
The Thermal Effect of Various Local Park Settings: A Simulation-Based Case Study of Sunshine Coast, Australia


1
School of Engineering and Built Environment, Griffith University, Gold Coast, QLD 4222, Australia
2
Green Infrastructure Research Labs (GIRLS), Cities Research Institute, Griffith University, Gold Coast, QLD 4215, Australia
Architecture 2023, 3(2), 195-212; https://doi.org/10.3390/architecture3020012
Submission received: 24 February 2023
/
Revised: 31 March 2023
/
Accepted: 12 April 2023
/
Published: 14 April 2023
(This article belongs to the Special Issue Sustainable Built Environments and Human Wellbeing)
Abstract
:Local parks are widely used to mitigate urban heat islands. However, the increase of dry weather periods in subtropical climates has caused natural grass failure, leading some city councils to replace it with artificial grass. Therefore, this study investigates various local park settings to assess the performance of different ground covers (i.e., irrigated and non-irrigated natural grass, bare soil, and artificial grass) and the influence that tree proximity has on them, as well as the total thermal performance of the investigated local parks. This study finds that non-irrigated parks could harm park users’ health due to the high concentration of mean radiant temperature (MRT) around trees. Although the surface temperature of the artificial grass was higher (2.60 °C) than that of asphalt during periods of peak temperature, the parks using artificial grass performed better at reducing air temperature and enhancing thermal comfort than the ones with dry grass or bare soil, where both tree proximity and soil water content played significant roles. However, artificial grass negatively affected night cooling, resulting in a poorer daily performance. This study discusses the influence of various park settings on air temperature, MRT, thermal comfort, surface temperature, soil temperature, and water content. In addition, various recommendations and settings are offered to direct decision makers and future studies.
1. Introduction
Urban heat islands (UHIs) increase daytime temperatures and reduce night cooling, which negatively influences the health and welfare of urban residents, specifically during heatwaves [1,2]. The effect of UHIs increases in densely built-up urban areas, especially if they lack green spaces and suffer from high greenhouse gas emissions [3], and their intensity ranges from 1.0 °C to 13.0 °C [4]. Therefore, research and policy has focused on investigating and applying different strategies to mitigate UHIs in the built environment [5,6]. The primary strategy has been to increase green spaces [7,8], as vegetation has a significant role in moderating temperature due to the evapotranspiration (ET) mechanism and the shade cast from canopy species [9].
The vegetation canopy intercepts shortwave radiation before it reaches the shaded surfaces, reducing the absorbed heat, surface temperature, and the heat emitted from these surfaces back into the atmosphere, which reduces the UHI’s effect [10,11,12,13]. Although this interception helps in balancing the temperature and water content of the soil [14,15], it causes a reduction in the ET of the lower canopy vegetation (e.g., grass) that is affected by the shade [16,17]. In addition, the trees’ increased leaf area density (LAD) and proximity can trap hot air and reduce the airflow and associated wind speed, reducing the ET and the anticipated cooling effect of the green spaces [5,18,19]. Vegetation also reflects a part of short- and long-wave radiation, which increases the mean radiant temperature (MRT) [20]. MRT is usually used to quantify the exchange of radiant heat between a human and their surrounding environment. It can be defined as the uniform temperature of an imaginary environment in which the radiant heat transfer from the human body is equal to the radiant heat transfer in the actual nonuniform environment [21]. Therefore, selecting the appropriate vegetation typologies is necessary to maximise their cooling effect, enhance thermal comfort, and increase their contribution to mitigating UHIs.
The subsurface properties of parks, including soil type, texture, and moisture content, play a crucial role in shaping the thermal environment of these green spaces. Soil moisture, in particular, significantly influences the thermal properties of the soil, affecting the amount of energy exchanged with the atmosphere and ultimately impacting air temperature [22]. In irrigated natural grass areas, moisture in the soil can provide a cooling effect on the surrounding environment. The grass acts as a natural evaporative cooler, with water transpiring through the leaves and into the atmosphere [23]. This process helps to reduce ambient temperatures, providing a more comfortable environment for park-goers. Conversely, in non-irrigated natural grass areas, soil moisture levels may be lower, resulting in increased soil and air temperatures. Bare soil areas can also significantly impact the thermal environment of parks. Without the cooling effect from vegetation, bare soil absorbs more solar radiation, leading to higher temperatures [24]. Artificial grass, while not subject to the same moisture fluctuations as natural grass, can also affect the thermal environment of parks [2,25,26]. In addition, artificial grass is manufactured from plastics and heavy metals, and it can potentially increase environmental hazards, such as a reduction in biodiversity and water infiltration, increasing the risk of floods, and carbon dioxide and toxic gas emissions [27,28,29,30,31,32].
Recently, many countries and city councils have established greening initiatives and strategies to increase urban green spaces in cities, specifically in local parks, for their various benefits in addition to their cooling effect, such as for people’s mental and physical health [33,34,35]. The construction of local parks in tropical and subtropical climates is widespread as the weather conditions encourage their implementation and sustainability [36,37]. Specifically, they mainly depend on rainfall and do not require irrigation. In addition, most park projects in these climates do not consider implementing irrigation systems and restrict irrigation [38,39]. However, increased global warming has resulted in precipitation variability and increasing dry weather periods, substantially reducing soil water content, specifically in the upper layers, impacting the wilting point [40] and leading to grass and shrub failure. Instead of watering the grass in these green spaces to avoid failure, some city councils tend to install artificial grass to mitigate this issue and reduce maintenance requirements [30,41].
The main objective of this study is to provide more insight into the thermal behaviour of different ground covers in local parks, including bare soil, artificial grass, and natural grass with and without irrigation. In addition, this study investigates the influence of tree proximity and park orientation on the above-mentioned ground covers. This investigation is expected to increase awareness of the best local park strategies to mitigate UHIs during extreme heat and dry weather in subtropical climates in general. This study focuses on the case of Sunshine Coast, Australia. The findings of this research can be used to improve the regulations and management of outdoor green spaces, including parks, in cities.
Simulations offer experiential learning opportunities that are well-suited to assist research [42,43] and readily facilitate the adjustment of investigation parameters, such as the experimental settings and the surrounding conditions. They also provide accurate results in a considerably short period of time [44] and are a powerful tool for providing insights into complex problems that are difficult to study in laboratories [45]. To achieve the objectives of this study, the ENVI-met simulation tool was selected for this study, as explained further in the following methodology.
2. Methodology
A three-step methodology was utilised in this study. The first step included a thorough literature review of existing state-of-the-art artificial and natural grasses in public spaces. The most influential material characteristics of the grasses and the climatic conditions were also analysed to design the study scenario and the framework for the comparative study. The second step involved the selection of the simulation parameters and the implementation of the simulation tool. The simulation results were analysed and reported in the third step.
2.1. Scenario Development
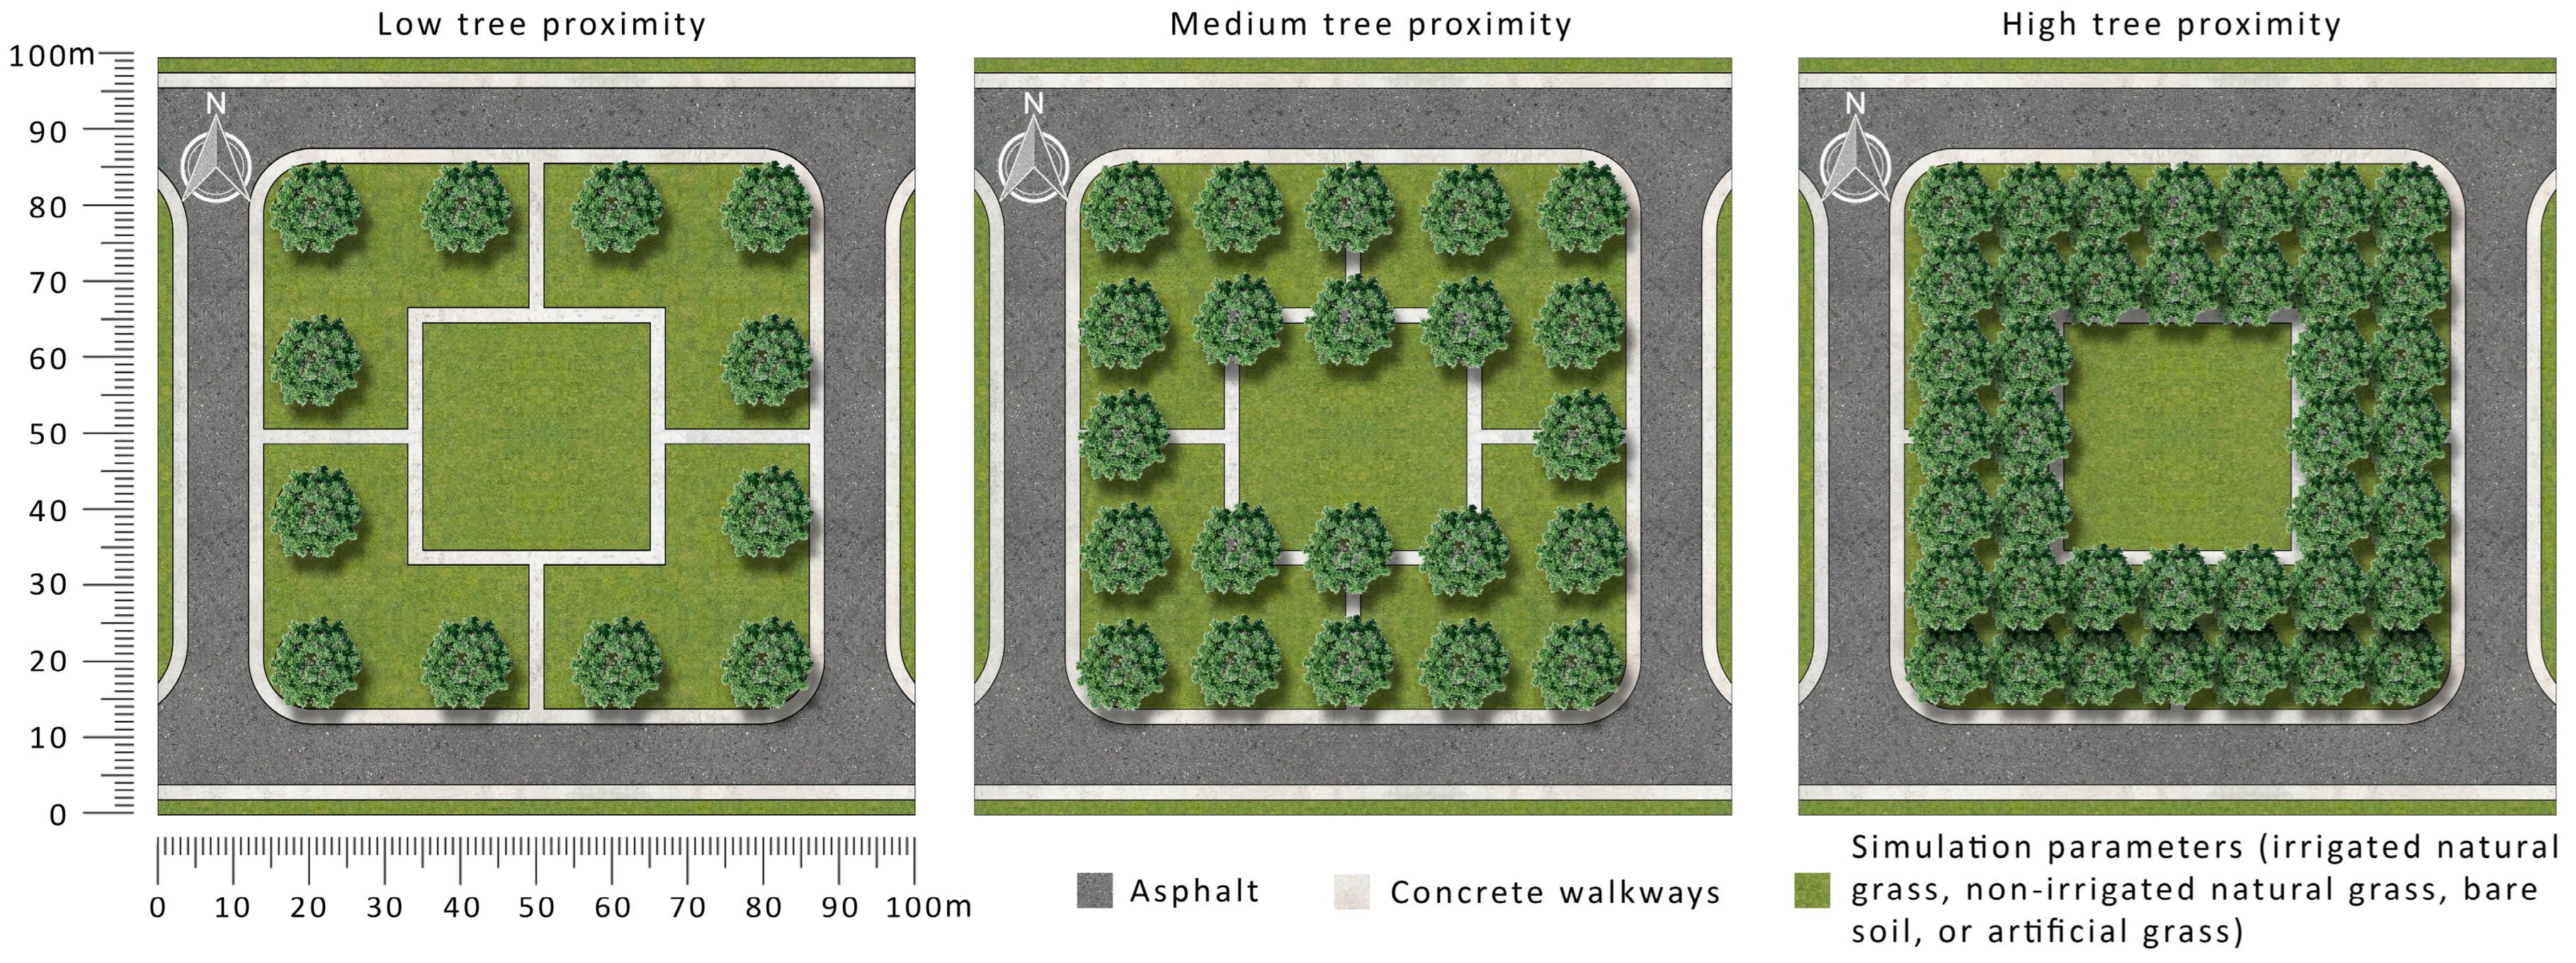
To contextualise the investigation, the Sunshine Coast, Australia, was selected as a representative site for this climate zone (based on the Köppen climate classification), at latitude −26.50, longitude 153.00, time zone +10, and elevation 10 m. Table 1 provides more climate information regarding the site. Designed according to the Sunshine Coast Council’s guidelines, a 72 m × 72 m hypothetical local park was developed, as that is the minimum size of parks in the city, and followed the identified local park’s contexts in the new master planning strategies [38]. The park was surrounded by a 2 m wide footpath and 8 m wide streets. The ground surface configurations of the park were of four types: (1) artificial grass, (2) non-irrigated natural grass (dry grass), (3) irrigated natural grass (irrigated grass), and (4) Kandosols (bare soil), the most common soil type in the Sunshine Coast. Kandosols is a combination of red, yellow, and grey earths. It contains a sandy to loamy surface soil, with porous sandy clay in the lower layers and has a limited water holding capacity (16% water content at field capacity) [46]. Additionally, there were three canopy tree arrangements: (1) high proximity, (2) medium proximity, and (3) low proximity. To apply these typologies, a 10 m diameter tree was used, and the tree arrangements were represented by grids of 10 m, 15 m, and 20 m, respectively. To fulfill a mandatory requirement of the Sunshine Coast regulations [38], a 30 m × 30 m open space was centralised in the local park as a small kick-and-throw area, which could also host active recreation elements. This area was surrounded and connected to the park edges by 2 m wide footpaths, dividing the park into four identical spaces around the centralised active open space (Figure 1). These settings were carefully selected to assess the thermal impact of different ground covers, tree proximities, and park orientation on the pedestrian level, and to evaluate the influence of these scenarios on UHIs within local park contexts. These selected settings resulted in 12 scenarios. It should be noted that to help retain the focus on the investigated elements of this study and to increase the transferability of the results to other urban open spaces, no shelters, services, or furniture were added to these scenarios.
2.2. Description of Modelling Tool and Model Parameters
The ENVI-met v5.1 Winter22 modelling tool was selected for this study. ENVI-met is the most-used simulation tool for evaluating urban microclimates [10]. The tool includes a holistic numerical microclimate model capable of simulating the airflow in the modelled areas, including the interaction between plants and other horizontal and vertical surfaces. The model also includes various microclimate assessments, including heat, energy, and mass exchange, based on fluid mechanics’ principles, thermodynamics, and atmospheric physics [47,48,49]. The complete ENVI-met model description can be found in Bruse and Fleer [49], Bruse [50]. The ENVI-met vegetation model has been thoroughly evaluated for use in similar climates, and it was found to adequately simulate the plant transpiration rate and shaded leaf temperatures and their impact on the surrounding environment [51]. Various studies have validated the use of the model in a variety of urban contexts and found a 20–25% error at street level [12,52]. Therefore, ENVI-met can be considered a valid simulation tool for this investigation, specifically with the latest enhanced update, which reduces errors and increases the accuracy of the results [53].
The model geometry of this study consisted of 50 × 50 × 152 cells, with a size of 2 m × 2 m × 0.25 m for the X, Y and Z axes, respectively. The lowest grid was split into five sub-cells to allow for a 5 cm grass height. A telescoping factor was activated with a value of 1.5% to start after 16 m on the z-axis, which was 1 m above the level of the trees. In addition, 10 nesting grids were included with the Kandosols as the soil profile, to allow the simulation tool to expand the model boundary, if needed, in order to minimise undesired boundary effects and facilitate the simulation. These settings were selected to facilitate better forcing for weather conditions, to implement appropriate vegetation dimensions, and to reduce the model height to ease the simulation process. Typical ENVI-met grass, spherical trees, and surface materials were used in this simulation. Since there is no artificial grass material in ENVI-met, the artificial grass materials included in this study followed the values used in the study by Yaghoobian, et al. [54]. The vegetation parameters were carefully selected, and they generally fit with the various vegetation used in the local parks in the city (Table 2). The surface material parameters are presented in Table 3. It should be noted that a light colour concrete was used for the paved walkway and its albedo was taken from the study by Sanjuán, et al. [55]. The light colour of the concrete used in this study may have influenced the surface and mean radiant temperatures. The initial water content of the irrigated soil was 40% and the non-irrigated soil was slightly above the wilting point of 16%. The tree canopy coverage percentages compared to those of the local park area were 61%, 33%, and 18% for tree arrangements of high proximity, medium proximity, and low proximity, respectively.
The simulation was undertaken on the hottest day on the Sunshine Coast (4 January 2014) since the recording of weather conditions commenced in 1994, according to the Bureau of Meteorology (BoM), Sunshine Coast, Australia, to investigate the most extreme weather conditions, which were slightly above the typical hottest day of the year. The simulation was conducted starting at 4 a.m. for the following 25 h, using the BoM weather data to cover the influence of the sun on the UHIs from sunrise to sunset, and from sunset to sunrise of the following day.
2.3. Data Analysis Protocol
Several factors affect the intensity of UHIs, such as air and surface temperatures, as well as the radiant heat emitted from these surfaces back to the atmosphere [4]. All these factors also affect human thermal comfort. Therefore, this study focused on evaluating these factors to investigate the influence of different surfaces on the intensity of UHIs within the local park contexts. Air temperature, ground surface temperatures, soil temperature, and human thermal comfort were analysed and reported. In addition, although thermal comfort is highly reliable for analysing heat stress risk, the metric MRT was also analysed to increase understanding of heat stress and to compare the results with the existing literature. Thorsson, et al. [56] stated that when the MRT reached the threshold of 57.1 °C or above, it could increase the risk of death by 5% for all age groups; therefore, this threshold was used in analysing the results. The Universal Thermal Climate Index (UTCI) was selected to report human thermal comfort in this study and the ENVI-met BioMet module was used to report the results. Zare, et al. [57] classified the thermal sensation based on UTCI temperature (Table 4). Li, et al. [58] stated that the UTCI was the most successful index that reasonably approximated the observed data in their study of a subtropical climate. In addition, Ghani, et al. [59] reported average differences of 14% between the simulated and observed data in their investigation, which increases its creditability for use as the selected index in this study. Sundevall and Jansson [60] found that the dominant visitor age group of parks is children, who are the most vulnerable to heat stress. Therefore, this study used this age group to report the thermal comfort results (Table 5), and used the default parameters of the Bio-met tool.
The following section reports the extracted results at 1.5 m above ground level for each air temperature, thermal comfort, and MRT, while the soil temperature was taken at 1 cm under the soil surface level to check the influence of the ground cover, and at 25 cm, the average shrub root depth, to check the temperature impact on the ground covers and shrubs. The results were taken each hour, and the thermal comfort, MRT, and surface temperature focused on the hottest hours of the day. The median air temperature of each scenario was extracted directly from the ENV-met outputs, representing the average temperatures of each grid cell in the park. The soil temperature and water content results were taken at 1 cm and 25 cm under the ground cover materials in the centre of the five zones of the local park for each scenario.
3. Results
This section presents the main results of the parametric study developed to evaluate the thermal performance of the 12 local park settings using ENVI-met simulation software. The following subsections report the impact of the investigated parks on (1) air temperature, (2) MRT, (3) thermal comfort, (4) surface temperature, and (5) the influence on soil temperature and water content.
3.1. Urban Heat Intensity
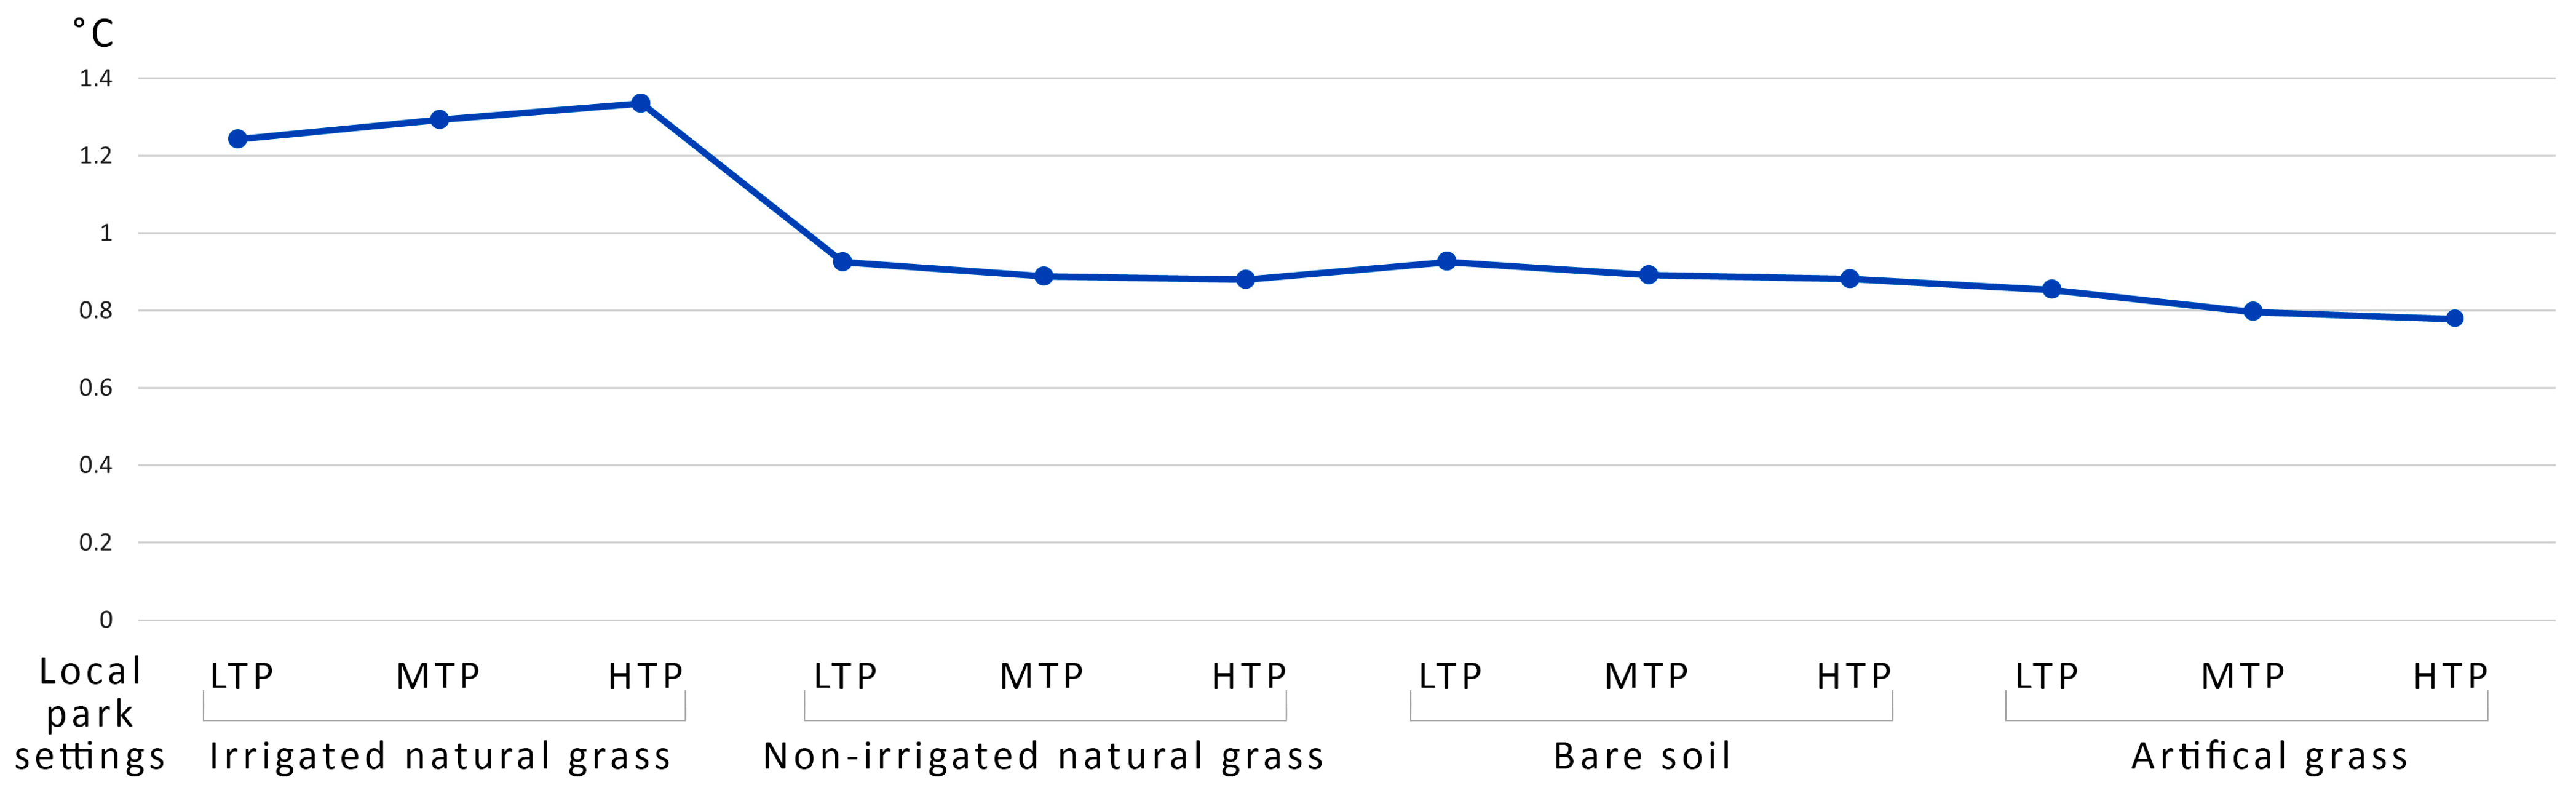
Overall, the various park settings positively reduced the urban heat intensity, while the ground cover type and the absence of irrigation altered the reduction values (Figure 2). The average temperature reduction among the various park settings ranged between 0.78 °C and 1.34 °C. The average reduction based on the ground covers during the simulated 25 h was highest for the local parks with irrigated grass and high tree proximity, leading to an overall decrease of 1.34 °C, followed by an identical reduction of 0.93 °C for parks with dry grass and bare soil with low tree proximity, and lastly a reduction of 0.85 °C for parks with artificial grass and low tree proximity. The same park settings variables also worked to reduce the peak temperature of the day; the reduction ranged between 3.6 °C and 2 °C.
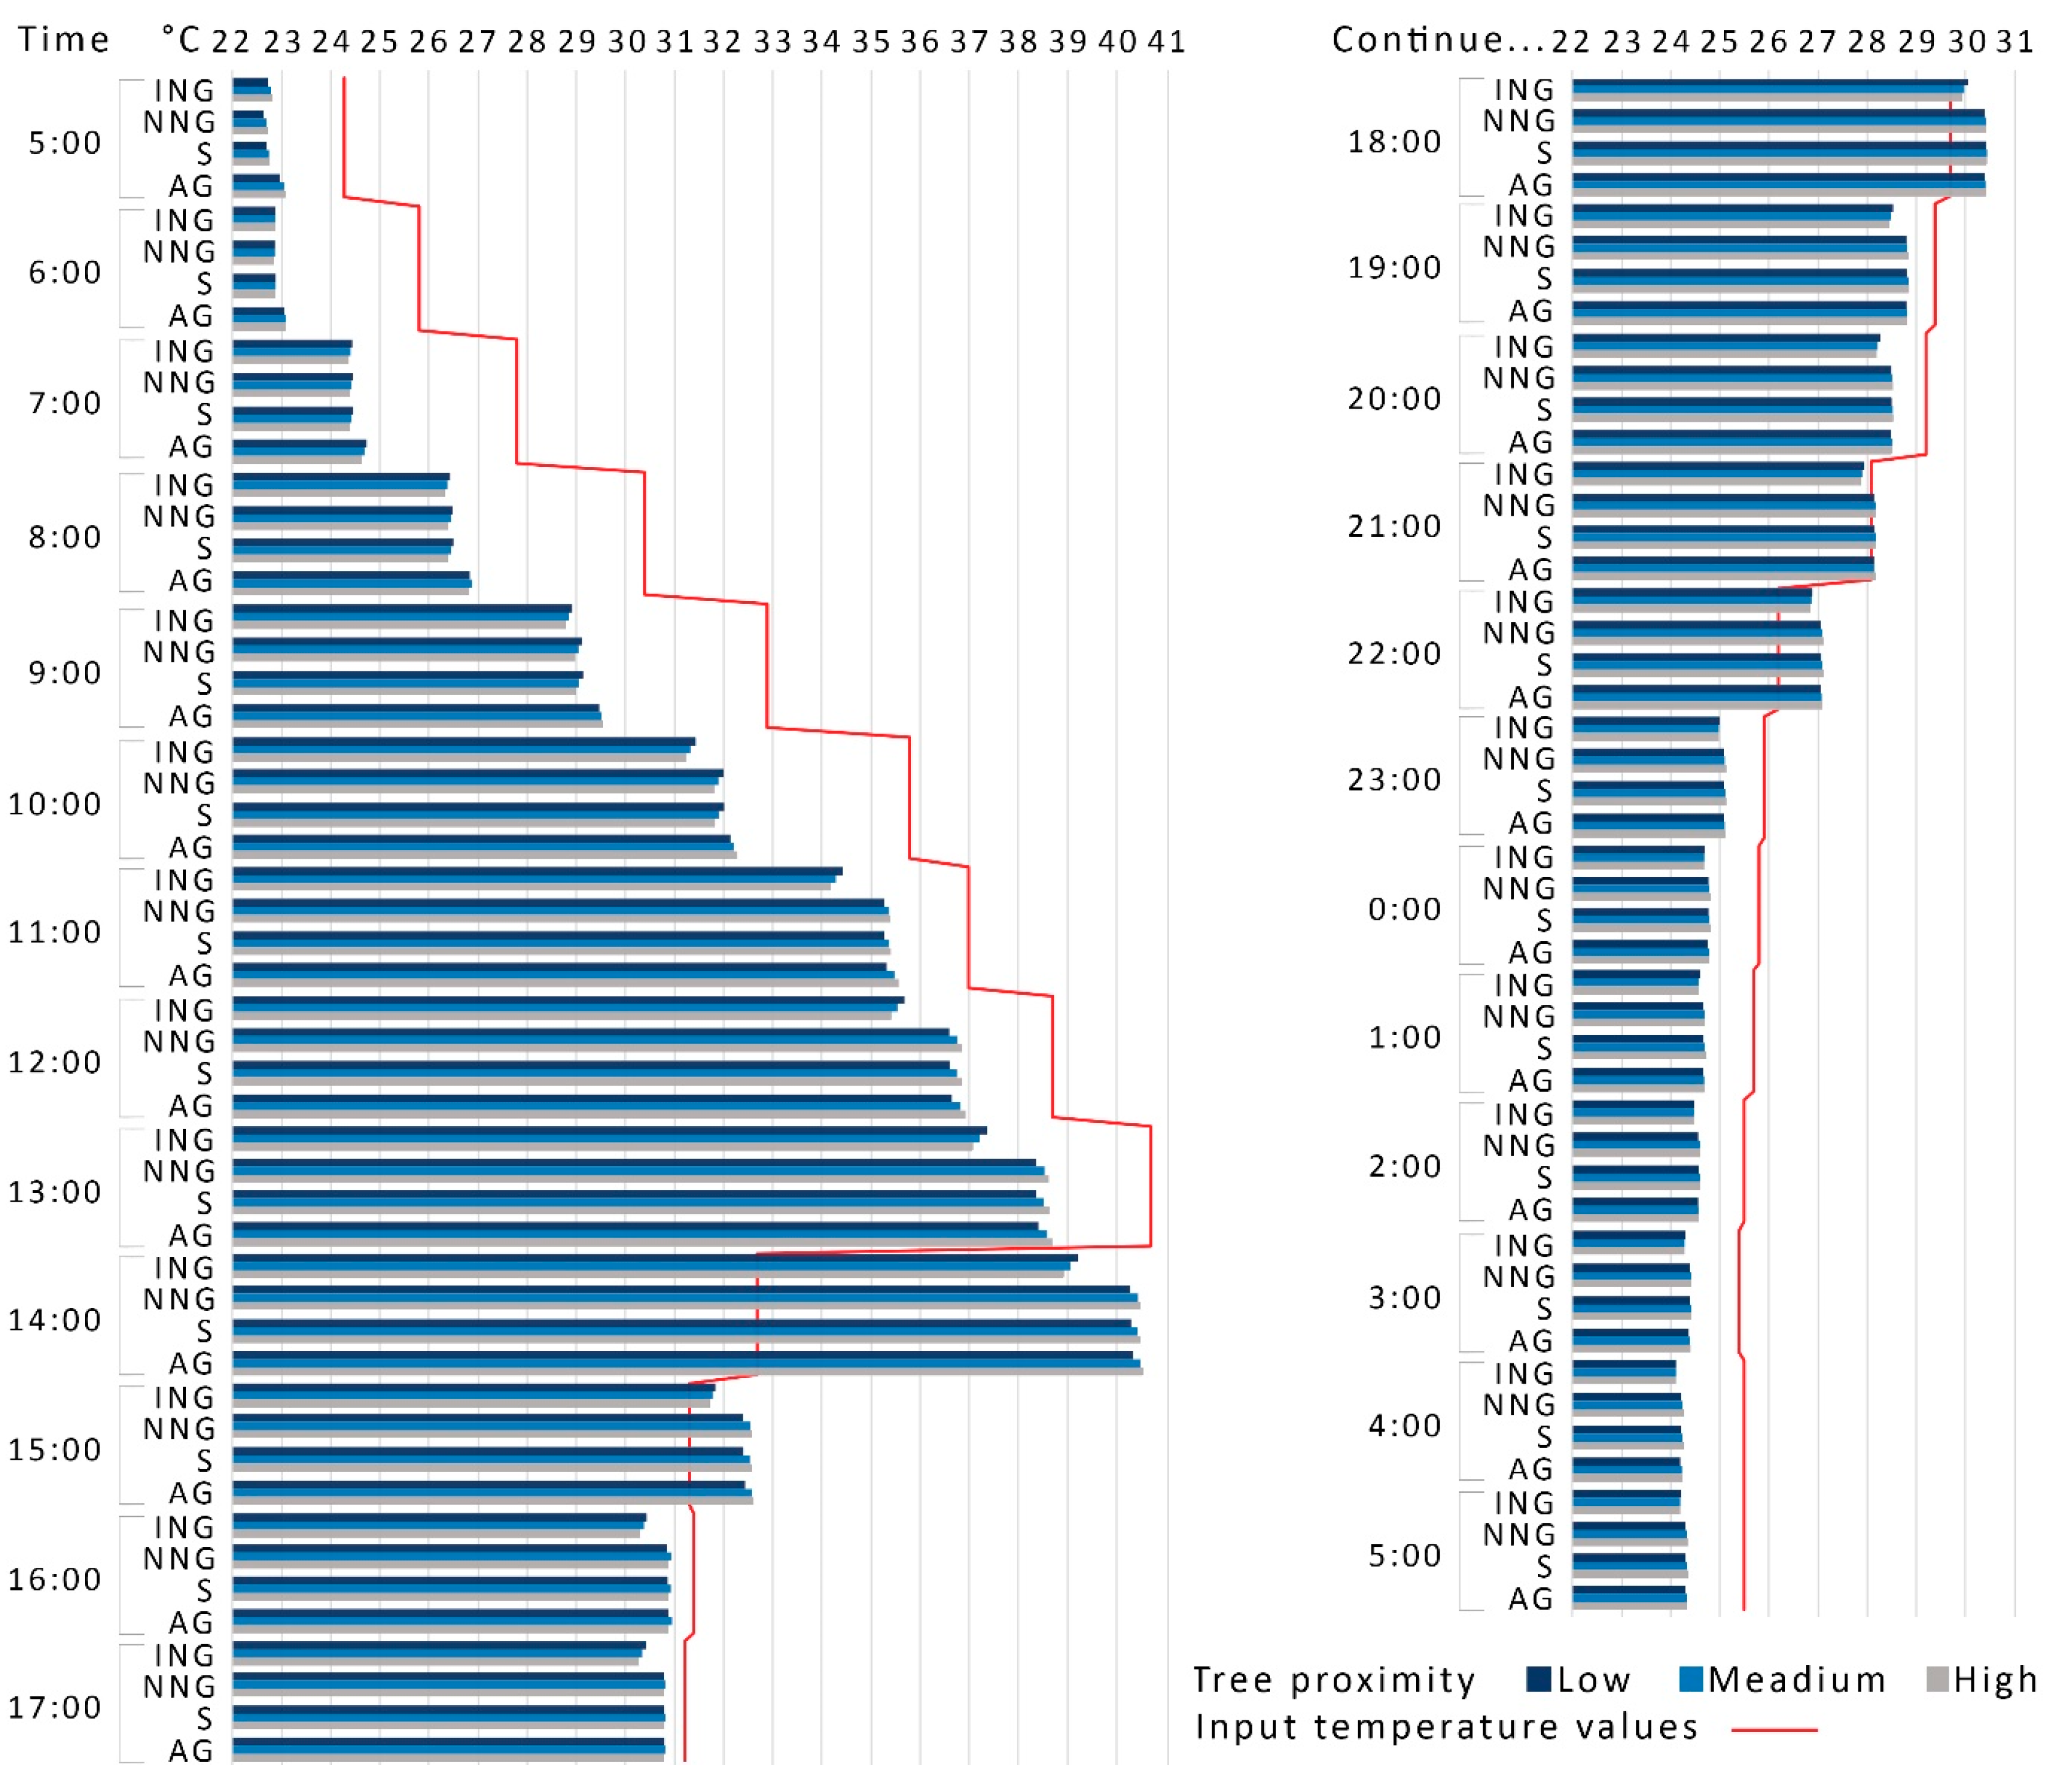
Generally, the various park settings positively offset the increased air temperature during the day. However, the offset was delayed or negated when associated with a drop in the input air temperature (Figure 3). The reduction remained positive up to 1 p.m., when the air temperature was at its maximum for the day. The park temperature continued to increase up until 2 p.m., even though the input temperature was reduced by 8 °C (due to a high increase in wind speed and the formation of clouds in the sky), which resulted in an almost one-hour delay and a higher temperature of between 6.2 °C and 7.8 °C for the various local park settings. The same phenomenon was noticed at 3 p.m., 6 p.m., and 10 p.m., where the input temperature was less than the simulated temperature at the parks.
3.2. Thermal Comfort
Overall, there was no extreme heat stress, and all the parks remained within a very strong heat stress between 38.07 °C and 44.14 °C (Figure 4). The northwest side of the park was the coolest, and the opposite side was the hottest, even though the wind direction was 327 degrees north-northwest at 1 p.m. However, this remained reasonable as the wind direction before 1 p.m. was from the northwest. The extracted maps in Figure 4 highlight the importance of considering wind direction as a primary design influencer for mitigating overheating in the city. The impact that trees and their proximity to each other have on wind speed and direction also emphasises the importance of creating open breeze channels throughout the urban environment to eliminate the heat collected by the urban features.
The parks with irrigated grass performed better with a median temperature below 41 °C, while the median temperature of the other park settings ranged between 41.36 °C and 42.08 °C. The highest performance was by the local parks with irrigated grass and low tree proximity, followed by high, and then medium tree proximity. The order of the median performance based on tree proximity was different for the other park settings, as the high tree proximity performed better, followed by the medium, and then the low tree proximity. However, the order is inverted with regard to the temperature at the centre of the parks; artificial grass performed better than dry grass, which performed better than bare soil.
The temperature under the tree canopies was the lowest in the parks, with the irrigated grass below 40 °C in general and in some locations below 38.50 °C, specifically on the south-southeast side of both the tree canopy and the local park area. For the other park settings, the temperature under the trees ranged between 39.80 °C and 41.90 °C, and the temperature was higher in the southeast side of the local park area, which reached above 44 °C in some areas.
3.3. Mean Radiant Temperature
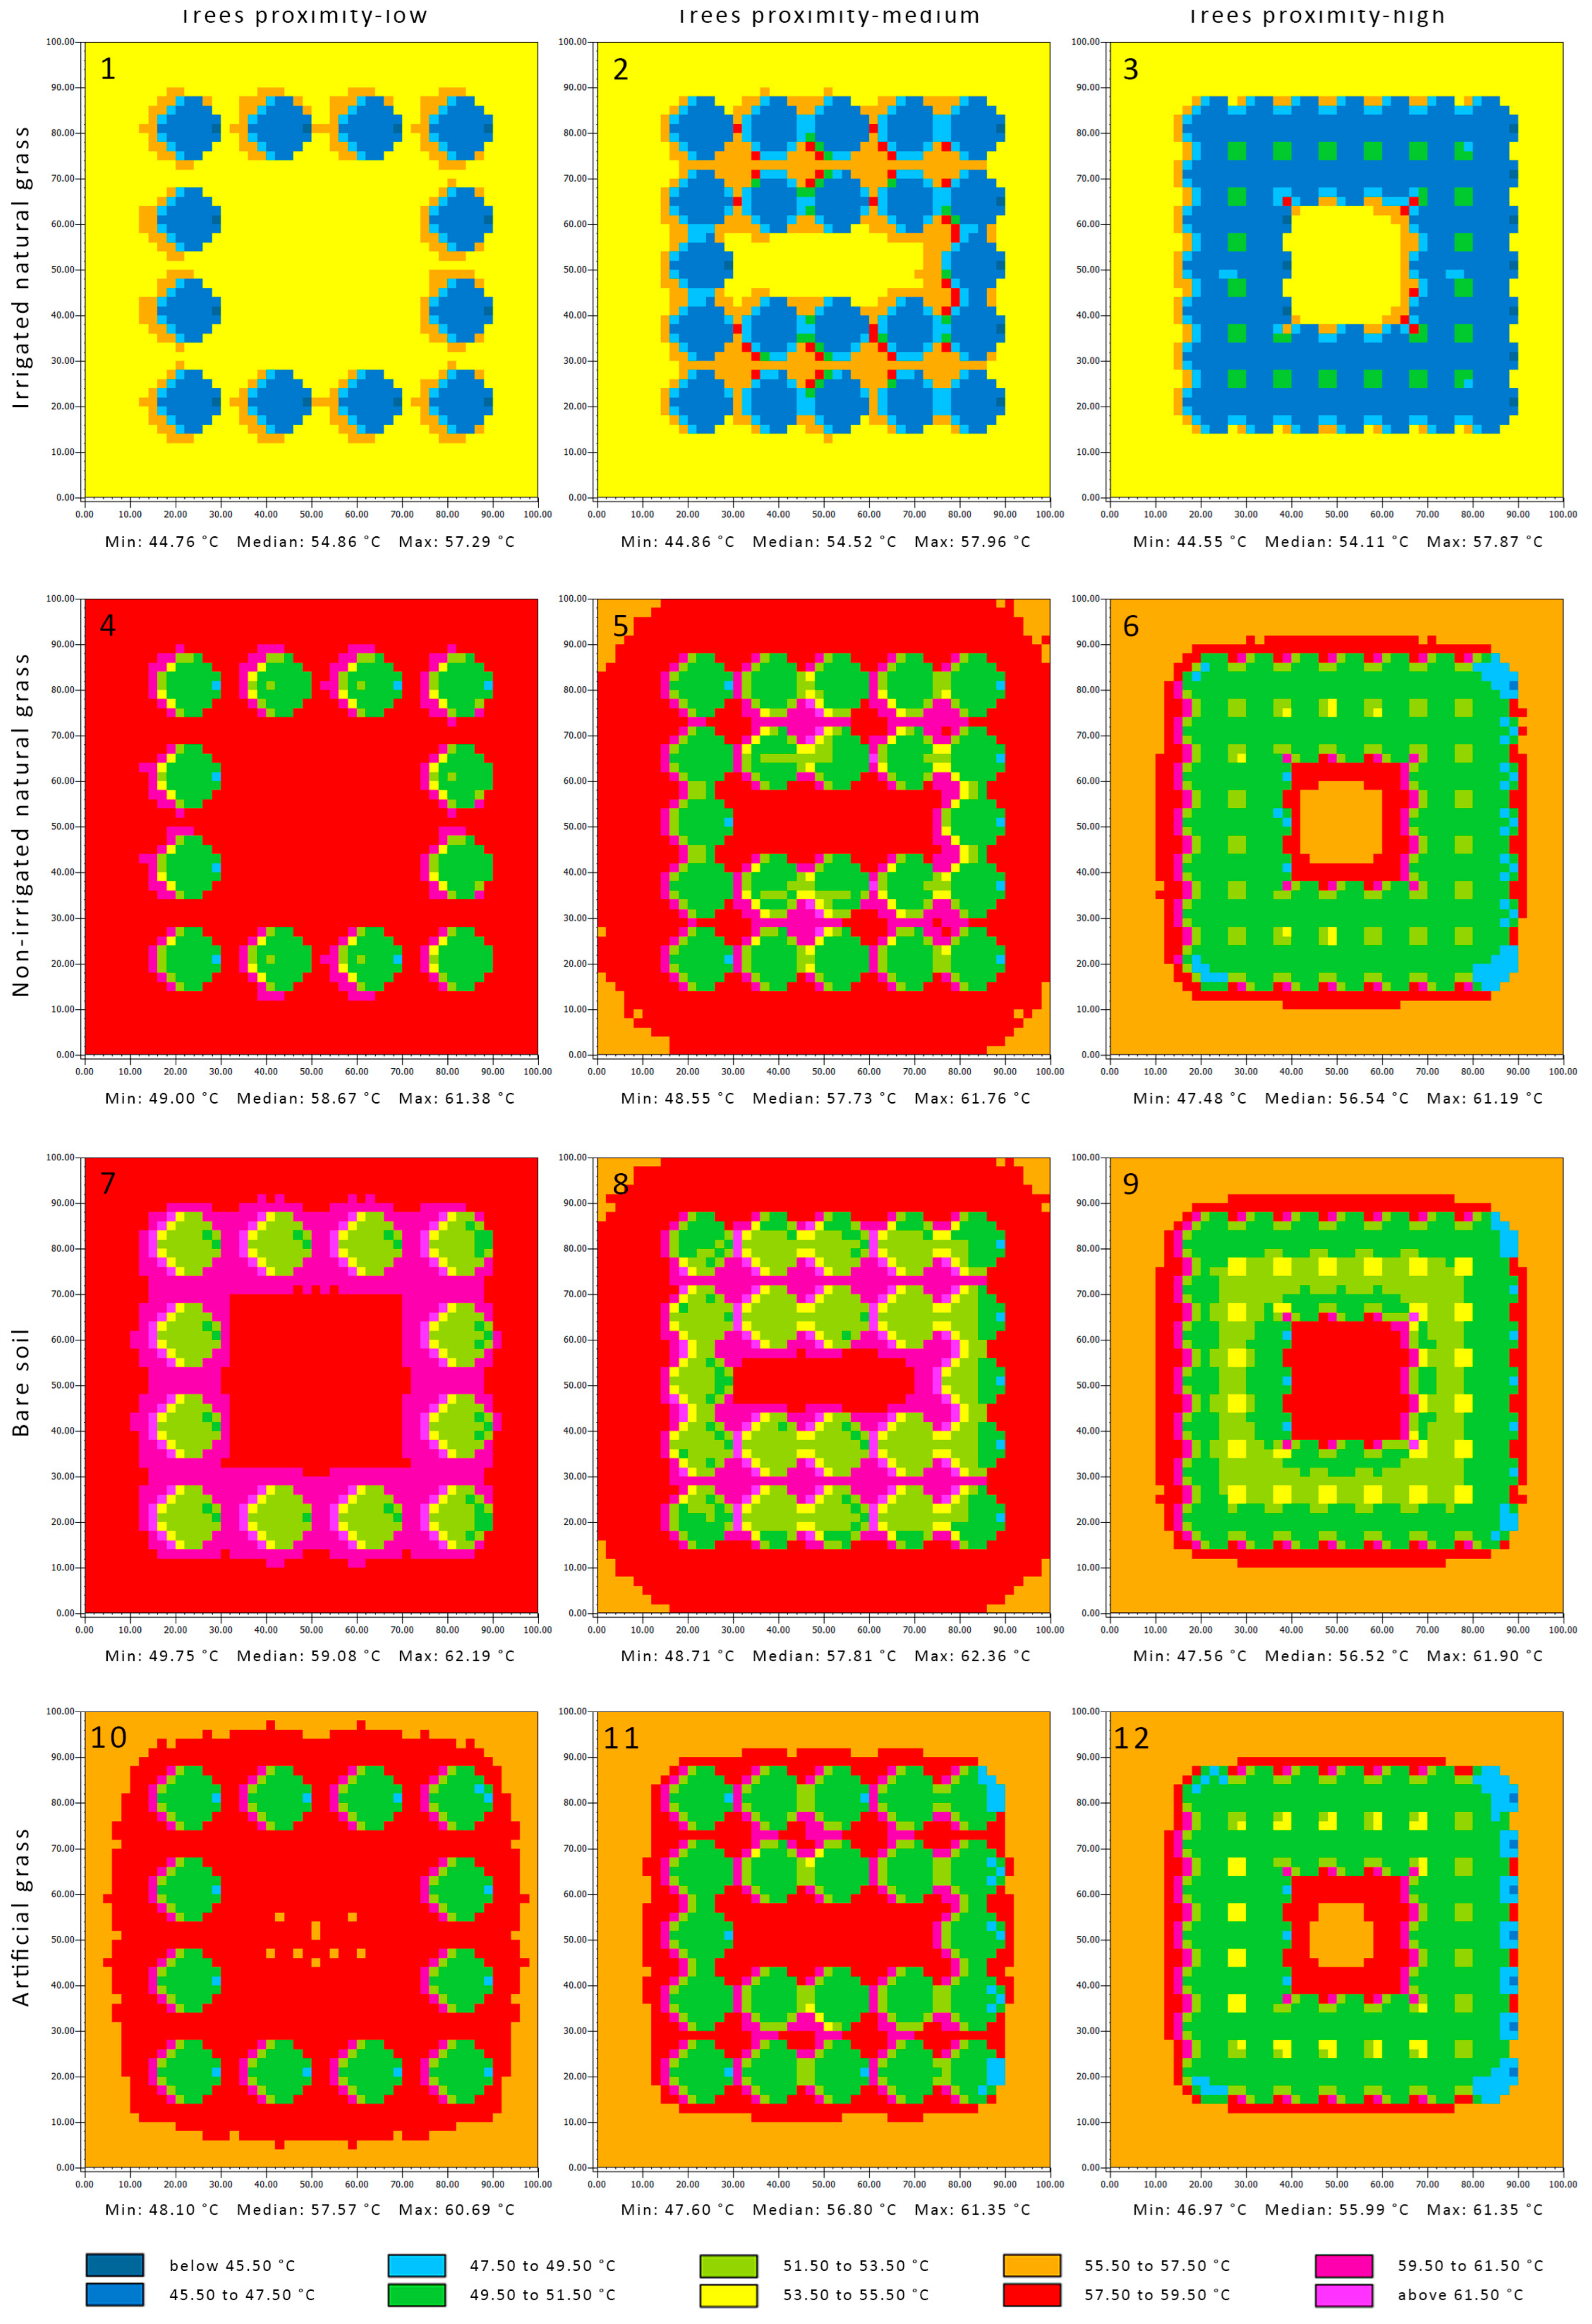
The highest MRT was at 1 p.m., the peak temperature of the day (Figure 5). The median MRTs of the local parks with different tree arrangements and irrigated grass remained under the threshold of 57.1 °C and ranged between 54.11 °C and 54.86 °C. The MRTs remained low inside the parks and within the park context, and ranged between 53.50 °C and 55.50 °C. It reached a maximum slightly above the threshold of 57.1 °C in a limited area on the west side of the trees. The median MRTs in the local parks with high tree proximity and artificial grass, bare soil, or dry grass were under the thresholds of 57.1 °C, 55.99 °C, 56.52 °C, and 56.54 °C, respectively. The MRT was concentrated inside the local park while remaining under the threshold of 57.1 °C within the park context. The same MRT characteristics were applied to the local park with artificial grass and medium tree proximity with a median MRT value of 56.80 °C. The median MRT of the remaining parks was above the threshold of 57.1 °C, including the local parks with low tree proximity and with artificial grass, bare soil, or dry grass, with temperatures of 57.57 °C, 59.08 °C, and 58.67 °C, respectively. The parks with medium tree proximity and with dry grass or bare soil had temperatures of 57.73 °C and 57.81 °C, respectively. There was a high concentration of MRT above 60 °C around the trees in all the parks except the ones with irrigated grass. This was mainly noticed in the parks with bare soil and with both low and medium tree proximity, and the parks with medium tree proximity for both dry grass and artificial grass.
3.4. Influence on Surface Temperature
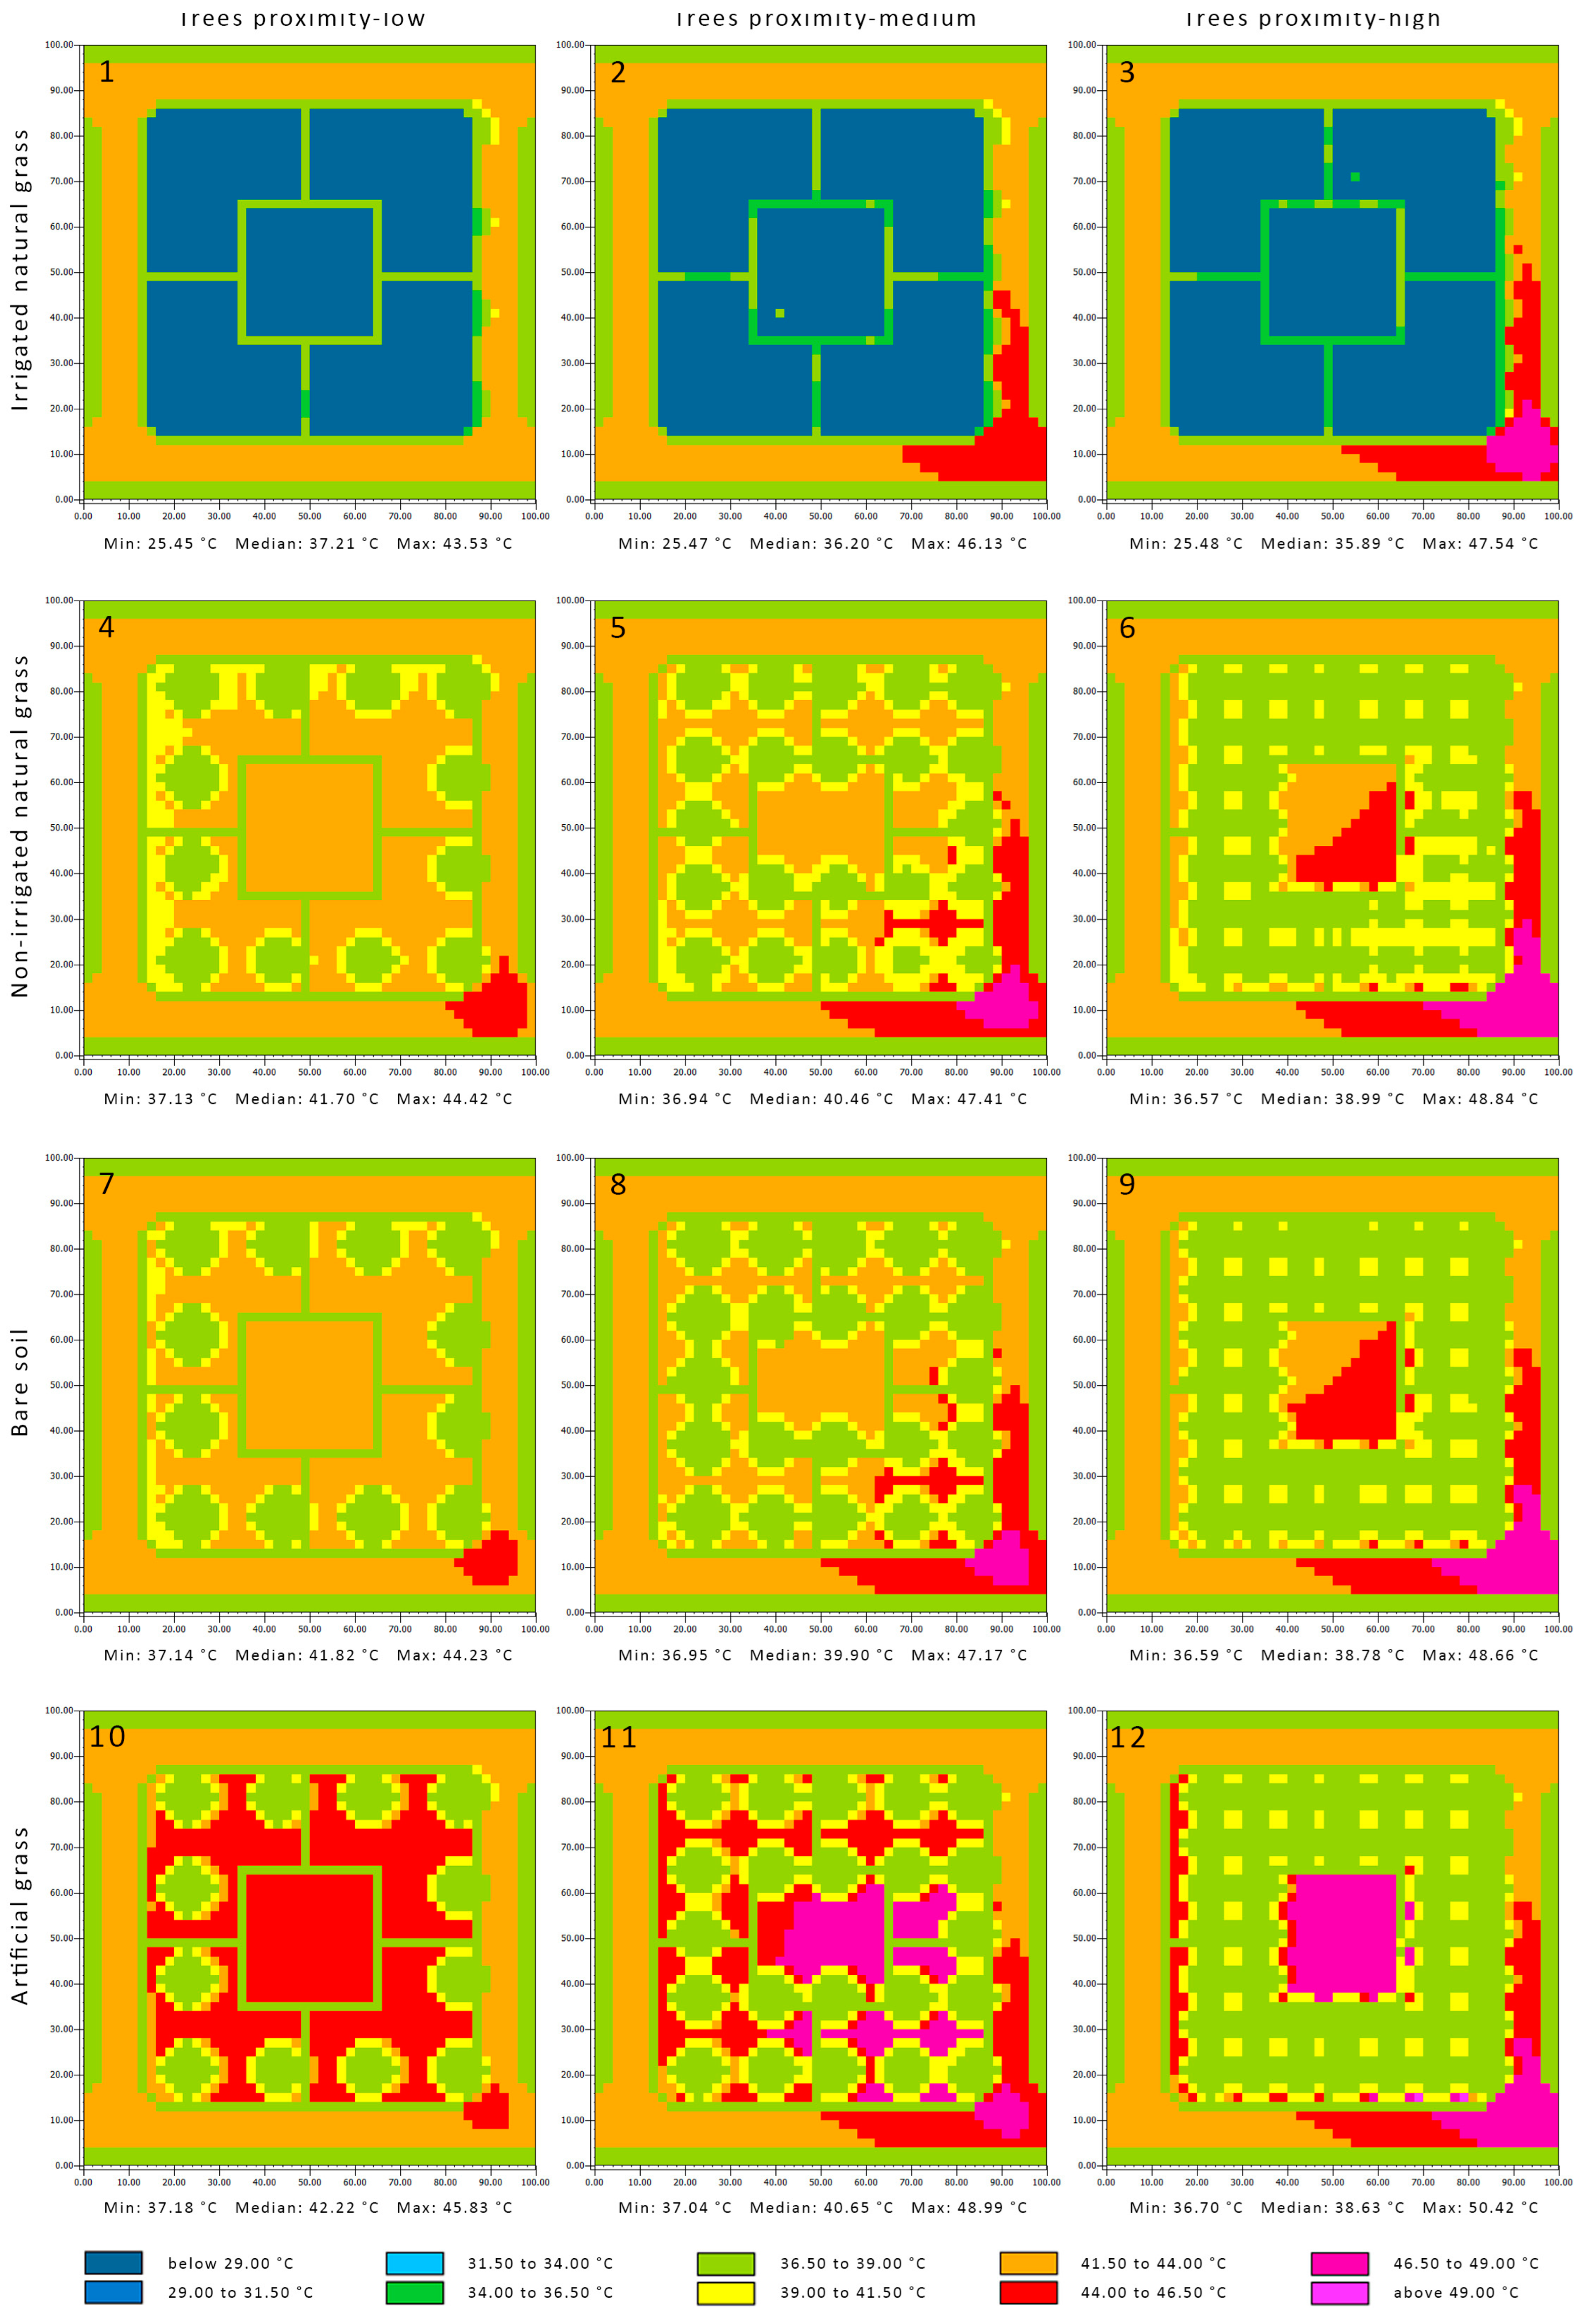
The surface temperature of the irrigated grass remained below 29.00 °C, and the parks did not influence the context surface temperature except in a limited area at the southeast side of both the medium and high tree proximity arrangements (Figure 6). This influence occurred due to the obstruction of the wind by the trees, which reduced the ability of natural cooling. The difference between the surface temperature of the dry grass and bare soil inside the parks was limited and ranged between 36.50 °C and 46.50 °C, with a slightly lower surface temperature for the dry grass. The surface temperature of the park was generally noticeably reduced by the increased tree proximity, which also can be explained by a reduced wind speed and its ability to override the heat. For instance, the mean temperature of the surfaces of the local parks with high tree proximity was lower than the ones with low tree proximity by 1.32 °C, 2.71 °C, 3.04 °C, and 3.59 °C, for the irrigated grass, dry grass, bare soil and artificial grass, respectively. The artificial grass surface temperature was the highest among the different ground covers, specifically for non-shaded locations, where the surface temperature was above 44.00 °C, and in some locations, it was above 49.00 °C. The surface temperature of the paved footbaths was less than the dry grass and bare soil by about 3.50 °C on average and slightly lower than asphalt by 0.55 °C on average, while the surface temperature of the artificial grass was higher than both the paved footbaths and asphalt by 6.00 °C and 2.60 °C, respectively.
3.5. Influence on Soil Temperature and Water Content
The soil temperature at 1 cm under the soil surface was mostly similar to that of the surface temperature during the day. The soil water content of the parks that included irrigated grass and artificial grass remained above the wilting point, while for parks with dry grass and bare soil, the soil was dry around 11 a.m.
At a level of 25 cm underground, the high tree proximity arrangement had the lowest effect on soil temperature for the parks with irrigated grass due to the available shading and cooling provided by evaporation. In contrast, the low tree proximity arrangement had the lowest effect on the rest of the parks with other ground covers, due to higher wind speed which allowed for natural cooling. The medium tree proximity arrangements had the highest impact on soil temperature due to a reduced air speed in the park and less shading than the parks with high tree proximity. The soil temperature of the medium tree proximity parks gradually increased and reached a maximum of 23.10 °C, 22.83 °C, 22.83 °C, and 24.60 °C, at 7 p.m., 4 a.m., 4 a.m., and midnight, for the irrigated grass, dry grass, bare soil, and artificial grass, respectively. The temperature of the irrigated grass and artificial grass decreased gradually up until 5 a.m. after reaching a peak temperature, while the dry grass and bare soil remained the same. The temperature of the soil after 25 h was higher by about 2.60 °C, 2.83 °C, 2.53 °C, and 4.27 °C for the parks with medium tree proximity and irrigated grass, dry grass, bare soil, or artificial grass, respectively. In addition, the water content for the irrigated and artificial grass remained above the wilting point, while the dry grass and bare soil remained slightly below the wilting point.
3.6. Summary
Overall, at peak temperature (1 p.m.), the median thermal reduction of the local parks with irrigated grass was the highest among the different settings (Table 6). The influence of the various local park settings on the median air temperature and thermal comfort was minimal. In contrast, the median MRT and surface temperatures were noticeable among the various local park settings, including those with different tree proximity but containing the same ground cover, and parks containing the same tree proximity but different ground cover types. It also should be noted that the local parks with high tree proximity reduced MRT and surface temperatures better.
4. Discussion
The investigated local park settings exhibited different abilities to mitigate UHIs. The investigation results show the inadvisability of depending only on the air temperature to evaluate the efficiency of UHI mitigation strategies. Local parks with irrigated grass proved to be the most efficient mitigation strategy among the various park settings due to the ET mechanism, which significantly reduced air temperature, MRT, and surface temperature. These reductions positively enhanced the thermal comfort of the park’s users and the park context, and these results align with the studies by Spronken-Smith, et al. [61] and Ouyang, et al. [62].
Regardless of the local park settings, all the parks reduced the urban heat intensity by 0.78 °C–1.34 °C on average during the day and reduced the peak temperature by 2 °C–3.6 °C. This emphasises the importance of increasing the number of parks within the built environment as an effective strategy to mitigate UHIs, and this also aligns with the studies by Gago, Roldan, Pacheco-Torres and Ordóñez [5], Sun, et al. [63], Shao and Kim [64]. It also emphasises the importance of evaluating local park design and vegetation typologies to reach the maximum cooling effect, results that align with the findings of both Yao, et al. [65], Barradas, et al. [66]. Regardless of the local park settings, once the temperature drops, there will be a delay in the effect of that drop due to the hot air trapped in the vegetation canopy and the high temperature of the vegetation’s leaves, as demonstrated by Gago, Roldan, Pacheco-Torres and Ordóñez [5]. This delay could result in inverting the cooling effect into a heating effect if the temperature drop is ≥1.4 °C/h. Although this delay could be exaggerated, as the ENV-met vegetation model tends to increase the leaf temperature [51], a careful assessment of the wind’s direction and speed within the park context is needed to ensure sufficient airflow inside the parks to reduce the cooling delay time.
This study found that tree proximity could positively or negatively impact temperature reduction based on the ground cover type and the availability of the soil water content. These findings demonstrate that evaluations of tree typologies in green spaces must consider the ground cover type and water availability in order to obtain accurate results, which align with the finding of [62]. In addition, the transferability of studies regarding tree proximity should be limited to identical climates with similar rainfall patterns and dry periods and should be carefully considered if the context has different climatic patterns, considering that the results of this study are based on the Sunshine Coast location. In this context, an ENVI-met simulation could help to produce satisfactory results, as stated in the study by Ouyang, Sinsel, Simon, Morakinyo, Liu and Ng [53]. However, the existence of errors in the vegetation model requires further consideration, specifically where the results of the evaluation process showed minimal differences between the different design settings. In this instance, the results could be used for guidance, but more investigation and evaluation are required.
Although MRT significantly influences thermal comfort, this study demonstrates that in parks, and due to the influence of vegetation, MRT could reach harmful levels without being sensed by the park users. For instance, although the median MRT remained under the threshold of 57.1 °C in several of the parks, specifically under the tree canopy (which also had the highest thermal comfort), it exceeded the threshold in various locations, such as near the tree canopies, which park users seek for shade during heatwaves and periods of high temperature. The MRT concentration increased when the water content of the soil was reduced, which in turn reduced the ET mechanism, which aligns with the study of Wang, et al. [67]. Therefore, the city council and relevant institutions should warn the visitors at parks with limited soil water content, specifically during heatwaves, as that could increase the risk of death by 5% among park users, as noted by Thorsson, Rocklöv, Konarska, Lindberg, Holmer, Dousset and Rayner [56]. In addition, city policies regarding irrigation limitations in local parks should be revised to allow irrigation to increase the local park’s cooling effect and the effective mitigation of UHIs, at least during heatwaves or once the soil water content falls below the wilting point.
The shade cast by trees resulted in a significant reduction in surface temperatures. In addition, the increased soil water content also contributed to reducing surface temperatures. To increase the thermal comfort in local parks, park shading should be explicitly maximised in open spaces, such as kick-and-throw areas and active recreation spaces where tree canopies are limited. Although parks with artificial grass presented better thermal comfort than dry grass and bare soil during periods of peak temperature, their surface temperature was considerably higher (by about 6 °C) than dry grass and bare soil, and their temperature reached up to 48.30 °C. In addition, artificial grass significantly reduced the night cooling effect, hence reducing the overall cooling effect of the park. Therefore, evaluating the strategies for night cooling and the overall day cooling of UHIs must be considered in the evaluation process.
This study also reveals that asphalt performs better than artificial grass, and paved footpaths perform better than artificial grass, dry grass, and bare soil, emphasising the importance of irrigated grass during periods with extreme conditions. In addition, artificial grass significantly increases the soil temperature, which endangers its characteristics and biodiversity, including shrubs planted around the artificial grass, a concern also stated by Sánchez-Sotomayor, Martín-Higuera, Gil-Delgado, Gálvez and Bernat-Ponce [41]. The increased surface temperature of the artificial grass also increases the heat stress on park users who are conducting activities close to ground level, such as playing or sitting on the artificial grass. In addition, artificial grass blocks water evaporation from the soil, which enhances tree performance due to stabilising the soil water content above the wilting point. However, this could harm the overall water cycle in the city and may result in longer dry weather periods [68]. Therefore, the city council must not use artificial grass in local parks and should restrict its usage in open spaces, at least where visitors perform activities, especially if the artificial grass is not shaded.
Limitations and Future Studies
This simulation-based study investigates various local park settings during extreme heat and dry periods. Although the simulation tool provided highly satisfactory results [53], it is not without limitations, and a percentage of error could exist in the study, reaching 20–25%. Therefore, the results of this study could be used for guidance, and future research may consider conducting surveys during the highlighted weather conditions to increase the credibility of this study and to investigate the thermal comfort sensation of different age groups.
In addition, this study demonstrates that wind direction affects the cooling effect of the local parks and their impact on the context, specifically with trees in the wind’s direction. Therefore, future studies may consider investigating different local park designs and tree arrangements to increase the wind flow within the park and limit the negative impact from reduced wind speed. These designs may include a different location for the active open spaces and different tree proximity arrangements inside the park.
The study also shows that the artificial grass temperature could increase to high levels, limiting the transfer of water between the soil and the atmosphere and reducing water infiltration during rainfalls. This negatively affects the environment and limits artificial grass usage. Future studies could investigate alternative materials and finishes to mitigate these limitations. This could be performed using super-cool materials for the artificial grass fibres, porous infills, and backing systems.
5. Conclusions
This case study focused on the Sunshine Coast, Australia. It aimed to provide evidence for the thermal comfort and UHI mitigation performance of various local settings; specifically, it tested whether using artificial grass or installing irrigation systems would have a more sustainable impact on UHIs. The study also tested three tree proximity arrangements to assess their influence on the investigated surfaces and to find which tree arrangement could help mitigate UHIs better, based on the selected settings of the local parks. Overall, the study provided valuable insights for UHI mitigation and improving thermal comfort on the Sunshine Coast.
This study demonstrated that installing an irrigation system or irrigating local parks would significantly enhance their performance in various aspects, including visitors’ thermal comfort and the ability to mitigate UHIs. The research also emphasised the importance of increasing the number of local parks in the built environment of the city since, regardless of their setting, they contributed to a reduction of the UHIs’ effect by 0.78 °C–1.34 °C and a reduction of the peak temperature by 2 °C–3.6 °C. However, it should be noted that their cooling effect was delayed by about an hour when the temperature dropped, and it could be negative if the drop was ≥1.4 °C/h.
This study showed that artificial grass’s performance was worse than that of asphalt by about 2.60 °C. Using artificial grass for the park’s surface resulted in a better performance than dry grass or bare soil at peak temperature, due to the reduced ET of the soil’s surface and the stabilisation of the soil’s water content, which enhanced the ET of the trees. However, due to the increased surface temperature of the artificial grass, which increased the soil temperature, the night cooling effect was significantly reduced, limiting the overall cooling effect during the day. In addition, although the artificial grass reduced air temperature better than dry grass or soil, this study found that this could be inverted during long dry weather periods, when the soil water content is reduced to below the wilting point.
In addition, the study demonstrated that air temperature and thermal comfort are not sufficient to evaluate strategies to mitigate urban heat islands when humans could interact with the mitigation strategies used. This is because the MRT could be increased to harmful levels around trees due to the limited soil water content in some of the investigated local parks. Lastly, the study demonstrated that tree proximity positively or negatively impacted UHIs depending on the local park settings. Therefore, the tree arrangements and the type of ground cover used in this context must be carefully studied, and consider the availability of the soil water content, specifically during heatwaves and dry weather periods when the cooling performance of these parks is most needed.
Funding
This research received no external funding.
Data Availability Statement
No data were created except what are presented in this study.
Conflicts of Interest
The author declares there is no conflict of interest.
References
- Tan, J.; Zheng, Y.; Tang, X.; Guo, C.; Li, L.; Song, G.; Zhen, X.; Yuan, D.; Kalkstein, A.J.; Li, F. The urban heat island and its impact on heat waves and human health in Shanghai. Int. J. Biometeorol. 2010, 54, 75–84. [Google Scholar] [CrossRef] [PubMed]
- Gustin, M.; Fleming, P.R.; Allinson, D.; Watson, S. Modelling surface temperatures on 3G artificial turf. Multidiscip. Digit. Publ. Inst. Proc. 2018, 2, 279. [Google Scholar]
- Satterthwaite, D. Cities’ contribution to global warming: Notes on the allocation of greenhouse gas emissions. Environ. Urban. 2008, 20, 539–549. [Google Scholar] [CrossRef] [Green Version]
- Yenneti, K.; Ding, L.; Prasad, D.; Ulpiani, G.; Paolini, R.; Haddad, S.; Santamouris, M. Urban overheating and cooling potential in Australia: An evidence-based review. Climate 2020, 8, 126. [Google Scholar] [CrossRef]
- Gago, E.J.; Roldan, J.; Pacheco-Torres, R.; Ordóñez, J. The city and urban heat islands: A review of strategies to mitigate adverse effects. Renew. Sustain. Energy Rev. 2013, 25, 749–758. [Google Scholar] [CrossRef]
- Abuseif, M.; Dupre, K.; Michael, R.N. Trees on buildings: A design framework. Nat.-Based Solut. 2023, 3, 100052. [Google Scholar] [CrossRef]
- Bowler, D.E.; Buyung-Ali, L.; Knight, T.M.; Pullin, A.S. Urban greening to cool towns and cities: A systematic review of the empirical evidence. Landsc. Urban Plan 2010, 97, 147–155. [Google Scholar] [CrossRef]
- Eliasson, I. The use of climate knowledge in urban planning. Landsc. Urban Plan 2000, 48, 31–44. [Google Scholar] [CrossRef]
- Abuseif, M.; Dupre, K.; Michael, R.N. Trees on Buildings: A Tree Selection Framework Based on Industry Best Practice. Land 2023, 12, 97. [Google Scholar] [CrossRef]
- Abuseif, M.; Dupre, K.; Michael, R. The effect of green roof configurations including trees in a subtropical climate: A co-simulation parametric study. J. Clean. Prod. 2021, 317, 128458. [Google Scholar] [CrossRef]
- Feyisa, G.L.; Dons, K.; Meilby, H. Efficiency of parks in mitigating urban heat island effect: An example from Addis Ababa. Landsc. Urban Plan. 2014, 123, 87–95. [Google Scholar] [CrossRef]
- Morakinyo, T.E.; Kong, L.; Lau, K.K.-L.; Yuan, C.; Ng, E. A study on the impact of shadow-cast and tree species on in-canyon and neighborhood’s thermal comfort. Build. Environ. 2017, 115, 1–17. [Google Scholar] [CrossRef]
- Zheng, S.; Zhao, L.; Li, Q. Numerical simulation of the impact of different vegetation species on the outdoor thermal environment. Urban For. Urban Green. 2016, 18, 138–150. [Google Scholar] [CrossRef]
- Dunnett, N.; Nagase, A.; Booth, R.; Grime, P. Influence of vegetation composition on runoff in two simulated green roof experiments. Urban Ecosyst. 2008, 11, 385–398. [Google Scholar] [CrossRef]
- Carter, T.; Keeler, A. Life-cycle cost–benefit analysis of extensive vegetated roof systems. J. Environ. Manag. 2008, 87, 350–363. [Google Scholar] [CrossRef]
- Jaffal, I.; Ouldboukhitine, S.-E.; Belarbi, R. A comprehensive study of the impact of green roofs on building energy performance. Renew. Energy 2012, 43, 157–164. [Google Scholar] [CrossRef]
- Sun, T.; Grimmond, C.; Ni, G.H. How do green roofs mitigate urban thermal stress under heat waves? J. Geophys. Res. Atmos. 2016, 121, 5320–5335. [Google Scholar] [CrossRef]
- Geros, V.; Santamouris, M.; Karatasou, S.; Tsangrassoulis, A.; Papanikolaou, N. On the cooling potential of night ventilation techniques in the urban environment. Energ. Build. 2005, 37, 243–257. [Google Scholar] [CrossRef]
- Abuseif, M.; Dupre, K.; Michael, R.N. Trees on buildings: Opportunities, challenges, and recommendations. Build. Environ. 2022, 225, 109628. [Google Scholar] [CrossRef]
- Lindberg, F.; Grimmond, C. The influence of vegetation and building morphology on shadow patterns and mean radiant temperatures in urban areas: Model development and evaluation. Theor. Appl. Climatol. 2011, 105, 311–323. [Google Scholar] [CrossRef]
- Gagge, A.P.; Fobelets, A.; Berglund, L. A standard predictive index of human response to the thermal environment. ASHRAE Trans 1986, 92, 709–731. [Google Scholar]
- Rees, S.; Adjali, M.; Zhou, Z.; Davies, M.; Thomas, H. Ground heat transfer effects on the thermal performance of earth-contact structures. Renew. Sustain. Energy Rev. 2000, 4, 213–265. [Google Scholar] [CrossRef]
- Shashua-Bar, L.; Pearlmutter, D.; Erell, E. The cooling efficiency of urban landscape strategies in a hot dry climate. Landsc. Urban Plan 2009, 92, 179–186. [Google Scholar] [CrossRef]
- Oke, T.R. The energetic basis of the urban heat island. Q. J. R. Meteorol. Soc. 1982, 108, 1–24. [Google Scholar] [CrossRef]
- Yaghoobian, N. The Effect of Heat Transfer from Artificial Turf on the Urban Energy Balance. In Proceedings of the Eighth Symposium on the Urban Environment, Aachen, Germany, 19–21 August 2009. [Google Scholar]
- Mantas, V.M.; Xian, G. Land Surface Temperature Differences Between Natural and Artificial Turf Sports Fields as Estimated from Satellite: Examples from the United States and Europe. In Proceedings of the 2021 IEEE International Geoscience and Remote Sensing Symposium IGARSS, Brussels, Belgium, 11–16 July 2021; pp. 1777–1780. [Google Scholar]
- Golden, L.M. The Contribution of Artificial Turf to Global Warming. Sustain. Clim. Chang. 2021, 14, 436–449. [Google Scholar] [CrossRef]
- Ataabadi, Y.A.; Sadeghi, H.; Alizadeh, M.H. The effects of artificial turf on the performance of soccer players and evaluating the risk factors compared to natural grass. Neurol. Res. Ther. 2017, 2, 1–16. [Google Scholar] [CrossRef] [Green Version]
- Beausoleil, M.; Price, K.; Muller, C. Chemicals in Outdoor Artificial Turf: A health Risk for Users. Public Health Branch, Montreal Health and Social Services Agency. 2009. Available online: http://www.ncceh.ca/sites/default/files/Outdoor_Artificial_Turf.pdf (accessed on 24 February 2023).
- El, S. Artificial grass to replace natural grass in green areas and public parks to combat water shortage. ARPN J. Eng. Appl. Sci. 2018, 13, 8110–8119. [Google Scholar]
- Lozano, J.E.; Ferguson, S. Ecosystem Services for Compensation of Artificial Turf Systems; Swedish University of Agricultural Sciences (SLU): Uppsala, Sweden, 2021; p. 21. Available online: https://www.ifn.se/media/sq0b0gti/2021-ferguson-lozano-ecosystem-services-for-compensation-of-artificial-turf-systems.pdf (accessed on 24 February 2023).
- Nilsson, N.H.; Malmgren-Hansen, B.; Thomsen, U.S.; Institut, T. Mapping, Emissions and Environmental and Health Assessment of Chemical Substances in Artificial Turf; Danish Environmental Protection Agency: Copenhagen, Denmark, 2008. [Google Scholar]
- Levinger, P.; Cerin, E.; Milner, C.; Hill, K.D. Older people and nature: The benefits of outdoors, parks and nature in light of COVID-19 and beyond–where to from here? Int. J. Environ. Health Res. 2022, 32, 1329–1336. [Google Scholar] [CrossRef]
- Pitas, N.A.; Powers, S.L.; Mowen, A.J. Neoliberal conservation and equity in the context of local parks and recreation: Stakeholder perceptions on public-non-profit partnerships. J. Leis. Res. 2022, 53, 473–491. [Google Scholar] [CrossRef]
- Geng, X.; Yu, Z.; Zhang, D.; Li, C.; Yuan, Y.; Wang, X. The influence of local background climate on the dominant factors and threshold-size of the cooling effect of urban parks. Sci. Total Env. 2022, 823, 153806. [Google Scholar] [CrossRef]
- Richards, D.R.; Fung, T.K.; Belcher, R.; Edwards, P.J. Differential air temperature cooling performance of urban vegetation types in the tropics. Urban For. Urban Green. 2020, 50, 126651. [Google Scholar] [CrossRef]
- Jamei, E.; Ossen, D.; Seyedmahmoudian, M.; Sandanayake, M.; Stojcevski, A.; Horan, B. Urban design parameters for heat mitigation in tropics. Renew. Sustain. Energy Rev. 2020, 134, 110362. [Google Scholar] [CrossRef]
- Sunshine Coast Council. Sunshine Coast: Recreation Parks Plan; Sunshine Coast Council: Sunshine Coast, Australia, 2021; p. 98.
- State of Queensland. Efficient Irrigation for Water Conservation: Guideline for Water Efficient Urban Gardens and Landscapes; The Queensland Government: State of Queensland, Australia, 2020; p. 48.
- McDowell, N.; Pockman, W.T.; Allen, C.D.; Breshears, D.D.; Cobb, N.; Kolb, T.; Plaut, J.; Sperry, J.; West, A.; Williams, D.G. Mechanisms of plant survival and mortality during drought: Why do some plants survive while others succumb to drought? New Phytol. 2008, 178, 719–739. [Google Scholar] [CrossRef]
- Sánchez-Sotomayor, D.; Martín-Higuera, A.; Gil-Delgado, J.A.; Gálvez, Á.; Bernat-Ponce, E. Artificial grass in parks as a potential new threat for urban bird communities. Bird Conserv. Int. 2022, 33, e16. [Google Scholar] [CrossRef]
- Bogo, M.; Rawlings, M.; Katz, E.; Logie, C. Using Simulation in Assessment and Teaching: OSCE Adapted for Social Work; Council on Social Work Education: Alexandria, VA, USA, 2014. [Google Scholar]
- Kourgiantakis, T.; Sewell, K.M.; Hu, R.; Logan, J.; Bogo, M. Simulation in social work education: A scoping review. Res. Soc. Work Pract. 2020, 30, 433–450. [Google Scholar] [CrossRef]
- Sailor, D.J. A green roof model for building energy simulation programs. Energ Build. 2008, 40, 1466–1478. [Google Scholar] [CrossRef]
- Norman, J.M. Simulation of microclimates. In Biometeorology in Integrated Pest Management; Academic Press: Cambridge, MA, USA, 1982; pp. 65–99. [Google Scholar]
- Isbell, R.; National Committee on Soil and Terrain. The Australian Soil Classification; CSIRO Publishing: Clayton, Victoria, Australia, 2021. [Google Scholar]
- Ziaul, S.; Pal, S. Modeling the effects of green alternative on heat island mitigation of a meso level town, West Bengal, India. Adv Space Res 2020, 65, 1789–1802. [Google Scholar] [CrossRef]
- Chen, Y.P.; Zheng, B.H.; Hu, Y.Z. Numerical Simulation of Local Climate Zone Cooling Achieved through Modification of Trees, Albedo and Green Roofs—A Case Study of Changsha, China. Sustainability 2020, 12, 2752. [Google Scholar] [CrossRef] [Green Version]
- Bruse, M.; Fleer, H. Simulating surface–plant–air interactions inside urban environments with a three dimensional numerical model. Env. Model. Softw. 1998, 13, 373–384. [Google Scholar] [CrossRef]
- Bruse, M. ENVI-met 3.0: Updated Model Overview. Available online: http://envi-met.net/documents/papers/overview30.pdf (accessed on 24 February 2023).
- Liu, Z.; Zheng, S.; Zhao, L. Evaluation of the ENVI-Met vegetation model of four common tree species in a subtropical hot-humid area. Atmosphere 2018, 9, 198. [Google Scholar] [CrossRef] [Green Version]
- Ng, E.; Chen, L.; Wang, Y.N.; Yuan, C. A study on the cooling effects of greening in a high-density city: An experience from Hong Kong. Build Environ. 2012, 47, 256–271. [Google Scholar] [CrossRef]
- Ouyang, W.; Sinsel, T.; Simon, H.; Morakinyo, T.E.; Liu, H.; Ng, E. Evaluating the thermal-radiative performance of ENVI-met model for green infrastructure typologies: Experience from a subtropical climate. Build. Environ. 2022, 207, 108427. [Google Scholar] [CrossRef]
- Yaghoobian, N.; Kleissl, J.; Krayenhoff, E.S. Modeling the thermal effects of artificial turf on the urban environment. J. Appl. Meteorol. Climatol. 2010, 49, 332–345. [Google Scholar] [CrossRef]
- Sanjuán, M.Á.; Morales, Á.; Zaragoza, A. Effect of Precast Concrete Pavement Albedo on the Climate Change Mitigation in Spain. Sustainability 2021, 13, 1448. [Google Scholar] [CrossRef]
- Thorsson, S.; Rocklöv, J.; Konarska, J.; Lindberg, F.; Holmer, B.; Dousset, B.; Rayner, D. Mean radiant temperature—A predictor of heat related mortality. Urban Clim. 2014, 10, 332–345. [Google Scholar] [CrossRef]
- Zare, S.; Hasheminejad, N.; Shirvan, H.E.; Hemmatjo, R.; Sarebanzadeh, K.; Ahmadi, S. Comparing Universal Thermal Climate Index (UTCI) with selected thermal indices/environmental parameters during 12 months of the year. Weather Clim. Extrem. 2018, 19, 49–57. [Google Scholar] [CrossRef]
- Li, K.; Liu, X.; Bao, Y. Evaluating the performance of different thermal indices on quantifying outdoor thermal sensation in humid subtropical residential areas in China. Front. Environ. Sci. 2022, 10, 2401. [Google Scholar] [CrossRef]
- Ghani, S.; Mahgoub, A.O.; Bakochristou, F.; ElBialy, E.A. Assessment of thermal comfort indices in an open air-conditioned stadium in hot and arid environment. J. Build. Eng. 2021, 40, 102378. [Google Scholar] [CrossRef]
- Sundevall, E.P.; Jansson, M. Inclusive parks across ages: Multifunction and urban open space management for children, adolescents, and the elderly. Int. J. Environ. Res. Public Health 2020, 17, 9357. [Google Scholar] [CrossRef]
- Spronken-Smith, R.A.; Oke, T.R.; Lowry, W.P. Advection and the surface energy balance across an irrigated urban park. Int. J. Climatol. A J. R. Meteorol. Soc. 2000, 20, 1033–1047. [Google Scholar] [CrossRef]
- Ouyang, W.; Morakinyo, T.E.; Ren, C.; Ng, E. The cooling efficiency of variable greenery coverage ratios in different urban densities: A study in a subtropical climate. Build. Environ. 2020, 174, 106772. [Google Scholar] [CrossRef]
- Sun, S.; Xu, X.; Lao, Z.; Liu, W.; Li, Z.; Higueras García, E.; He, L.; Zhu, J. Evaluating the impact of urban green space and landscape design parameters on thermal comfort in hot summer by numerical simulation. Build. Environ. 2017, 123, 277–288. [Google Scholar] [CrossRef]
- Shao, H.; Kim, G. A Comprehensive Review of Different Types of Green Infrastructure to Mitigate Urban Heat Islands: Progress, Functions, and Benefits. Land 2022, 11, 1792. [Google Scholar] [CrossRef]
- Yao, X.; Yu, K.; Zeng, X.; Lin, Y.; Ye, B.; Shen, X.; Liu, J. How can urban parks be planned to mitigate urban heat island effect in “Furnace cities”? An accumulation perspective. J. Clean. Prod. 2022, 330, 129852. [Google Scholar] [CrossRef]
- Barradas, V.L.; Miranda, J.A.; Esperón-Rodríguez, M.; Ballinas, M. (Re) Designing Urban Parks to Maximize Urban Heat Island Mitigation by Natural Means. Forests 2022, 13, 1143. [Google Scholar] [CrossRef]
- Wang, J.; Chang, L.; Aggarwal, S.; Abari, O.; Keshav, S. Soil moisture sensing with commodity RFID systems. In Proceedings of the 18th International Conference on Mobile Systems, Applications, and Services, Toronto, ON, Canada, 16–19 June 2020; pp. 273–285. [Google Scholar]
- Abuseif, M.; Gou, Z. A Review of Roofing Methods: Construction Features, Heat Reduction, Payback Period and Climatic Responsiveness. Energies 2018, 11, 3196. [Google Scholar] [CrossRef] [Green Version]
Figure 1.
Schematic layouts for the simulation scenarios identifying the three different tree proximity arrangements and ground covers as design variables for the local park.
Figure 1.
Schematic layouts for the simulation scenarios identifying the three different tree proximity arrangements and ground covers as design variables for the local park.

Figure 2.
The day’s average urban heat intensity reduction of the various local park settings compared to the input weather data from the Bureau of Metrology, Australia. LTP = low tree proximity, MTP = medium tree proximity, and HTP = high tree proximity.
Figure 2.
The day’s average urban heat intensity reduction of the various local park settings compared to the input weather data from the Bureau of Metrology, Australia. LTP = low tree proximity, MTP = medium tree proximity, and HTP = high tree proximity.

Figure 3.
Median air temperature at 1.5 m above ground level in the centre of the park. ING = irrigated natural grass, NNG = non-irrigated natural grass, S = bare soil, and AG = artificial grass.
Figure 3.
Median air temperature at 1.5 m above ground level in the centre of the park. ING = irrigated natural grass, NNG = non-irrigated natural grass, S = bare soil, and AG = artificial grass.

Figure 4.
The Universal Thermal Climate Index of the local parks at 1.5 m above ground level at 1 p.m. Sub-figures (1)–(12) refer to the simulated scenarios, as the headers explained.
Figure 4.
The Universal Thermal Climate Index of the local parks at 1.5 m above ground level at 1 p.m. Sub-figures (1)–(12) refer to the simulated scenarios, as the headers explained.

Figure 5.
Mean radiant temperature of the local parks at 1.5 m above ground level at 1 p.m. Sub-figures (1)–(12) refer to the simulated scenarios, as the headers explained.
Figure 5.
Mean radiant temperature of the local parks at 1.5 m above ground level at 1 p.m. Sub-figures (1)–(12) refer to the simulated scenarios, as the headers explained.

Figure 6.
The surface’s temperature at the local parks at 1 p.m. Sub-figures (1)–(12) refer to the simulated scenarios, as the headers explained.
Figure 6.
The surface’s temperature at the local parks at 1 p.m. Sub-figures (1)–(12) refer to the simulated scenarios, as the headers explained.


Table 1.
Climate characteristics of the Sunshine Coast. The source of this information is the Bureau of Meteorology, Australia.
Table 1.
Climate characteristics of the Sunshine Coast. The source of this information is the Bureau of Meteorology, Australia.
| Statistics | Jan. | Feb. | Mar. | Apr. | May | Jun. | Jul. | Aug. | Sep. | Oct. | Nov. | Dec. | Annual |
|---|---|---|---|---|---|---|---|---|---|---|---|---|---|
| Temperature | |||||||||||||
| Mean maximum temperature (°C) | 29 | 28.9 | 27.9 | 26 | 23.6 | 21.4 | 21.1 | 22.2 | 24.3 | 25.7 | 27.2 | 28.3 | 25.5 |
| Mean minimum temperature (°C) | 21.3 | 21.3 | 20.2 | 17.1 | 13.8 | 11.4 | 9.7 | 9.9 | 13 | 15.7 | 17.9 | 19.9 | 15.9 |
| Rainfall | |||||||||||||
| Mean rainfall (mm) | 143 | 224 | 183 | 147 | 167 | 112 | 69 | 68 | 54 | 94 | 83 | 154 | 1517 |
| Mean number of days of rain ≥ 1 mm | 10 | 12 | 12 | 11 | 10 | 9 | 7 | 5 | 5 | 7 | 7 | 10 | 106 |
| Detailed climate characteristics | |||||||||||||
| 9 a.m. conditions | |||||||||||||
| Mean temperature (°C) | 26.3 | 26.3 | 24.9 | 22.5 | 19.3 | 16.8 | 15.9 | 17.4 | 20.8 | 22.8 | 24.4 | 25.9 | 21.9 |
| Mean relative humidity (%) | 73 | 73 | 74 | 75 | 75 | 76 | 73 | 68 | 65 | 66 | 67 | 69 | 71 |
| Mean wind speed (km/h) | 19.3 | 18.8 | 18.3 | 17.3 | 15.8 | 15 | 14.9 | 15.8 | 16.7 | 18.2 | 18.9 | 18.5 | 17.3 |
| 3 p.m. conditions | |||||||||||||
| Mean temperature (°C) | 27 | 27.1 | 26.1 | 24.3 | 22 | 20.1 | 19.6 | 20.3 | 22.3 | 23.4 | 24.8 | 26.2 | 23.6 |
| Mean relative humidity (%) | 70 | 71 | 69 | 68 | 65 | 63 | 59 | 59 | 63 | 66 | 67 | 69 | 66 |
| Mean wind speed (km/h) | 24.1 | 23.5 | 23.1 | 21.2 | 19.1 | 18.2 | 18.9 | 21.2 | 23.5 | 24.2 | 24.5 | 24.3 | 22.1 |
Table 2.
The values used for the simulation parameters of the vegetation.
| Vegetation Type and Parameters | Input Value |
|---|---|
| Tree parameters | |
| Height | 15 m |
| Diameter | 10 m |
| LAD | 1.1 m2/m3 |
| Root depth | 12 m |
| Root diameter | 9 m |
| Foliage shortwave albedo | 0.18 |
| Foliage shortwave transmittance | 0.30 |
| Emissivity of leaves | 0.96 |
| Leaf weight | 100 g/m2 |
| Grass parameters | |
| Height | 0.05 m |
| Leaf area profile | 0.3 |
| Root depth | 0.2 m |
| Shortwave albedo | 0.2 |
| Shortwave transmittance | 0.3 |
| Emissivity | 0.97 |
Table 3.
The values used for the simulation parameters of the surfaces.
| Surface Type | Albedo | Emissivity | Heat Capacity | Heat Conductivity |
|---|---|---|---|---|
| Artificial grass | 0.08 | 0.95 | 2.214 | 1.16 |
| Light colour Concrete pavement | 0.8 | 0.9 | 2.083 | 1.63 |
| Asphalt | 0.2 | 0.9 | 2.251 | 0.9 |
Table 4.
Thermal sensation based on UTCI temperature. Adapted from Zare, Hasheminejad, Shirvan, Hemmatjo, Sarebanzadeh and Ahmadi [57].
Table 4.
Thermal sensation based on UTCI temperature. Adapted from Zare, Hasheminejad, Shirvan, Hemmatjo, Sarebanzadeh and Ahmadi [57].
| UTCI (°C) Range | Stress Category |
|---|---|
| 46+ | Extreme heat stress |
| 46–38 | Very strong heat stress |
| 38–32 | Strong heat stress |
| 32–26 | Moderate heat stress |
| 26–9 | No thermal stress |
Table 5.
Human parameters used in reporting UTCI.
| Parameters | Values |
|---|---|
| Body Parameters | |
| Age of person | 9 |
| Gender | Male |
| Weight (kg) | 30 |
| Height (m) | 1.5 |
| Surface area (DuBois-Area) | 1.1 m2 |
| Walking speed | 1.21 m/s |
| Body position | Standing |
| Clothing parameters | |
| Static Insulation Outdoor (clo) | 0.5 |
| Personal metabolism | |
| Total Metabolic rate (W) | 128.85 (=117.18 W/m2) (met = 2.01) |
Table 6.
Median air, UTCI, MRT, and surface temperatures of the investigated local park settings at 1 p.m.
Table 6.
Median air, UTCI, MRT, and surface temperatures of the investigated local park settings at 1 p.m.
| Irrigated Natural Grass | Non-Irrigated Natural Grass | Bare Soil | Artificial Grass | |||||||||
|---|---|---|---|---|---|---|---|---|---|---|---|---|
| Tree Proximity | Low | Medium | High | Low | Medium | High | Low | Medium | High | Low | Medium | High |
| Air temperature | 37.36 | 37.21 | 37.08 | 38.37 | 38.54 | 38.63 | 38.36 | 38.52 | 38.62 | 38.41 | 38.60 | 38.70 |
| UTCI | 40.74 | 40.87 | 40.76 | 41.96 | 41.68 | 41.45 | 42.08 | 41.72 | 41.49 | 41.76 | 41.50 | 41.36 |
| MRT | 54.86 | 54.52 | 54.11 | 58.67 | 57.73 | 56.54 | 59.08 | 57.81 | 56.52 | 57.57 | 56.80 | 55.99 |
| Surfaces | 37.21 | 36.20 | 35.89 | 41.70 | 40.46 | 38.99 | 41.82 | 39.90 | 38.78 | 42.22 | 40.65 | 38.63 |
Disclaimer/Publisher’s Note: The statements, opinions and data contained in all publications are solely those of the individual author(s) and contributor(s) and not of MDPI and/or the editor(s). MDPI and/or the editor(s) disclaim responsibility for any injury to people or property resulting from any ideas, methods, instructions or products referred to in the content. |
© 2023 by the author. Licensee MDPI, Basel, Switzerland. This article is an open access article distributed under the terms and conditions of the Creative Commons Attribution (CC BY) license (https://creativecommons.org/licenses/by/4.0/).
Share and Cite
MDPI and ACS Style
Abuseif, M. The Thermal Effect of Various Local Park Settings: A Simulation-Based Case Study of Sunshine Coast, Australia. Architecture 2023, 3, 195-212. https://doi.org/10.3390/architecture3020012
AMA Style
Abuseif M. The Thermal Effect of Various Local Park Settings: A Simulation-Based Case Study of Sunshine Coast, Australia. Architecture. 2023; 3(2):195-212. https://doi.org/10.3390/architecture3020012
Chicago/Turabian StyleAbuseif, Majed. 2023. "The Thermal Effect of Various Local Park Settings: A Simulation-Based Case Study of Sunshine Coast, Australia" Architecture 3, no. 2: 195-212. https://doi.org/10.3390/architecture3020012