
Assessing the COVID-19 Impact of Projects under Construction with Monte Carlo Simulation
1
Construction Engineering, National Kaohsiung University of Science and Technology, Kaohsiung 82445, Taiwan
2
CECI Engineering Consultants, Inc., Kaohsiung 82445, Taiwan
*
Authors to whom correspondence should be addressed.
Architecture 2023, 3(2), 175-194; https://doi.org/10.3390/architecture3020011
Submission received: 6 February 2023
/
Revised: 10 March 2023
/
Accepted: 10 April 2023
/
Published: 13 April 2023
(This article belongs to the Special Issue Ideas, Practices and Strategies for the Implementation of Sustainable Architecture, including User Needs, Construction Technology, and Resource Efficiency)
Abstract
:The outbreak of the novel coronavirus pneumonia (COVID-19) in 2019 and the 2022 war in Ukraine have had profound global impacts on travel and logistics, disrupted the material supply chain, significantly influenced the cost and progress of construction projects, and further impacted the operational effectiveness of firms. Despite some existing studies providing valuable insights into the impact of COVID-19 on the construction industry, there remain research gaps that need to be addressed. Prior studies have mainly focused on the immediate impact factors of the pandemic, such as supply chain disruptions and workforce shortages, and strategies for effectively reducing or eliminating these risks. However, there is a need for research that delves into the long-term implications of these disruptions. So far, no relevant research has quantified the broader impact of the epidemic. Thus, this study aims to analyze the effects of the pandemic and the war on 136 construction industry professionals, their projects, and firms through literature review, questionnaire surveys, and expert interviews. The study compiles a list of significant risk factors for construction projects between 2019–2022, including their probability of occurrence, impact over time, and overall cost. The study also analyzes and discusses the impact of these high-risk factors as of 2022. To quantify the impact, cost, and level of exposure to these risks suffered by actual construction projects over this period, the Monte Carlo simulation method is introduced. This approach provides contractors with early prediction of risks and appropriate responses to mitigate risks.
1. Introduction
The outbreak of the novel coronavirus disease (COVID-19) pandemic has caused significant impacts on life and economy, with the World Bank forecasting a 4.3% global economic contraction in 2020 as a result of the measures taken by governments to control the virus transmission, such as travel restrictions, social distancing, quarantine, and border closures and controls [1]. This research aims to explore and analyze the impacts of COVID-19 on engineering projects in terms of the risk occurrence probability and the percentage of impacts on time and cost which resulted in delayed engineering progress and increased costs over the three-year period from 2019 to 2022.
Recent literature and research concerning the effects of war and the pandemic on the economy over the past three years have mostly focused on identifying the risk factors affecting specific projects, and have neither investigated the broader causes of these risks nor assessed the probability of occurrence and the degree of impact during construction. Some scholars in Taiwan have discussed the impact of the epidemic on the global economy and assessed the current state of the construction industry. They have reported statistics on the prices of major construction materials such as sand and gravel, ready-mixed concrete, steel rebar, asphalt, and concrete, and forecasted their fluctuation trends [2,3]. They have also collected and analyzed information on issues such as manpower shortage and rising raw material prices, as well as offered statistics and an analysis of the fluctuations in the stock prices of listed companies in the domestic construction industry [4]. Studies conducted in various countries, such as the United States [5,6], China [7], South Korea [8], India [9], and Singapore [10], have investigated the short- and long-term impacts of COVID-19 on the construction industry. Having evaluated and analyzed the information, these studies have proposed guidelines to manage the impact of this pandemic on the industry. Therefore, this study aims to quantify the exposure value of the increase in project duration and costs caused by unexpected pandemic risk factors through a case analysis, providing the project manager with a sophisticated quantitative assessment of the potential subsequent impact of the risks in advance. The purpose of this study is as follows:
- (1)
- Comprehensively identify the risk factors of the impact of the epidemic on construction projects and classify them according to their nature.
- (2)
- Identify key risk factors by means of expert interviews and questionnaires.
- (3)
- Use Monte Carlo simulation to quantify the exposure to risk, estimate the project schedule delay, and demonstrate the validity of this model.
2. Literature Review
2.1. The Impact of the Coronavirus Epidemic on the Construction Industry
The novel coronavirus pneumonia epidemic (COVID-19) that appeared in early 2020 has been a major public health emergency in human history. It resulted in severe economic declines, fluctuations in financial markets, and continued increases in commodity prices. There are many publications on the impact of the epidemic, indicating how much the world has suffered from it [11]. According to the real-time statistics of the World Health Organization (WHO), as of 5 October 2022, the cumulative number of confirmed cases of the coronavirus pneumonia worldwide was over 610 million [12,13]. Among many other consequences of the epidemic, the construction industry has suffered insufficient labor and an inadequate supply of machinery, materials, and equipment, resulting in additional costs and increased construction time, contract disputes, difficulties in financial turnover, and deepening operational risks [14,15].
Concerning the construction industry, the Taiwan government [12] put forth specific relevant countermeasures for many important issues that had arisen, such as stabilizing supply chains for sand and gravel, covering short-term gaps in imported sand and gravel, controlling price fluctuations of ready-mixed concrete, stabilizing the supply of engineering labor, and managing other related bottlenecks in procurement. These measures have meant that so far the construction industry has not endured much impact.
2.2. The Phenomenon of Labor Shortage in the Construction Industry
The International Labor Organization (ILO) announced that the number of unemployed worldwide is estimated to be 207 million 2022, about 11% higher than the 186 million in 2019 [13], and the labor market is expected to remain weak next year. In early 2022, the Construction Administration of the Republic of China released a survey on the economic situation of the construction industry [14]. It was revealed that the situation of “talent shortage” in the construction industry poses a much greater concern [4].
Many countries have experienced labor shortages due to the epidemic and war. Singapore was blocked for 122 days from April to August 2020 [15]. According to a questionnaire survey, most of the construction projects in Singapore were expected to be completed during the epidemic. However, project completion took 40% more time than originally planned, and the root cause was a shortage of workers, with a large number of immigrant construction workers infected with COVID-19 and confined to their dormitories. Another reason is that about 30% of migrant workers did not return to Singapore after returning to their own countries, resulting in further labor shortages. The People’s Republic of China also experienced a large number of labor shortages. Wang [16] pointed out that almost all cases were blocked due to the epidemic. As a result, many cities in China are still locked down, making it difficult for workers to return, thereby hindering the resumption of construction work and causing serious delays in construction. In terms of construction, the epidemic and war have not only interrupted procurement and caused shortages in supply and manpower, but have also affected the progress of construction works [17,18].
2.3. Existing Literature and Knowledge Gaps
Shi Yifang et al. [2] discussed the impact of the epidemic on the global economy, assessed the current state of the engineering industry, and explained the impact of the epidemic on engineering consulting companies. They then put forward suggestions for introducing and expanding technological applications supporting the work. Li Jialong and Lu Zongxian [3] reported statistics on the prices of major construction materials such as sand and gravel, ready-mixed concrete, steel rebar, asphalt, and concrete, and forecast their development trends. Liu Taiyi et al. [19] collected and analyzed information on issues such as manpower shortage and rising raw material prices, and also offered statistics and an analysis of fluctuations in stock prices of listed companies in the Taiwan construction industry. All these studies showed that COVID-19 has led to constraints and delays in material supply, limited access to resources, and manpower shortages. International travel restrictions have further impacted project schedules and budgets.
While previous studies [20,21,22,23,24,25,26,27] have examined the impact of epidemics and wars on construction engineering, there remains a need for further research to investigate the long-term implications of these disruptions and to provide a detailed quantification of their impact on overall construction cost and time. So far, no research has specifically quantified the impact of epidemics on the construction industry, including the risk of project schedule delays, increased costs, and the probability of occurrence. This study aims to fill this gap in the literature.
2.4. Key Factors of Risk in Construction Projects
The ultimate purpose of risk management is not to try to minimize risks or dangers, or to eliminate them completely, but to seek an equilibrium point and to control risks or dangers within an acceptable range under the most cost-effective premises [28]. This study discusses the risk involved with construction projects to predict the overall exposure to risk over the construction period and the cost thereof. Here, the construction phase is given greater attention because it requires material and equipment input and has the most intensive on-site labor, and therefore poses the most acute risk factors.
In light of the literature related to construction risk, some studies on risk management mainly rely on a single project as a reference for estimating construction risk. Consequently, the risk factors are often biased toward the narratives of individual case studies. For instance, Zhang Qingmiao [29] conducted a study on occupational disaster risks in safety aspects such as falling, collapsing, and flying that frequently occur in steel structure engineering. He Weixuan [30] analyzed high-risk factors, such as employee falls, falling objects, and electric shock, connected with the bridge construction method, while Wang Jiaye [31] summarized the natural and human factors affecting the risks faced by offshore hoisting operations over the past ten years. However, few studies have compiled a list of risk factors commonly used in various construction projects.
Concerning the categorization of risk factors in previous studies, Yang Zhibin et al. [32] analyzed public works using questionnaires to explore the reasons for delays in each stage. Yang classified the risks encountered during the construction stage into 37 reasons divided into seven categories, including “Inconsistency with the contract content”, “Poor project management”, “Improper planning and design”, “Financial problems”, “Human factors”, “Non-human factors”, and “Human and non-human factors together”. Yuan Zhentu [33] studied the construction of the MRT (mass rapid transit) and reviewed the major risks involved in Taiwanese public projects as given in the literature, discussed the relevant risks, and summed them up into 20 risk factors, classified into 5 engineering aspects: “Contract”, “System and civil engineering”, “Construction”, “Site environment”, and “Human resources”. Zheng Yijun [34] evaluated litigation cases in the Supreme Court, and summarized the risk of construction delay caused by both parties A and B, as well as judges’ determination. Lu Zhenyu [35] discussed relevant risk factors in terms of overruns in project cost, which were divided into “Planning and design”, “Management”, “Procurement contracting”, and “Engineering”.
Jelena et al. [36] discussed the key risks in railway projects implemented under the Belt and Road Initiative (BRI). A total of 24 potential risks of BRI railway projects were identified and classified, and the risks divided into six categories: “BRI”, “External factors”, “Environment”, “Design process”, “Construction process”, and “Human resources”. Through a literature review, expert opinions, and field observations, Madhumitha [37] sorted the potential construction risks into seven aspects: “Financial”, “Contractual”, “Design”, “Environment Health and Safety”, “Management”, “Political”, and “Construction”. Herrera et al. [38] analyzed cost overruns in road projects and classified the most important risk factors and their probability of occurrence into 14 categories, including “Contract”, “Contractor”, “Contractual Relationship”, “Design”, “Equipment”, “External Factors”, “Financial”, “Laws and Regulations”, “Materials”, “Owner”, “Personal”, “Programming and Control”, “Project”, and “Site”.
Considering the relevant literature on different construction projects’ risks, it was found that financial risk ranks first, including inflation, poor on-site financial control, and cash flow difficulties. For this type of financial risk, a proper prediction of the cost estimate and a detailed understanding of similar projects is recommended to help eliminate or mitigate these factors. Contractual risk and design risk are secondary crucial risks, including changes in project scope, laws, and regulations; disputes and claims; and miscalculation of time and cost; mainly due to modifications of the project resulting in increased costs. Among other reasons, this problem can be exacerbated when a long time elapses between completion of the design phase and the start of the construction phase, as design specification updates and other unforeseen events may occur.
This research collected literature on construction risk factors, comprehensively integrated these risks, and then compared the texts to identify the factors with a higher repeatability to form the basis of the questionnaire. These risk factors were classified into six risk categories according to their sources and characteristics, with a total of 18 items, as shown in Table 1.
3. Methods
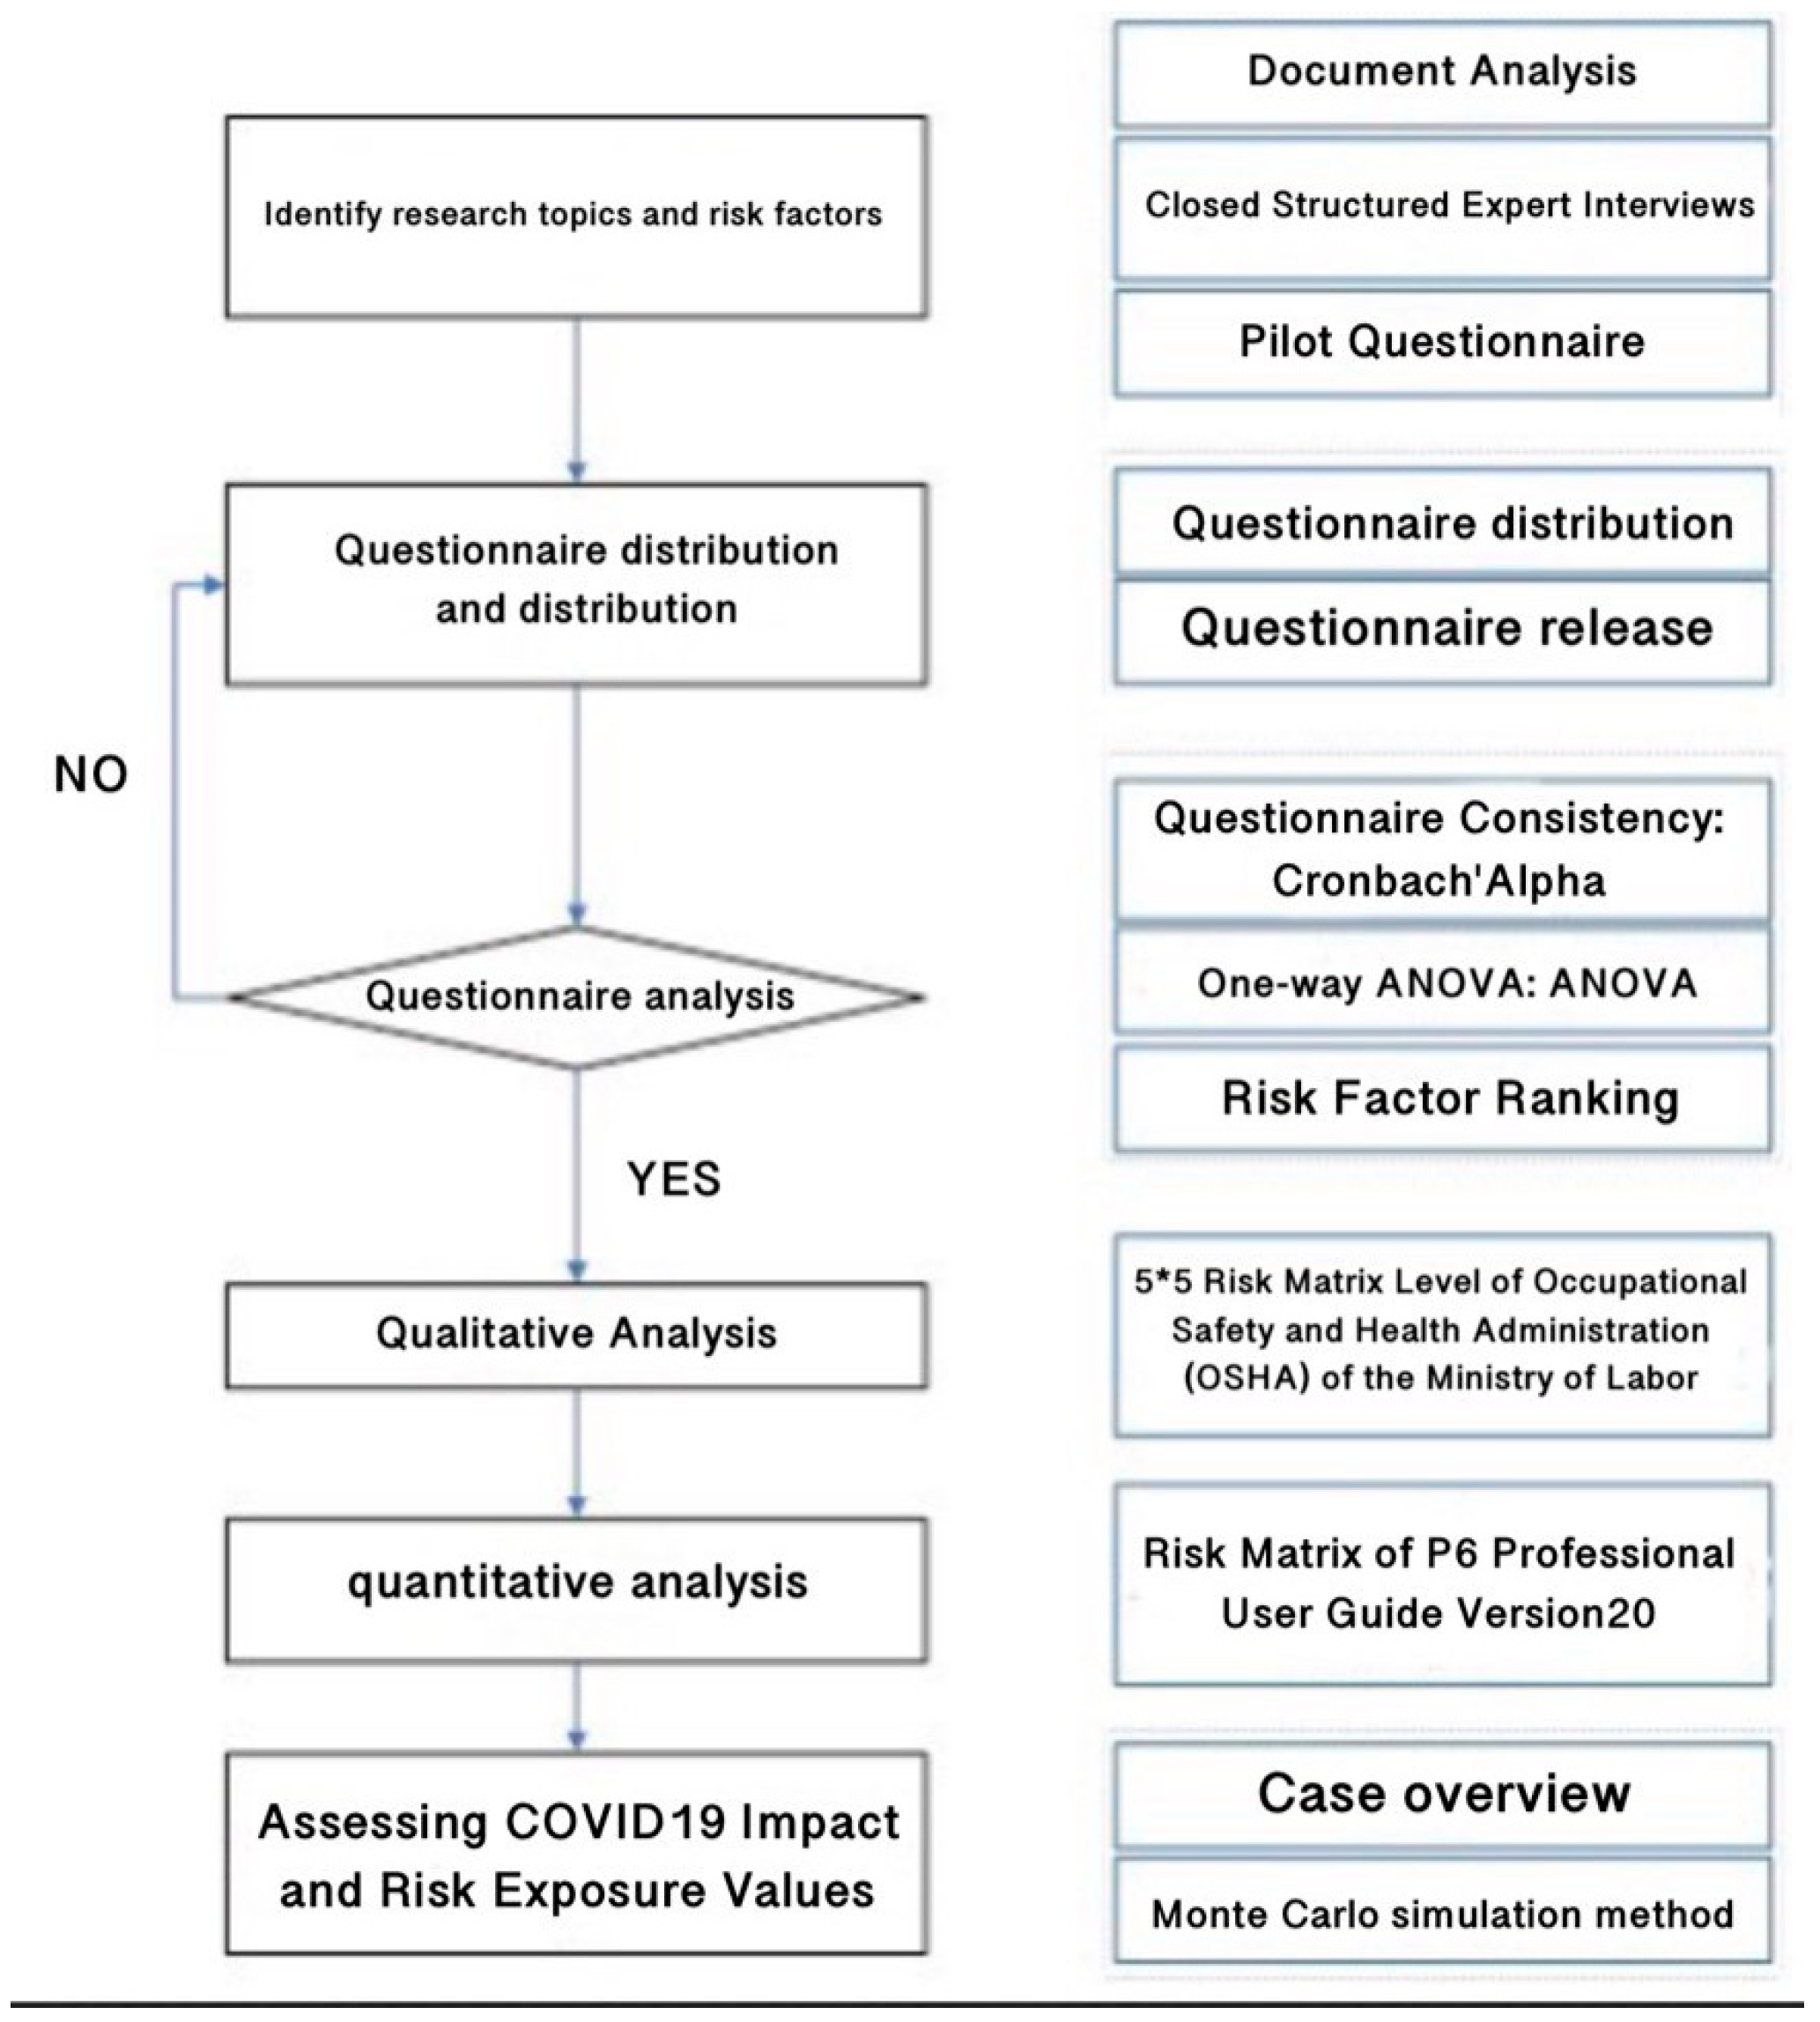
The main procedures of this study were divided into six steps, as shown in Figure 1.
3.1. Risk Identification
This study first conducts a systematic literature review analysis, and establishes and verifies the appropriateness and comprehensiveness of the construction risk factor list through structured interviews and pilot questionnaires.
3.1.1. Document Analysis
First, a review of the relevant literature on construction risk factors was conducted, using the keywords “COVID-19” and “construction risk” in domestic and foreign journal search engines. The construction risk factors mentioned in the literature were compared, analyzed and summarized. Due to the lack of relevant literature on COVID-19 in Taiwan, the keyword “construction risk” was used for searching. After searching both domestic and foreign journals, 177 articles were found with the above keywords. Research content unrelated to this study was removed and, after collecting the construction risk factors integrated by experts and scholars from various countries in their articles, and after text comparison and semantic analysis, a total of 18 key factors of construction risk in times of severe epidemic were obtained.
3.1.2. Expert Interviews
Six experts were chosen through snowball sampling following a comprehensive literature analysis to identify relevant risk factors related to COVID-19’s impact on construction. Each expert had at least 10 years of construction experience and possessed sufficient relevant expertise. A structured questionnaire (detailed in Table 2) was used to obtain their feedback on 18 risk factors, including suggestions for revisions, clarifications, additions, or deletions.
This study’s interviews comprised two parts, each consisting of three questions. The first part aimed to provide a profile of the participating professionals, including (1) their current service position and location of employment, (2) previous work experience, and (3) the nature of their work. The second part focused on the impact of the epidemic on the construction industry from 2019–2022, with three questions regarding (1) the types of disruptions encountered, (2) their probability, and (3) their severity. Table 3 presents the experts’ and scholars’ views on the second part’s three questions.
Through expert interviews, three additional risk factors, namely “raw material shortages and difficulty of obtaining”, “labor shortages” and “pandemic effects leading to decreased labor productivity” were added to the aforementioned 18 risk factors. Finally, the formal questionnaire included 6 major categories: “Design and Contract”, “Owner Supplies”, “Finance”, “Construction”, “Management” and “Industry Environment”, totaling 21 risk factors, as shown in Figure 2.
3.1.3. Pilot Questionnaire
Prior to the formal questionnaire administration, 15 pilot questionnaires were conducted to understand if the risk factors were adequately explained, the content of the questionnaire was understood, and a risk fill-in-the-blank was added at the end of the questionnaire to ensure its validity and reliability.
3.2. Questionnaire Distribution and Collection
The first part of the research questionnaire provides personal information, exploring the respondent’s “work unit nature”, “job attributes”, and “years of experience in the construction industry”, and “whether they are currently engaged in related work”. Part Two examines the risk of construction projects under COVID-19, including the probability of occurrence, and the cost and schedule impacts, using a 5-point scale to rate the different levels of opinion, with the scale as follows: very unimportant (1), unimportant (2), ordinary (3), important (4), and very important (5), corresponding to the qualitative analysis values of the risk in this study.
The study employed a randomized sampling method to distribute the questionnaire via both online and in-person means. The survey platform included public links, which actively invited industry professionals to participate. A total of 157 survey responses were obtained, and after screening for ineligible responses, 136 valid questionnaires were analyzed, with a high valid sample recovery rate of 86.62%. The majority of respondents were from “Construction firms”, as shown in Table 4, and had diverse backgrounds and experience in the construction industry. Notably, 58% of respondents had over five years of experience in the field, indicating the reliability and validity of the results. Therefore, the sample is considered high quality compared to previous studies related to construction in Taiwan.
3.3. Questionnaire Analysis
3.3.1. Consistency
The reliability analysis of this questionnaire was calculated using IBM SPSS 21 statistical software. For internal consistency of the questionnaire, Cronbach’s Alpha(α) was used, and the overall questionnaire’s α was 0.956, the α of Probability of Occurrence 0.843, the α of Degree of Cost Impact 0.896, and the α of Degree of Time Impact 0.923. Cronbach’s Alpha above 0.7 indicates good confidence in the response.
3.3.2. Analysis of Significance (ANOVA)
A one-way ANOVA analysis revealed a significant difference in the “probability of poor financial status of owners” between construction firms and other types of work organizations (government: mean = 2.8, other groups: mean = 3.5). Construction firms, engineering consultants, construction and development, and architecture firms considered the probability of poor financial status to be between possible and most likely, whereas government agencies considered it to be between unlikely and possible. However, no significant difference was found in the likelihood and impact of risk in a severe epidemic situation across all types of companies.
3.3.3. Ranking of Risk Factors
Following the above analysis, the average number of questionnaire samples was used to rank the probability of occurrence and the degree of impact from the construction risk factors during the epidemic, and the top 10 high-risk factors for projects under construction were obtained, here shown in Table 5.
3.4. Qualitative Risk Analysis
The qualitative analysis risk matrix designed in this study refers to the 5 × 5 risk matrix of the Occupational Safety and Health Administration (OSHA) of the Ministry of Labor (2021), as shown in Table 6.
Through the multiplication of the risk “Probability” and “Impact” collected by the questionnaire, the risk level was calculated, and the “labor shortage”, “raw material prices continue to rise”, “the shortage of raw materials is difficult to obtain” and “pandemic effects leading to decreased labor productivity” were analyzed under the epidemic situation. It was revealed that these are the four main high-risk factors, as shown in Table 7.
3.5. Quantitative Risk Analysis
In this study, the probability of the occurrence of risks, according to expert interviews, is about 20–30%, with a maximum value of 30%, and the degree of impact is 20–30%, with a maximum value of 20–30%. These figures were used as experimental control values in the estimation of the probability of risk occurrence and the severity of impact. This data are compiled in Table 8 and Table 9.
The averages of the “occurrence probability” and “influence degree” of each risk in the questionnaire corresponds to the percentage of the risk “occurrence probability” and “degree of influence”. The calculated values of the probability of occurrence and the degree of influence of each risk were used in the quantitative analysis. These values are listed in Table 10 and Table 11.
3.6. Assessing the Risk Exposure due to the Impact of COVID-19
Case Overview
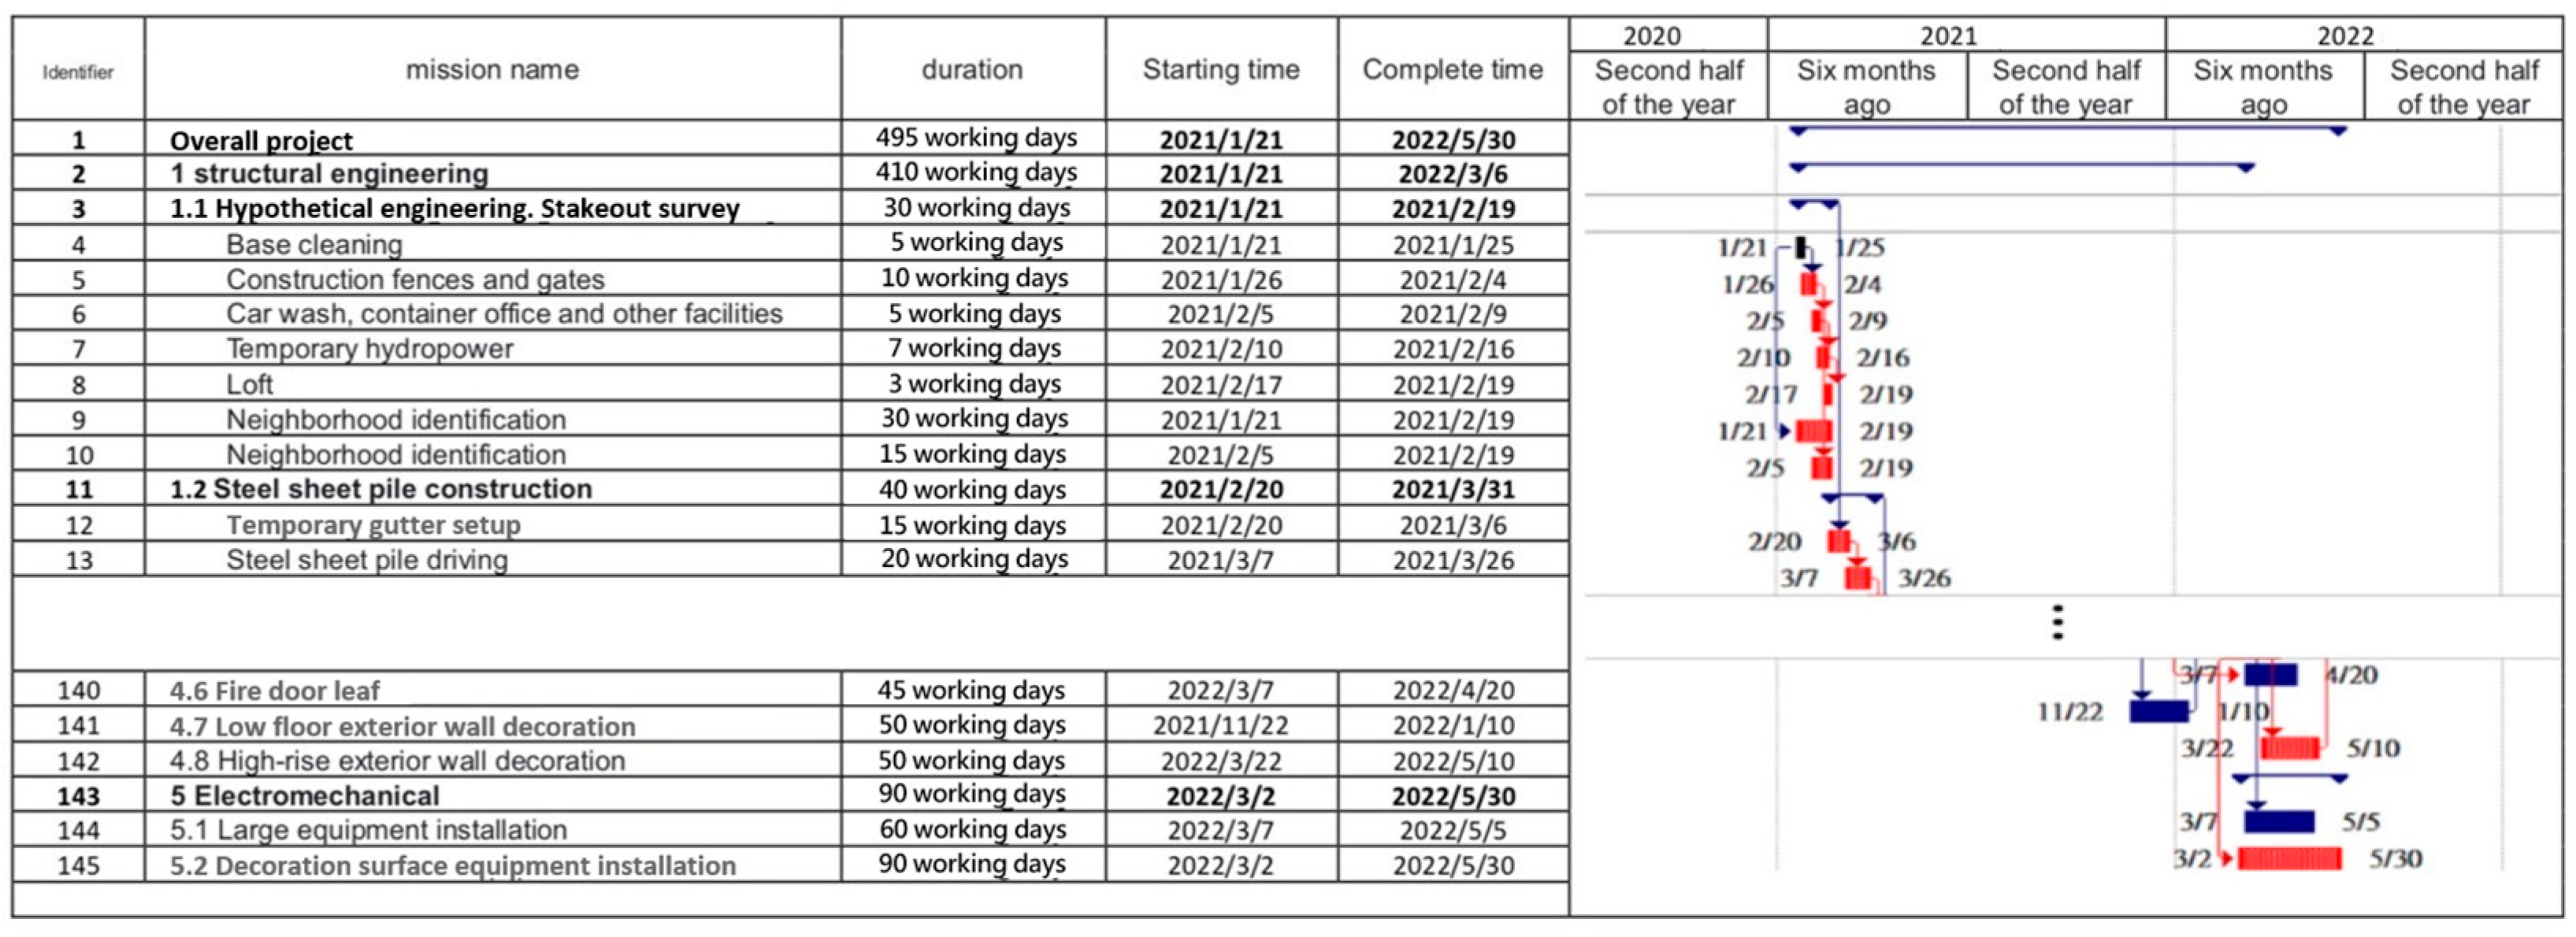
The research case is a building with one underground floor and six above ground floors, with construction starting on 21 January 2021 and ending on 30 May 2022, a total of 495 days. The total budget is TWD 1,989,707. A Gantt chart was established with the MS Project scheduling software, as shown in Figure 3.
- 1.
- Risk Exposure Value Quantification Steps: The 80–20 Principle
The purpose of this case study is to demonstrate the feasibility of risk quantification. In order to avoid the difficulty of displaying an excessive number of risk factors, the Pareto 80/20 Rule is adopted to analyze and prioritize the risk list, with the top 20% as the input data for analysis. Subsequently, the first four factors (21 × 20% ≒ 4) in the risk list are used to analyze the project time and cost.
In this case, for the product of the risks, “Probability of occurrence”, “Degree of cost impact” and “Degree of scheduling impact”, the first four risk factors are “labor shortage”, “raw material prices continue to rise”, “the shortage of raw materials is difficult to obtain”, and “pandemic effects leading to decreased labor productivity”.
According to the above top 20% risk list, the average and standard deviation of risk factors in the questionnaire and fuzzy mathematics are used to calculate the probability and degree range of each risk. These include the most optimistic value (the value of the mean minus three standard deviations); the most likely value (the mean value); and the most pessimistic value (the mean plus three standard deviations), all of which are the input parameters of the triangular probability distribution in this study, as shown in Table 12, Table 13 and Table 14. Finally, the formula of exposure value = calculated value of risk occurrence probability * calculated value of impact is obtained.
- 2.
- Establishing a Model Framework through a Monte Carlo Simulation
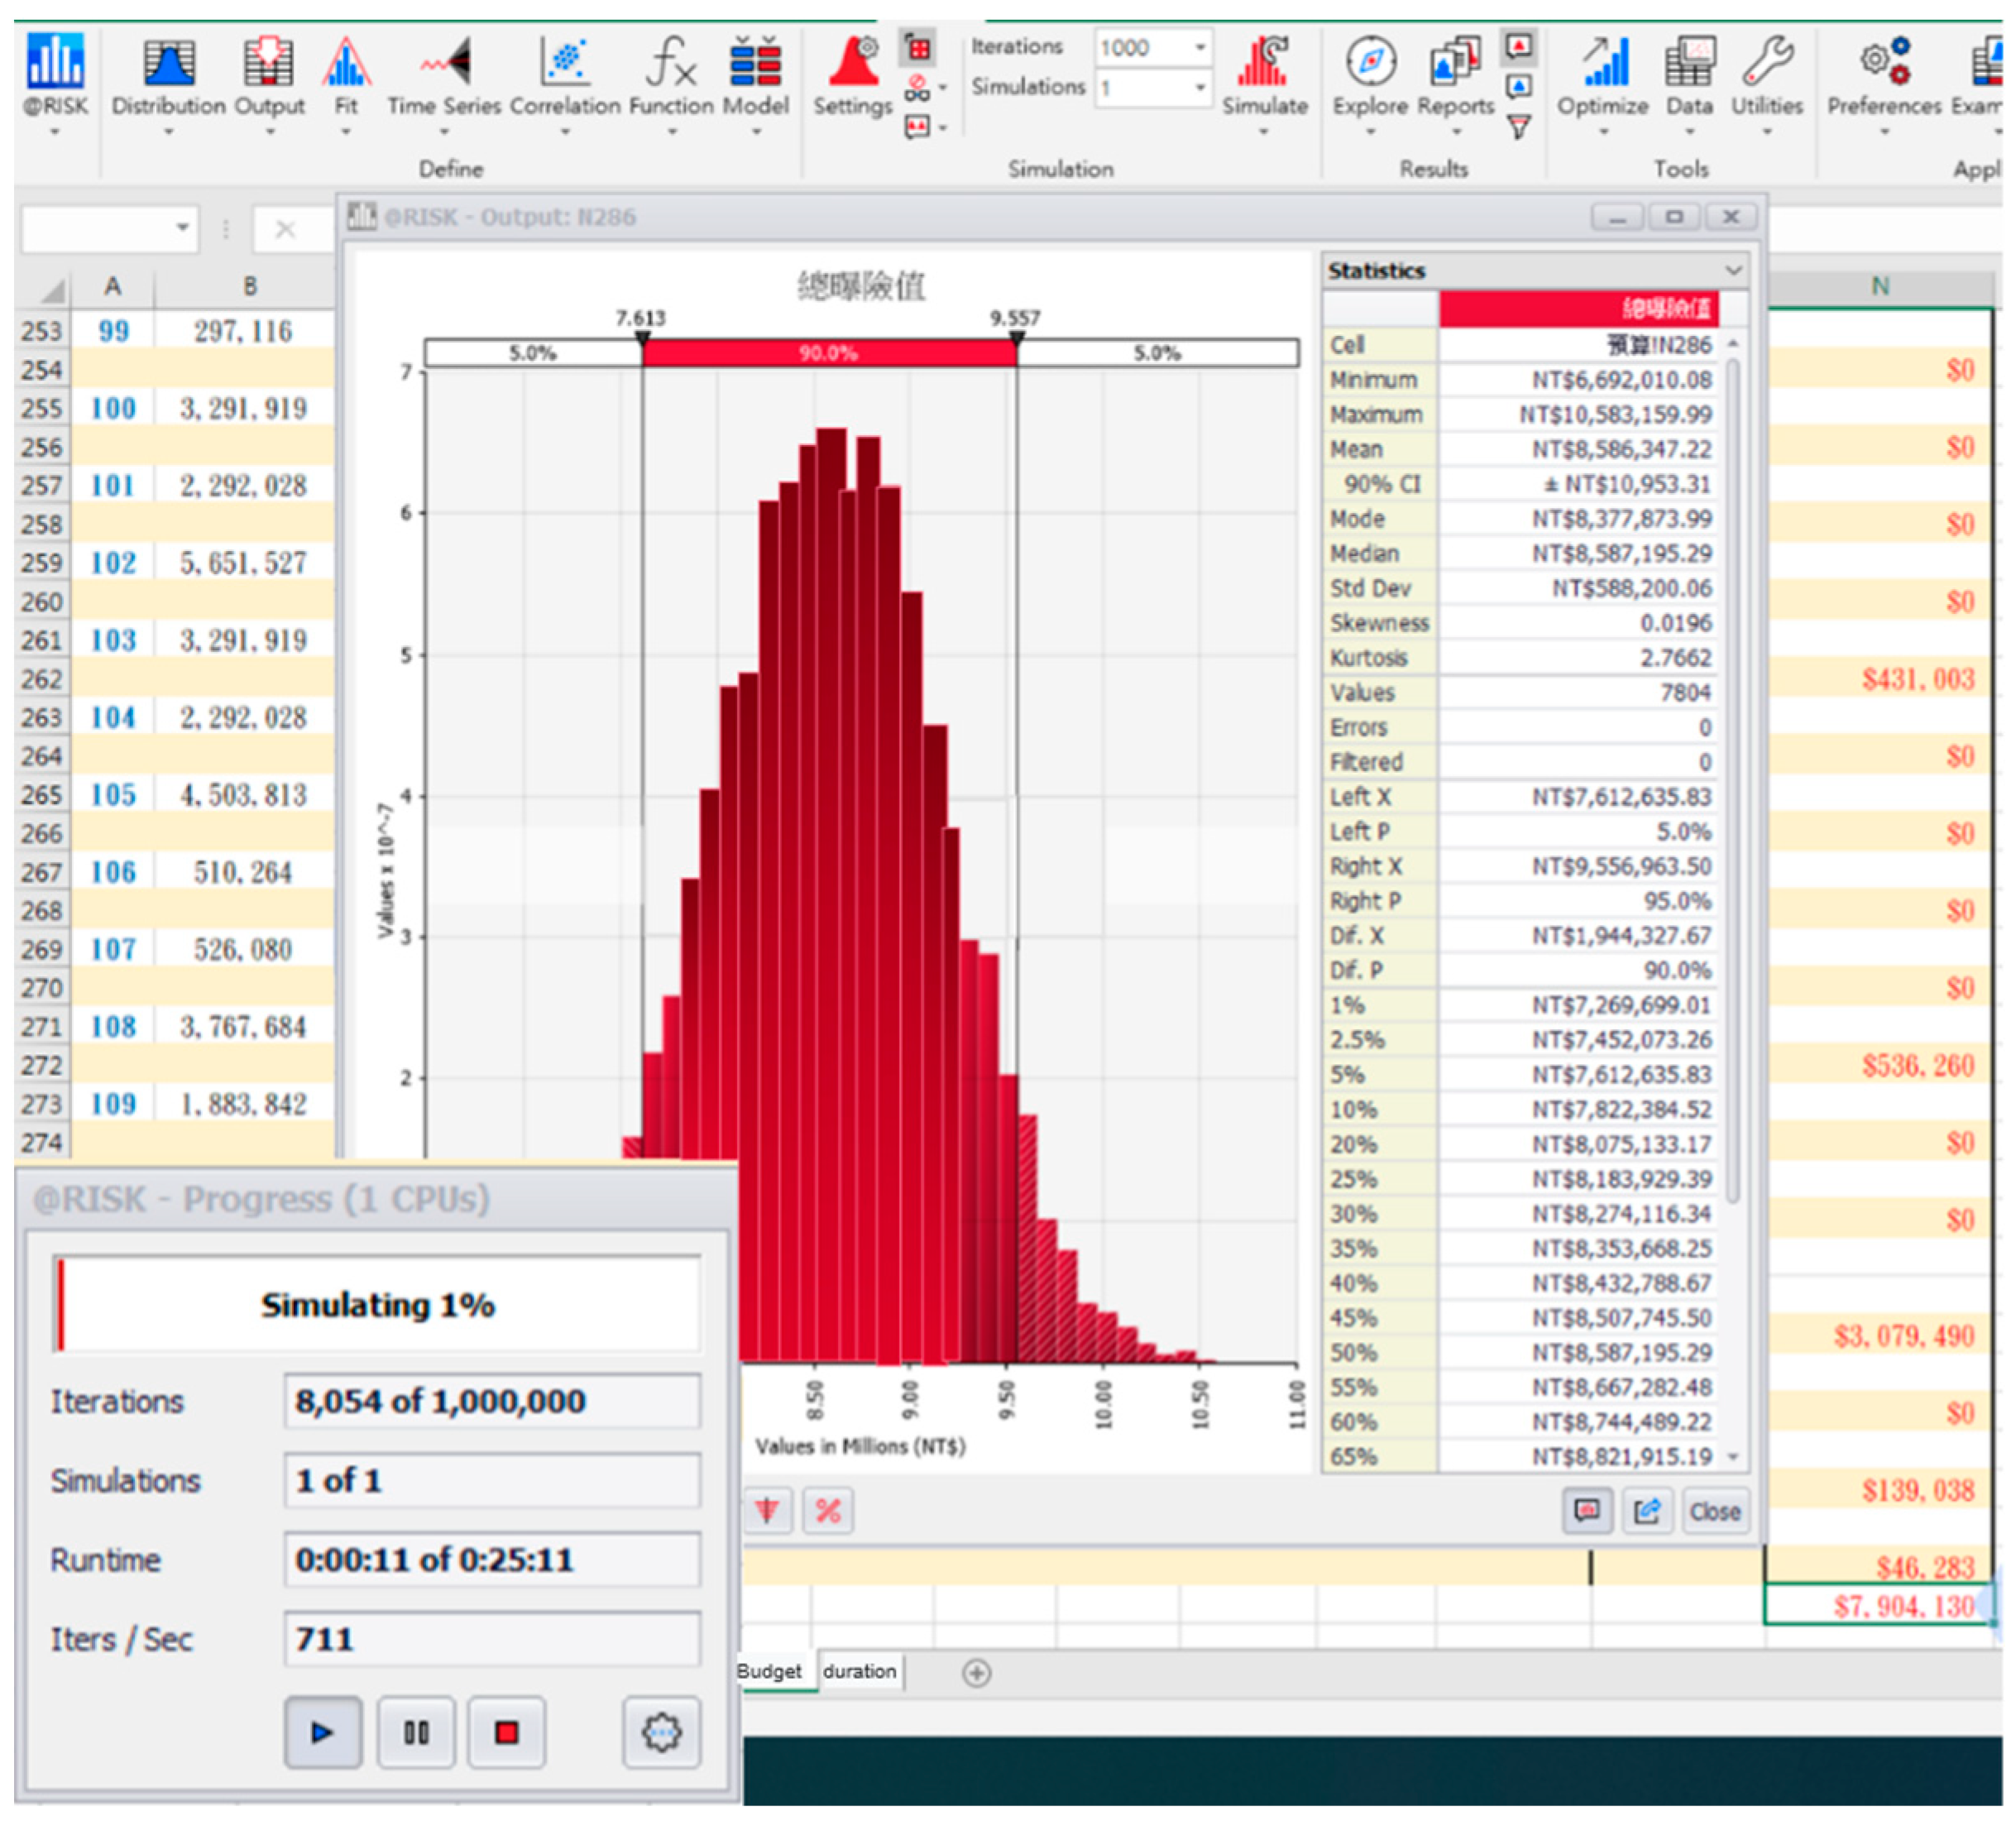
A system risk analysis software @Risk, was used to input the cost and time period of each operation. The range of variables (optimistic, most likely, pessimistic) were reassessed for each risk calculation. The random value block diagram style of the variable (this study uses a triangular distribution) was selected for display, and finally the input/output blocks were defined. The number of simulations was set to one million times [39].
4. Results
This research used the @Risk for Project 8.0 risk analysis and simulation software, and the simulation parameters were set to perform one million Monte Carlo simulations, each lasting about 25 min. The results are shown in Figure 4.
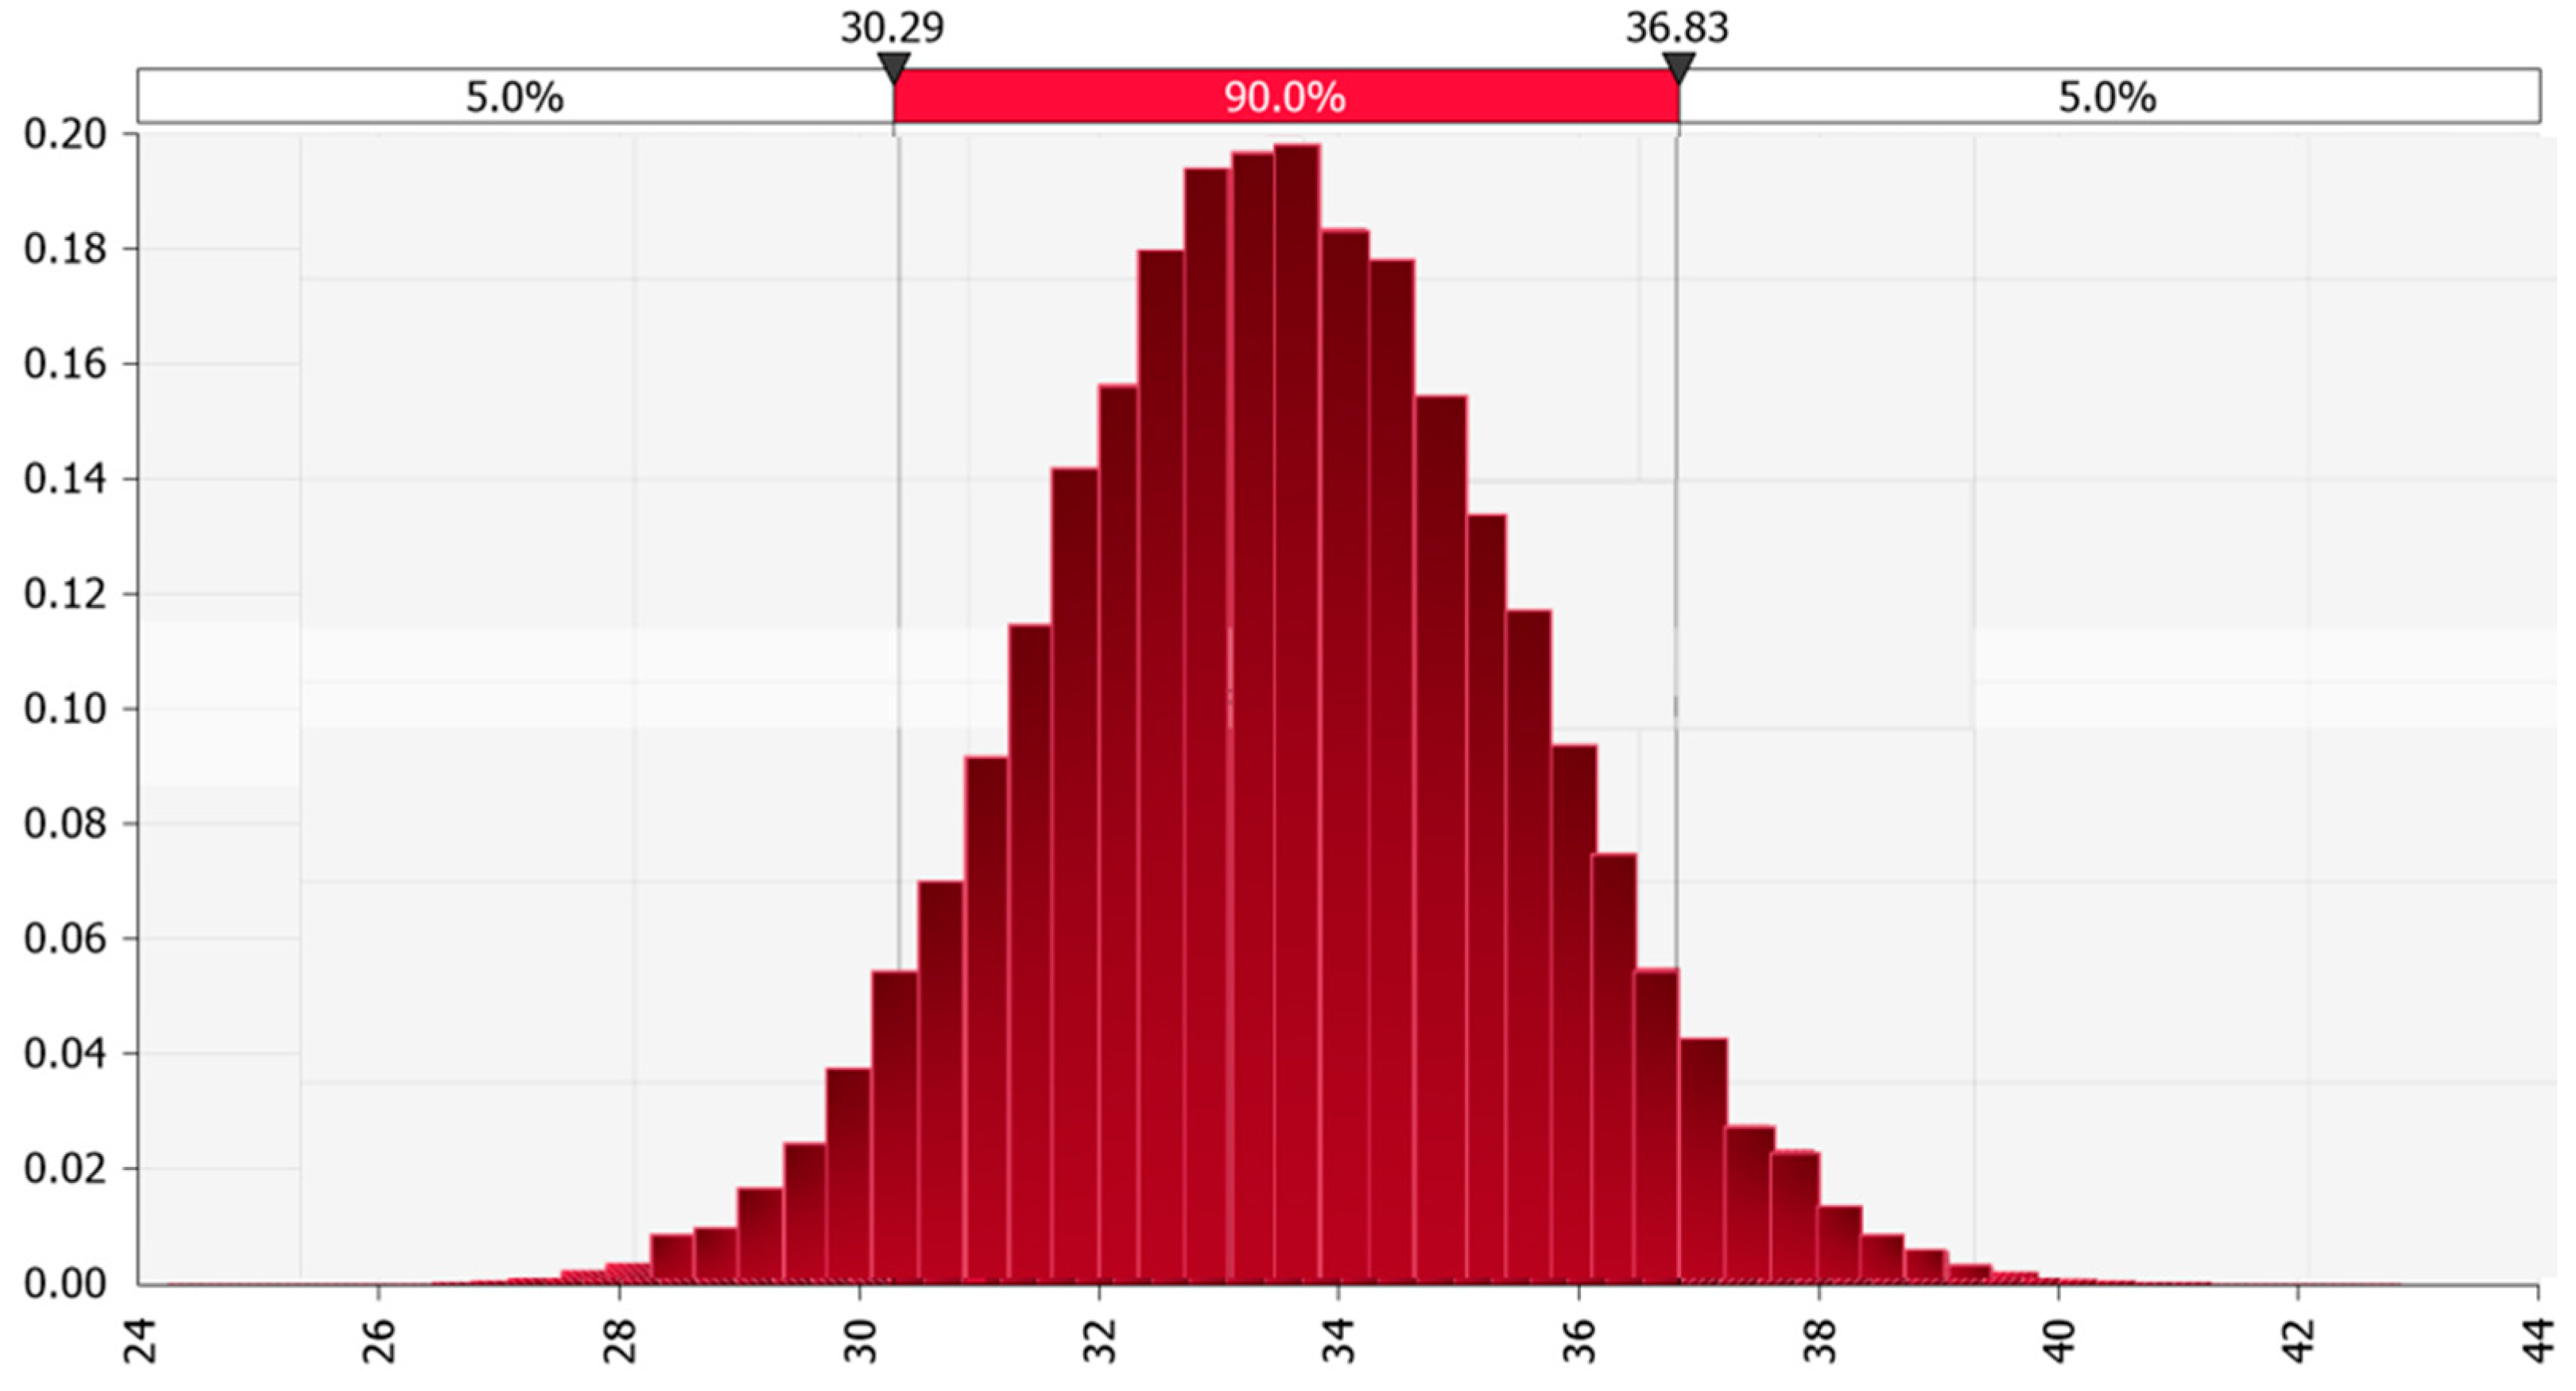
This case was analyzed by Monte Carlo simulations with one million runs. The most probable value for time risk was 8% for the total duration, with a minimum of 7% and a maximum of 10%, as shown in Table 15 and Figure 5 which shows the probability distribution of the time risk. The actual duration extension of the building in this case was 40 days (8.1%), which is within the simulated predicted range.
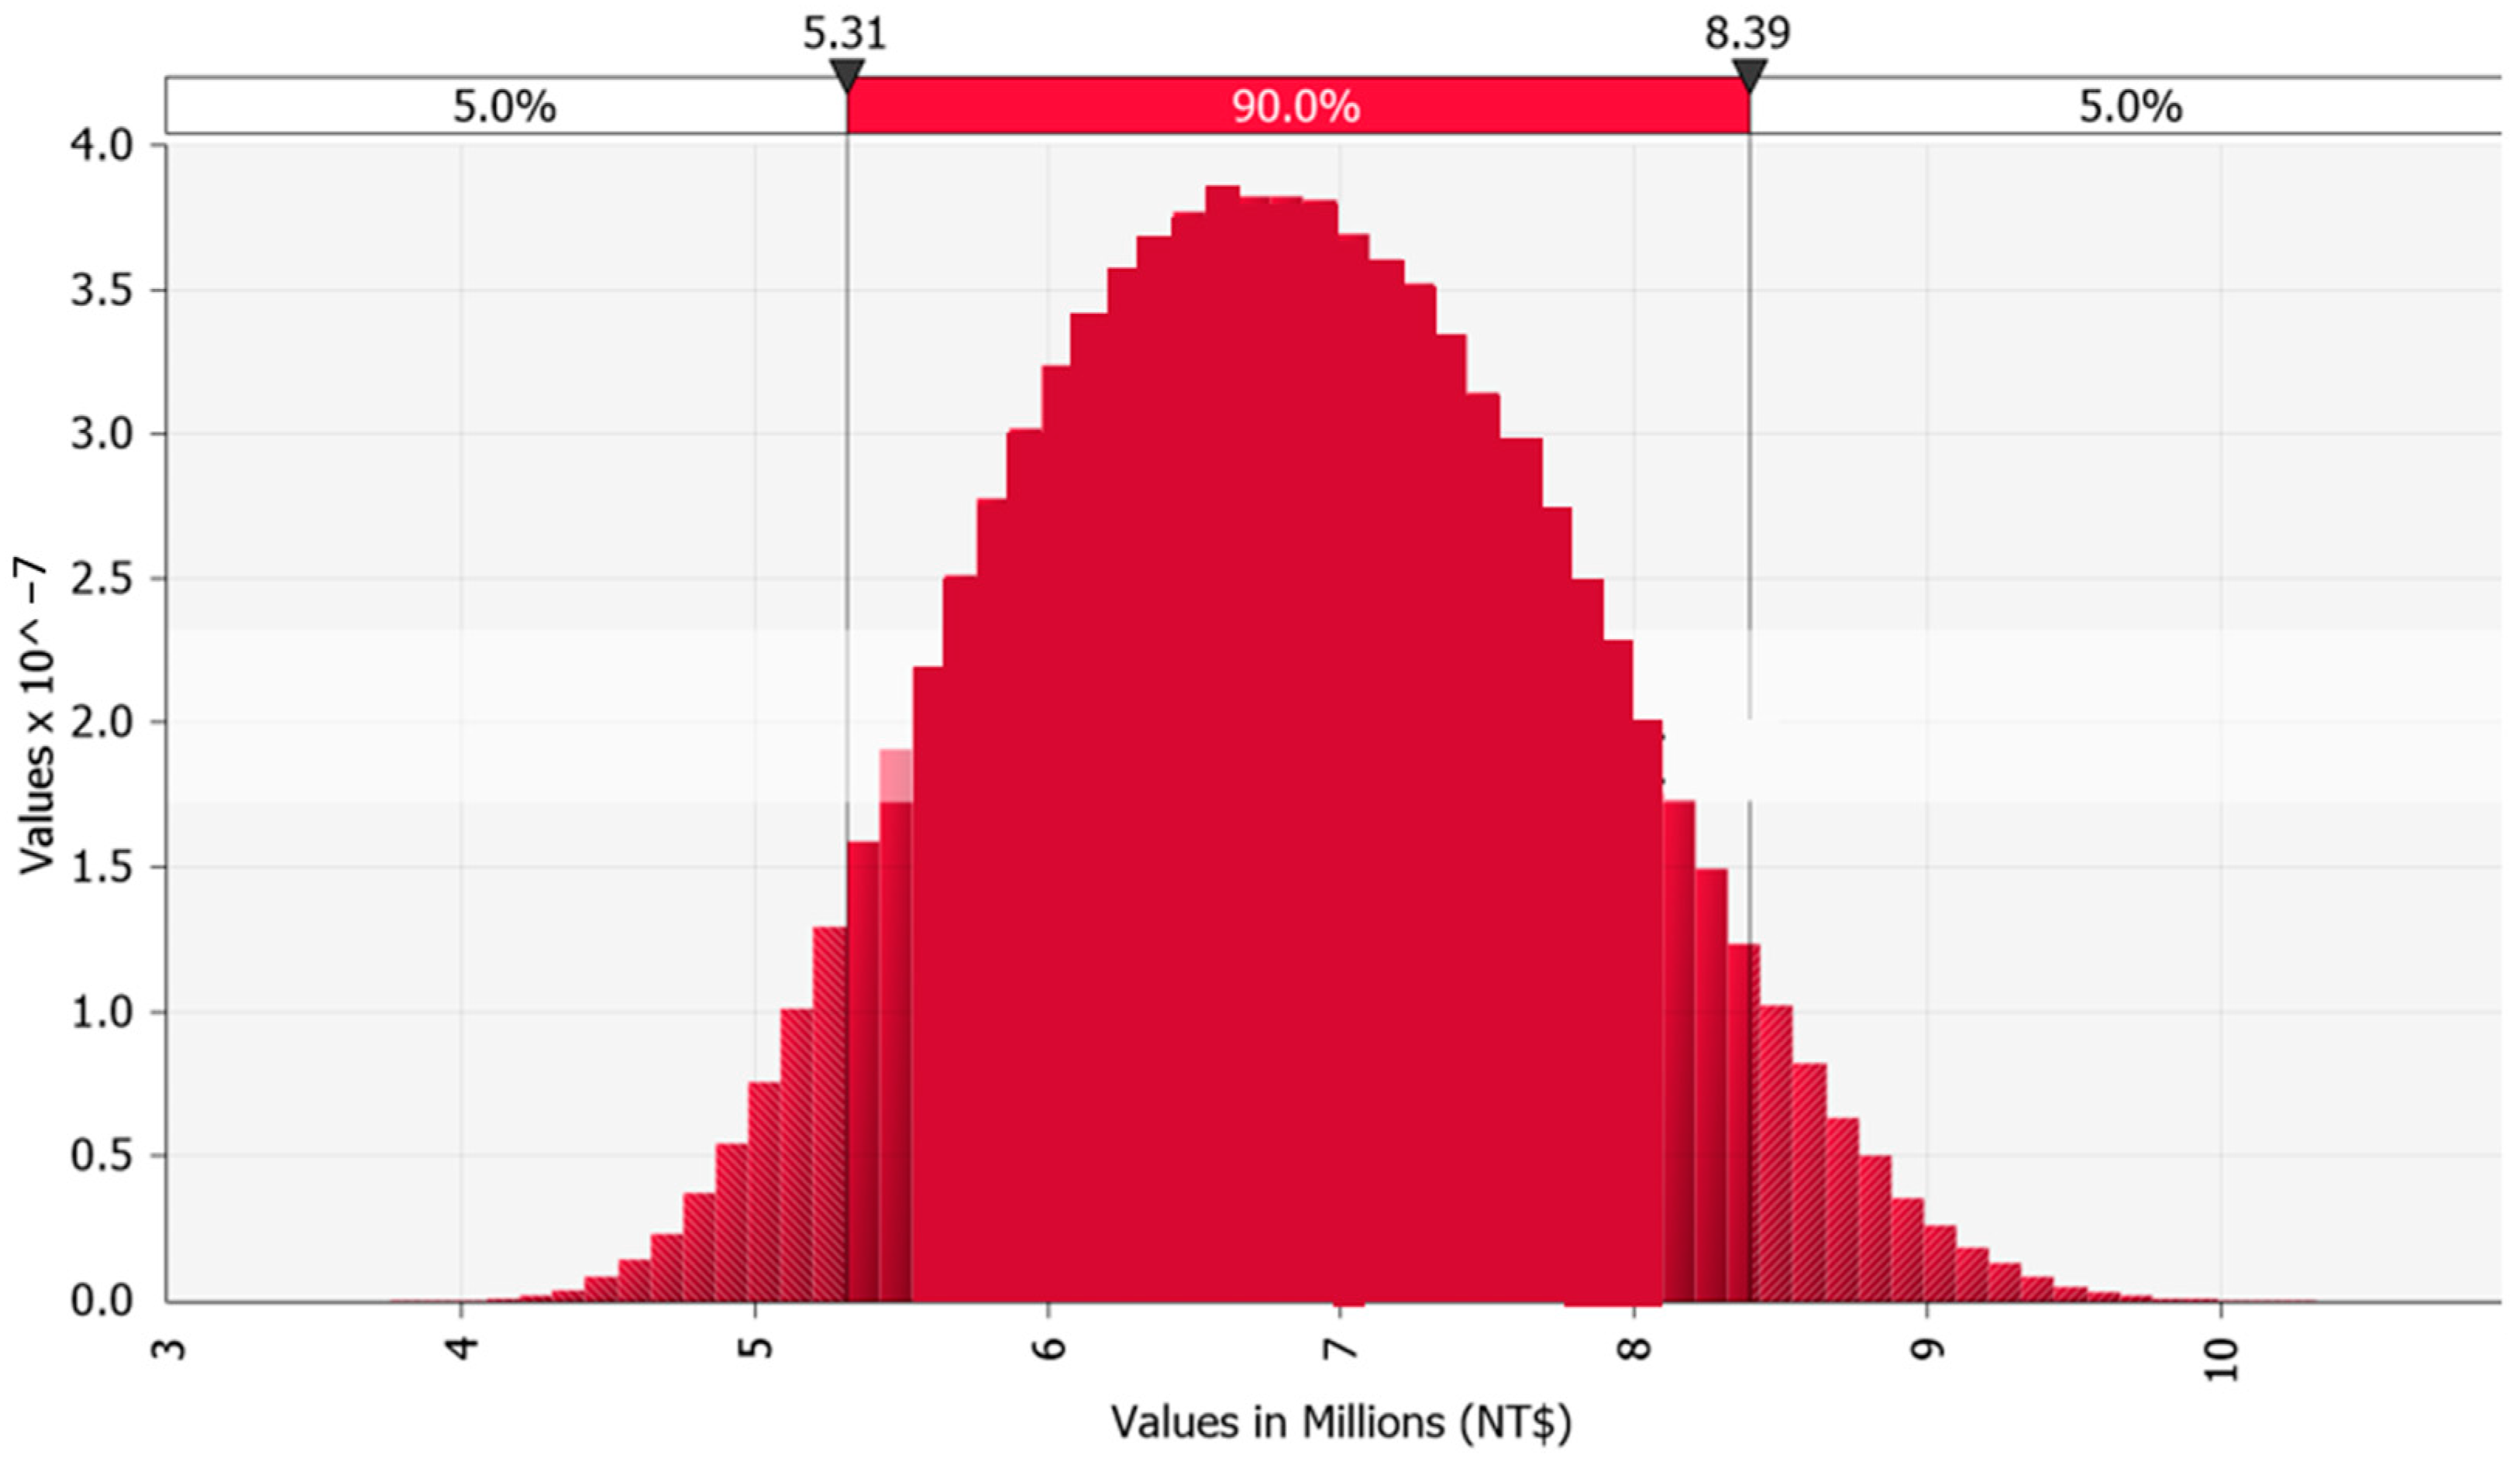
The total budget for the simulated construction project is TWD 101,989,707. Based on the outcomes of 1,000,000 Monte Carlo simulations, the most probable cost exposure value is 7%, with a minimum of 4% and a maximum of 10% of the total cost, as illustrated in Figure 6, which displays the probability distribution of cost exposure values. The COVID-19 pandemic resulted in severe labor shortages and surging material prices, leading to an escalation in construction costs. The construction price index, as reported by the Executive Yuan, indicates an annual growth rate of 10.93%, which is comparable to the maximum value predicted by the simulation.
5. Conclusions
This research identified 21 project risk factors in 6 major categories under high inflation conditions through a literature review and expert interviews. Cost and time risk factors, as well as their occurrence probability and influence degree, caused by the pandemic in ongoing construction projects were analyzed using questionnaires and interviews. Among them, labor shortage, pandemic effects decreasing labor productivity, difficult access to raw materials, and continuous price rise were identified as high-risk factors. These factors are consistent with the employment shortage rate and annual increase rate of the construction price index published in Taiwan. Compared to previous literature, finance (i.e., inflation and project cash flow) has consistently been identified as the most critical factor, while labor and material supply, which were less discussed in stable periods before the pandemic, have become high-risk factors due to the restrictions on human and material flows after the outbreak of COVID-19.
The Monte Carlo simulation was used to quantify the additional cost and exposure value of construction projects. In this case study, it was predicted that the minimum time exposure days required for the project during the outbreak of epidemic was 7% of the original schedule, most likely 8%, and in extreme cases, up to 10% of the original schedule. In terms of cost, the minimum cost exposure amount was 6% of the original cost, most likely 8%, and in extreme cases, up to 11% of the original cost. The exposure value varies depending on the type and scale of the project and the types and quantities of risk factors assessed.
As this study is conducted within the construction industry, its findings are only applicable to the construction stage of projects in progress. This study offers an important set of risk factors that could serve as a foundation for construction scholars to research the effects of COVID-19 and any future potential pandemics. A risk quantification framework could provide project managers with the ability to anticipate and quantify risks, and develop countermeasures in a high inflation environment, thereby mitigating the impact on project performance.
This study quantifies the cost and schedule exposure value of construction projects and provides a basis for formulating guidelines and strategies to mitigate the impacts of risks such as strikes, wars, changes in raw material prices, climate change, and natural disasters. In the future, the ripple effects of these risks can be factored into cost and schedule exposure value simulations for projects.
Author Contributions
Conceptualization, Y.-T.C., Y.-Y.Y. and Y.-H.C.; methodology, Y.-T.C., Y.-Y.Y. and Y.-H.C.; validation, Y.-T.C. and Y.-H.C.; formal analysis, Y.-T.C. and Y.-H.C.; investigation, Y.-T.C., Y.-Y.Y. and Y.-H.C.; data curation, Y.-T.C. and Y.-H.C.; writing—original draft preparation, Y.-T.C. and Y.-H.C.; writing—review and editing, Y.-T.C. and Y.-H.C.; supervision, Y.-T.C., Y.-Y.Y. and Y.-H.C. All authors have read and agreed to the published version of the manuscript.
Funding
This research received no external funding.
Institutional Review Board Statement
Not applicable.
Informed Consent Statement
Informed consent was obtained from all subjects involved in the study.
Data Availability Statement
Data supporting reported results are available from the corresponding authors on request.
Conflicts of Interest
The authors declare no conflict of interest.
References
- Duncan, T.; McEvoy, S.; Whitehouse, L.C.A.C. Ashurst. 2021. Available online: https://reurl.cc/kqzeVr (accessed on 5 October 2021).
- Shi, Y.; Lin, Y.; Liu, N.; Wu, W.; Zhou, C.; Qiu, S.; Wu, S. Discussion on the Impact of the New Coronary Pneumonia Epidemic on the Engineering Industry and Its Response. China J. Civ. Eng. Water 2020, 1, 7–14. [Google Scholar]
- Li, J.; Lu, Z. How does the epidemic affect construction prices? China Civ. Eng. Water Conserv. J. Water 2020, 47, 15–19. [Google Scholar]
- Xin, B. On the current situation and response of Taiwan’s labor market under the epidemic. Taiwan Labor Q. No. 2021, 63, 4–31. [Google Scholar]
- Suneson, G. Industries Hit Hardest by Coronavirus in the US Include Retail. 2020. Available online: https://reurl.cc/oZaEVq (accessed on 10 March 2021).
- Jeon, L.H.; Padhye, S.; Bhattacharyya, A.; Cai, H.; Hastak, M. Impact of COVID-19 on the US Construction Industry as Revealed in the Purdue Index for Construction. ASCE J. Manag. Eng. 2022, 38, 77–79. [Google Scholar] [CrossRef]
- Wang, Z.; Cai, X.; Liu, Z. Survival and Revival: Transition Path of the Chinese Construction Industry During the COVID-19 Pandemic. Eng. Manag. J. 2022, 43, 1–13. [Google Scholar] [CrossRef]
- Kim, S.; Kong, M.; Choi, J.; Han, S.; Baek, H.; Hong, T. Feasibility Analysis of COVID-19 Response Guidelines at Feasibility Analysis of COVID-19 Response Guidelines at Terms of Cost and Time. ASCE J. Manag. Eng. 2021, 37, 375. [Google Scholar] [CrossRef]
- Kamiludin, C.; Roy, A.F. Identifying the Impact of the COVID-19 Pandemic on The Indonesian Construction Sector Using the Exploratory Factor Analysis EFA. Univ. Kadiri Ris. Tek. Sipil 2022, 6, 16–30. [Google Scholar] [CrossRef]
- Gan, W.H.; Koh, D. COVID-19 and Return-To-Work for the Construction Sector: Lessons from Singapore. Saf. Health Work 2021, 12, 277–281. [Google Scholar] [CrossRef]
- Sneader, K.; Singhal, S. Getting to the Next Normal; McKinsey & Company: New York, NY, USA, 2020; Available online: https://reurl.cc/EX575n (accessed on 5 March 2021).
- Committee, Executive Yuan Public Works. The impact of the COVID-19 epidemic on public construction and countermeasures. China Civ. Eng. Water Resour. J. 2020, 47, 3–6. [Google Scholar]
- Ryder, G. International Labour Organization, ILO. 2022. Available online: https://www.ilo.org/global/langen/index.htm (accessed on 10 March 2022).
- Ministry of Interior of the Republic of China. Survey on Economic Situation of Construction Industry. 2022. Available online: https://reurl.cc/NGK6Ye (accessed on 10 March 2021).
- Ling, F.Y.; Zhang, Z.; Yew, A.Y. Impact of COVID-19 Pandemic on Demand, Output, and Outcomes of Construction Projects in Singapore. J. Manag. Eng. 2022, 38, 04021097. [Google Scholar] [CrossRef]
- Wang, Z.; Liu, Z.; Liu, J. Risk Identification and Responses of Tunnel Construction Management during the COVID-19 Pandemic. Adv. Civ. Eng. 2020, 2020, 6620539. [Google Scholar] [CrossRef]
- Choi, S.D.; Staley, J.A. Safety and Health Implications of COVID-19 on the United States Construction Industry. Ind. Syst. Eng. Rev. 2021, 9, 56–57. [Google Scholar] [CrossRef]
- Chen, Y.P. The Lack of Jobs and Materials in the International Industry Has Dragged Down the Progress of U.S. Housing Construction. China Times Group. 2022. Available online: https://reurl.cc/bG1a8E (accessed on 11 March 2022).
- Taiyi, L.; Nanshan, Z.; Bohan, C. A Preliminary Study on the Impact of Novel Coronavirus (COVID-19) on Taiwan’s Construction Industry. Chin. J. Civ. Eng. Water Resour. 2020, 47, 7–14. [Google Scholar]
- World Health Organization. Report of the WHO-China Joint Mission on Coronavirus Disease 2019 (COVID-19) Pandemic. Available online: https://www.who.int/publications-detail/report-of-the-who-china-joint-mission-on-coronavirus-disease-2019-(covid-19) (accessed on 28 April 2020).
- Ataei, H.; Becker, D.; Hellenbrand, J.R.; Mehany, M.S.H.M.; Mitchell, T.E.; Ponte, D.M. COVID-19 Pandemic impacts on construction projects. Am. Soc. Civ. Eng. 2021, 70, 115. Available online: https://www.dbpia.co.kr/Journal/articleDetail?nodeId=NODE11067041 (accessed on 30 January 2022).
- World Health Organization. WHO Coronavirus (COVID-19) Dashboard. 2022. Available online: https://covid19.who.int/ (accessed on 30 January 2022).
- Rouleau, J.; Gosselin, L. Impacts of the COVID-19 lockdown on energy consumption in a Canadian social housing building. Appl. Energy 2021, 287, 116565. [Google Scholar] [CrossRef] [PubMed]
- Mercy, O.; Mansur, H.A.; Huda, S.; Tahar, H. COVID-19 pandemic: The effects and prospects in the construction industry. Int. J. Real Estate Stud. 2020, 14, 120–128. [Google Scholar]
- Assaad, R.; El-adaway, I.H. Guidelines for Responding to COVID-19 Pandemic: Best Practices, Impacts, and Future Research Directions. J. Manag. Eng. 2021, 37, 06021001. [Google Scholar] [CrossRef]
- Metinal, Y.B.; Ayalp, G.G. Effects of the COVID-19 pandemic on architectural education: Bibliometric and content analyses. Open House Int. 2022, 47, 657–687. [Google Scholar] [CrossRef]
- Harinarain, N. Despair during the COVID-19 lockdown for the South African construction industry. J. Constr. 2020, 13, 52–63. [Google Scholar]
- Williams, R.C.; Walker, J.A.; Dorofee, A.J. Putting risk management into practice. Int. Conf. Ind. Eng. Eng. Manag. 1997, 14, 75–82. [Google Scholar] [CrossRef]
- Chang, C.-M. Bayesian-Network-Based Safety Risk Assessment for Steel Construction Projects. National Taiwan University of Science and Technology. 2015. Available online: https://hdl.handle.net/11296/sssxq7 (accessed on 30 March 2020).
- HO, W.H. An Analytical Hierarchical Process for Construction Risk Assessment into the Bridge Engineering Design Stage. National Central University. 2020. Available online: https://hdl.handle.net/11296/s3vcm8 (accessed on 1 April 2020).
- Wang, C.-Y. Hazard Factors and Risk Assessment of the Lifting Operations in Offshore Wind Farm. National Taiwan Ocean University. 2019. Available online: https://hdl.handle.net/11296/5s696s (accessed on 1 April 2020).
- Yang, Z.; Yin, B.; Wei, P.; Ou, S.F.; Gao, Z.; Jiang, X. Analysis of the Causes and Calculation Methods of Time-Course Delay in Public Works. Special Research Program of the National Science Committee of the Executive Yuan. 2005. Available online: https://hdl.handle.net/11296/2ha2x7 (accessed on 1 April 2020).
- Yuan, C.-T. A Study of Risks in Construction of Elevated Mass Rapid Transit Projects. National Kaohsiung University of Science and Technology-First Campus. 2007. Available online: https://hdl.handle.net/11296/c6u637 (accessed on 1 April 2020).
- Cheng, Y.-C. Identification of Employed Delay Analysis Methods and Delay Causes in the Cases from the Court. Chung Hua University. 2009. Available online: https://hdl.handle.net/11296/f5stvh (accessed on 3 April 2020).
- Lu, C.-Y. Study of Using Dynamic Bayesian Network Construct Construction Project Cost Prediction Model. National Taiwan University of Science and Technology. 2009. Available online: https://hdl.handle.net/11296/c43933v (accessed on 3 April 2020).
- Andrić, J.M.; Wang, J.; Zhong, R. Identifying the Critical Risks in Railway Projects Based on Fuzzy and Sensitivity Analysis: A Case Study of Belt and Road Projects. Sustainability 2019, 11, 1302. [Google Scholar] [CrossRef] [Green Version]
- Madhumitha, T.S.; Shankar, C. Analysing and managing bridge construction Analysing and managing bridge construction. Analysing and managing bridge construction. Int. Res. J. Eng. Technol. 2020, 7, 329–338. [Google Scholar]
- Herrera, R.F.; Sánchez, O.; Castañeda, K.; Porras, H. Cost Overrun Causative Factors in Road Infrastructure Projects: A Frequency and Importance Analysis. Appl. Sci. 2020, 10, 5506. [Google Scholar] [CrossRef]
- Naderpour, H.; Kheyroddin, A.; Mortazavi, S. Risk Assessment in Bridge Construction Projects in Iran Using Monte Carlo Simulation Technique. Pract. Period. Struct. Des. Constr. 2019, 24, 04019026. [Google Scholar] [CrossRef]
Figure 1.
Research flow chart.

Figure 2.
Risk Factors for Construction Projects in a High inflationary environment.

Figure 3.
Case schedule.

Figure 4.
Case Monte Carlo simulation executed on million times.

Figure 5.
Probability distribution of the exposure to risk during the construction period.

Figure 6.
Probability distribution of the cost variance.


Table 1.
Summary of construction risk factors.
| Category | Numbering | Risk Factor | References |
|---|---|---|---|
| Design with Contract | 1 | Changes in the design | [21,32,33,34,35,36,37,38] |
| 2 | Changes in laws and regulations | [21,32,33,34,35,37,38] | |
| Supply - Owner | 3 | Late delivery of land | [21,32,34,35,36,38] |
| 4 | Illustration material delivered late | [21,32,34,35,36] | |
| 5 | Those who have been ordered by the government or the owner to stop work, requisition, confiscate or demolish | [21,32,34,36,38] | |
| 6 | Insufficient construction period arranged by the owner | [21,32,33,34,35,36,37,38] | |
| 7 | Owner’s financial situation is poor | [21,32,34,37,38] | |
| Finance | 8 | Budget cuts, rising costs of raw materials | [21,32,34,37] |
| 9 | Poor financial condition of contractors | [21,32,34,35,36,37,38] | |
| 10 | Poor financial condition of subcontractors | [34,36]. | |
| Construction | 11 | Site conditions do not match the design | [21,34,35,36,37,38] |
| 12 | Manufacturer changes the method or the sequence of construction | [32,35,38] | |
| 13 | Insufficient technical ability | [21,32,35,36,38] | |
| Management | 14 | Poor capital turnover | [34,36,37] |
| 15 | Failure to coordinate the timely operation of relevant manufacturers | [32,35,38] | |
| 16 | Defective materials, resulting in poor quality | [21,32,35,36,38] | |
| 17 | Material testing is slow | [32] | |
| Industrial Environment | 18 | Residents’ protests resulting in project delayed | [32,33,34,36,38] |
Table 2.
Introduction to the interview industry experts.
| Number | Service Unit | Job Attributes | Years of Work Experience |
|---|---|---|---|
| A | Construction firm | Purchasing outsourcing-purchasing | 28 years |
| B | Construction firm | On-site construction quality control personnel | 11 years |
| C | Construction firm | Project management, construction supervision | 20 years |
| D | Government agency | Construction, project management | 25 years |
| E | Construction firm | Project management | 20 years |
| F | Construction and development | Principal | 36 years |
Table 3.
Summary of the second part of the expert interviews in this study.
| Q1: What impact do you think the COVID-19 epidemic has had on the domestic construction industry? | |
| Experts A, B, C: | The experts agreed that the epidemic has had little impact on the construction industry. For the affected parts, the Public Works Committee of the Executive Yuan put forth specific relevant responses to help all units overcome this difficulty, such as price adjustments due to changes in construction prices. |
| Experts D, E: | The biggest impact of the epidemic was the decline in productivity. Due to the epidemic, the space between people was limited, and a certain social distance had to be maintained, which is a little inconvenient for outdoor communication. At the same time, in hot weather, due to the heat of wearing masks, some workers’ emotions would fluctuate, resulting in a drop in productivity, which had little impact on other aspects. |
| Expert F: | The main impact was the lack of work, a large shortage of human resources, the situation of poaching of work teams, and the government’s epidemic prevention control increased costs a little, and the prices of major material markets have risen sharply. |
| Q2: During the epidemic, what impact did your company mainly encounter or what risk factors did it face? | |
| Expert A: | The impact on the construction site was relatively small, and workers had to maintain a certain social distance to work. The more troublesome aspect was that government control measures reduced the willingness of workers to come to work. |
| Experts B and C: | The epidemic control measures had a great impact. Requiring workers to wear masks in hot weather affects the mood and speed of work, resulting in a drop in productivity. Some special areas also required workers to quickly screen before entering the construction site. Experts said that there was a construction site in Qijin which required every worker to be screened quickly every day. Most workers were unwilling to go to work when they heard this requirement. |
| Experts D, E: | The main construction sites are located in the south, where there was no shutdown, so the epidemic did not have much impact. However, there was a large number of labor shortages, and experts believe that the main reason for the shortage of manpower was TSMC robbing people. |
| Expert F: | The demand, supply and price dynamics of domestic construction materials were all affected by the epidemic, or only imported materials were affected by the international market, which increased the shortage of materials and caused prices to inflate substantially. |
| Q3: What percentage do you think these factors have on the probability of occurrence of the project and on the severity of the project cost and time history? (0~100%) | |
| Experts A, B, C: | The impact is too small to give data |
| Expert D: | Probability of occurrence increases by 30%, the cost increases by 20%, and the construction period increases by 20~30% |
| Expert E: | 20% increased chance of occurrence, 20 % cost and duration |
| Expert F: | Chance of occurrence is increased by 30%, the cost is 10~20%, and the duration is 20% |
Table 4.
Occupation of respondents.
| Respondents Profile | Category | Number of People | Percentage |
|---|---|---|---|
| Occupation | Construction firms | 86 | 63% |
| Construction and development | 7 | 5% | |
| Architect firms | 8 | 6% | |
| Government agencies | 22 | 16% | |
| Engineering consultants | 3 | 2% | |
| Other | 10 | 8% | |
| Range of experience (years) | 1–3 | 32 | 24% |
| 3–5 | 25 | 18% | |
| 5–10 | 28 | 21% | |
| 10–20 | 25 | 18% | |
| >20 | 25 | 19% |
Table 5.
Ranking of Risk Factors.
| Ranking | Probability of Occurrence | Degree of Cost Impact | Degree of Time Impact | |||
|---|---|---|---|---|---|---|
| Factor Description | Average | Factor Description | Average | Factor Description | Average | |
| 1 | Labor shortage (Industrial Environment) | 4.82 | Raw material prices continue to rise (financial) | 4.58 | Labor shortage (industrial environment) | 4.41 |
| 2 | Raw material prices continue to rise (financial) | 4.55 | Labor shortage (industrial environment) | 4.36 | The shortage of raw materials is difficult to obtain (industrial environment) | 4.16 |
| 3 | The shortage of raw materials is difficult to obtain (industrial environment) | 4.55 | The shortage of raw materials is difficult to obtain (industrial environment) | 4.36 | Pandemic effects leading to decreased labor productivity (industrial environment) | 4.10 |
| 4 | Pandemic effects leading to decreased labor productivity (industrial environment) | 4.52 | Pandemic effects leading to decreased labor productivity (industrial environment) | 4.10 | Raw material prices continue to rise (financial) | 4.01 |
| 5 | Insufficient construction period arranged by the owner (supply-owner) | 3.65 | Poor financial condition of contractors (financial) | 4.10 | Insufficient construction period arranged by the owner (supply-owner) | 3.76 |
| 6 | Insufficient construction period arranged by the owner (supply-owner) | 3.53 | Insufficient construction period arranged by the owner (supply-owner) | 3.96 | Those who have been ordered by the government or the owner to stop work, requisition, confiscate or demolish (supply-owner) | 3.67 |
| 7 | Poor financial condition of contractors (financial) | 3.41 | The owner’s financial situation is poor (supply-owner) | 3.66 | Poor capital turnover (management) | 3.67 |
| 8 | Poor financial condition of subcontractor (financial) | 3.41 | Those who have been ordered by the government or the owner to stop work, requisition, confiscate or demolish (supply-owner) | 3.57 | Failure to coordinate the timely operation of relevant manufacturers (management) | 3.61 |
| 9 | Failure to coordinate the timely operation of relevant manufacturers (management) | 3.30 | Failure to coordinate the timely operation of relevant manufacturers (management) | 3.56 | The owner’s financial situation is poor (supply-owner) | 3.56 |
| 10 | Material testing is slow (management) | 3.19 | Poor capital turnover (management) | 3.54 | Poor financial condition of contractors (financial) | 3.49 |
Table 6.
Risk Matrix.
| Risk Level | Impact | |||||
|---|---|---|---|---|---|---|
| Catastrophic 5 | Critical 4 | Moderate 3 | Marginal 2 | Negligible 1 | ||
| Probability | Almost certain 5 | 25 | 20 | 15 | 10 | 5 |
| Likely 4 | 20 | 16 | 12 | 8 | 4 | |
| Possible 3 | 15 | 12 | 9 | 6 | 3 | |
| Unlikely 2 | 10 | 8 | 6 | 4 | 2 | |
| Rare 1 | 5 | 4 | 3 | 2 | 1 | |
| Risk Level: Very high = 20–25; High = 10–16; Medium = 5–9; Low =3–4; Very low = 1–2. | ||||||
Table 7.
Risk factors for very high-risk levels.
| Risk Factor | Probability | Cost Impact | Time Impact | Cost Risk Level (Probability × Cost Impact) | Scheduling Risk Level (Probability × Time Impact) |
|---|---|---|---|---|---|
| Raw material prices continue to rise | 5 | 5 | 4 | 25 | 20 |
| Labor shortage | 5 | 4 | 4 | 20 | 20 |
| Raw materials are difficult to obtain | 5 | 4 | 4 | 20 | 20 |
| Pandemic effects leading to decreased labor productivity | 5 | 4 | 4 | 20 | 20 |
Table 8.
Occurrence probability classification of quantitative analysis in this study.
| Quantitative Grading | Description of Possibility | Likely to Happen |
|---|---|---|
| 5 | Almost certain | 30% or more |
| 4 | Most likely | 20~30% |
| 3 | Possible | 10~20% |
| 2 | Unlikely | 5~10% |
| 1 | Almost impossible | 0~5% |
Table 9.
The impact degree classification of the quantitative analysis of this study.
| Quantitative Grading | Severity Description | Time Severity | Cost Severity |
|---|---|---|---|
| 5 | Catastrophic | Unable to meet milestone schedule | 20~30% increase in budget or unit cost |
| 4 | Major | Influence path | 10~20% increase in budget or unit cost |
| 3 | Medium | A small number of schedule delays, it is possible to meet milestones without floating time | 5~10% increase in budget or unit cost |
| 2 | Low | Possible date | 1~5% increase in budget or unit cost |
| 1 | Negligible | Little or no effect | Little or no effect |
Table 10.
Calculated values of risk occurrence probability and level of impact.
| Probability | ||||
|---|---|---|---|---|
| Grade Description | Qualitative Grading | Quantitative Grading | Questionnaire Average | Probability |
| Almost certain | 5 | Very high (30% or higher) | 5.0 | 100.0 |
| 4.9 | 91.4 | |||
| 4.8 | 83.8 | |||
| 4.7 | 76.1 | |||
| 4.6 | 68.4 | |||
| 4.5 | 60.8 | |||
| 4.4 | 53.1 | |||
| 4.3 | 45.4 | |||
| 4.2 | 37.8 | |||
| 4.1 | 30.1 | |||
| Likely | 4 | High (20–30%) | 4.0 | 30.0 |
| 3.9 | 29.0 | |||
| 3.8 | 27.9 | |||
| 3.7 | 26.8 | |||
| 3.6 | 25.7 | |||
| 3.5 | 24.5 | |||
| 3.4 | 23.4 | |||
| 3.3 | 22.3 | |||
| 3.2 | 21.2 | |||
| 3.1 | 20.1 | |||
| Possible | 3 | Middle (10–20%) | 3.0 | 20.0 |
| 2.9 | 19.0 | |||
| 2.8 | 17.9 | |||
| 2.7 | 16.8 | |||
| 2.6 | 15.7 | |||
| 2.5 | 14.5 | |||
| 2.4 | 13.4 | |||
| 2.3 | 12.3 | |||
| 2.2 | 11.2 | |||
| 2.1 | 10.1 | |||
| Unlikely | 2 | Low (5–10%) | 2.0 | 10.0 |
| 1.9 | 9.5 | |||
| 1.8 | 9.0 | |||
| 1.7 | 8.4 | |||
| 1.6 | 7.9 | |||
| 1.5 | 7.3 | |||
| 1.4 | 6.8 | |||
| 1.3 | 6.2 | |||
| 1.2 | 5.7 | |||
| 1.1 | 5.1 | |||
| Rare | 1 | Very low (0–5%) | 1.0 | 5.0 |
| 0.9 | 4.4 | |||
| 0.8 | 3.9 | |||
| 0.7 | 3.3 | |||
| 0.6 | 2.8 | |||
| 0.5 | 2.2 | |||
| 0.4 | 1.7 | |||
| 0.3 | 1.1 | |||
| 0.2 | 0.6 | |||
| 0.1 | 0.0 | |||
| 0.0 | 0.0 | |||
Table 11.
Calculated values of risk occurrence probability and level of impact.
| Influence Level | ||||
|---|---|---|---|---|
| Grade Description | Qualitative Grading | Quantitative Grading | Questionnaire Average | Influence Level Calculated |
| Catastrophic | 5 | Very High (20–30%) | 5.0 | 30.0 |
| 4.9 | 29.0 | |||
| 4.8 | 27.9 | |||
| 4.7 | 26.8 | |||
| 4.6 | 25.7 | |||
| 4.5 | 24.5 | |||
| 4.4 | 23.4 | |||
| 4.3 | 22.3 | |||
| 4.2 | 21.2 | |||
| 4.1 | 20.1 | |||
| Critical | 4 | High (10–20%) | 4.0 | 20.0 |
| 3.9 | 19.0 | |||
| 3.8 | 17.9 | |||
| 3.7 | 16.8 | |||
| 3.6 | 15.7 | |||
| 3.5 | 14.5 | |||
| 3.4 | 13.4 | |||
| 3.3 | 12.3 | |||
| 3.2 | 11.2 | |||
| 3.1 | 10.1 | |||
| Moderate | 3 | Middle (5–10%) | 3.0 | 10.0 |
| 2.9 | 9.5 | |||
| 2.8 | 9.0 | |||
| 2.7 | 8.4 | |||
| 2.6 | 7.9 | |||
| 2.5 | 7.3 | |||
| 2.4 | 6.8 | |||
| 2.3 | 6.2 | |||
| 2.2 | 5.7 | |||
| 2.1 | 5.1 | |||
| Marginal | 2 | Low (1–5%) | 2.0 | 5.0 |
| 1.9 | 4.6 | |||
| 1.8 | 4.1 | |||
| 1.7 | 3.7 | |||
| 1.6 | 3.2 | |||
| 1.5 | 2.8 | |||
| 1.4 | 2.3 | |||
| 1.3 | 1.9 | |||
| 1.2 | 1.4 | |||
| 1.1 | 1.0 | |||
| Negligible | 1 | Negligible (0%) | 1.0 | 0.0 |
| 0.9 | 0.0 | |||
| 0.8 | 0.0 | |||
| 0.7 | 0.0 | |||
| 0.6 | 0.0 | |||
| 0.5 | 0.0 | |||
| 0.4 | 0.0 | |||
| 0.3 | 0.0 | |||
| 0.2 | 0.0 | |||
| 0.1 | 0.0 | |||
Table 12.
Calculated value of probability of occurrence of very high risk.
| Probability of Occurrence | |||||||
|---|---|---|---|---|---|---|---|
| Risk Factor | Average | 3 Standard Deviations | Most Optimistic | Most Pessimistic | Calculated Value (%) | ||
| Labor shortage | 4.8 | 1.15 | 3.7 | 5.0 | 26.8 | 83.8 | 100.0 |
| Raw material prices continue to rise | 4.5 | 1.50 | 3.0 | 5.0 | 20.0 | 60.8 | 100.0 |
| The shortage of raw materials is difficult to obtain | 4.5 | 1.78 | 2.7 | 5.0 | 16.8 | 60.8 | 100.0 |
| Pandemic effects leading to decreased labor productivity | 4.5 | 2.80 | 1.6 | 5.0 | 7.9 | 60.8 | 100.0 |
Table 13.
Calculated value of cost impact degree of very high risk.
| Degree of Cost Impact | |||||||
|---|---|---|---|---|---|---|---|
| Risk Factor | Average | 3 Standard Deviations | Most Optimistic | Most Pessimistic | Calculated Value (%) | ||
| Raw material prices continue to rise | 4.5 | 1.75 | 2.7 | 5.0 | 8.4 | 24.5 | 30.0 |
| Labor shortage | 4.4 | 1.44 | 2.9 | 5.0 | 9.5 | 23.4 | 30.0 |
| The shortage of raw materials is difficult to obtain | 4.4 | 1.70 | 2.7 | 5.0 | 8.4 | 23.4 | 30.0 |
| Pandemic effects leading to decreased labor productivity | 4.1 | 2.04 | 2.1 | 5.0 | 5.1 | 20.1 | 30.0 |
Table 14.
Calculation of extremely high risk of impact on time.
| Degree of Impact on Scheduling | |||||||
|---|---|---|---|---|---|---|---|
| Risk Factor | Average | 3 Standard Deviations | Most Optimistic | Most Pessimistic | Calculated Value (%) | ||
| Labor shortage | 4.4 | 1.48 | 2.9 | 5.0 | 9.5 | 23.4 | 30.0 |
| The shortage of raw materials is difficult to obtain | 4.2 | 2.14 | 2.0 | 5.0 | 5.0 | 21.2 | 30.0 |
| Pandemic effects leading to decreased labor productivity | 4.1 | 2.41 | 1.7 | 5.0 | 3.7 | 20.1 | 30.0 |
| Raw material prices continue to rise | 4.0 | 2.37 | 1.6 | 5.0 | 3.2 | 20.0 | 30.0 |
Table 15.
Analysis Results of Monte Carlo Simulated Exposure Value.
| Exposure Value | Minimum | Most Likely Value | Maximum Value |
|---|---|---|---|
| Time | 24 days (5% of project duration) | 34 days (7% of project duration) | 43 days (9% of project duration) |
| Cost | NTD 3,754,654 (~USD 121,900) (4% of total cost) | NTD 6,814,068 (~USD 221,300) (7% of total cost) | NTD 10,322,207 (~USD 335,200) (10% of total cost) |
Disclaimer/Publisher’s Note: The statements, opinions and data contained in all publications are solely those of the individual author(s) and contributor(s) and not of MDPI and/or the editor(s). MDPI and/or the editor(s) disclaim responsibility for any injury to people or property resulting from any ideas, methods, instructions or products referred to in the content. |
© 2023 by the authors. Licensee MDPI, Basel, Switzerland. This article is an open access article distributed under the terms and conditions of the Creative Commons Attribution (CC BY) license (https://creativecommons.org/licenses/by/4.0/).
Share and Cite
MDPI and ACS Style
Chen, Y.-T.; Yang, Y.-Y.; Chen, Y.-H. Assessing the COVID-19 Impact of Projects under Construction with Monte Carlo Simulation. Architecture 2023, 3, 175-194. https://doi.org/10.3390/architecture3020011
AMA Style
Chen Y-T, Yang Y-Y, Chen Y-H. Assessing the COVID-19 Impact of Projects under Construction with Monte Carlo Simulation. Architecture. 2023; 3(2):175-194. https://doi.org/10.3390/architecture3020011
Chicago/Turabian StyleChen, Yih-Tzoo, Yee-Yen Yang, and Yi-Hua Chen. 2023. "Assessing the COVID-19 Impact of Projects under Construction with Monte Carlo Simulation" Architecture 3, no. 2: 175-194. https://doi.org/10.3390/architecture3020011