

Spatial and Temporal Analysis of Extreme Precipitation under Climate Change over Gandaki Province, Nepal
School of Engineering, Pokhara University, Pokhara 33700, Nepal
*
Author to whom correspondence should be addressed.
Architecture 2022, 2(4), 724-759; https://doi.org/10.3390/architecture2040039
Submission received: 28 March 2022
/
Revised: 4 November 2022
/
Accepted: 14 November 2022
/
Published: 22 November 2022
(This article belongs to the Special Issue Resilience and Sustainability in Architecture and Urban Planning: Policies, Practices, Strategies and Visions)
Abstract
:This paper presents a research study of expected precipitation extremes across the Gandaki Province, Nepal. The study used five indices to assess extreme precipitation under climate change. Precipitation output of two Global Climate Models (GCMs) of Coupled Model Intercomparison Project Phase Six (CMIP6) were used to characterize the future precipitation extremes during the rainfall season from June to September (JJAS) and overall days of the year. To characterize extreme precipitation events, we used daily precipitation under the SSP2–4.5 and SSP5–8.5 scenarios from the Beijing Climate Center and China Meteorological Administration, China; and Meteorological Research Institute (MRI), Japan. Considering large uncertainties with GCM outputs and different downscaling (including bias correction) methods, direct use of GCM outputs were made to find change in precipitation pattern for future climate. For 5-, 10-, 20-, 50-, and 100-year return periods, observed and projected 24 h and 72 h annual maximum time series were used to calculate the return level. The result showed an increase in simple daily intensity index (SDII) in the near future (2021–2040) and far future (2081–2100), with respect to the base-year (1995–2014). Similarly, heavy precipitation days (R50 mm), very heavy precipitation days (R100 mm), annual daily maximum precipitation (RX1day), and annual three-day maximum precipitation (RX3day) indices demonstrated an increase in extreme precipitation toward the end of the 21st century. A comparison of R50 mm and R100 mm values showed an extensive (22.6% and 63.8%) increase in extreme precipitation days in the near future and far future. Excessive precipitation was forecasted over Kaski, Nawalparasi East, Syangja, and the western half of the Tanahun region. The expected increase in extreme precipitation may pose a severe threat to the long-term viability of social infrastructure, as well as environmental health. The findings of these studies will provide an opportunity to better understand the origins of severe events and the ability of CMIP6 model outputs to estimate anticipated changes. More research into the underlying physical factors that modulate the occurrence of extreme incidences expected for relevant policies is suggested.
1. Introduction
Climate change is generally considered to be increasing warming days, erratic rainfall patterns, ecological variability, biological change, and the adverse effects these things have on human beings. It is measured by finding the patterns of deviation in temperature, humidity, atmospheric pressure, wind, precipitation, atmospheric particle counts, and other meteorological variables in a specific region over a long period [1]. Different research studies show that temperature increases rapidly, the rainfall pattern is erratic, seasons are changing, events of droughts are increasing, and hailstorm occurs abnormally [2]. The Intergovernmental Panel on Climate Change (IPCC) forecasts an increase in mean temperature of around 1 °C by 2025 and 3 °C by the end of the next century [3]. Climate change is one of the most critical global challenges of the century. It is expected that climate change will have a significant impact on extreme precipitation because the warming atmosphere will alter the precipitation pattern by changing the global/regional hydrological cycle.
Extreme precipitation is one of the major factors that trigger natural disasters, such as floods, landslides, and droughts, which cause the loss of life and property. Under climate change, rainfall is increasing its pattern in the world [4]. It shows the problems of food and water security, as well as disaster management. In 14–17 June 2013, the cloudburst happened in the northwestern region of Nepal and India border, killing around 5700 and affecting more than 100,000 people from both countries. Another event of 14–16 August 2014 caused massive flooding and triggered a number of landslides, causing massive losses of life and property and distressing around 35,000 households [4].
Mainly Tropical Disturbance, i.e., EI Nino-Southern oscillation and Madden Julian Oscillation, contributes to the variability of extreme rainfall in the South Pacific region. In tropical regions, tropical cyclones play the vital role for the extreme weather [5]. Precipitation in Nepal varies significantly from place to place due to sharp topographical variation. According to the rain-bearing wind approach, most rainfall occurred over the foothills of the lower Himalayas in monsoon season and least on the leeward side of individual successive range [6].
Climate change is one of the most critical challenges of the century for Nepal. The warming trend in Nepal after 1997 has ranged from 0.06 to 0.12 °C per year in most of the middle mountains and Himalayan regions [7]. Nepal is unique geographic location, with the Churia Range at the south and the Himalayas to the north, and the prevailing monsoon has made it one of the wettest countries of the world. It is located at the southern slope of the Central Himalayas, with latitudes of 26°22′ to 30°27″ north and longitudes of 80°04′ to 88°12′ east. The topography diverges from 60 m in south to the highest peak of the world, i.e., 8848 m. Pre-monsoon (March–May), monsoon (June–September), post-monsoon (October–November), and winter (December–February) are the four main seasons of Nepal. The majority of the precipitation occurs during the monsoon season, which accounts for greater than 80% of the annual precipitation.
Predictions are constantly being made to understand what will happen based on observed climate shifts over the past decades and projected greenhouse gas emissions. Information on the likely change in the precipitation pattern is highly useful in various fields, such as engineering, environment, forestry, and agriculture. Investigations on climate-change impacts on precipitation extremes are necessary for proper engineering designs of hydrologic structures such as dams, bridges, irrigation canals, sewerage, etc. Rainfall intensity–duration–frequency (IDF) curves are used to quantify the depth and its frequency of rainfall, thinking about one-of-a-kind periods; historically, the IDF curves are primarily based totally on historic rainfall residences in general [8].
Global Climate Model (GCM) is a popular tool for generating the future climate-change scenarios. Recently, Coupled Model Intercomparison Project Phase Six (CMIP6) simulations have been used to find the change pattern in future precipitation extremes. GCM faces problems of reliable precipitation simulation at regional or local scales, particularly in regard to the simulation of extreme precipitation events, due to its coarse spatial resolution and the current incomplete understanding of the climate system. The poor performance in regional/local precipitation simulation makes it difficult to directly use GCM outputs in studies on climate-change impact on extreme precipitation change, because an extreme precipitation event is most likely a localized phenomenon. Recently, research efforts have been made to downscale the GCM to support localized impact assessment. However, such downscaling models are either complex and computationally demanding (dynamic downscaling) or require the extensive use of observed data (statistical downscaling). That leads to a limited availability of model results, which, in most cases, are not sufficient to fulfil localized impact-assessment needs [9].
Precipitation-change assessments for Nepal at different scales (grid cell, basin, district, and country) and the temporal scale can be found in different forms (reports and journal papers). However, there is no study on climate-change impact assessment primarily focused on precipitation extremes over Gandaki Province. This research investigated implications of climate change on characteristics of extreme precipitation over Gandaki Province of Nepal. Gandaki is one of the seven provinces (states) of Nepal. Using CMIP6 simulations, this research investigated likely change in precipitation extremes over Gandaki Province, Nepal. To assess extreme precipitation, the study used five indices: simple daily intensity index (SDII), heavy precipitation days (R50 mm), very heavy precipitation days (R100 mm), annual daily maximum precipitation (RX1day), and annual three-day maximum precipitation (RX3day).
2. Study Area and Methods
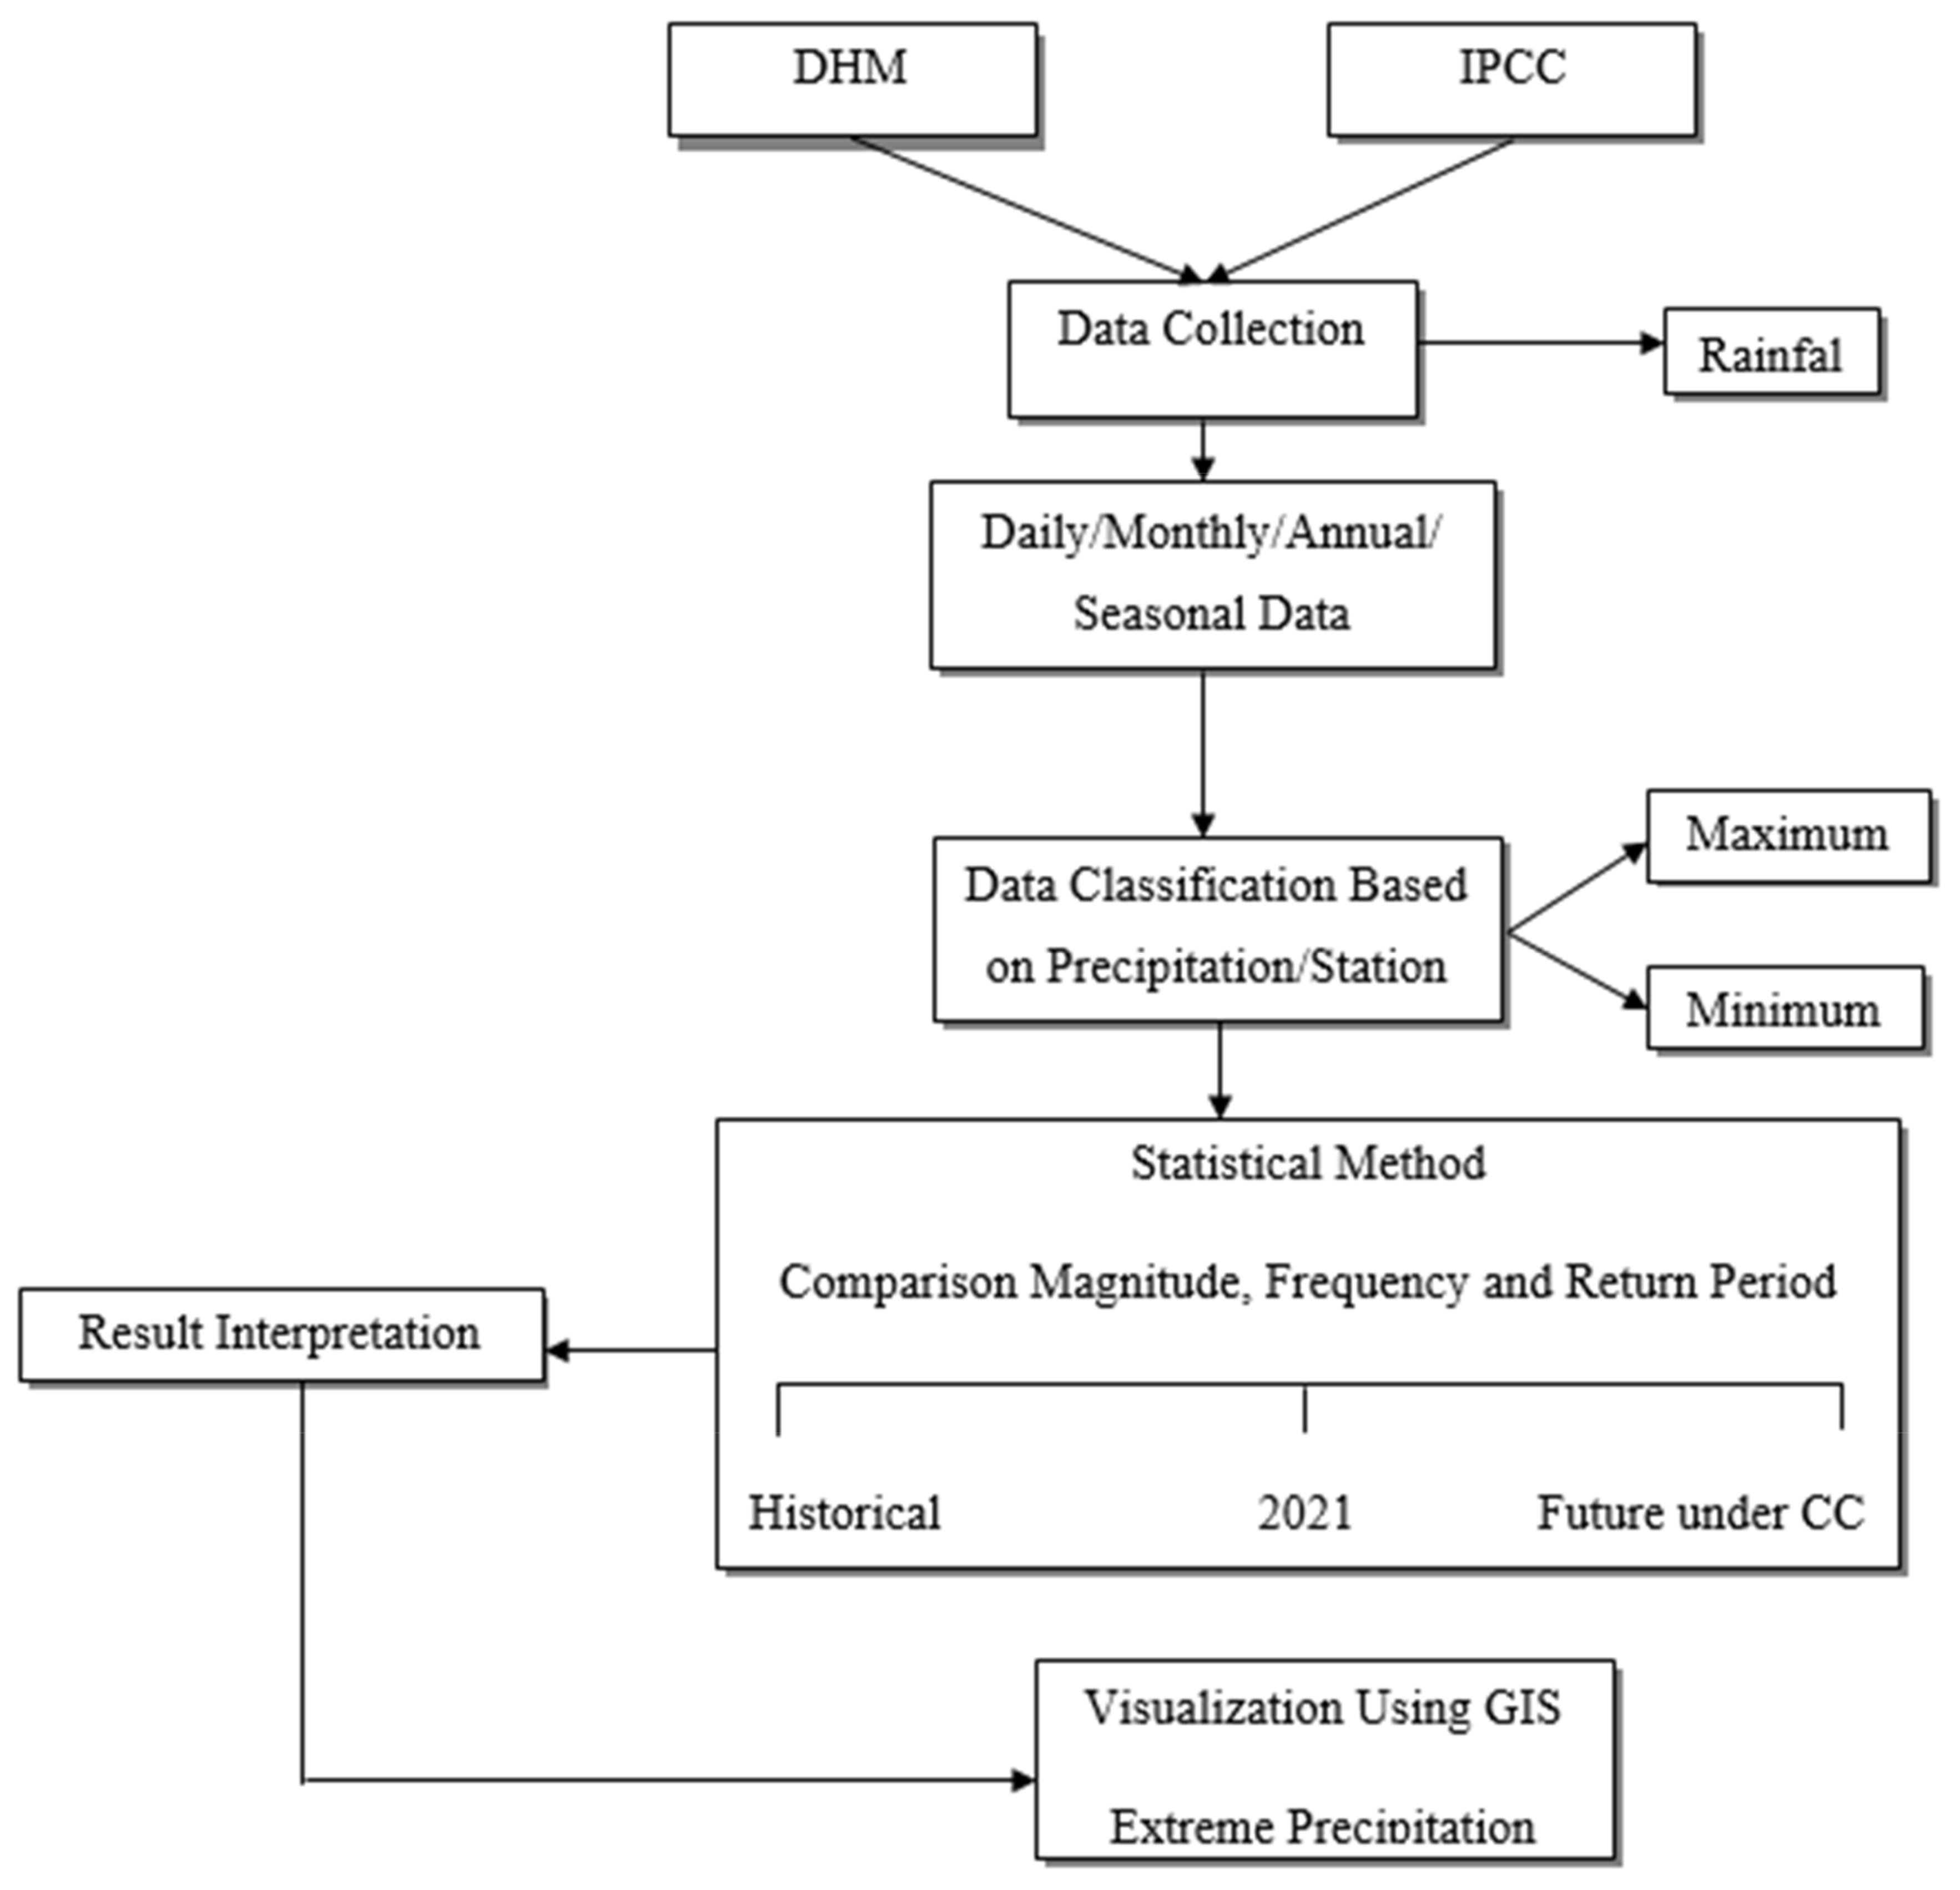
In order to understand the precipitation pattern over the past decades, the observed data of the previous year were obtained through the relevant department. The rainfall data were collected from the Department of Hydrology and Metrology, Nepal. GCM precipitation outputs for different scenarios were obtained online. An analysis of extreme precipitation under climate-change consequence was conducted through an MS Excel-based tool. The overall methodology and how it relates to each objective are briefly shown below, in diagrammatic form (Figure 1).
2.1. Study Area
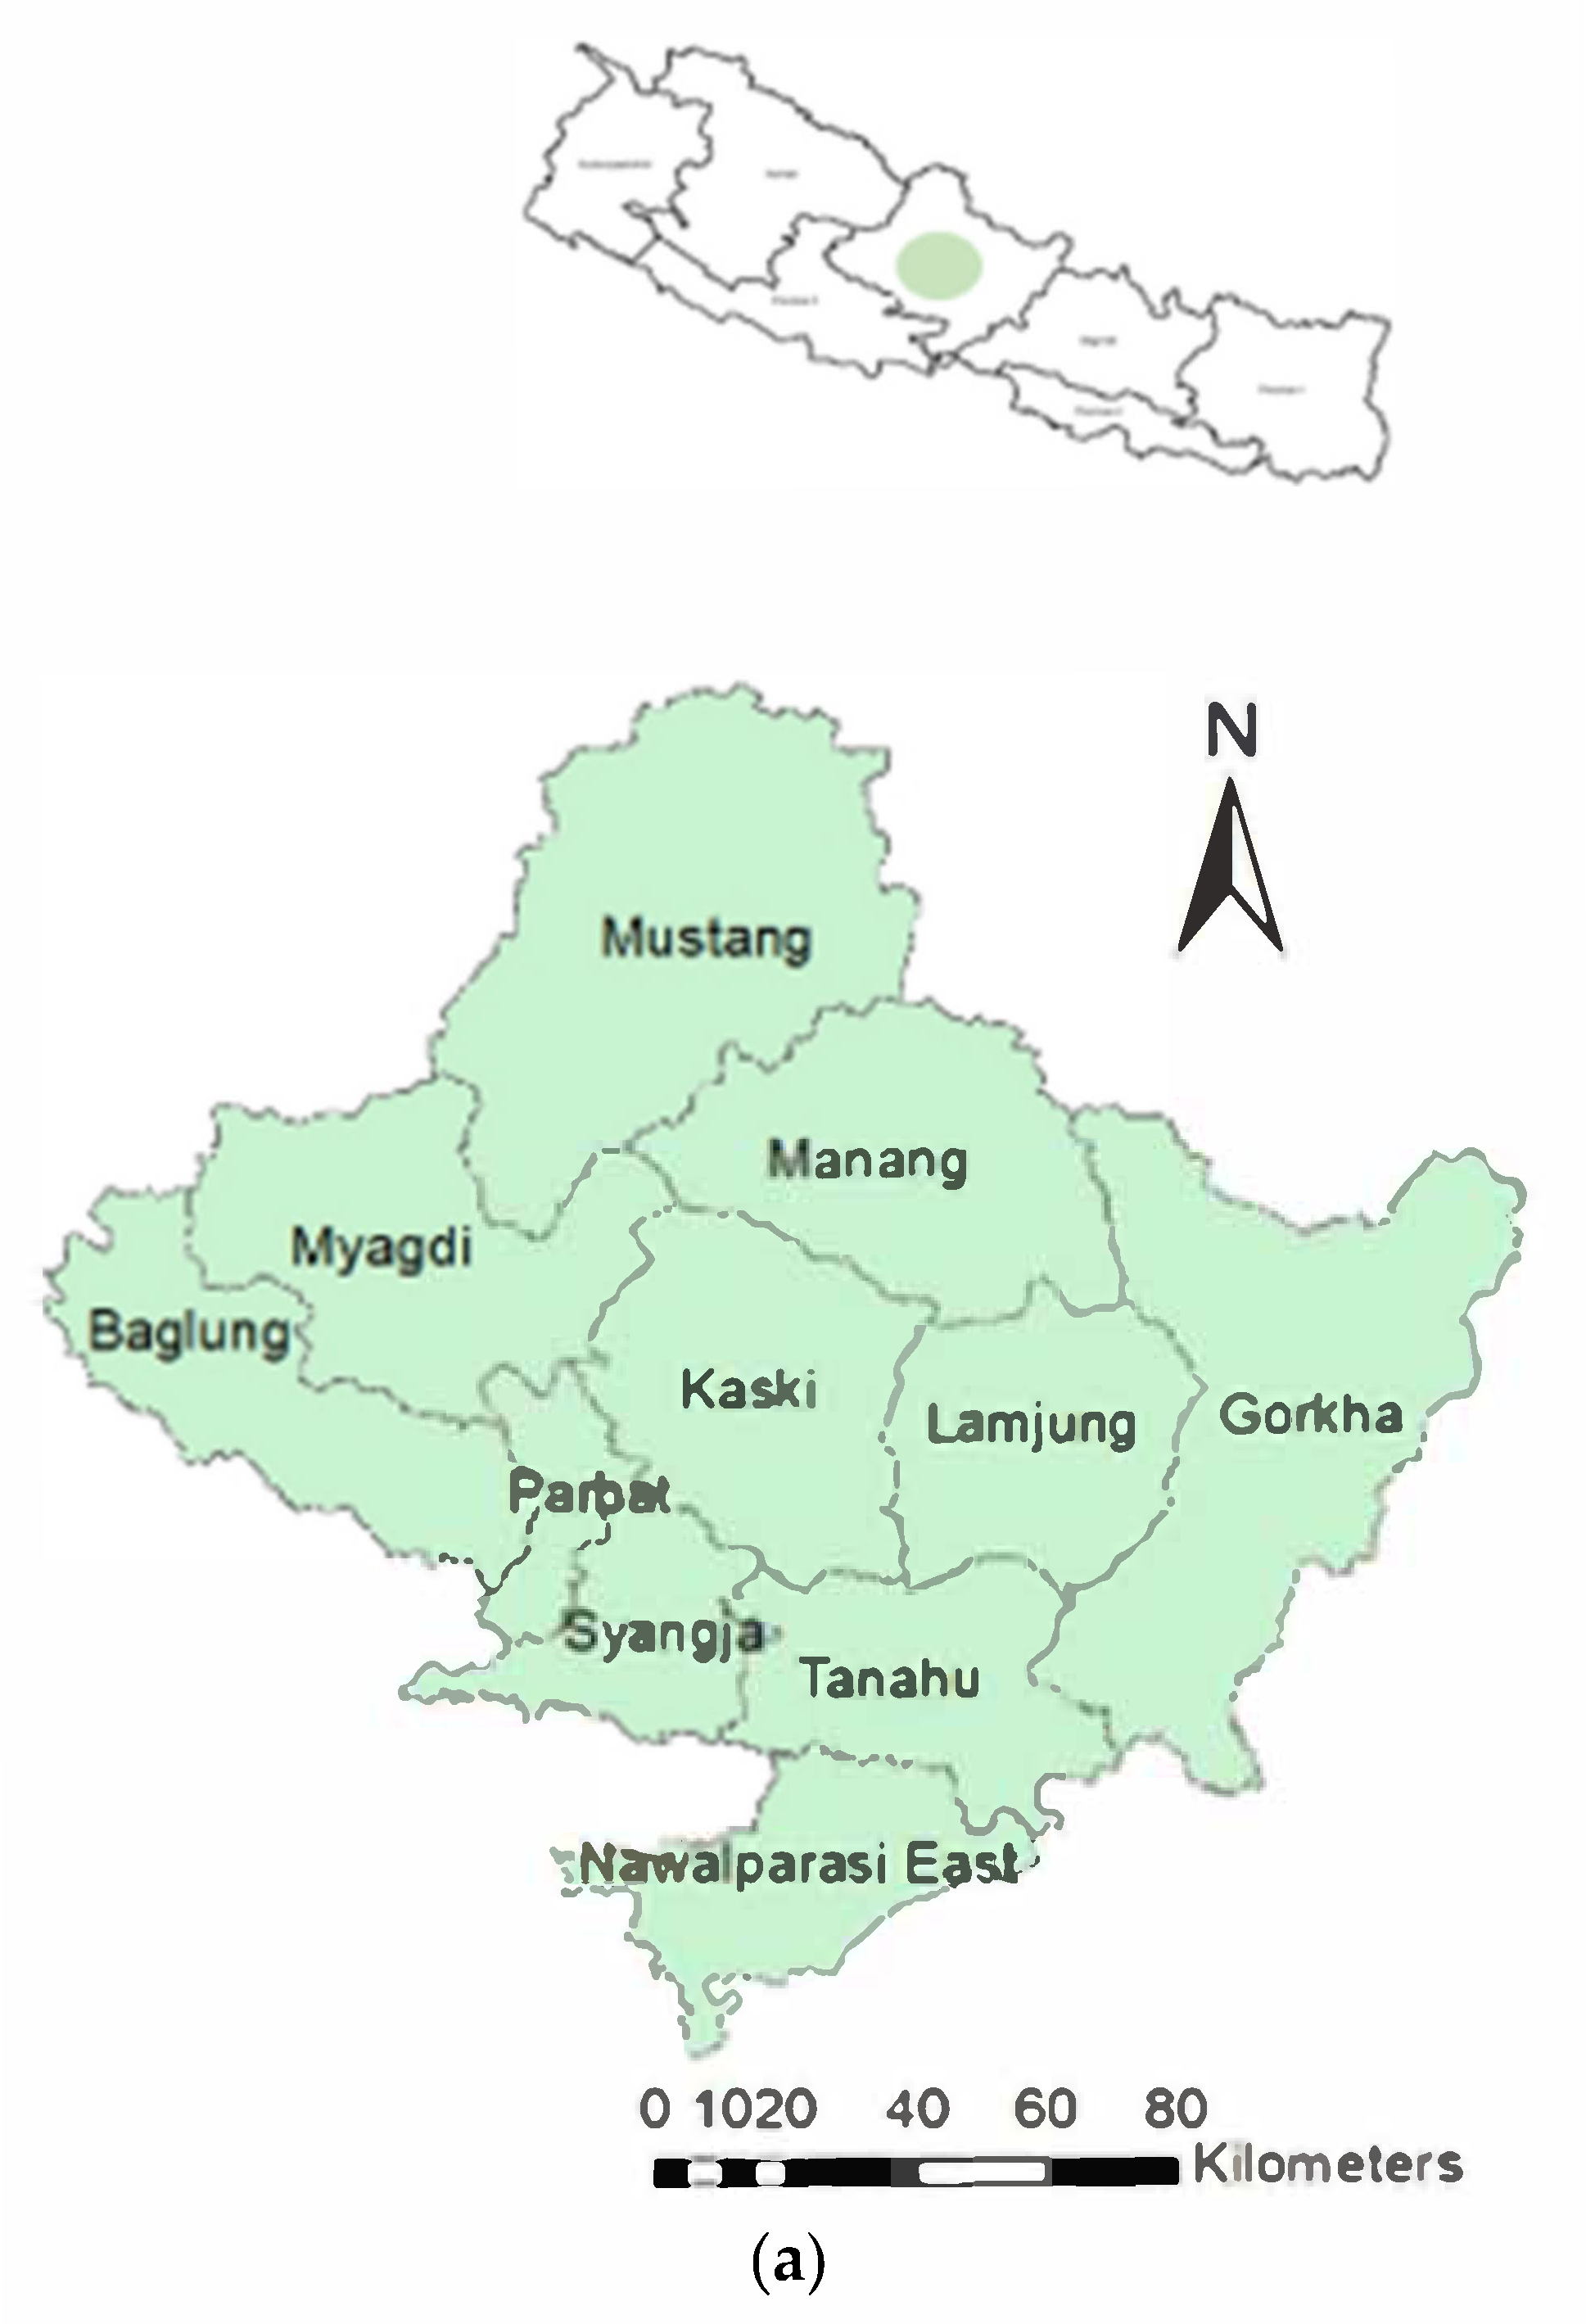
The location of the study area is Gandaki Province, Nepal (Figure 2a). It is one of the seven federal provinces established by the current constitution of Nepal, which was promulgated on 20 September 2015 AD. There are 11 districts: Manang, Gorkha, Lamjung, Tanahun, Nawalparasi (Bardaghat-Susta East), Kaski, Syangja, Parbat, Baglung, Magdi, and Mustang. It borders the Tibet Autonomous Region of China to the north, Bagmati Province to the east, Karnali Province to the west, and Lumbini Province and Bihar of India to the south. It has an area of 21,773 Km2, which is about 14.66% of the total area of Nepal. The state lies at a latitude of 27°20′ N~29°20′ N and longitude of 82° 52′ E~85°12′ E [10]. In terms of terrain, the province lies in the Himalayan region, along with hilly and plain regions with high spatial variability of climate (Figure 2b). The summer monsoon, which lasts from June to September, has the most influence on the climate in the study area. Basically, the climate ranges from subtropical in the lower belt to arctic in the upper elevations [11].
Climate change is a major environmental challenge that plays out through changing intensity, duration, and frequency of extreme events in the Gandaki Province. Water-related disasters such floods and landslides are frequently reported during monsoon due to occurrences of heavy rainfall events. The Gandaki Province has a wide spatial heterogeneity in topography and climate, with the topographical variation ranging. Elevations range from 60 m in the south to higher than 8000 m in the north, where the watershed contains the Dhaulagiri (8167 m) and Annapurna (8091 m) peaks. The average annual precipitation varies from as low as 150 mm in the Trans-Himalayas to as high as 5400 mm in the hilly region. The Gandaki River Basin is the main river system. The presence of the Langtang, Machapuchare, Dhaulagiri, and Annapurna mountains have created a steep variation in climate over the basin.
2.2. Precipitation Data
2.2.1. Observed
The study was based upon meteorological data collected from Nepal’s Department of Hydrology and Meteorology (DHM). The DHM is the country’s only institution in charge of collecting and disseminating meteorological and hydrological data. It builds and maintains a nationwide network of hydrometeorological stations. DHM collects daily meteorological data, and these data of Gandaki Province were used for this research, as illustrated in (Table 1).
2.2.2. GCM
GCM outputs are used for climate predictions and to study climate variability and change. Most of the GCMs are characterized by a coarse grid resolution, resulting in greater uncertainty. Climate-change impact assessment based on GCMs is simulated by the integration of future emission paths (socioeconomic scenarios). There is a wide selection of climate models available to provide scenarios of future climate change. For meaningful climate-change-impact studies, realistic simulations of the local climate are needed. The use of multiple GCMs and scenarios is recommended due to the large uncertainty of the GCM outputs. However, the use of too many GCMs requires too much time and too many resources. In this case, two GCM datasets were used from the CMIP6 models. They are from the Beijing Climate Center and China Meteorological Administration, China (BCC-CSM2-MR); and the Meteorological Research Institute (MRI), Japan (Table 2). BCC-CSM2-MR outputs were considered because of the proximity of the study area to China, where this GCM was originated. On the other hand, MRI GCM outputs have been widely applied, as well as tested, in the Nepalese basin by the authors of previous works [12,13].
The daily precipitation under the SSP2–4.5 and SSP5–8.5 scenarios was used to estimate extreme precipitation events [14]. The SSP2–4.5 (+4.5 Wm2) pathway represents a medium-forcing middle-of-the-road pathway, whereas the SSP5–8.5 (+8.5 Wm2) pathway represents a high-end-forcing pathway. The SSP2–4.5 scenario is thought to be a more likely conclusion, with modest mitigation efforts limiting global warming to a maximum of 2.5 degrees Celsius above pre-industrial levels by the end of the twenty-first century [14]. SSP5–8.5, on the other hand, is also known as “business as usual”, meaning a dismal future that is fossil-fuel intensive and devoid of any climate mitigation, resulting in approximately 5 °C of warming by the end of the century. In this study, we considered 1995–2014 data as the baseline, as well as two future time periods, referred to as the near future (2021–2040) and far future (2081–2100), respectively.
2.3. Precipitation Indices
To investigate projected variations in precipitation over the research region, five indicators collected from ETCCDI were used. The indicators stated below, in Table 3, were chosen to investigate future changes in regional precipitation intensity, frequency, and duration [14]. A recent study on EA used the indices described above to see if CMIP6 models could accurately represent the current characteristics and geographical distribution of extreme precipitation. The study’s key findings proved MME’s capacity to describe observed precipitation and related extremes during rainfall seasons when compared to individual models. Furthermore, when compared to the extremes, MME performed better in recreating yearly total precipitation, according to the study. As a result of Reference [15], the MME was also used in this study to look at future changes in local precipitation extremes. The five indices shown in (Table 3) were used in numerous studies to analyze changes in precipitation over the Gandaki area.
The changing climatic conditions were assessed in this study by using observed and projected daily extreme precipitation data (annual maximum). Trend tests were applied to the observed annual maximum time series to capture any variations. For the 5-, 10-, 20-, 50-, and 100-year return periods, observed and projected 24 h and 72 h annual maximum time series were used to calculate the return level (precipitation depth in mm).
3. Results
3.1. Observed Precipitations
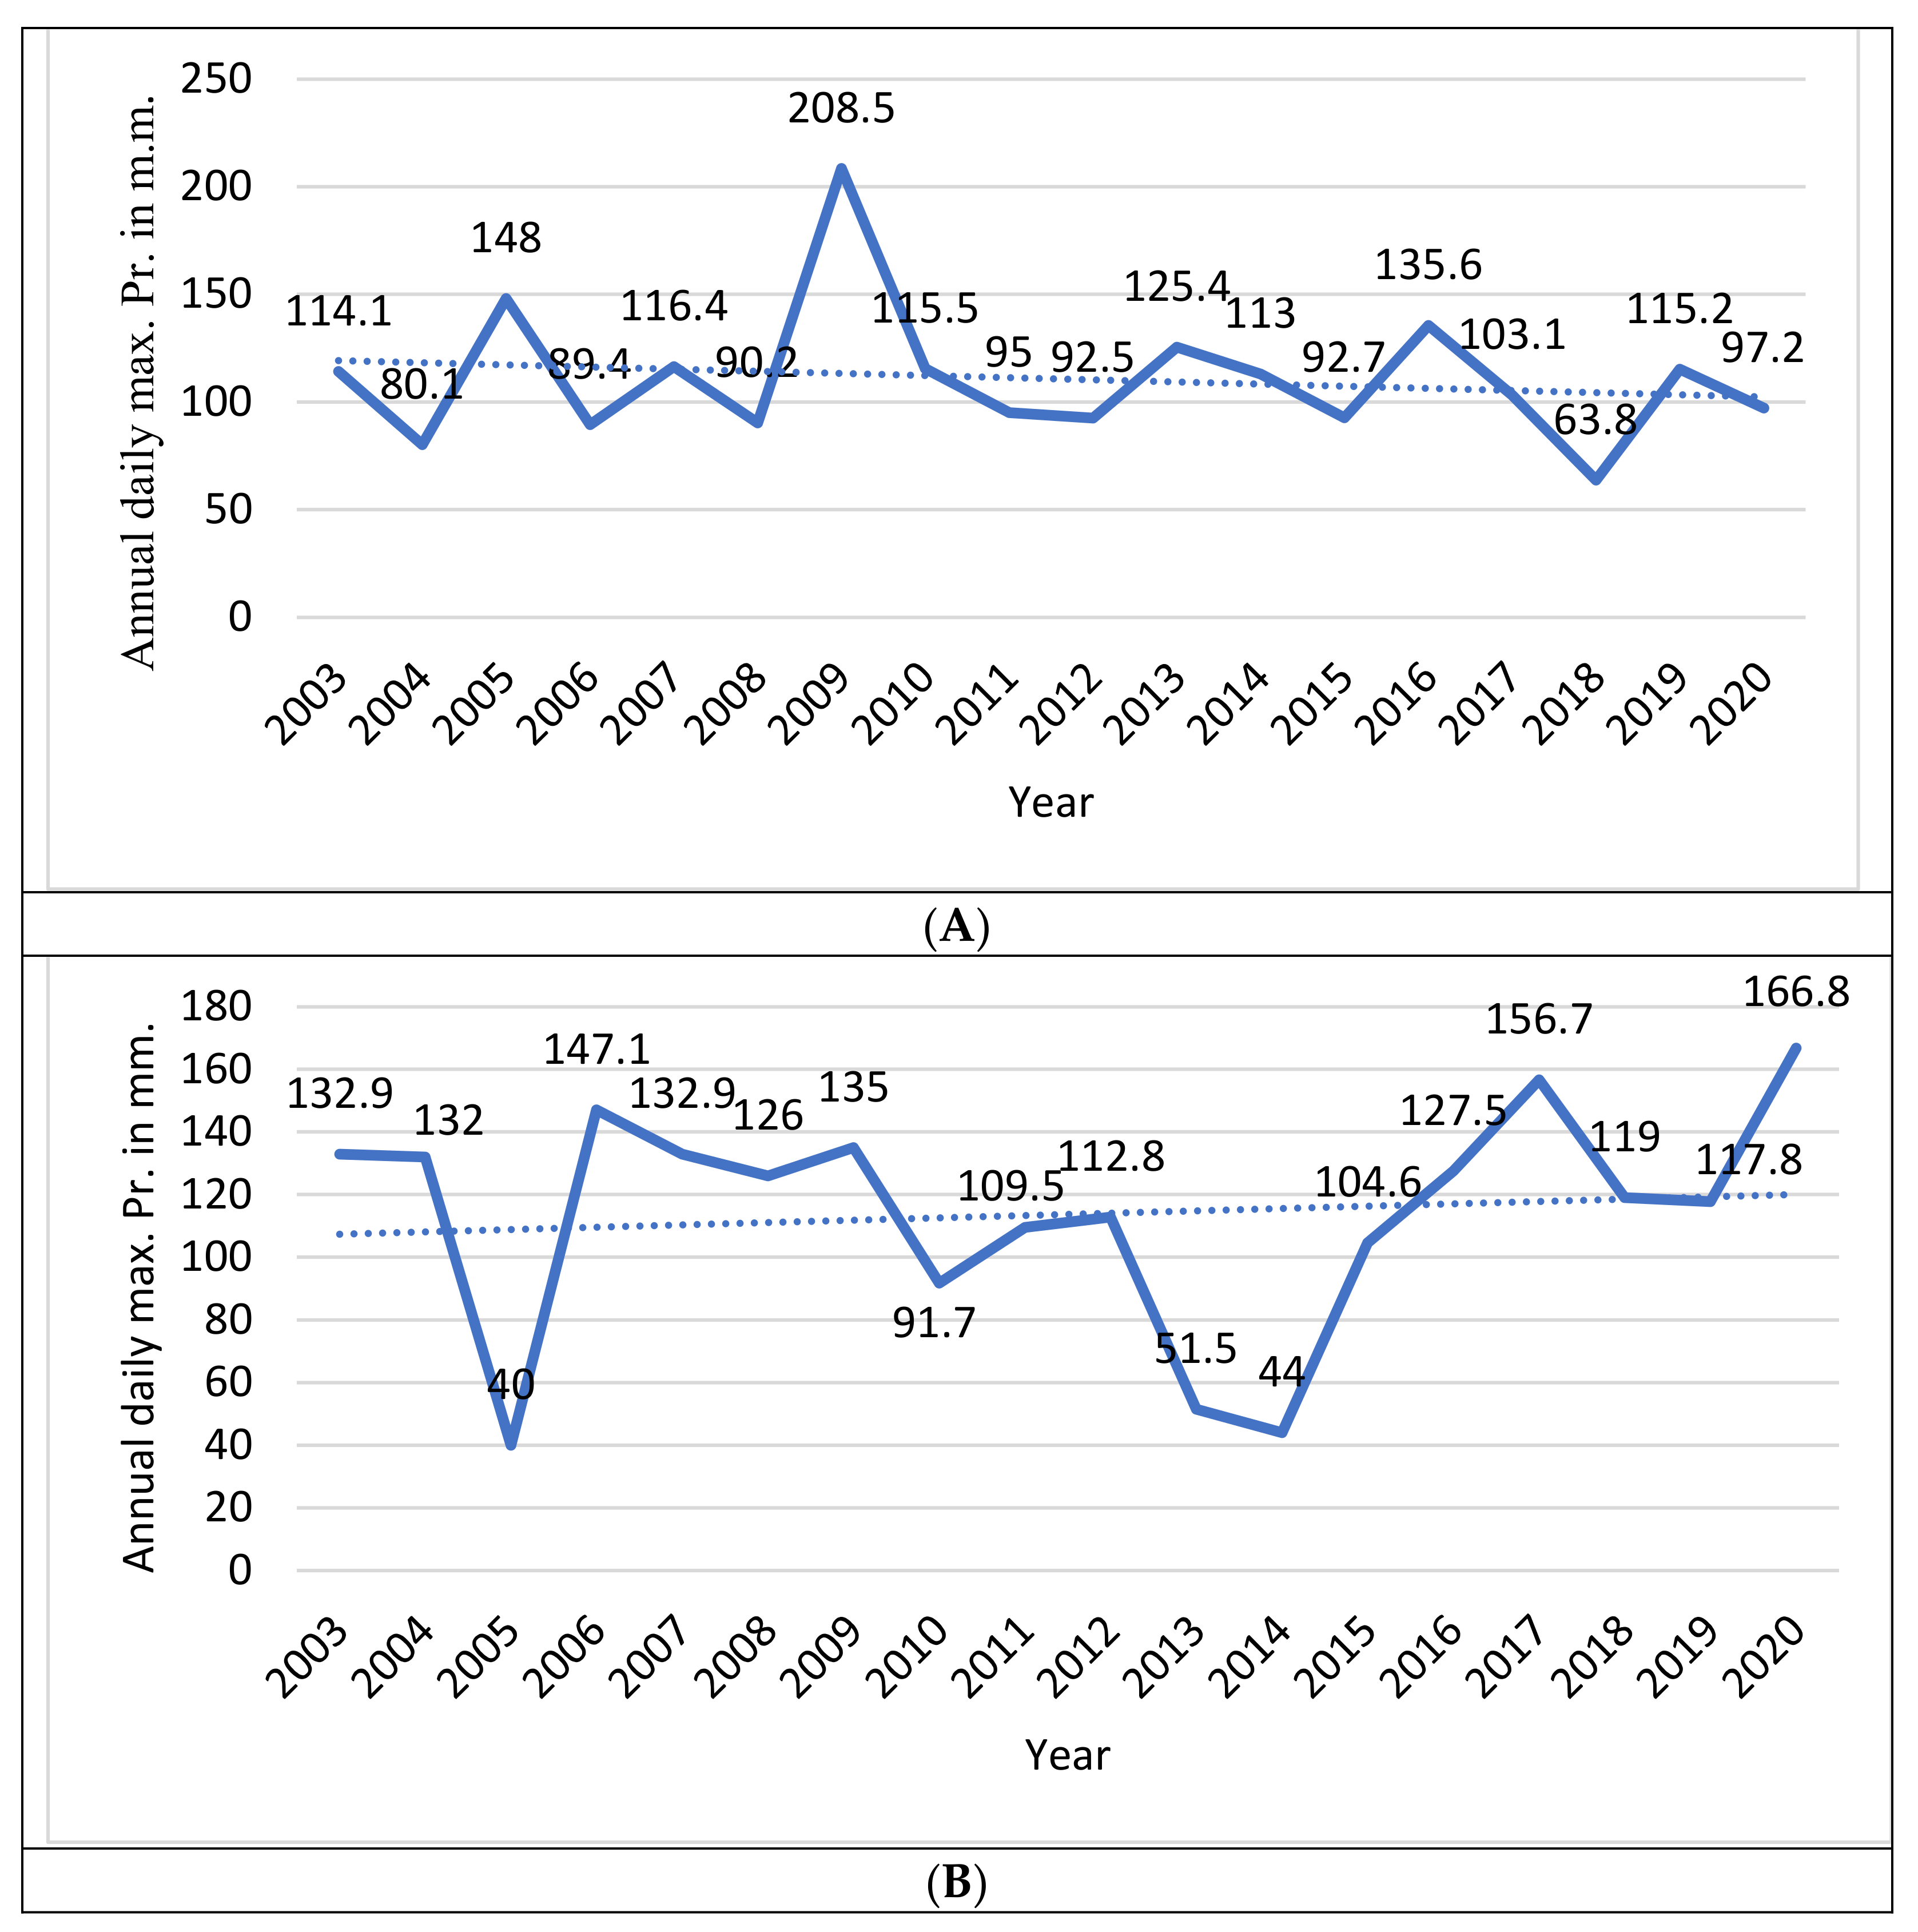
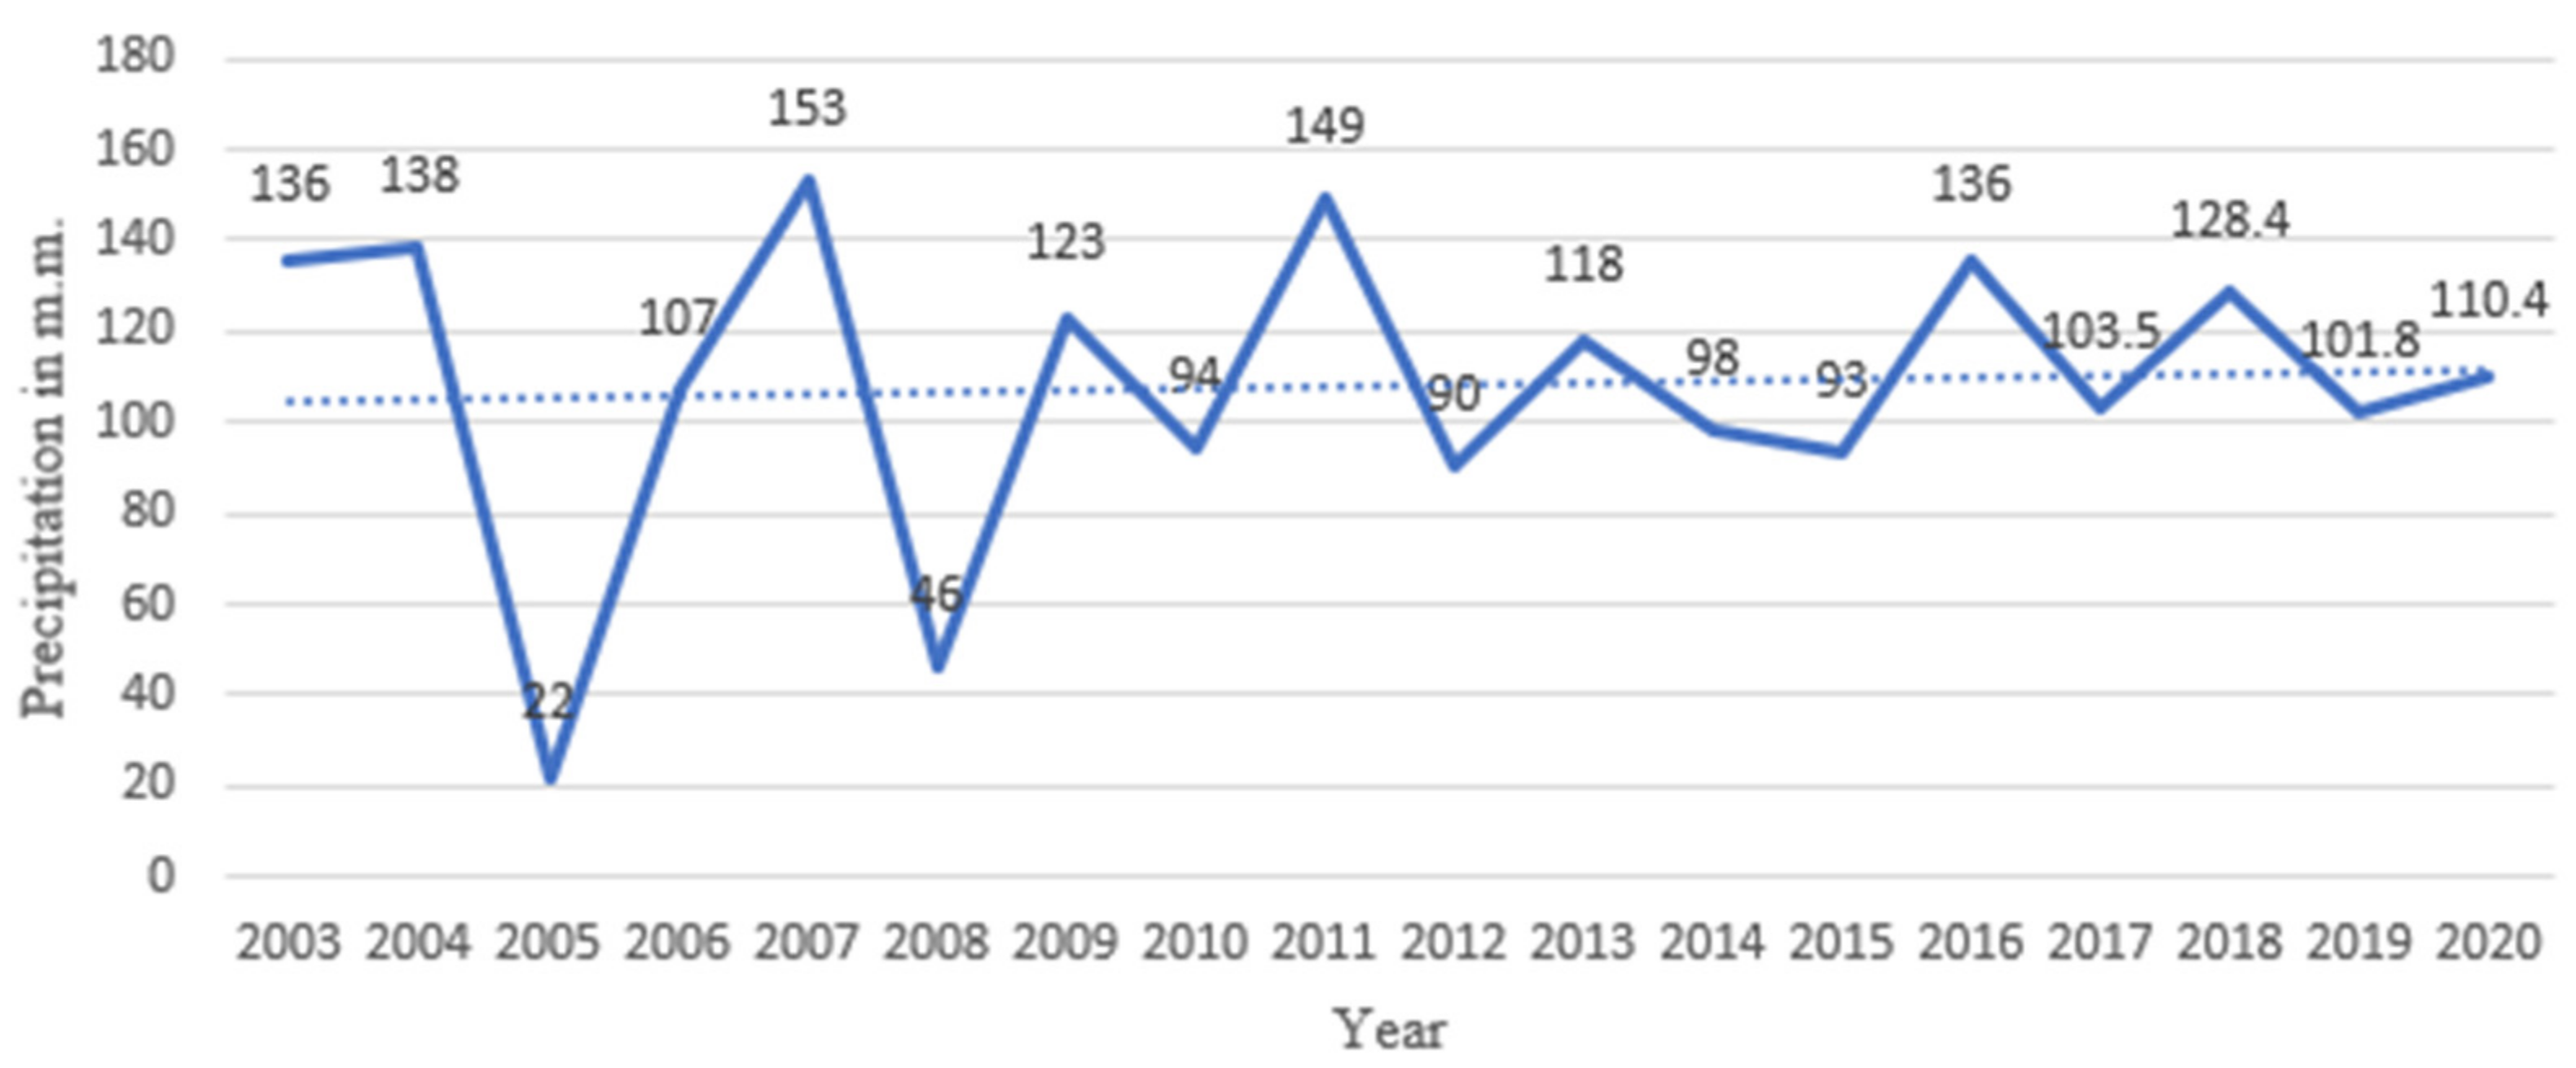
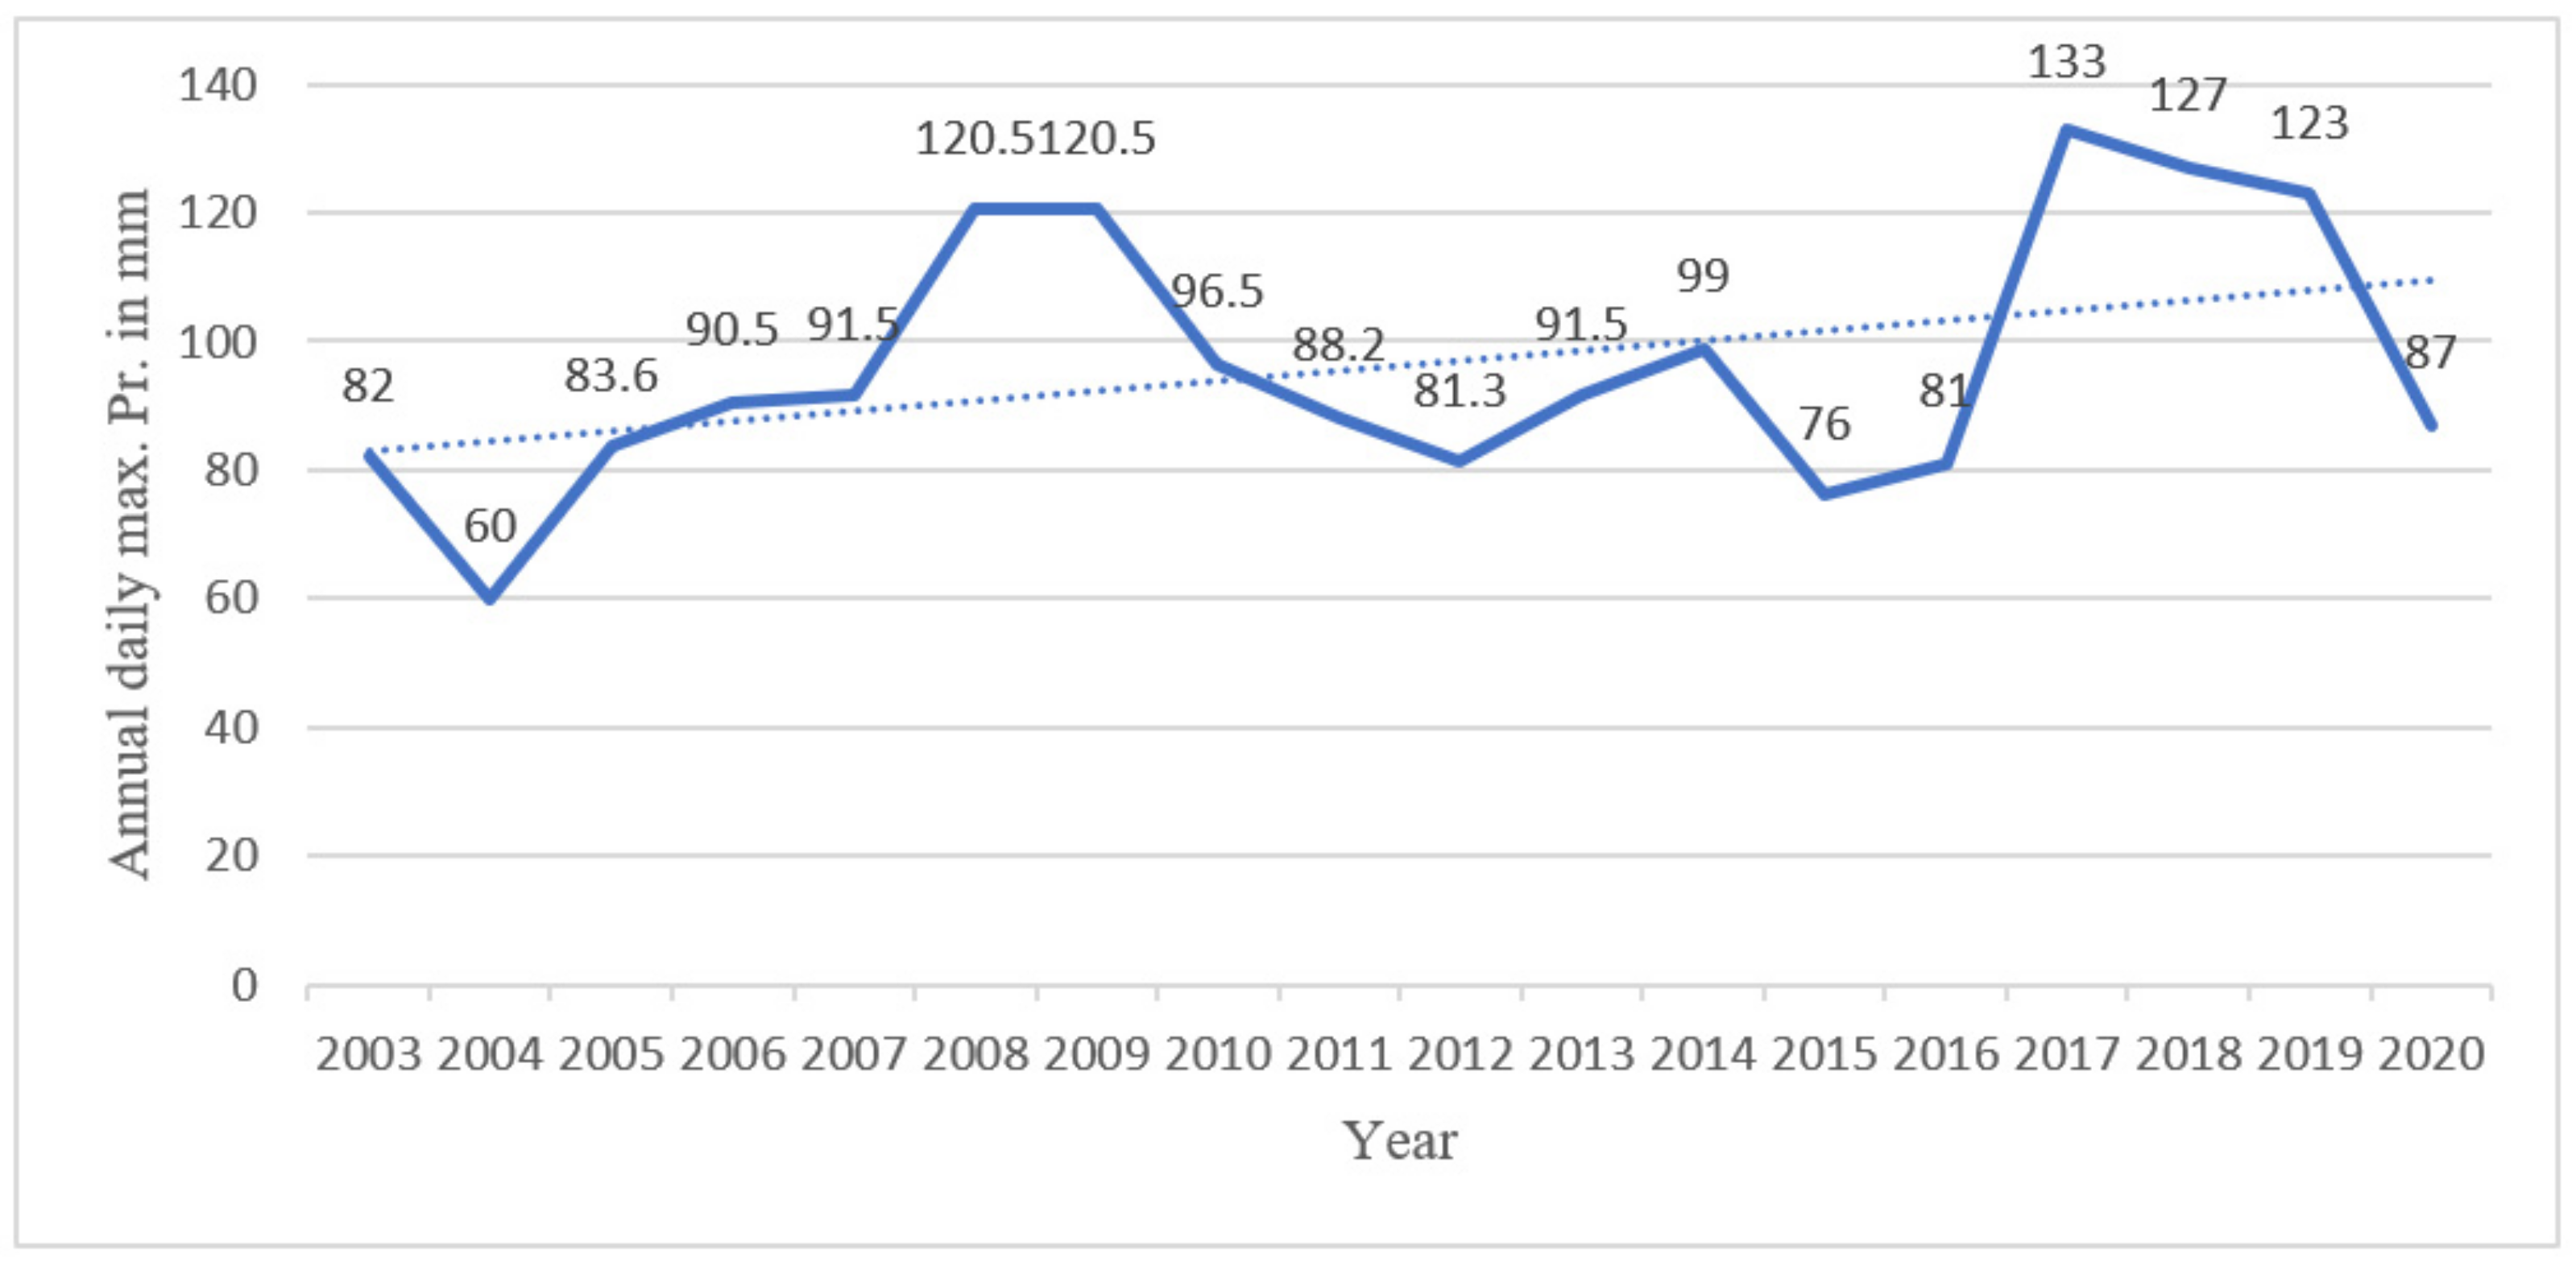
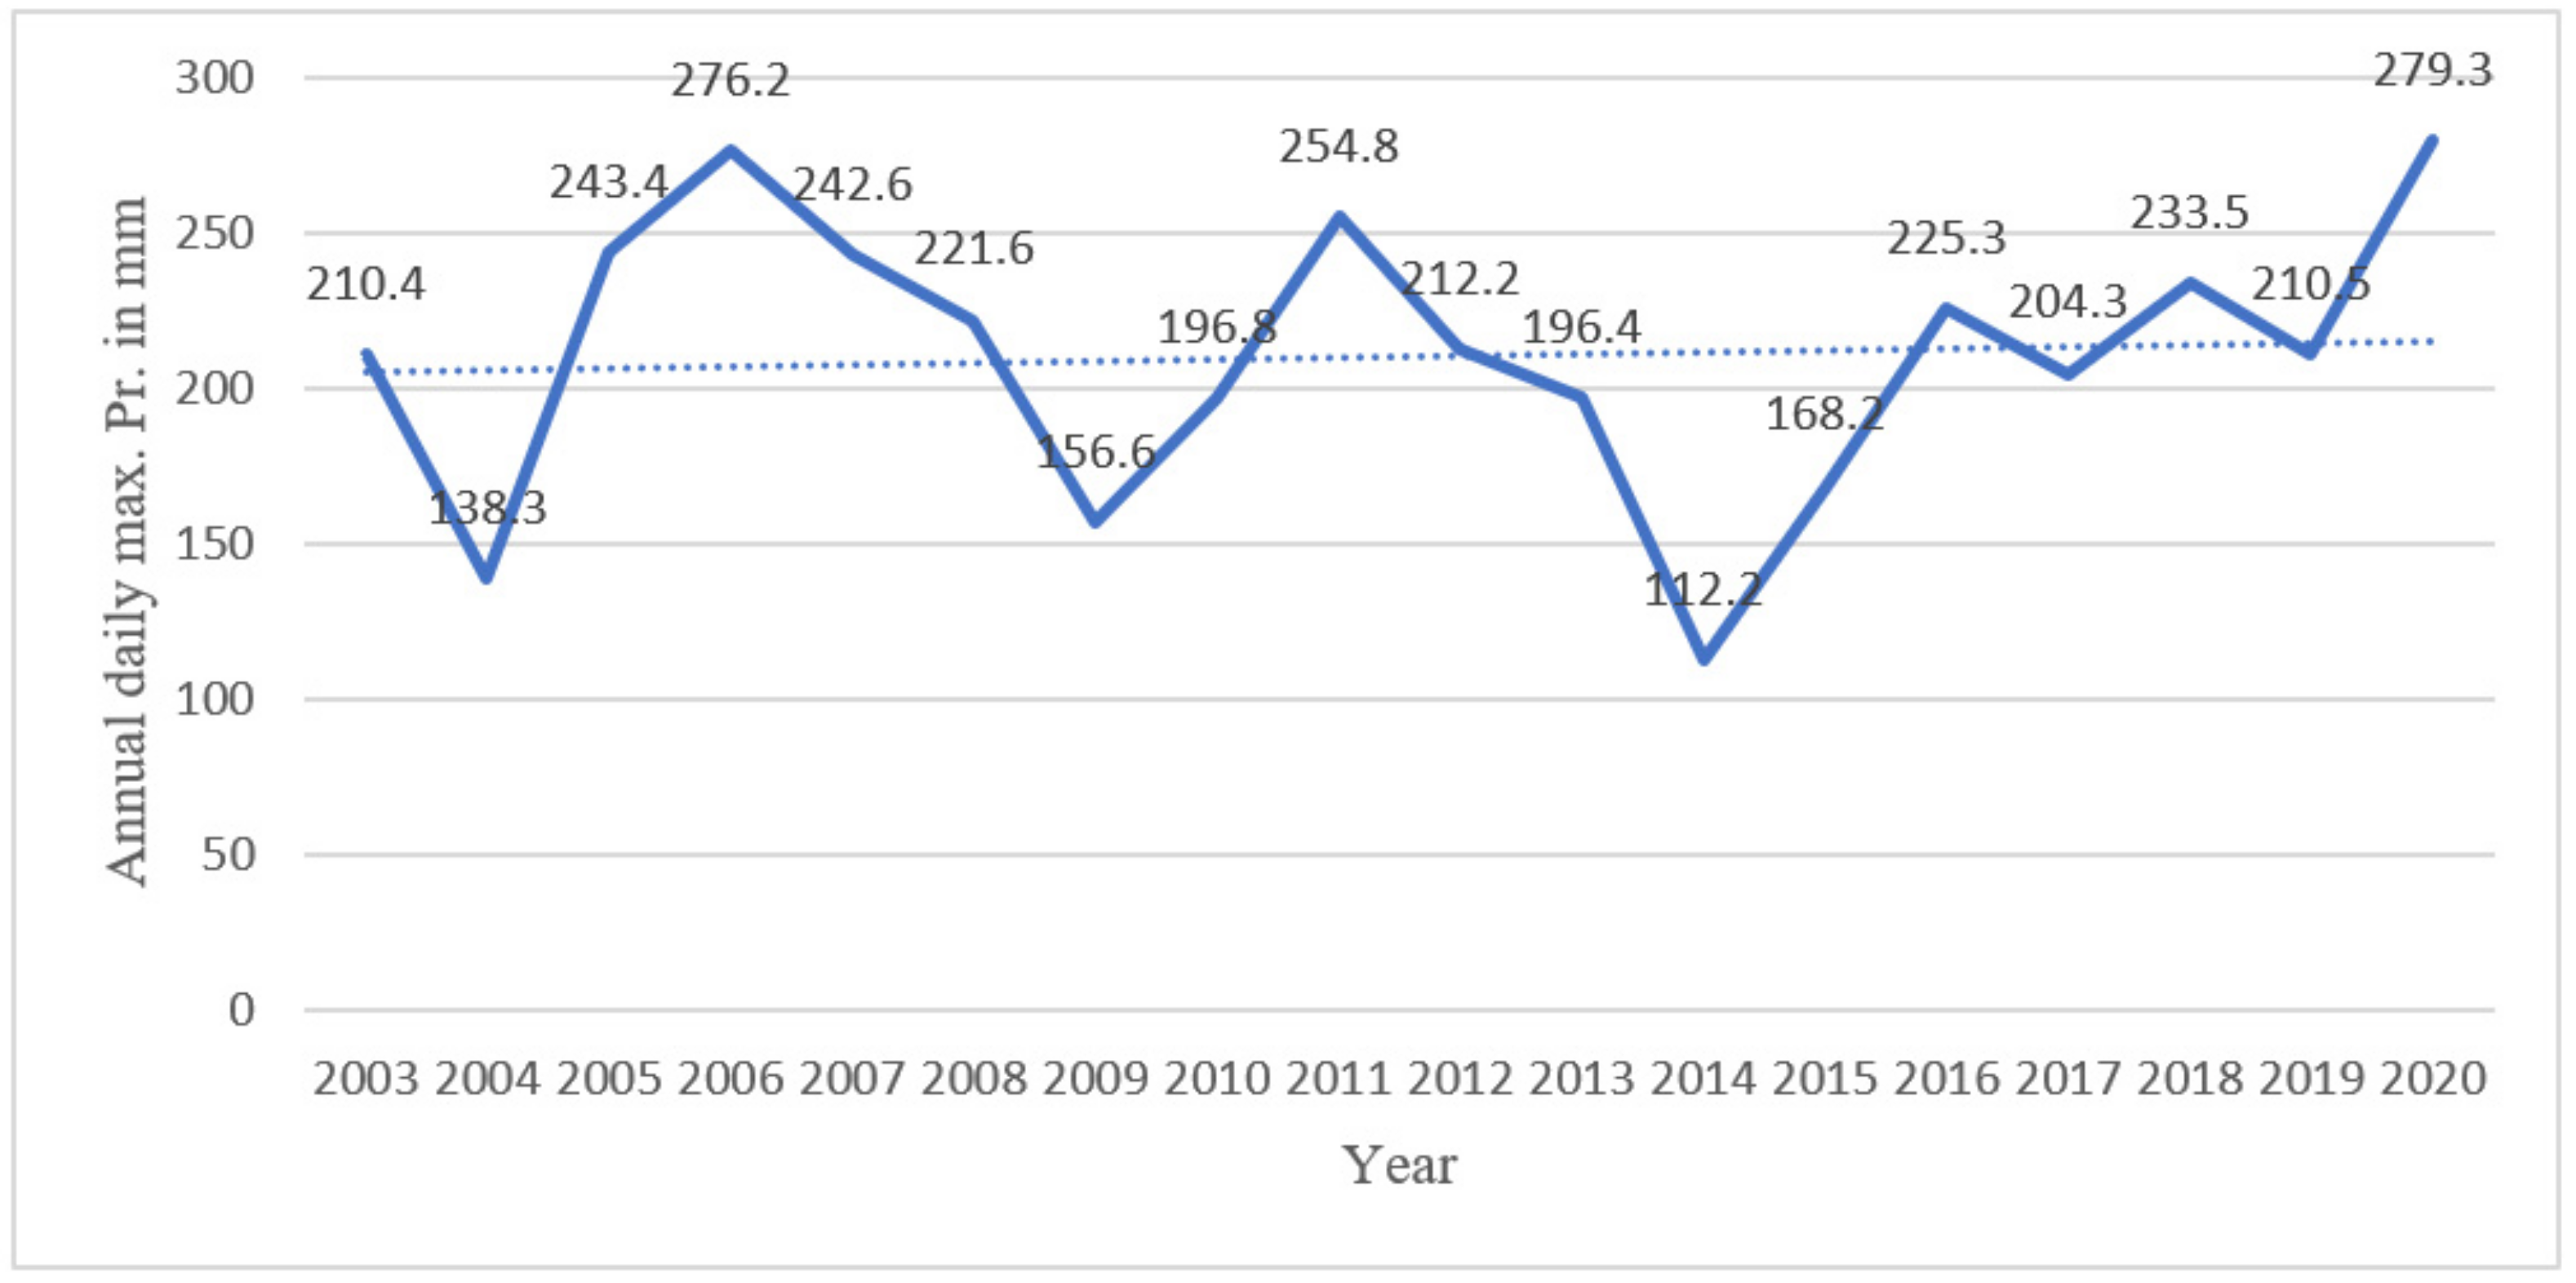
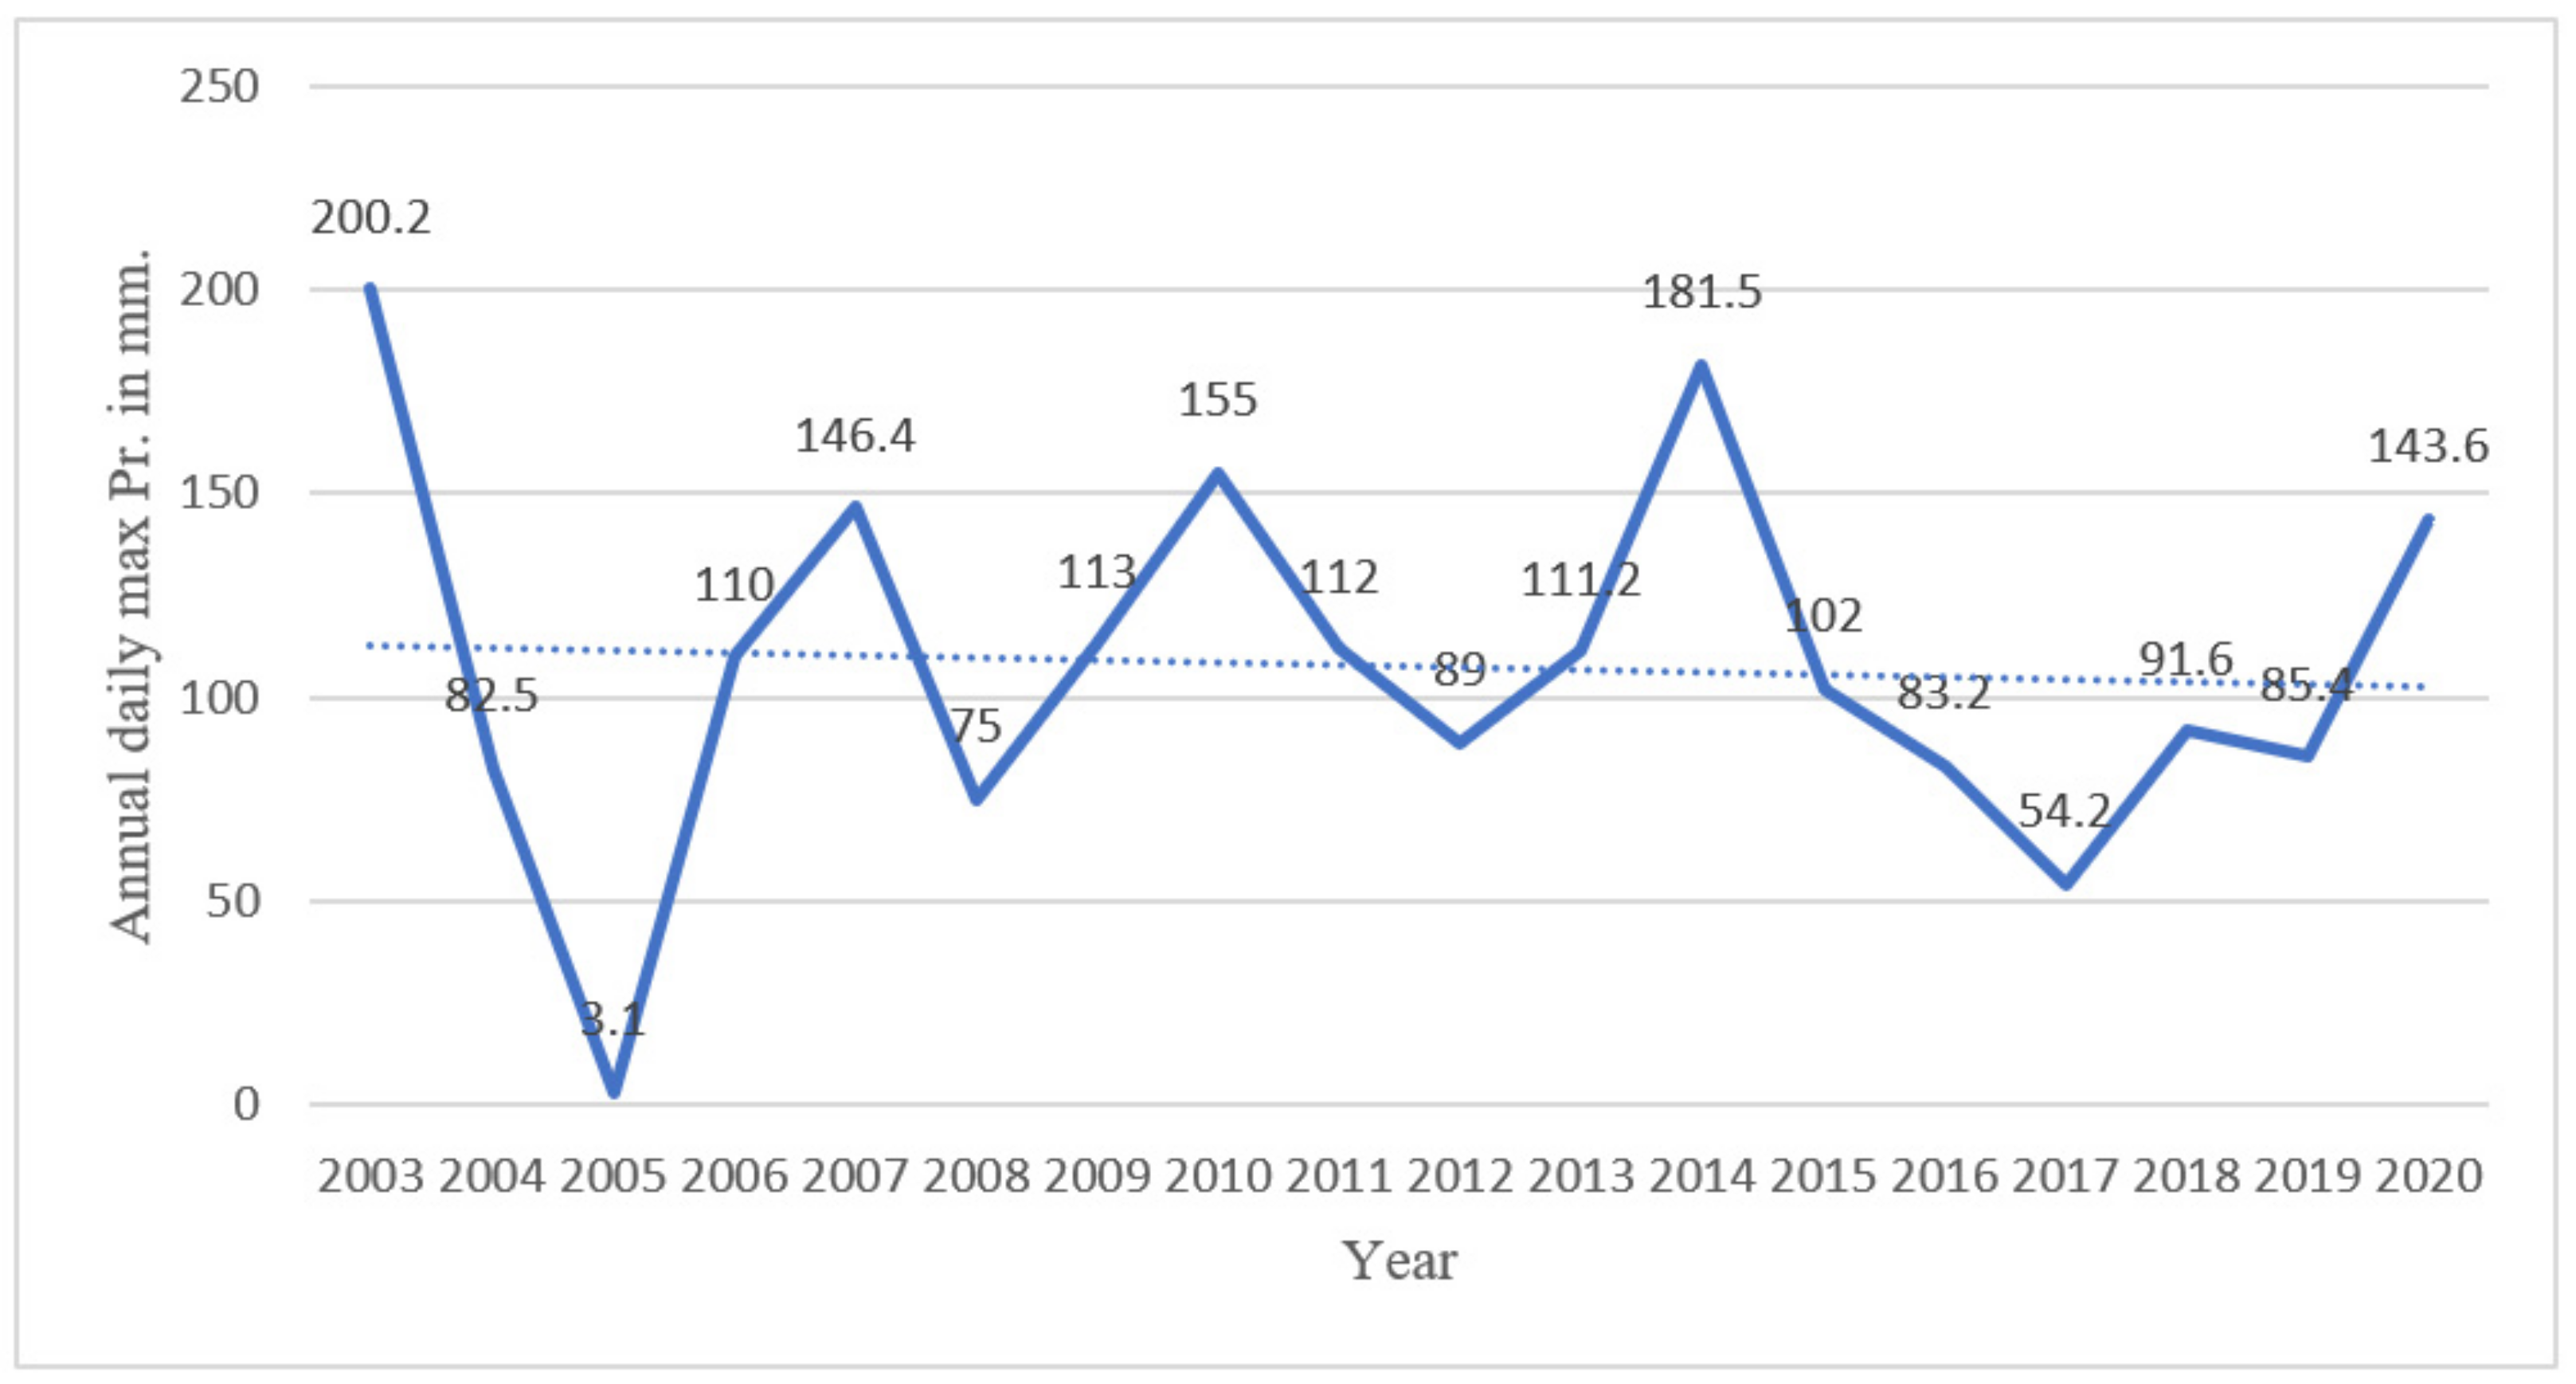
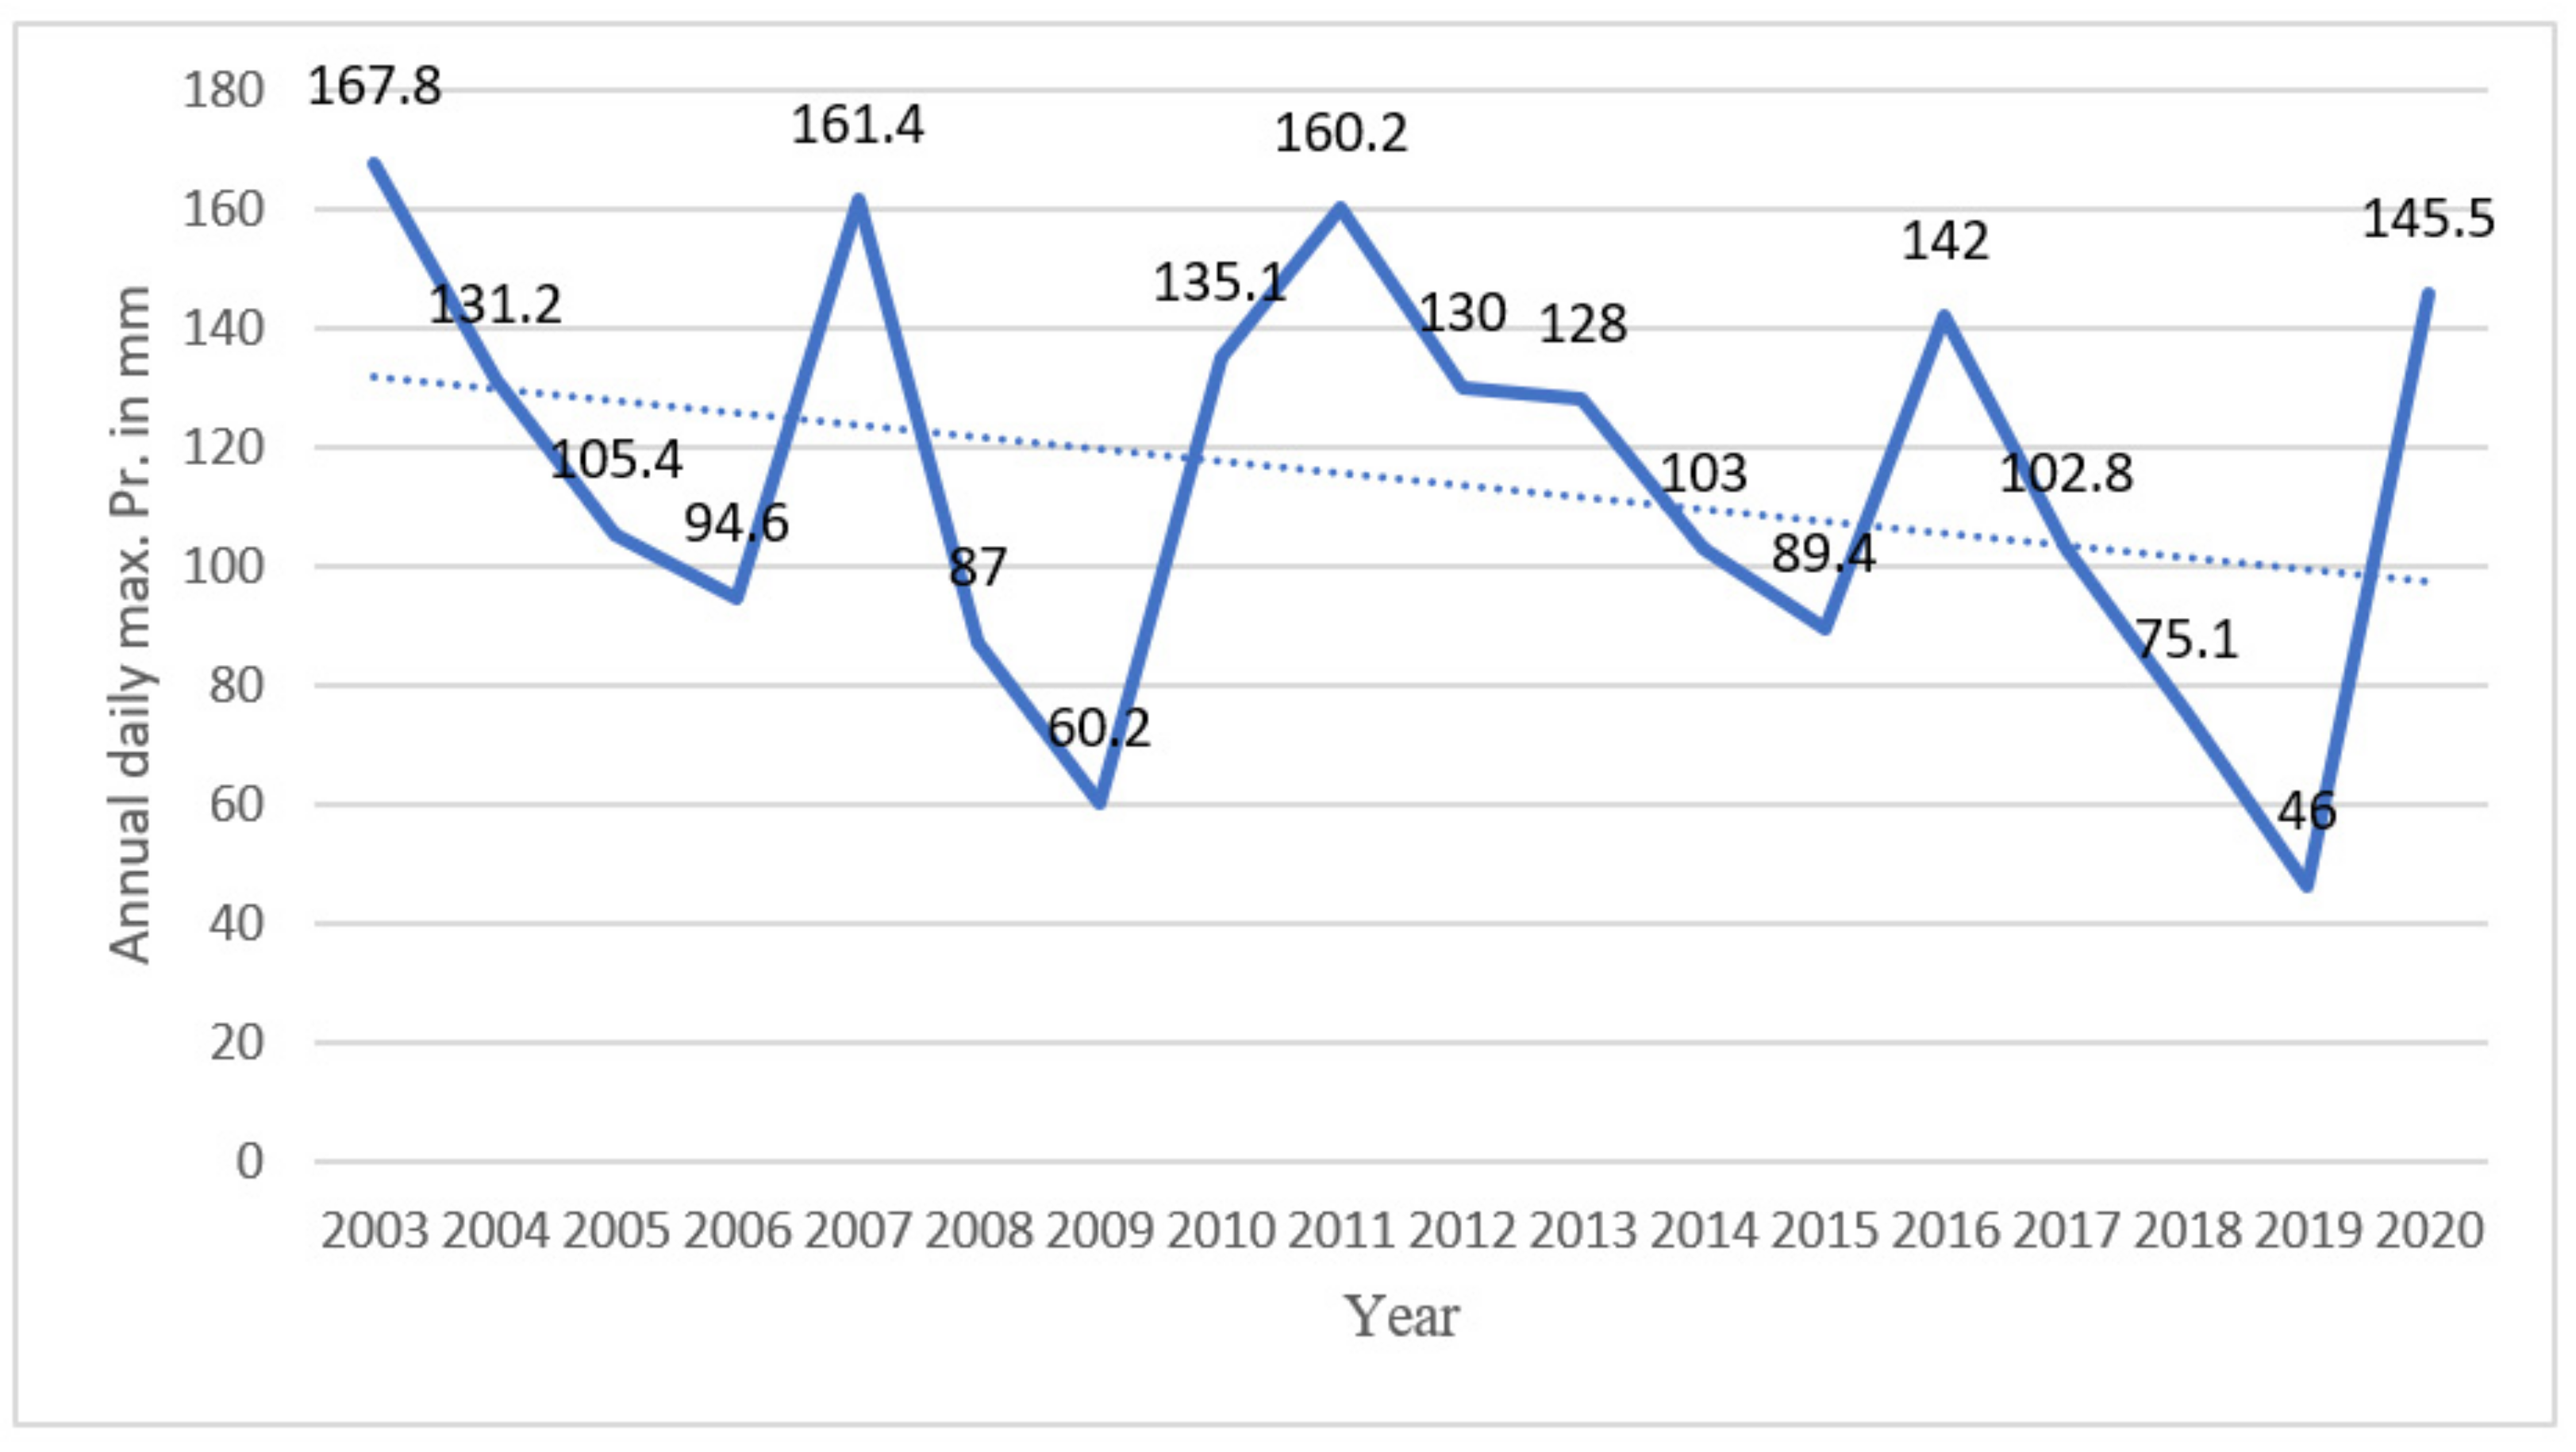
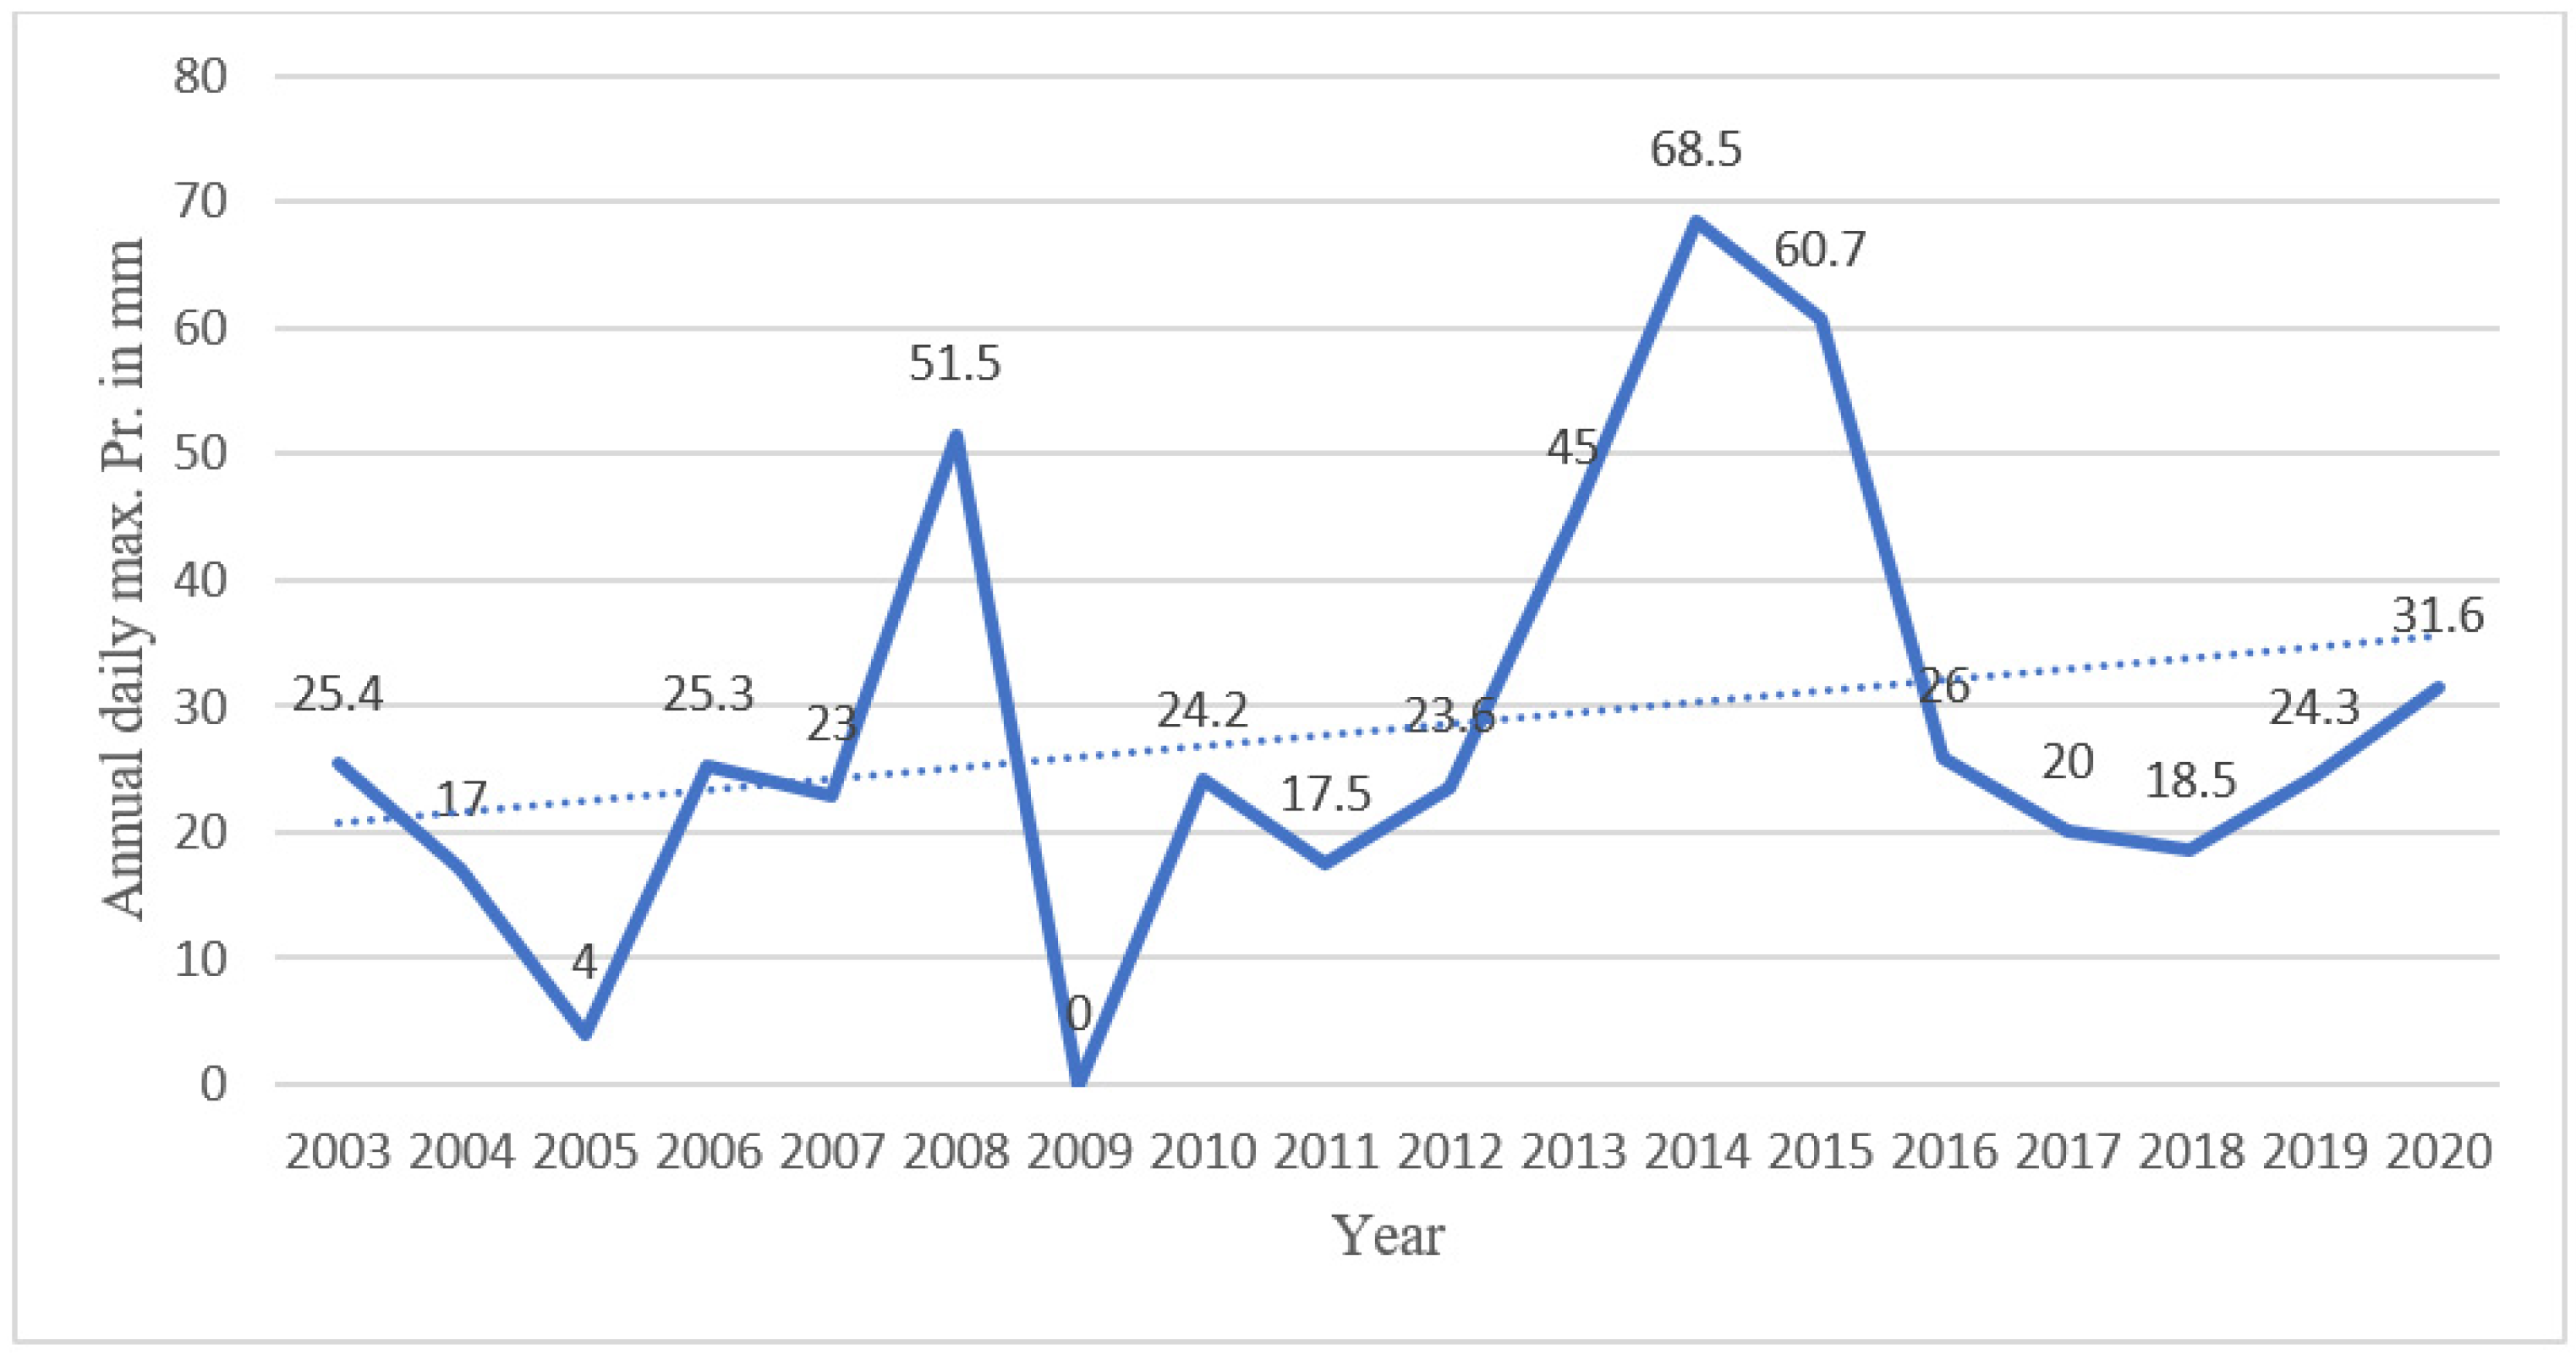
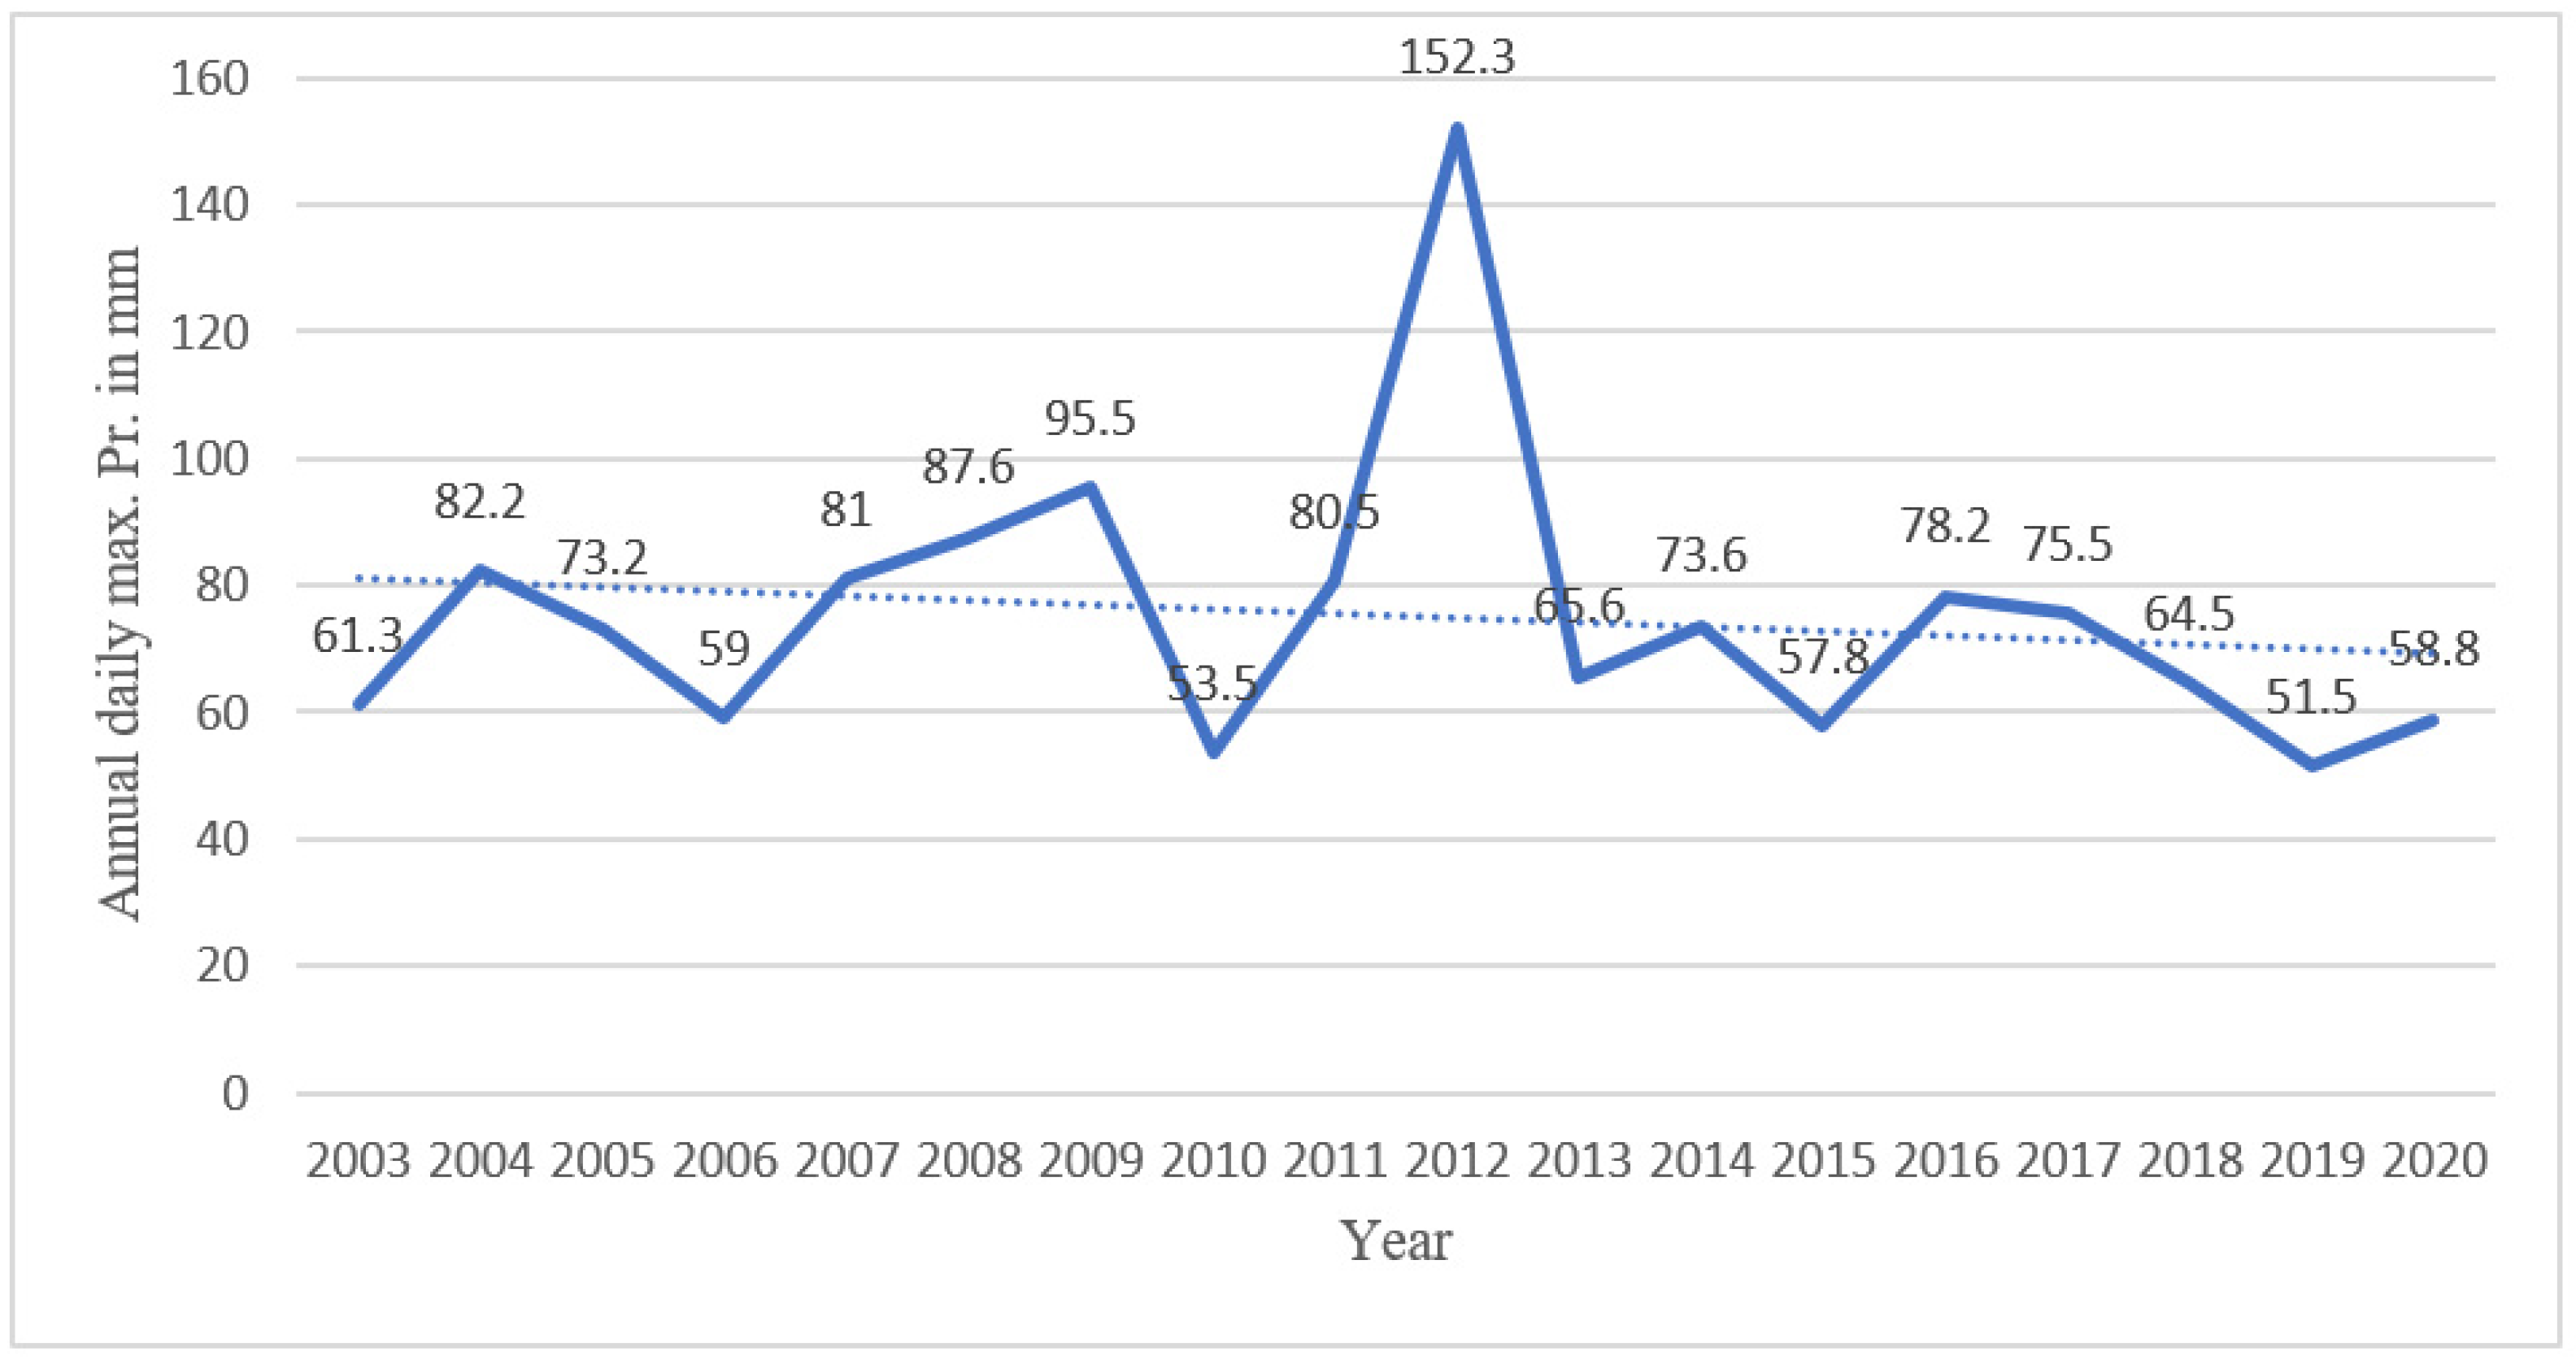
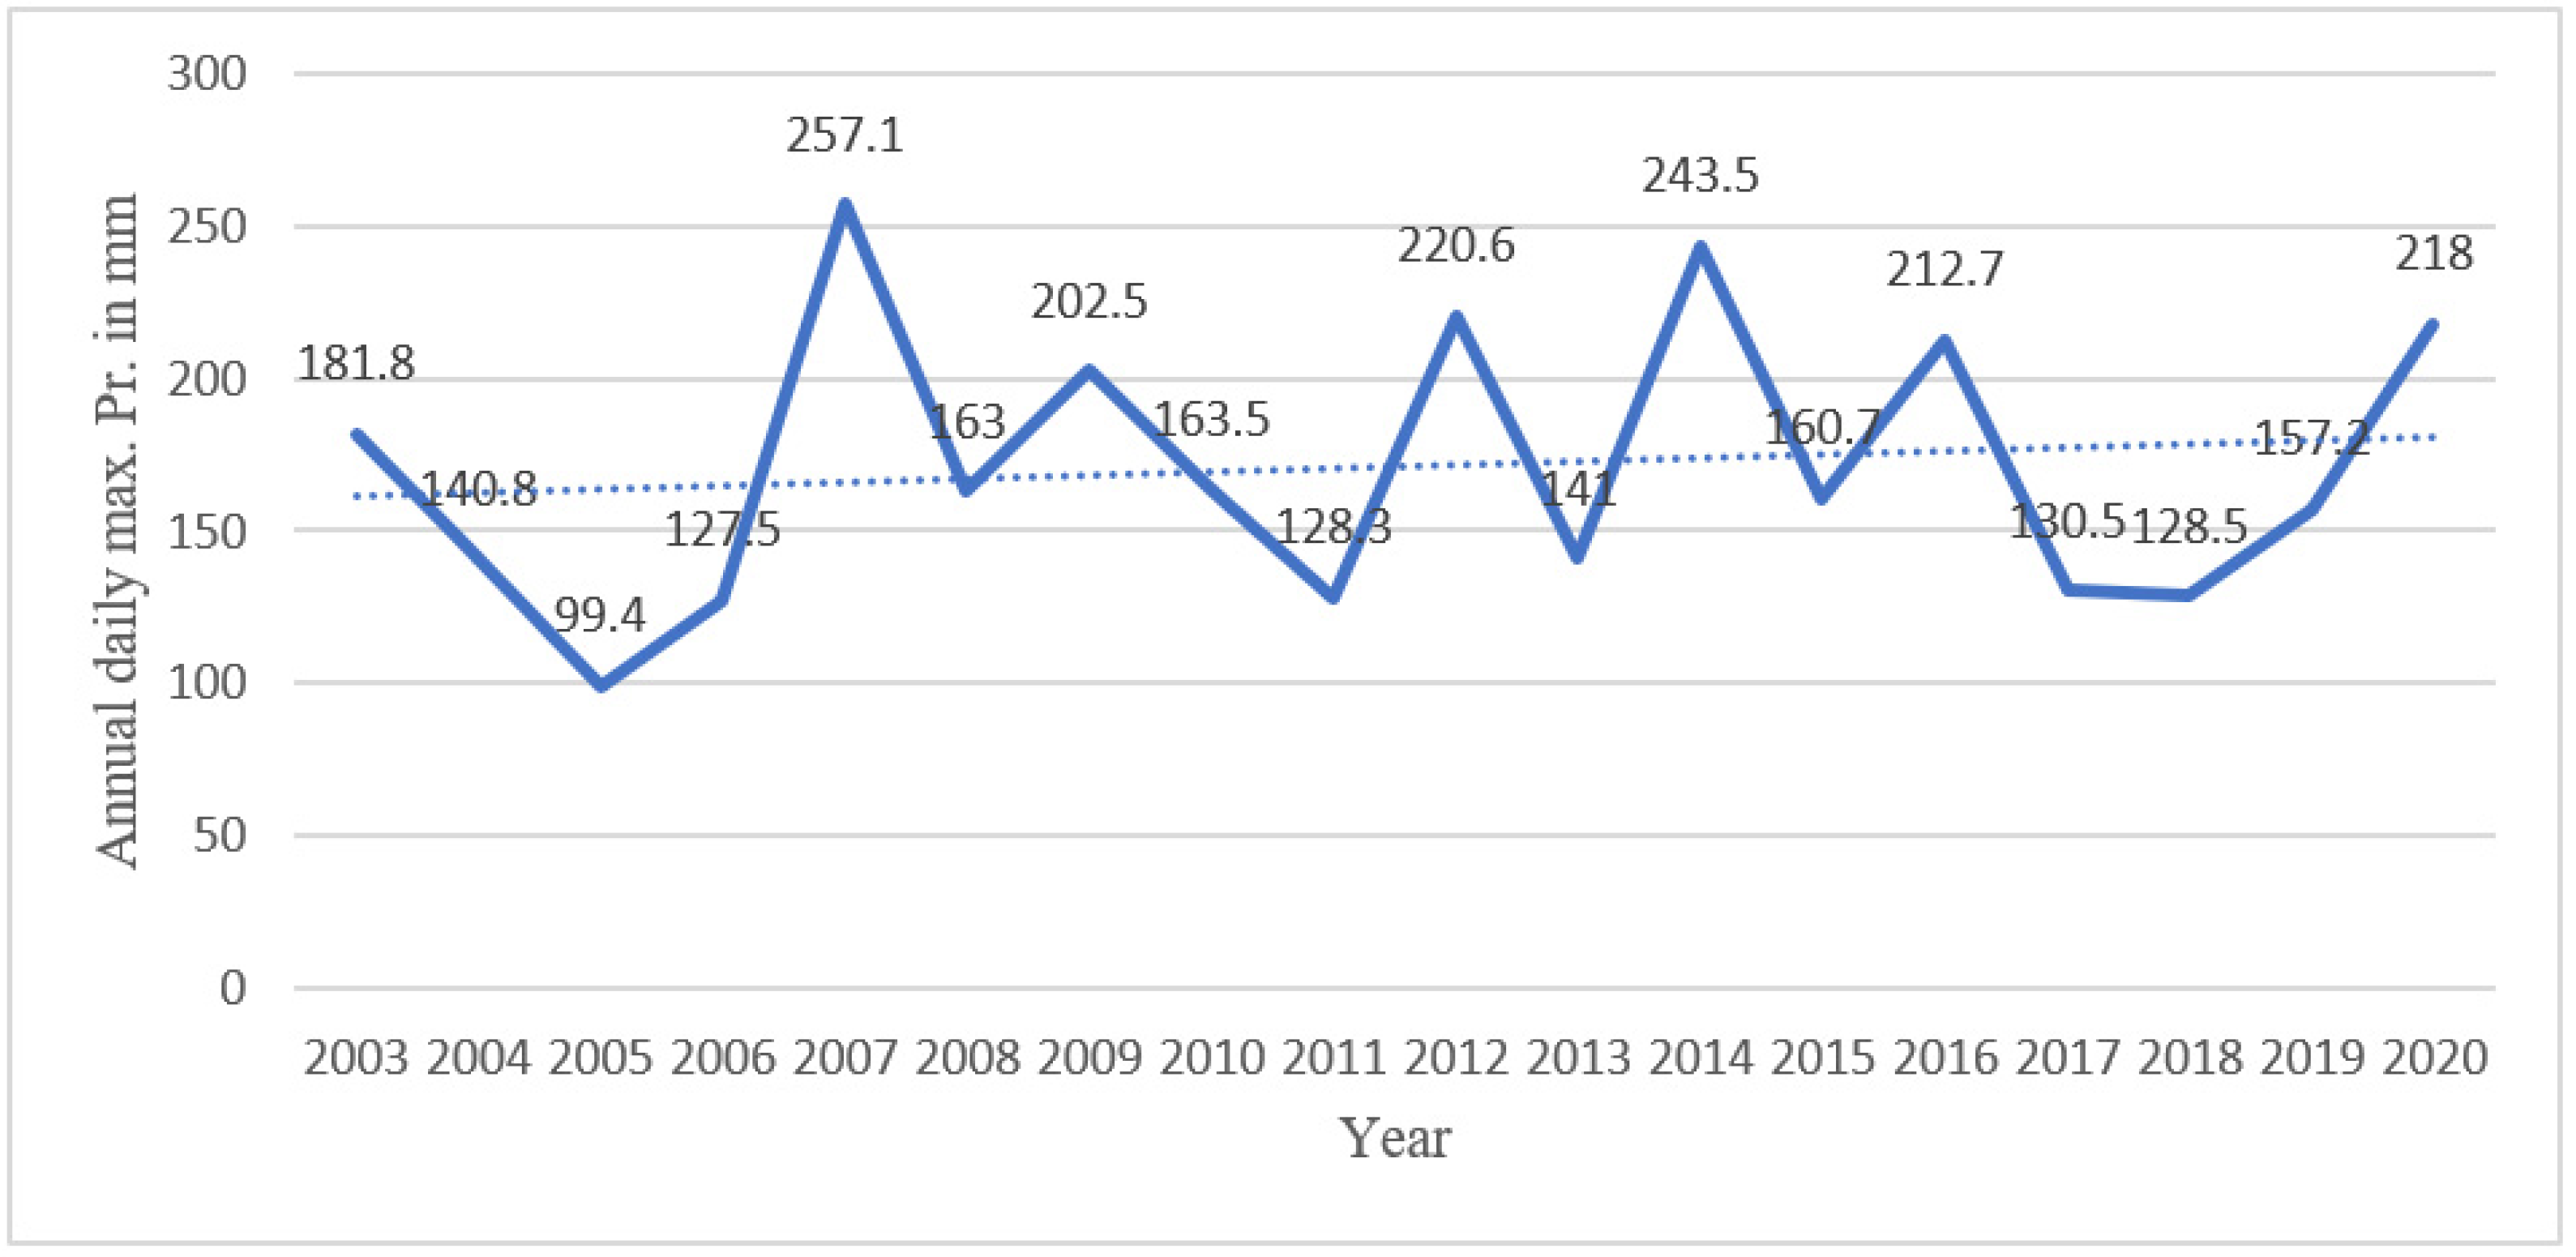
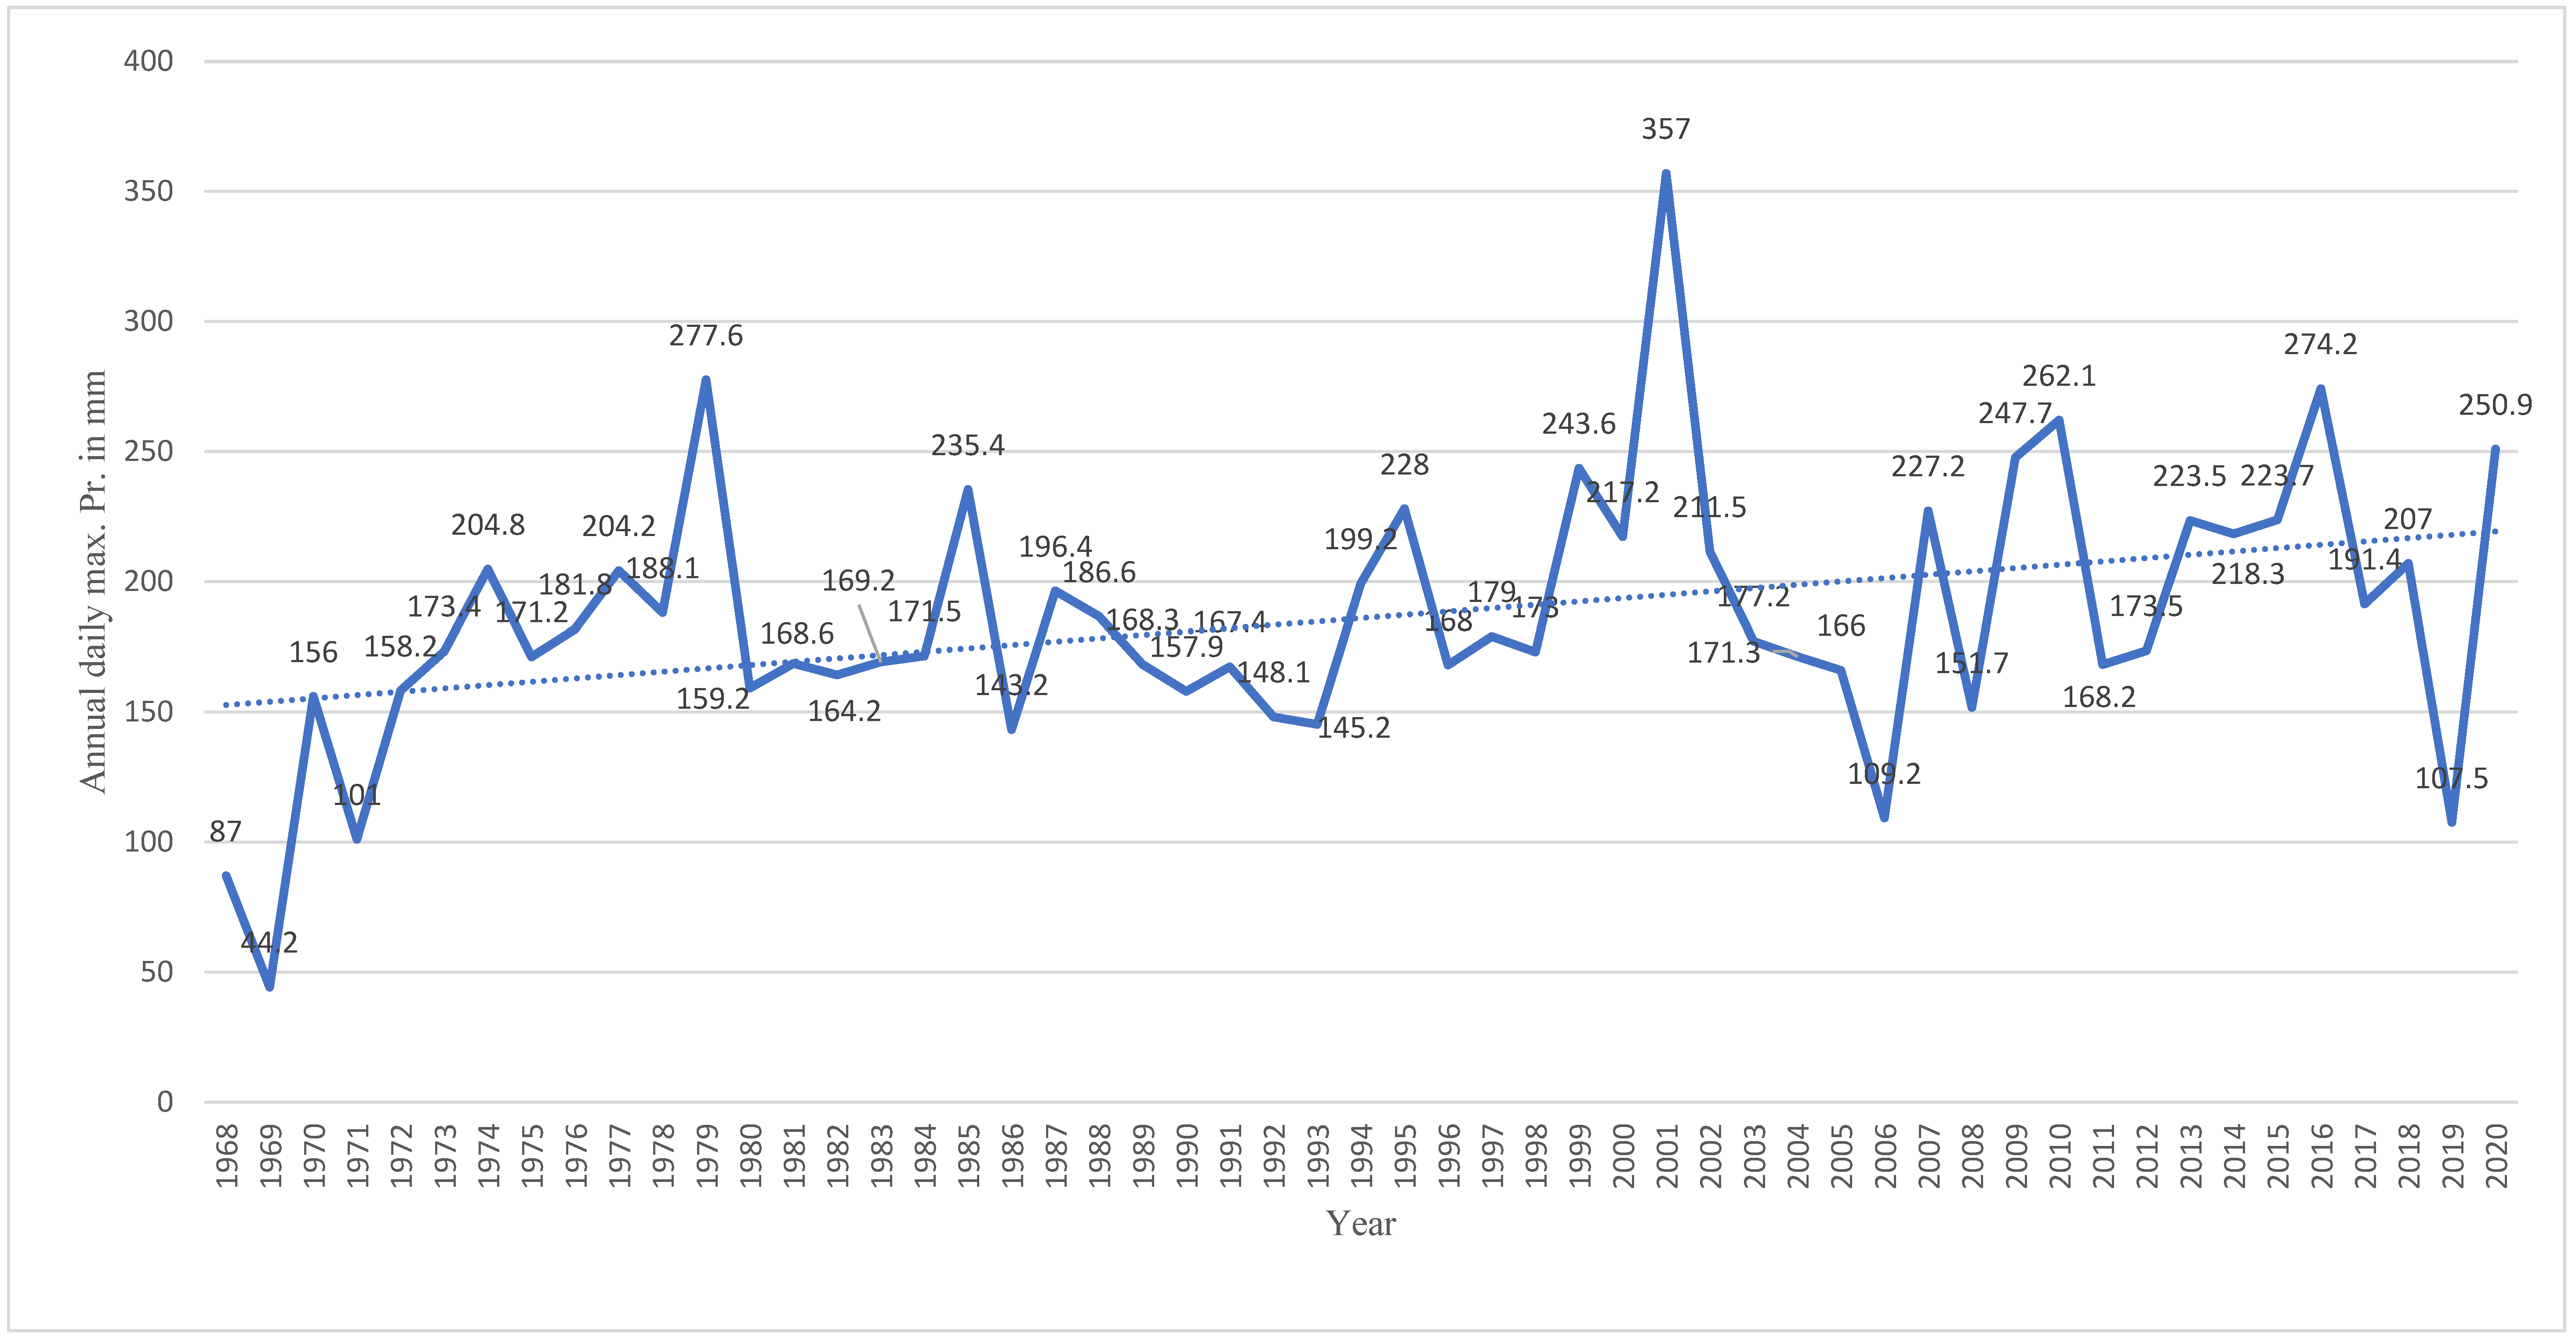
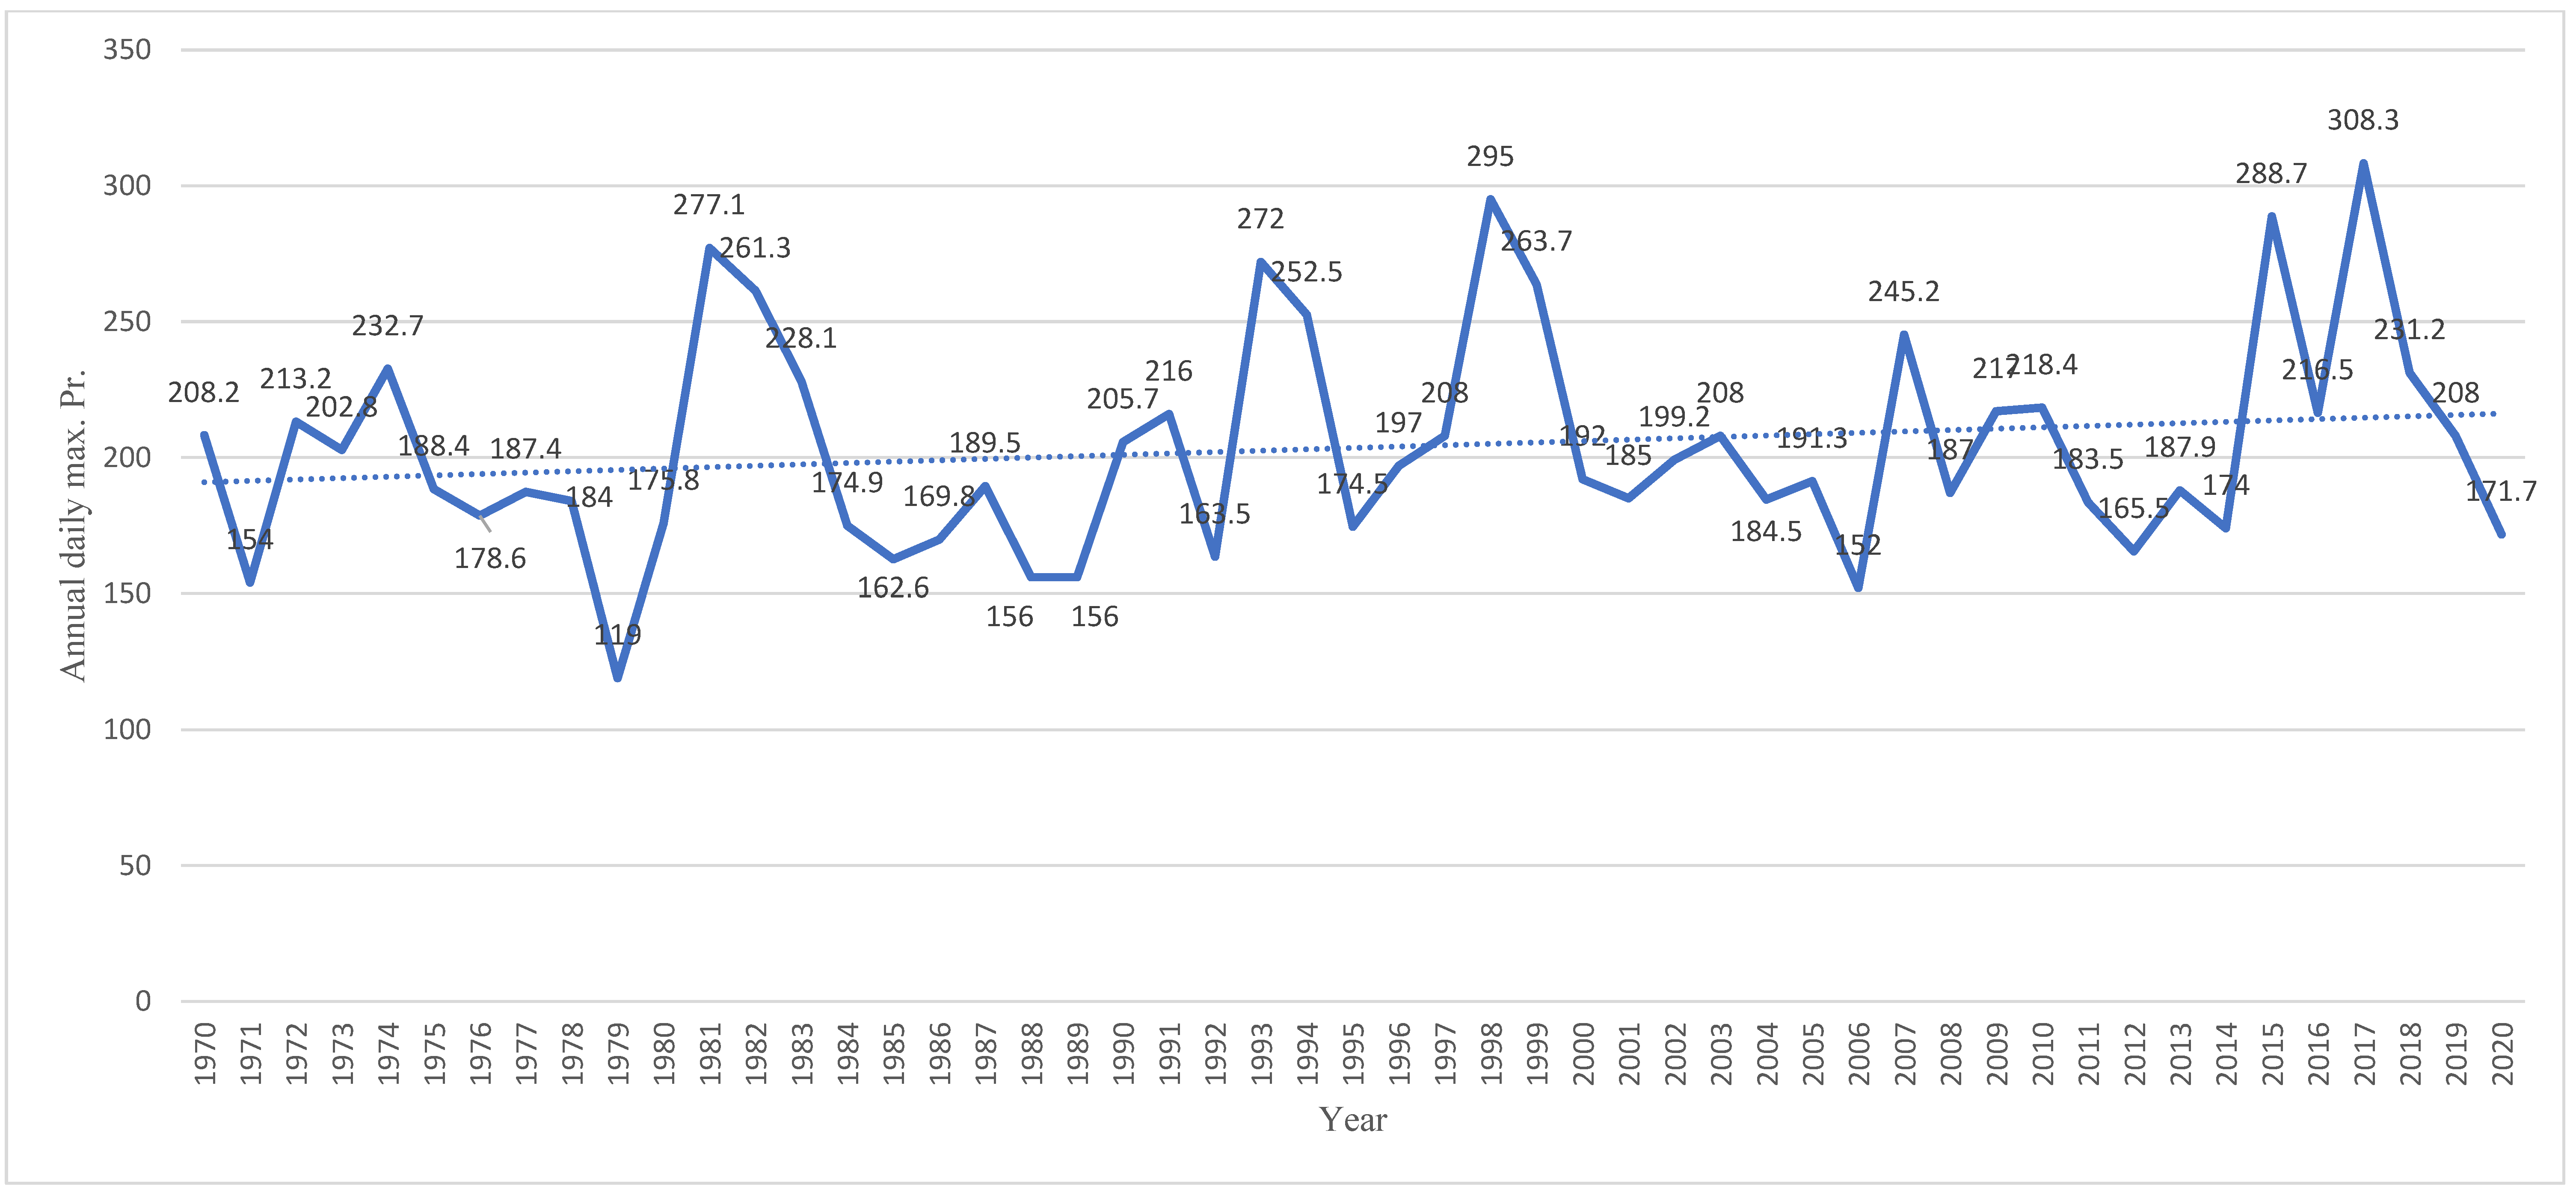
Precipitation data were collected for fifteen stations within the Gandaki Province and adjusted. The stations’ elevation ranges from 150 to 3420 m above sea level, and the reported precipitation similarly exhibited a wide range. During the research period, the recorded annual daily maximum precipitation was 357 mm at Pokhara airport stations. Figure 3 shows the trend of observed annual daily extreme precipitation from 2003 to 2020 in the Baglung and Lamjung districts of Gandaki Province.
Baglung, Bandipur, Manang Bhot, Tatopani, and Damauli were among fifteen stations that showed a decreasing trend in annual daily extreme precipitation from 2003 to 2020, whereas Kushma, Bobang, Beluwa Girwari, Dumkauli, Khudi Bazar, Gorkha, Jomsom, Syangja, Pokhara Airport, and Lumle demonstrated the increase in precipitation. Lumle station’s data were analyzed for 51 years, and for the Pokhara airport station, we analyzed 53 years of data (see Appendix A, Figure A1, Figure A2, Figure A3, Figure A4, Figure A5, Figure A6, Figure A7, Figure A8, Figure A9, Figure A10, Figure A11, Figure A12, Figure A13 and Figure A14).
3.2. Future Climate Projection
This study looked at relevant extreme indices that were “user-relevant” for assessing potential future changes in extreme events. The indices for the extreme-event analysis were calculated over three 20-year periods, using the two GCMs’ CMIP6 climate projections. For both GCMs, the first 20 years are the base period, or the control run from 1995 to 1914. The effects of climate change on extreme events were projected for the near future (2021–2040) and the far future (2081–2100). The projections of two GCMs were found to be slightly different from the rest, and it is believed that such discrepancy could be partly due to the raw data resolution, which was relatively coarse compared to the raw data resolution for the base period and projections, but also to the overall extreme precipitation increases over Gandaki Province in comparison to the base period. Future projections from various indices are further discussed.
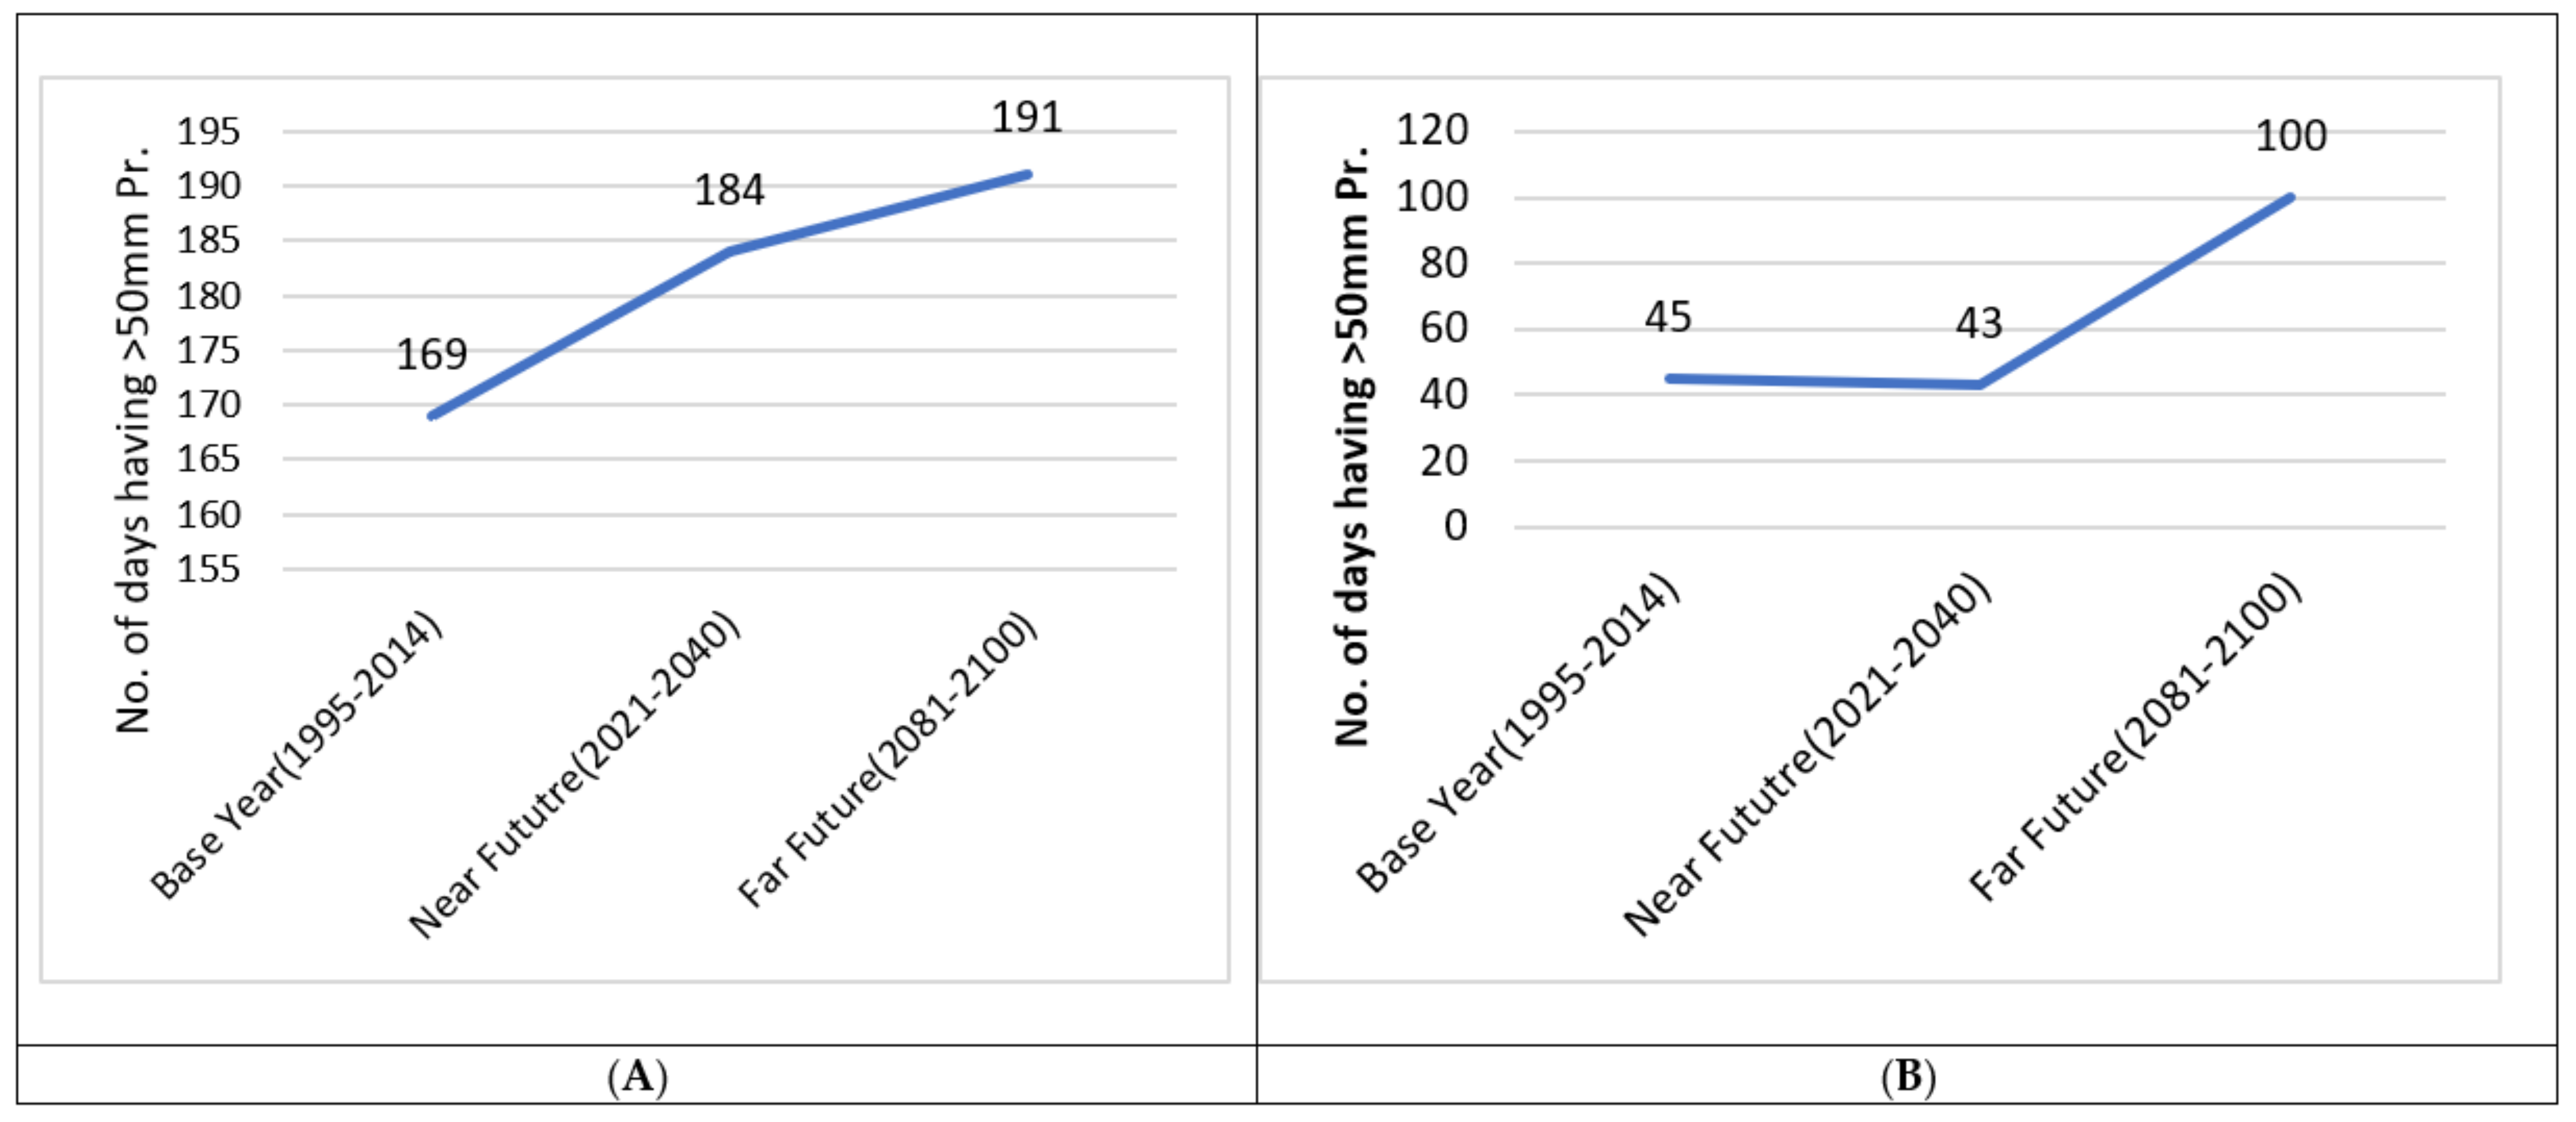
3.2.1. R50 mm Index
The R50 mm index, also known as really heavy precipitation days, is the number of days in a certain period when the daily precipitation was greater than 50 mm. In comparison to the base period for the SSP2–4.5 scenarios of BCC-CSM2-MR analyzed, the R50 mm was increased by about 9% and 13% in the near future (2021–2040) and far future (2081–2100), respectively (see Figure 4A). On the other hand, from the model MRI-ESM2-0, it is projected to decrease by 4% in the near future and dramatically increase by 122% in the far future (2081–2100) (see Figure 4B).
3.2.2. R100 mm Index
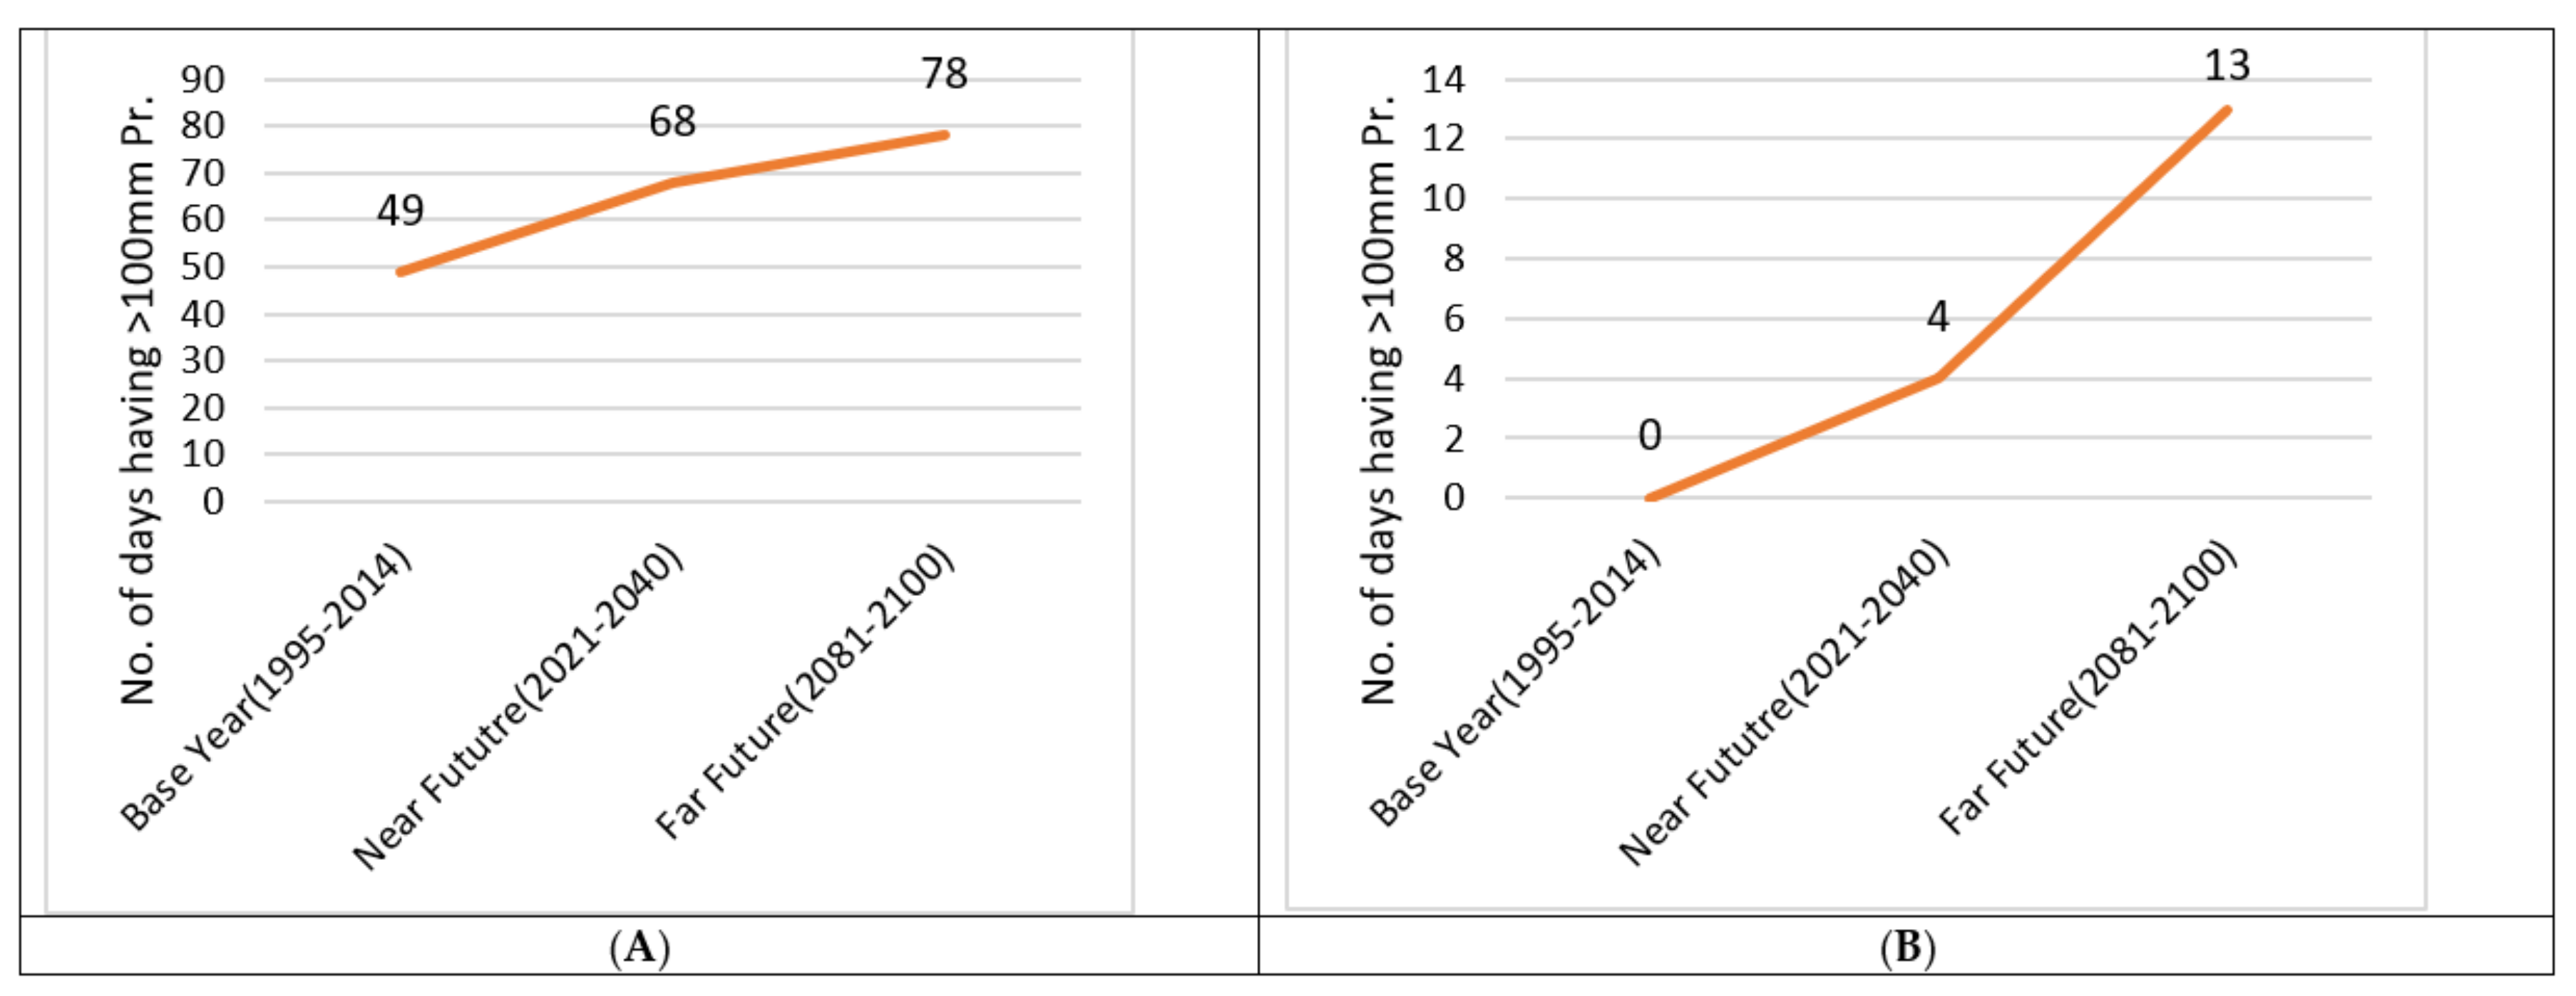
The R100 mm index, also known as very heavy precipitation days, counts the number of days in a given period when the daily precipitation exceeds 100 mm. Figure 5A shows that the R100 mm was increased by around 38.7% and 60% in the near future and far future, respectively, with respect to the base year, from the BCC-CSM2-MR model. According to the MRI-ESM2-0 model, there was no precipitation observed in the base year, while the near future showed 4 days and the far future indicated 13 days (see Figure 5B). We can conclude from this result that both models predicted an increase in very heavy precipitation days in the future, i.e., 2081–2100.
3.2.3. RX1day Index
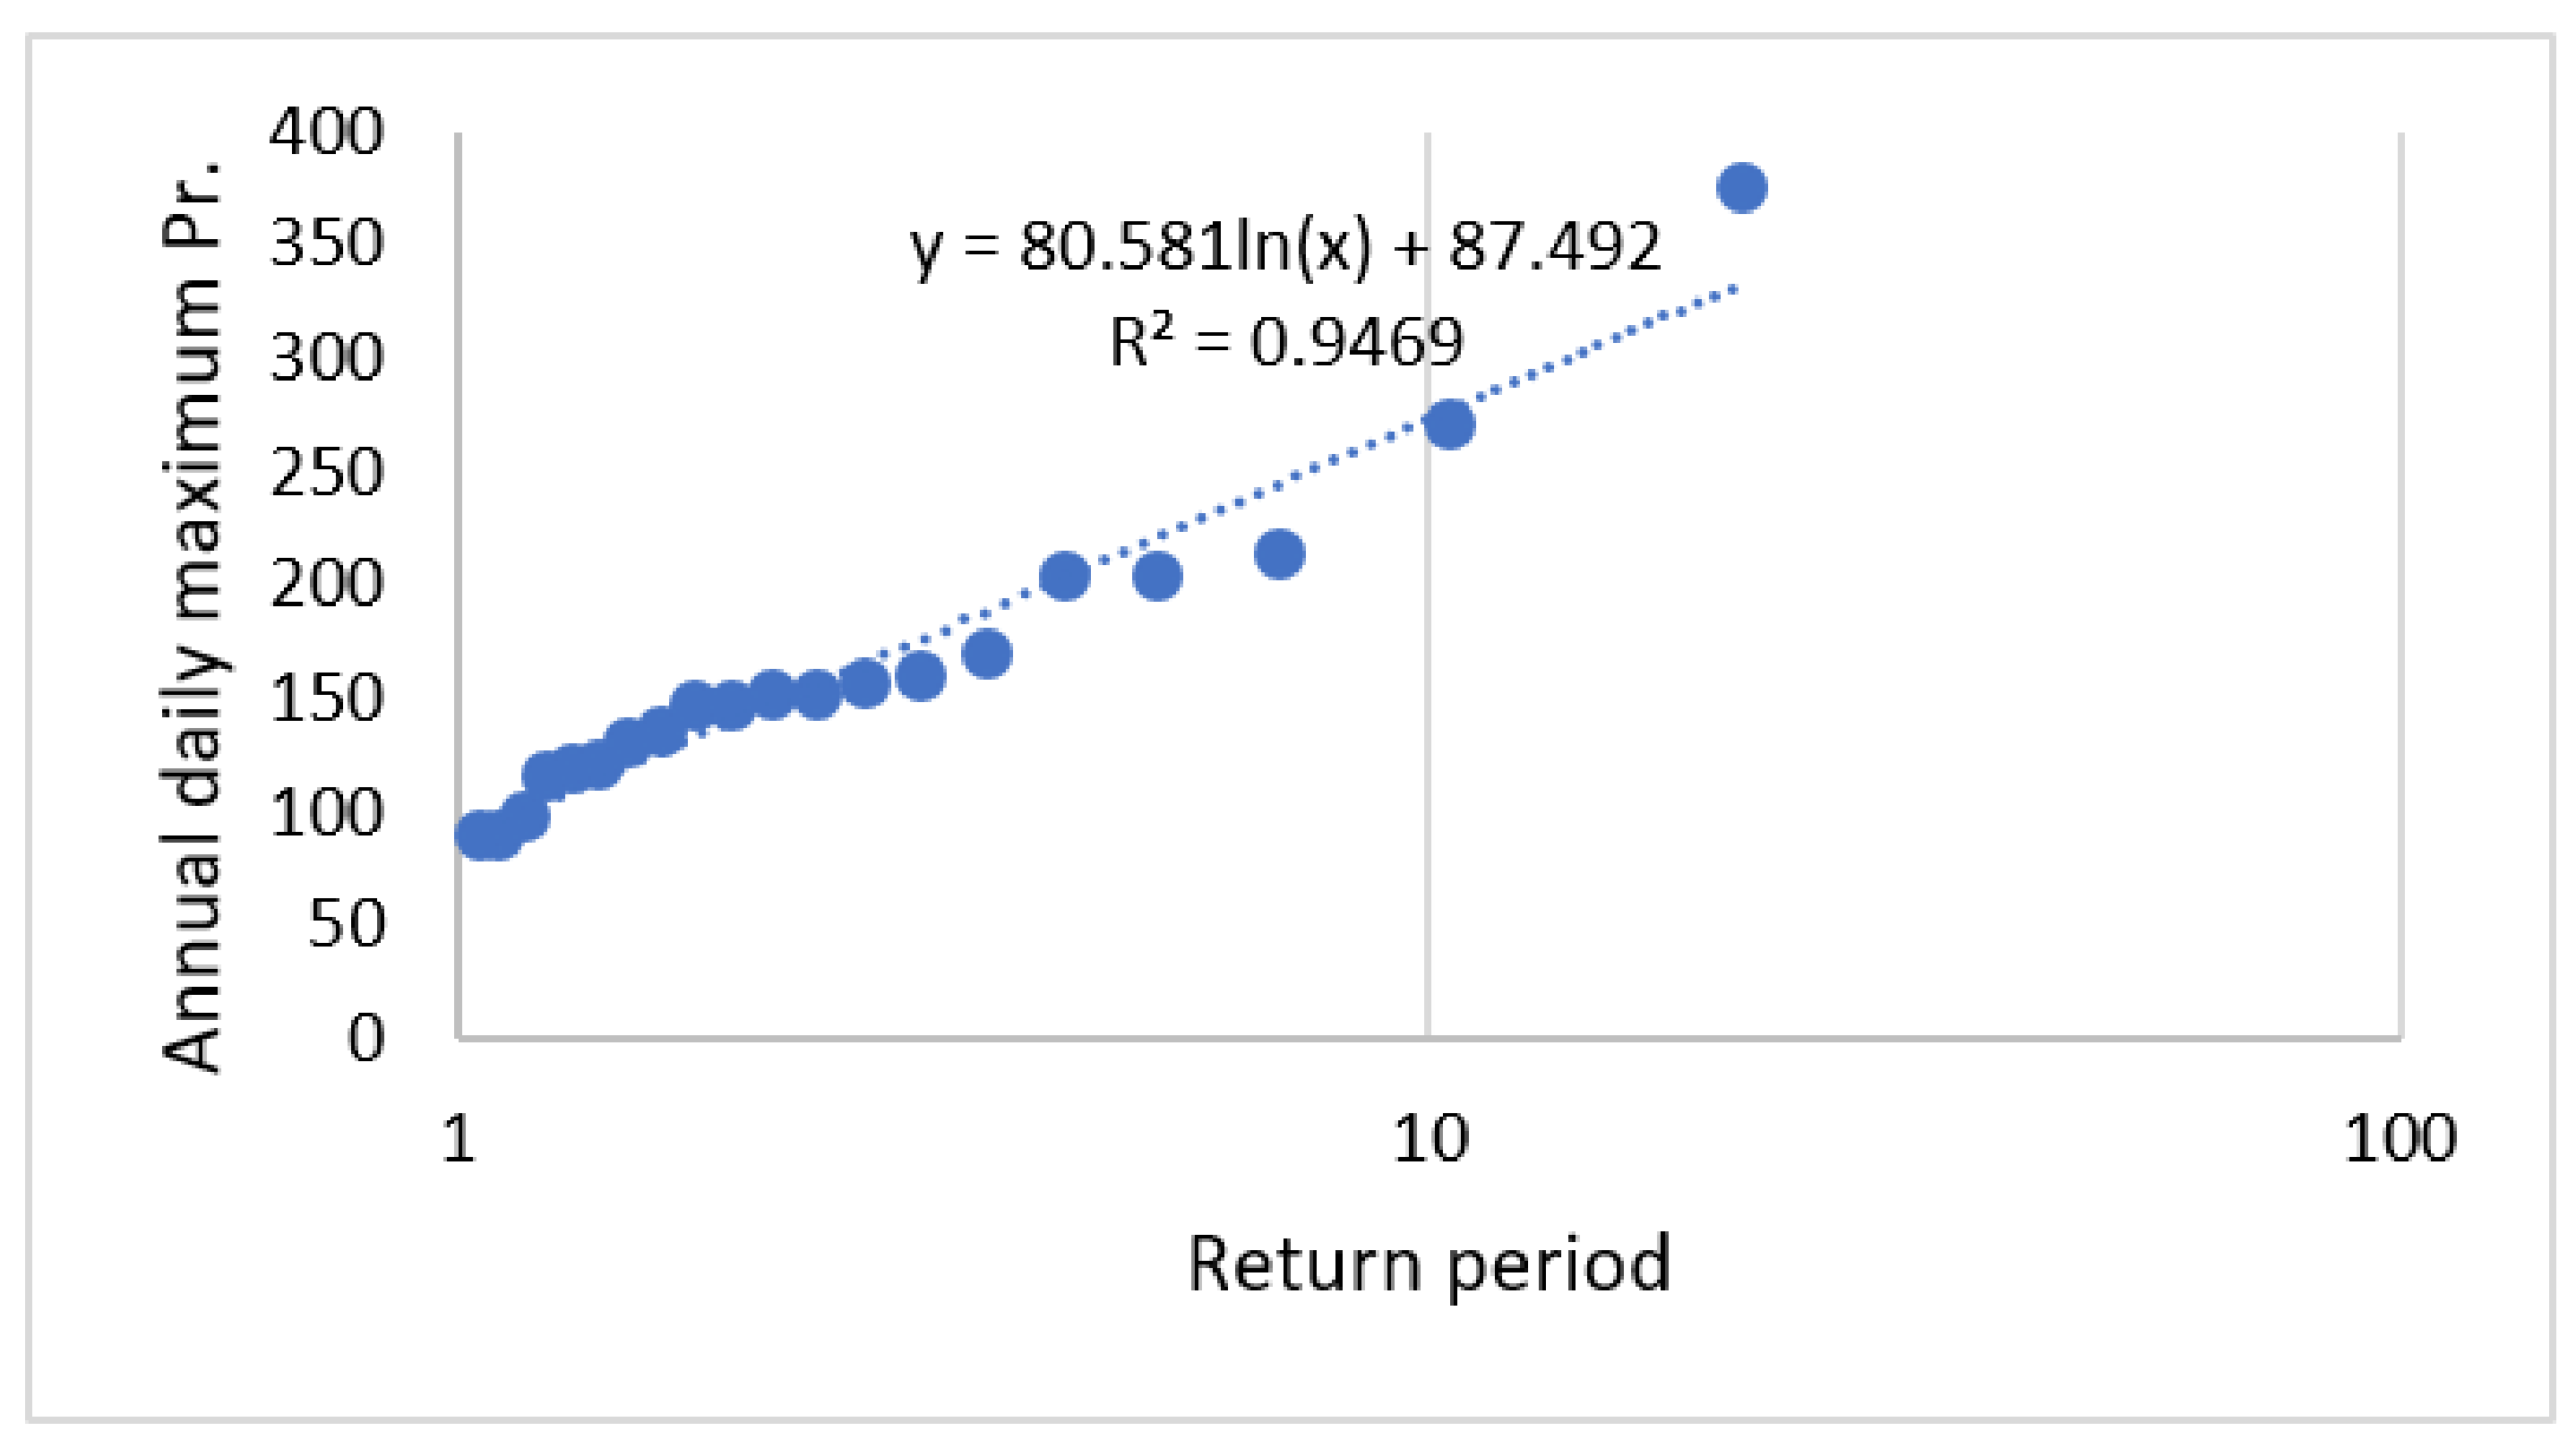
The RX1day index represents the maximum daily precipitation within a given period. The return period was utilized to determine the extreme precipitation projection in this index. Equation (1) can be used to calculate the return period by using the graphical analysis:
where n = No. of years, m = rank of precipitation, and T = return period.
T = (n + 1)/m
We may discover the equation by plotting the return period on the x-axis and the yearly daily maximum precipitation in descending order on the y-axis in logarithmic form. From this equation, we can estimate future precipitation. Figure 6 shows the sample of the logarithmic equation for the BCC-CSM2-MR model in the base year.
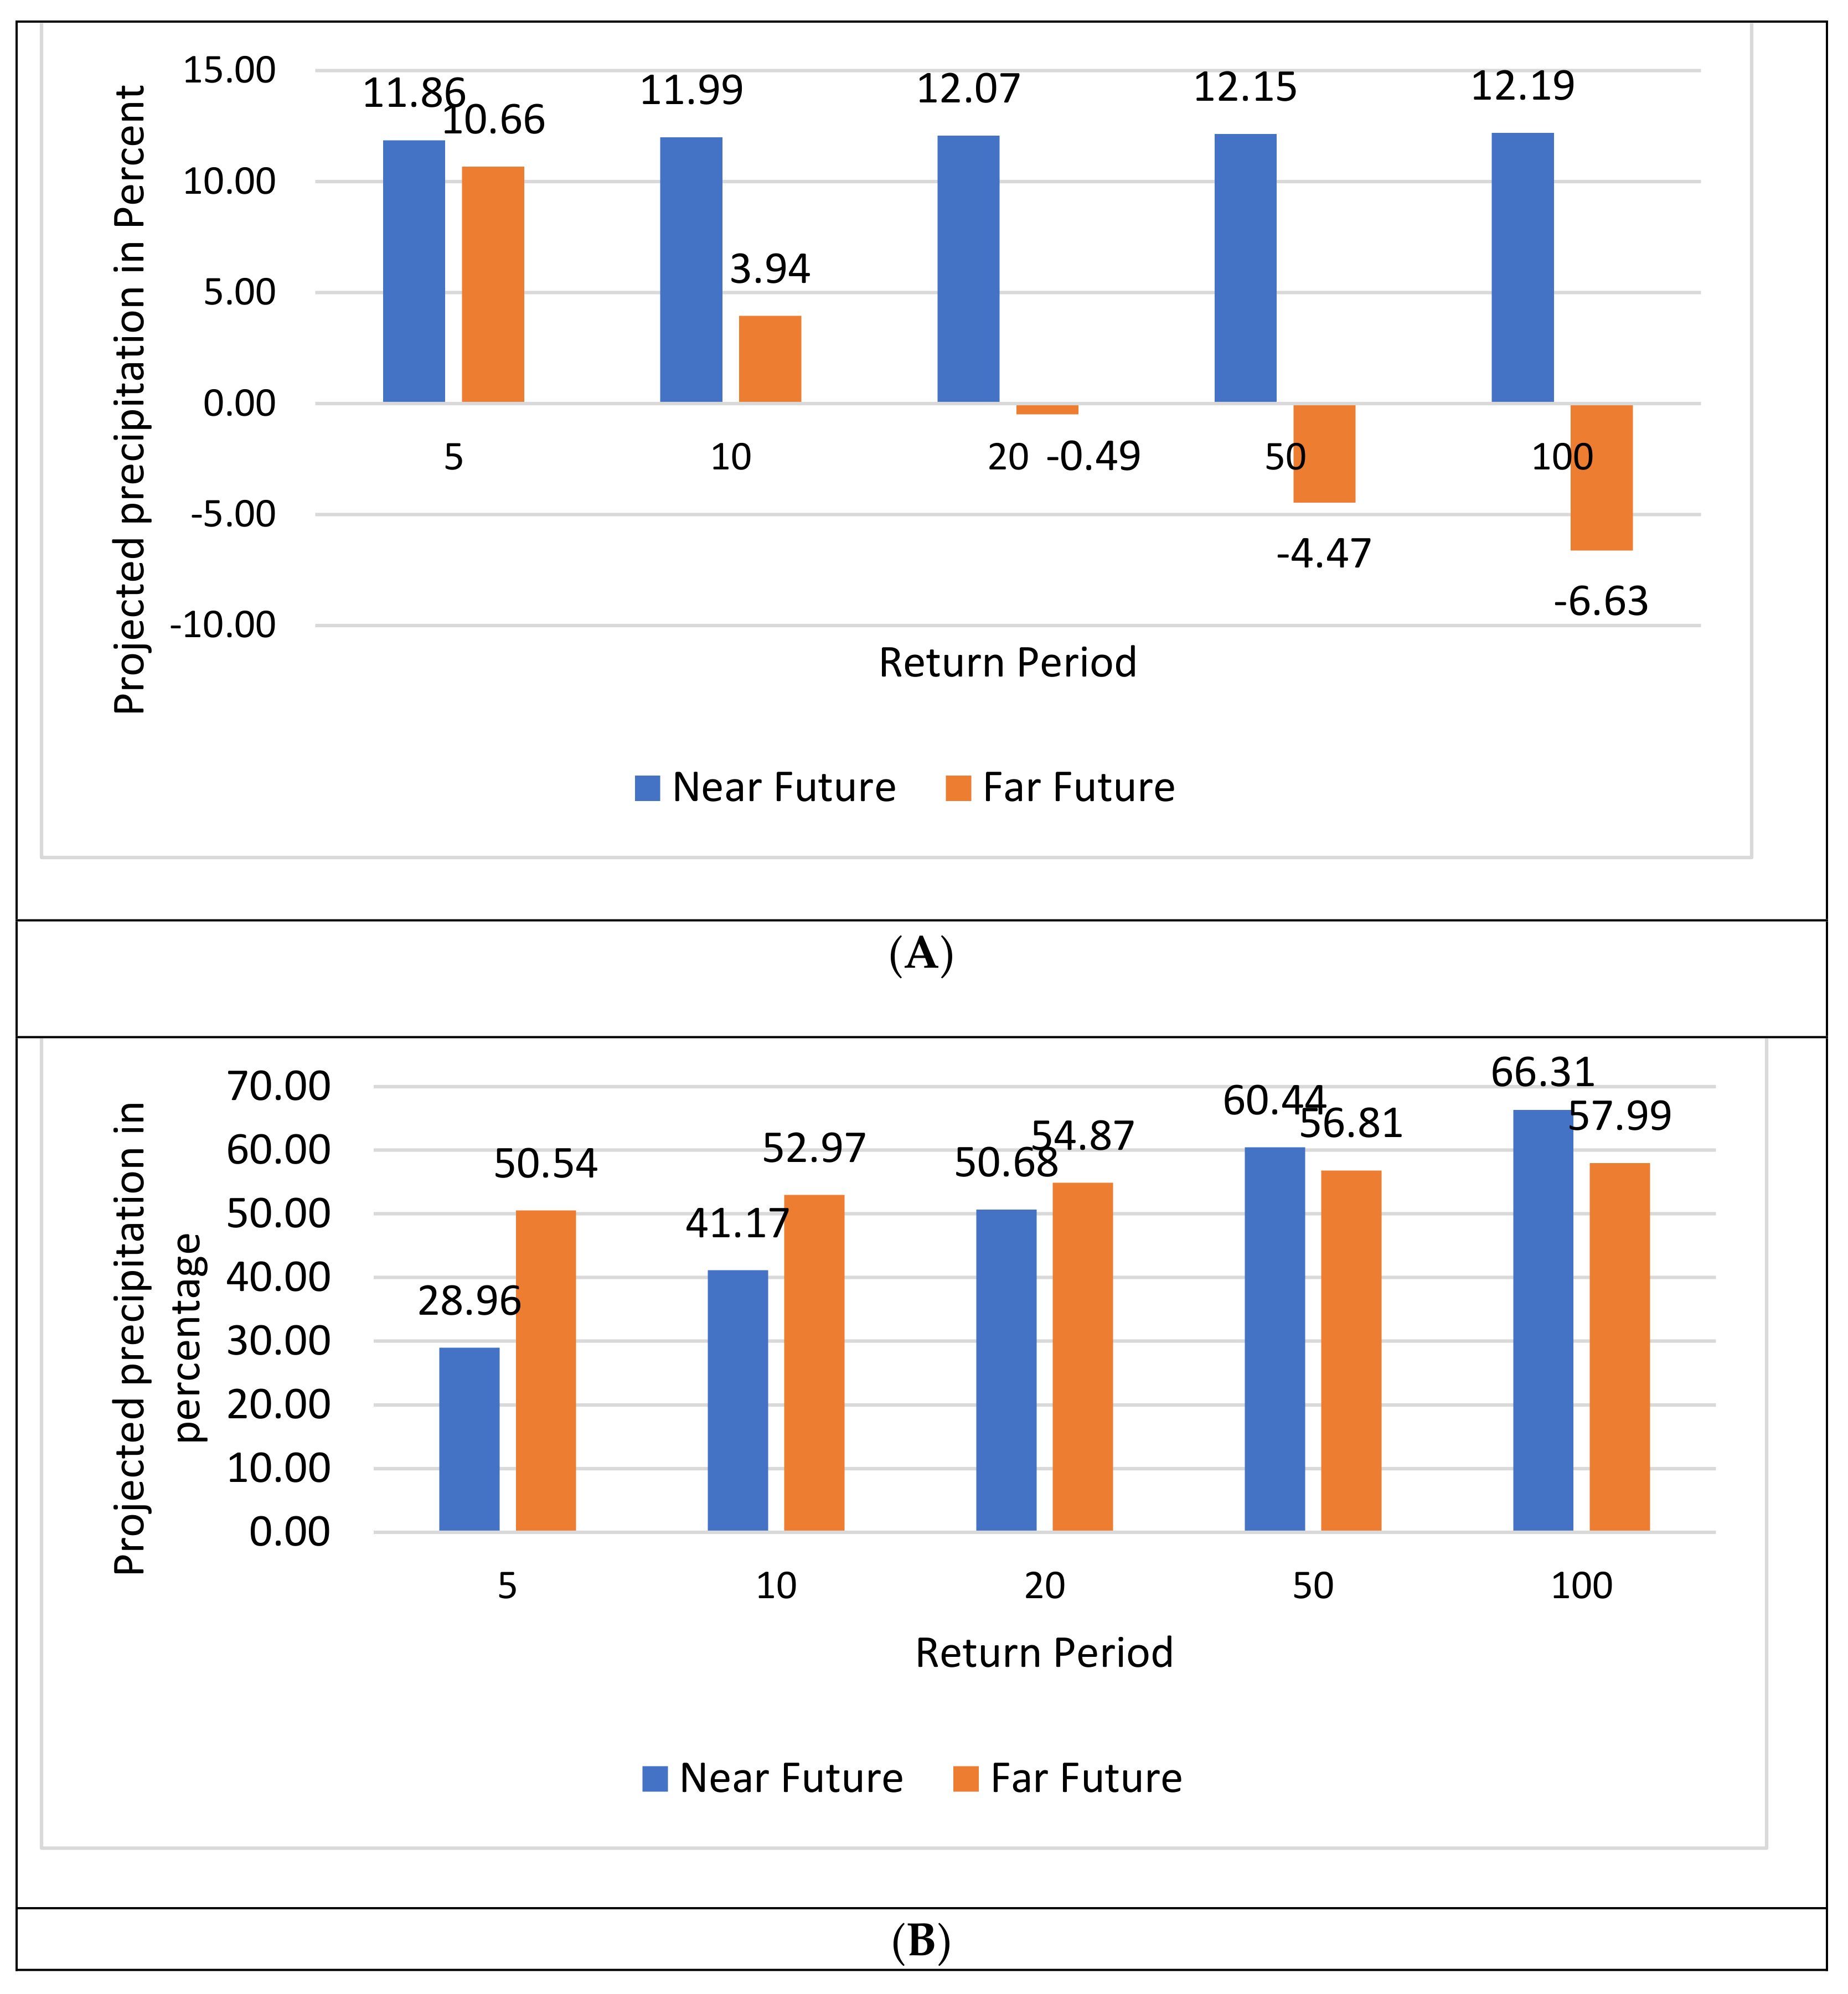
With reference to the base period, all the stations showed a 11.86%, 11.99%, 12.07%, 12.15%, and 12.19% increase in 5-, 10-, 20-, 50-, and 100-year precipitation, respectively, in the near future. Similarly, a 10.64% and 3.94% increase in the next 5 and 10 years in the far future, respectively, was shown, as well as a 0.49%, 4.47%, and 6.63% decrease in the next 20, 50, and 100 years, from the BCC-CSM2-MR model (see Figure 7A). From the MRI-ESM2-0 model, the results were quite different, in that 5-, 10-, 20-, 50-, and 100-year annual maximum precipitation increased by 28.96%, 41.17%, 50.68%, 60.44%, and 66.31%, respectively, in the near future. Increases in 5, 10, 20, 50, and 100 years in the far future are 50.54%, 52.97%, 54.87%, 56.81%, and 57.99%, which are slightly less than the near-future precipitation for the 100-year return period (see Figure 7B).
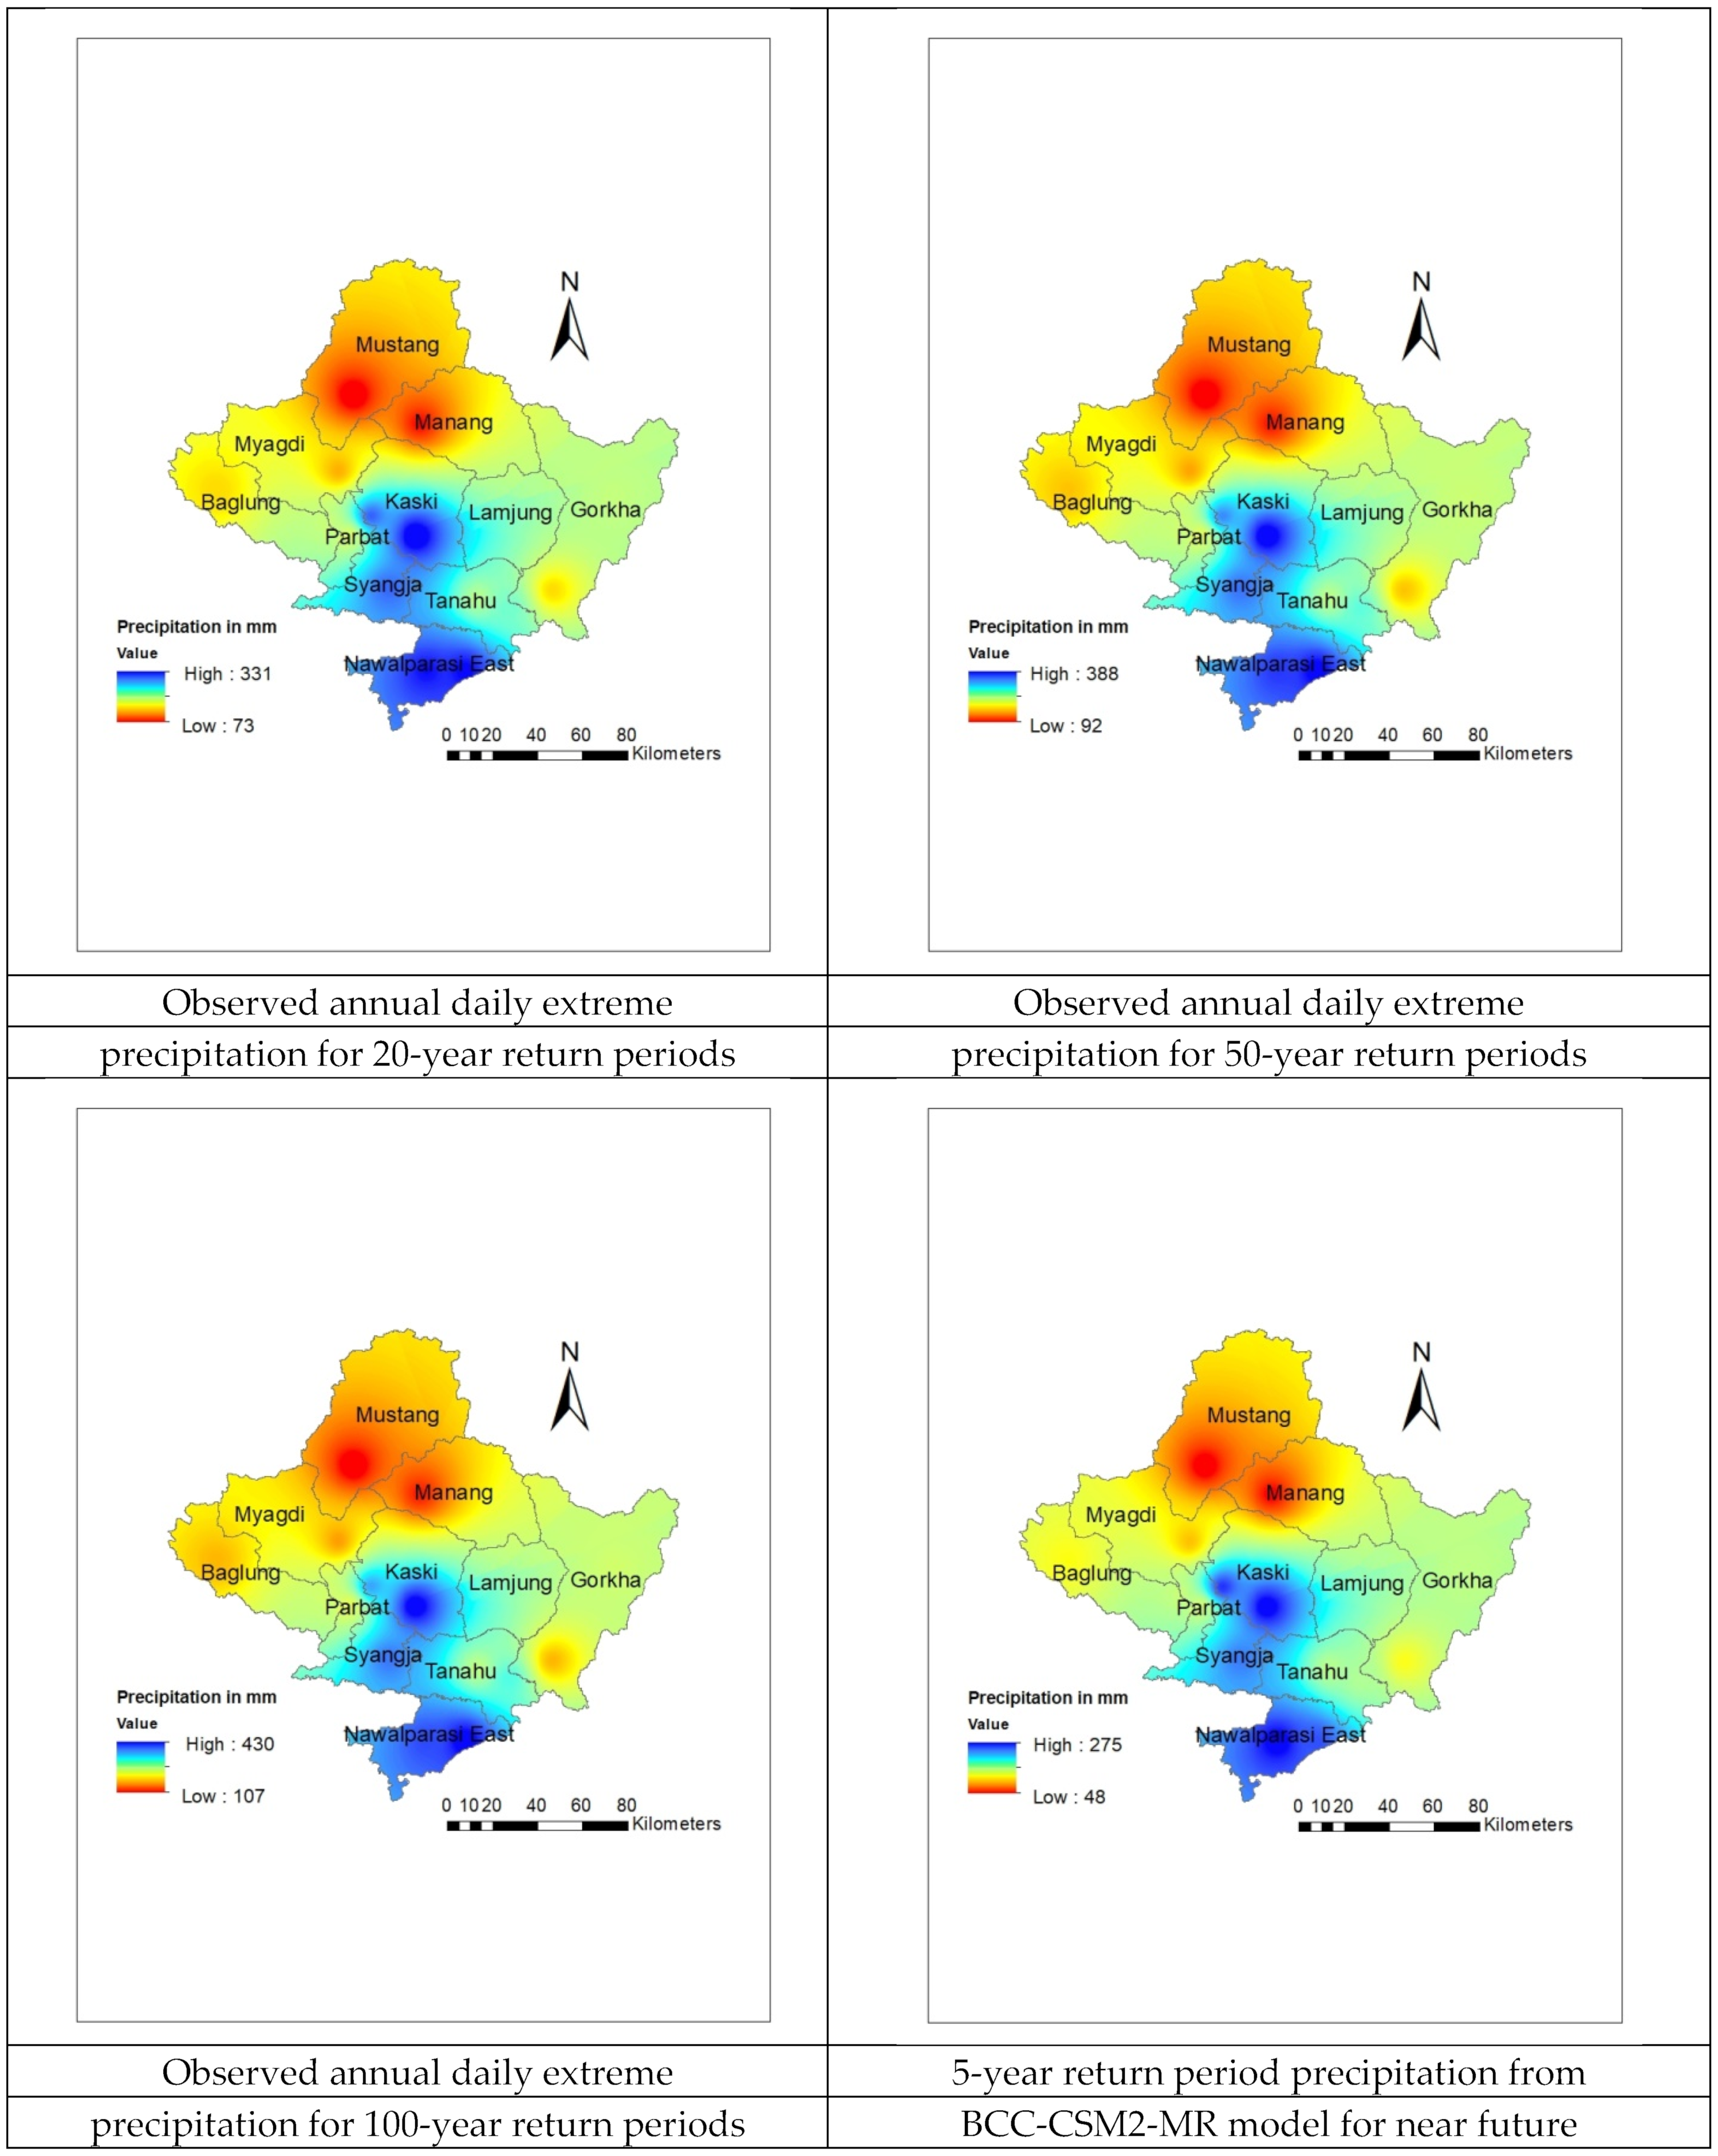
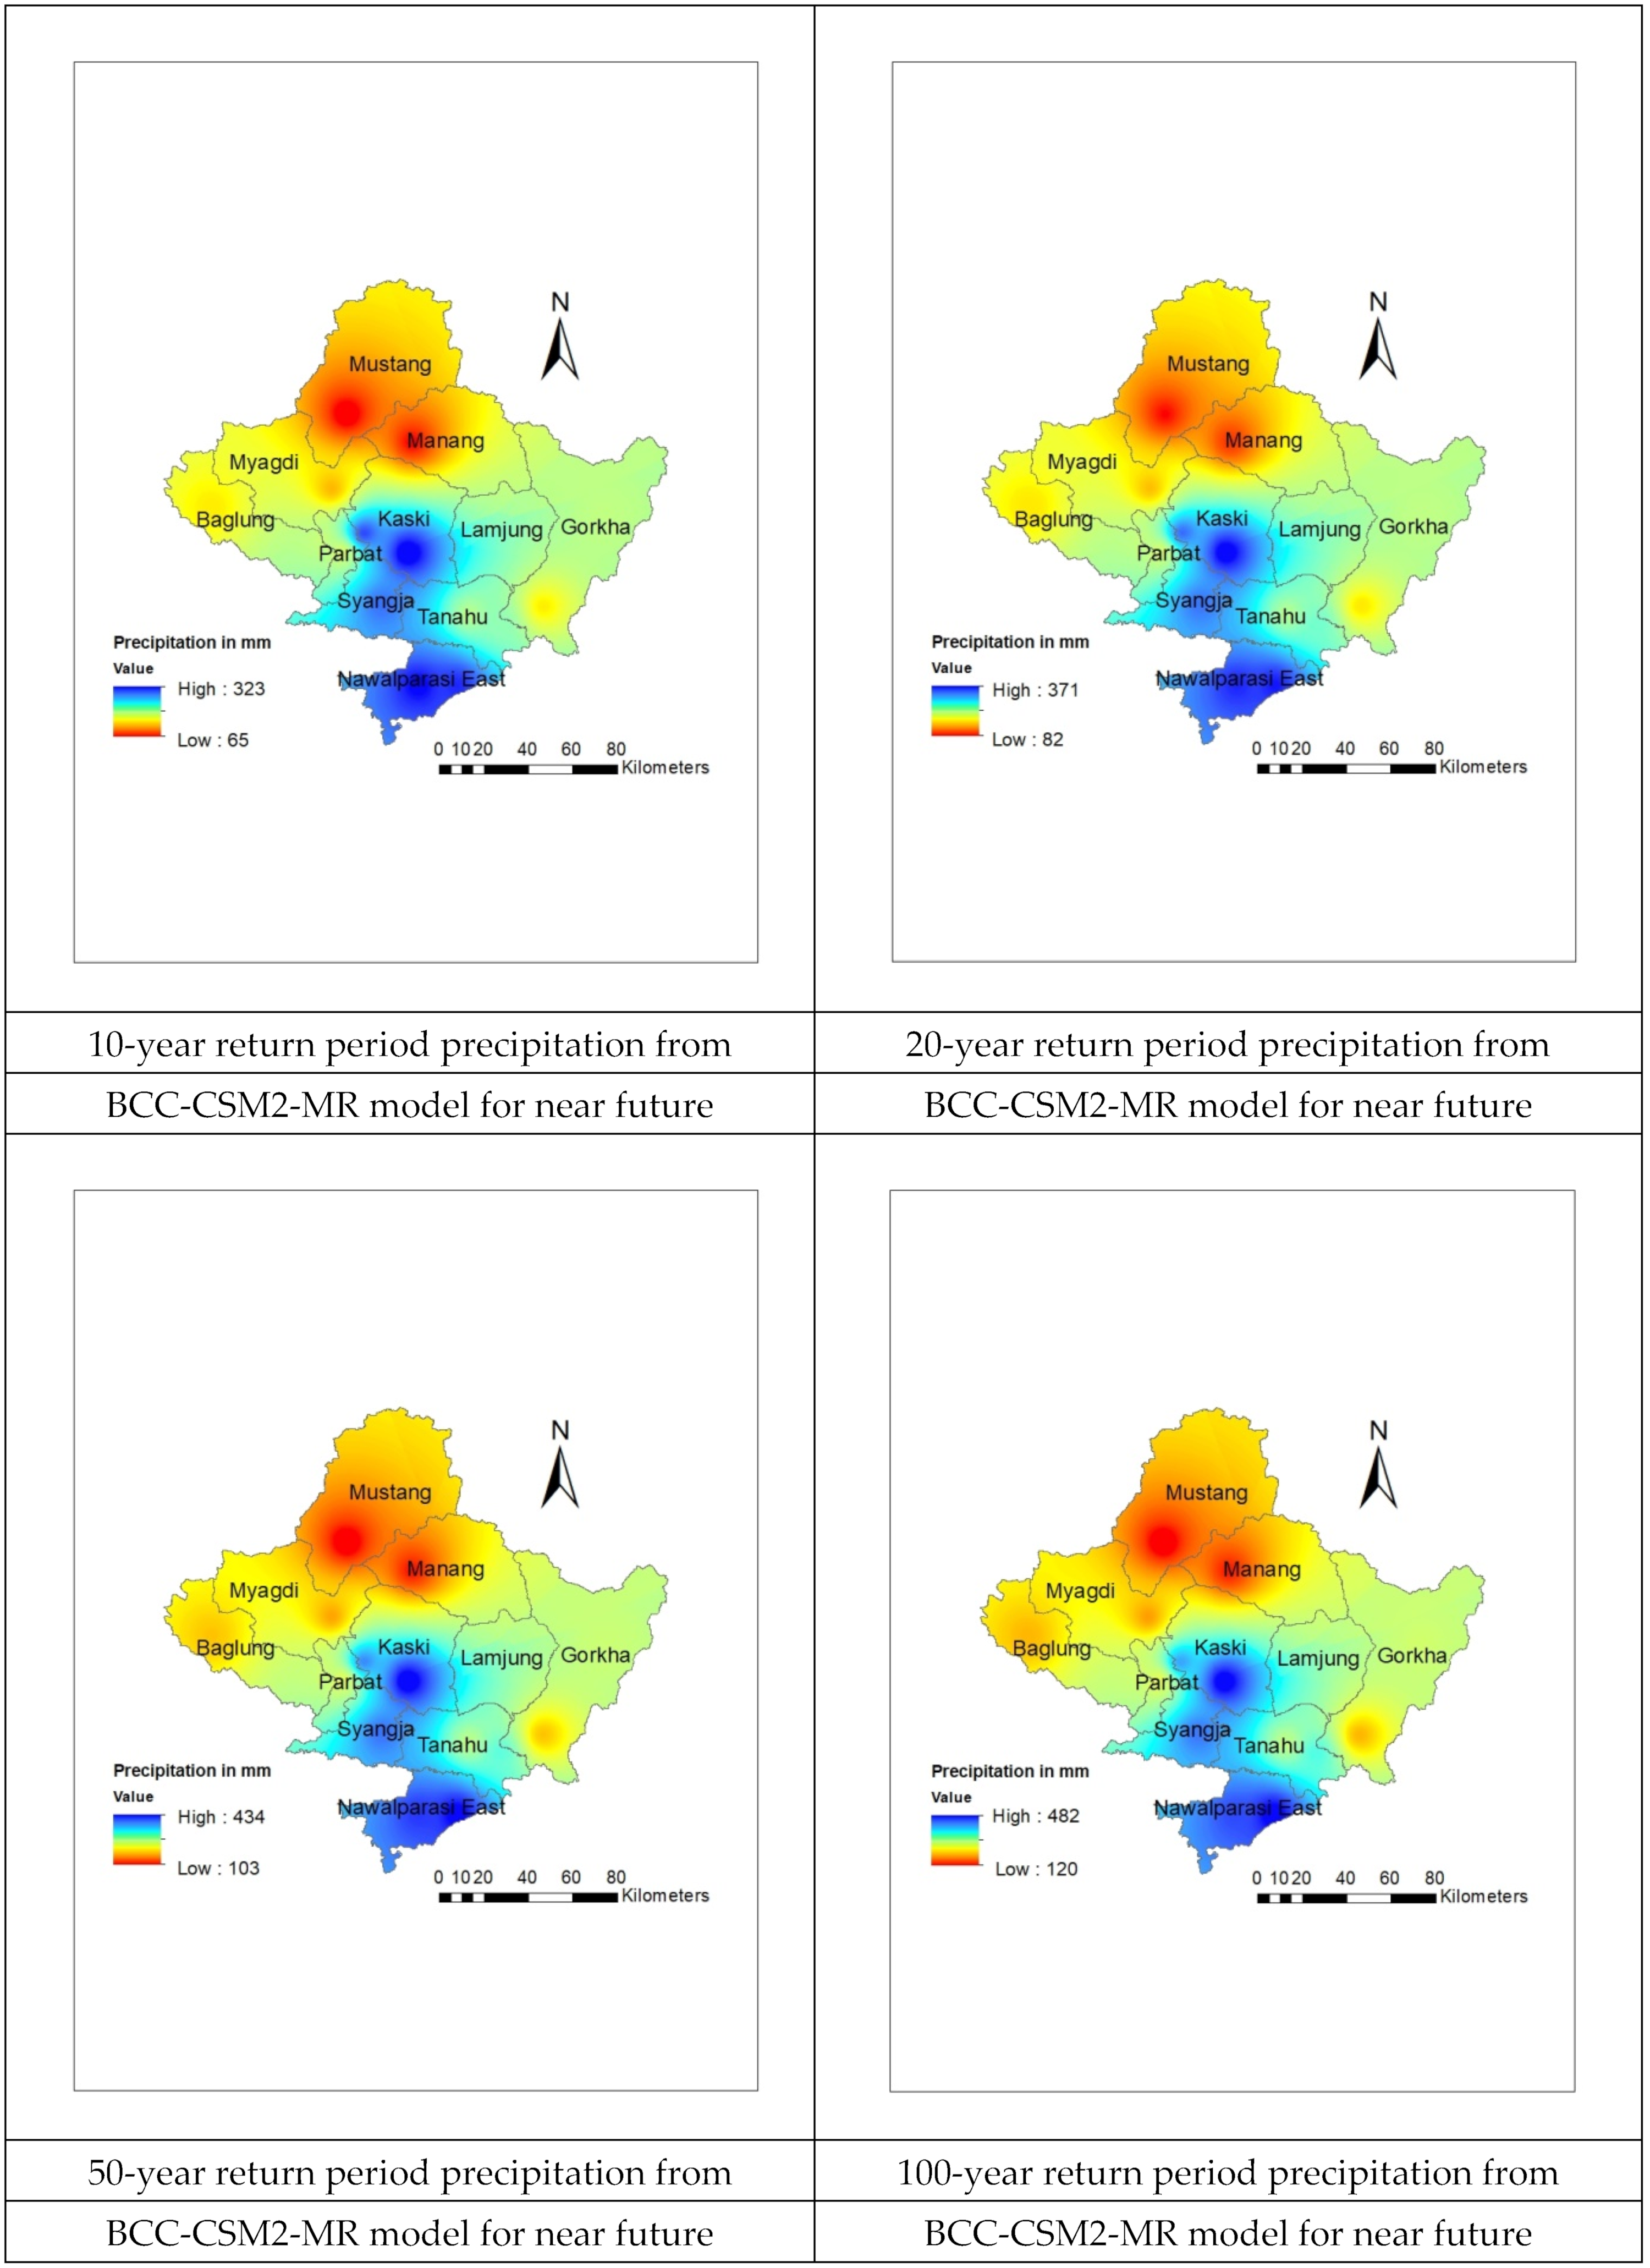
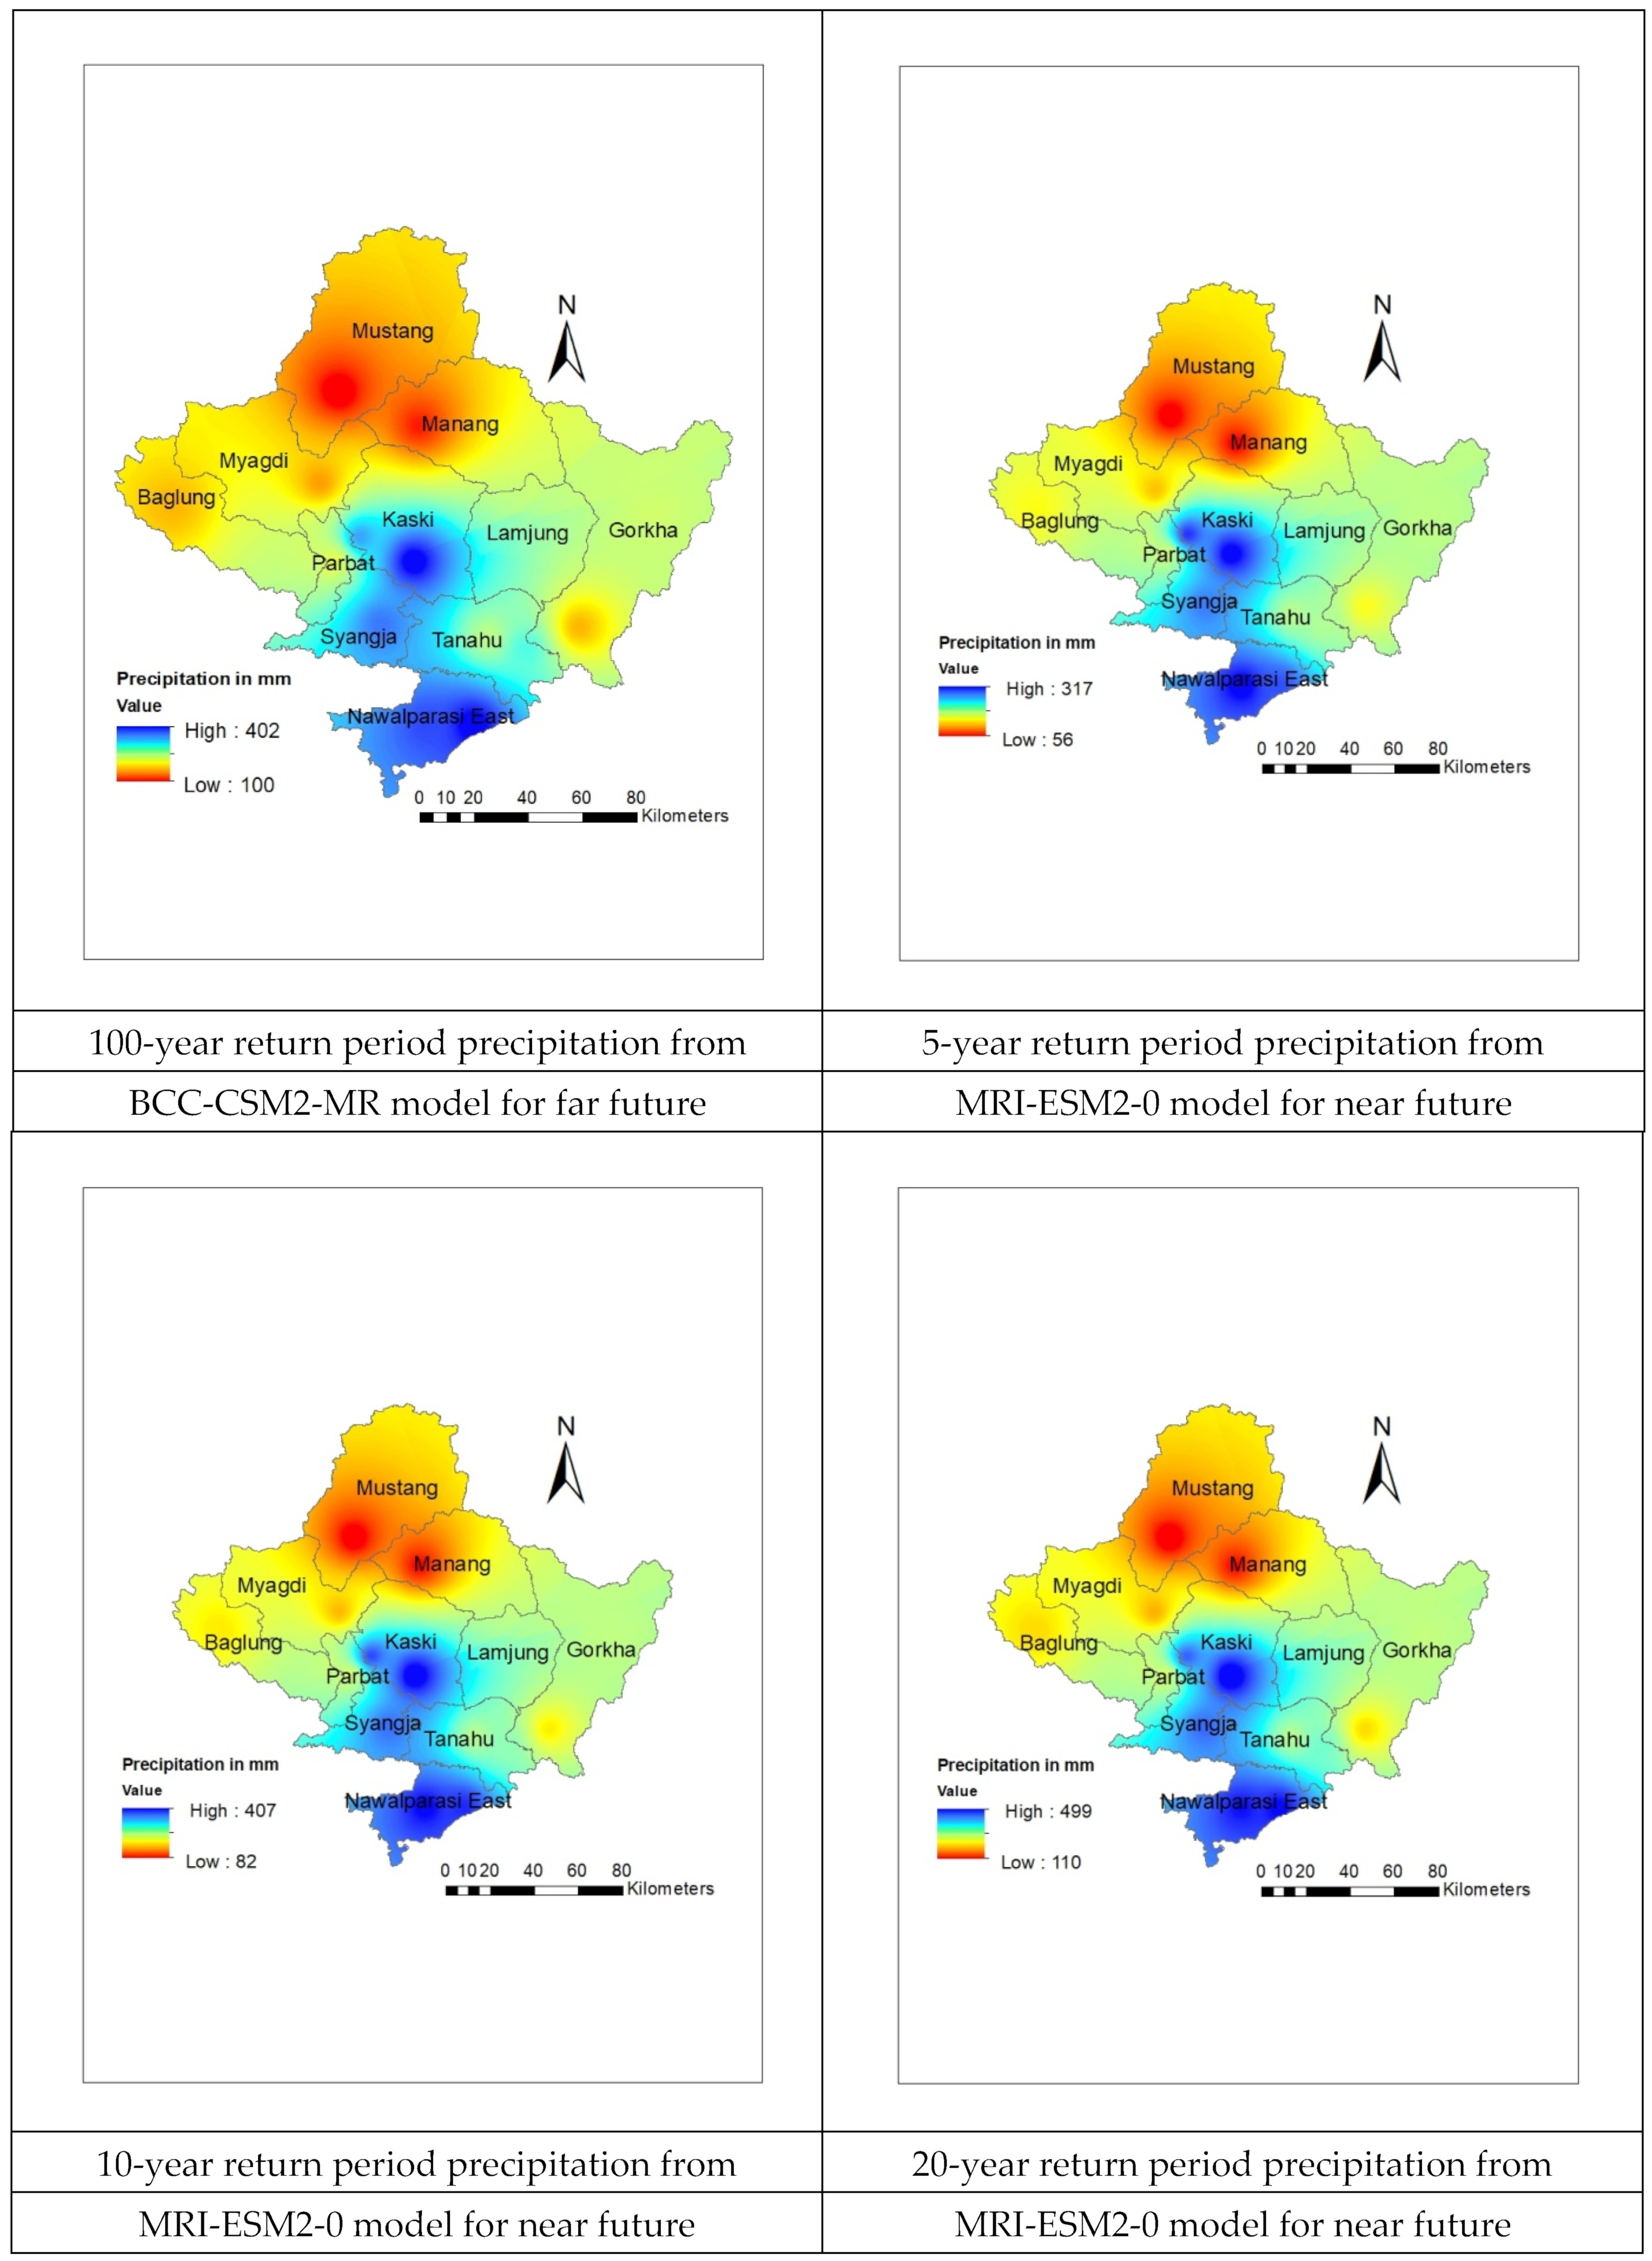
Figure 8 shows the spatial distribution of annual daily extreme precipitation for the 100-year return period output from the graphical analysis from the MRI-ESM2-0 model, under the SSP2–4.5 and SSP5–8.5 scenarios for the near future (2021–2040) relative to 1995–2014. ArcGIS was used to visualize the observed and projected extreme precipitation with a cell size of 100 m over the Gandaki Province. As shown in the figure, the blue color indicates the highest precipitation among the study areas, whereas the red color shows the lowest precipitation.
Extreme precipitation for 5-, 10-, 20-, 50-, and 100-year return periods was observed to be higher in Nawalparasi East, Kaski, Syangja, and the Western parts of the Tanahun district, respectively, whereas the Mustang and Manang districts showed the least precipitation. Similarly, the BCC-CSM2-MR and MRI-ESM2-0 models show higher precipitation in Nawalparasi East, Kaski, Syangja, and the western part of Tanahun. The Mustang and Manang districts showed the minimum precipitation (see Appendix B, Figure A15).
3.2.4. RX3day Index
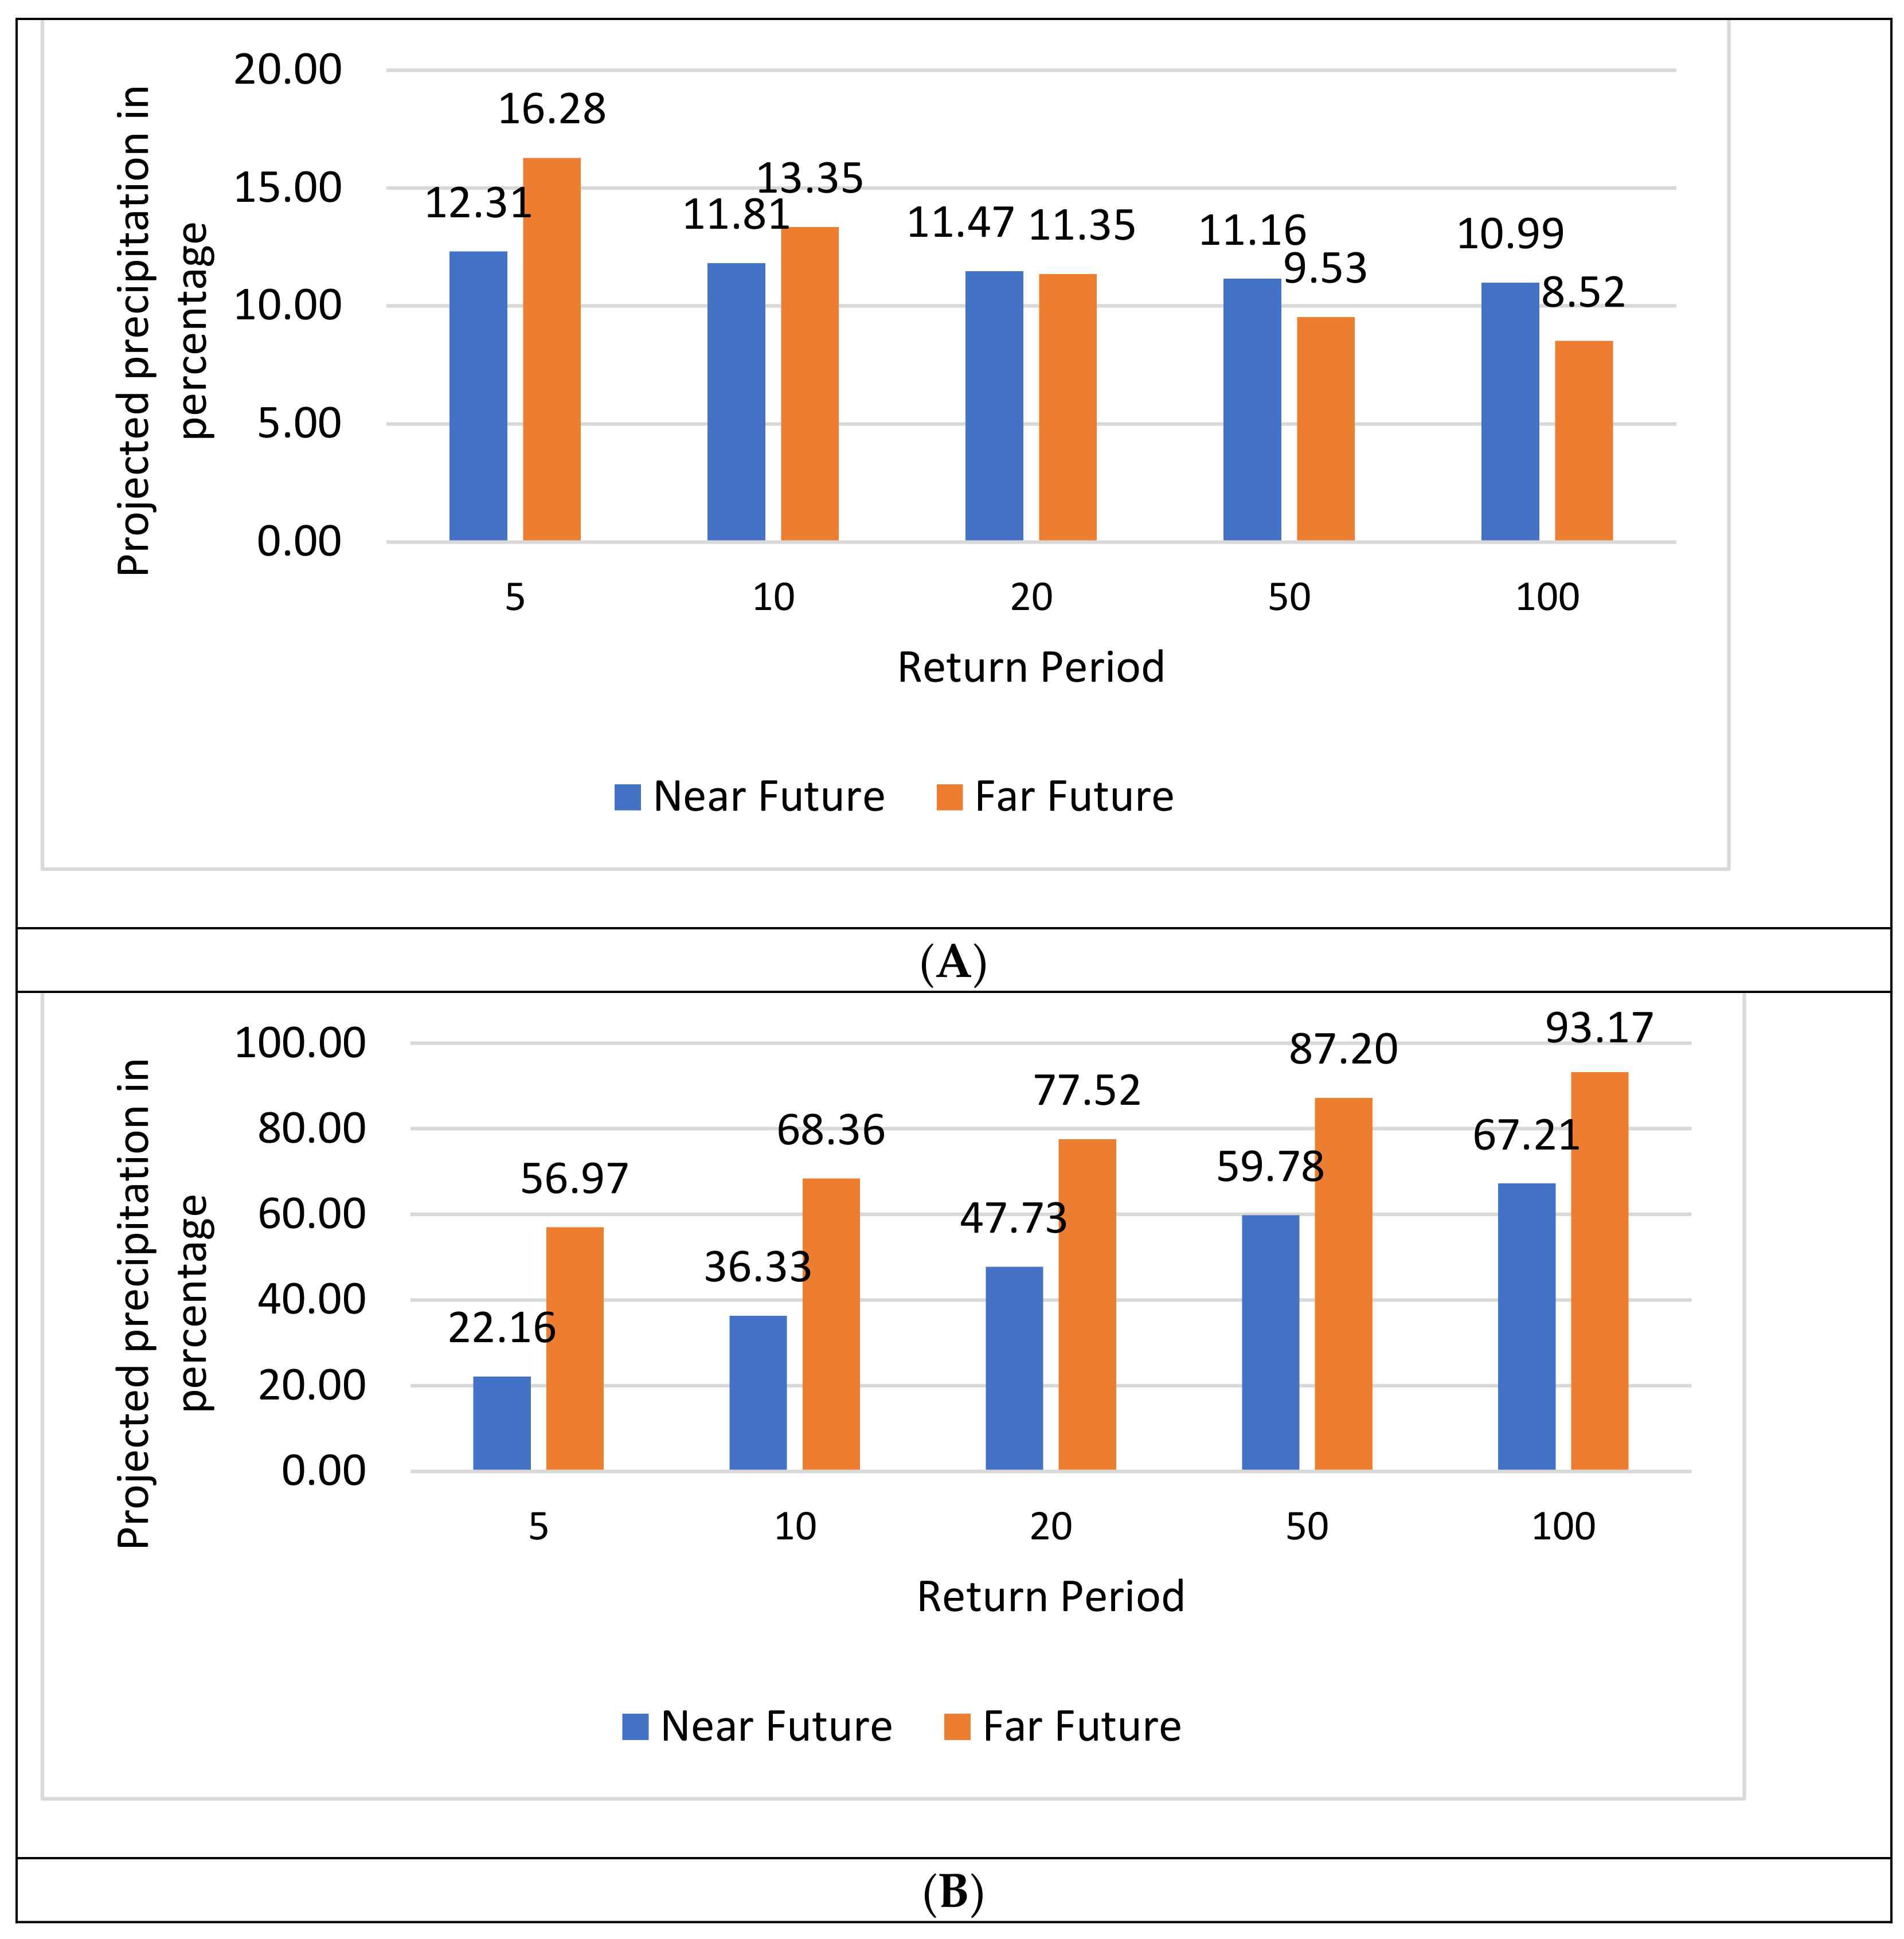
The RX3day index is similar to the RX1day index, but it measures the most precipitation observed in three consecutive days during a specific time period, making it another precipitation index that is appropriate for identifying flood-causing storm events. Figure 9 shows that RX3day was projected to increase by about 12.31%, 11.81%, 11.47%, 11.16%, and 10.99% in the near future (2021–2040) and by 16.28%, 13.35%, 11.35%, 9.53%, and 8.52% in the far future (2081–2100) for 5, 10, 20, 50, and 100 years, respectively, from the BCC-CSM2-MR model. Meanwhile, MRI-ESM2-0 showed a 22.16%, 36.33%, 47.73%, 59.78%, and 67.21% increase in the near future (2021–2040), with respect to the base-year, (1995–2014) for 5-, 10-, 20-, 50-, and 100-year return periods and 56.97%, 68.36%, 77.52%, 87.20%, and 93.17% in the far future (2081–2100), respectively.
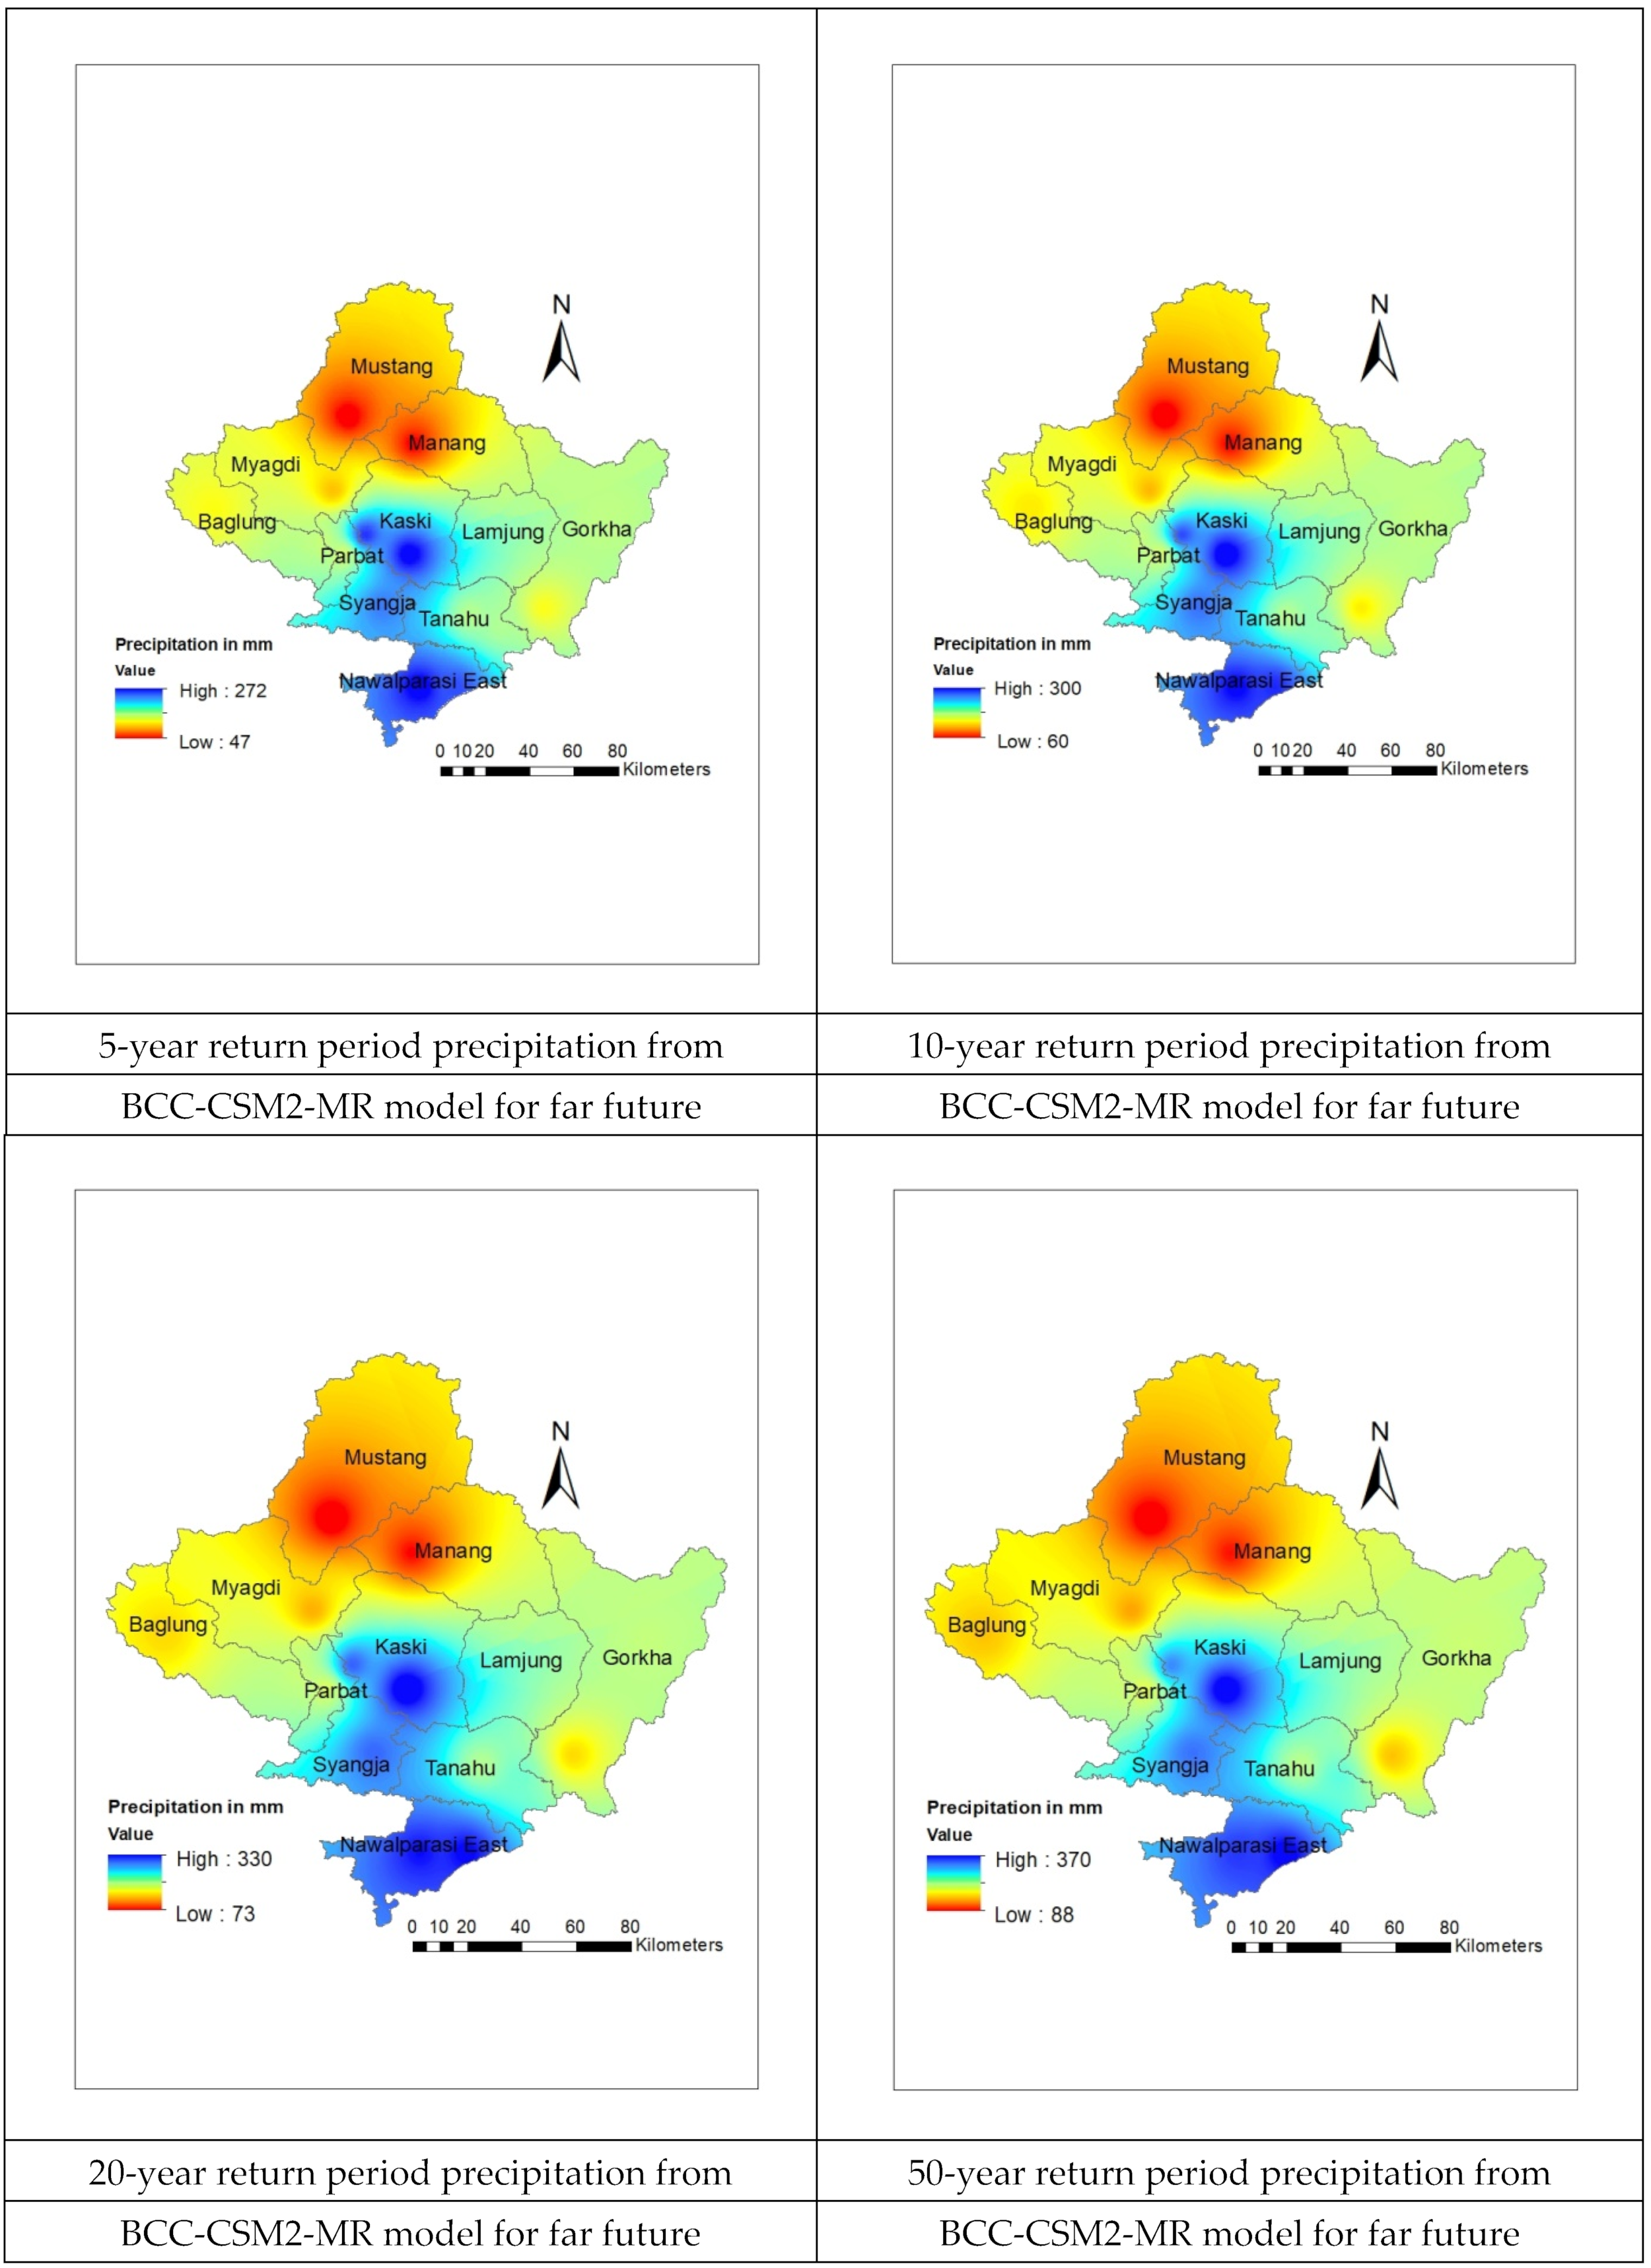
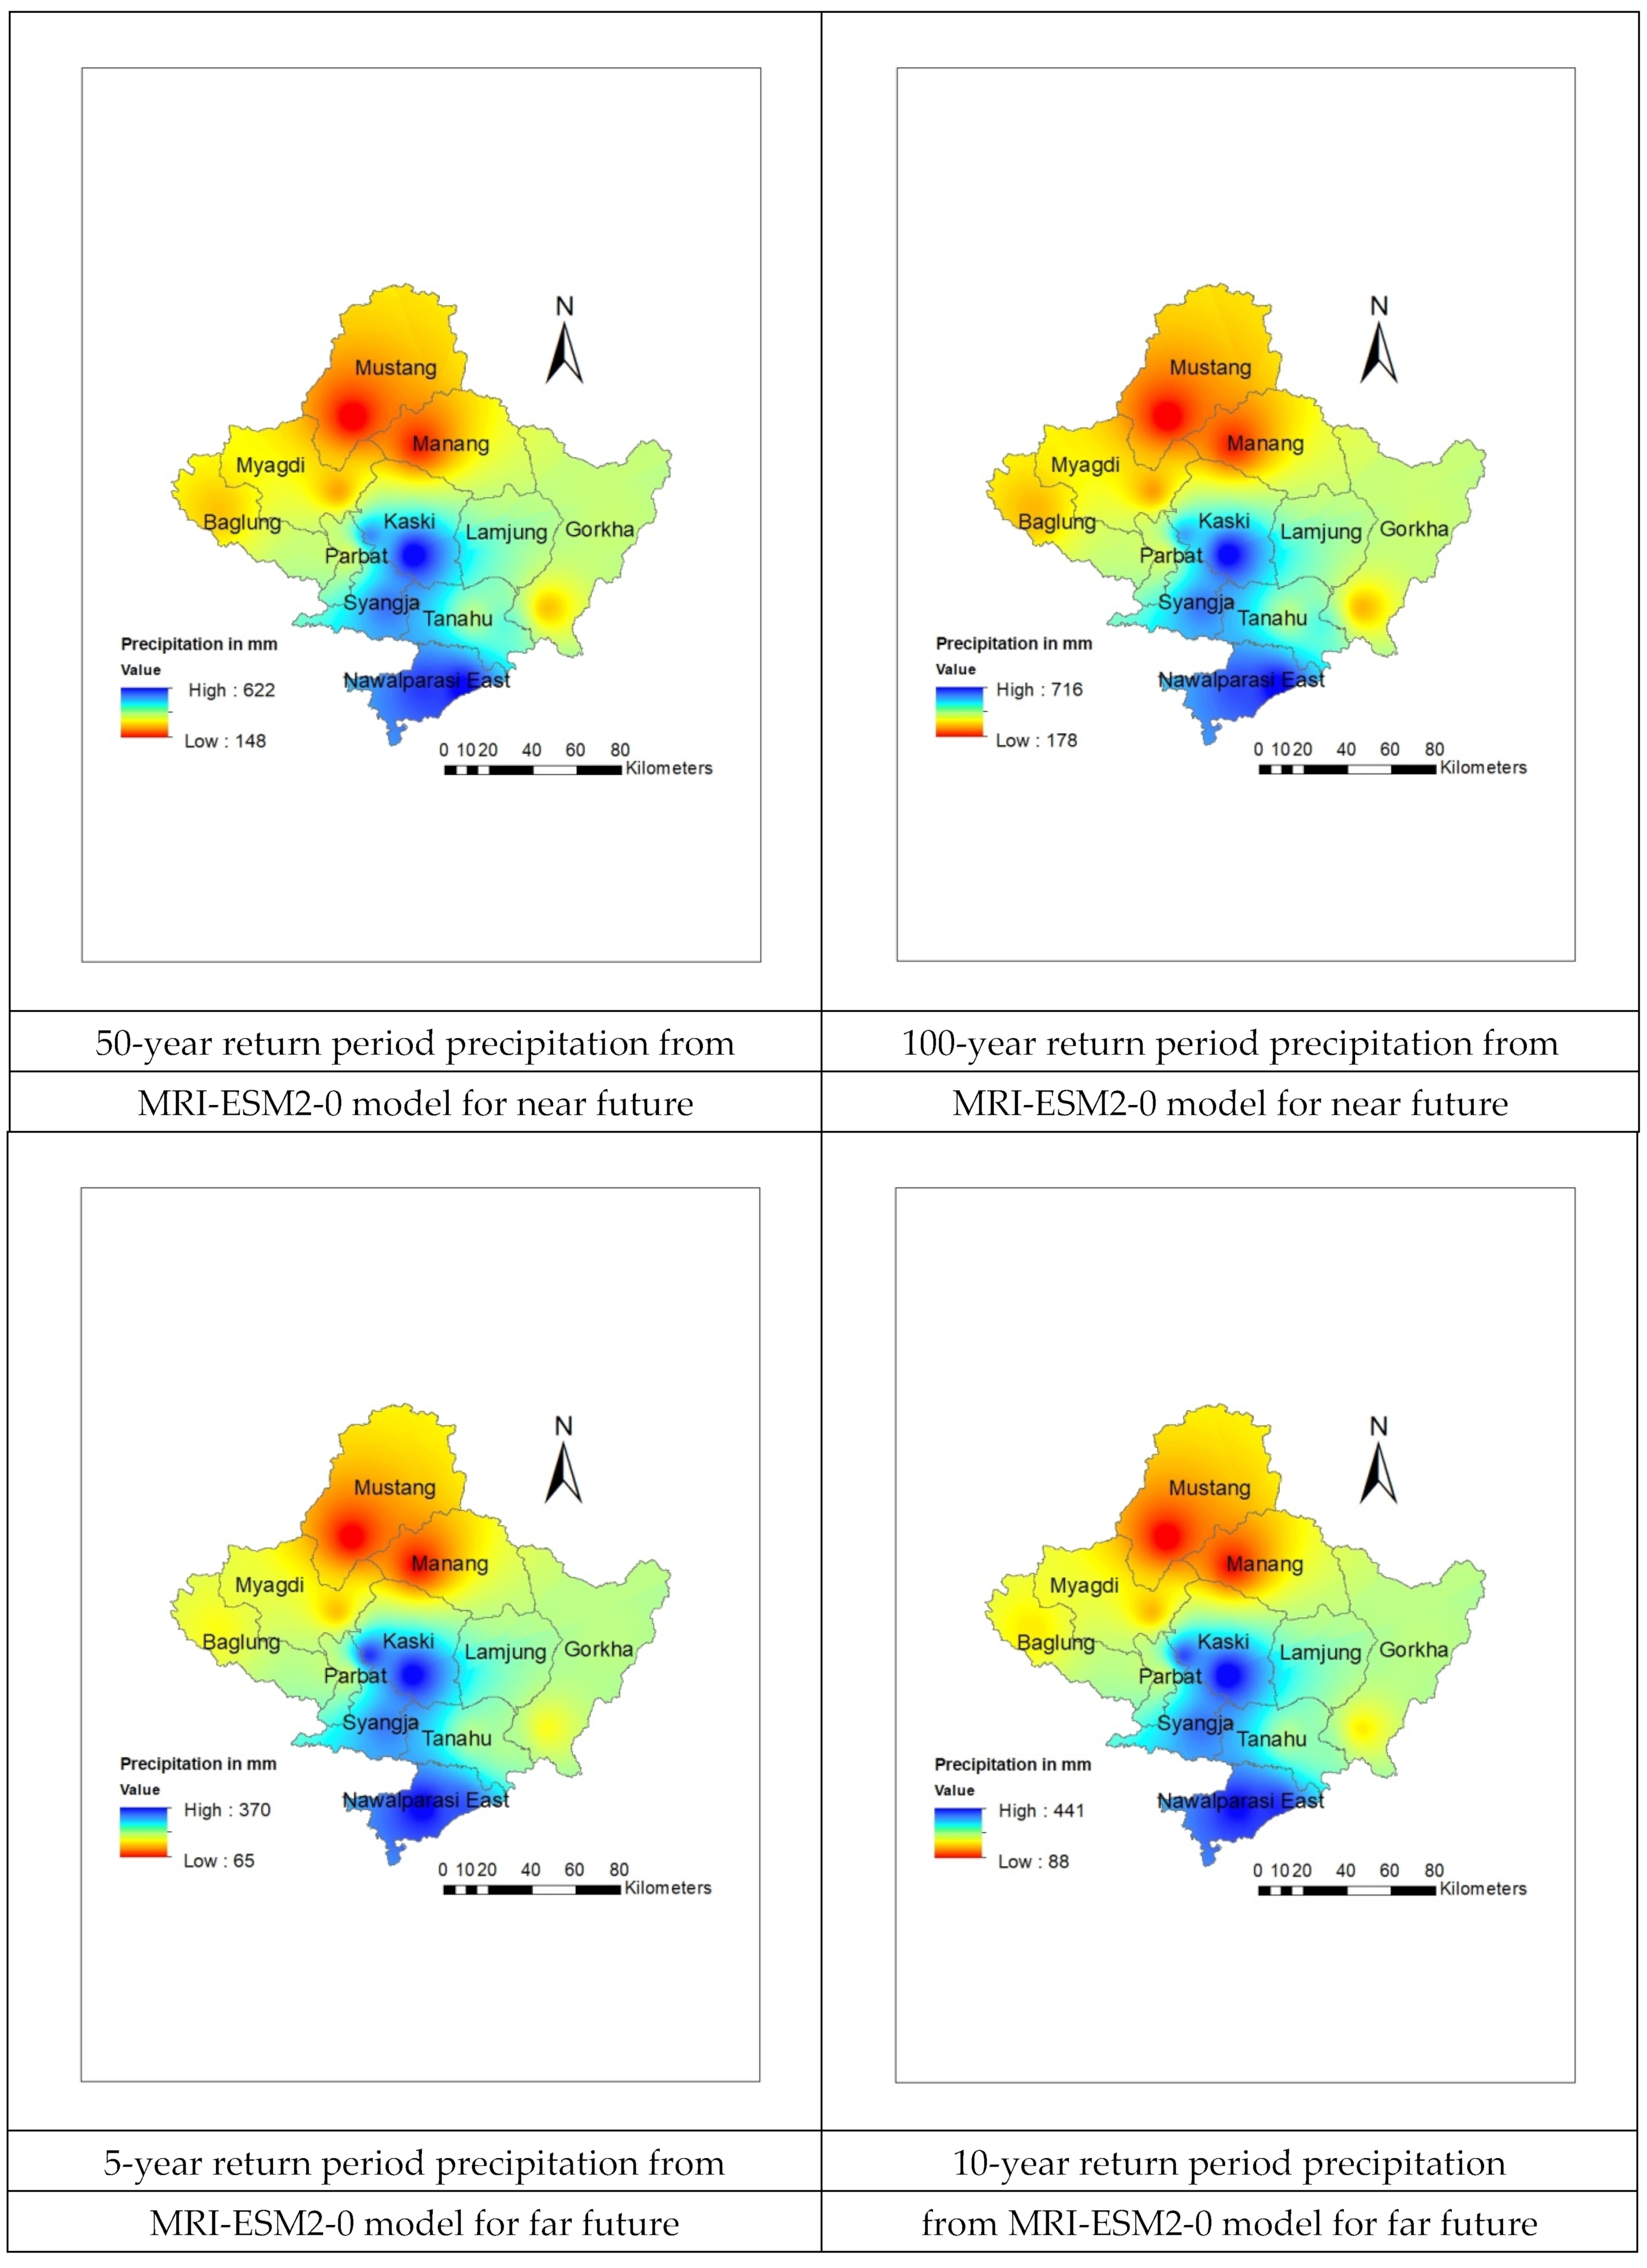
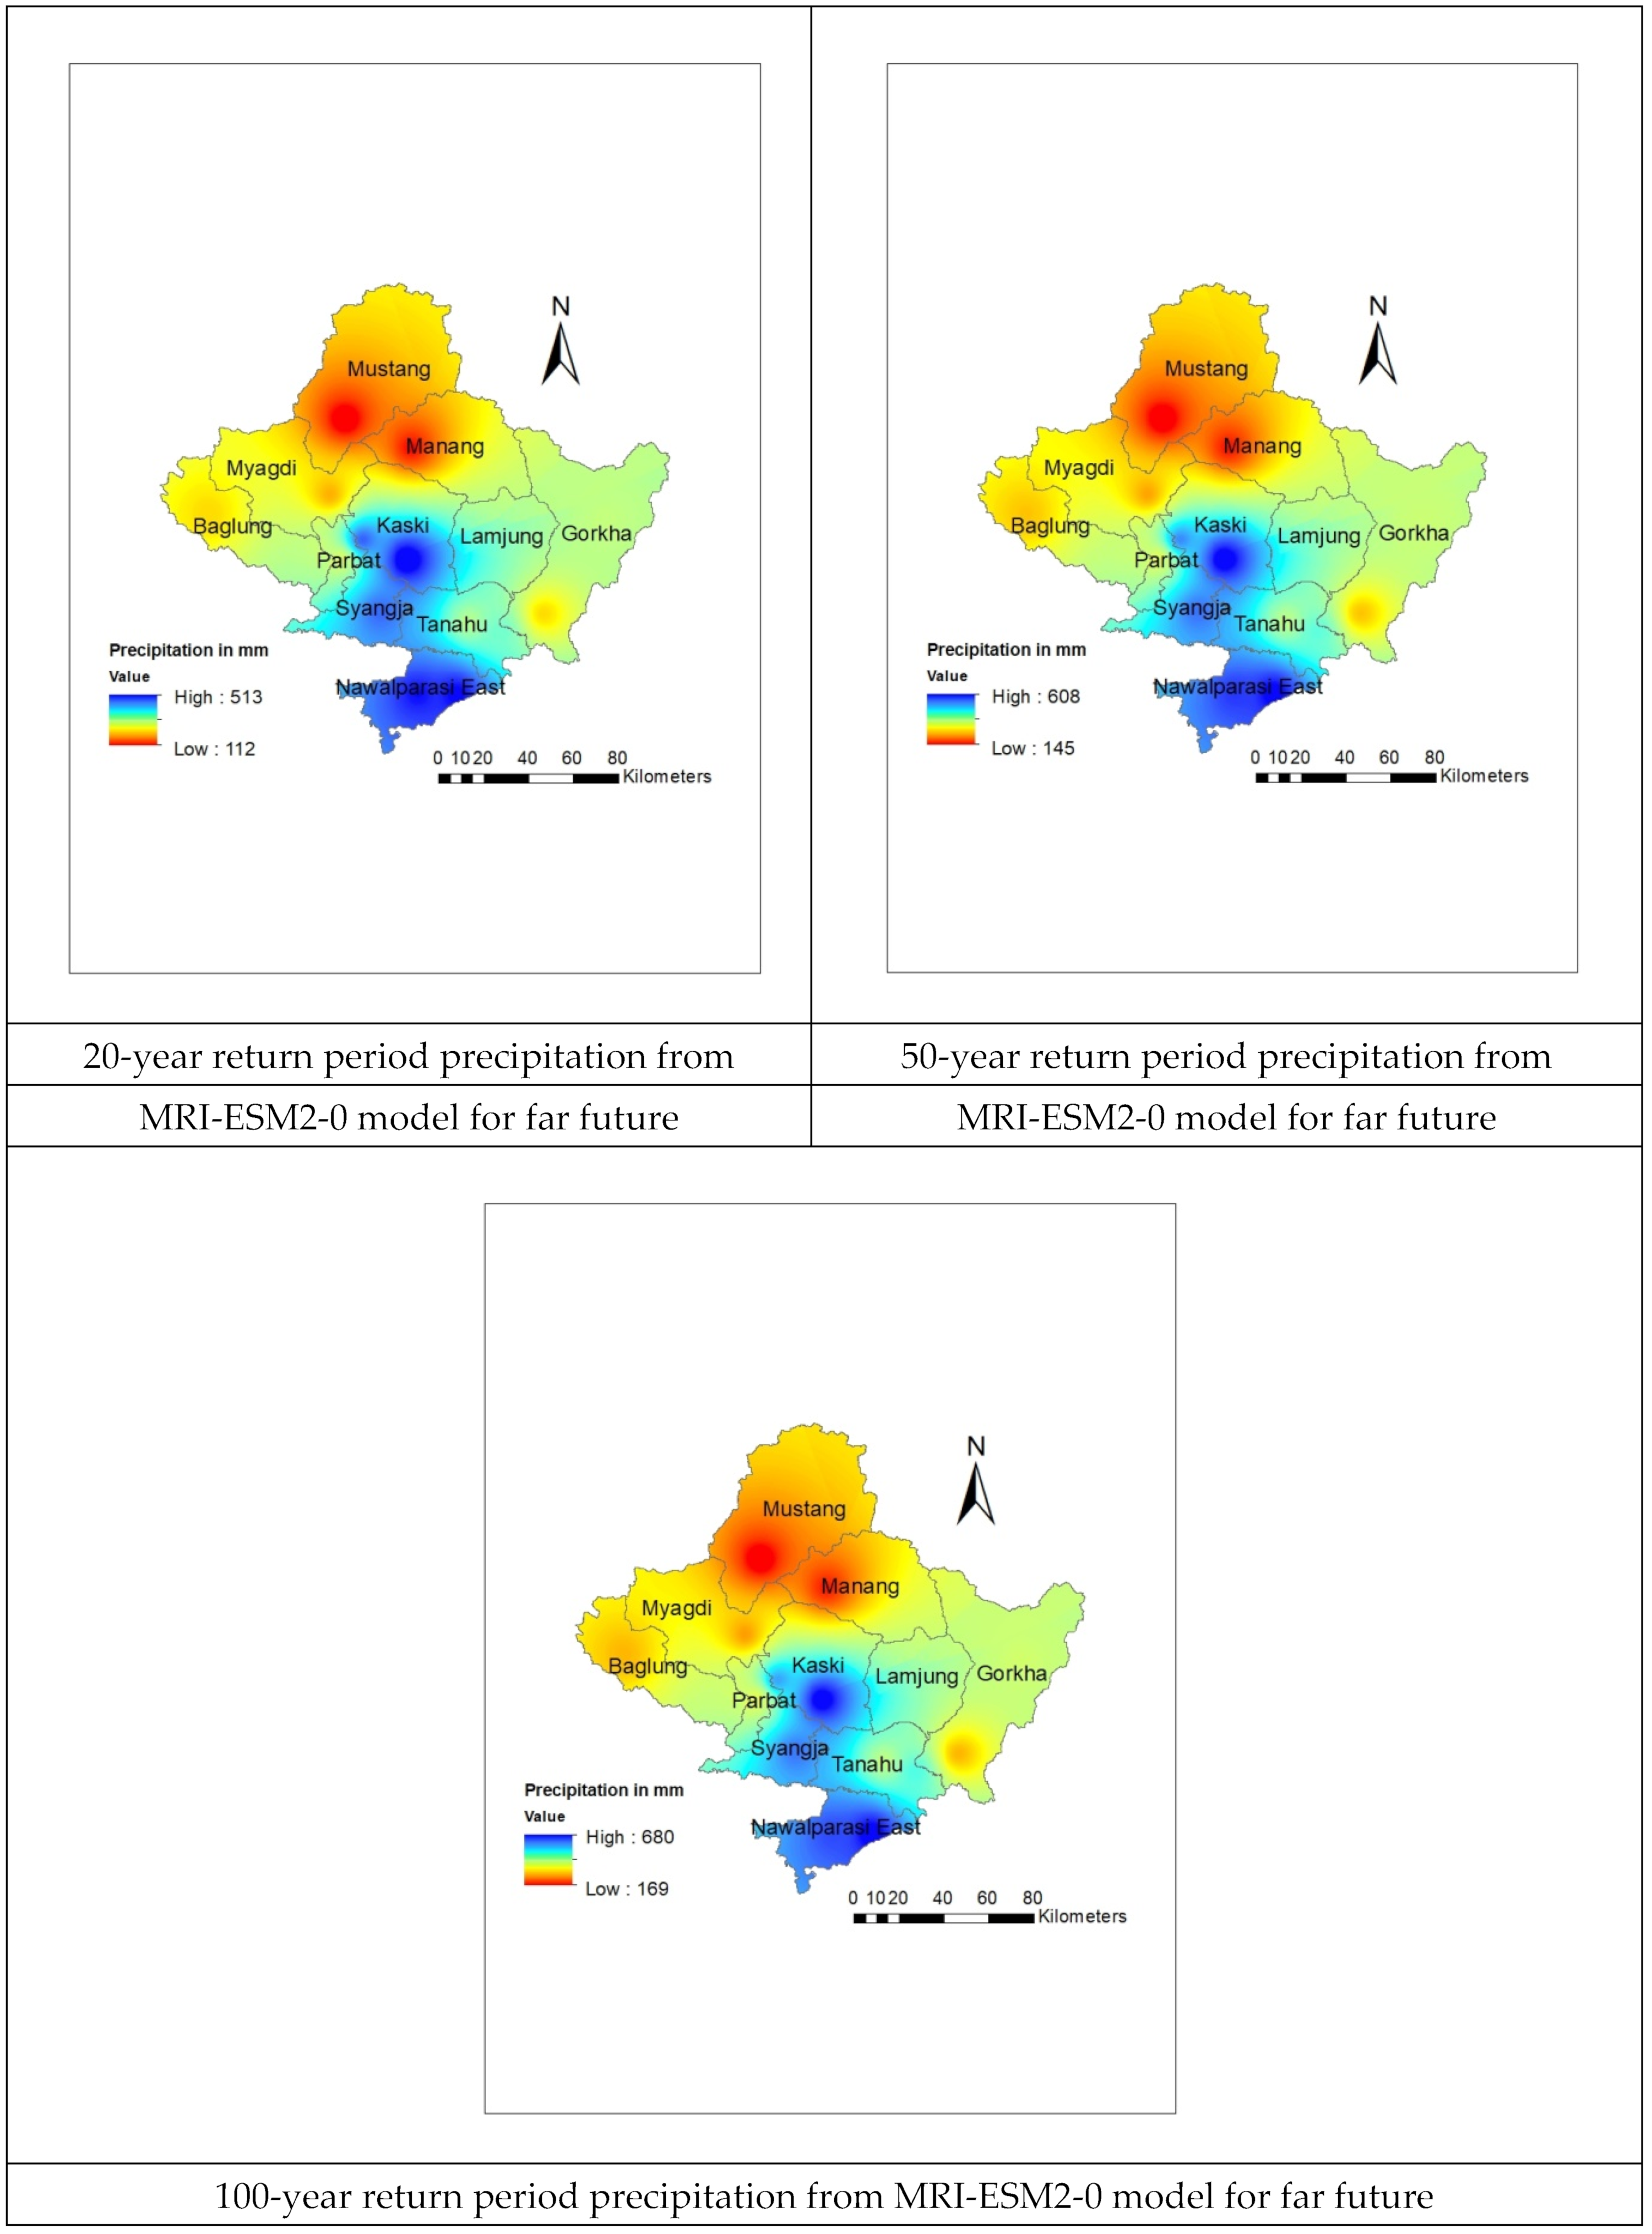
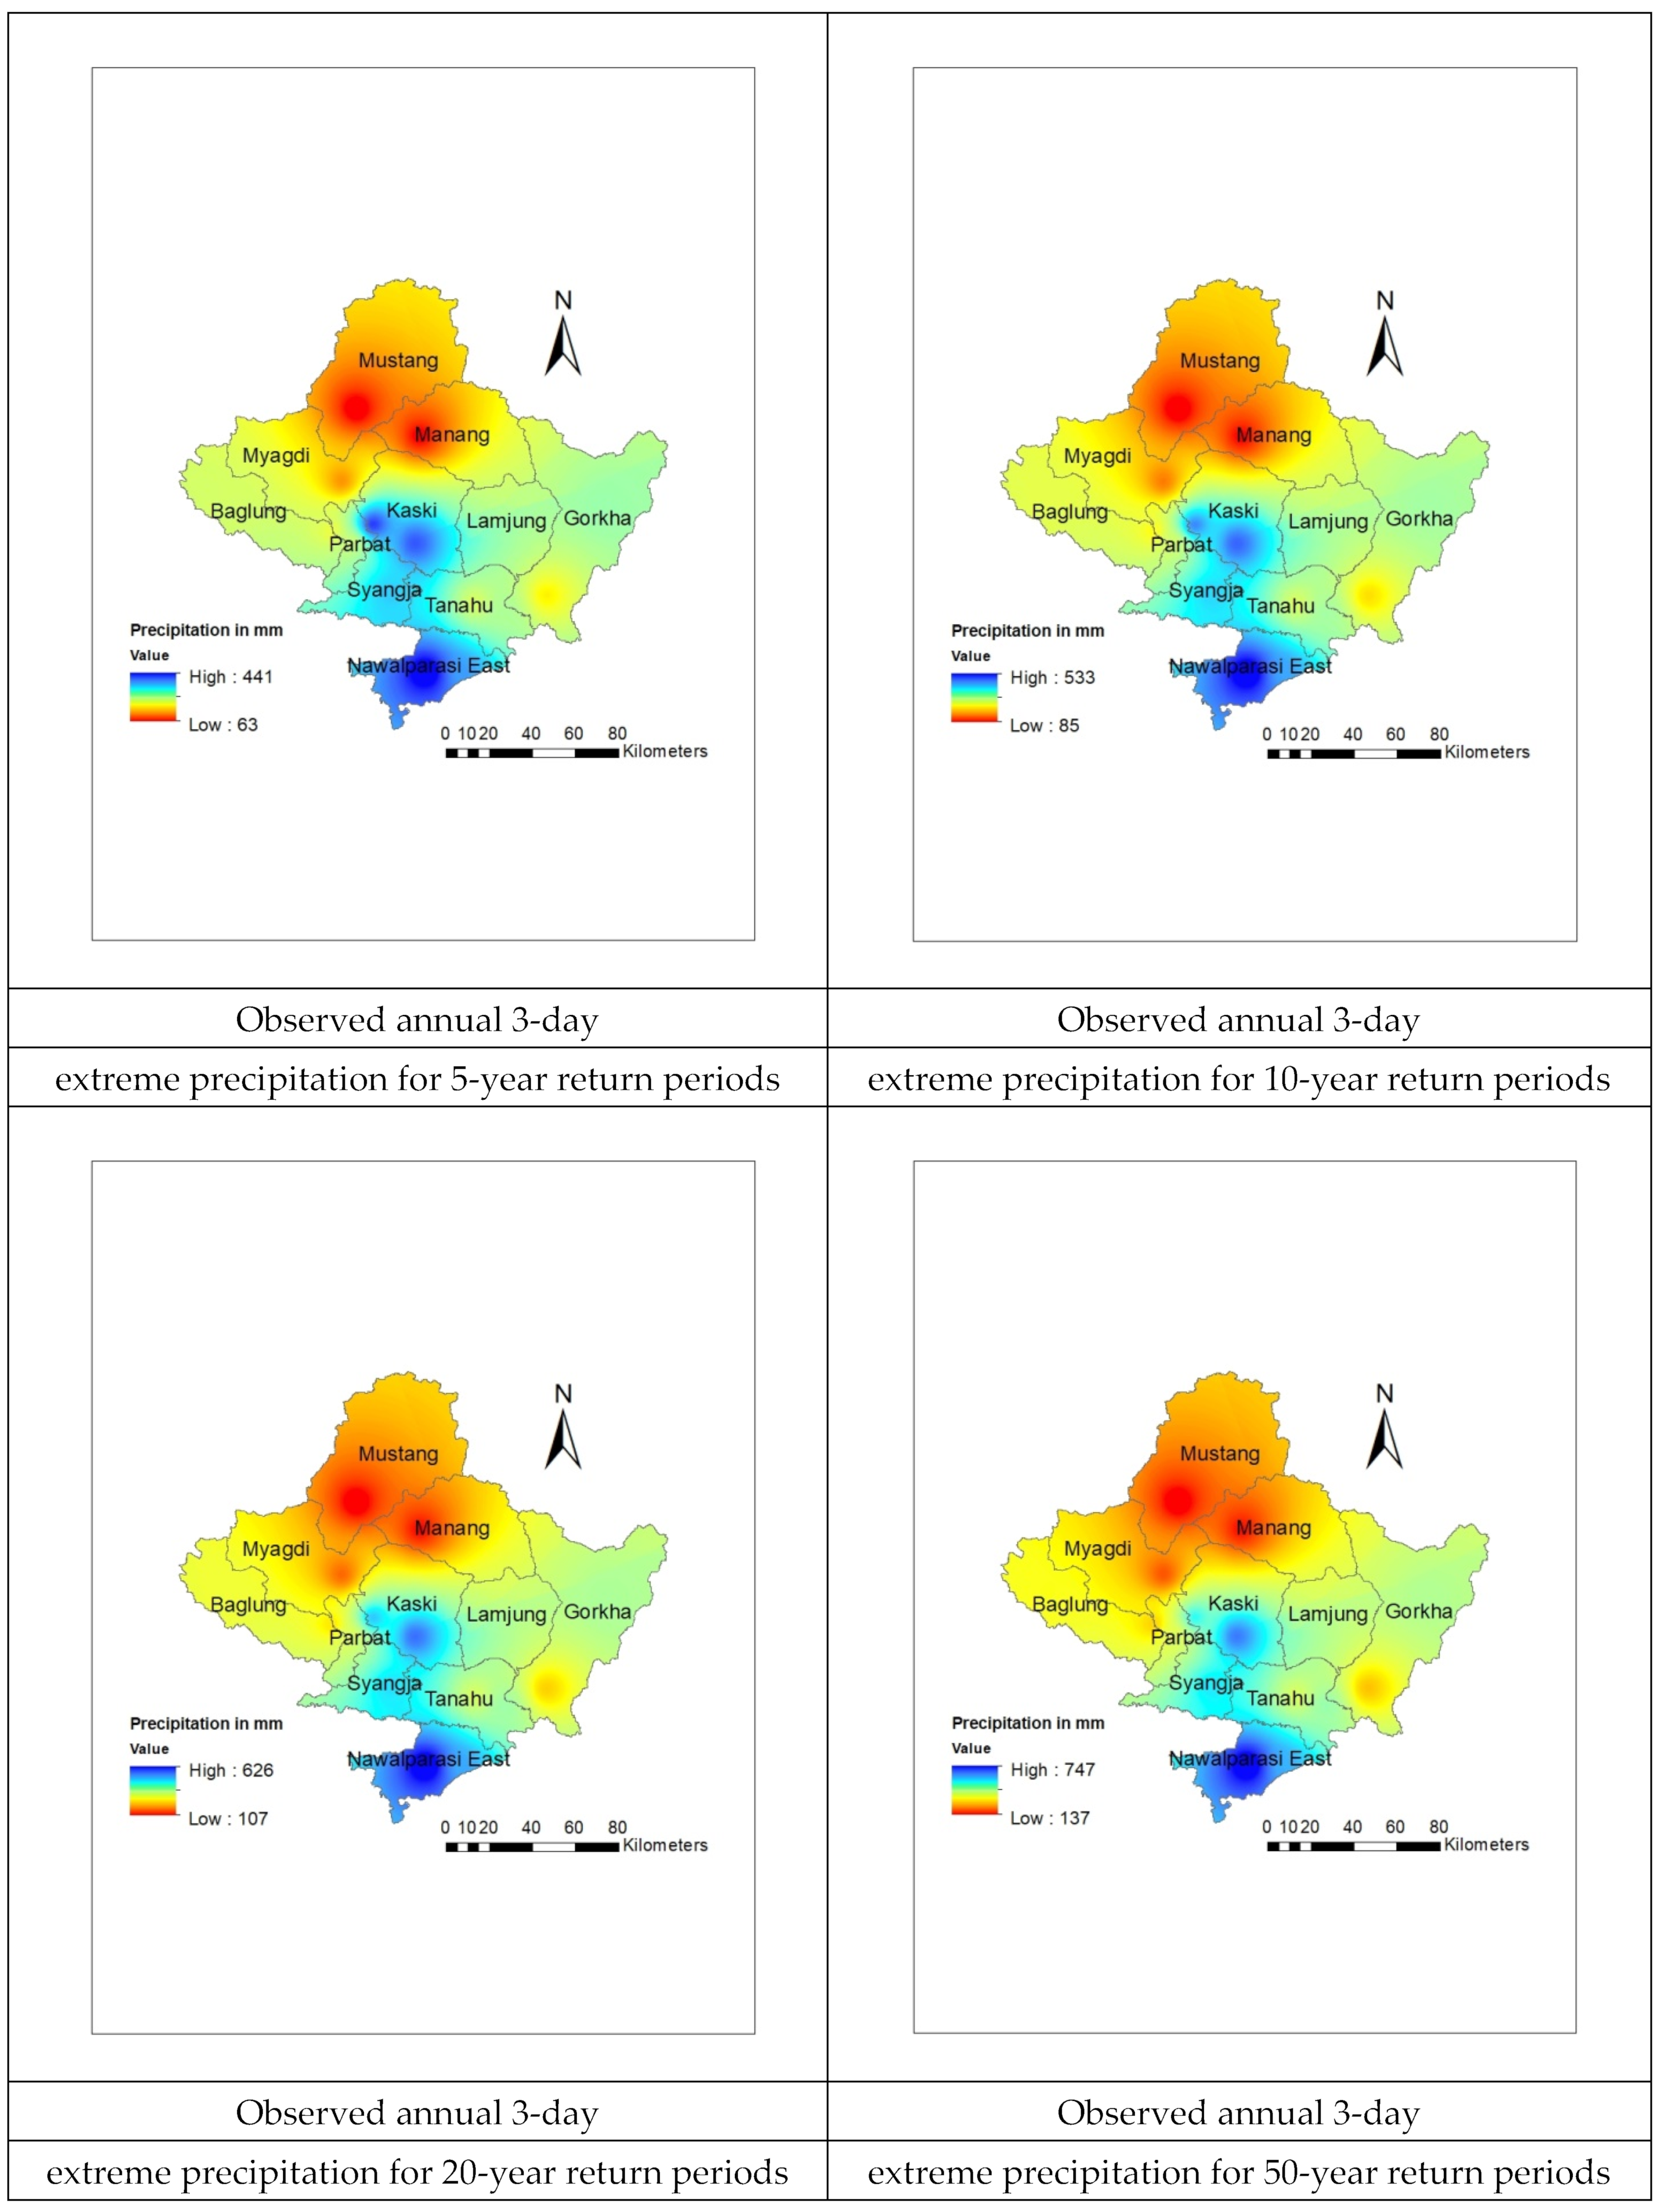
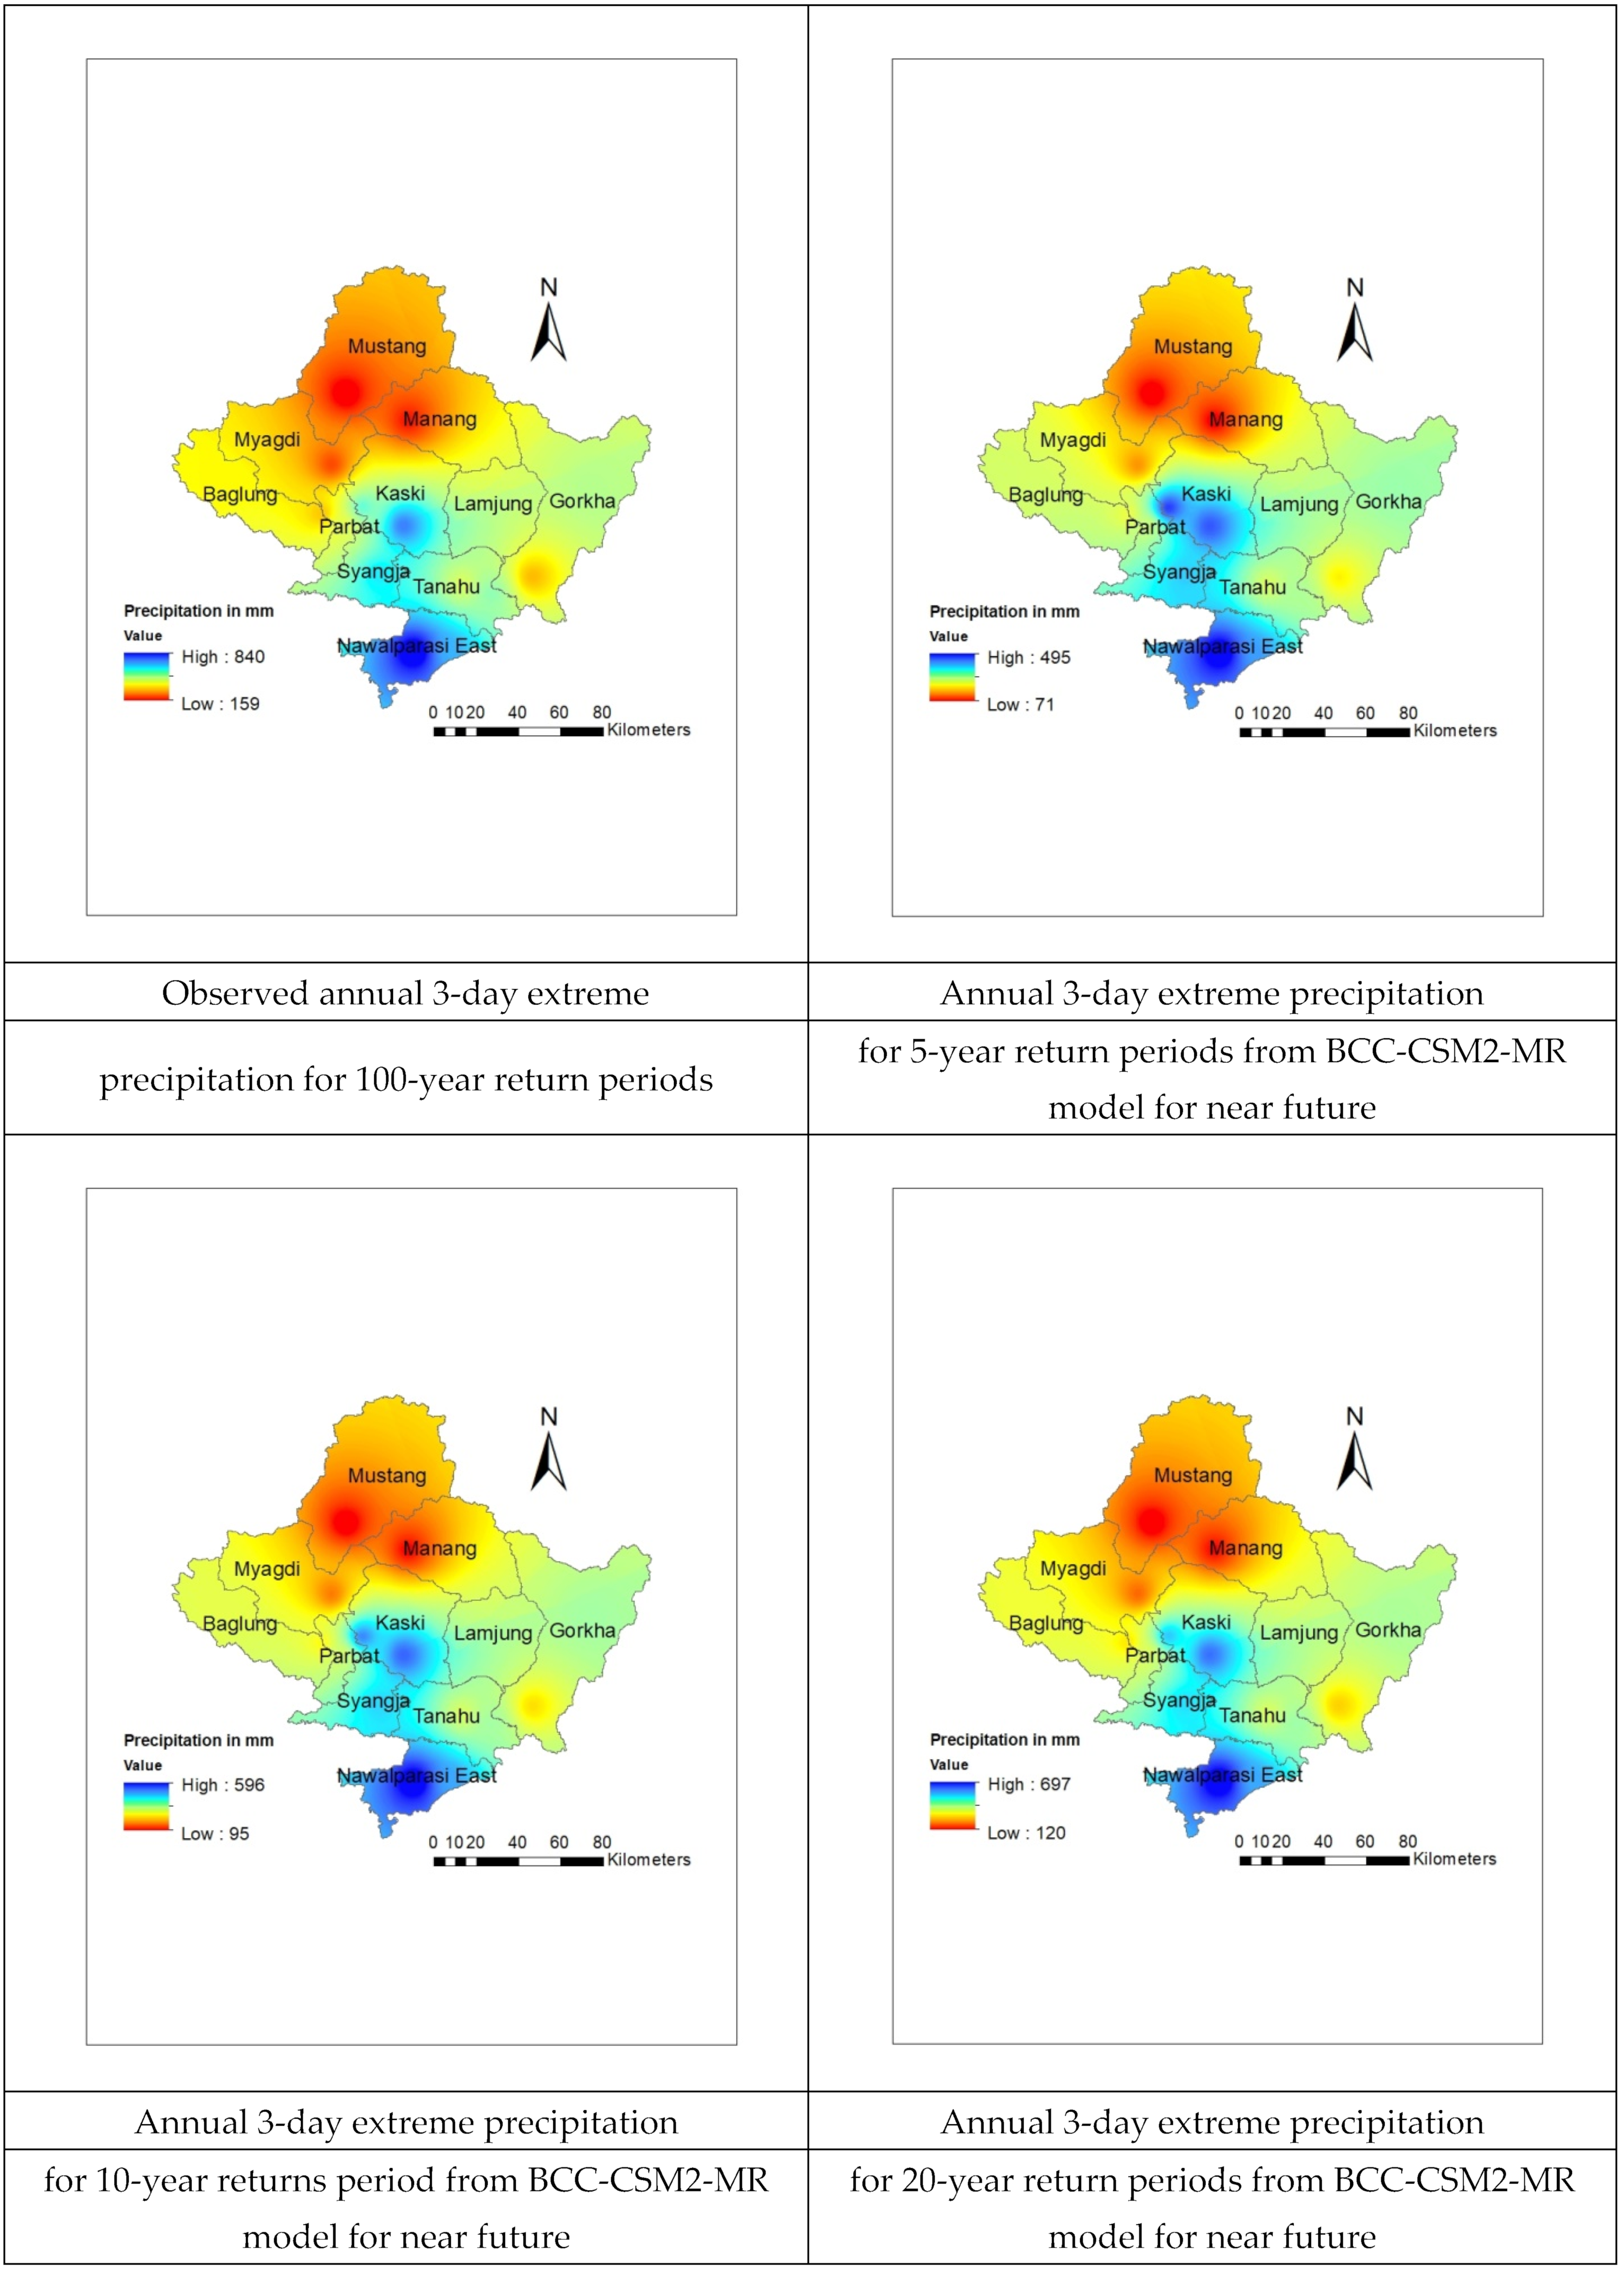
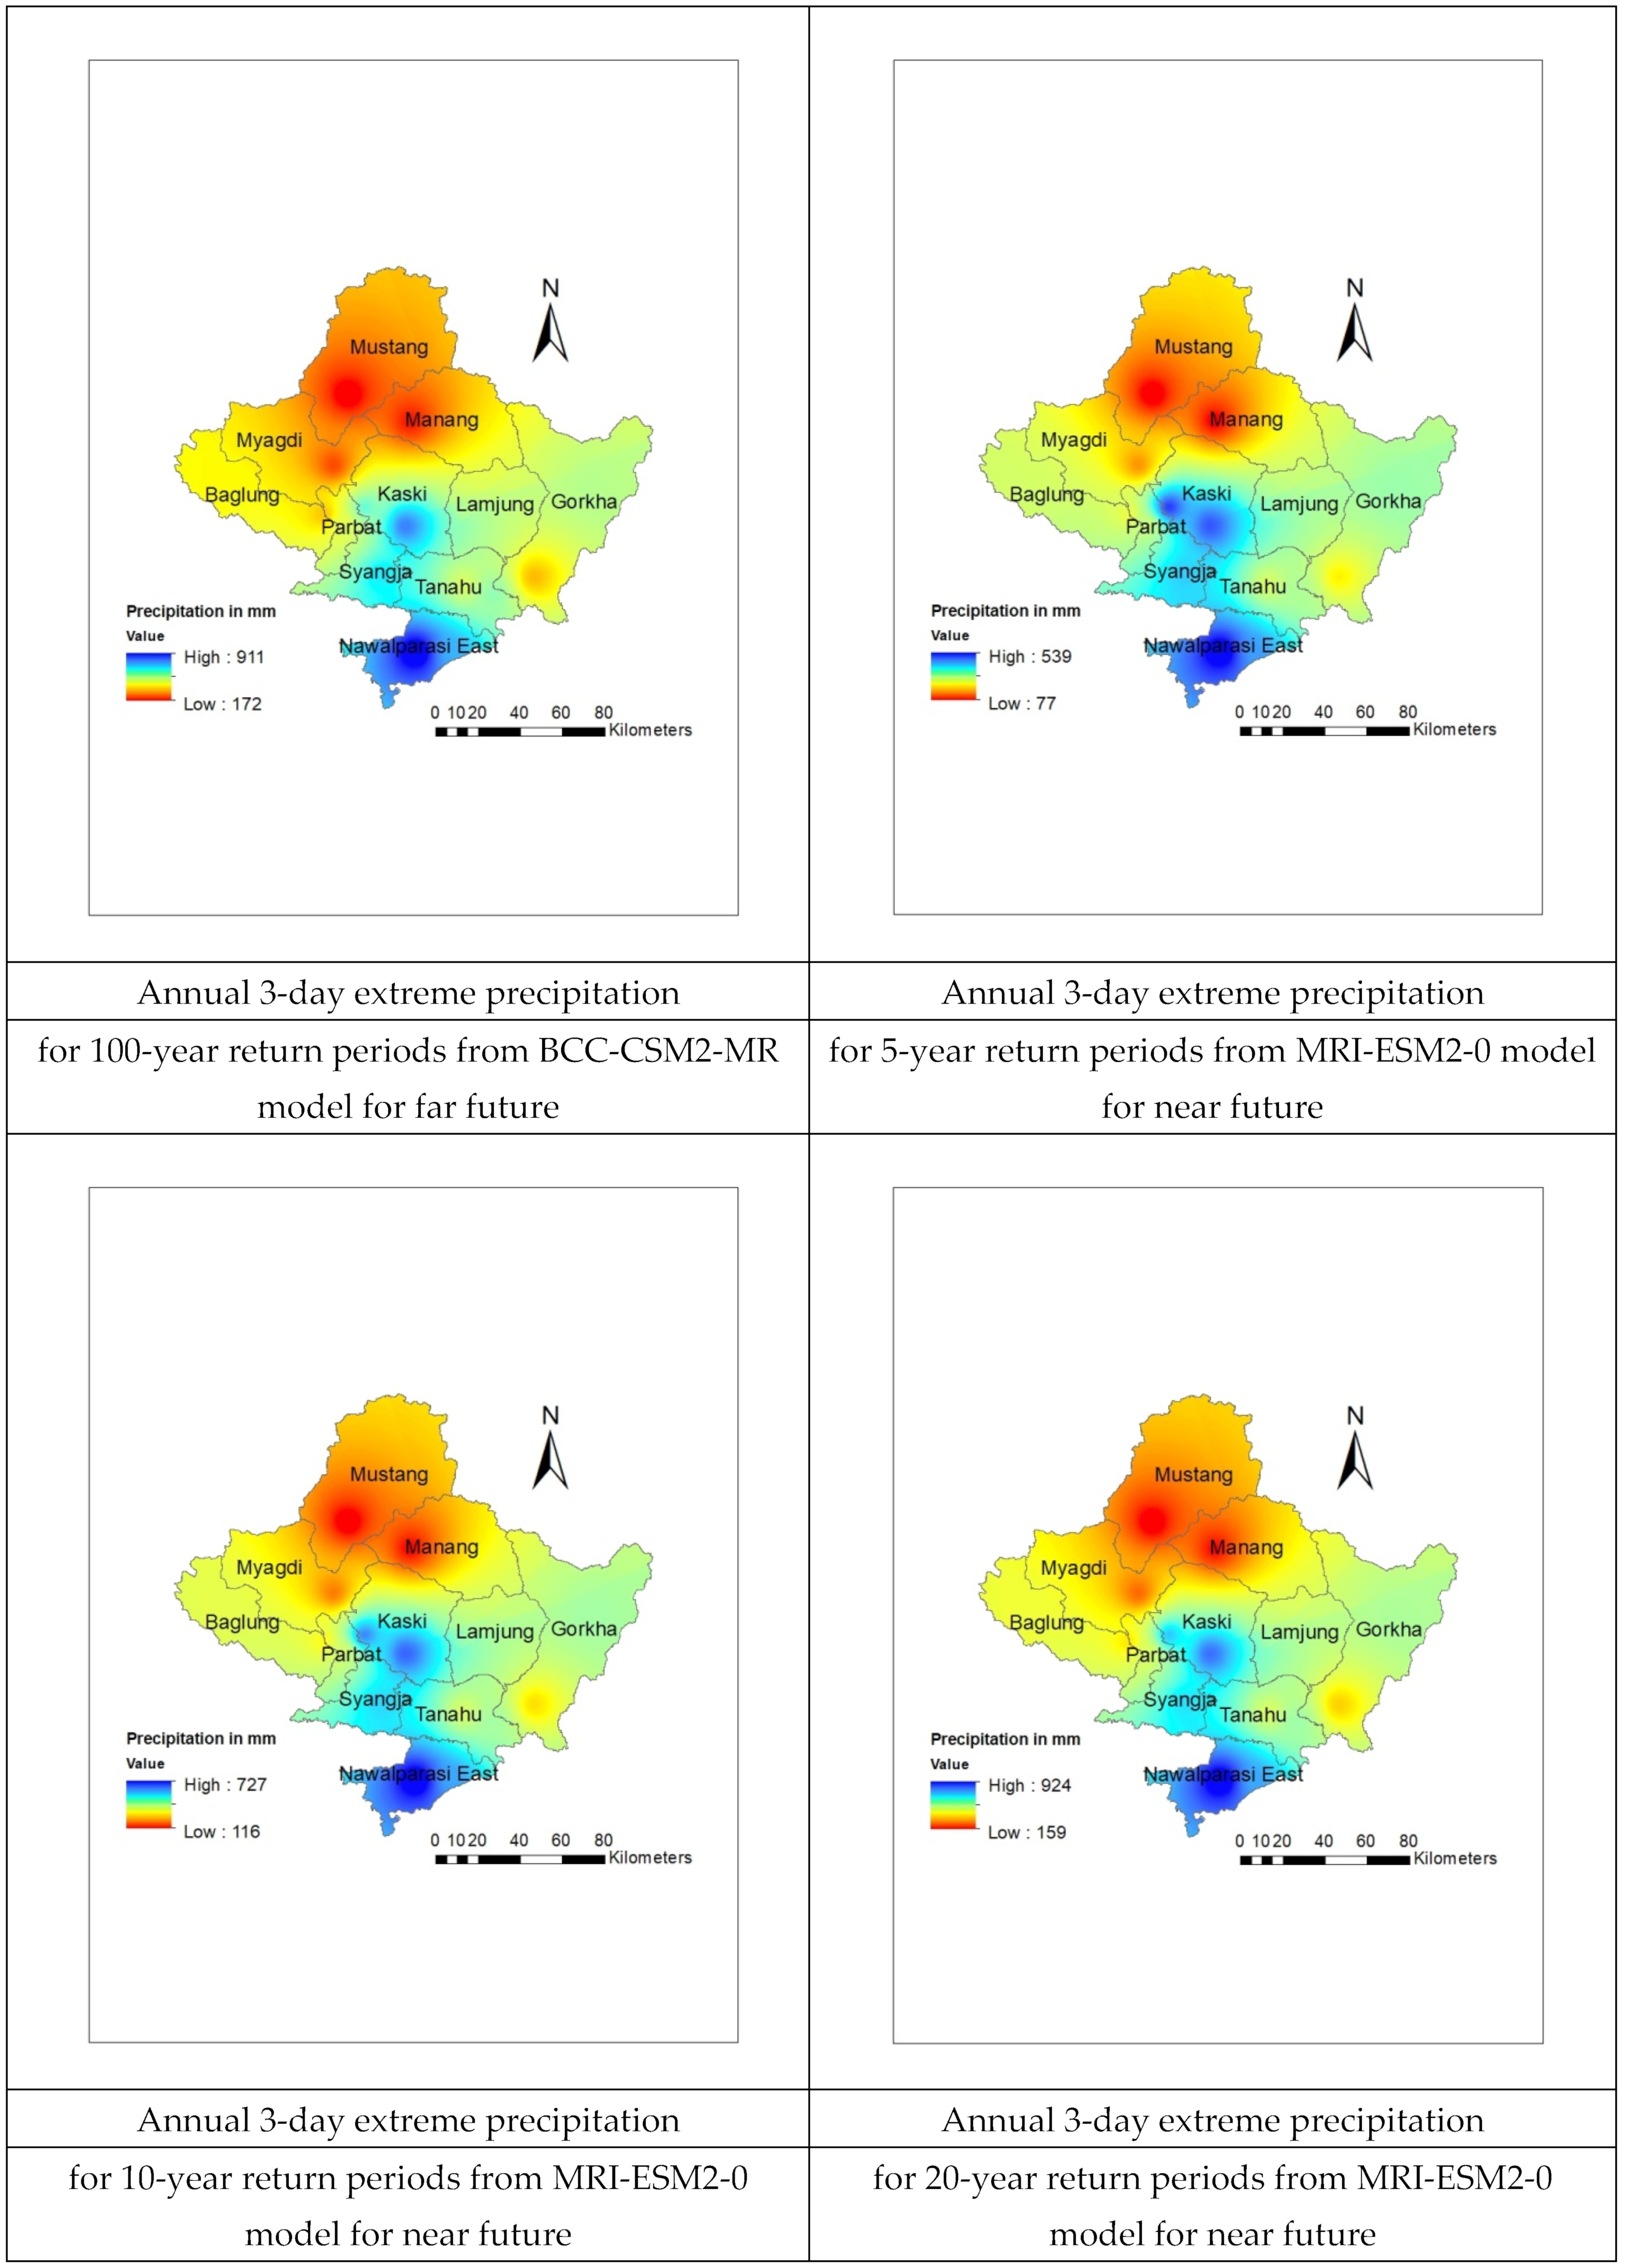
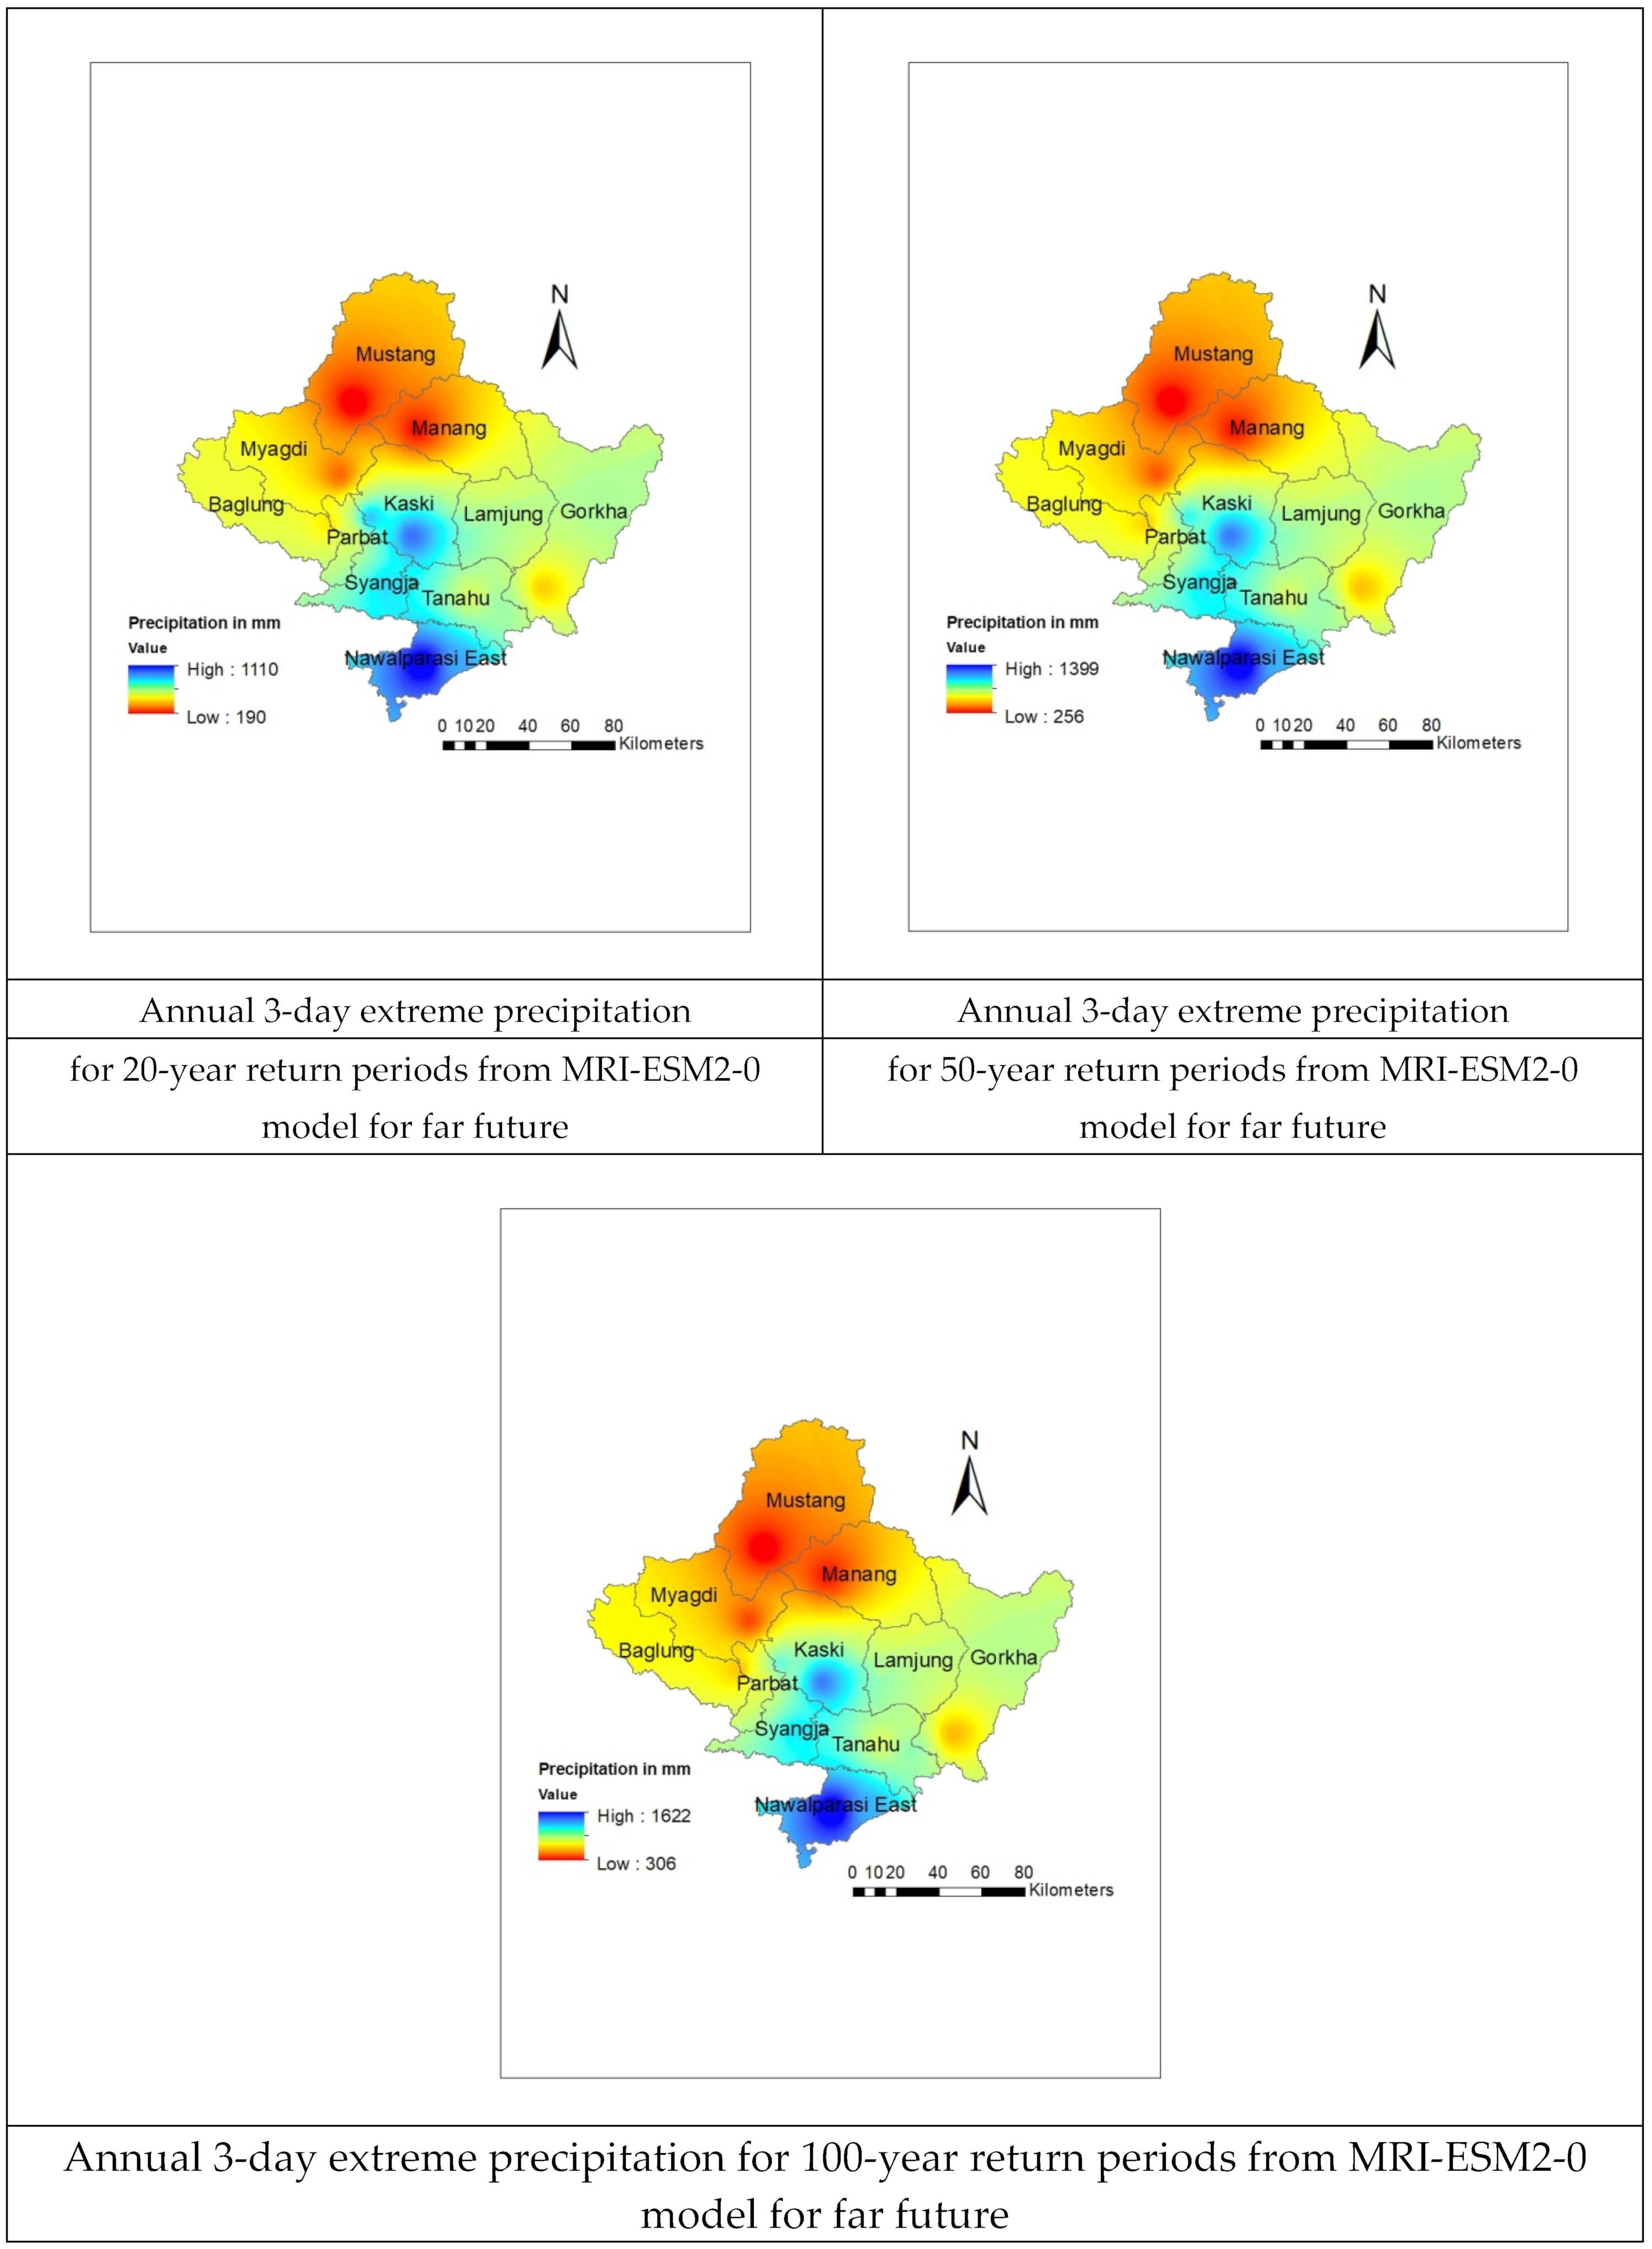
Similarly, Figure 10 shows the spatial distribution of annual three-day extreme precipitation for a 100-year return-period output from the graphical analysis from the MRI-ESM2-0, under the SSP2–4.5 and SSP5–8.5 scenarios for the far future (2081–2100), relative to 1995–2014. ArcGIS was used to visualize the observed and projected extreme precipitation with a cell size of 100 m over the Gandaki Province. As shown in Figure 10, the blue color indicates the highest precipitation among the study areas, whereas the red color shows the lowest precipitation.
Extreme precipitation for 5-, 10-, 20-, 50-, and 100-year return periods was predicted to be higher in Nawalparasi East, Kaski, Syangja, and the Western parts of the Tanahun district, respectively, whereas the Mustang and Manang districts showed the least precipitation. The BCC-CSM2-MR and MRI-ESM2-0 models showed higher precipitation in Nawalparasi East, Kaski, Syangja, and the western part of Tanahun. The Mustang and Manang districts showed the lowest precipitation (see Appendix B, Figure A16). The highest precipitation for annual three-day extreme precipitation was projected to be 1622 mm.
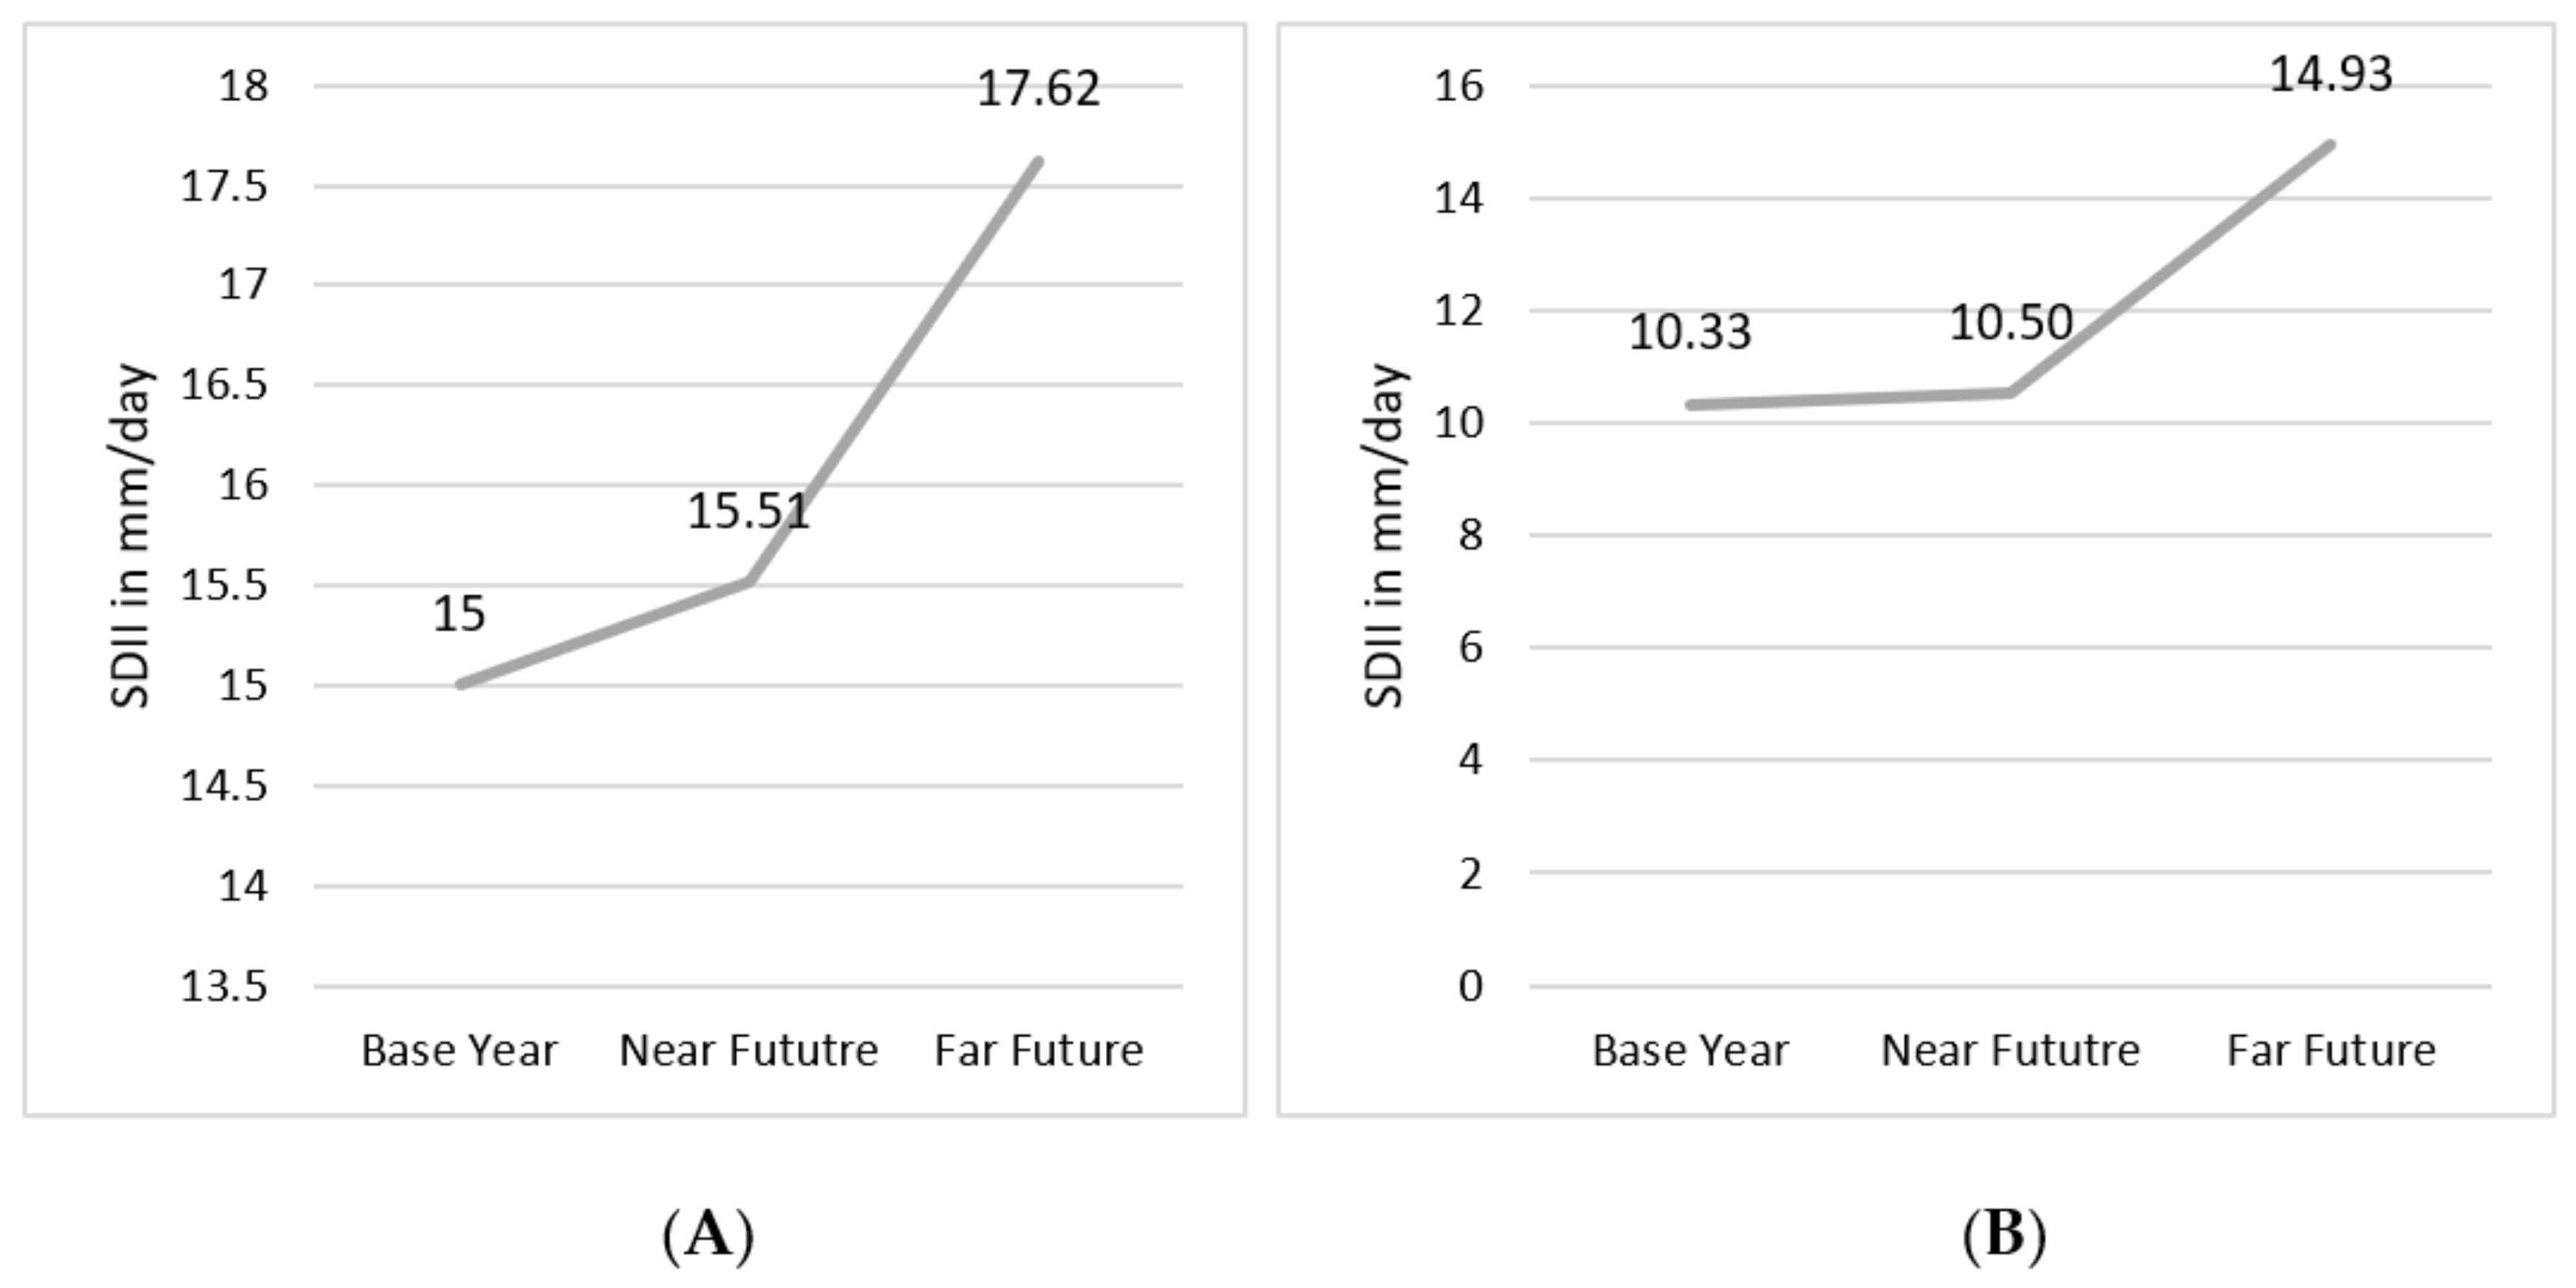
3.2.5. SDI Index
The simple precipitation intensity index was computed by taking the sum of precipitation on wet days (days with >1 mm of precipitation) and dividing that by the number of wet days in the period. This gives the mean precipitation on wet days. We computed wet days only from June to September in this study because June–September is the rainy season in this province.
The SDII in the base year was 15 mm/day, which is considered to increases by about 3% and 17% in the near future (2021–2040) and far future (2081–2100), respectively, based on the BCC-CSM2-MR model shown in Figure 11A. The SDII, on the other hand, was projected to increase by 2% and 44% in the near future (2021–2040) and far future (2081–2100), respectively, based on MRI-ESM2-0, where the SDII in the base year is 10.33 mm/day as shown in Figure 11B.
4. Discussion
Using observed data and GCMs data produced from CMIP6, this study explored projected changes in precipitation extremes across the Gandaki Province, Nepal. The study used a subset of ETCCDI’s precipitation indices to examine extreme events in two future timelines: the near future (2021–2040) and the far future (2081–2100). From the various studies, CMIP6, MIP, SSP2–4.5, and SSP5–8.5, scenarios were used for the projection of extreme events over the study area [16]. A Multi-Model Ensemble (MME) enables the clear identification of signal of interest; hence, it spreads the natural variability. Many studies praised CMIP6-MME’s ability to accurately reproduce precipitation extremes when compared to the use of individual models in diverse domains [17].
An examination of extreme estimates revealed the region will have more wet days during the near future (2021–2040) and far future (2081–2100) relative to the baseline period in June–September. An increase of R100 mm around the study area for all regions. It indicated an intensification of very wet events, such as flashfloods, floods, and landslides over the region. Both the increase in RX1day and RX3day precipitation could pose a critical threat to the socioeconomic condition of the region and the government for water-related disaster management in the future. In other words, future extreme precipitation is expected to occur more frequently, meaning that the risk of flooding in these river basins is expected to increase in the future. Extreme rainfall events have serious consequences for economic sectors, such as agriculture, and food security, as these are closely linked to climate change. Maximum precipitation was forecasted in Kaski, Nawalparasi East, Syangja, and the western half of the Tanahun region, raising the risk of future floods and water-related calamities. Due to the lack of precipitation, there is a potential for drought in the future for Mustang, Manang, and the upper portion of the Myagdi.
The findings of these analyses could provide an opportunity to better understand future extreme events predicted by GCMs. Several limitations were identified which have an impact on the current results. Such limitations include the use of few models during the analysis, the use of a limited number of statistical features, the use of a limited number of indices, and the lack of examination of physical mechanisms to aid in a better understanding of the phenomenon of extreme occurrence. GCM precipitation outputs are reported with greater uncertainties, such as too many wet days and smaller intensities. However, a clear characterization of the potential extremes defining the intensity, frequency, and duration remains critical for various stakeholders to make better-informed decisions. More research is needed to investigate the underlying physical features that influence the occurrence of extreme incidences projected for relevant policies, as well as the use of bias-corrected models to reduce inter-model biases. In this study, GCM precipitation output patterns of near-future and far-future periods with respect to the base period were analyzed to characterize climate-change impacts on precipitation output. Statistical and dynamic downscaling techniques are popularly carried out to minimize uncertainties and enhance the quality of climate outputs. The bias-correction technique, a statistical downscaling technique, is applied to minimize discrepancies in the wet days and intensities. These techniques need to be explored and applied for reliable estimates for climate-change impacts on extreme precipitation characteristics.
These findings suggest that water-related disasters could be common in the study area, and that they are likely to become more common in the future, as a result of pronounced climate change, which will either increase precipitation or change the nature of precipitation so that it is short-lived and high in intensity. It is better to prepare for mitigation and adaptation measures to deal with the adverse situation in the future by reducing the disaster.
5. Conclusions
The study investigated the potential impact of climate change on future extreme precipitation over the Gandaki Province, using observed and the latest GCMs of CMIP6 with 100 km resolution. The analysis was carried out by using five extreme precipitation indices defined by ETCCDI. They are R50 mm, R100 mm, SDII, RX1day, and RX3day.
For the JJAS season, with respect to the base year (1995–2014), SDII indices were projected to increase in both the near future (2021–2040) and the far future (2081–2100) from the BCC-CSM2-MR model, whereas the MRI-ESM2-0 model shows a dramatic increase in the far future (2081–2100). However, RX50 mm was projected to be slightly lower in the far future (2081–2100), as compared to the near future (2021–2040), with MRI-ESM2-0. There was no RX100 mm observed in the base year, but there was an increase in both the near future (2021–2040) and the far future (2081–2100). Similarly, both the RX1day and RX3day showed an extensive increase in precipitation in the near future and far future. Overall, the indices indicated that future extreme precipitation in the study area would increase with respect to the base year (1995–2014).
The monsoonal circulation of South Asia has a significant impact on Nepal, which is located on the southern edge of the Himalayas [18]. This study showed the more extensive precipitation in the future as compared to a previous study that the downscaling of GCM [11]. On the basis of this study, immediate mitigation and adaptation measures shall be implemented to avoid uncontrollable consequences. Furthermore, further research should be carried out to evaluate the potential population exposure to forecasted precipitation extremes.
Extreme precipitation is increasing in the future, posing floods and landslides, so it is suggested for policymakers and water-related structure designers to consider revised return-period rainfall during the structure design of constructions such as bridges and dams. It is also advised to revise the design guidelines and adopt the suitable mitigation measures.
6. Dedication
This is dedicated to my father, Hum Nath Pandey, who died in the flood.
Author Contributions
Writing–original draft, S.P.; Writing–review & editing, B.K.M. All authors have read and agreed to the published version of the manuscript.
Funding
This research received no external funding.
Institutional Review Board Statement
Not applicable.
Informed Consent Statement
Not applicable.
Data Availability Statement
Not applicable.
Conflicts of Interest
The authors declare no conflict of interest.
Appendix A. Observed Annual Daily Maximum Precipitation of Study Area
Figure A1.
Observed annual daily maximum precipitation of Kushma, Parbat.

Figure A2.
Observed annual daily maximum precipitation of Bobang, Baglung.

Figure A3.
Observed annual daily maximum precipitation of Beluwa Girwari, Nawalpur.

Figure A4.
Observed annual daily maximum precipitation of Dumkauli, Nawalpur.

Figure A5.
Observed annual daily maximum precipitation of Bandipur, Tanahun.

Figure A6.
Observed annual daily maximum precipitation of Damauli, Tanahun.

Figure A7.
Observed annual daily maximum precipitation of Khudi Bazar, Lamjung.

Figure A8.
Observed annual daily maximum precipitation of Gorkha.

Figure A9.
Observed annual daily maximum precipitation of Manang Bhot, Manang.

Figure A10.
Observed annual daily maximum precipitation of Jomsom, Mustang.

Figure A11.
Observed annual daily maximum precipitation of Tatopani, Myadi.

Figure A12.
Observed annual daily maximum precipitation of Syangja.

Figure A13.
Observed annual daily maximum precipitation of Pokhara Airport, Kaski.

Figure A14.
Observed annual daily maximum precipitation of Lumle, Kaski.

Appendix B. Spatial Variation of Forecasted Return Periods Precipitation
Figure A15.
Projected spatial annual daily extreme precipitation.


Figure A16.
Projected spatial annual 3-day extreme precipitation.


References
- Basnet, K.; Shrestha, A.; Joshi, P.C.; Pokharel, N. Analysis of Climate Change Trend in the Lower Kaski District of Nepal. Himal. J. Appl. Sci. Eng. 2020, 1, 11–22. [Google Scholar] [CrossRef]
- Chikosi, E.S.; Mugambiwa, S.S.; Tirivangasi, H.M.; Rankoana, S.A. Climate change and variability perceptions in Ga-Dikgale community in Limpopo Province, South Africa. Int. J. Clim. Chang. Strateg. Manag. 2019, 11, 392–405. [Google Scholar] [CrossRef] [Green Version]
- Mansell, M.G. The effect of climate change on rainfall trends and flooding risk in the West of Scotland. Nord. Hydrol. 1997, 28, 37–50. [Google Scholar] [CrossRef]
- Karki, R.; Hasson, S.U.; Schickhoff, U.; Scholten, T.; Böhner, J. Rising precipitation extremes across Nepal. Climate 2017, 5, 4. [Google Scholar] [CrossRef] [Green Version]
- Pariyar, S.K.; Keenlyside, N.; Sorteberg, A.; Spengler, T.; Bhatt, B.C.; Ogawa, F. Factors affecting extreme rainfall events in the South Pacific. Weather Clim. Extrem. 2020, 29, 100262. [Google Scholar] [CrossRef]
- Nayava, J.L. Heavy Monsoon Rainfall in Nepal. Weather 1974, 29, 443–450. [Google Scholar] [CrossRef]
- Shrestha, A.B.; Wake, C.P.; Mayewski, P.A.; Dibb, J.E. Maximum temperature trends in the Himalaya and its vicinity: An analysis based on temperature records from Nepal for the period 1971–1994. J. Clim. 1999, 12, 2775–2786. [Google Scholar] [CrossRef]
- Oruc, S. Investigation of The Effect of Climate Change on Extreme Precipitation: Tekirdağ Case. Turk. J. Water Sci. Manag. 2020, 4, 136–161. [Google Scholar] [CrossRef]
- Ye, W.; Li, Y. A method of applying daily GCM outputs in assessing climate change impact on multiple day extreme precipitation for Brisbane River Catchment, MODSIM11. In Proceedings of the 19th International Congress on Modelling and Simulation, Canberra, Australia, 12–16 December 2011; Chan, F., Marinova, D., Anderssen, R.S., Eds.; Modelling and Simulation Society of Australia and New Zealand: Canberra, Australia, 2011; pp. 3678–3683. [Google Scholar]
- Basnet, K.; Paudel, R.C.; Sherchan, B. Analysis of Watersheds in Gandaki Province, Nepal Using QGIS. Tech. J. 2019, 1, 16–28. [Google Scholar] [CrossRef]
- Khadka, D.; Pathak, D. Climate change projection for the marsyangdi river basin, Nepal using statistical downscaling of GCM and its implications in geodisasters. Geoenviron. Disasters 2016, 3, 1–15. [Google Scholar] [CrossRef]
- Mishra, B.K.; Mansoor, A.; Saraswat, C.; Gautam, A. Climate change adaptation through optimal stormwater capture measures. APN Sci. Bull. 2019, 9, 28–37. [Google Scholar] [CrossRef] [Green Version]
- Mishra, B.K. Precipitation change assessment over upper Bagmati river basin using regional bias corrected GCM data. Int. J. Water 2017, 11, 294–313. [Google Scholar] [CrossRef]
- Martel, J.L.; Mailhot, A.; Brissette, F.; Caya, D. Role of natural climate variability in the detection of anthropogenic climate change signal for mean and extreme precipitation at local and regional scales. J. Clim. 2018, 31, 4241–4263. [Google Scholar] [CrossRef] [Green Version]
- Ghimire, P. A Review of Studies on Climate Change in Nepal. Geogr. Base 2019, 6, 11–20. [Google Scholar] [CrossRef]
- Ayugi, B.; Tan, G.; Ruoyun, N.; Babaousmail, H.; Ojara, M.; Wido, H.; Mumo, L.; Ngoma, N.H.; Nooni, I.K.; Ongoma, V. Quantile mapping bias correction on rossby centre regional climate models for precipitation analysis over Kenya, East Africa. Water 2020, 12, 801. [Google Scholar] [CrossRef] [Green Version]
- Ouali, D.; Cannon, A.J. Estimation of rainfall intensity–duration–frequency curves at ungauged locations using quantile regression methods. Stoch. Environ. Res. Risk Assess. 2018, 32, 2821–2836. [Google Scholar] [CrossRef]
- Baidya, S.K.; Shrestha, M.L.; Sheikh, M.M. Trends in Daily Climatic Extremes of Temperature and Precipitation in Nepal. J. Hydrol. Meteorol. 2008, 5, 47–50. [Google Scholar]
Figure 1.
Conceptual framework for this study.

Figure 2.
(a) Map of Nepal, showing Gandaki Province. (b) Elevation variation across Gandaki Province. (c) River network inside Gandaki Province.
Figure 2.
(a) Map of Nepal, showing Gandaki Province. (b) Elevation variation across Gandaki Province. (c) River network inside Gandaki Province.


Figure 3.
Observed annual daily maximum precipitation trend of (A) Baglung and (B) Lamjung.

Figure 4.
Number of days having greater than 50 mm precipitation (A) from the BCC-CSM2-MR model and (B) from the MRI-ESM2-0 model.
Figure 4.
Number of days having greater than 50 mm precipitation (A) from the BCC-CSM2-MR model and (B) from the MRI-ESM2-0 model.

Figure 5.
Number of days having greater than 100 mm precipitation (A) from the BCC-CSM2-MR model and (B) from the MRI-ESM2-0 model.
Figure 5.
Number of days having greater than 100 mm precipitation (A) from the BCC-CSM2-MR model and (B) from the MRI-ESM2-0 model.

Figure 6.
Logarithmic equation for the BCC-CSM2-MR model in the base year.

Figure 7.
The projected daily extreme precipitation percentage (A) from the BCC-CSM2-MR model and (B) from the MRI-ESM2-0 model.
Figure 7.
The projected daily extreme precipitation percentage (A) from the BCC-CSM2-MR model and (B) from the MRI-ESM2-0 model.

Figure 8.
The 100-year return period’s precipitation from the MRI-ESM2-0 model for the near future.

Figure 9.
The projected 3-day extreme precipitation percentage (A) from the BCC-CSM2-MR model and (B) from the MRI-ESM2-0 model.
Figure 9.
The projected 3-day extreme precipitation percentage (A) from the BCC-CSM2-MR model and (B) from the MRI-ESM2-0 model.

Figure 10.
Annual 3-day extreme precipitation for 100-year return periods from the MRI-ESM2-0 model for the far future.
Figure 10.
Annual 3-day extreme precipitation for 100-year return periods from the MRI-ESM2-0 model for the far future.

Figure 11.
SDII for June–September (A) from BCC-CSM2-MR model and (B) from MRI-ESM2-0 model.


Table 1.
List of meteorological stations used in this study.
| SN | Station ID | Station Name | District | Latitude | Longitude | Altitude (m) | Period | Types of Station |
|---|---|---|---|---|---|---|---|---|
| 1 | 601 | Jomsom | Mustang | 28°47′ | 8°343′ | 2744 | 2003–2020 | Climatology |
| 2 | 605 | Baglung | Baglung | 28°16′ | 83°36′ | 984 | 2003–2020 | Climatology |
| 3 | 606 | Tatopani | Myagdi | 28°29′ | 83°39′ | 1243 | 2003–2020 | Precipitation |
| 4 | 614 | Kushma | Parbat | 28°13′ | 83°42′ | 891 | 2003–2020 | Climatology |
| 5 | 615 | Bobang | Baglung | 28°24′ | 83°06′ | 2273 | 2003–2020 | Precipitation |
| 6 | 704 | Beluwa/Girwari | Nawalpur | 27°41′ | 84°03′ | 150 | 2003–2020 | Precipitation |
| 7 | 706 | Dumkauli | Nawalpur | 27°41′ | 84°13′ | 154 | 2003–2020 | Agrometrology |
| 8 | 802 | Khudi Bazar | Lamjung | 28°22′ | 84°54′ | 1334 | 2003–2020 | Climatology |
| 9 | 804 | Pokhara Airport | Kaski | 28°13′ | 84°00′ | 827 | 1995–2020 | Aeronautical |
| 10 | 805 | Syangja | Syangja | 28°06′ | 83°53′ | 868 | 2003–2020 | Climatology |
| 11 | 808 | Bandipur | Tanahun | 27°56′ | 84°25′ | 965 | 2003–2020 | Climatology |
| 12 | 809 | Gorkha | Gorkha | 28°00′ | 84°37′ | 1097 | 2003–2020 | Agrometrology |
| 13 | 814 | Lumle | Kaski | 28°18′ | 83°48′ | 1740 | 1995–2020 | Agrometrology |
| 14 | 817 | Damauli | Tanahun | 27°58′ | 84°17′ | 358 | 2003–2020 | Climatology |
| 15 | 820 | Manang Bhot | Manang | 28°40′ | 84°01′ | 3420 | 2003–2020 | Climatology |
Source: Department of Hydrology and Meteorology, 2021.
Table 2.
Information of the CMIP6 climate models used in this study.
| SN | Models | Institution | Resolution |
|---|---|---|---|
| 1 | BCC-CSM2-MR | Beijing Climate Center and China Meteorological Administration, China | 1.13° × 1.13° |
| 2 | MRI-ESM2-0 | Meteorological Research Institute (MRI), Japan | 1.13° × 1.13° |
Table 3.
Extreme climate indices used in studies.
| Label | Index Name | Index Definition | Unit |
|---|---|---|---|
| R50 mm | Heavy precipitation days | Number of days where PRij 1 > 50 mm of a given period | Days |
| R100 mm | Very heavy precipitation days | Number of days where PRij 1 > 100 mm of a given period | Days |
| RX1day | Max 1-day precipitation | RX1dayj = max (PRij), the maximum 1-day precipitation for period j | mm |
| RX3day | Max 3-day precipitation | RX3dayj = max (PRkj), the maximum 3-day precipitation for period j | mm |
| SDII | No. of rainy days June–September | Total rainfall June–September/No. of rainy days June–September | mm/day |
Publisher’s Note: MDPI stays neutral with regard to jurisdictional claims in published maps and institutional affiliations. |
© 2022 by the authors. Licensee MDPI, Basel, Switzerland. This article is an open access article distributed under the terms and conditions of the Creative Commons Attribution (CC BY) license (https://creativecommons.org/licenses/by/4.0/).
Share and Cite
MDPI and ACS Style
Pandey, S.; Mishra, B.K. Spatial and Temporal Analysis of Extreme Precipitation under Climate Change over Gandaki Province, Nepal. Architecture 2022, 2, 724-759. https://doi.org/10.3390/architecture2040039
AMA Style
Pandey S, Mishra BK. Spatial and Temporal Analysis of Extreme Precipitation under Climate Change over Gandaki Province, Nepal. Architecture. 2022; 2(4):724-759. https://doi.org/10.3390/architecture2040039
Chicago/Turabian StylePandey, Sudip, and Binaya Kumar Mishra. 2022. "Spatial and Temporal Analysis of Extreme Precipitation under Climate Change over Gandaki Province, Nepal" Architecture 2, no. 4: 724-759. https://doi.org/10.3390/architecture2040039