Article

Fiberglass as a Novel Building Material: A Life Cycle Assessment of a Pilot House

by
Stavroula Bjånesøy
1,
Jukka Heinonen
1,*,
Ólafur Ögmundarson
2,
Áróra Árnadóttir
1 and
Björn Marteinsson
1
1
Faculty of Civil and Environmental Engineering, University of Iceland, Hjardarhagi 2-6, 107 Reykjavik, Iceland
2
Faculty of Food Science and Nutrition, University of Iceland, Aragata 14, 101 Reykjavik, Iceland
*
Author to whom correspondence should be addressed.
Architecture 2022, 2(4), 690-710; https://doi.org/10.3390/architecture2040037
Submission received: 19 September 2022 / Revised: 19 October 2022 / Accepted: 28 October 2022 / Published: 1 November 2022

Abstract

:
Alternative building materials have the potential to reduce environmental pressure from buildings, though the use of these materials should be guided by an understanding of the embodied environmental impacts. Extensive research on embodied greenhouse gas emissions from buildings has been conducted, but other impacts are less frequently reported. Furthermore, uncertainty is rarely reported in building LCA studies. This paper provides a piece for filling those gaps by comprehensively reporting the embodied environmental impacts of a fiberglass house within the LCA framework, modeled in the OpenLCA software using the Ecoinvent 3.7.1 inventory database. The ReCiPe 2016 impact assessment method is used to report a wide range of environmental impacts. The global warming potential is calculated to be 311 kgCO2 eq/m2. Additionally, a hotspot analysis is included to identify areas that should be the focus for improvement, as well as an uncertainty analysis based on Monte Carlo. The embodied emissions are given context by a scenario analysis over a 50-year use phase in three different grid conditions and with two different energy efficiency levels. Based on the results of this study, it is determined that fiberglass does not provide a viable alternative to conventional building materials if the purpose is to reduce embodied emissions from buildings.

1. Introduction

We are currently facing the threat of climate change, largely driven by anthropogenic environmental impacts [1]. Steffen et al. [2] identify 24 socio-economic and Earth system indicators that demonstrate unprecedented human growth coupled with changes to the natural environment that have occurred in the 20th century. They refer to the post-1950 acceleration of Earth system indicators as the ‘Great Acceleration’, demonstrating human impact on the Earth’s systems. The built environment impacts all the Earth system processes, which contributes to the accelerated rate of change we are experiencing. Of particular concern is the built environment’s contribution to greenhouse gas (GHG) emissions, accounting for 36% of global final energy use and 38% of energy-related carbon dioxide (CO2) emissions in 2019 [3]. While the life cycle emissions from buildings have been extensively studied, e.g., [4,5,6], the embodied emissions are often underrepresented, shifting the focus away from the construction phase [6,7,8,9]. Energy-efficient buildings have higher primary energy use for construction and a lower energy requirement for the use phase compared to conventional buildings [10]. With policy driving an increase of use phase energy efficiency in buildings [11], embodied energy becomes more significant. It has become increasingly recognized that reducing use phase impacts should be accompanied by equal attention to embodied impacts [6,12]. To accurately inform policy decisions, more research into embodied impacts from buildings is necessary.
Currently, the most widely used building materials, such as concrete and steel, have high embodied GHG emissions. To minimize embodied emissions and ensure that the positive benefit from increased operational efficiency is not nullified or postponed too far into the future, a transition away from typical high-carbon building materials is essential [4,7,13,14]. It is widely accepted that life-cycle assessment (LCA) is the most comprehensive approach for assessing the environmental impacts associated with buildings [6,15,16]. Much of the focus of building LCA studies has been on traditional building materials, such as concrete, steel, and wood [6], though the positive benefits from substituting conventional building materials with less carbon-intensive alternative materials have been shown to reduce the embodied emissions of new construction projects [17,18,19,20]. There are still significant knowledge gaps about the embodied emissions associated with buildings constructed with non-conventional materials. Fiberglass is one of these new, and so far, not widely utilized alternatives to conventional materials. To date, no LCA studies assess the environmental impacts of fiberglass panels as the main building components in the context of buildings. In a 2020 study, Işildar, Morsali, and Zar Gari [21] assess the environmental impacts of fiberglass-reinforced polymer (GFRP) in the construction context when they compare GFRP to traditional steel rebar. When comparing the environmental impacts from the manufacturing of the same quantities of both GFRP and steel, they report higher overall impacts in most impact categories for GFRP, particularly respiratory inorganics and fossil fuels. The authors call for more research into the impacts and lifetime of this material in the construction industry, given the limited understanding we currently have [21].
Many LCA studies on buildings primarily focus on global warming potential (GWP), representing GHG emissions, e.g., [22,23]. However, this is not the only harmful environmental impact associated with buildings [15]. Other impact categories are less frequently reported, and relatively few studies report those same impact categories. Anand and Amor [24] point out that the justification for the choice of impact categories is often not clear in many building LCA studies, presenting challenges for comparison. To address the gap in literature regarding reported impact categories other than GHG emissions highlighted by Khasreen et al. [25], more transparent and harmonized reporting of various environmental impacts from buildings is necessary to establish a baseline for comparison.
Accounting for uncertainty is a key challenge for LCA, despite efforts to classify and define it, as well as to develop estimation methodologies [26,27]. Applying uncertainty in LCA studies is not common and is a limitation when interpreting results [28]. According to Bamber et al. [28], less than 20% of all LCA studies published in the last 5 years included uncertainty analyses of any kind. Even less reported was propagating uncertainty with a mathematical approach [28], such as Monte Carlo [29], though it is the most common method for mathematical uncertainty analysis in LCA e.g., [30,31,32].
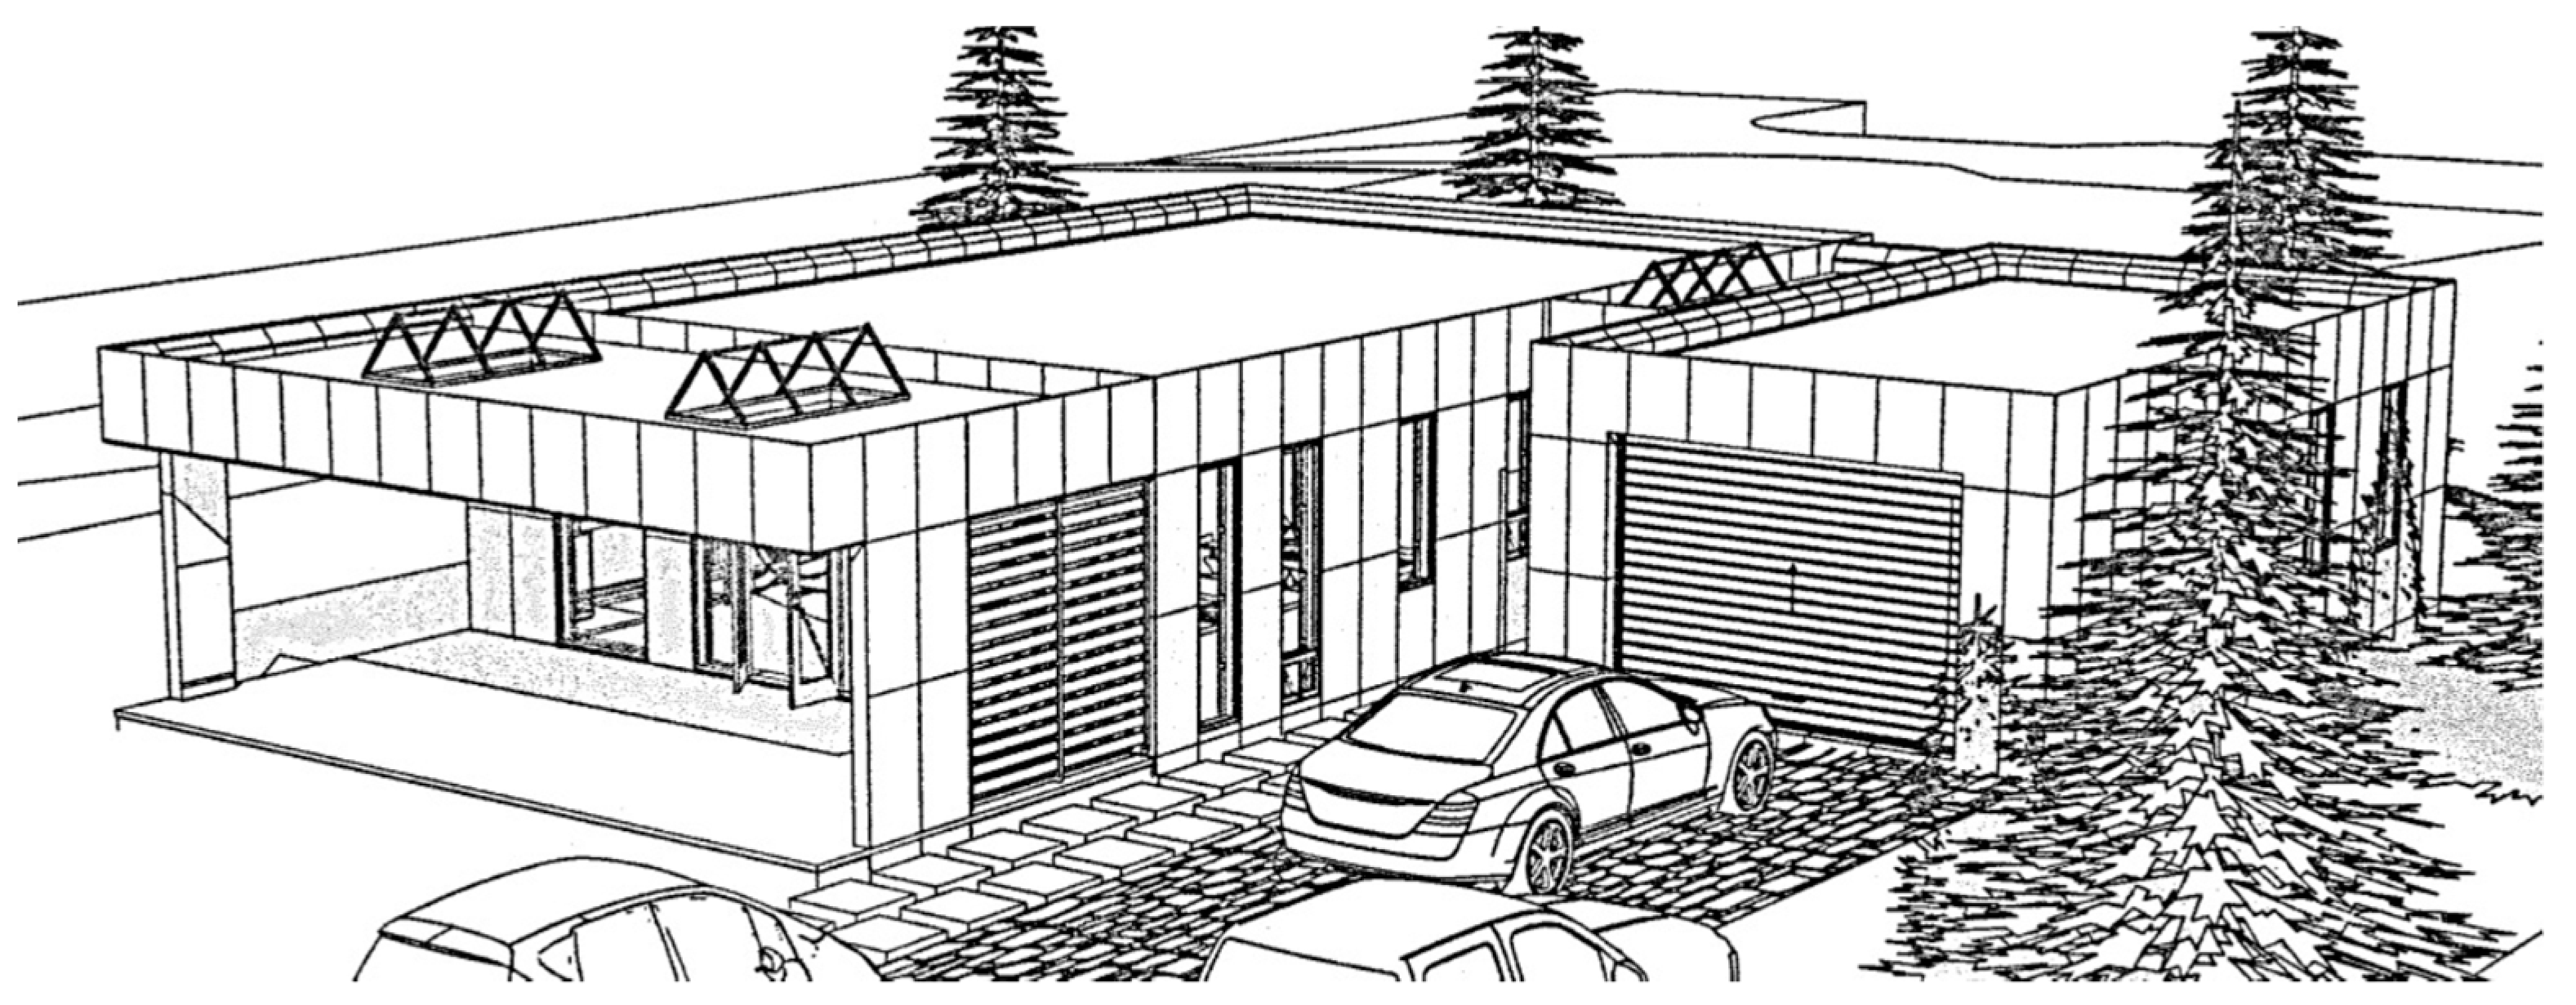
This paper aims to contribute to the research gaps identified above. The embodied emissions and environmental impacts from a newly designed fiberglass modular house in Iceland, employing non-traditional building materials and techniques, are presented within the LCA framework. A wide range of environmental impacts are reported utilizing the ReCiPe midpoint and endpoint impact assessment method. Based on the midpoint results, we identify the main hotspots to show where improvements need to take place if this material is to be used to reduce the embodied emissions in comparison to the conventional options. The climate change impact is put into life cycle perspective by presenting use phase energy use scenarios for three different grid conditions (Iceland, Finland, and Poland) and two different energy efficiency levels. Additionally presented is an uncertainty analysis based on Monte Carlo. The results of this study suggest that fiberglass does not provide a viable alternative to conventional building materials if the purpose is to reduce embodied emissions from buildings, although the uncertainty ranges are significant, calling for more research on this material.

2. Materials and Methods

2.1. Description of the Fiberglass House Case

This study is a case study of a prototype modular residential house concept utilizing fiberglass and stone wool panels as the primary building components. The material inventory is based on the architectural and engineering design plans provided by the producer. Figure 1 shows an architectural rendering of the fiberglass house design. The total area used for the assessment is 186 m2, of which the heated floor area is 106 m2, with an additional 35 m2 semi-open front porch and 45 m2 garage. Table 1 shows the characteristics of the fiberglass house.

2.1.1. Fiberglass Panels

The modular house is composed of prefabricated fiberglass panels, with design for disassembly (DfD), referring to a design strategy that enables easy disassembly and reuse at the end-of-life [34]. While the specific characteristics of the fiberglass panels vary depending on their function, all panels are based on the same principle—a sandwich element with a fiberglass outer shell, filled with stone wool. Figure 2 shows the structure of the fiberglass panels used for the roof, with 2 mm fiberglass on the outer surface and 1.5 mm on the inner surface. The connecting joints are 3 mm fiberglass on each side, with a 3 mm fiberglass support rib every 1200 mm inside of the panels. The stone wool thickness for the roof is 300 mm in total. The main house roof, including the porch, consists of 13 fiberglass panels, and the garage roof is made of 8 fiberglass panels. Details of the fiberglass material are provided in Appendix A.
As with the roof panels, the vertical exterior wall panels (Figure 3) have 2 mm fiberglass on the outer surface, 1.5 mm fiberglass on the inner surface, 3 mm fiberglass connecting joints, and 3 mm support ribs every 1200 mm. The stone wool thickness for these panels is 150 mm, which is half the thickness of the roof panels. The internal vertical wall panels have 1.5 mm fiberglass surfaces and a core of 100 mm of stone wool.

2.1.2. Support Structure

The foundation and floor slab are made of concrete. The fiberglass panels are secured to the foundation with steel support brackets and ten steel columns provide structural support for the two fiberglass H support beams for the roof elements that run horizontally across the length of the house. The fiberglass used for the support has the same composition as the fiberglass used for the fiberglass panels. On the inside of all outer walls and roof, there is a thin wooden frame, making space for electrical and water pipes. Gypsum fiberboard is used as the internal wall finish in the fiberglass house to enhance fire safety and create a better sound environment. It is made from recycled paper, gypsum, and water. Two 13 mm layers of gypsum fiberboard are on all internal walls and the ceiling.

2.2. Method

The method employed in this study is LCA. LCA is a method used to quantify the potential environmental impacts throughout a product’s life cycle [35]. This can include all phases from raw material acquisition, to production, use, and disposal [36]. LCA emerged in the 1960’s [37], but the methodology grew rapidly in the 1980’s and 90’s, where it was first applied to the building sector [38].
To assess embodied environmental impacts, this study utilized process LCA, a bottom-up approach that breaks down the environmental impacts according to energy and physical mass flows in different processes throughout the life cycle of a product [39]. It is the most common way of conducting an LCA in the building sector [6,40]. According to Sharrard et al. [41], it is particularly prominent in this sector, given the complexity of buildings as assessment objects. It is also thought to produce the most accurate results [7]. Limitations of the LCA process will be discussed in Section 4.

2.3. Research Process

This study was conducted in four phases, in line with the ISO 14040 series standards: goal and scope definition, inventory analysis phase, impact assessment phase, and interpretation phase [36].

2.3.1. Goal and Scope

The primary goal of this study was to evaluate and comprehensively report the embodied environmental impacts of the fiberglass house in Iceland, including an uncertainty analysis and hotspot analysis. Additionally shown are the use phase GHG emissions, simulated in three geographic locations. The results of this study will add to the field of LCAs on built structures using alternative materials, and position the fiberglass house among other building types. The results can further guide future development of fiberglass house design and fiberglass as an alternative building material. The functional unit (FU) selected for this study was one square meter (m2) of gross area.
Figure 4 shows the system boundary according to EN 15804 [41]. This is a cradle to site plus operational energy analysis, focusing on the pre-use phase (A1–A4). For these life cycle stages, various environmental impacts are presented. The impacts from construction work (A5) were excluded because data were not available. The second component includes the use phase operational energy (B6) in an analysis of GHG emissions. The other use phases (B1–B5 and B7) were excluded. Of these, maintenance and material replacements were not included as the needs are low according to the producer, and they are likely to remain similar regardless of the location, therefore, they do not affect the use phase comparisons. The operational water use will also have little effect on the use phase GHG emissions and is not included, but is assumed to be comparable in all geographic locations. In addition, the case house was built in 2020, and therefore, there is very little operational use phase information available. The end-of-life phase (C1–C4) and benefits beyond the system boundary (D) were also excluded because this is a new house and the end-of-life treatment far in the future could not be determined with the available data; therefore, any estimate now would carry a very high uncertainty. In addition, although missing from the assessment, given the durability of the materials used, there is likely high potential for recycling and reuse.

2.3.2. Pre-Use Phase Life Cycle Inventory

Data collection for the life cycle inventory (LCI) occurred primarily from January to August 2020. Data were gathered from architectural and engineering drawings provided by the producer of the fiberglass house. Additional information was provided by the producers of the specific building materials. The volume of materials was estimated to calculate their weight. Building components were disaggregated to calculate the amounts of individual materials. Materials with an insignificant mass were excluded. This includes low-density polyurethane (LDPE) and bronze, which accounted for less than 0.002% of the total mass. Limitations with a mass-based cutoff criterion are discussed in Section 4. Data were not available for fixed furniture, bathroom and kitchen fixtures, and some internal finishes, as well as earth and groundwork, and construction work; therefore, they were also excluded from the product system following the typical tradition in the field of building LCAs [6]. Impacts from the thin wooden frame were also excluded. The complete LCI is shown in Table 2 and Table 3. The fiberglass material modeling details are shown in the Appendix A.

2.3.3. Use Phase

A 50-year life span was selected for the use phase, following the prevailing building sector LCA tradition [6]. The actual expected lifetime of the fiberglass house can be significantly longer, but no experiments are available to back up that claim. The uncertainty in accounting for emissions beyond a 50 years’ time span is significant and they likely do not occur as expected, e.g., [7]. For this phase, global warming impacts are modeled for three geographic locations—Iceland, Poland, and Finland. These countries were selected to show how the energy mix impacts lifetime GHG emissions. Iceland represents the actual location of the house and the location with a nearly zero carbon energy mix. Poland represents a country with one of the most carbon-intensive energy mixes, and Finland is located in between the two.
For each country, two different energy efficiency levels are shown, divided into Scenario 1 and Scenario 2. Scenario 1 uses the average residential building heat use for each country, with an assumed 75% reduction in heat demand due to the high thermal insulation level of the fiberglass house. The assumed energy demand is shown for each country in Table 4. Scenario 2 uses the Passive House standard for all countries [42]. It is important to note that an increase of energy efficiency to meet the Passive House standard would increase the insulation material quantity needed, resulting in higher pre-use emissions. An increase of the insulation material impacts the pre-use emissions, but this increase is not included in the modeling. Additional electricity use, i.e., lighting, appliance, and HVAC electricity is assumed to be consistent regardless of geographic location, but is included to demonstrate a more realistic comparison of the pre-use and use phase GHG emissions.
The GWP used for Iceland’s district heating system is 11.2 gCO2 eq/kWh, taken from Karlsdottir et al. [43]. The heating systems for other countries are modeled using the Ecoinvent v3.7.1 database with OpenLCA version 1.10.3. The carbon intensity of electricity production in Poland is 719 g CO2 eq/kWh and 86 g CO2 eq/kWh for Finland, according to the European Energy Agency [44]. The carbon intensity of electricity in Iceland is 9.3 g CO2 eq/kWh [45].
In Scenario 1, the current heating demand for Iceland is estimated from Fazeli and Davidsdottir [46]. For Poland and Finland, the average heat demand for 2016 is from Rousselot [47]. In Poland, space heating and electricity are reported together; therefore, the share of heating was estimated using residential energy consumption data for 2015 [48]. Additional energy use is assumed to remain constant in all locations and was selected based on the 2016 European average of 75 kWh/m2 [47]. In Scenario 2, the passive house standard of 15 kWh/m2 for heating demand and 45 kWh/m2 for additional electricity demand is used in all locations [42]. Table 4 shows the values used in the two scenarios for the current GHG content of energy and the energy consumption of the case house.
Predicting future energy production presents many challenges, though there is a global shift towards lower carbon forms of energy production. Every country will follow a different timeline with emissions reduction and to a different extent, but assuming constant emissions over time would likely significantly overestimate the use phase emissions. To account for future improvements in energy production, the carbon intensity (kg CO2 eq/kWh) for Poland and Finland is modeled based on the recent European Union carbon neutrality goal by 2050 [49]. To reach net-zero emissions by 2050, it is assumed the carbon intensity of electricity and heat production will decrease by around 3% per year, until reaching net zero after 2050. The reduction in emissions from energy production will likely follow a stepwise decline, given the long lifetime of energy projects. In line with Säynäjoki et al. (2012), the linear decline, as modeled, is assumed to be an average reduction over the whole period, not considering country-specific reductions. This could also include mitigation technologies for decarbonization, as this is expected to be paired with energy decarbonization to meet climate goals [49]. In Iceland, the emissions are assumed to decline at around 5% per year until 2040 to reach their 2040 carbon neutrality goal [50]. Iceland’s energy system is already based on renewables [51]; therefore, the overall impact from emissions reduction compared to other countries is relatively low. Despite this, there is high potential for carbon capture and storage (CCS) in geothermal power production [52].

2.3.4. Life Cycle Impact Assessment

OpenLCA version 1.10.3 in combination with the Ecoinvent v3.7.1 database was used for this assessment. This database contains around 18,000 LCI datasets [53] and is widely used in previous LCA studies on buildings [6]. The ReCiPe 2016 impact assessment method [54] was used to conduct the LCIA. ReCiPe was selected because it includes a wide range of impact category coverage and includes both midpoint and endpoint indicators [55]. Midpoint indicators show the impact to a single environmental problem, such as global warming or water consumption, and endpoint indicators show the impact to three higher-level damage categories, known as areas of protection. These categories are damage to human health, damage to ecosystems, and damage to resource availability [54]. ReCiPe is utilized in many similar studies [15,19,56,57] and includes 18 midpoint indicators with characterization and normalization factors, as well as 3 endpoint indicators with normalization factors [54]. The normalization factors are consistent among both the midpoint and endpoint levels [58]. In general, the midpoint method results in lower uncertainty but can be difficult to interpret for meaningful decision-making, while the endpoint method can be easier to interpret but comes with higher uncertainty [59]. A key feature of the ReCiPe method is the linkage between the midpoint and endpoint results [54], using the midpoint characterization results to determine the endpoint results [58]. This allows for analysis on both levels to capture the advantages of each. Results for this study were normalized and weighted using the ReCiPe global average per capita normalization and weighting factors for the year 2010 (World 2010 H/A) [58].

2.3.5. Uncertainty Analysis

At midpoint results, a Monte Carlo simulation was conducted with OpenLCA and Ecoinvent 3.7.1. The number of iterations chosen was first 1000 and then 5000, following Heijungs [60]. For this study, the Pedigree Matrix approach (Muller et al., 2016) was used to calculate geometric standard deviations used in the Monte Carlo simulation for the foreground processes based on five data quality criteria (reliability, completeness, temporal correlation, geographical correlation, and further technological correlation), assuming log-normal distribution. For background processes, the pre-defined geometric standard deviations from Ecoinvent were used.

3. Results

3.1. Midpoint Results

The midpoint results are shown in Table 5 for the 18 ReCiPe midpoint impact categories. The embodied GWP per m2 is 311 kg CO2 eq. This impact is mainly resulting from the fiberglass, concrete, and steel materials, shown in more detail in Section 3.3. The impact to human carcinogenic toxicity is 127 kg 1.4-DCBeq/m2, with steel contributing the most to this impact. The impact to water consumption is 8 m3/m2, mainly resulting from the stone wool, fiberglass, and concrete. Other important impact categories to highlight are land use with an impact of 7 m2 a crop eq/m2, mineral resource scarcity with an impact of 2 kg CU eq/m2, and fossil resource scarcity with an impact of 93 kg oil eq/m2. The uncertainty ranges are shown in Table 5, and will be covered in more detail in Section 3.3.

3.2. Midpoint Hotspot Analysis by Materials

The hotspot analysis shows the relative impact, in percentage, to each midpoint impact category from each of the materials (Figure 5). Transportation is shown separately for the two main contributing transportation methods: sea cargo and lorry, to demonstrate how the impacts from different transportation methods compare to the building materials. The other transport methods (rail, inland barge, light commercial vehicle, sea bulk carrier for dry goods) have a negligible impact on all impact categories and were excluded from the hotspot analysis. Fiberglass contributes more than 50% of the impact to fossil resource scarcity and stratospheric ozone depletion. Fiberglass also has the highest contribution to fine particulate matter formation, freshwater eutrophication, climate change, ionizing radiation, land use, ozone formation—human health, ozone formation—terrestrial ecosystems, terrestrial acidification, and terrestrial ecotoxicity. Steel contributes most of the impact (89%) to human carcinogenic toxicity and has the highest contribution to marine eutrophication (45%) and mineral resource scarcity (43%). Copper contributes the most to freshwater ecotoxicity, human non-carcinogenic toxicity, and marine ecotoxicity. It also has a significant contribution to freshwater eutrophication, mineral resource scarcity, and terrestrial ecotoxicity. Concrete contributes significantly to climate change (16%), ozone formation—human health (13%), ozone formation—terrestrial ecosystems (12%), and water use (11%). Of the transportation methods included, sea cargo contributes the most to ozone formation—human health (15%), ozone formation—terrestrial ecosystems (14%), terrestrial acidification (12%), and fine particulate matter formation (9%). Lorry transport contributes the most to terrestrial ecotoxicity (22%) and land use (7%).

Most Contributing Materials to GWP

The materials identified as having the largest contribution to GWP are fiberglass (48%), concrete (16%), steel (14%), rock wool (5%), and window glass (3%), as shown in Figure 6a. When considering the material sub-types in Figure 6b, polyester resin, epoxy resin, and glass fiber are among the top contributors to GWP. These material sub-types are the primary components that make up the fiberglass process. Cement is the second most contributing sub-process, which is part of the concrete process.

3.3. Uncertainty Analysis

Uncertainty ranges, based on Monte Carlo simulation, were calculated, and only very small changes were observed between 1000 and 5000 runs. The results for 5000 runs were presented along with the midpoint results in Table 5 (see Section 3.1). All but one of the distributions are skewed to the right, as can be seen from the three values in Table 2; the center point, 5th, and 95th percentiles. A typical distribution, Figure 7, also shows this clearly. The total variability in estimated values is great, especially when compared to the most frequent values. However, the pronounced skewness results in that the most frequent values are much closer to the lower 5th percentile value than the upper 95th percentile. This means that a greater part of the distribution is nearer to the center value than indicated by only the 5th and 95th percentiles. This is most pronounced for the climate change, human non-carcinogenic toxicity, and stratospheric ozone depletion impact categories. The only exception to the above discussed is for water consumption, where the probability distribution follows a normal distribution, including negative values which are meaningless. This anomaly is most probably due to the probabilistic distribution assumed in the database.

3.4. Endpoint Results

Table 6 shows the pre-use endpoint impact to the three LCA areas of protection: damage to human health (DALY), damage to ecosystems (species. Yr), and damage to resource availability (USD 2013), based on the FU. The endpoint damage to human health is 1.07 × 10⁻³ DALY/m2. Fiberglass, steel, and copper are the highest contributing materials to this endpoint category. Damage to ecosystems is 1.44 × 10⁻⁶ species. Yr/m2, with the highest contribution from fiberglass. Damage to resource availability is 3.1 × 10 USD2013/m2 with the highest contribution from fiberglass and steel. These impacts cannot be compared across impact categories, though the weighted endpoint results in Table 7 show the highest impact to damage to resource availability, followed by damage to human health and damage to ecosystems. The single score is calculated to be 1.76 × 10⁸.

3.5. Use Phase

Figure 8 shows the use phase comparison for Iceland, Finland, and Poland. The use phase emissions, expressed as kg CO2eq, are shown for each country based on the energy demand in Scenario 1 (solid lines) and in the Passive House standard Scenario 2 (dotted lines). The pre-use phase emissions are shown as occurring in 2020 with the blue line, and are the same in all scenarios.
In both Scenario 1 and 2 the pre-use phase emissions account for the largest share of lifetime emissions in Iceland and Finland, responsible for almost 100% of the emissions in Iceland and 75–80% in Finland. The break-even point for Poland occurs in year 12 for Scenario 1 and year 24 for Scenario 2, but also in Poland, the pre-use phase accounts for almost 50% of the emissions in Scenario 2 and close to 40% in Scenario 1.

4. Discussion and Conclusions

This study aimed to quantify the embodied environmental impacts of a fiberglass house in Iceland and evaluate the environmental potential of fiberglass as a replacement for conventional high-impact materials. As identified in the literature review, there is a gap in the LCA literature addressing the impacts of unconventional building materials, specifically fiberglass. The pre-use phase has also been identified as an emissions hotspot. This is often underexplored in building LCA literature [6] but actually causes a high emissions “spike” during a short time period. Comparatively, the use phase emissions accumulate over a long time and might easily be overestimated when calculated as if they occurred at the same time as the pre-use phase emissions [7]. Furthermore, while GHG emissions have been the focal point of the climate discussion, other environmental impacts are important to consider, especially in light of the fact that we have already crossed, or are fast approaching, critical planetary boundaries [61]. More widespread reporting of midpoint and endpoint impact categories, as shown in this analysis, is necessary to develop baseline results for comparison.
This study was a process LCA, modeled in the OpenLCA software using the Ecoinvent 3.7.1 inventory database. The ReCiPe impact assessment method was used to calculate the environmental impacts of a new building solution for eighteen midpoint categories and three endpoint categories. Several key findings were made based on this assessment.
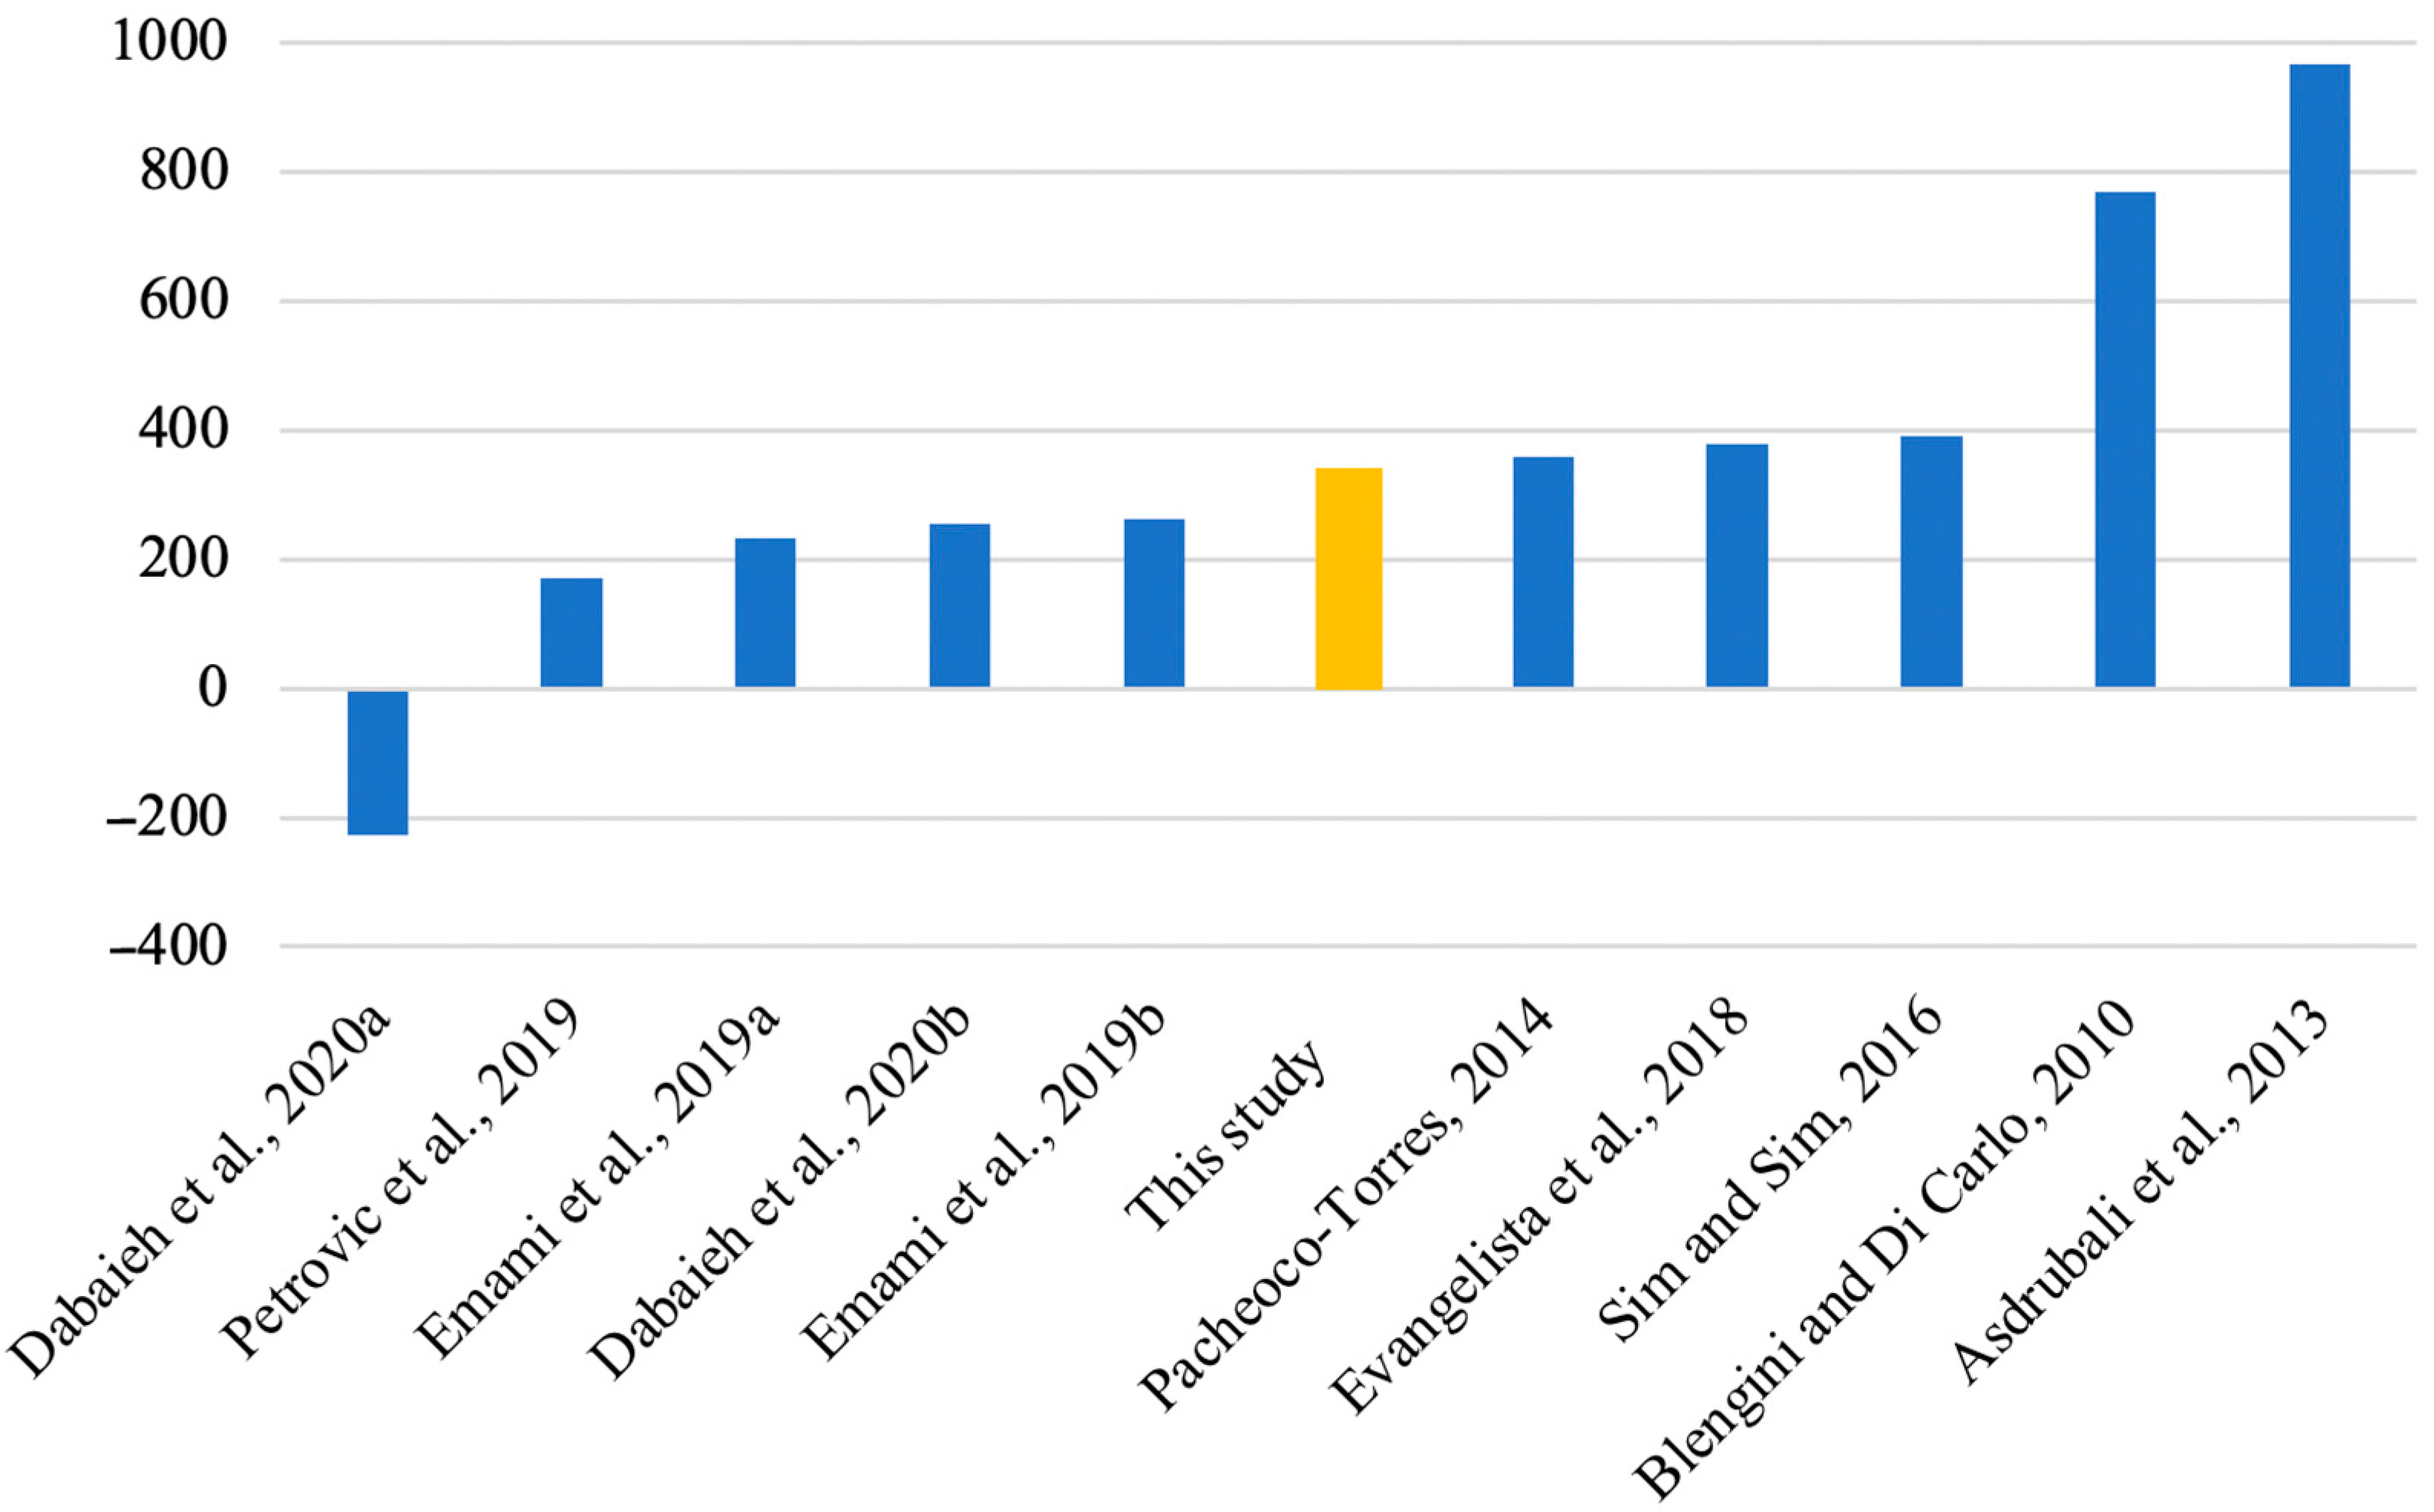
First, midpoint results showed the GWP for the pre-use phase was 311 kg CO2eq/m2. This is similar to typical concrete buildings [6] and well above natural materials-based buildings and houses, particularly if the carbon storage is accounted for [6,13]. The case example by Dabaieh et al. [19] shows how the carbon storage potential of natural materials has the potential to significantly reduce the associated GHG emissions though the potential benefit is determined by the end-of-life assumptions. The carbon storage potential of natural materials and treatment of end-of-life is a developing field [16], therefore, more research is necessary to accurately account for this benefit; however, their superiority in terms of GHG emissions seems to be a relatively conclusive finding. Table 8 and Figure 9 present a comparison to selected previous detached house LCA studies.
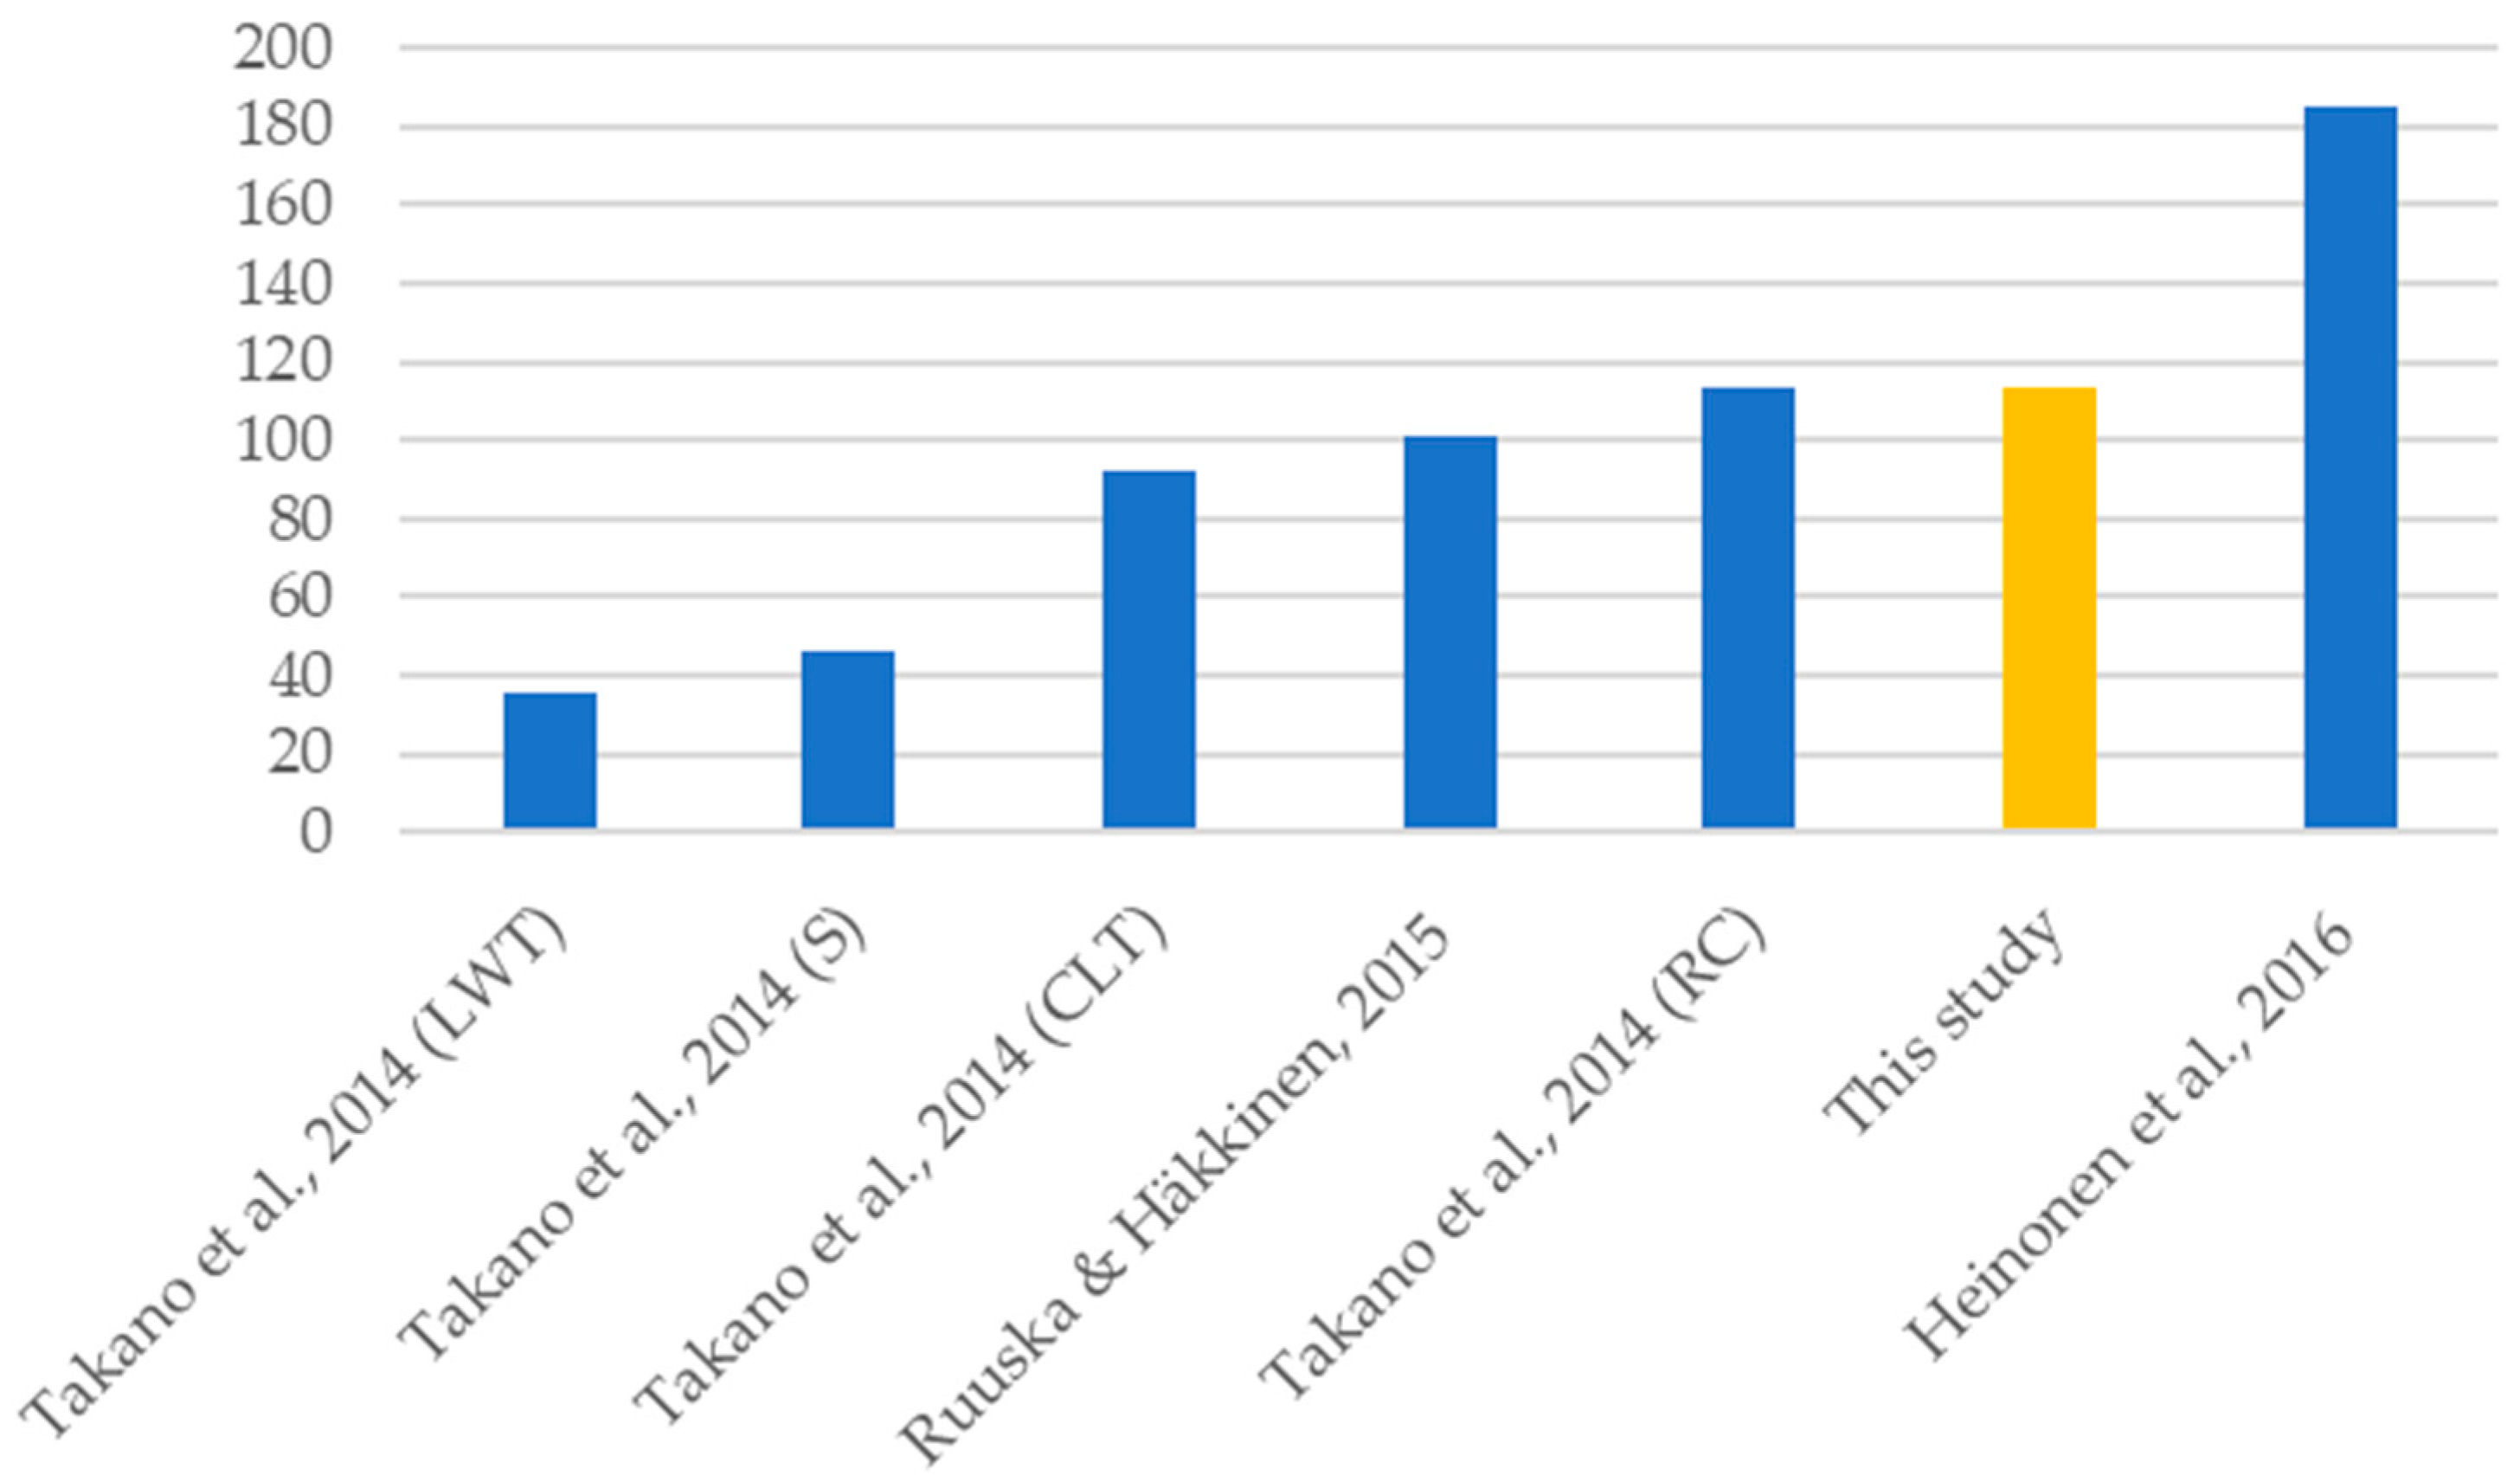
The results for the fiberglass panels as frame and wall elements were also compared to a selection of previous studies in which the same information was available. Table 9 lists the studies and the materials of the compared structures and Figure 10 shows the results comparison. As can be seen, the GWP impact from the frame/wall structures of the fiberglass house falls to the higher end of values reported from the other studies.
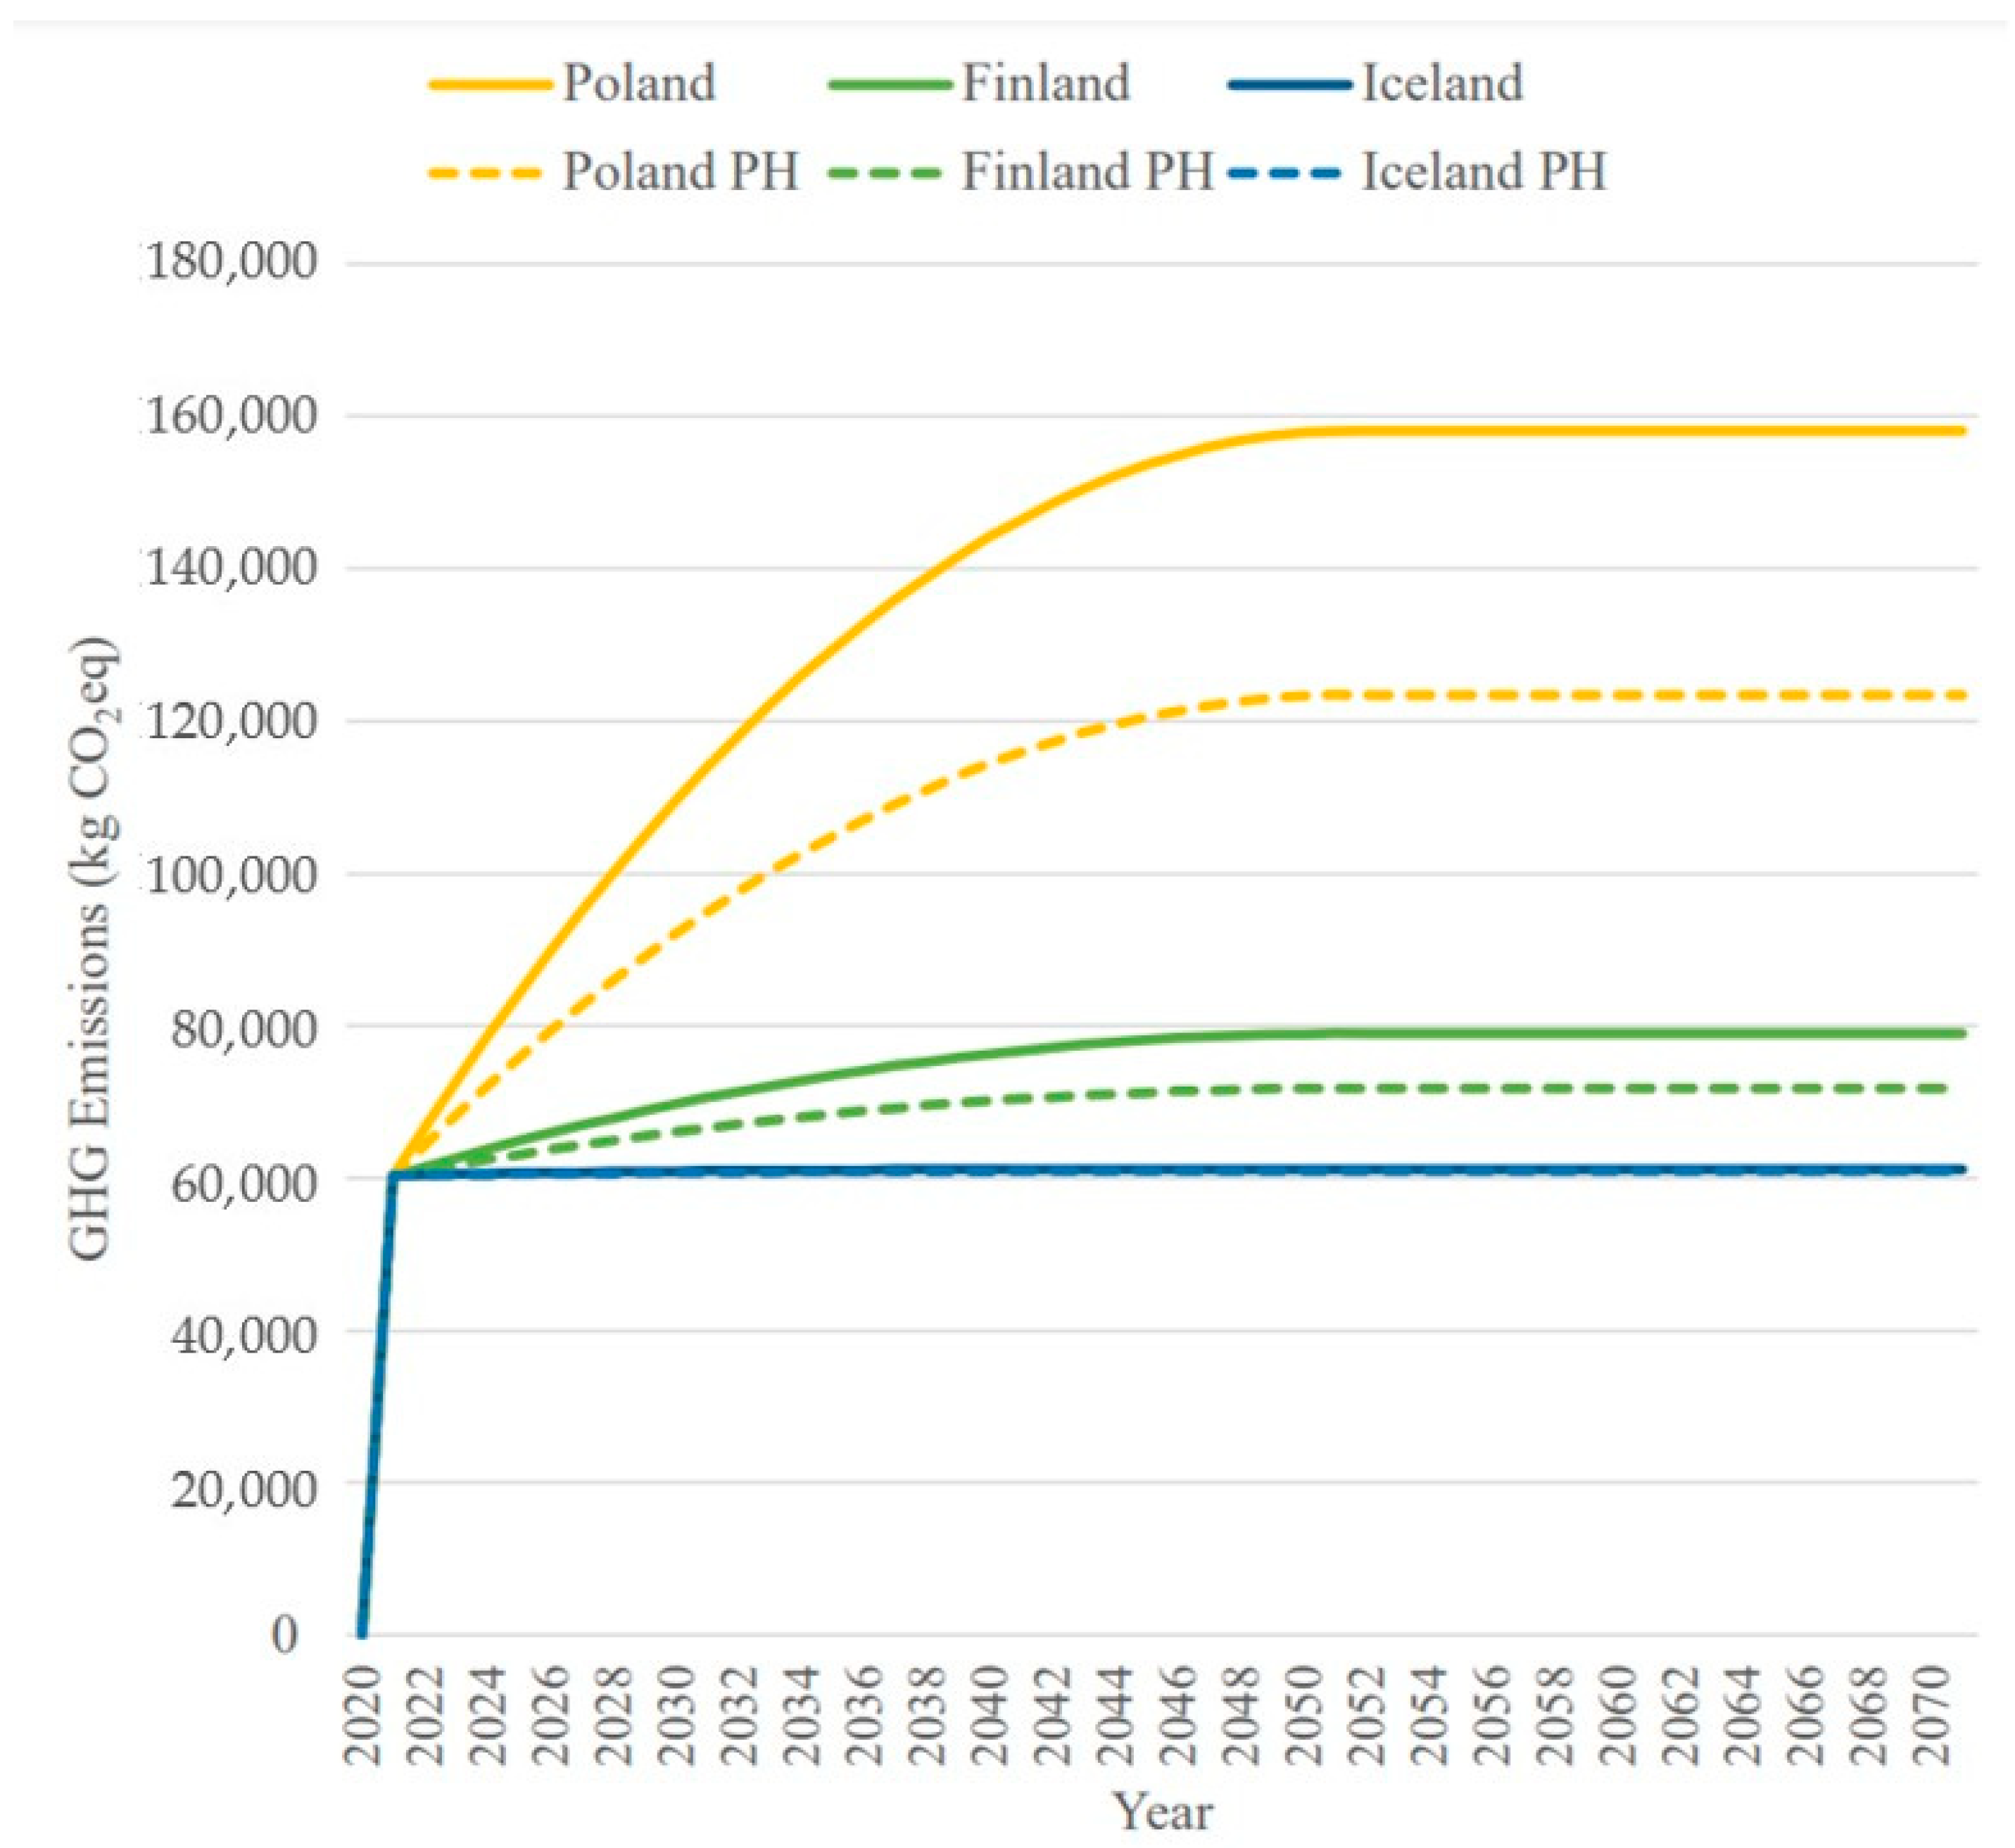
The use phase energy analysis was conducted as a simplified comparison of two different energy efficiency levels in three different locations to put the embodied GWP into context. This analysis showed that the embodied emissions are extremely high and dominate the life cycle emissions over the 50-year period, unless the grid emissions are very high, as shown by the Poland case. Even in the case of the Poland location, the embodied component is significant. We did not try to estimate the increase of the embodied emissions along with higher energy efficiency, but Säynäjoki et al. [7] provided an estimate of a 5% increase of the embodied emissions when increasing the energy efficiency from business as usual to a passive house standard level. User influence on the use phase energy consumption is also significant, and inversely connected to the energy efficiency level: the worse the energy efficiency, the higher the fiscal incentive for energy-saving behavior, and vice versa [69]. The magnitude of this impact is also tightly connected to the energy prices and the affluence of the users.
Other impact categories were reported to demonstrate the wide range of environmental impacts from the fiberglass house, beyond just GHG emissions; though it is difficult to draw conclusions from these results because a comprehensive baseline in the context of buildings does not exist. Previously, toxicity impacts were associated with high uncertainty due to limited understanding [70,71]. Harmonization in the assessment of toxicity-related impact categories is ongoing [72,73,74]; therefore, accuracy in the context of LCA is improving, though there is still uncertainty with these impact categories. Other common environmental impacts, such as global warming, terrestrial acidification, freshwater eutrophication, fine particulate matter formation, mineral resource scarcity, and fossil resource scarcity, are associated with less uncertainty due to a better understanding and more reporting; therefore, these results are considered to be more reliable [75], and baselines for buildings can be developed along with more reporting.
The endpoint results were shown to be 1.07 × 10−03 DALY/m2 for damage to human health, 1.44 × 10−06 species.yr/m2 for damage to ecosystems, and 3.1 × 10 USD2013/m2 for damage to resource availability. Endpoint results are rarely reported or discussed, so it is impossible to position these results; however, with more reporting, baselines can be developed.
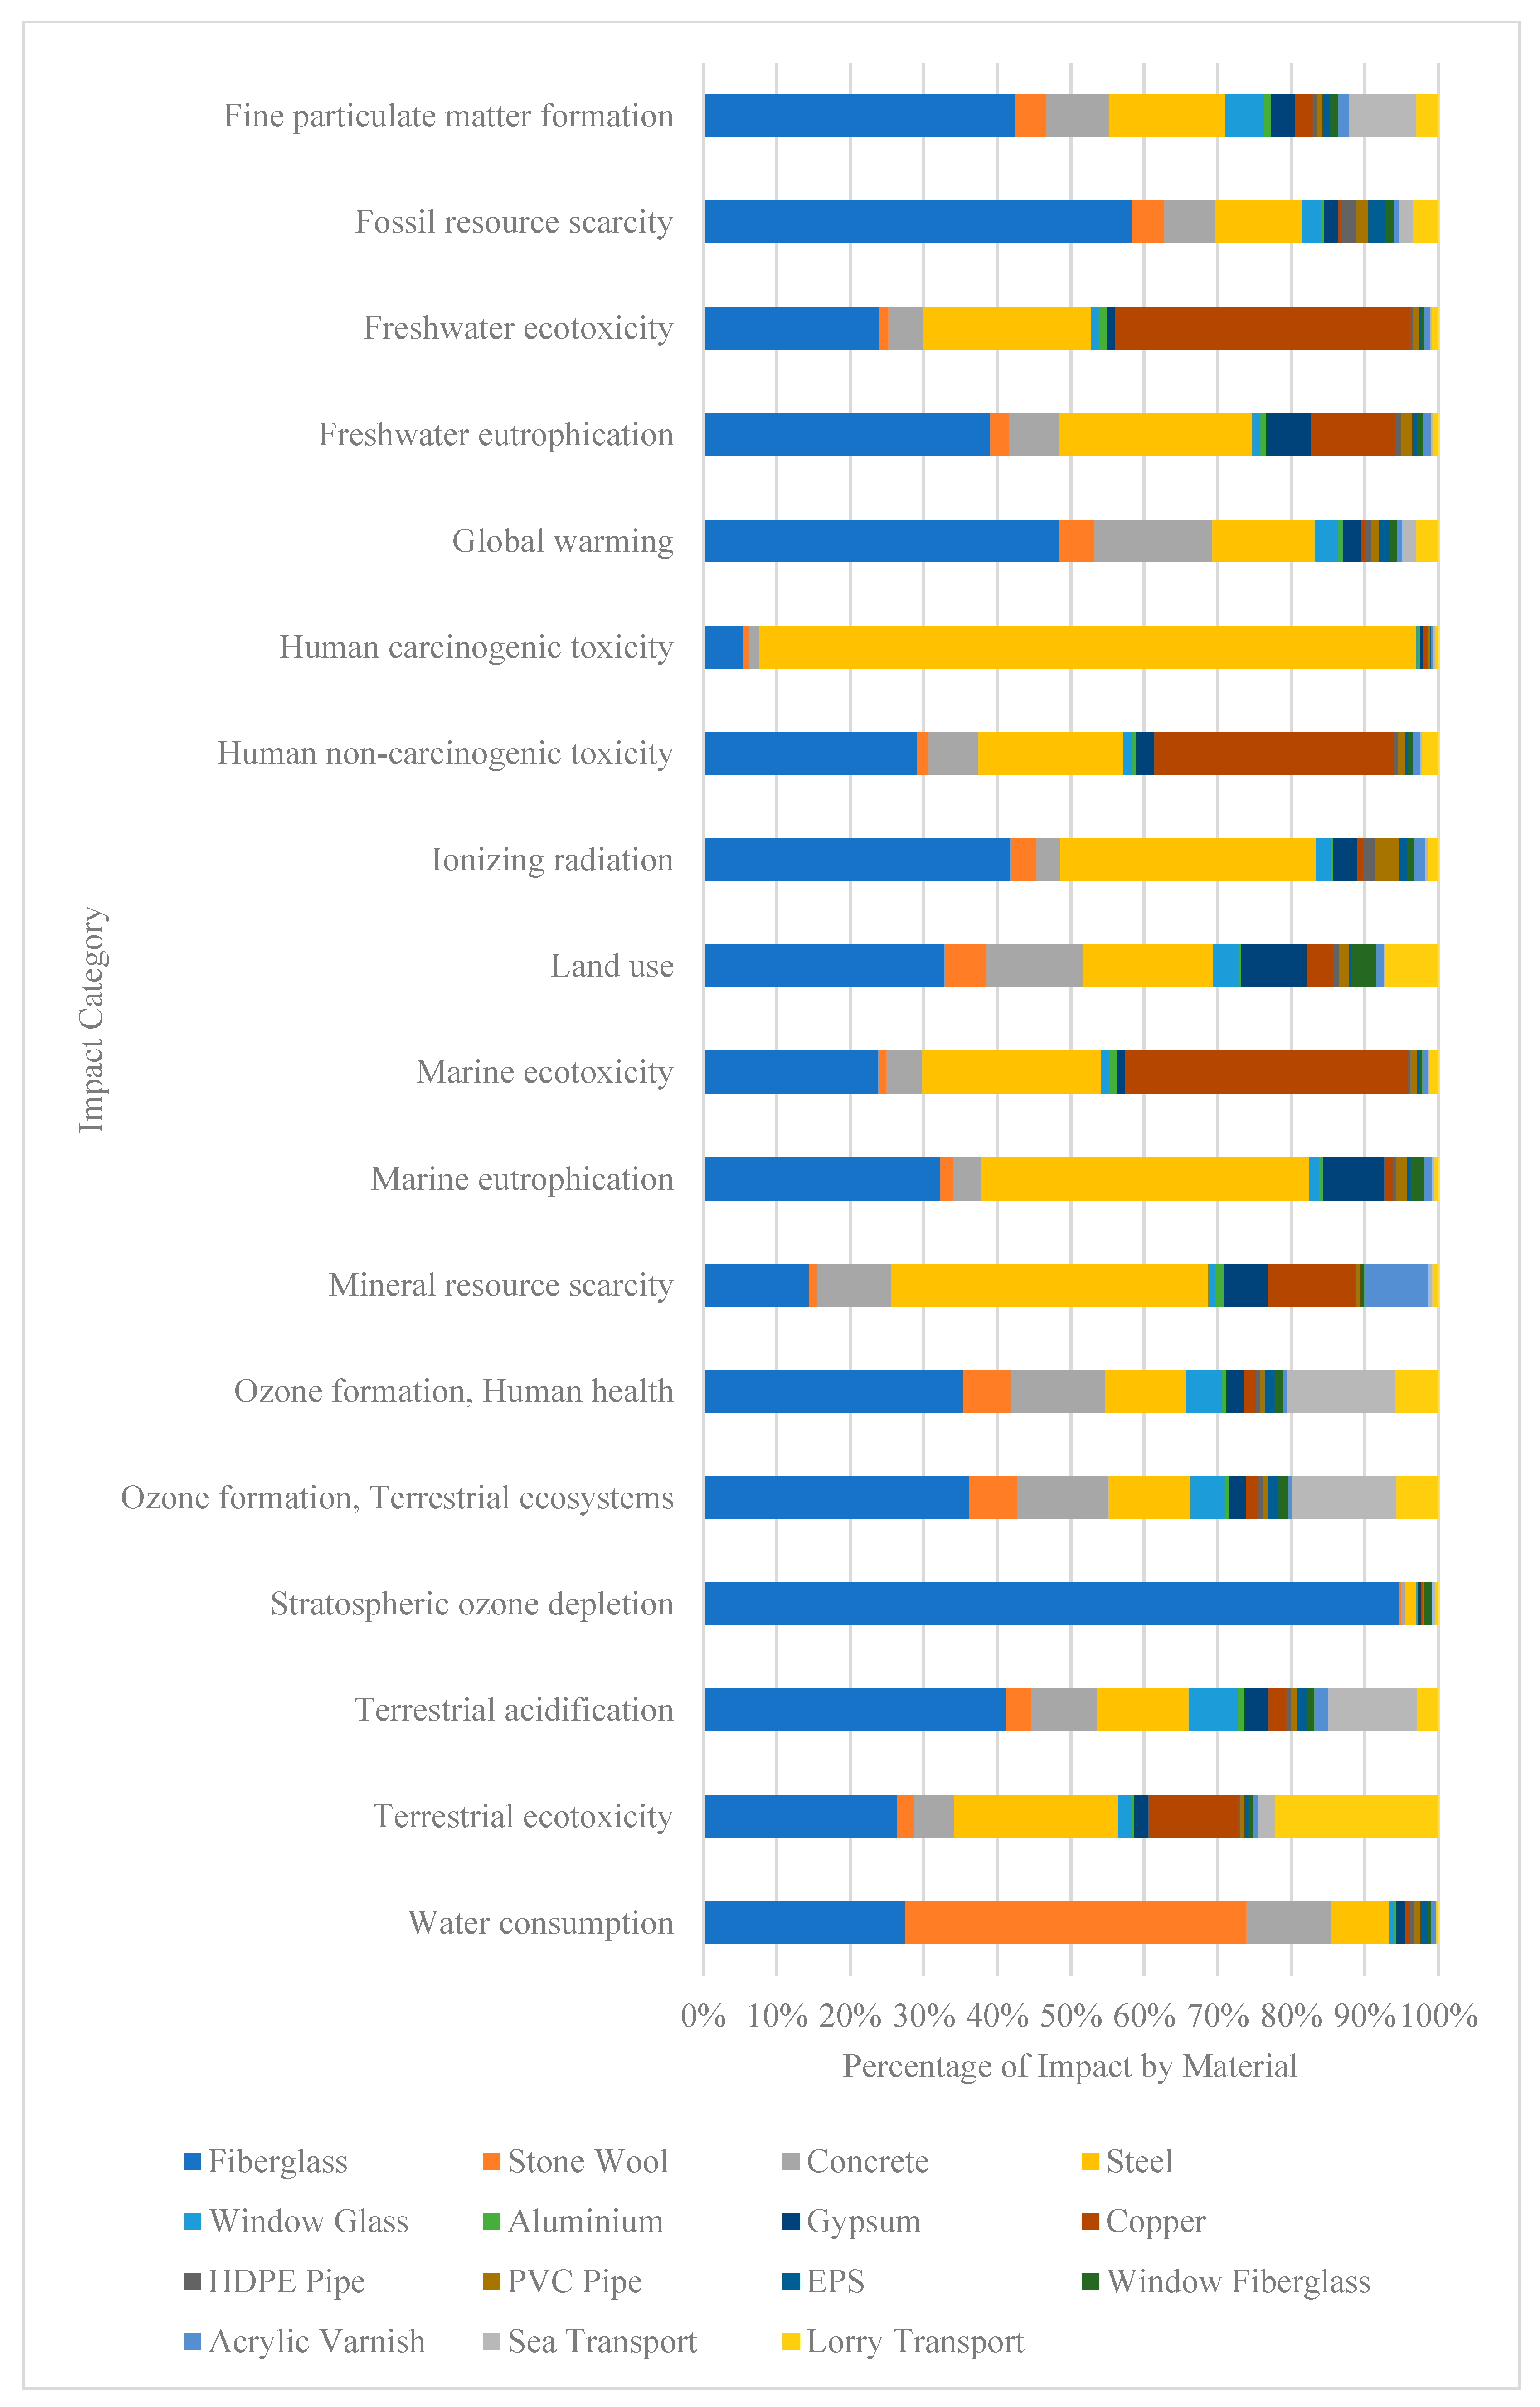
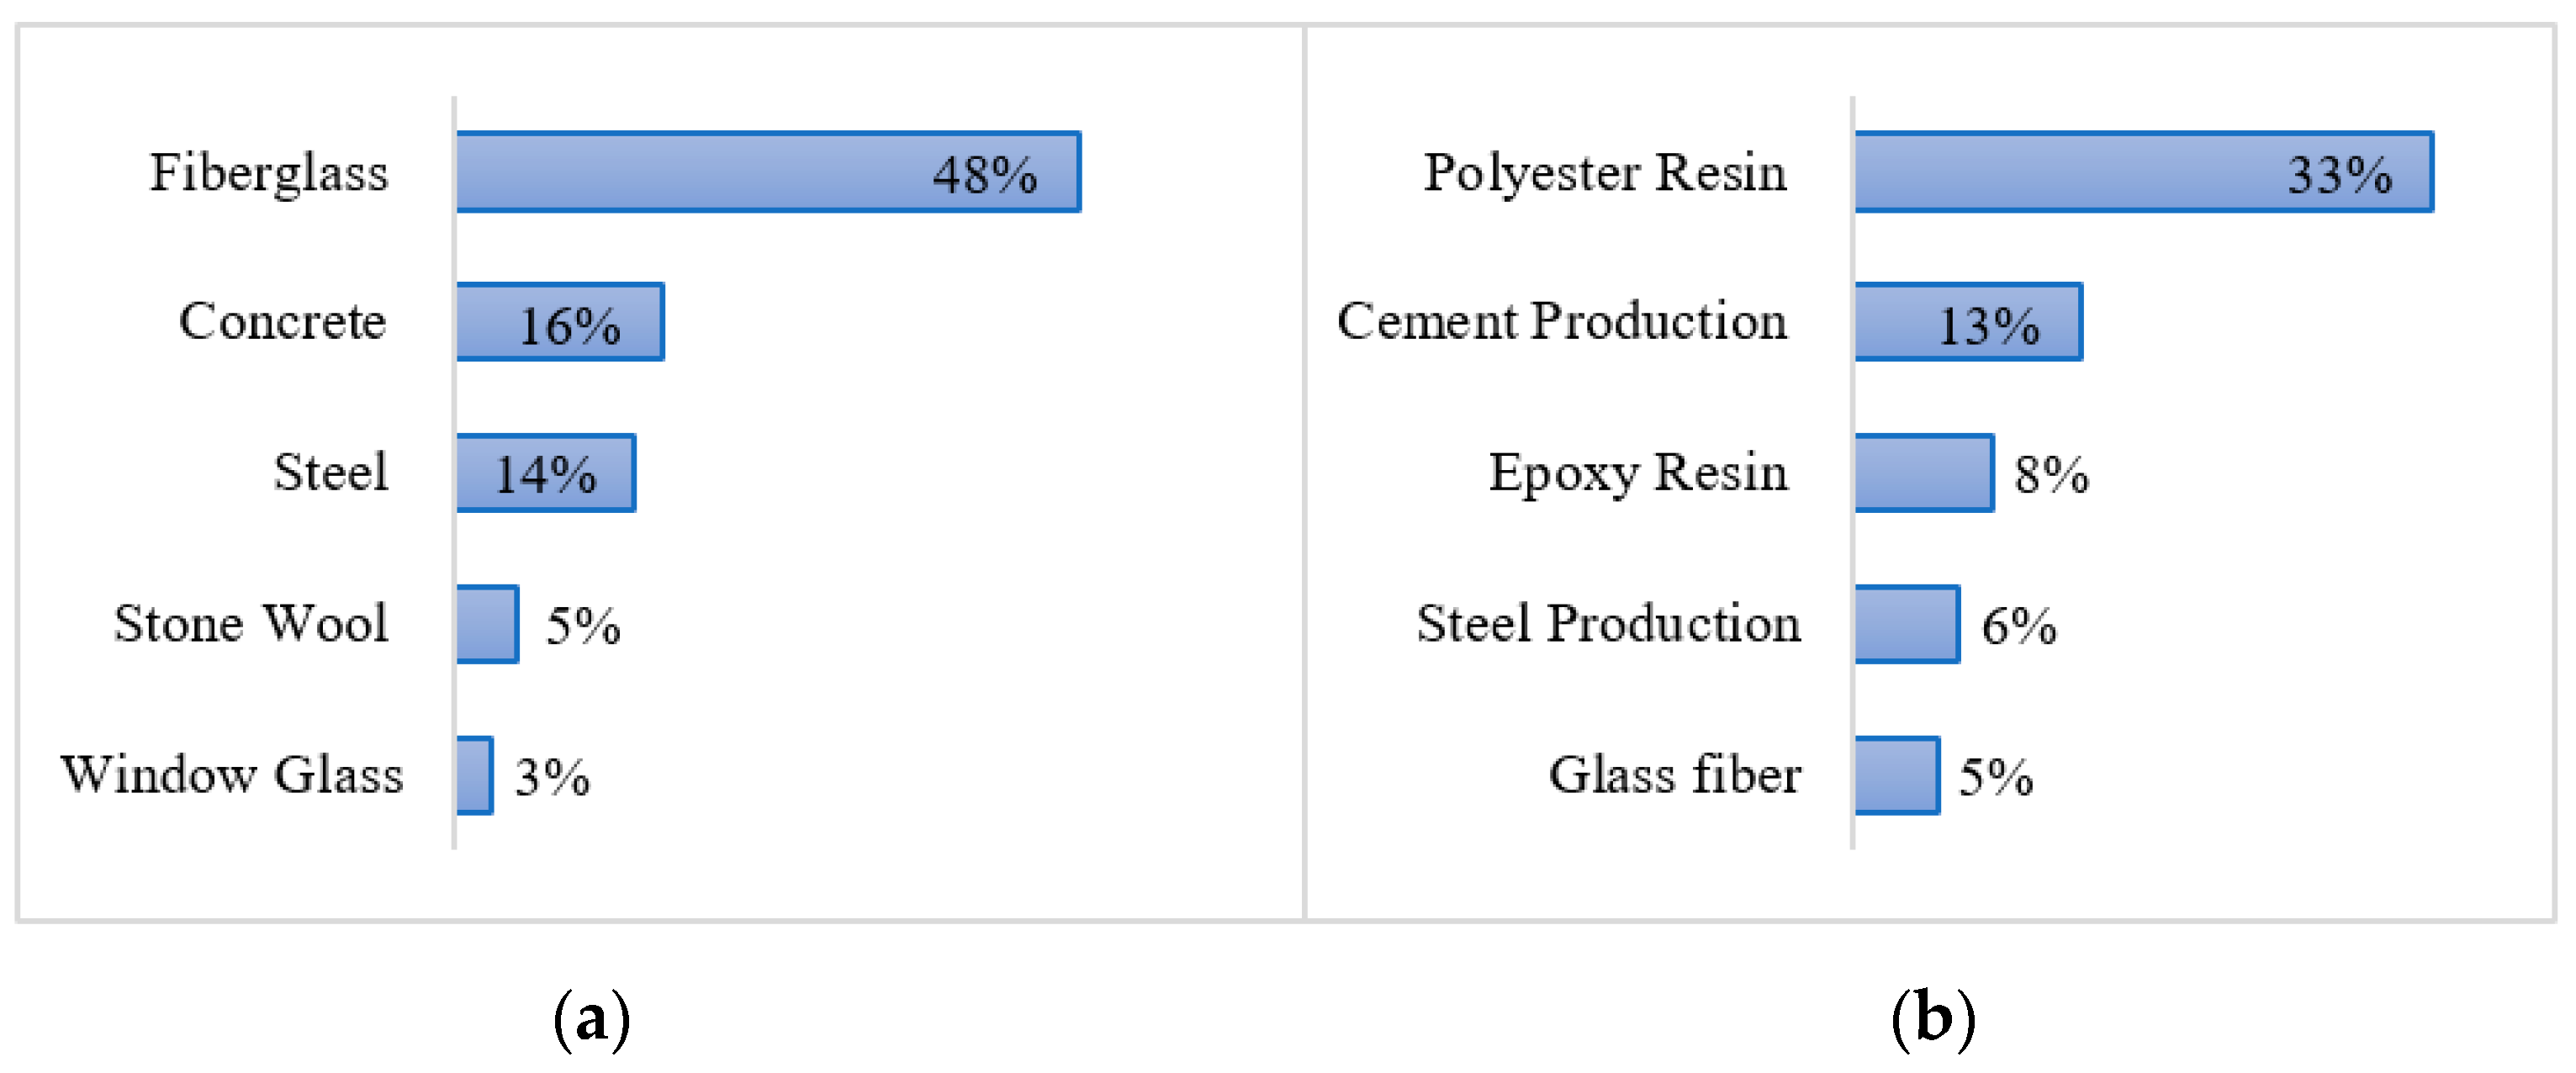
Next, the fiberglass material was identified as an environmental hotspot in most impact categories. Fiberglass had the highest contribution to fossil resource scarcity, stratospheric ozone depletion, fine particulate matter formation, freshwater eutrophication, climate change, ionizing radiation, land use, ozone formation—human health, ozone formation—terrestrial ecosystems, terrestrial acidification, and terrestrial ecotoxicity. Improvements to the fiberglass material quantity and composition could result in a better-performing material in the context of buildings. More research into solutions for reducing the environmental impact of fiberglass is necessary to guide the development of fiberglass as an alternative building material.
Steel and copper were also found to be hotspots. Steel contributed most of the impact to human carcinogenic toxicity and had the highest contribution to marine eutrophication and mineral resource scarcity. Copper contributed the most to freshwater ecotoxicity, human non-carcinogenic toxicity, and marine ecotoxicity. It also had a significant contribution to freshwater eutrophication, mineral resource scarcity, and terrestrial ecotoxicity. Based on the hotspot results, the use of these materials, along with the fiberglass, should be the target for improvement in future development of this alternative housing option.
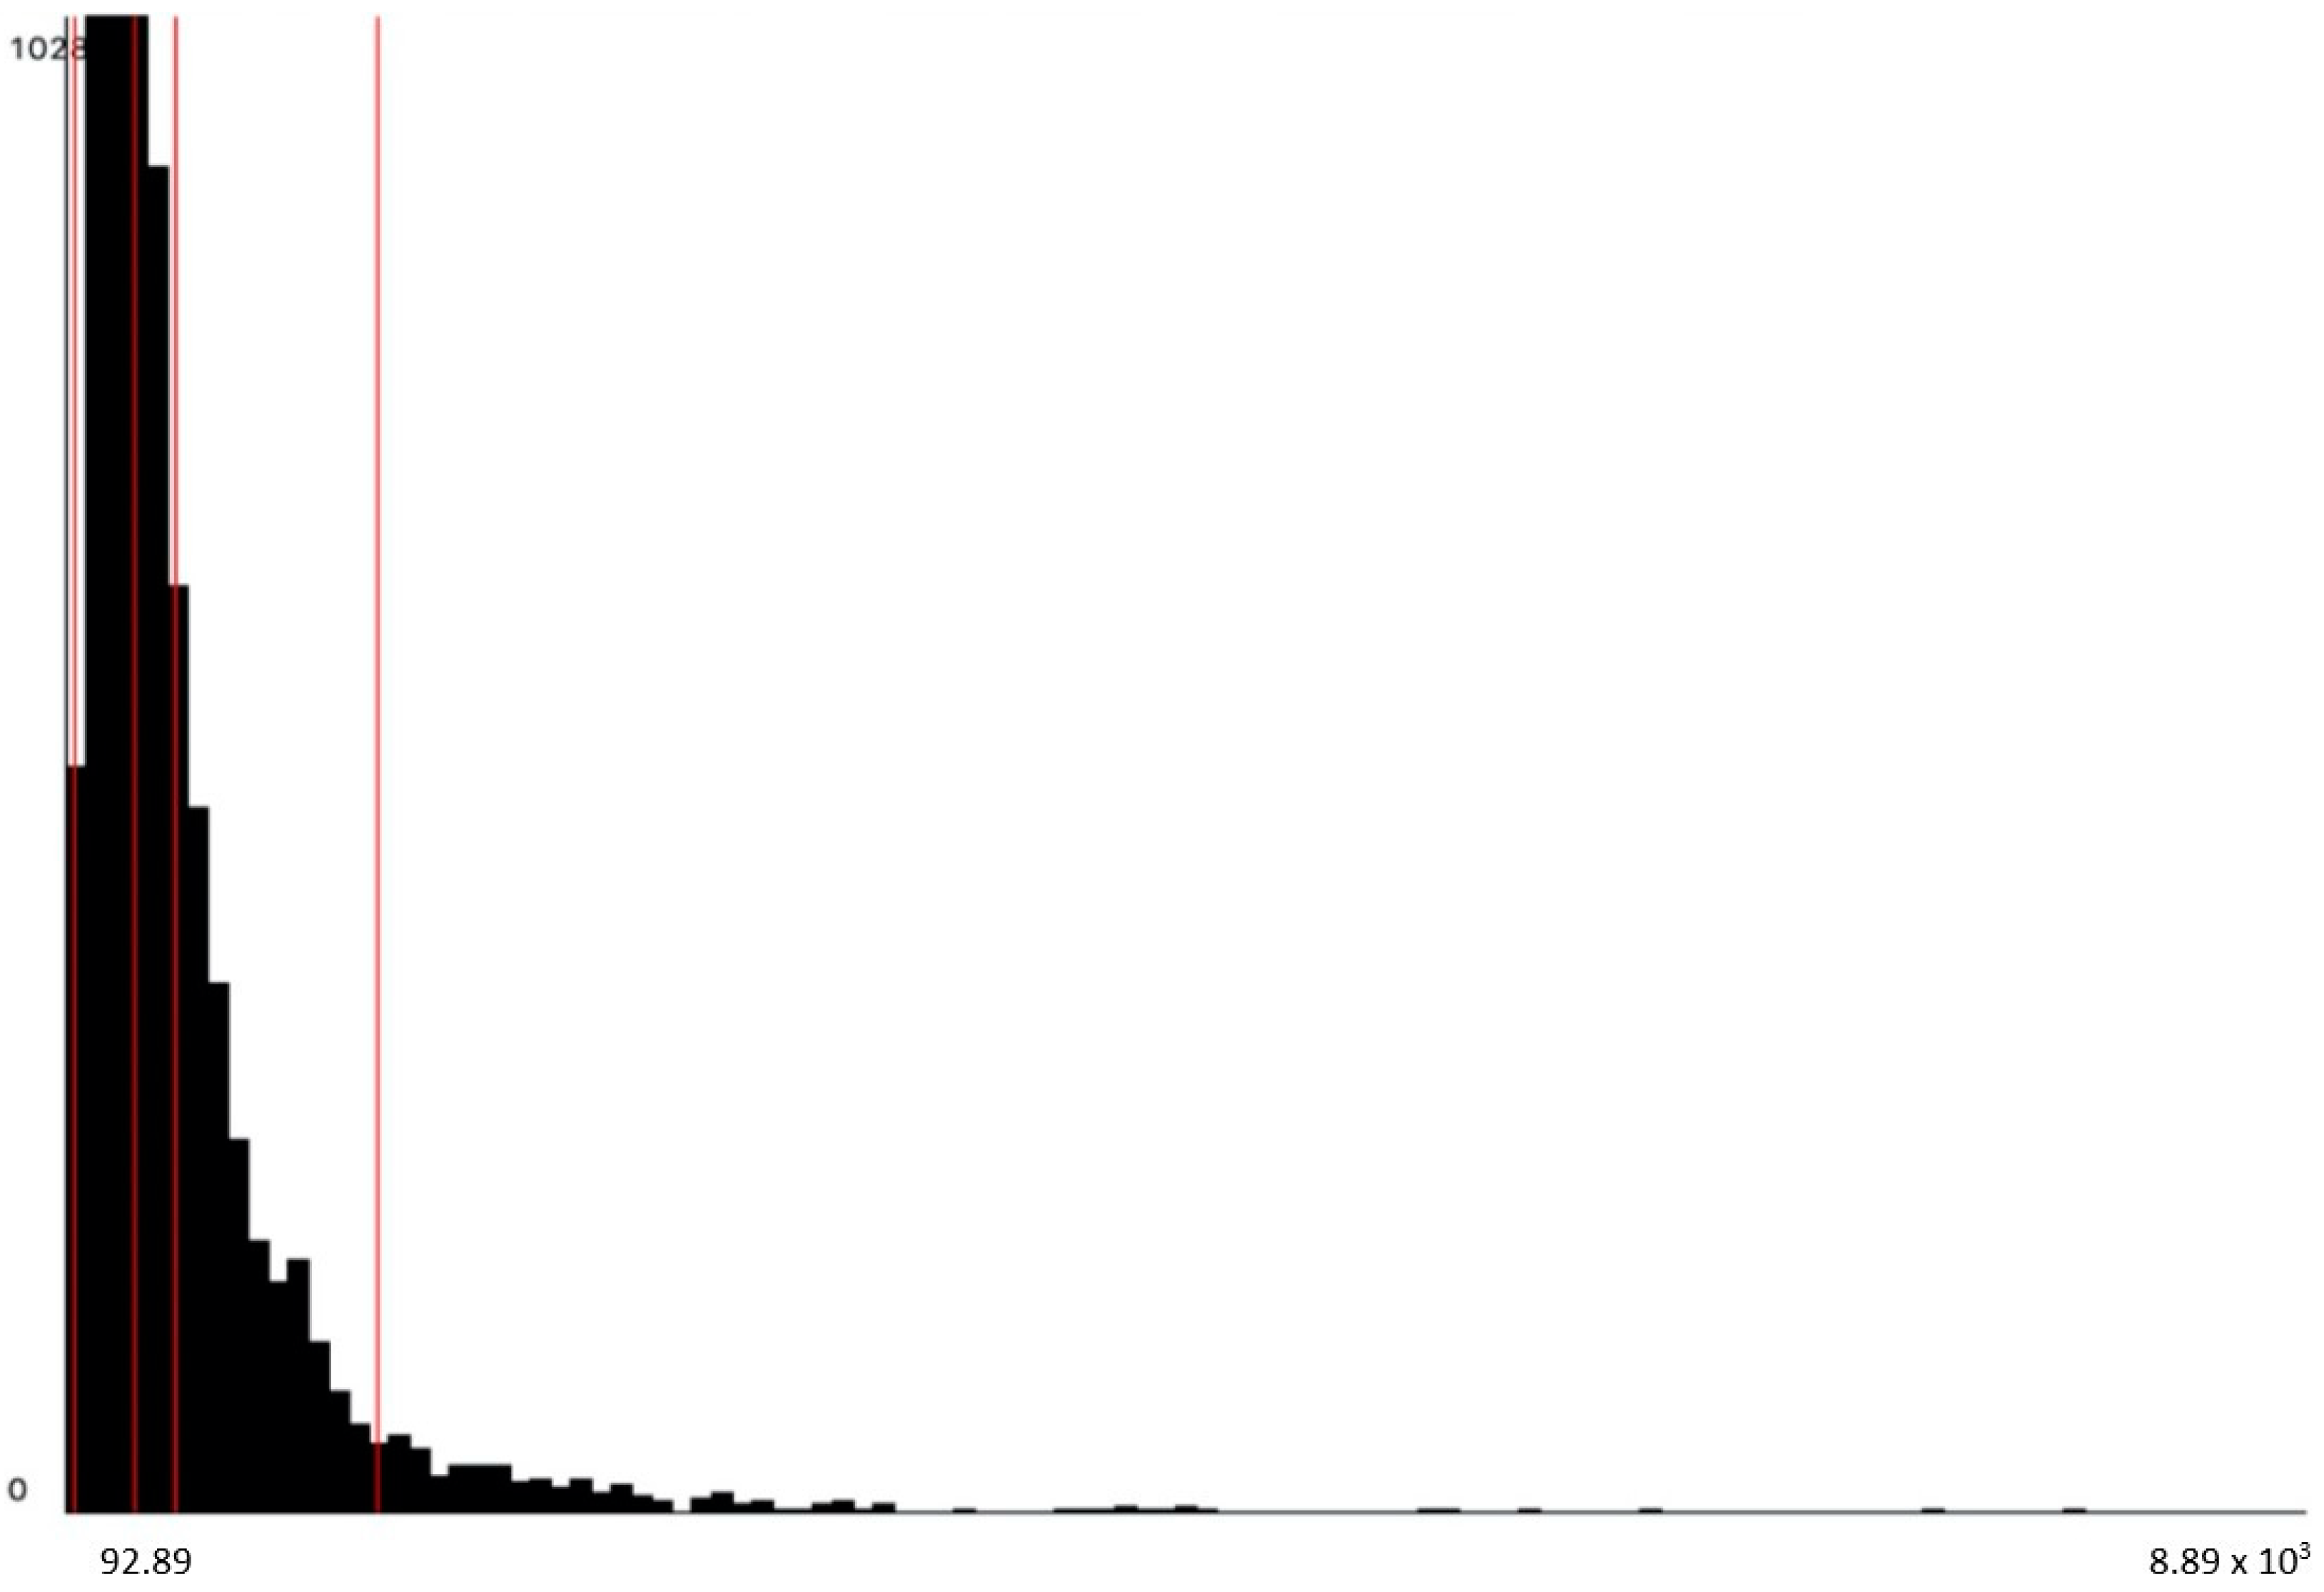
There are significant uncertainties in this study that should be taken into consideration when interpreting the results. The fiberglass material is associated with high uncertainty, largely due to a limited understanding of the material in the context of buildings. This contributed to the overall high uncertainty of the results. The uncertainty analysis conducted in the study focused on the midpoint results. For some impact categories, such as climate change, human non-carcinogenic toxicity, and stratospheric ozone depletion, the wide range between the 5th and 95th percentile represent highly uncertain data. However, the bulk of the estimated values are much nearer to one end in the skew distributions, indicating that the practical uncertainty is generally lower than the total variability shows. This can be attributed to the uncertainty factors assigned to the foreground processes, which did not closely represent the LCI. While processes were modified to reflect the actual production data as close as possible, for example energy mix in production countries, location-specific data were not available in the Ecoinvent database for many processes. Often, the available data are based on average or single case values [15], limiting the representativeness of the results presented. Additionally, the Ecoinvent database did not include data for specific materials, such as the acrylic resin used in the fiberglass; therefore, the closest alternative within the constraints of the database was used: polyester resin. The quantities used for modeling 1 kg of fiberglass in Ecoinvent are shown in Appendix A Table A1, and the modeling details in Appendix A Table A2. There are no LCA studies on acrylic resin, so it is not known how the impacts from acrylic resin compare to the polyester resin reflected in this study, resulting in high uncertainty. Polyester resin is the most common resin used in fiberglass production [76] and used in the general process for fiberglass in Ecoinvent ‘glass fiber reinforced plastic production,’ so it is justified in this case. Based on these uncertainties, the results do not represent the exact environmental impacts of the case study, but are more intended to report the potential impact of fiberglass panels as a new building solution. More research on fiberglass material is necessary to minimize uncertainty.
It has also been suggested that the results are strongly connected to the selected LCA database. Emami et al. [56] assessed the emissions related to the construction of a wooden detached house and a concrete structure apartment building with both SimaPro/Ecoinvent and with GaBi, and found the estimates by the two to be highly different for both.
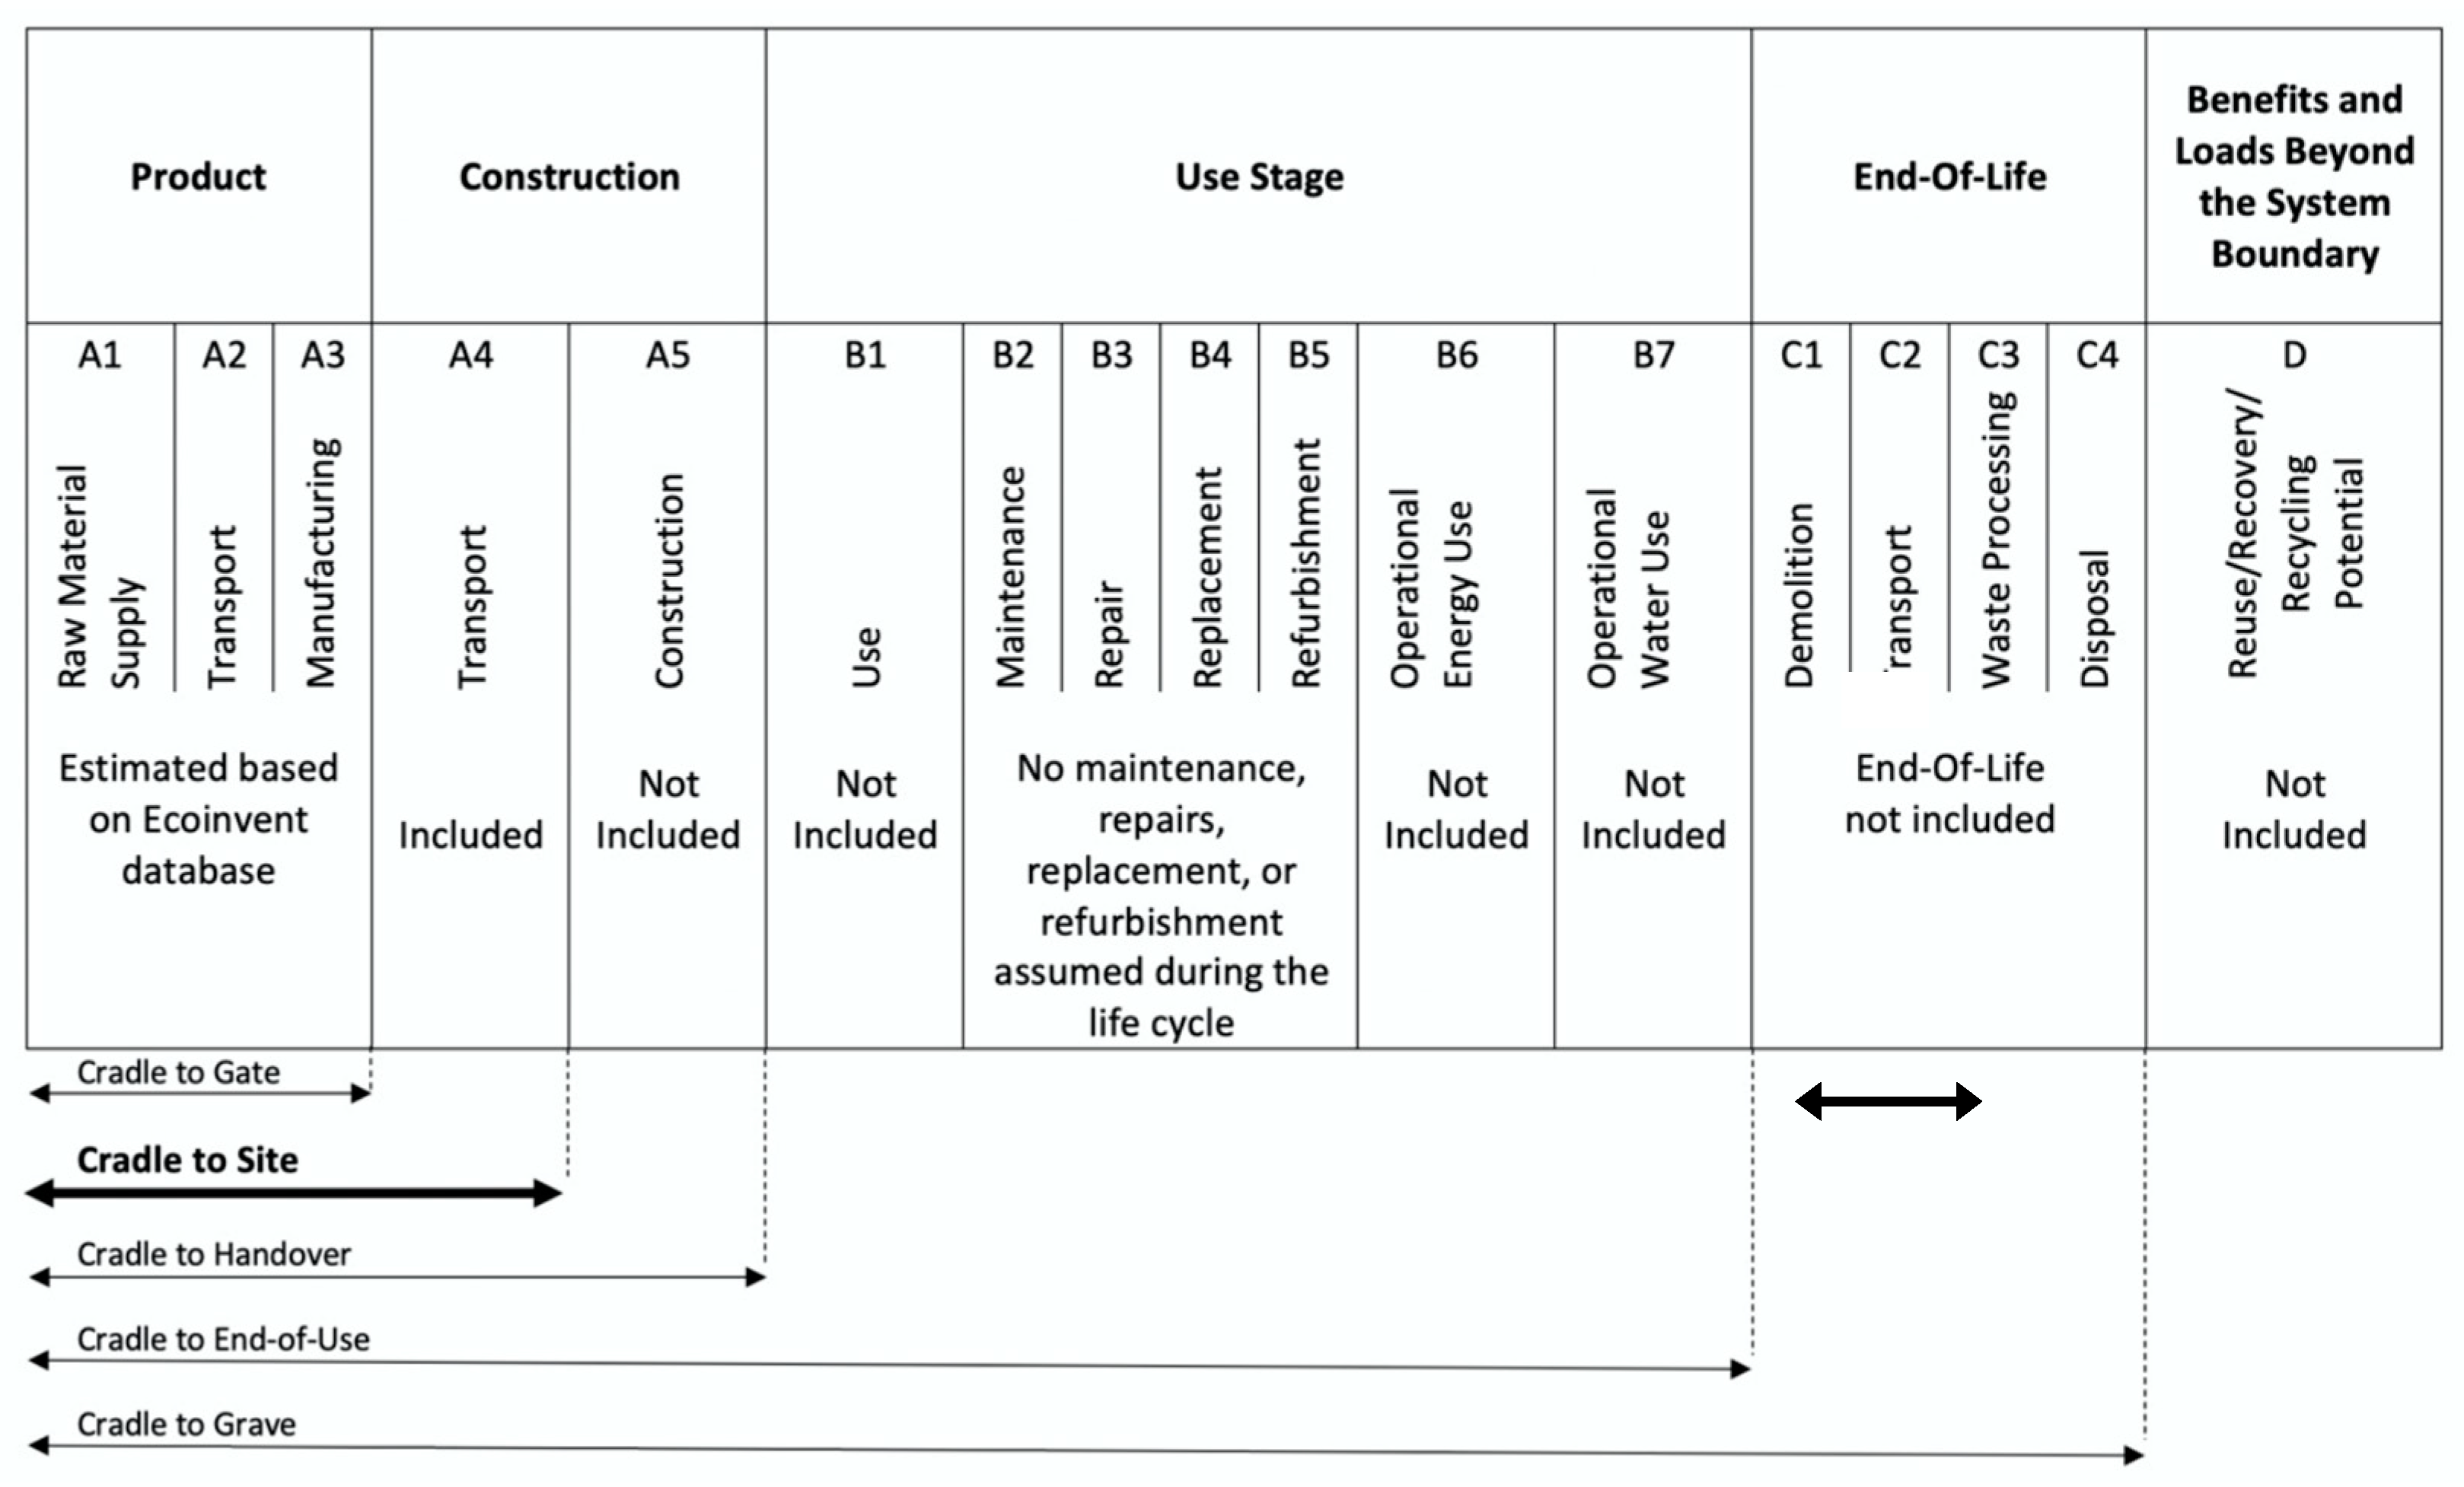
The next limitation relates to the LCI. Available data for the LCI were provided by the producer of the fiberglass house, but it was not comprehensive, which limited the system boundary, though this is a common limitation with LCA. In this study, the system boundary was selected based on processes that have significant mass. Materials with insignificant mass (<0.002%) were excluded for the pre-use phase. Suh et al. [77] highlight that there are limitations when only using mass to determine the system boundary because it is not guaranteed that a small mass will result in minimal environmental impacts. This is demonstrated by Heinonen et al. [15], who found that mass is not a good cutoff criterion for demonstrating the correlation between mass and impacts to 18 midpoint categories for an apartment building in Finland. Further, they report the cutoffs from omitting building systems and materials can be significant, even for finishes and mechanical works. Mass was used in this study following the main LCA tradition in the building sector [78], though it does result in uncertainty. This is demonstrated by the copper process in this study, which accounted for only 0.03% of the total mass but had a large contribution to many midpoint impact categories. Other phases were excluded from the system boundary due to a lack of data, including the impacts from construction work (A5) in the pre-use phase, the use phase (B1-B7), the end-of-life phase (C1-C4), and benefits outside the system boundary (D), as defined by EN15804 in Figure 3. Based on the durability of the fiberglass material and the potential for reuse is high, and therefore, a design for disassembly approach could significantly reduce end-of-life impacts following Joensuu et al. [79].
Finally, truncation error is a problem present in all process LCA studies, meaning process LCA studies always cut out higher-level tiers [77]. Heinonen et al. [15] and Säynäjoki et al. [6] also refer to “first-tier truncation,” meaning that some emissions are left out of the assessment when only the materials that make up certain building components are assessed, leaving out the final processing and assembly steps in converting the materials to the actual building components. The first-tier truncation problem does not apply to all materials, but examples of such building components are windows and doors, electrical systems, or pipes. This problem is similar to the truncation error that concerns the higher-level tiers, but first-tier truncation cuts off the first tier. To address the first-tier truncation in this study, the processes for aluminum, steel, HDPE pipe and PVC pipe, and copper wire include transformation processes equal to the raw material input. For many components, the information was not available, which leads to a downwards bias, although this is not different from other building LCA case studies.
In conclusion, this study presented a wide range of both midpoint and endpoint results for a newly designed fiberglass house in Iceland within the LCA framework. As this was the first study conducted on a modular house utilizing fiberglass as the main building component, this study contributes to existing research by comprehensively reporting the environmental impacts of an alternative building solution. Based on the results, the fiberglass material, as assessed in this study, does not demonstrate environmental benefits compared to traditional non-renewable building materials. Therefore, it does not provide a suitable replacement when striving to reach environmental targets, unless improvements to the material quantity and/or composition are made to reduce environmental impacts. Based on the uncertainties and limitations discussed above, the results from this study should be interpreted with care, though the comprehensive reporting of midpoint and endpoint impacts can contribute to developing a baseline for comparison for building LCA studies. Replacing traditional building materials with low-impact alternatives has the potential to significantly reduce environmental impacts from the built environment, though future development should be guided by a thorough understanding of the lifetime environmental impacts from buildings.

Author Contributions

Conceptualization, all authors; methodology, all authors; software, S.B. and Ó.Ö.; validation, J.H., Á.Á., B.M. and Ó.Ö.; formal analysis, S.B.; data curation, S.B.; writing—original draft preparation, S.B.; writing—review and editing, all authors; visualization, S.B.; supervision, J.H., Á.Á., B.M. and Ó.Ö.; project administration, J.H.; funding acquisition, J.H. All authors have read and agreed to the published version of the manuscript.

Funding

The study was supported by the University of Iceland Research Fund (Vísindagarðar Háskóla Íslands).

Institutional Review Board Statement

Not applicable.

Informed Consent Statement

Not applicable.

Data Availability Statement

All the relevant data is published in the main body of the paper or as appendix tables.

Acknowledgments

The authors thank the fiberglass house producer for support in compiling the life cycle inventory (LCI).

Conflicts of Interest

The authors declare no conflict of interest.

Appendix A

The fiberglass modeling details.
Table A1. The quantities used for modeling 1 kg of fiberglass in Ecoinvent.
Material Name Quantity Unit
Glass fiber0.19kg
Modar NX resin0.785kg
Neulon LP 85 additive0.025kg
Maxgaurd FRX Gelcoat0.216kg
The ratio of fiberglass materials was provided by the producer of the fiberglass house. Information on fiberglass components was gathered from the distributer, IMCD (T. Sjöö, personal communication, 9 September 2020) as well as technical and safety datasheets from the producer Ashland (Maxguard FRX 11406 S GELCOAT; SDS No. 000000283246; Modar NX 860 TF RESIN; SDS No. 000000273216). Table A2 shows a breakdown of individual fiberglass components per kg of fiberglass material. The gelcoat is added as a finish on the surface of the fiberglass, so the total fiberglass surface area was calculated, and the gel coat quantity estimated based on coverage of 1 kg/m2 (INEOS Composites). The quantity per kg of fiberglass was calculated and included in the fiberglass process. The assembly energy is assumed to be negligible, as the fiberglass panels are formed from hand lay-up.
Table A2. Detailed modeling information for the fiberglass process.
ProcessProcess Name in OpenLCA SourceGeographical CoverageYearModeling Adjustments
Fiberglass Custom process ecoinvent 2020
Maxgaurd FRX Gelcoat epoxy resin production, liquid | epoxy resin, liquid | Cutoff, U—RER ecoinvent Poland 2020 Modified ecoinvent process from European to Poland by changing electricity process
Neulon LP 85 additive ethylene vinyl acetate copolymer production | ethylene vinyl acetate copolymer | Cutoff, U—RER ecoinvent Poland 2019 Modified ecoinvent process from European to Poland by changing electricity process
Glass fiber glass fibre production | glass fibre | Cutoff, U—RoW ecoinvent China 2019 Modified ecoinvent process from Rest of the World to China by changing the electricity process to CN, tap water process to RoW, and heat process to RoW
Modar NX Resinpolyester resin production, unsaturated | polyester resin, unsaturated | Cutoff, U—RER ecoinvent Spain 2019 Modified ecoinvent process from European to Spain by changing the electricity process

References

  1. Boyle, A. Climate Change, Sustainable Development, and Human Rights; Springer: Cham, Switzerland, 2020. [Google Scholar]
  2. Steffen, W.; Broadgate, W.; Deutsch, L.; Gaffney, O.; Ludwig, C. The trajectory of the Anthropocene: The Great Acceleration. Anthr. Rev. 2015, 2, 81–98. [Google Scholar] [CrossRef]
  3. Global Alliance for Buildings and Construction, International Energy Agency. 2020 Global Status Report for Buildings and Construction. 2020. Available online: https://globalabc.org/sites/default/files/inline-files/2020%20Buildings%20GSR_FULL%20REPORT.pdf (accessed on 1 August 2022).
  4. Röck, M.; Saade, M.R.M.; Balouktsi, M.; Rasmussen, F.N.; Birgisdottir, H.; Frischknecht, R.; Habert, G.; Lützkendorf, T.; Passer, A. Embodied GHG emissions of buildings—The hidden challenge for effective climate change mitigation. Appl. Energy 2019, 258, 114107. [Google Scholar] [CrossRef]
  5. Nwodo, M.; Anumba, C.J. A review of life cycle assessment of buildings using a systematic approach. Build. Environ. 2019, 162, 106290. [Google Scholar] [CrossRef]
  6. Säynäjoki, A.; Heinonen, J.; Junnonen, J.-M.; Junnila, S. Input–output and process LCAs in the building sector: Are the results compatible with each other? Carbon Manag. 2017, 8, 155–166. [Google Scholar] [CrossRef]
  7. Säynäjoki, A.; Heinonen, J.; Junnila, S. A scenario analysis of the life cycle greenhouse gas emissions of a new residential area. Environ. Res. Lett. 2012, 7, 034037. [Google Scholar] [CrossRef]
  8. Ramesh, T.; Prakash, R.; Shukla, K.K. Life cycle energy analysis of buildings: An overview. Energy Build. 2010, 42, 1592–1600. [Google Scholar] [CrossRef]
  9. Verbeeck, G.; Hens, H. Life cycle inventory of buildings: A contribution analysis. Build. Environ. 2010, 45, 964–967. [Google Scholar] [CrossRef]
  10. Gustavsson, L.; Joelsson, A. Life cycle primary energy analysis of residential buildings. Energy Build. 2010, 42, 210–220. [Google Scholar] [CrossRef]
  11. Wells, L.; Rismanchi, B.; Aye, L. A review of Net Zero Energy Buildings with reflections on the Australian context. Energy Build. 2018, 158, 616–628. [Google Scholar] [CrossRef]
  12. Crawford, R.H.; Bartak, E.L.; Stephan, A.; Jensen, C.A. Evaluating the life cycle energy benefits of energy efficiency regulations for buildings. Renew. Sustain. Energy Rev. 2016, 63, 435–451. [Google Scholar] [CrossRef]
  13. Amiri, A.; Ottelin, J.; Sorvari, J.; Junnila, S. Cities as carbon sinks—Classification of wooden buildings. Environ. Res. Lett. 2020, 15, 094076. [Google Scholar] [CrossRef]
  14. Kuittinen, M.; Zernicke, C.; Slabik, S.; Hafner, A. How can carbon be stored in the built environment? A review of potential options. Arch. Sci. Rev. 2021, 1–17. [Google Scholar] [CrossRef]
  15. Heinonen, J.; Säynäjoki, A.; Junnonen, J.-M.; Pöyry, A.; Junnila, S. Pre-use phase LCA of a multi-story residential building: Can greenhouse gas emissions be used as a more general environmental performance indicator? Build. Environ. 2016, 95, 116–125. [Google Scholar] [CrossRef] [Green Version]
  16. Hoxha, E.; Passer, A.; Saade, M.R.M.; Trigaux, D.; Shuttleworth, A.; Pittau, F.; Allacker, K.; Habert, G. Biogenic carbon in buildings: A critical overview of LCA methods. Build. Cities 2020, 1, 504–524. [Google Scholar] [CrossRef]
  17. Ben-Alon, L.; Loftness, V.; Harries, K.; Hameen, E.C. Life cycle assessment (LCA) of natural vs conventional building assemblies. Renew. Sustain. Energy Rev. 2021, 144, 110951. [Google Scholar] [CrossRef]
  18. Cabeza, L.F.; Barreneche, C.; Miró, L.; Morera, J.M.; Bartolí, E.; Fernández, A.I. Low carbon and low embodied energy materials in buildings: A review. Renew. Sustain. Energy Rev. 2013, 23, 536–542. [Google Scholar] [CrossRef]
  19. Dabaieh, M.; Emami, N.; Heinonen, J.T.; Marteinsson, B. A life cycle assessment of a ‘minus carbon’ refugee house: Global warming potential and sensitivity analysis. Archnet-IJAR Int. J. Arch. Res. 2020, 14, 559–579. [Google Scholar] [CrossRef]
  20. Dabaieh, M.; Heinonen, J.; El-Mahdy, D.; Hassan, D.M. A comparative study of life cycle carbon emissions and embodied energy between sun-dried bricks and fired clay bricks. J. Clean. Prod. 2020, 275, 122998. [Google Scholar] [CrossRef]
  21. Işildar, G.Y.; Morsali, S.; Gari, Z.H.Z. A comparison LCA of the common steel rebars and FRP. J. Build. Pathol. Rehabil. 2020, 5, 8. [Google Scholar] [CrossRef]
  22. Pacheco-Torres, R.; Jadraque, E.; Roldán-Fontana, J.; Ordóñez, J. Analysis of CO2 emissions in the construction phase of single-family detached houses. Sustain. Cities Soc. 2014, 12, 63–68. [Google Scholar] [CrossRef]
  23. Gong, X.; Nie, Z.; Wang, Z.; Cui, S.; Gao, F.; Zuo, T. Life Cycle Energy Consumption and Carbon Dioxide Emission of Residential Building Designs in Beijing. J. Ind. Ecol. 2012, 16, 576–587. [Google Scholar] [CrossRef]
  24. Anand, C.K.; Amor, B. Recent developments, future challenges and new research directions in LCA of buildings: A critical review. Renew. Sustain. Energy Rev. 2017, 67, 408–416. [Google Scholar] [CrossRef]
  25. Khasreen, M.M.; Banfill, P.F.G.; Menzies, G.F. Life-Cycle Assessment and the Environmental Impact of Buildings: A Review. Sustainability 2009, 1, 674–701. [Google Scholar] [CrossRef]
  26. Igos, E.; Benetto, E.; Meyer, R.; Baustert, P.; Othoniel, B. How to treat uncertainties in life cycle assessment studies? Int. J. Life Cycle Assess. 2018, 24, 794–807. [Google Scholar] [CrossRef]
  27. Guo, M.; Murphy, R. LCA data quality: Sensitivity and uncertainty analysis. Sci. Total Environ. 2012, 435–436, 230–243. [Google Scholar] [CrossRef] [PubMed]
  28. Bamber, N.; Turner, I.; Arulnathan, V.; Li, Y.; Ershadi, S.Z.; Smart, A.; Pelletier, N. Comparing sources and analysis of uncertainty in consequential and attributional life cycle assessment: Review of current practice and recommendations. Int. J. Life Cycle Assess. 2019, 25, 168–180. [Google Scholar] [CrossRef] [Green Version]
  29. Groen, E.; Heijungs, R.; Bokkers, E.; de Boer, I. Methods for uncertainty propagation in life cycle assessment. Environ. Model. Softw. 2014, 62, 316–325. [Google Scholar] [CrossRef]
  30. Chandrasekaran, V.; Dvarioniene, J.; Vitkute, A.; Gecevicius, G. Environmental Impact Assessment of Renovated Multi-Apartment Building Using LCA Approach: Case Study from Lithuania. Sustainability 2021, 13, 1542. [Google Scholar] [CrossRef]
  31. Morales, M.F.; Passuello, A.; Kirchheim, A.P.; Ries, R.J. Monte Carlo parameters in modeling service life: Influence on life-cycle assessment. J. Build. Eng. 2021, 44, 103232. [Google Scholar] [CrossRef]
  32. Ögmundarson, Ó.; Sukumara, S.; Laurent, A.; Fantke, P. Environmental hotspots of lactic acid production systems. GCB Bioenergy 2019, 12, 19–38. [Google Scholar] [CrossRef]
  33. Hjaltason, P. A02 Útlit (Verknr. 1709, Breyting 02) [Architectural Drawing]. 2020. Available online: https://www.map.is/grindavik/ (accessed on 3 December 2021).
  34. Minunno, R.; O’Grady, T.; Morrison, G.M.; Gruner, R.L.; Colling, M. Strategies for Applying the Circular Economy to Prefabricated Buildings. Buildings 2018, 8, 125. [Google Scholar] [CrossRef] [Green Version]
  35. Guinée, J.; De Haes, H.U.; Huppes, G. Quantitative life cycle assessment of products: 1:Goal definition and inventory. J. Clean. Prod. 1993, 1, 3–13. [Google Scholar] [CrossRef]
  36. ISO Standard No. 14044; Environmental Management-Life Cycle Assessment-Requirements and Guidelines. International Organization for Standardization: Geneva, Switzerland, 2006.
  37. United States Environmental Protection Agency. Life Cycle Assessment: Principals and Practice; National Risk Management Research Laboratory: Cincinnati, OH, USA, 2006; pp. 4–5. Available online: https://nepis.epa.gov/Exe/ZyPDF.cgi/P1000L86.PDF?Dockey=P1000L86.PDF (accessed on 29 August 2020).
  38. Buyle, M.; Braet, J.; Audenaert, A. Life cycle assessment in the construction sector: A review. Renew. Sustain. Energy Rev. 2013, 26, 379–388. [Google Scholar] [CrossRef]
  39. Crawford, R.H.; Bontinck, P.-A.; Stephan, A.; Wiedmann, T.; Yu, M. Hybrid life cycle inventory methods—A review. J. Clean. Prod. 2018, 172, 1273–1288. [Google Scholar] [CrossRef]
  40. Teh, S.H.; Wiedmann, T.; Moore, S. Mixed-unit hybrid life cycle assessment applied to the recycling of construction materials. J. Econ. Struct. 2018, 7, 13. [Google Scholar] [CrossRef] [Green Version]
  41. EN 15804:2012flA1; Sustainability of Construction Works, Environmental Product Declarations. Core Rules for the Product Category of Construction Products. U.S. Green Building Council: Washington, DC, USA, 2012.
  42. Passive House Institute. Criteria for the Passive House, EnerPHit and PHI Low Energy Building Standard. 2016. Available online: https://passiv.de/downloads/03_building_criteria_en.pdf (accessed on 15 September 2021).
  43. Karlsdottir, M.R.; Heinonen, J.; Palsson, H.; Palsson, O.P. Life cycle assessment of a geothermal combined heat and power plant based on high temperature utilization. Geothermics 2019, 84, 101727. [Google Scholar] [CrossRef]
  44. European Energy Agency. Energy Intensity in Europe. 2020. Available online: https://www.eea.europa.eu/data-and-maps/indicators/total-primary-energyintensity-4/assessment-1 (accessed on 9 May 2021).
  45. Reykjavik Energy. Annual Report 2018. 2018. Available online: https://annualreport2018.or.is/loftslagsm%C3%A1l/ (accessed on 9 May 2021).
  46. Fazeli, R.; Davidsdottir, B. Energy performance of dwelling stock in Iceland: System dynamics approach. J. Clean. Prod. 2017, 167, 1345–1353. [Google Scholar] [CrossRef]
  47. Rousselot, M. Energy Efficiency Trends in Buildings (Rep.). 2018. Available online: https://www.odysseemure.eu/publications/policy-brief/buildings-energy-efficiency-trends.html (accessed on 10 February 2021).
  48. Buildings Performance Institute Europe. Financing Building Energy Performance Improvement in Poland (Rep.). 2016. Available online: http://bpie.eu/wpcontent/uploads/2016/01/BPIE_Financing-building-energy-in-Poland_EN.pdf (accessed on 10 February 2021).
  49. European Commission. European Climate Law. 2021. Available online: https://ec.europa.eu/clima/policies/eu-climate-action/law_en (accessed on 9 May 2021).
  50. Government of Iceland. Iceland’s 2020 Climate Action Plan. 2020. Available online: https://www.government.is/library/01-Ministries/Ministry-for-TheEnvironment/201004%20Umhverfisraduneytid%20Adgerdaaaetlun%20EN%20V2.pdf (accessed on 9 May 2021).
  51. Government of Iceland. Energy. 2015. Available online: https://www.government.is/topics/business-and-industry/energy/ (accessed on 29 August 2020).
  52. Sigfússon, B.; Arnarson, M.; Snæbjörnsdóttir, S.; Karlsdóttir, M.R.; Aradóttir, E.S.; Gunnarsson, I. Reducing emissions of carbon dioxide and hydrogen sulphide at Hellisheidi power plant in 2014–2017 and the role of CarbFix in achieving the 2040 Iceland climate goals. Energy Procedia 2018, 146, 135–145. [Google Scholar] [CrossRef]
  53. Ecoinvent. About Ecoinvent. 2021. Available online: https://www.ecoinvent.org/about/about.html (accessed on 29 September 2021).
  54. Huijbregts, M.A.J.; Steinmann, Z.J.N.; Elshout, P.M.F.; Stam, G.; Verones, F.; Vieira, M.; Zijp, M.; Hollander, A.; van Zelm, R. ReCiPe2016: A harmonised life cycle impact assessment method at midpoint and endpoint level. Int. J. Life Cycle Assess. 2017, 22, 138–147. [Google Scholar] [CrossRef]
  55. Goedkoop, M.; Heijungs, R.; Huijbregts, M.; Schryver, A.; Struijs, J.; Zelm, R. ReCiPE 2008: A Life Cycle Impact Assessment Method Which Comprises Harmonised Category Indicators at the Midpoint and the Endpoint Level; Ruimte Enmilieu, Ministerie Van Volkshuisvesting, Tuimtelijke Ordening en Milieubeheer: Den Haag, The Netherlands, 2008. [Google Scholar]
  56. Emami, N.; Heinonen, J.; Marteinsson, B.; Säynäjoki, A.; Junnonen, J.-M.; Laine, J.; Junnila, S. A Life Cycle Assessment of Two Residential Buildings Using Two Different LCA Database-Software Combinations: Recognizing Uniformities and Inconsistencies. Buildings 2019, 9, 20. [Google Scholar] [CrossRef]
  57. Skullestad, J.L.; Bohne, R.A.; Lohne, J. High-rise Timber Buildings as a Climate Change Mitigation Measure—A Comparative LCA of Structural System Alternatives. Energy Procedia 2016, 96, 112–123. [Google Scholar] [CrossRef] [Green Version]
  58. Dong, Y.; Ng, S.T. Comparing the midpoint and endpoint approaches based on ReCiPe—A study of commercial buildings in Hong Kong. Int. J. Life Cycle Assess. 2014, 19, 1409–1423. [Google Scholar] [CrossRef]
  59. Bare, J.C.; Hofstetter, P.; Pennington, D.W.; De Haes, H.A.U. Midpoints versus endpoints: The sacrifices and benefits. Int. J. Life Cycle Assess. 2000, 5, 319. [Google Scholar] [CrossRef] [Green Version]
  60. Heijungs, R. On the number of Monte Carlo runs in comparative probabilistic LCA. Int. J. Life Cycle Assess. 2019, 25, 394–402. [Google Scholar] [CrossRef] [Green Version]
  61. Rockström, J.; Steffen, W.; Noone, K.; Persson, Å.; Chapin, F.S., III; Lambin, E.F.; Lenton, T.M.; Scheffer, M.; Folke, C.; Schellnhuber, H.J.; et al. A safe operating space for humanity. Nature 2009, 461, 472–475. [Google Scholar] [CrossRef] [PubMed]
  62. Laurent, A.; Olsen, S.I.; Hauschild, M.Z. Normalization in EDIP97 and EDIP2003: Updated European inventory for 2004 and guidance towards a consistent use in practice. Int. J. Life Cycle Assess. 2011, 16, 401–409. [Google Scholar] [CrossRef]
  63. Pizzol, M.; Christensen, P.; Schmidt, J.; Thomsen, M. Impacts of “metals” on human health: A comparison between nine different methodologies for Life Cycle Impact Assessment (LCIA). J. Clean. Prod. 2011, 19, 646–656. [Google Scholar] [CrossRef]
  64. Fantke, P.; Aylward, L.; Bare, J.; Chiu, W.A.; Dodson, R.; Dwyer, R.; Ernstoff, A.; Howard, B.; Jantunen, M.; Jolliet, O.; et al. Advancements in Life Cycle Human Exposure and Toxicity Characterization. Environ. Health Perspect. 2018, 126, 125001. [Google Scholar] [CrossRef]
  65. Hou, P.; Jolliet, O.; Zhu, J.; Xu, M. Estimate ecotoxicity characterization factors for chemicals in life cycle assessment using machine learning models. Environ. Int. 2019, 135, 105393. [Google Scholar] [CrossRef]
  66. Westh, T.B.; Hauschild, M.Z.; Birkved, M.; Jørgensen, M.S.; Rosenbaum, R.K.; Fantke, P. The USEtox story: A survey of model developer visions and user requirements. Int. J. Life Cycle Assess. 2014, 20, 299–310. [Google Scholar] [CrossRef]
  67. Dahlbo, H.; Koskela, S.; Pihkola, H.; Nors, M.; Federley, M.; Seppälä, J. Comparison of different normalised LCIA results and their feasibility in communication. Int. J. Life Cycle Assess. 2012, 18, 850–860. [Google Scholar] [CrossRef]
  68. Duflou, J.R.; Deng, Y.; Van Acker, K.; Dewulf, W. Do fiber-reinforced polymer composites provide environmentally benign alternatives? A life-cycle-assessment-based study. MRS Bull. 2012, 37, 374–382. [Google Scholar] [CrossRef] [Green Version]
  69. Suh, S.; Lenzen, M.; Treloar, G.J.; Hondo, H.; Horvath, A.; Huppes, G.; Jolliet, O.; Klann, U.; Krewitt, W.; Moriguchi, Y.; et al. System Boundary Selection in Life-Cycle Inventories Using Hybrid Approaches. Environ. Sci. Technol. 2003, 38, 657–664. [Google Scholar] [CrossRef] [PubMed]
  70. Silva, V.; Pulgrossi, L. When part is too little: Cutoff rules’ influence on LCA application to whole-building studies. In Proceedings of the Windsor 2020: Resilient Comfort, Windsor, UK, 16–19 April 2020. [Google Scholar]
  71. Joensuu, T.; Leino, R.; Heinonen, J.; Saari, A. Developing Buildings’ Life Cycle Assessment in Circular Economy-Comparing methods for assessing carbon footprint of reusable components. Sustain. Cities Soc. 2021, 77, 103499. [Google Scholar] [CrossRef]
  72. Petrovic, B.; Myhren, J.A.; Zhang, X.; Wallhagen, M.; Eriksson, O. Life Cycle Assessment of Building Materials for a Single-family House in Sweden. Energy Procedia 2019, 158, 3547–3552. [Google Scholar] [CrossRef]
  73. Evangelista, P.P.; Kiperstok, A.; Torres, E.A.; Gonçalves, J.P. Environmental performance analysis of residential buildings in Brazil using life cycle assessment (LCA). Constr. Build. Mater. 2018, 169, 748–761. [Google Scholar] [CrossRef]
  74. Sim, J.; Sim, J. The air emission assessment of a South Korean traditional building during its life cycle. Build. Environ. 2016, 105, 283–294. [Google Scholar] [CrossRef]
  75. Asdrubali, F.; Baldassarri, C.; Fthenakis, V. Life cycle analysis in the construction sector: Guiding the optimization of conventional Italian buildings. Energy Build. 2013, 64, 73–89. [Google Scholar] [CrossRef]
  76. Blengini, G.A.; Di Carlo, T. Energy-saving policies and low-energy residential buildings: An LCA case study to support decision makers in Piedmont (Italy). Int. J. Life Cycle Assess. 2010, 15, 652–665. [Google Scholar] [CrossRef]
  77. Ruuska, A.P.; Häkkinen, T.M. The significance of various factors for GHG emissions of buildings. Int. J. Sustain. Eng. 2014, 8, 317–330. [Google Scholar] [CrossRef]
  78. Takano, A.; Hughes, M.; Winter, S. A multidisciplinary approach to sustainable building material selection: A case study in a Finnish context. Build. Environ. 2014, 82, 526–535. [Google Scholar] [CrossRef]
  79. Heinonen, J.; Junnila, S. Residential energy consumption patterns and the overall housing energy requirements of urban and rural households in Finland. Energy Build. 2014, 76, 295–303. [Google Scholar] [CrossRef]
Figure 1. Model of the fiberglass house in Iceland. Reprinted from Hjaltason [33].
Architecture 02 00037 g001
Figure 2. Horizontal fiberglass panels used in the roof of the fiberglass house.
Architecture 02 00037 g002
Figure 3. Vertical fiberglass panels used in the vertical exterior walls of the fiberglass house.
Architecture 02 00037 g003
Figure 4. System boundary, cradle to site, of the fiberglass house LCA study. Figure according to EN 15804. Adapted from U.S. Green Building Council [41].
Architecture 02 00037 g004
Figure 5. Midpoint hotspot analysis by material. Each color represents the impacts from each material to the18 midpoint impact categories.
Architecture 02 00037 g005
Figure 6. (a) Most contributing main materials to GWP. (b) Most contributing material sub-types to GWP.
Architecture 02 00037 g006
Figure 7. Uncertainty distribution for global warming potential. From left to right, red lines represent the 5th percentile, median value, mean value, and 95th percentile.
Architecture 02 00037 g007
Figure 8. Lifetime GHG emissions over a 50-year timeframe in three geographic locations: Iceland, Poland, and Finland. Scenario 1, represented by the solid lines, utilizes current building standards for each respective country. Scenario 2, represented by dotted lines, reflects the Passive House standard.
Architecture 02 00037 g008
Figure 9. GWP reported for studies in Table 8 (kg CO2eq/m2).
Architecture 02 00037 g009
Figure 10. GWP reported for frame/wall materials from previous LCA studies reported as kg CO2eq/m2, compared to this study.
Architecture 02 00037 g010
Table 1. Characteristics of the fiberglass house in Iceland.
Gross floor area 186 m2
Heated area 106 m2
Mass 130 t
Construction year 2020
Table 2. Five main building systems of the fiberglass house, split by the main components of each, along with the main materials of each component.
Building SystemsMain Materials
1. Foundations
WallsConcrete, steel reinforcement
Ground SlabConcrete, steel reinforcement
InsulationExpanded polystyrene (EPS)
2. Frame and roof structures
SupportSteel, fiberglass
External wallsFiberglass panels–fiberglass, stone wool
Internal WallsFiberglass panels–fiberglass, stone wool
RoofFiberglass panels–fiberglass, stone wool
InsulationStone wool
3. Complementary works
WindowsDouble-pane, fiberglass frame
Internal doorsDouble-pane, fiberglass frame
External doorsDouble-pane, fiberglass frame
4. Finishes
GypsumGypsum fiberboard
Interior and exterior paintAcrylic paint
5. Mechanical works
Floor heatingHigh-density polyethylene (HDPE) pipe
PlumbingHDPE pipe, polyvinyl chloride (PVC) pipe
ElectricalHDPE pipe, PVC pipe, aluminum, copper, steel
Table 3. Estimated quantity (in kg) of each main material for the total building and to meet the functional unit. Includes the assumed density used to calculate the weight for relevant materials.
Material Building Total
(kg)
Total per FU (kg/m2)Assumed Density (kg/m3)
Concrete 100,8005422252
Fiberglass 433923.3-
Glass fiber 8244.4344.5
Modar NX Resin 340618.31700
Neulon LP 85 additive 1080.61000
Maxgaurd FRX Gelcoat 9375-
Rockwool (stone wool)91404980
Fermacell gypsum fiber board9158491180
EPS1941.0430
Window/door glass 15858.5-
Fiberglass window/door frame1460.8-
Steel 258013.97850
HDPE Pipe2151.2940
PVC Pipe 2541.41467
Aluminum pipes, tracks 220.12700
Copper wire380.28960
Interior acrylic paint 400.2-
Exterior paint 1400.8-
Total 129,587696
Table 4. The current energy GHG content and the assumed annual energy consumption in the two scenarios.
kg CO2 eq/kWh
(Year 1)
Energy Consumption
Scenario 1 (kWh/m2/yr)
Energy Consumption
Scenario 2 (kWh/m2/yr)
HeatElec.HeatElec.HeatElec.
Iceland0.010.009 44 701545
Poland0.4 0.723 701545
Finland0.2 0.0826 70 1545
Table 5. Midpoint results to the 18 midpoint impact categories. The uncertainty ranges for the 5th and 95th percentile are shown in parentheses.
Name Unit Total Results per FU
(5th–95th Percentile)
Climate changekg CO2 eq311 (178–1445)
Fine particulate matter formationkg PM2.5 eq0.4 (0.3–2)
Fossil resource scarcitykg oil eq93 (52–463)
Freshwater ecotoxicitykg 1.4-DCB20 (18–101)
Freshwater eutrophicationkg P eq0.08 (0.05–0.5)
Human carcinogenic toxicitykg 1.4-DCB127 (69–520)
Human non-carcinogenic toxicitykg 1.4-DCB229 (201–1686)
Ionizing radiationkBq Co-60 eq16 (5–178)
Land usem2a crop eq7 (5–34)
Marine ecotoxicitykg 1.4-DCB26 (24–132)
Marine eutrophicationkg N eq0.01 (0.007–0.04)
Mineral resource scarcitykg Cu eq2 (1–6)
Ozone formation, Human healthkg NOx eq0.8 (0.5–3)
Ozone formation, Terrestrial ecosystemskg NOx eq0.9 (0.6–3)
Stratospheric ozone depletionkg CFC11 eq0.001 (0.0002–0.01)
Terrestrial acidificationkg SO2 eq1 (0.6–4)
Terrestrial ecotoxicitykg 1.4-DCB595 (526–2404)
Water consumptionm38 (−491–347)
Table 6. Endpoint results, based on the FU.
LCA Area of Protection Unit Result
Damage to ecosystems species.yr 1.44 × 10⁻⁶
Damage to human health DALY 1.07 × 10⁻³
Damage to resource availabilityUSD2013 3.1 × 10
Table 7. Weighted endpoint results and single score, based on the FU.
LCA Area of Protection Unit Result
Damage to ecosystems Pt4.11 × 10−7
Damage to human health Pt1 × 10−2
Damage to resource availability Pt1.76 × 108
Single Score Pt1.76 × 108
Table 8. Selected previous detached house LCA studies used to position the GWP from the fiberglass house of this study.
Study Location Floor Area (m2) Main Materials
Dabaieh et al. [19]Sweden 37Plant-based
Emami et al. [56]Finland149Wood
Petrovic et al. [62] Sweden180Wood
Evangelista et al. [63] Brazil56Concrete
Sim & Sim, [64] Korea 77Wood
Pacheco-Torres et al. [22] Spain313 Concrete, steel
Asdrubali et al. [65] Italy 443Concrete
Blengini & Di Carlo, [66]Italy 376Concrete, brick
Table 9. Selected previous studies used to position the GWP from the frame/wall structures of thefiberglass house of this study.
StudyBuilding TypeSize (m2)Frame and Wall
Ruuska & Häkkinen, [67]Apartment building3056Reinforced concrete
Takano et al. [68]Detached1243Lightweight timber panel
Takano et al. [68]Detached1243Cross-laminated timber
Takano et al. [68]Detached1243Reinforced concrete
Takano et al. [68]Detached1243Steel
Heinonen et al. [15]Apartment building3085Reinforced concrete
Publisher’s Note: MDPI stays neutral with regard to jurisdictional claims in published maps and institutional affiliations.

