Article

Comparison of the Basic Reproduction Numbers for COVID-19 through Four Waves of the Pandemic in Vietnam

1
Department of Veterinary Microbiology and Infectious Diseases, Faculty of Veterinary Medicine, Vietnam National University of Agriculture, Ha Noi 131000, Vietnam
2
Department of Pharmacology, Toxicology, Internal Medicine and Diagnostics, Faculty of Veterinary Medicine, Vietnam National University of Agriculture, Ha Noi 131000, Vietnam
3
Department of Veterinary Public Health, Faculty of Veterinary Medicine, Vietnam National University of Agriculture, Ha Noi 131000, Vietnam
*
Author to whom correspondence should be addressed.
These authors contributed equally to this work.
Int. J. Transl. Med. 2023, 3(1), 1-11; https://doi.org/10.3390/ijtm3010001
Submission received: 1 November 2022 / Revised: 18 November 2022 / Accepted: 16 December 2022 / Published: 21 December 2022

Abstract

:
Estimating the basic reproduction number (R0) of an infectious disease is a crucial step to describe the contagiousness and provides suggestions for interventions. To lift the effectiveness of preventive measures for the COVID-19 pandemic, we need to minimize the newly infected cases by reaching adequate herd immunity. This study thus aimed to compare the R0 through four waves of COVID-19 outbreaks in Vietnam and to calculate the minimal vaccination coverage in different populations. The data on the number of daily confirmed COVID-19 patients were collected from 21 January 2020 to 16 November 2021 from the daily reports through the four waves of the pandemic in Vietnam. The R0 values were estimated by exponential growth and the maximum likelihood methods to range from 1.04 to 3.31 from the first to the third wave. The fourth wave was the most severe, especially in the southern provinces, and the highest R0 was in Ho Chi Minh City. The herd immunity would range from 43.50% to 95.76% by various R0 values from different populations. Overall, the presence of new viral mutants increased the infectiousness and the vaccination coverage was higher to establish the required herd immunity in a high-density population. The results provide the basis for policy recommendations and resource allocation for vaccine management and distribution at a time when the COVID-19 pandemic is not yet over.

1. Introduction

The whole world is still facing COVID-19, which is classified as a highly infectious disease due to its quick spread. Therefore, more and more studies are focused on algorithms through statistical and artificial intelligence approaches to develop accurate forecasting models for the spread of the COVID-19 pandemic to support managing this pandemic [1,2]. Estimating the basic reproduction number (R0) of an infectious disease such as COVID-19 is a crucial step to describe the contagiousness or transmissibility of infectious agents [3]. R0 is affected by numerous biological, socio-behavioral, and environmental factors. It is usually estimated with various types of complex mathematical models. Therefore, the R0 value varies according to the pathogen and the local socio-behavioral and environmental circumstances [4]. R0 can be defined as the average number of secondary infections that are produced in a susceptible host population when an infected individual is introduced into that population during its entire infectious period [5]. This value can be estimated using a variety of mathematical methods, for example, from the stability analysis of a compartmental model, via the matrix of next generation, from the final size of an epidemic, from the initial growth rate… Therefore, R0 could obtain different values depending on the method used. The R0 value gives information about the situation of the infection whether it is likely to spread in a population when R0 > 1 or disappear from the population when R0 < 1 [6]. Providing vaccination for the whole population is hard to achieve due to some reasons such as the age threshold eligible for vaccination, anxiety, and afraid of the side effects of COVID-19 vaccination [7]. Therefore, vaccinating a specific proportion of the population could work as a protective wall for other susceptible persons against getting the infection. This proportion can be calculated depending on the R0 of the disease. On the other hand, a mathematical model could be developed from the R0 value, which is an effective tool used in predictive disease dynamics and provides suggestions on related interventions. Many studies have also used the forecasting model for COVID-19 through the officially reported data [8,9].
The first cases of COVID-19 were reported in Wuhan City in China in December 2019 [10]. The COVID-19 pandemic has spread rapidly across the globe since December 2019. The number of confirmed cases is still increasing rapidly in many countries (https://covid19.who.int/, accessed on 1 January 2022). As it spread easily worldwide, the disease was declared a pandemic on 11 March 2020 [11]. Since the outbreak of the disease, a large body of research on COVID-19 has been conducted to estimate the R0 values in different populations [12,13,14,15,16]. The R0 of COVID-19 was initially estimated by the World Health Organization (WHO) to range between 1.4 and 2.5 [17]. Liu et al. compared many published studies from December 2019 to January 2020 where the R0 for COVID-19 had a range of values between 1.4 and 6.49 [18]. From the official statistics of COVID-19 in the 15 largest countries in Western Europe, the average R0 value was estimated at 2.2 by the exponential growth method [16]. The R0 value depends not only on the biological characteristics of the disease, but also on the social habits of the population [19]. Therefore, R0 might be different from country to country or population to population.
In Vietnam, the first case was a 66-year-old Chinese male who traveled from Wuhan to visit his son living in Vietnam on 21 January 2020. Up to 16 November 2021, Vietnam experienced four waves of the COVID-19 pandemic. In 2020, despite sharing a long land border and high travel flows with China, Vietnam initially contained the spread of COVID-19, with the total number of deaths being 35. However, by 2021, the epidemic had become more severe, affecting all 63 provinces in Vietnam. The most severe epidemic places were in southern areas including Ho Chi Minh City and neighboring provinces [20]. There have been several reports on COVID-19 in Vietnam, however, these studies focused on outbreak investigation, social media, or risk perception and control [21,22,23,24,25,26]. Only one study also provided information about the effective reproduction number of COVID-19 in Vietnam from the daily confirmed cases recorded between January and December 2020 [26]. To the best of our knowledge, no existing studies have estimated the R0 of COVID-19 in Vietnam that could help to quantify the spread of infectious disease, predicting its speed, scale, and the herd immunity level required to control the disease. Herd immunity is resistance to the spread of an infectious disease within a population that occurs when a large portion of a community becomes immune to a disease as a result of infection or vaccination [27]. It is still unclear exactly how many people will need to be vaccinated to achieve herd immunity. Our aims were to compare the difference of R0 through four waves of COVID-19 outbreaks in Vietnam and to calculate the minimal vaccination coverage against COVID-19 in the main affected cities/provinces.

2. Materials and Methods
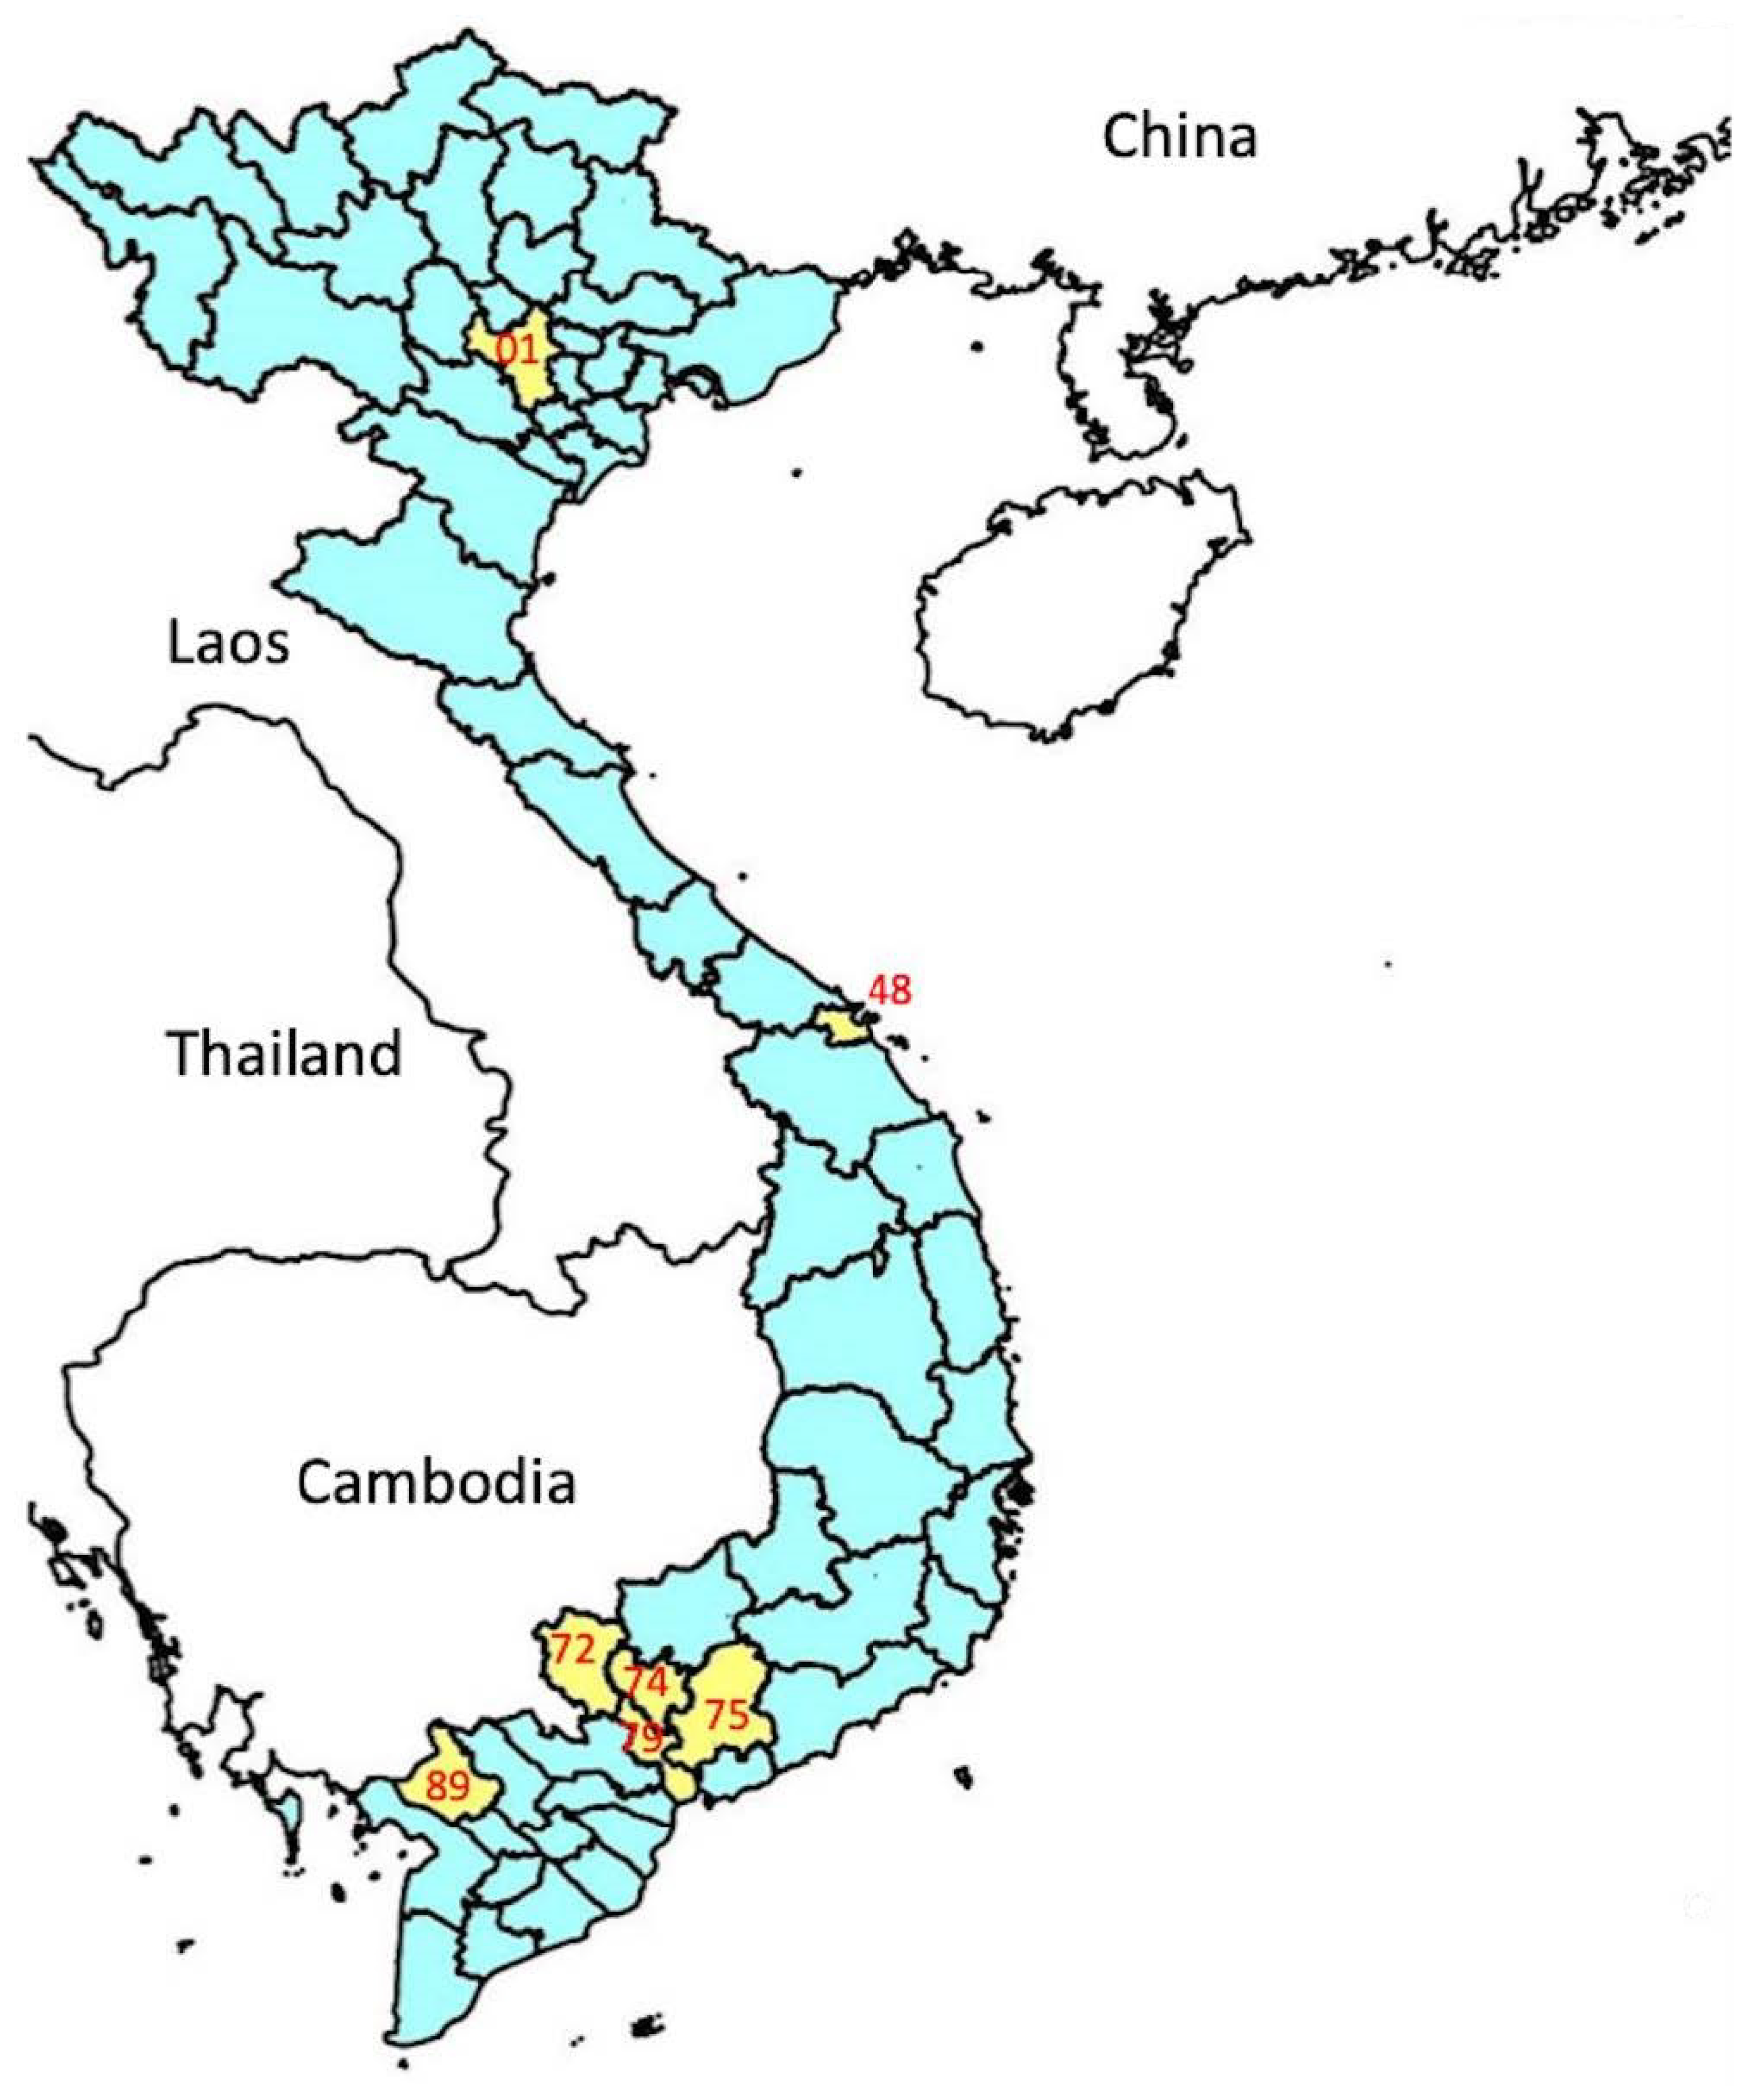
2.1. Study Area

Vietnam is a country in Southeast Asia with a population of over 96 million, the world’s fifteenth-most populous country. Northern Vietnam shares a long border with North China. Ha Noi’s capital is located in the north, the largest cities in the central and the south are Da Nang and Ho Chi Minh, respectively. The map of Vietnam and some major affected provinces by COVID-19 in the fourth wave were depicted using the free, open-source Quantum Geographic Information System (QGIS) (Figure 1).

2.2. Data Collection

In this study, a secondary study was implemented by using already existing data that was published on government public websites. The data on the number of confirmed COVID-19 patients who were positive for the reverse transcriptase polymerase chain reaction was collected from the daily situation reports of the Ministry of Health, Vietnam (https://ncov.vncdc.gov.vn/viet-nam.html, accessed on 1 May 2021). The first cases were detected on 21 January 2020. All data from the four waves of the COVID-19 pandemic in Vietnam were updated as of 16 November 2021 (Figure 2). The number of daily cases in some of the major affected provinces (including Ho Chi Minh City, HCM, and other southern provinces: Binh Duong, Dong Nai, An Giang, Tay Ninh; Ha Noi, capital in the north, HN; and Da Nang central area city) by COVID-19 in the fourth wave from 27 April to 16 November 2021 is indicated in Figure 3.

2.3. Calculation of the Basic Reproduction Number (R0)

There are different methods for the computing of R0, but some of them require more variables that were not present in our dataset. From our dataset, the exponential growth (EG) and maximum likelihood (ML) methods were available to estimate the R0 value. From the daily confirmed data, we set up the best-fitting generation time (GT) distribution for a series of the serial interval (SI) distribution of COVID-19 by the “est.GT” function in the package “R0” equipped. The generation time is the time lag between infection in a primary case and a secondary case. From GT distribution, the mean and standard deviation of the serial interval of COVID-19 were also calculated. Then, R0 was estimated by the EG and ML methods by the functions est.R0.EG and est.R0.ML in the “R0” package.

2.4. Calculation of Minimal Vaccination Coverage for COVID-19

Herd immunity is a form of immunity that occurs when the vaccination of a significant portion of a herd provides a measure of protection for individuals that have not developed immunity [28]. The R0 value can be used to calculate the herd immunity threshold (Ic), which is the minimum percentage of individuals in the population that would need to be vaccinated to ensure the disease does not persist. The value of R0 was used to calculate the Ic using the formula   1 1 / R 0 [28].

2.5. Data Analysis

The standard Microsoft Office Excel 2010 package was used for data processing. R0 estimation was calculated from the Epidemic’s package for R language in statistical computing in program R version 3.4.3 (R development team, Vienna, Austria). Quantum Geographic Information System (QGIS) version 2.14.14 was used for geovisualization (https://www.qgis.org/en/site/, accessed on 1 January 2022).

3. Results

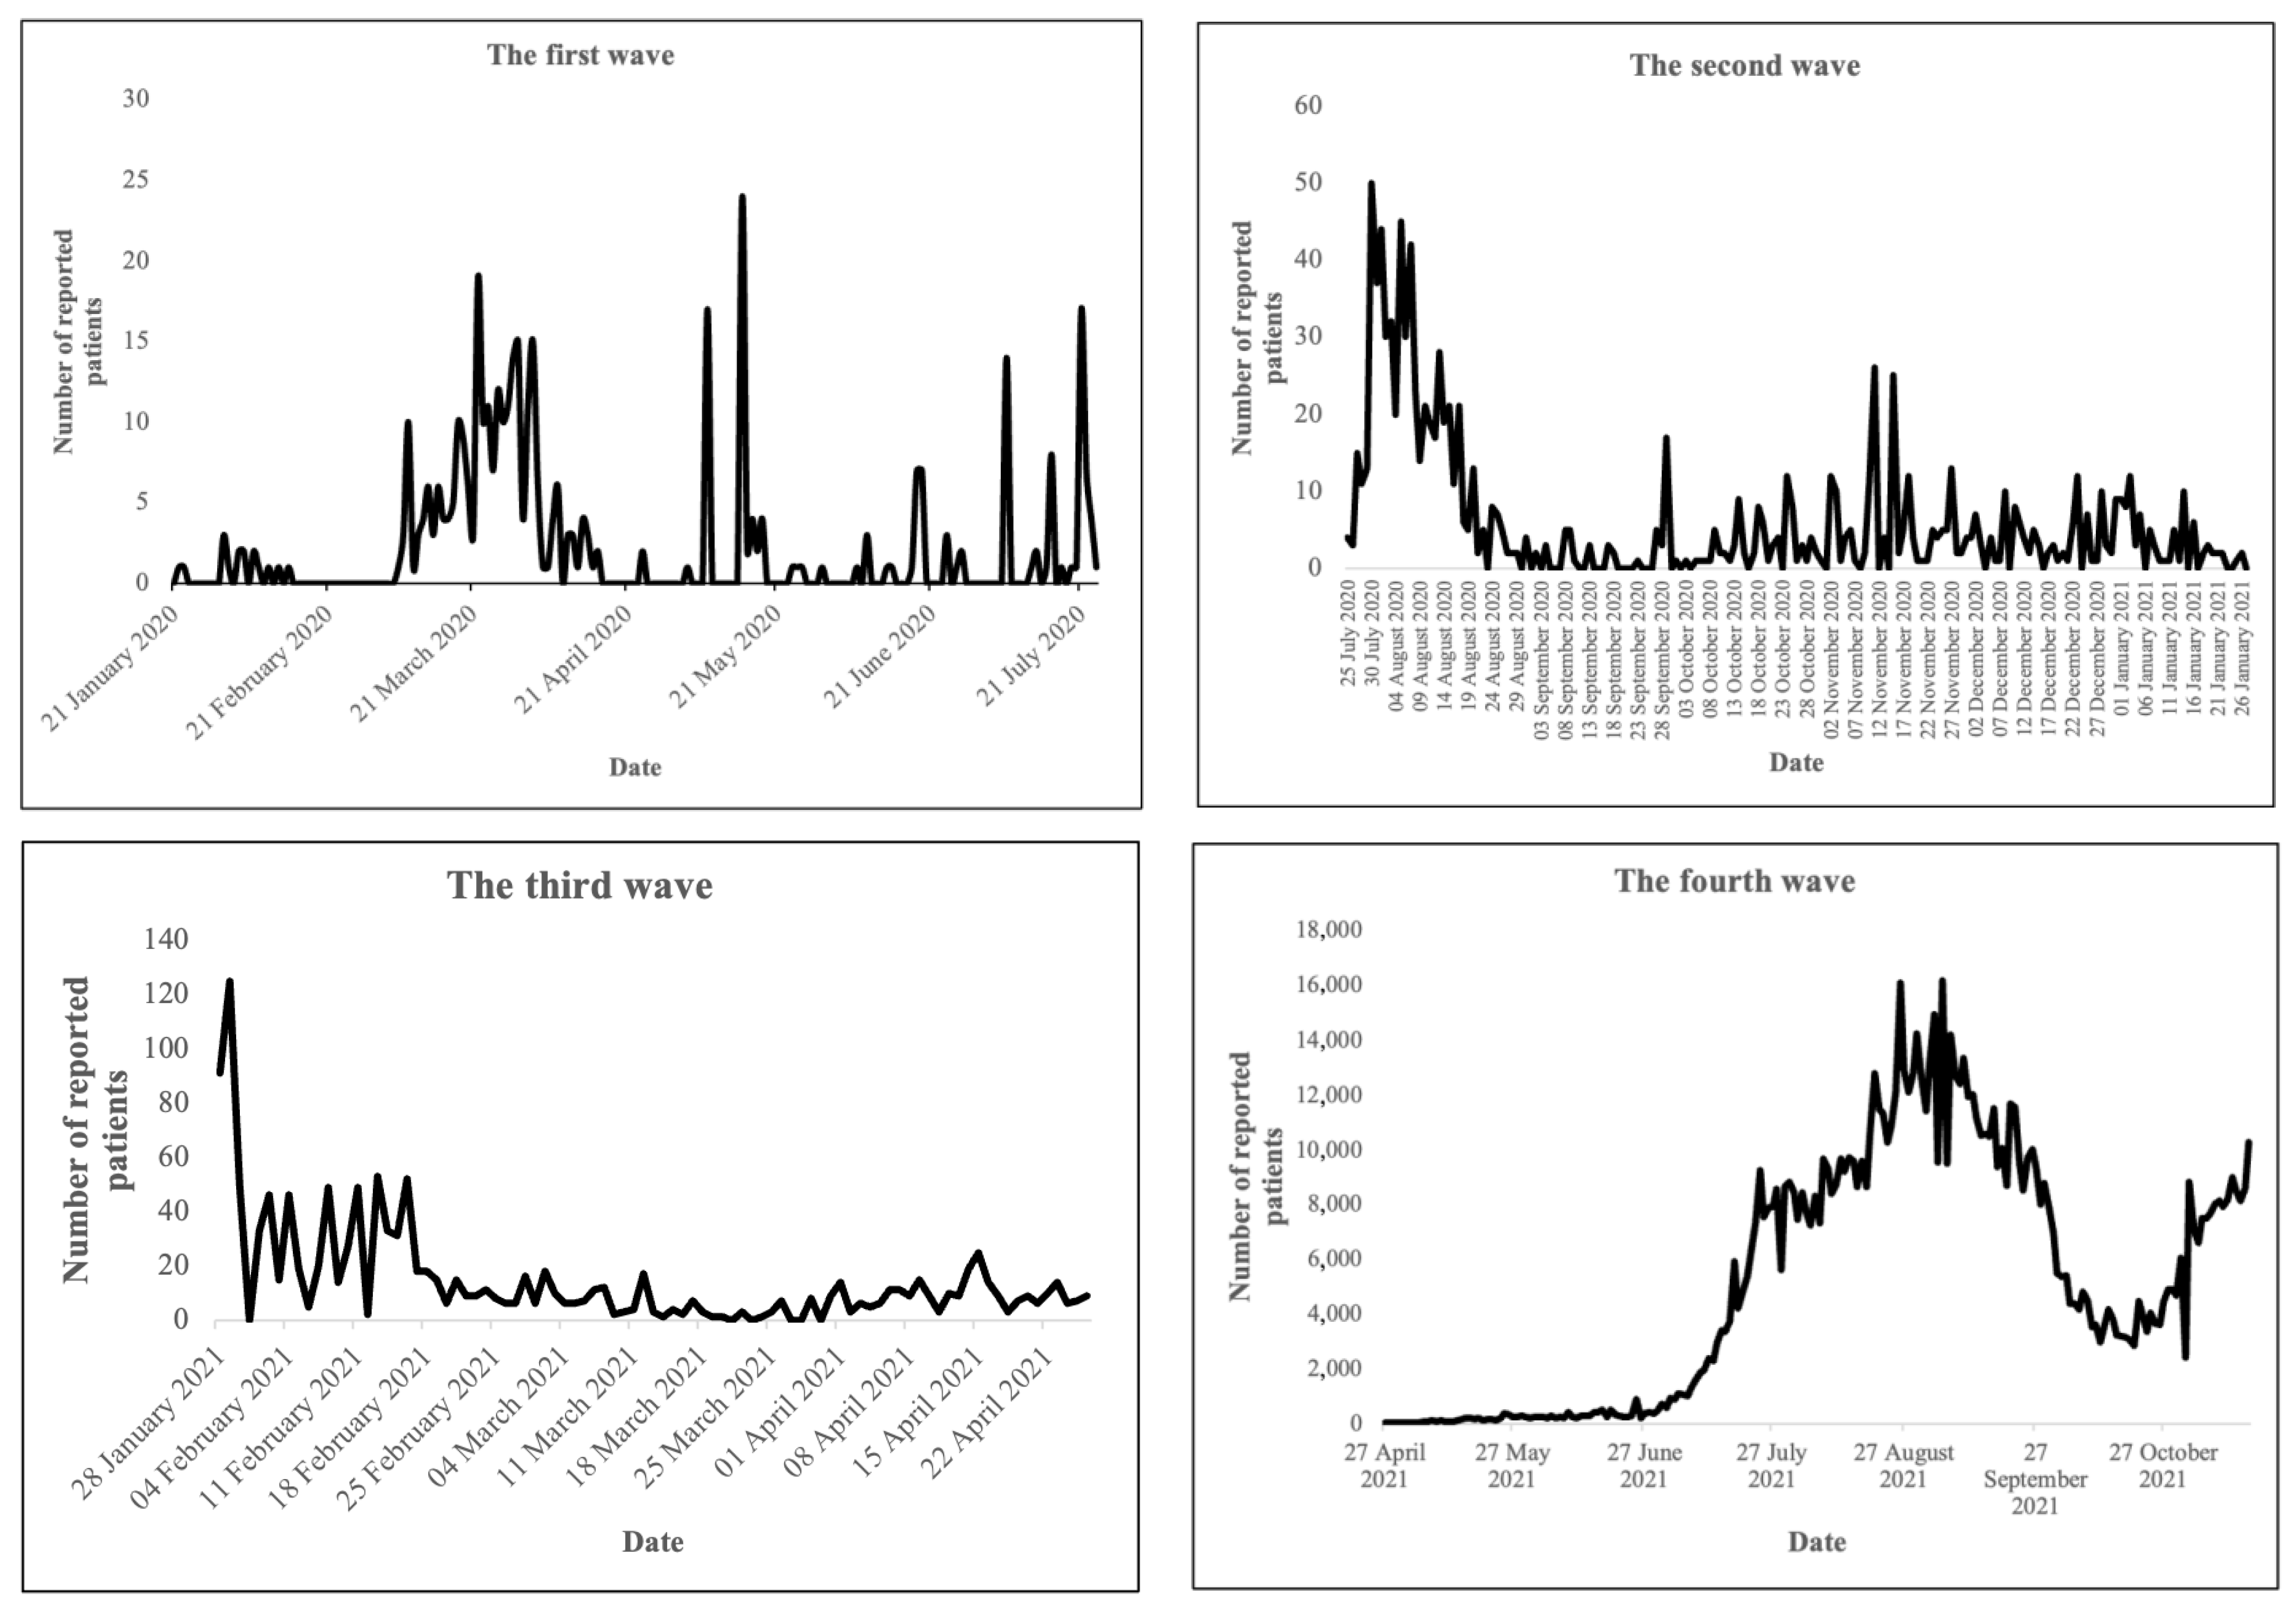
3.1. R0 Values of COVID-19 at the National Level from the First Three Waves of the Pandemic in Vietnam

The overall R0 values with 95% CI derived from the two methods and those from each wave are shown in Table 1. Overall, the highest R0 values were in the second wave using both EG and ML (3.31 and 2.92, respectively), and the lowest R0 values were estimated from the first wave of outbreak data (1.15 and 1.19). The R0 values of each outbreak wave estimated by different methods showed a slight difference. Except for the third wave, the R0 value from the ML method was much higher compared to the EG method (2.38 and 1.04 in the ML and EG method, respectively).

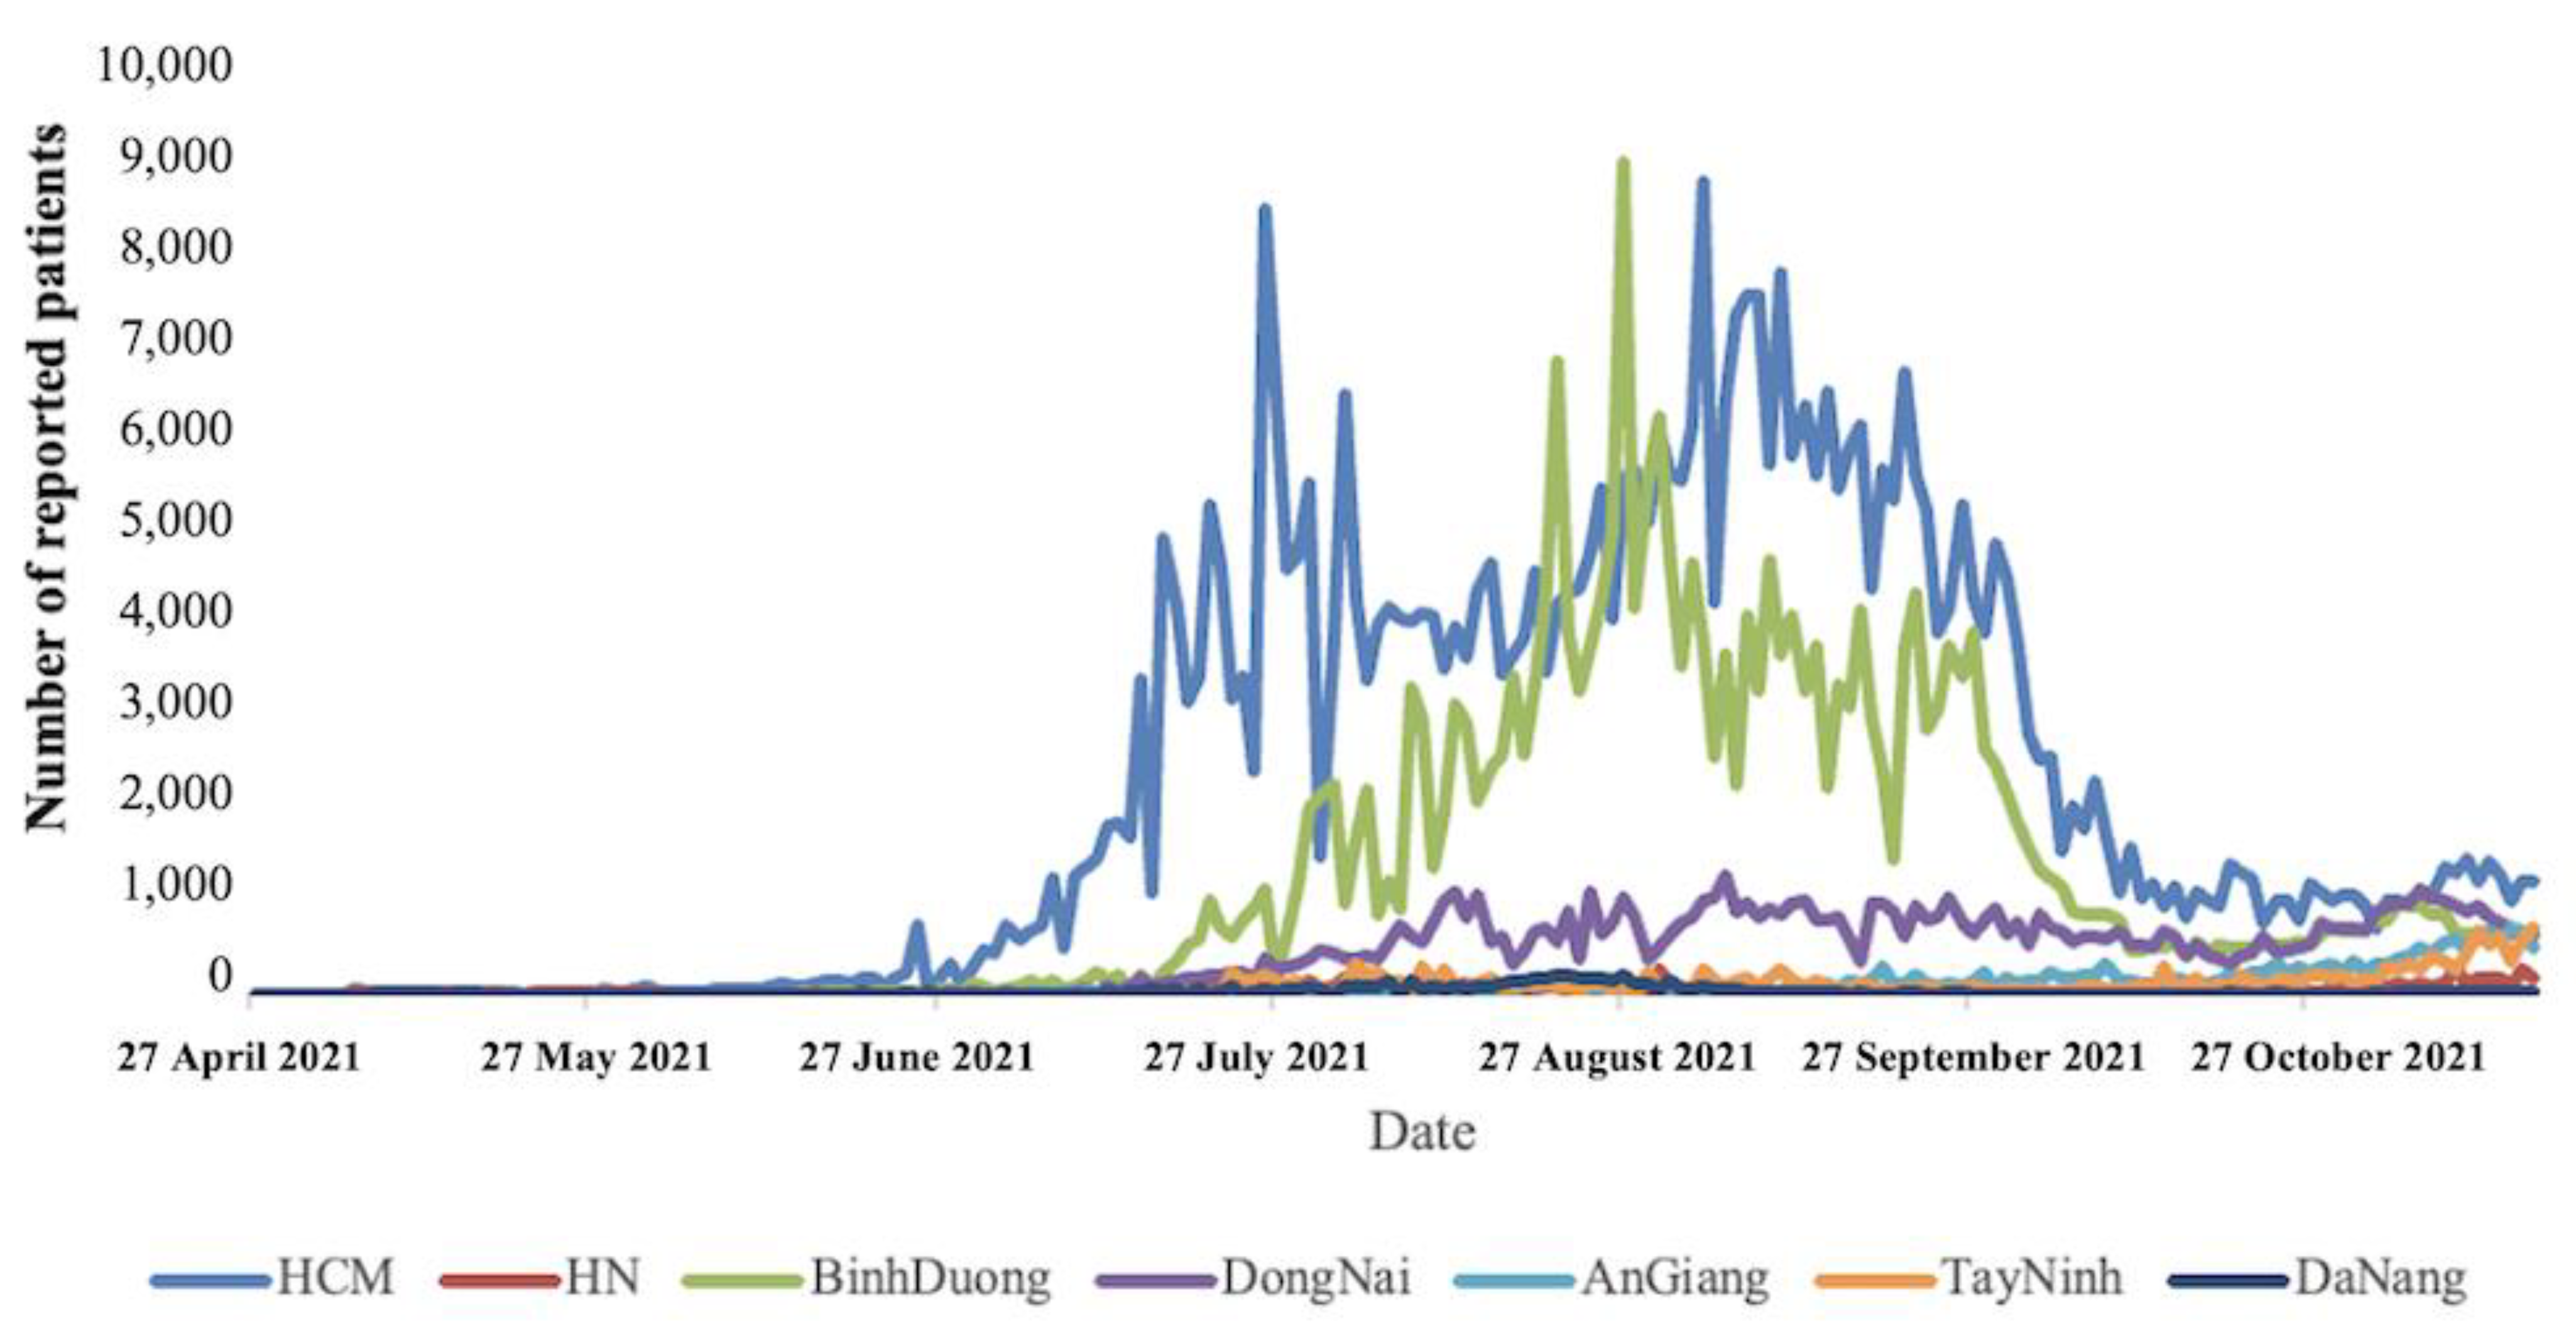
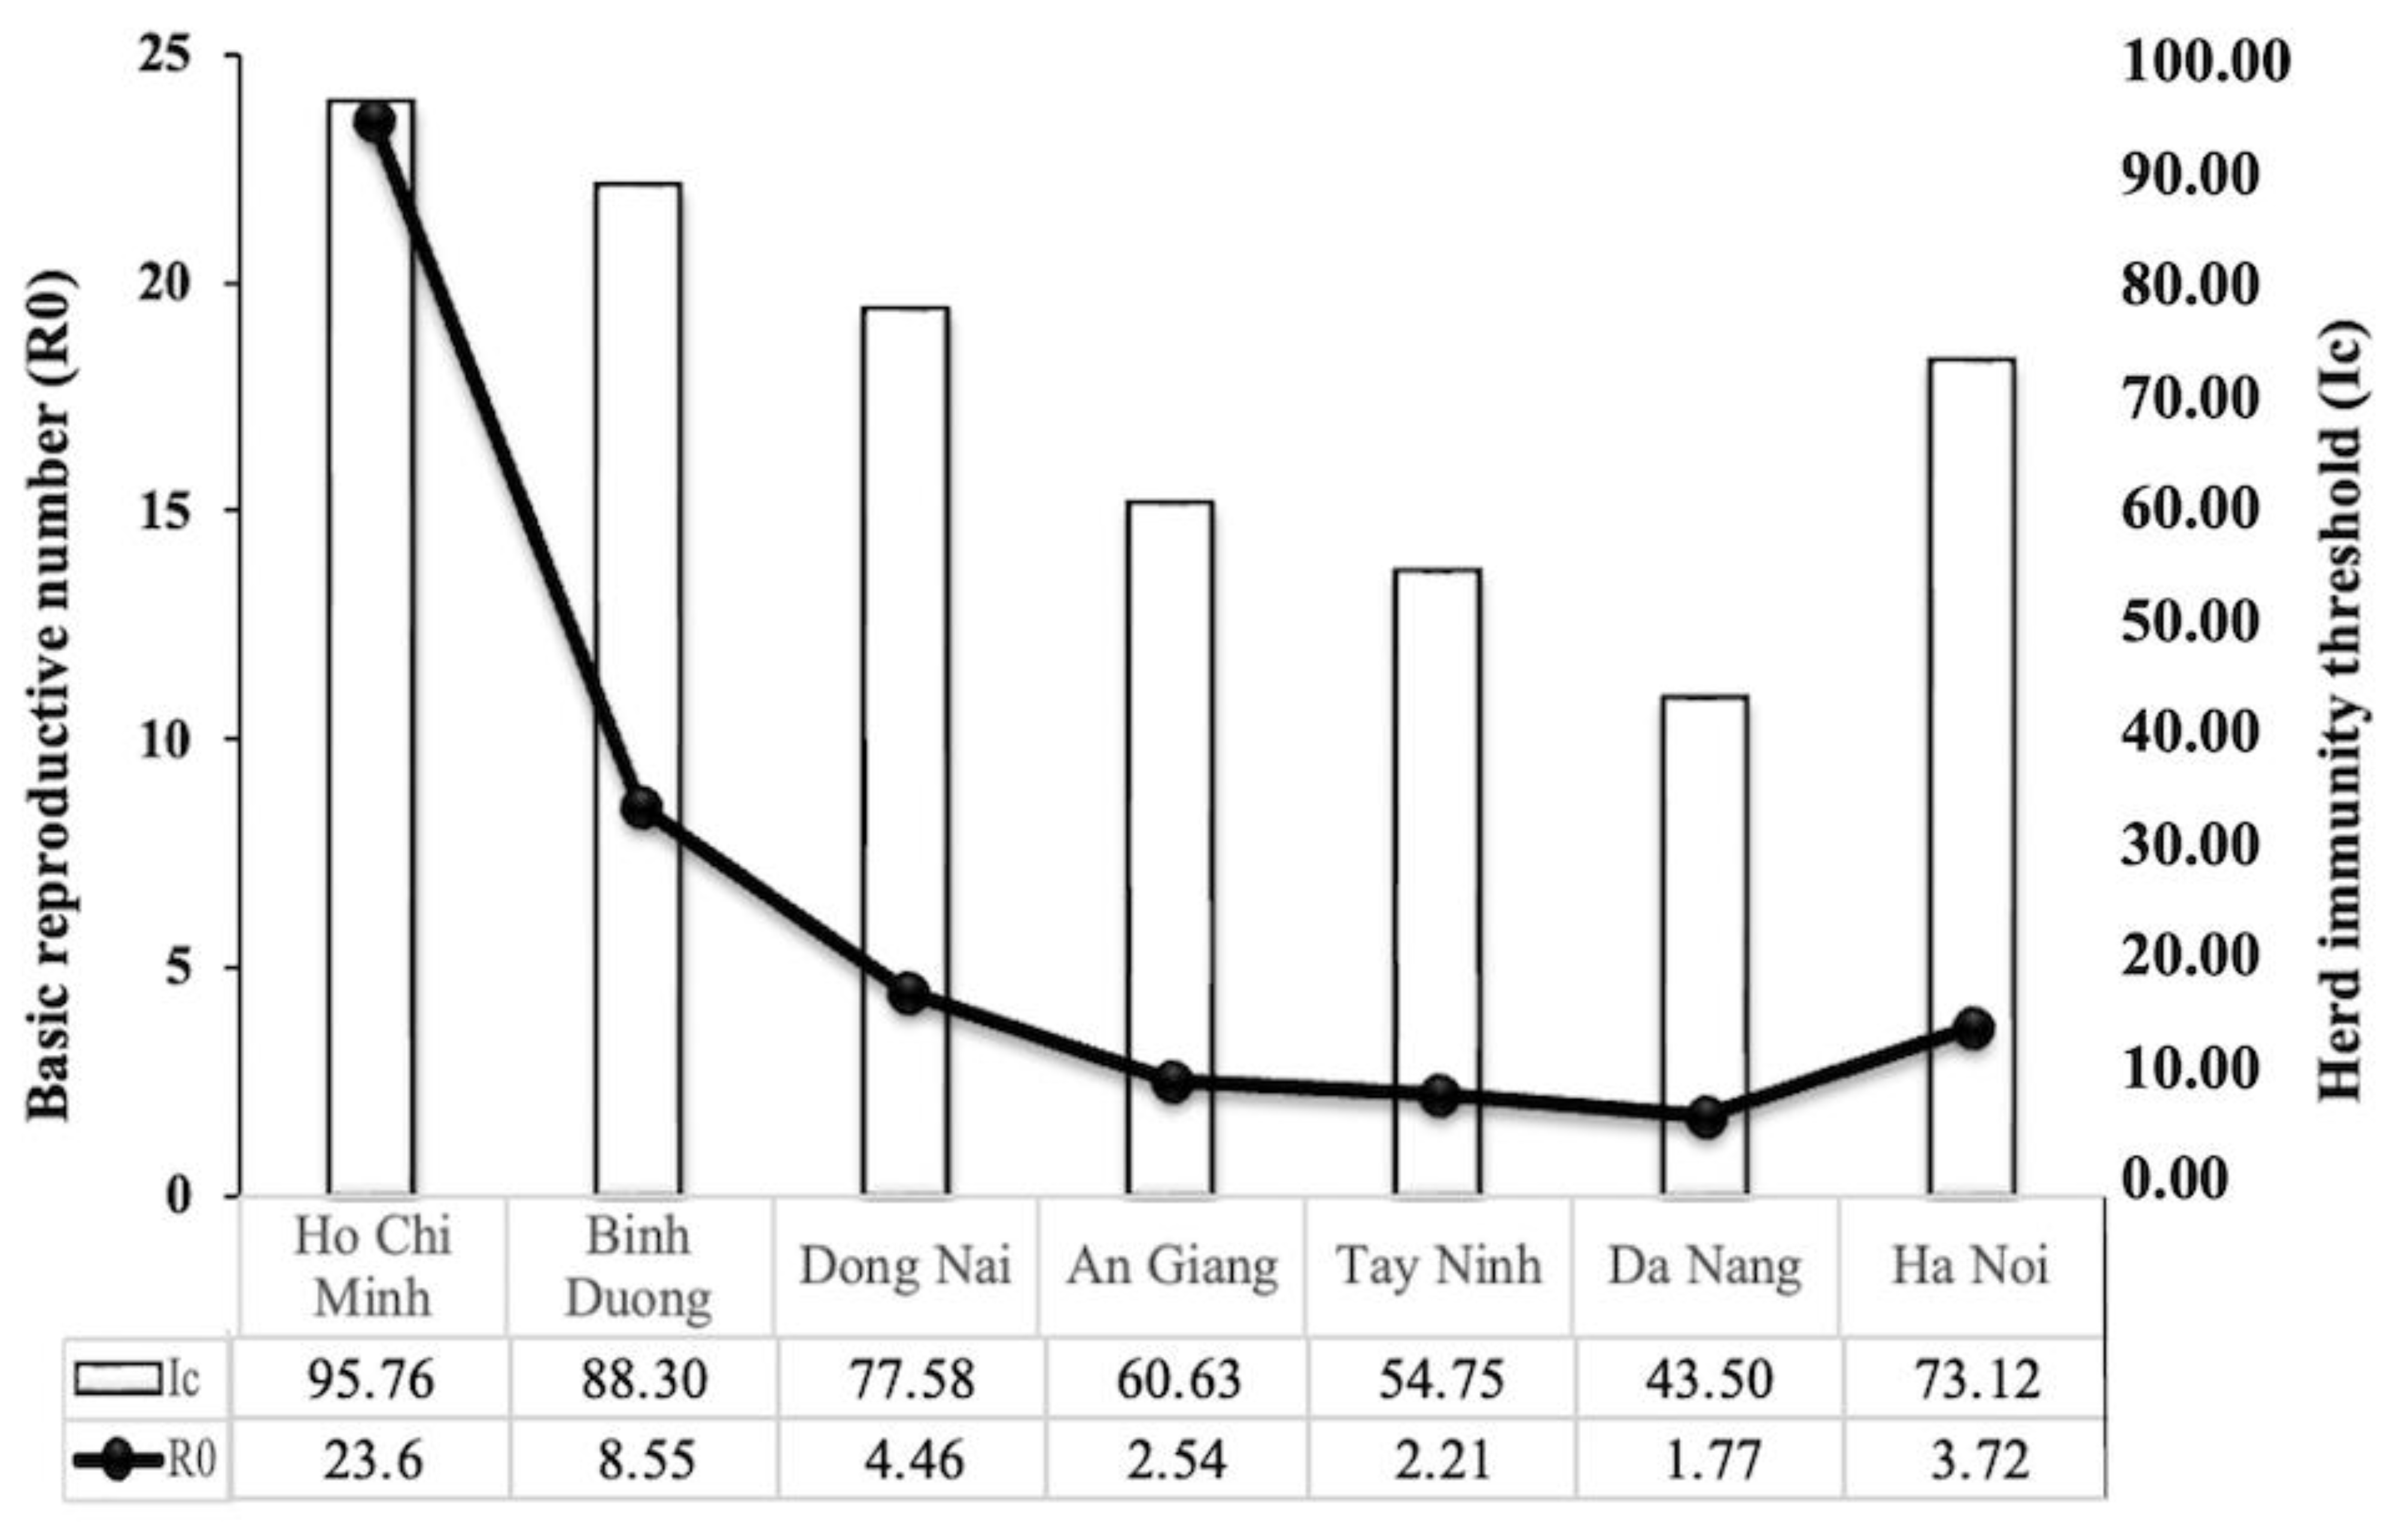
3.2. R0 Values of COVID-19 at the Province Level in Some Locations from the Fourth Wave of the Pandemic in Vietnam

In the fourth wave of the COVID-19 pandemic in Vietnam from 27 April 2021, some provinces were more affected, especially Ho Chi Minh City and neighboring provinces. Regarding the southern provinces in Vietnam, Ho Chi Minh City reached the highest R0 with 22.05 (95% CI: 21.86–22.24) people being infected by one sick person with the EG method and 23.60 (95% CI: 23.33–23.86) with the ML method. For the rest of the southern provinces, the R0 values were from 1.78 to 8.55, with a slight difference between the two methods. In the central representative of Da Nang city, R0 values of 1.73 (95% CI: 1.70–1.76) and 1.77 (95% CI: 1.69–1.85) were obtained by the EG and ML methods, respectively. In the north, R0 values of COVID-19 in the capital Ha Noi were 3.64 (95% CI: 3.43–3.84) and 3.72 (95% CI: 3.41–4.04) with the EG and ML methods, respectively (Table 2). In general, the value of R0 in each locality estimated by the ML method was higher compared to the EG method. Therefore, we used the values derived from the ML method in further analysis to prepare for a worse situation.

3.3. Minimal Vaccination Coverage for COVID-19

In this study, we used the vaccine efficacy of 100%, which is impossible to achieve. The relation between R0 and Ic can be illustrated by the curve represented in Figure 4. Regarding the results, the higher the R0, the more the vaccination coverage needed to establish the required herd immunity. The minimum percentage of vaccination must be reached from 43.50 to 95.76%, corresponding to the R0 value from 1.77 to 23.60 in these cities/provinces.

4. Discussion

In this study, we provide an estimation of the R0 for COVID-19 in Vietnam, which has a population of 96 million and a 1450 km land border with mainland China, where the COVID-19 pandemic originated [10]. Data were collected from the daily cases of four waves of the COVID-19 pandemic in Vietnam. Using the EG and ML methods, we estimated that the R0 values were 1.15 or 1.19 and 3.31 or 2.92 for data from 21 January to 24 July 2020 in the first wave, and in the second wave with data obtained to 27 January 2021, respectively. Additionally, in the third wave, the R0 values were 1.04 or 2.38 with the data up to 26 April 2021 by the EG and ML methods, respectively. In the fourth wave, from 27 April 2021, the values of R0 of COVID-19 at the city/province level varied widely from 1.73 to 23.60 in some of the hugely affected cities/provinces. The herd immunity ranged from 43.50% to 95.76% through various R0 values from different cities/provinces and was higher in big cities. As a result, the vaccination coverage needed to achieve herd immunity against COVID-19 will be greater in high-density population provinces with higher R0 values. Our study might be a useful message in enhancing the knowledge of COVID-19 as well as for policy recommendation and resource allocation for the COVID-19 vaccine management and distribution at a time when the COVID-19 outbreak is not yet well-controlled.
Herein, the estimated R0 values of COVID-19 are various at different time points and populations. Indeed, the R0 values of the COVID-19 pandemic in Vietnam were ascending in the first three waves and lower than the R0 values in the fourth wave. In general, the R0 values by the ML method were a little higher compared to the EG method, with the exception of the third wave. This could be due to the collected data from this wave not exhibiting an exponential growth curve shape as the other waves (Figure 2), therefore, the R0 estimation by the EG method was not totally exact. In addition, there was a slightly lower R0 in Vietnam compared with previous studies as follows: 3.3, 3.3, 6.3, 6.1, and 5.1 in China, Italy, France, Germany, and Spain, respectively [14,29]. This might be due to the social habits of the population and the applied prevention method in each country. Another reason is supposed that Vietnam has proximity and high travel flows with China, therefore, the government’s rigorous measures that have been put in place were able to limit the spread of the disease in these three waves of the COVID-19 pandemic. Moreover, Vietnam was prepared as soon as the first case appeared in China. The first case that appeared in Ho Chi Minh City was an imported case from Wuhan. Starting 1 April 2020, nationwide strict physical distancing orders were applied for 15 days, requiring all persons to stay at home except for essential and emergency outings, and closing non-essential businesses [30]. Suspected transmission cities or communities were locked down to stop community transmission [23]. No new cases of community transmission were detected in Vietnam for a period of 99 days from 17 April [31]. From 25 July, a further wave of COVID-19 community transmission was detected in the central city of Da Nang including the first deaths, which led to the reintroduction of physical distancing measures throughout high-risk areas [32]. On 30 August 2020, it was the first full day since 25 July 2020 that saw no new infections and it appeared that Vietnam was once again on the threshold of defeating the virus. The third wave of infection began on 28 January 2021, when Vietnam recorded an additional 84 community transmission cases within a single day in Hai Duong and Quang Ninh provinces, regions in northern Vietnam. Most of the cases were related to a migrant worker, who was diagnosed with the UK variant by Japanese authorities after arriving in Osaka [33]. On 15 February 2021, the entire province of Hai Duong was locked down for 15 days. This was one of the most serious outbreaks due to the slow tracing process, mismanagement in quarantine facilities, and people beginning to ignore lockdown rules due to the long period of restrictions. The higher R0 values in the second and third waves could be due to the entry of new COVID-19 strains that increased the infection rates, leading to a high number of cases. On 7 March 2021, the situation in the northern provinces appeared to have been largely brought under control. Along this line, the impact of the preventive measures implemented in Vietnam throughout the first three waves has been reported [24,25]. “Zero-covid” strategies have demonstrated success in containing the three earlier waves of COVID-19 in Vietnam. Collectively, the R0 can be significantly reduced as a result of the implementation of active measures to mitigate the virus spread.
In this study, data from the fourth phase of the COVID-19 outbreak in Vietnam collected from 27 April to 16 November 2021 have been reported from all 63 provinces and cities in Vietnam. The reappearance of a fast-spreading outbreak from the end of April 2021 with the presence of the Delta variant served as a reminder of the continuing threat that the virus posed to health and of the need for vaccination to contain the spread of the disease [20,34]. This wave was the most severe outbreak, and the central economic regions and big cities were more affected, especially in the southern provinces (Ho Chi Minh city, Binh Duong, Dong Nai, An Giang and Tay Ninh), the central city of Da Nang, and the northern capital of Ha Noi. Vietnam followed a COVID-free strategy until September 2021. As the epidemic spread to many provinces in Vietnam, many outbreaks occurred in many localities at the same time, making it nearly impossible to trace and cut the chain of infection. On 29 August 2021, a major change from “zero covid” to “safe adaptation” forced Vietnam to accelerate its vaccination campaign to control the pandemic, instead of mass quarantine. One of the main reasons for this outbreak was the four-day holiday for Reunification Day and International Workers’ Day, which saw many vacation destinations packed with travelers. In addition, gene sequencing results showed that the SARS-CoV-2 Delta variant was the dominant variant in this wave, especially among cases in the central and southern localities of Vietnam [34]. The reason why Ho Chi Minh City and the southern provinces were strongly affected by COVID-19 was partly due to the cultural characteristics of the southern provinces, in which many patients were related to the Renaissance Mission Church group in Ho Chi Minh City. Furthermore, Ho Chi Minh City has the largest population with 9.22 million people. After nearly three months of lockdown in Ho Chi Minh city, which contributes to 20% of the total GDP of the country, many enterprises were pushed to cut down their production when almost all economic activities froze. Concerns about the outbreak caused tens of thousands of people to flee their workplaces and even went back to their hometowns, worsening the situation, and quickly spreading to the southern provinces. Aside from Ho Chi Minh, Ha Noi, Binh Duong, and Dong Nai, An Giang is also one of the 10 most populous provinces and cities in Vietnam. In addition, An Giang and Tay Ninh share a border with Cambodia (Figure 1). During the same period, Cambodia had also been struggling to hold back the disease since late February, with a strict lockdown in the capital Phnom Penh. Vietnam stepped up patrols along both nations’ borders to prevent COVID-19 from being carried into the country by people crossing the porous frontier illegally. In comparison, the capital Ha Noi, with nearly 10 million people, the center of the country, was always highly alert and ready for any epidemic situation, a flexible adaptation that helped Ha Noi effectively control the COVID-19 epidemic. Therefore, it is necessary to estimate the R0 of COVID-19 in different populations to design suitable interventions and responses to protect the population and control the spread of disease.
In addition to assessing the ability of an infectious disease to invade the community, R0 values were also used to determine the fraction of the community that should be vaccinated to prevent the growth of the epidemic. In this study, we focused on comparing the basic reproduction number of COVID-19 waves in Vietnam, and the vaccination coverage to achieve herd immunity was also estimated. In further detail, we found that the ML technique provided a higher estimation of R0 values. In addition to the EG and ML methods, other methods such as the sequential Bayesian method, the SIR model can also be used for the estimation of the R0 of COVID-19 [12,13,14,15,16]. In these studies, the R0 value from the EG method was lower than from other methods and the R0 value from the ML method was highest in all methods. Additionally, the ML method has been used the most in the estimation of the R0 of COVID-19 [12,13,15]. As the result, we thus used the values derived from this method to calculate the herd immunity threshold to prepare interventions for a worse scenario. The ML method has previously been used in the estimation of R0 for COVID-19 and other infectious diseases such as the Zika virus [35] and influenza [36]. We are thus convinced that the method would also provide a good estimation in the current study. The R0 of COVID-19 ranged widely through various provinces from 1.77 to 23.60. This high R0 value for the new coronavirus is very alarming for the rapid spread of the disease and gives an idea about the rapid vaccination to prevent the spread of the disease. As a result, the herd immunity threshold would range from 43.50% to 95.76%. However, vaccination coverage also depends on the effectiveness of the vaccine. Four main vaccines currently approved for use are AstraZeneca, SPUTNIK V, Pfizer/BioNTech’s Comirnaty, and Moderna, which has an efficacy of more than 90% [37,38,39,40]. In response to urgent needs in the prevention and control of the COVID-19 epidemic, the Ministry of Health has agreed to import the first 204,000 doses of the COVID-19 vaccine, and the COVID-19 vaccination in Vietnam started on 8 March 2021. As of 19 October 2021, over 65.7 million doses have been administered with the rate of injection of at least one dose for people aged 18 years and above at 63.5%. Taken together, the result of this study provides the foundation for the strategy for vaccine coverage in Vietnam to contain the disease during a time of uncertainty.
However, in this study, there was a limitation due to the limited information (only data from confirmed cases). It was not possible to determine the real number of cases due to two primary reasons: insufficient test kits did not allow each potential patient with COVID-19-like symptoms to be tested, and there has been a good portion of asymptomatic COVID-19 carriers who would never be tested and counted as confirmed cases. The highest R0 value in HCM City could not be reflected exactly in real dynamics due to being affected by the late discovery of new clusters of infections.

5. Conclusions

This was the first study that estimated the R0 values of COVID-19 through four waves of pandemic in Vietnam. The R0 values were estimated by the EG and the ML methods to range from 1.04 to 3.31 from the first to the third wave. The fourth wave was the most severe, especially in the southern provinces, and the highest R0 was in Ho Chi Minh City. The presence of new viral mutants increased the infectiousness. The herd immunity level ranged from 43.50% to 95.76% through various R0 values from different provinces/cities. The vaccination coverage was higher to establish the required herd immunity in the high-density population. Our results provide the basis for policy recommendations and resource allocation for vaccine management and distribution at a time when the COVID-19 pandemic is not yet over. Although our estimation was based on confirmed cases, these results are useful in the strategy for resource allocation for vaccine distribution in Vietnam to obtain herd immunity for resistance to the spread of COVID-19.

Author Contributions

N.T.M., G.T.H.T. and L.T.M.H. collected the data, performed the statistical analysis, and drafted the manuscript. P.T.B.C., A.H.D., H.T.L.P., T.T.N., T.T.T.V. and H.V.D. participated in the design of the study and reviewed the manuscript. All authors have read and agreed to the published version of the manuscript.

Funding

This research received no external funding.

Institutional Review Board Statement

We used the publicly available data from the Ministry of Health, Vietnam (https://ncov.vncdc.gov.vn/viet-nam.html, accessed on 1 May 2021).

Informed Consent Statement

Not applicable.

Data Availability Statement

The data presented in this study are available on request from the corresponding author.

Acknowledgments

We would like to thank the anonymous reviewers for their thoughtful comments and efforts toward improving our manuscript.

Conflicts of Interest

The authors declare no conflict of interest.

References

  1. Abd Elaziz, M.; Dahou, A.; Alsaleh, N.A.; Elsheikh, A.H.; Saba, A.I.; Ahmadein, M. Boosting COVID-19 Image Classification Using MobileNetV3 and Aquila Optimizer Algorithm. Entropy 2021, 23, 1383. [Google Scholar] [CrossRef] [PubMed]
  2. Elsheikh, A.H.; Saba, A.I.; Panchal, H.; Shanmugan, S.; Alsaleh, N.A.; Ahmadein, M. Artificial Intelligence for Forecasting the Prevalence of COVID-19 Pandemic: An Overview. Healthcare 2021, 9, 1614. [Google Scholar] [CrossRef] [PubMed]
  3. Achaiah, N.C.; Subbarajasetty, S.B.; Shetty, R.M. R0 and Re of COVID-19: Can We Predict When the Pandemic Outbreak will be Contained? Indian J. Crit. Care Med. 2020, 24, 1125–1127. [Google Scholar] [CrossRef] [PubMed]
  4. Delamater, P.L.; Street, E.J.; Leslie, T.F.; Yang, Y.T.; Jacobsen, K.H. Complexity of the Basic Reproduction Number (R0). Emerg. Infect. Dis. 2019, 25, 1–4. [Google Scholar] [CrossRef] [PubMed] [Green Version]
  5. Guerra, F.M.; Bolotin, S.; Lim, G.; Heffernan, J.; Deeks, S.L.; Li, Y.; Crowcroft, N.S. The basic reproduction number (R0) of measles: A systematic review. Lancet Infect. Dis. 2017, 17, e420–e428. [Google Scholar] [CrossRef]
  6. Dietz, K. The estimation of the basic reproduction number for infectious diseases. Stat. Methods Med. Res. 1993, 2, 23–41. [Google Scholar] [CrossRef]
  7. Maiese, A.; Baronti, A.; Manetti, A.C.; Di Paolo, M.; Turillazzi, E.; Frati, P.; Fineschi, V. Death after the Administration of COVID-19 Vaccines Approved by EMA: Has a Causal Relationship Been Demonstrated? Vaccines 2022, 10, 308. [Google Scholar] [CrossRef]
  8. Elsheikh, A.H.; Saba, A.I.; Elaziz, M.A.; Lu, S.; Shanmugan, S.; Muthuramalingam, T.; Kumar, R.; Mosleh, A.O.; Essa, F.A.; Shehabeldeen, T.A. Deep learning-based forecasting model for COVID-19 outbreak in Saudi Arabia. Process Saf. Environ. Prot. 2021, 149, 223–233. [Google Scholar] [CrossRef]
  9. Saba, A.I.; Elsheikh, A.H. Forecasting the prevalence of COVID-19 outbreak in Egypt using nonlinear autoregressive artificial neural networks. Process Saf. Environ. Prot. 2020, 141, 1–8. [Google Scholar] [CrossRef]
  10. Zhu, N.; Zhang, D.; Wang, W.; Li, X.; Yang, B.; Song, J.; Zhao, X.; Huang, B.; Shi, W.; Lu, R.; et al. A Novel Coronavirus from Patients with Pneumonia in China, 2019. N. Engl. J. Med. 2020, 382, 727–733. [Google Scholar] [CrossRef]
  11. Zhang, C.; Huang, S.; Zheng, F.; Dai, Y. Controversial treatments: An updated understanding of the coronavirus disease 2019. J. Med. Virol. 2020, 92, 1441–1448. [Google Scholar] [CrossRef] [PubMed] [Green Version]
  12. Dharmaratne, S.; Sudaraka, S.; Abeyagunawardena, I.; Manchanayake, K.; Kothalawala, M.; Gunathunga, W. Estimation of the basic reproduction number (R0) for the novel coronavirus disease in Sri Lanka. Virol. J. 2020, 17, 144. [Google Scholar] [CrossRef] [PubMed]
  13. Zhang, S.; Diao, M.; Yu, W.; Pei, L.; Lin, Z.; Chen, D. Estimation of the reproductive number of novel coronavirus (COVID-19) and the probable outbreak size on the Diamond Princess cruise ship: A data-driven analysis. Int. J. Infect. Dis. 2020, 93, 201–204. [Google Scholar] [CrossRef] [PubMed]
  14. Yuan, J.; Li, M.; Lv, G.; Lu, Z.K. Monitoring transmissibility and mortality of COVID-19 in Europe. Int. J. Infect. Dis. 2020, 95, 311–315. [Google Scholar] [CrossRef]
  15. Xu, C.; Dong, Y.; Yu, X.; Wang, H.; Tsamlag, L.; Zhang, S.; Chang, R.; Wang, Z.; Yu, Y.; Long, R.; et al. Estimation of reproduction numbers of COVID-19 in typical countries and epidemic trends under different prevention and control scenarios. Front. Med. 2020, 14, 613–622. [Google Scholar] [CrossRef]
  16. Locatelli, I.; Trächsel, B.; Rousson, V. Estimating the basic reproduction number for COVID-19 in Western Europe. PLoS ONE 2021, 16, e0248731. [Google Scholar] [CrossRef]
  17. Viceconte, G.; Petrosillo, N. COVID-19 R0: Magic number or conundrum? Infect. Dis. Rep. 2020, 12, 8516. [Google Scholar] [CrossRef] [Green Version]
  18. Liu, Y.; Gayle, A.A.; Wilder-Smith, A.; Rocklöv, J. The reproductive number of COVID-19 is higher compared to SARS coronavirus. J. Travel Med. 2020, 27, taaa021. [Google Scholar] [CrossRef] [Green Version]
  19. Ke, R.; Romero-Severson, E.; Sanche, S.; Hengartner, N. Estimating the reproductive number R0 of SARS-CoV-2 in the United States and eight European countries and implications for vaccination. J. Theor. Biol. 2021, 517, 110621. [Google Scholar] [CrossRef]
  20. Nguyen, T.P.; Wong, Z.S.; Wang, L.; Thanh, T.T.; Van Nguyen, H.; Gilmour, S. Rapid impact assessments of COVID-19 control measures against the Delta variant and short-term projections of new confirmed cases in Vietnam. J. Glob. Health 2021, 11, 03118. [Google Scholar] [CrossRef]
  21. Van Nguyen, Q.; Cao, D.A.; Nghiem, S.H. Spread of COVID-19 and policy responses in Vietnam: An overview. Int. J. Infect. Dis. 2021, 103, 157–161. [Google Scholar] [CrossRef] [PubMed]
  22. Thanh, H.N.; Van, T.N.; Thu, H.N.T.; Van, B.N.; Thanh, B.D.; Thu, H.P.T.; Kieu, A.N.T.; Viet, N.N.; Marks, G.B.; Fox, G.J.; et al. Outbreak investigation for COVID-19 in northern Vietnam. Lancet Infect. Dis. 2020, 20, 535–536. [Google Scholar] [CrossRef] [PubMed] [Green Version]
  23. Van Tan, L. COVID-19 control in Vietnam. Nat. Immunol. 2021, 22, 261. [Google Scholar] [CrossRef] [PubMed]
  24. Ha, B.T.T.; Ngoc Quang, L.; Mirzoev, T.; Tai, N.T.; Thai, P.Q.; Dinh, P.C. Combating the COVID-19 Epidemic: Experiences from Vietnam. Int. J. Environ. Res. Public Health 2020, 17, 3125. [Google Scholar] [CrossRef]
  25. Nguyen Thi Yen, C.; Hermoso, C.; Laguilles, E.M.; De Castro, L.E.; Camposano, S.M.; Jalmasco, N.; Cua, K.A.; Isa, M.A.; Akpan, E.F.; Ly, T.P.; et al. Vietnam’s success story against COVID-19. Public Health Pract. 2021, 2, 100132. [Google Scholar] [CrossRef]
  26. Quach, H.L.; Nguyen, K.C.; Hoang, N.A.; Pham, T.Q.; Tran, D.N.; Le, M.T.Q.; Do, H.T.; Vien, C.C.; Phan, L.T.; Ngu, N.D.; et al. Association of public health interventions and COVID-19 incidence in Vietnam, January to December 2020. Int. J. Infect. Dis. 2021, 110 (Suppl. 1), S28–S43. [Google Scholar] [CrossRef] [PubMed]
  27. Elsaid, M.; Nasef, M.A.; Huy, N.T. R0 of COVID-19 and its impact on vaccination coverage: Compared with previous outbreaks. Hum. Vaccin Immunother. 2021, 17, 3850–3854. [Google Scholar] [CrossRef]
  28. Fine, P.; Eames, K.; Heymann, D.L. “Herd Immunity”: A Rough Guide. Clin. Infect. Dis. 2011, 52, 911–916. [Google Scholar] [CrossRef]
  29. Alimohamadi, Y.; Taghdir, M.; Sepandi, M. Estimate of the Basic Reproduction Number for COVID-19: A Systematic Review and Meta-analysis. J. Prev. Med. Public Health = Yebang Uihakhoe Chi 2020, 53, 151–157. [Google Scholar] [CrossRef] [Green Version]
  30. Prime Minister. Directive 16 on Strict Social Distancing Measures to Prevent and Control. In COVID-19 in 16/CT-TTg; Prime Minister: London, UK, 2020. [Google Scholar]
  31. Le, T.T.; Vodden, K.; Wu, J.; Atiwesh, G. Policy Responses to the COVID-19 Pandemic in Vietnam. Int. J. Environ. Res. Public Health 2021, 18, 559. [Google Scholar] [CrossRef]
  32. Nong, V.M.; Le Thi Nguyen, Q.; Doan, T.T.; Van Do, T.; Nguyen, T.Q.; Dao, C.X.; Thi Nguyen, T.H.; Do, C.D. The second wave of COVID-19 in a tourist hotspot in Vietnam. J. Travel Med. 2021, 28, taaa174. [Google Scholar] [CrossRef]
  33. Van Pham, D.; Hoang, H.; Nguyen, A.V.; Nguyen, N.T.; Van Hoang, N.; Hoang, N.T. The first newborn patient with SARS-CoV-2 variant B.1.1.7 identified in Viet Nam: Treatment and care practices. West. Pac. Surveill. Response J. WPSAR 2021, 12, 77–81. [Google Scholar] [CrossRef]
  34. Chau, N.V.V.; Ngoc, N.M.; Nguyet, L.A.; Quang, V.M.; Ny, N.T.H.; Khoa, D.B.; Phong, N.T.; Toan, L.M.; Hong, N.T.T.; Tuyen, N.T.K.; et al. An observational study of breakthrough SARS-CoV-2 Delta variant infections among vaccinated healthcare workers in Vietnam. EClinicalMedicine 2021, 41, 101143. [Google Scholar] [CrossRef]
  35. Nishiura, H.; Kinoshita, R.; Mizumoto, K.; Yasuda, Y.; Nah, K. Transmission potential of Zika virus infection in the South Pacific. Int. J. Infect. Dis. 2016, 45, 95–97. [Google Scholar] [CrossRef] [Green Version]
  36. Nikbakht, R.; Baneshi, M.R.; Bahrampour, A. Estimation of the Basic Reproduction Number and Vaccination Coverage of Influenza in the United States (2017-18). J. Res. Health Sci. 2018, 18, e00427. [Google Scholar]
  37. Fiolet, T.; Kherabi, Y.; MacDonald, C.J.; Ghosn, J.; Peiffer-Smadja, N. Comparing COVID-19 vaccines for their characteristics, efficacy and effectiveness against SARS-CoV-2 and variants of concern: A narrative review. Clin. Microbiol. Infect. 2022, 28, 202–221. [Google Scholar] [CrossRef]
  38. Vergnes, J.N. Safety and Efficacy of the BNT162b2 mRNA COVID-19 Vaccine. N. Engl. J. Med. 2021, 384, 1577. [Google Scholar] [CrossRef]
  39. Knoll, M.D.; Wonodi, C. Oxford-AstraZeneca COVID-19 vaccine efficacy. Lancet 2021, 397, 72–74. [Google Scholar] [CrossRef]
  40. Francis, A.I.; Ghany, S.; Gilkes, T.; Umakanthan, S. Review of COVID-19 vaccine subtypes, efficacy and geographical distributions. Postgrad. Med. J. 2022, 98, 389–394. [Google Scholar] [CrossRef]
Figure 1. Map of Vietnam with neighboring countries and some of the main affected provinces by COVID-19 in the fourth wave are highlighted in yellow and the province code in red (Ha Noi—01, Ho Chi Minh—79, Binh Duong—74, Dong Nai—75, An Giang—89, Tay Ninh—72, Da Nang—48).
Ijtm 03 00001 g001
Figure 2. The total number of daily reported cases in four waves of the COVID-19 outbreak in Vietnam from 21 January 2020 to 16 November 2021.
Ijtm 03 00001 g002
Figure 3. The total number of daily reported cases from 27 April to 16 November 2021 in some significantly affected provinces by COVID-19 in the fourth wave.
Ijtm 03 00001 g003
Figure 4. Herd immunity threshold (Ic-%) of COVID-19 depending on different values of the basic reproductive number (R0).
Ijtm 03 00001 g004
Table 1. R0 estimation of COVID-19 in the first three outbreak waves in Vietnam.
Outbreak WaveTimeR0 Estimated MethodsR0 Values95% CI
121 January 2020–24 July 2020EG1.150.99–1.31
ML1.190.85–1.61
225 July 2020–27 January 2021EG3.312.72–4.00
ML2.922.35–3.58
328 January 2021–26 April 2021EG1.040.28–1.42
ML2.382.04–2.75
EG, exponential growth; ML, maximum likelihood; CI, confidence interval.
Table 2. R0 values of COVID-19 at the province level in the fourth wave of the pandemic in Vietnam.
AreaProvinceProvince CodeR0 Values
EG Method95% CIML Method95% CI
SouthHo Chi Minh7922.0521.86–22.2423.6023.33–23.86
Binh Duong747.787.72–7.848.558.46–8.65
Dong Nai753.943.89–3.984.464.39–4.53
An Giang892.402.38–2.432.542.48–2.60
Tay Ninh721.781.75–1.802.212.16–2.26
CentralDa Nang481.731.70–1.761.771.69–1.85
NorthHa Noi013.633.43–3.843.723.41–4.04
EG, exponential growth; ML, maximum likelihood; CI, confidence interval.
Disclaimer/Publisher’s Note: The statements, opinions and data contained in all publications are solely those of the individual author(s) and contributor(s) and not of MDPI and/or the editor(s). MDPI and/or the editor(s) disclaim responsibility for any injury to people or property resulting from any ideas, methods, instructions or products referred to in the content.

