

Characterization of Large Microplastic Debris in Beach Sediments in the Po Delta Area


Abstract
:1. Introduction
2. Materials and Methods
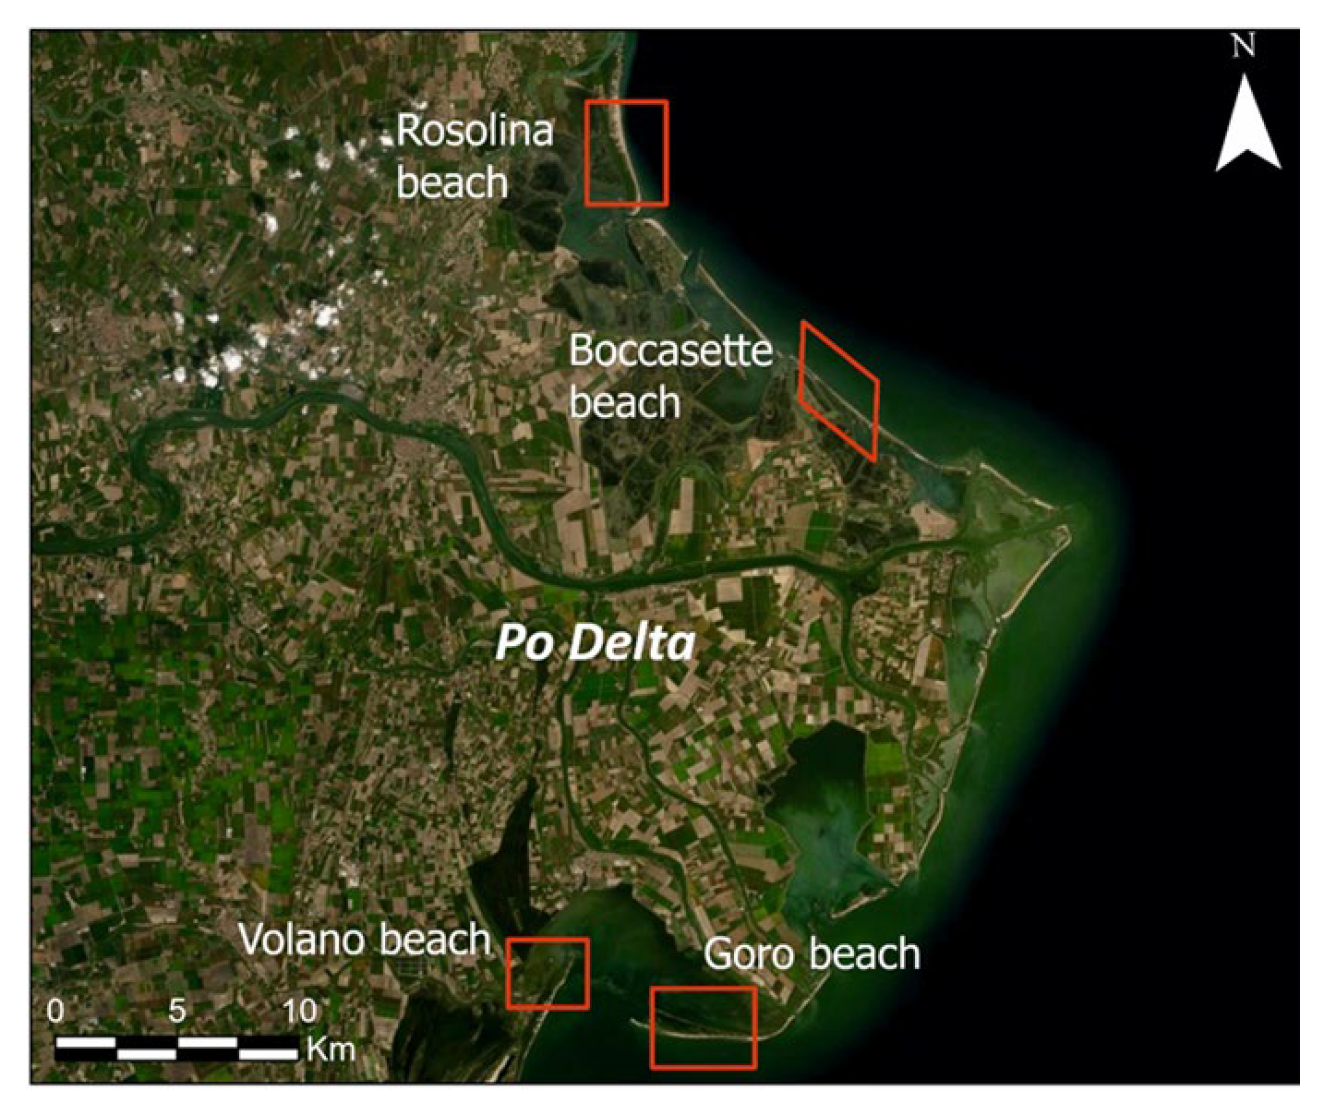
2.1. Study Area and Sampling Sites
2.2. Sampling and Separation of Plastic Particles
2.3. Visual Identification, Classification and Composition of the Particles
3. Results
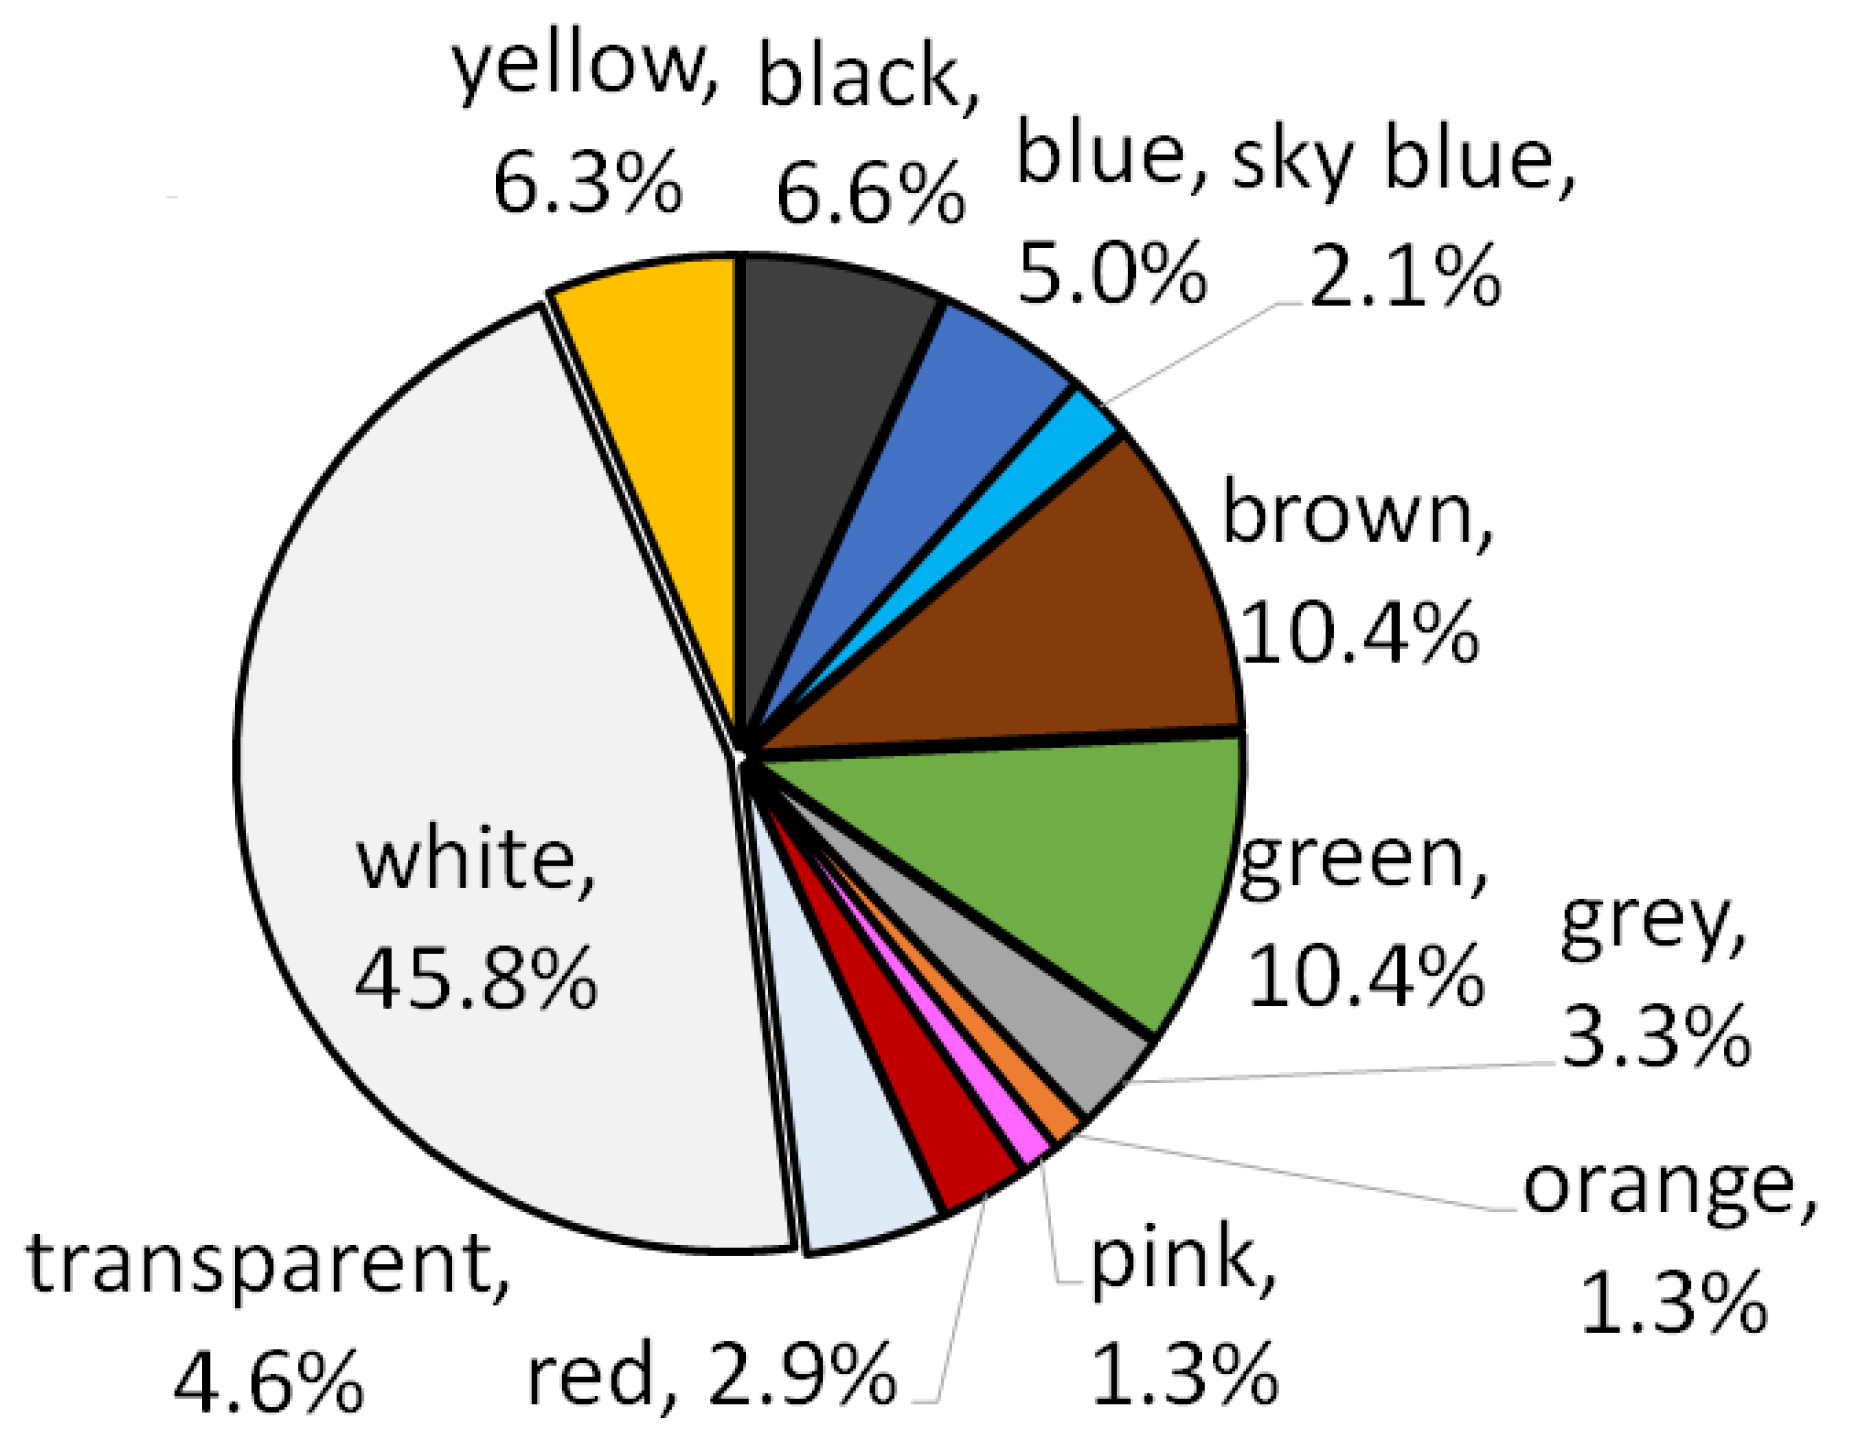
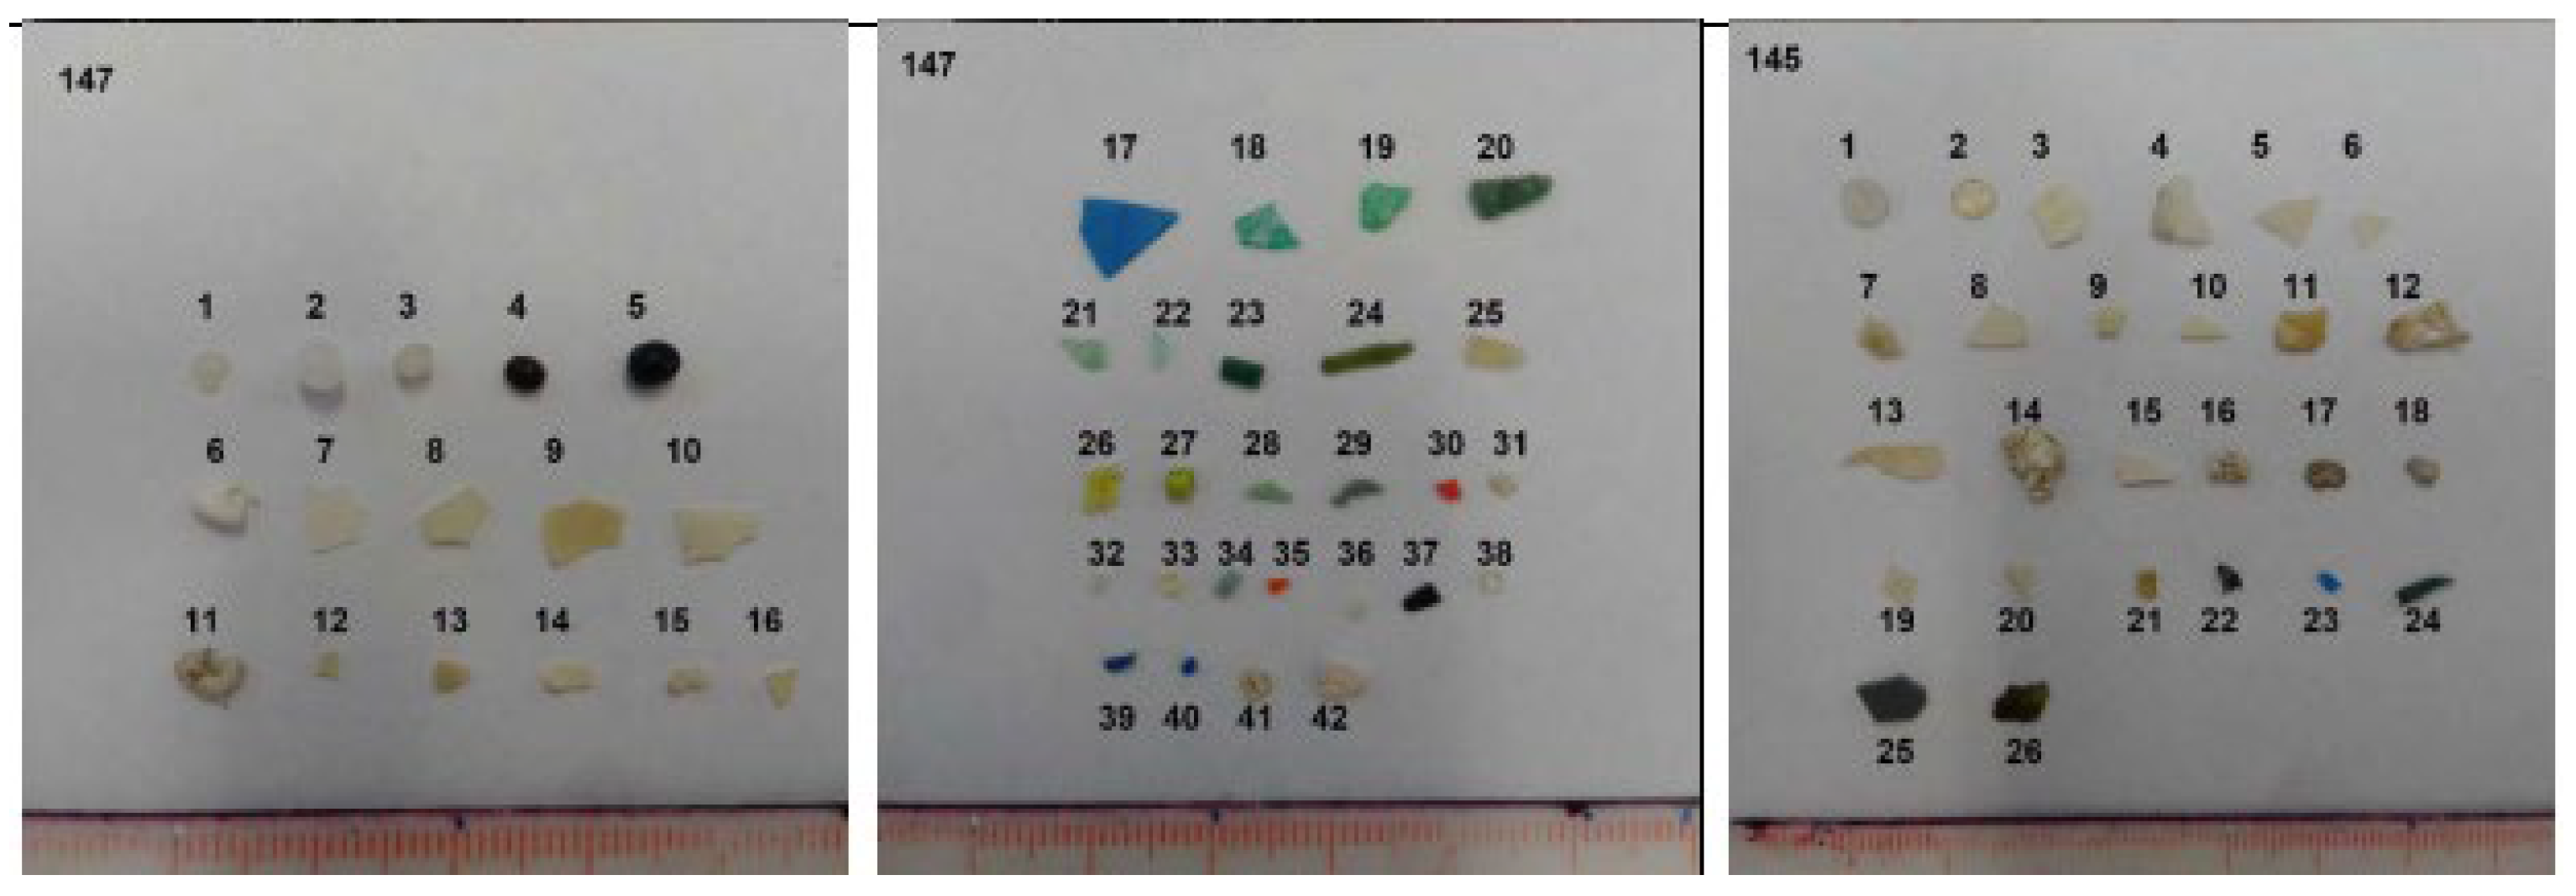
3.1. Visual Sorting
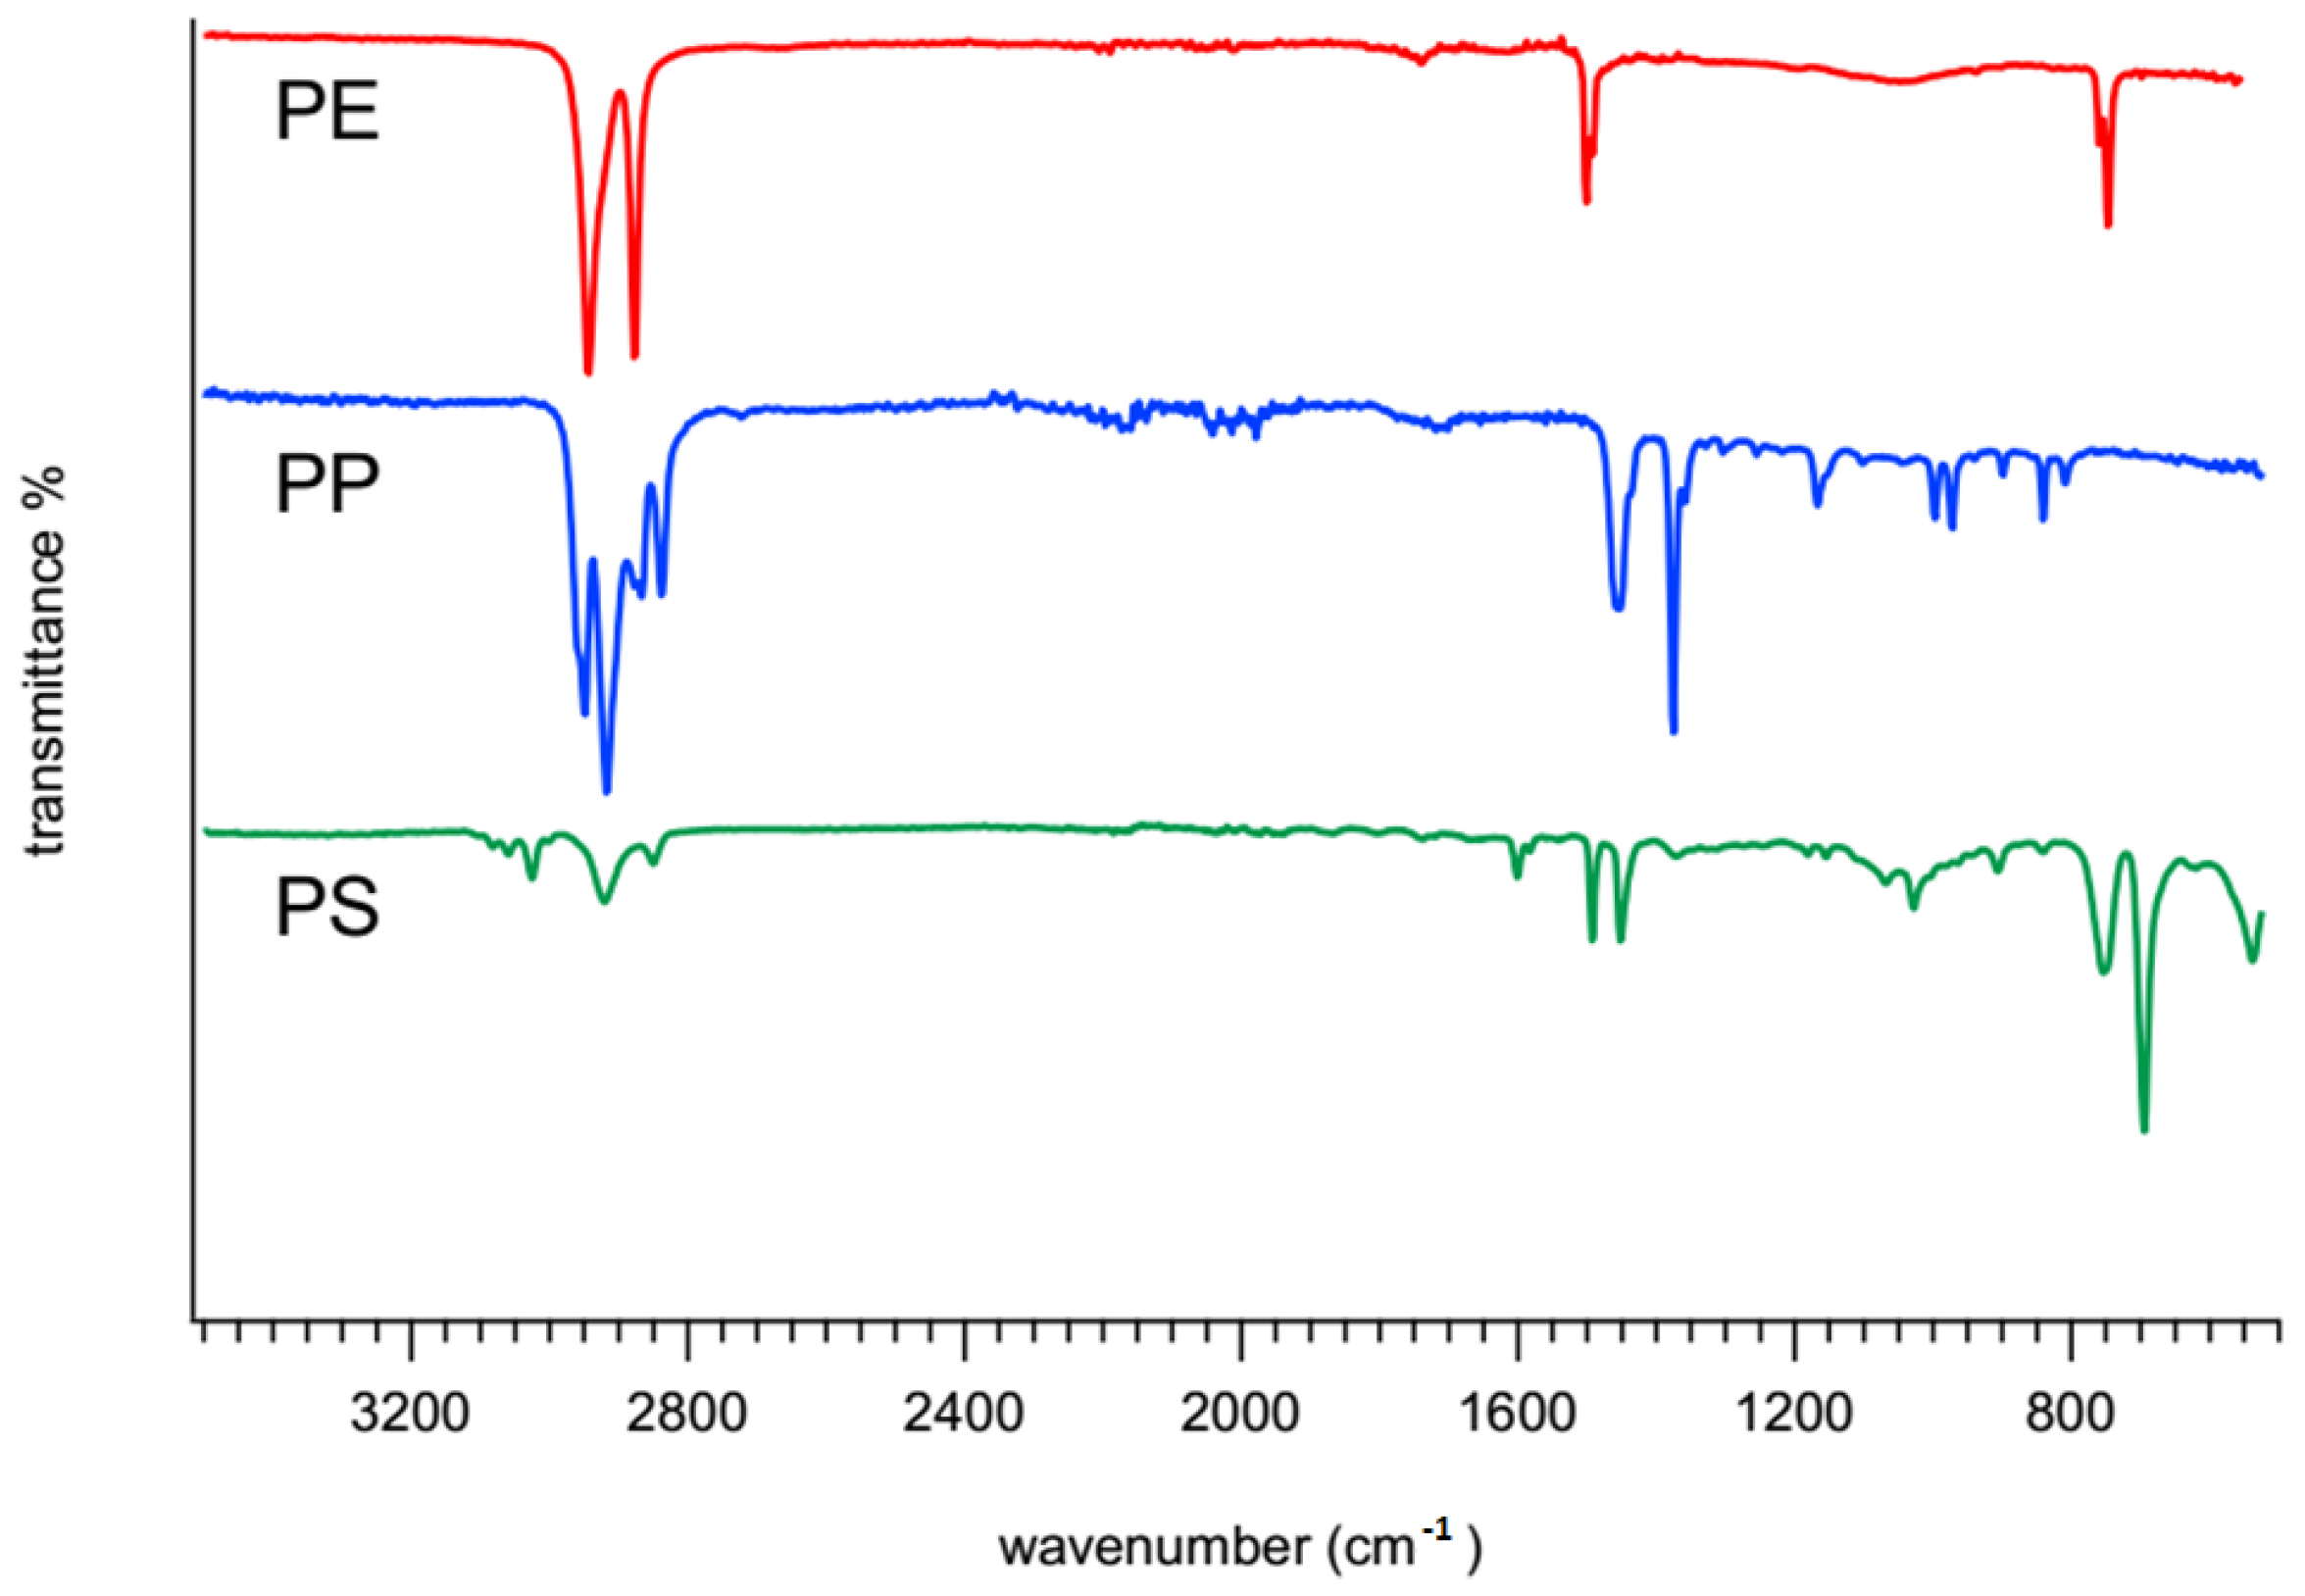
3.2. ATR-FTIR Analysis
4. Discussion
4.1. Identification and Possible Sources of Plastic Debris
4.2. Comparison with other Studies in Mediterranean Sea, Adriatic Coasts and Tributary Rivers
5. Conclusions
Author Contributions
Funding
Institutional Review Board Statement
Informed Consent Statement
Data Availability Statement
Acknowledgments
Conflicts of Interest
References
- Hamad, K.; Kaseem, M.; Deri, F. Recycling of Waste from Polymer Materials: An Overview of the Recent Works. Polym. Degrad. Stab. 2013, 98, 2801–2812. [Google Scholar] [CrossRef]
- Singh, N.; Hui, D.; Singh, R.; Ahuja, I.P.S.; Feo, L.; Fraternali, F. Recycling of Plastic Solid Waste: A State of Art Review and Future Applications. Compos. Part B Eng. 2017, 115, 409–422. [Google Scholar] [CrossRef]
- UN Environ Program. Beat Plastic Pollution. Available online: https://www.unep.org/interactives/beat-plastic-pollution/ (accessed on 18 October 2022).
- Gago, J.; Galgani, F.; Maes, T.; Thompson, R.C. Microplastics in Seawater: Recommendations from the Marine Strategy Framework Directive Implementation Process. Front. Mar. Sci. 2016, 3, 219. [Google Scholar] [CrossRef] [Green Version]
- Suaria, G.; Avio, C.G.; Mineo, A.; Lattin, G.L.; Magaldi, M.G.; Belmonte, G.; Moore, C.J.; Regoli, F.; Aliani, S. The Mediterranean Plastic Soup: Synthetic Polymers in Mediterranean Surface Waters. Sci. Rep. 2016, 6, 37551. [Google Scholar] [CrossRef] [Green Version]
- Liubartseva, S.; Coppini, G.; Lecci, R.; Clementi, E. Tracking Plastics in the Mediterranean: 2D Lagrangian Model. Mar. Pollut. Bull. 2018, 129, 151–162. [Google Scholar] [CrossRef]
- Cori, B. Spatial Dynamics of Mediterranean Coastal Regions. J. Coast. Conserv. 1999, 5, 105–112. [Google Scholar] [CrossRef]
- Cózar, A.; Sanz-Martín, M.; Martí, E.; González-Gordillo, J.I.; Ubeda, B.; Gálvez, J.Á.; Irigoien, X.; Duarte, C.M. Plastic Accumulation in the Mediterranean Sea. PLoS ONE 2015, 10, e0121762. [Google Scholar] [CrossRef] [Green Version]
- Ludwig, W.; Dumont, E.; Meybeck, M.; Heussner, S. River Discharges of Water and Nutrients to the Mediterranean and Black Sea: Major Drivers for Ecosystem Changes during Past and Future Decades? Prog. Oceanogr. 2009, 80, 199–217. [Google Scholar] [CrossRef]
- Gajšt, T.; Bizjak, T.; Palatinus, A.; Liubartseva, S.; Kržan, A. Sea Surface Microplastics in Slovenian Part of the Northern Adriatic. Mar. Pollut. Bull. 2016, 113, 392–399. [Google Scholar] [CrossRef]
- Schmid, C.; Cozzarini, L.; Zambello, E. A Critical Review on Marine Litter in the Adriatic Sea: Focus on Plastic Pollution. Environ. Pollut. 2021, 273, 116430. [Google Scholar] [CrossRef]
- Fortibuoni, T.; Amadesi, B.; Vlachogianni, T. Composition and Abundance of Macrolitter along the Italian Coastline: The First Baseline Assessment within the European Marine Strategy Framework Directive. Environ. Pollut. 2021, 268, 115886. [Google Scholar] [CrossRef]
- Liubartseva, S.; Coppini, G.; Lecci, R.; Creti, S. Regional Approach to Modeling the Transport of Floating Plastic Debris in the Adriatic Sea. Mar. Pollut. Bull. 2016, 103, 115–127. [Google Scholar] [CrossRef]
- Schmid, C.; Cozzarini, L.; Zambello, E. Microplastic’s Story. Mar. Pollut. Bull. 2021, 162, 111820. [Google Scholar] [CrossRef]
- Kaiser, K.; Schmid, M.; Schlummer, M. Recycling of Polymer-Based Multilayer Packaging: A Review. Recycling 2017, 3, 1. [Google Scholar] [CrossRef] [Green Version]
- PlasticsEurope Plastics–the Facts 2020. 2021. Available online: https://plasticseurope.org/wp-content/uploads/2021/12/Plastics-the-Facts-2021-web-final.pdf (accessed on 18 October 2022).
- Mio, A.; Bertagna, S.; Cozzarini, L.; Laurini, E.; Bucci, V.; Marinò, A.; Fermeglia, M. Multiscale Modelling Techniques in Life Cycle Assessment: Application to Nanostructured Polymer Systems in the Maritime Industry. Sustain. Mater. Technol. 2021, 29, e00327. [Google Scholar] [CrossRef]
- Laglbauer, B.J.L.; Franco-Santos, R.M.; Andreu-Cazenave, M.; Brunelli, L.; Papadatou, M.; Palatinus, A.; Grego, M.; Deprez, T. Macrodebris and Microplastics from Beaches in Slovenia. Mar. Pollut. Bull. 2014, 89, 356–366. [Google Scholar] [CrossRef] [Green Version]
- Vlachogianni, T.; Fortibuoni, T.; Ronchi, F.; Zeri, C.; Mazziotti, C.; Tutman, P.; Varezić, D.B.; Palatinus, A.; Trdan, Š.; Peterlin, M.; et al. Marine Litter on the Beaches of the Adriatic and Ionian Seas: An Assessment of Their Abundance, Composition and Sources. Mar. Pollut. Bull. 2018, 131, 745–756. [Google Scholar] [CrossRef]
- Munari, C.; Corbau, C.; Simeoni, U.; Mistri, M. Marine Litter on Mediterranean Shores: Analysis of Composition, Spatial Distribution and Sources in North-Western Adriatic Beaches. Waste Manag. 2016, 49, 483–490. [Google Scholar] [CrossRef]
- Net4mPlastic Project Deliverables. 2022. Available online: https://www.italy-croatia.eu/web/netformplastic/docs-and-tools (accessed on 18 October 2022).
- NET4MPLASTIC Online Platform. Available online: https://www.net4mplastic.net/login.php (accessed on 1 December 2022).
- Atwood, E.C.; Falcieri, F.M.; Piehl, S.; Bochow, M.; Matthies, M.; Franke, J.; Carniel, S.; Sclavo, M.; Laforsch, C.; Siegert, F. Coastal Accumulation of Microplastic Particles Emitted from the Po River, Northern Italy: Comparing Remote Sensing and Hydrodynamic Modelling with in Situ Sample Collections. Mar. Pollut. Bull. 2019, 138, 561–574. [Google Scholar] [CrossRef]
- Tagliapietra, D.; Sigovini, M.; Ghirardini, A.V.; Tagliapietra, D.; Sigovini, M.; Ghirardini, A.V. A Review of Terms and Definitions to Categorise Estuaries, Lagoons and Associated Environments. Mar. Freshw. Res. 2009, 60, 497–509. [Google Scholar] [CrossRef]
- Pethick, J. An Introduction to Coastal Geomorphology, 1st ed.; Hodder Education Publishers: London, UK, 1984; ISBN 0-7131-6391-7. [Google Scholar]
- Barnes, R. European Coastal Lagoons, Macrotidal versus Microtidal Contrasts. Biol. Mar. Mediterr. 1995, 2, 79–87. [Google Scholar]
- Kjerfve, B. Coastal Lagoon Processes, 1st ed.; Elsevier: Amsterdam, The Netherlands, 1994; ISBN 978-0-08-087098-4. [Google Scholar]
- Simeoni, U.; Fontolan, G.; Tessari, U.; Corbau, C. Domains of Spit Evolution in the Goro Area, Po Delta, Italy. Geomorphology 2007, 86, 332–348. [Google Scholar] [CrossRef]
- Bondesan, M.; Simeoni, U. Dinamica e analisi morfologica statistica dei litorali del delta del Po e alle foci dell’Adige e del Brenta. Mem. Sci. Geol. 1983, 36, 1–48. [Google Scholar]
- Ruol, P.; Martinelli, L.; Favaretto, C. Vulnerability Analysis of the Venetian Littoral and Adopted Mitigation Strategy. Water 2018, 10, 984. [Google Scholar] [CrossRef] [Green Version]
- Palatinus, A.; Kovač Viršek, M.; Kaberi, H. DeFishGear Protocols for Sea Surface and Beach Sediment Sampling and Sample Analysis. 2015. Available online: https://mio-ecsde.org/wp-content/uploads/2014/12/Protocols-sea-surfacebeach-sediments-Feb15.pdf (accessed on 18 October 2022).
- Gago, J.; Filgueiras, A.; Pedrotti, M.L.; Caetano, M.; Frias, J. Standardised Protocol for Monitoring Microplastics in Seawater. 2019. Available online: https://repository.oceanbestpractices.org/handle/11329/1077 (accessed on 18 October 2022).
- Kershaw, P.J.; Turra, A.; Galgani, F. Guidelines for the Monitoring and Assessment of Plastic Litter in the Ocean; GESAMP Joint Group of Experts on the Scientific Aspects of Marine Environmental Protection: London, UK, 2019. [Google Scholar]
- Masura, J.; Baker, J.; Foster, G.; Arthur, C. Laboratory Methods for the Analysis of Microplastics in the Marine Environment–Technical Memorandum NOS-OR&R-48. 2015. Available online: https://www.google.com/url?sa=t&rct=j&q=&esrc=s&source=web&cd=&ved=2ahUKEwi2jIacr739AhWei_0HHX7bAOQQFnoECBUQAQ&url=https%3A%2F%2Frepository.library.noaa.gov%2Fview%2Fnoaa%2F10296%2Fnoaa_10296_DS1.pdf&usg=AOvVaw2CVK4_oSX-UkqigISOKRGv (accessed on 18 October 2022).
- Fleet, D.; Vlachogianni, T.; Hanke, G. A Joint List of Litter Categories for Marine Macrolitter Monitoring 2021. EUR 2021, 30348, 52. [Google Scholar]
- Andrady, A.L. The Plastic in Microplastics: A Review. Mar. Pollut. Bull. 2017, 119, 12–22. [Google Scholar] [CrossRef]
- Kershaw, P.J. Marine Plastic Debris and Microplastics–Global Lessons and Research to Inspire Action and Guide Policy Change. 2016. Available online: https://wedocs.unep.org/handle/20.500.11822/7720 (accessed on 18 October 2022).
- Jung, M.R.; Horgen, F.D.; Orski, S.V.; Rodriguez, C.V.; Beers, K.L.; Balazs, G.H.; Jones, T.T.; Work, T.M.; Brignac, K.C.; Royer, S.-J.; et al. Validation of ATR FT-IR to Identify Polymers of Plastic Marine Debris, Including Those Ingested by Marine Organisms. Mar. Pollut. Bull. 2018, 127, 704–716. [Google Scholar] [CrossRef]
- Socrates, G. Infrared and Raman Characteristic Group Frequencies: Tables and Charts, 3rd ed.; Wiley: Hoboken, NJ, USA, 2004; ISBN 978-0-470-09307-8. [Google Scholar]
- Kumar, A.; Naumenko, D.; Cozzarini, L.; Barba, L.; Cassetta, A.; Pedio, M. Influence of Substrate on Molecular Order for Self-Assembled Adlayers of CoPc and FePc. J. Raman Spectrosc. 2018, 49, 1015–1022. [Google Scholar] [CrossRef]
- Larkin, P. Infrared and Raman Spectroscopy–1st Edition, 1st ed.; Elsevier: Amsterdam, The Netherlands, 2011; ISBN 978-0-12-386984-5. [Google Scholar]
- Oluniyi Solomon, O.; Palanisami, T. Microplastics in the Marine Environment: Current Status, Assessment Methodologies, Impacts and Solutions. J. Pollut. Eff. Control 2016, 4, 2. [Google Scholar] [CrossRef]
- Wang, C.; Liu, Y.; Chen, W.-Q.; Zhu, B.; Qu, S.; Xu, M. Critical Review of Global Plastics Stock and Flow Data. J. Ind. Ecol. 2021, 25, 1300–1317. [Google Scholar] [CrossRef]
- Thushari, G.G.N.; Senevirathna, J.D.M. Plastic Pollution in the Marine Environment. Heliyon 2020, 6, e04709. [Google Scholar] [CrossRef]
- Munari, C.; Scoponi, M.; Sfriso, A.A.; Sfriso, A.; Aiello, J.; Casoni, E.; Mistri, M. Temporal Variation of Floatable Plastic Particles in the Largest Italian River, the Po. Mar. Pollut. Bull. 2021, 171, 112805. [Google Scholar] [CrossRef]
- Soares, J.B.P.; McKenna, T.F.L. Introduction to Polyolefins. In Polyolefin Reaction Engineering; Wiley-VCH Verlag GmbH & Co. KGaA: Weinheim, Germany, 2012; ISBN 978-3-527-64694-4. [Google Scholar]
- Korez, Š.; Gutow, L.; Saborowski, R. Microplastics at the Strandlines of Slovenian Beaches. Mar. Pollut. Bull. 2019, 145, 334–342. [Google Scholar] [CrossRef]
- Palatinus, A.; Kovač Viršek, M.; Robič, U.; Grego, M.; Bajt, O.; Šiljić, J.; Suaria, G.; Liubartseva, S.; Coppini, G.; Peterlin, M. Marine Litter in the Croatian Part of the Middle Adriatic Sea: Simultaneous Assessment of Floating and Seabed Macro and Micro Litter Abundance and Composition. Mar. Pollut. Bull. 2019, 139, 427–439. [Google Scholar] [CrossRef]
- Bošković, N.; Joksimović, D.; Peković, M.; Perošević-Bajčeta, A.; Bajt, O. Microplastics in Surface Sediments along the Montenegrin Coast, Adriatic Sea: Types, Occurrence, and Distribution. J. Mar. Sci. Eng. 2021, 9, 841. [Google Scholar] [CrossRef]


| Size Range (Max Extent—mm) | |
|---|---|
| <1 mm | 0.4% |
| 1–5 mm | 76.1% |
| 5–10 mm | 17.6% |
| 10–20 mm | 4.2% |
| >20 mm | 1.7% |
| Aspect Ratio | |
| 1 | 24.3% |
| 1–2 | 49.0% |
| 2–5 | 17.2% |
| 5–10 | 4.6% |
| >10 | 5.0% |
| Object Category | |
| Filament | 4.6% |
| Pellet | 10.5% |
| Fragment | 84.9% |
| Object Category | PE (HDPE + LDPE) | PP | PS |
|---|---|---|---|
| Filament | 3.5% | 10.6% | 0.0% |
| Pellet | 11.4% | 18.2% | 0.0% |
| Fragment | 85.1% | 71.2% | 100.0% |
| Size Range (Max Extent—mm) | PE (HDPE + LDPE) | PP | PS |
| <1 mm | 0.0% | 0.0% | 2.6% |
| 1–5 mm | 8.2% | 24.2% | 17.9% |
| 5–10 mm | 69.1% | 56.1% | 74.4% |
| 10–20 mm | 14.4% | 12.1% | 5.1% |
| >20 mm | 6.2% | 4.5% | 0.0% |
| Aspect Ratio | PE (HDPE + LDPE) | PP | PS |
| 1 | 16.7% | 21.2% | 64.1% |
| 1–2 | 51.5% | 45.5% | 25.6% |
| 2–5 | 18.2% | 18.2% | 10.3% |
| 5–10 | 6.1% | 4.5% | 0.0% |
| >10 | 7.6% | 10.6% | 0.0% |
| Plastic Type | Common Application | Specific Gravity | |
|---|---|---|---|
| Low-density polyethylene | LDPE | Plastic bags, film, packaging | 0.91–0.93 |
| High-density polyethylene | HDPE | Bottle caps, storage containers | 0.92–0.95 |
| Polypropylene (PP) | PP | Ropes, storage containers, bottle caps | 0.90–0.92 |
| Polystyrene—expanded | EPS | Boxes, packaging | 0.01–1.00 |
| Polystyrene | PS | Utensils, cups | 1.05–1.10 |
| Polyvinyl chloride | PVC | Pipes, containers, insulators, films | 1.20–1.30 |
| Polyamide (Nylon) | PA | Ropes, fishing nets | 1.15–1.20 |
| Polyethylene terephthalate | PET | Bottles | 1.35–1.40 |
| Polyurethane | PU | Adhesives, foams | variable |
Disclaimer/Publisher’s Note: The statements, opinions and data contained in all publications are solely those of the individual author(s) and contributor(s) and not of MDPI and/or the editor(s). MDPI and/or the editor(s) disclaim responsibility for any injury to people or property resulting from any ideas, methods, instructions or products referred to in the content. |
© 2023 by the authors. Licensee MDPI, Basel, Switzerland. This article is an open access article distributed under the terms and conditions of the Creative Commons Attribution (CC BY) license (https://creativecommons.org/licenses/by/4.0/).
Share and Cite
Cozzarini, L.; Buoninsegni, J.; Corbau, C.; Lughi, V. Characterization of Large Microplastic Debris in Beach Sediments in the Po Delta Area. Microplastics 2023, 2, 147-157. https://doi.org/10.3390/microplastics2010011
Cozzarini L, Buoninsegni J, Corbau C, Lughi V. Characterization of Large Microplastic Debris in Beach Sediments in the Po Delta Area. Microplastics. 2023; 2(1):147-157. https://doi.org/10.3390/microplastics2010011
Chicago/Turabian StyleCozzarini, Luca, Joana Buoninsegni, Corinne Corbau, and Vanni Lughi. 2023. "Characterization of Large Microplastic Debris in Beach Sediments in the Po Delta Area" Microplastics 2, no. 1: 147-157. https://doi.org/10.3390/microplastics2010011