Article

Macroplastics and Microplastics in Intertidal Sediment of Vinces and Los Tintos Rivers, Guayas Province, Ecuador

1
Centre for Marine Biodiversity and Biotechnology, Institute of Life and Earth Sciences, School of Energy, Geoscience, Infrastructure and Society, Heriot-Watt University, Edinburgh EH14 4AS, UK
2
Faculty of Chemical Engineering, University of Guayaquil, Guayaquil 090510, Ecuador
3
Research Group Ambiente, Sociedad & Empresa (ASE), Faculty of Chemical Engineering, University of Guayaquil, Guayaquil 090510, Ecuador
4
Faculty of Natural Sciences, University of Guayaquil, Guayaquil 090510, Ecuador
5
Department of Microbiology, University of Manitoba, Winnipeg, MB R3T 2N2, Canada
*
Authors to whom correspondence should be addressed.
Microplastics 2022, 1(4), 651-668; https://doi.org/10.3390/microplastics1040045
Submission received: 1 June 2022 / Revised: 9 August 2022 / Accepted: 28 November 2022 / Published: 7 December 2022
(This article belongs to the Special Issue Microplastics in Marine Environment)

Abstract

:
The composition, abundance and distribution of macroplastics (MAPs) and microplastics (MPs) in the Vinces and Los Tintos rivers were determined in three sites (Pueblo Nuevo, Santa Marianita, Los Tintos) from the low basin in the coastal province of Guayas, Ecuador. MAPS were recorded by visual census, covering a total distance of 140 m, and MPs were extracted in the intertidal sediments via density separation using a saturated NaCl solution, and these were counted using a stereomicroscope. A total of 940 plastic items were identified. The predominant debris was plastic with 85.2%, followed by manufactured materials and metals. The Vinces River contained the highest abundance of plastic in the locality of Pueblo Nuevo. The most abundant plastic was MPs. The most common MAPs were plastic bags (23%), food packaging (17%) and foamed plastic (8%). MP size classes quantified between 0.15 and 2.52 mm in intertidal, very fine sandy sediment and decreased in abundance with increasing grain size. The most common MPs were fibres (65.2%) (black (43.8%) and blue (25.8%)), and their distribution has a high correlation with population density and water flow direction: Santa Marianita 5.55 g−1, Pueblo Nuevo 7.39 g−1, Los Tintos 8.17−1. A significant abundance of fibres was identified in Pueblo Nuevo. The plastic spatial distribution revealed major plastic pollution in areas where recreational and tourism activities have been developed. Therefore, we recommend implementing awareness campaigns by educating businesses, residents and tourists on managing solid waste (especially plastic) and wastewater. Our results can serve as a baseline for future plastic monitoring in the area.

1. Introduction

Estuaries and rivers are amongst the most economically and biologically important ecosystems [1]. However, their productivity and functionality are being affected by the fragmentation of plastic waste, which is effectively transporting and releasing vast amounts of fibres and particles into the oceans and being consumed by aquatic organisms [2]. The degradation of larger plastic items by breaking up into secondary microplastics (MP), is one of the main sources of MP pollution. Primary MPs are intentionally manufactured, such as microbead and pre-production pellets, and can be found in sediments [3,4]. MP morphotypes consist of fibres, particles, beads, pellets, films and Styrofoam [5].
Plastics can be categorised into three forms: macroplastics (MAPs; large plastic >2.5 cm), MPs (fibres/particles <5 mm) and nanoplastics (NPs; <1 µm) [3,6]. It has been estimated that up to 51 trillion particles may be floating on the surface of the oceans worldwide [7]. One study reported that an estimated 4.8–12.7 million metric tons of MPs were discharged into the oceans during 2010 [8]. Most MPs are caused by physical, photo and microbiological degradation of MAPs [9] which enter the aquatic systems, especially in urban areas where a high abundance of MP pollution is found [10]. MPs settle upon reaching variable density in the water column, allowing them to remain adrift and travel long distances through ocean currents [11].
Since the early 1970s the North Atlantic, North Pacific and South Pacific Subtropical Gyres have witnessed accumulations of floating plastic debris [12]. Generally, environmental plastic debris originates from three primary domains, land, river, and ocean [13,14], and is transported within estuaries by the influence of water movement and wind patterns [15]. Upon dispersion and fragmentation, caused by weathering processes and photodegradation, plastics converge in gyres, bays, gulfs and estuaries worldwide [13]. Plastic debris enters these riverine environments, mainly from land-based sources, during the rising tide, travelling out into coastal waters when the tide falls [15] and subsequently transferring across the shores of Ecuador by boundary currents [16], causing serious problems for marine life [15].
A recent analysis based on publications from January 2014 to May 2021 in Asian freshwater ecosystems, considered as a “hot spot” for plastic production, showed the presence of MPs in water, sediments and biota [10]. Plastic pollution production mainly originated from domestic wastewater/runoff, followed by industrial emissions, fisheries and aquaculture. In water, MPs ranged between 0.004 items m−3 and 500,000 items m−3 in a highly populated watershed, and in sediments the MP abundance ranged from 1 to more than 30,000 items kg−1 dry weight. Polyethylene (PE) and polypropylene (PP) were predominantly recorded in water and sediments. The abundance of MP in the species studied depended on the location, MP transference and accumulation in the aquatic environment, and ingestion by low to high trophic level organisms [10]. The presence of plastic in fish guts is normally high in rivers and estuaries [17] and affects animals through the ingestion of marine fish [18], causing damage to the respiratory and gastrointestinal tracts by obstruction [19].
Studies suggest that rivers contribute significantly to ocean litter pollution. Research shows that food and beverages packaging contributed to more than a quarter of total litter pollution in the Adour River, France [20]. With plastic packaging fragmenting over time, it inevitably breaks up into MPs. The timescale of particle fragmentation is uncertain, yet depending on the polymer type, it is suggested that in cold, oxygen-limiting conditions it could take more than 300 years for a 1 mm piece of plastic to fragment into 100 nm size pieces [8]. High concentrations of MPs are recorded in urban areas which serve as fishing grounds or industrial outflows, and are transported by estuarine waters. One study investigated five estuaries in KwaZulu-Natal, South Africa and reported them as pathways from catchments to the oceans [21]. A study investigating the occurrence of MPs in surface water from Yangtze, Jiaojiang, Oujiang, and Minjiang estuaries also reported that the high risk of inland water pollution by MPs is due to population density and unsound waste management systems [22].
Very little research on smaller fragments of plastic in freshwater environments is available, and attention should be focused on the source of these plastics within river basins, particularly in South America due to their volume and global ecological significance [23]. Recent studies in the southeast Pacific Ocean found a low prevalence of MP ingestion by planktivorous fish species along the coasts of Panamá to southern Chile. However, Ecuador showed high MP ingestion by fish in coastal waters close to urban areas such as La Libertad, with 3840 inhabitants km2 [24]. Some studies in the Galapagos and beaches on the Ecuadorian coast reveal that plastic items originating from fishing nets [25] and debris pollution [26,27] are some of the most prevalent problems in Ecuador.
In 2010, the National Program of Integrated Solid Waste Management (PNGIDS) was developed, aiming at promoting integrated and sustainable solid waste management throughout the 221 municipalities in Ecuador [28]. This program was enforced by the Ministry of the Environment (MAE) and is regulated through the Constitution of Ecuador [29] and the Organic Code of the Environment [30]. Despite these efforts, only 24% of the country’s municipal governments are separating waste, thus giving a clear indicator of economic unsustainability [31]. However, there is limited information on the composition and distribution of macro and microplastics in rivers, especially in the lower basins and estuarine areas of the coast of Ecuador. Therefore, this research was focused on determining the composition, abundance and distribution of MAPs and microplastics in a section of the Vinces and Los Tintos rivers in the Guayas province, to generate a baseline of contamination in fresh water sources in Ecuador.

2. Materials and Methods
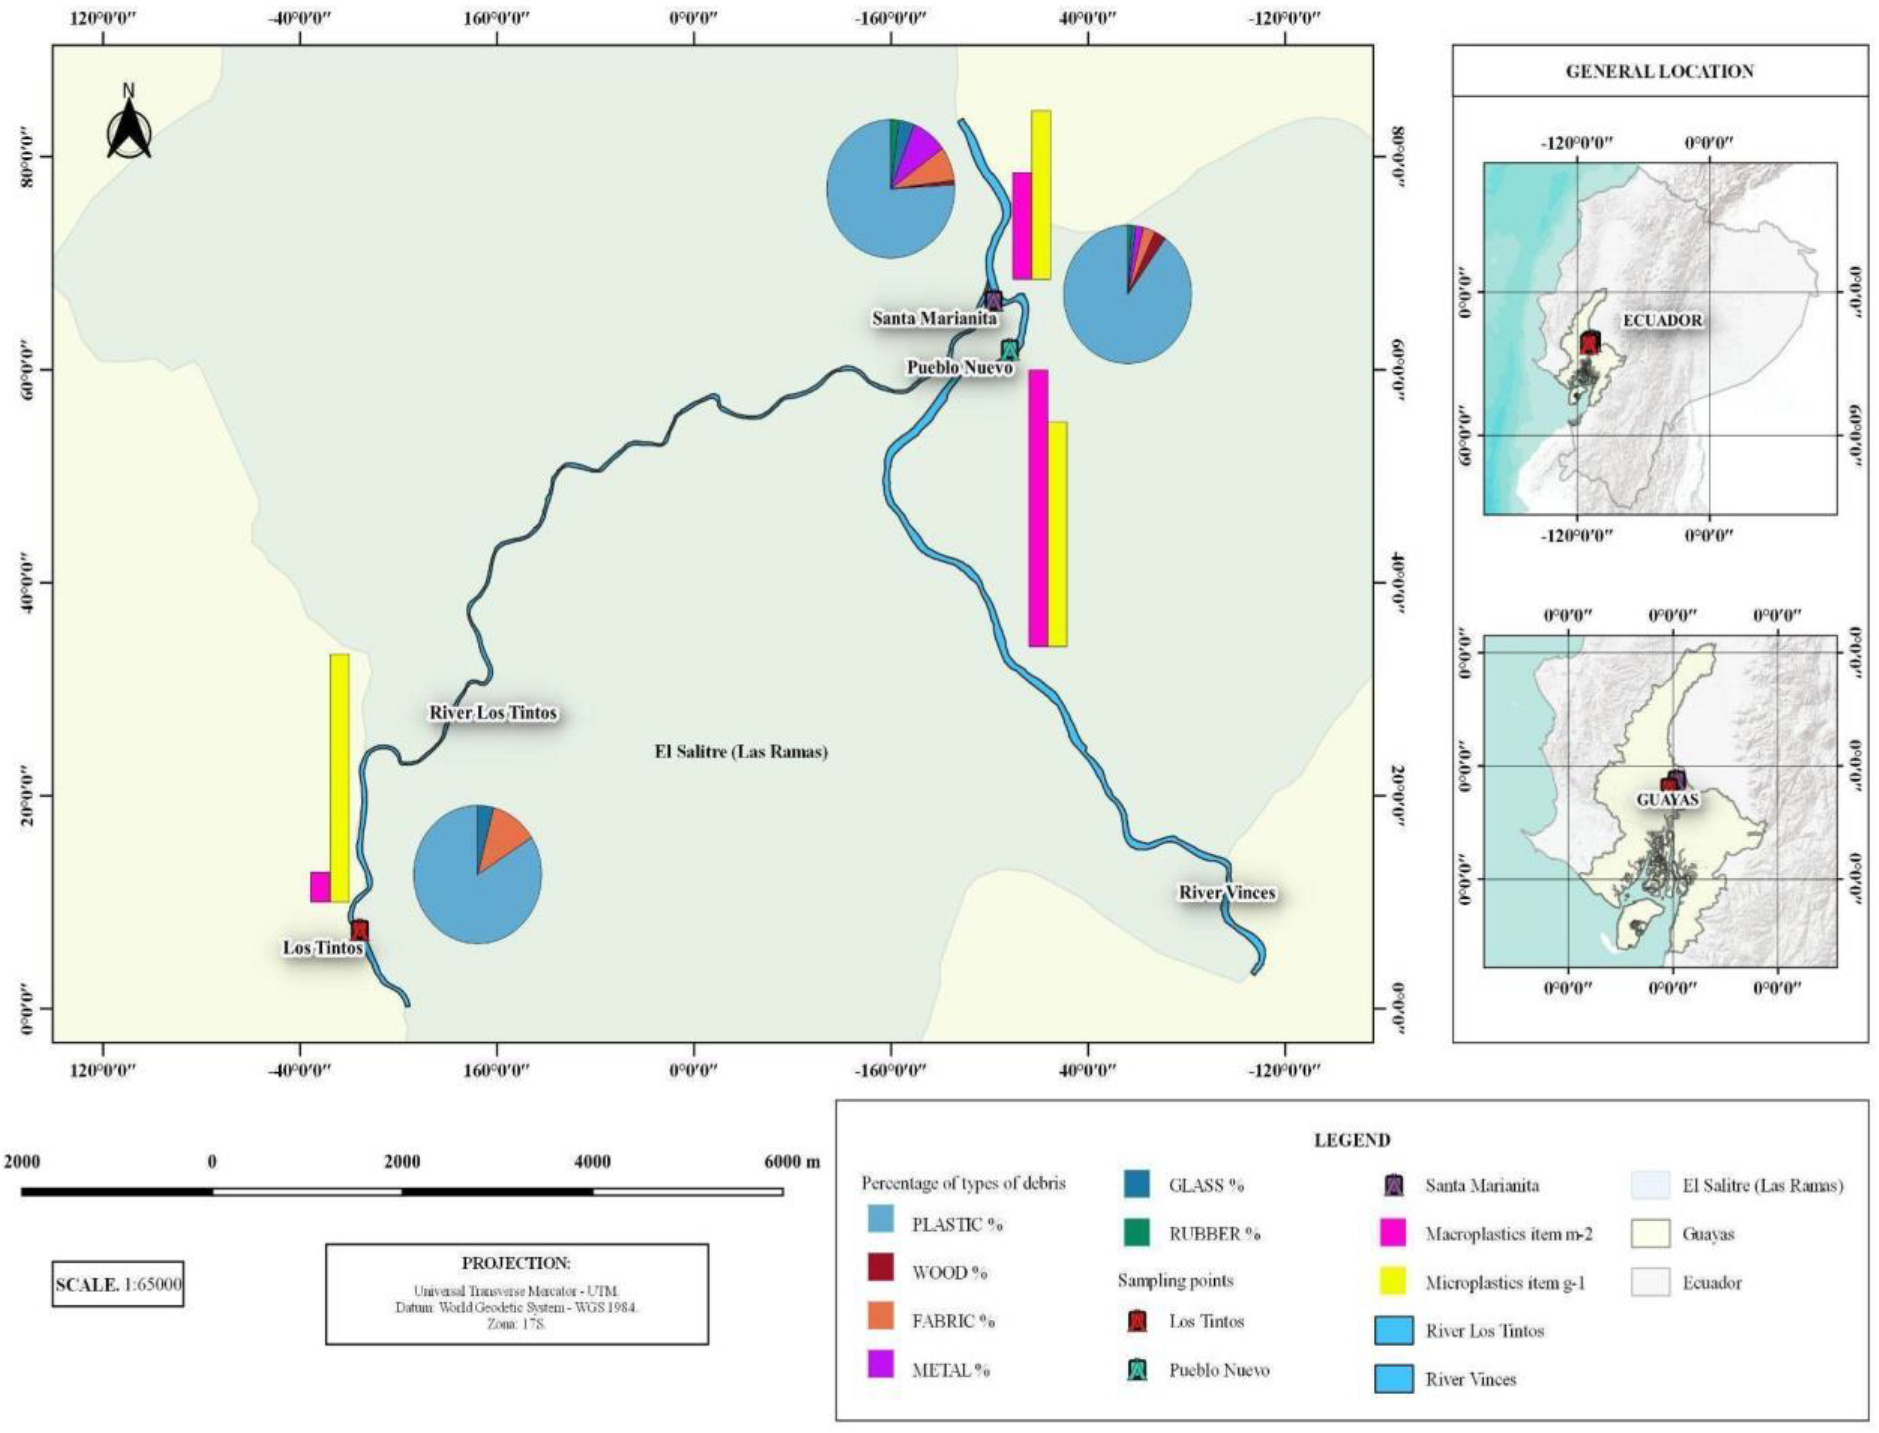
2.1. Study Area

The Guayas province is located on the central-western coast of Ecuador with a population of 3,573,003 inhabitants and an area of 18,661.69 km² [32]. Its hydrographic network is formed by the Guayas Basin, which extends across 36,000 km² [33]. Various rivers merge to form the Guayas River, the most important river in this province. The Guayas estuarine system is highly productive due to upwelling caused by the Humboldt current [34] and is one of the largest estuarine basins in Ecuador, covering an area of 33,700 km2 [35]. Towards the north of Guayaquil city, the Daule (receiving waters from Pueblo Viejo, Vinces, Zapatal, and Yaguachi) and Babahoyo (with San Pablo and Caracol affluents) rivers merge to form the Guayas River [36], which ultimately flows into the Pacific Ocean [37]. An important tributary within this hydrographic network is the Vinces river; it contributes to the supply and irrigation of crops and is the first freshwater beach resort in Ecuador [38].
The Los Tintos and Vinces rivers flow in a south-eastern direction feeding into the Babahoyo River (Figure 1). The sub-basins descend from the Andes and drain depending on the amount of rainfall. At peak flow, the average annual discharge during the dry season (June and November) is 200 cubic metres per second (m3 s−1) and may increase to approximately 1600 m3 s−1 during the wet season (December and May) [39]. The hydro-geographic conditions of the watersheds form the Guayas ecosystem. The most important watersheds in Ecuador [40] contain a wide variety of productive activities which are being developed. The main anthropogenic activities that have impacted the Guayas Basin are urban-industrial development, monoculture agriculture and shrimp pond aquaculture [41].

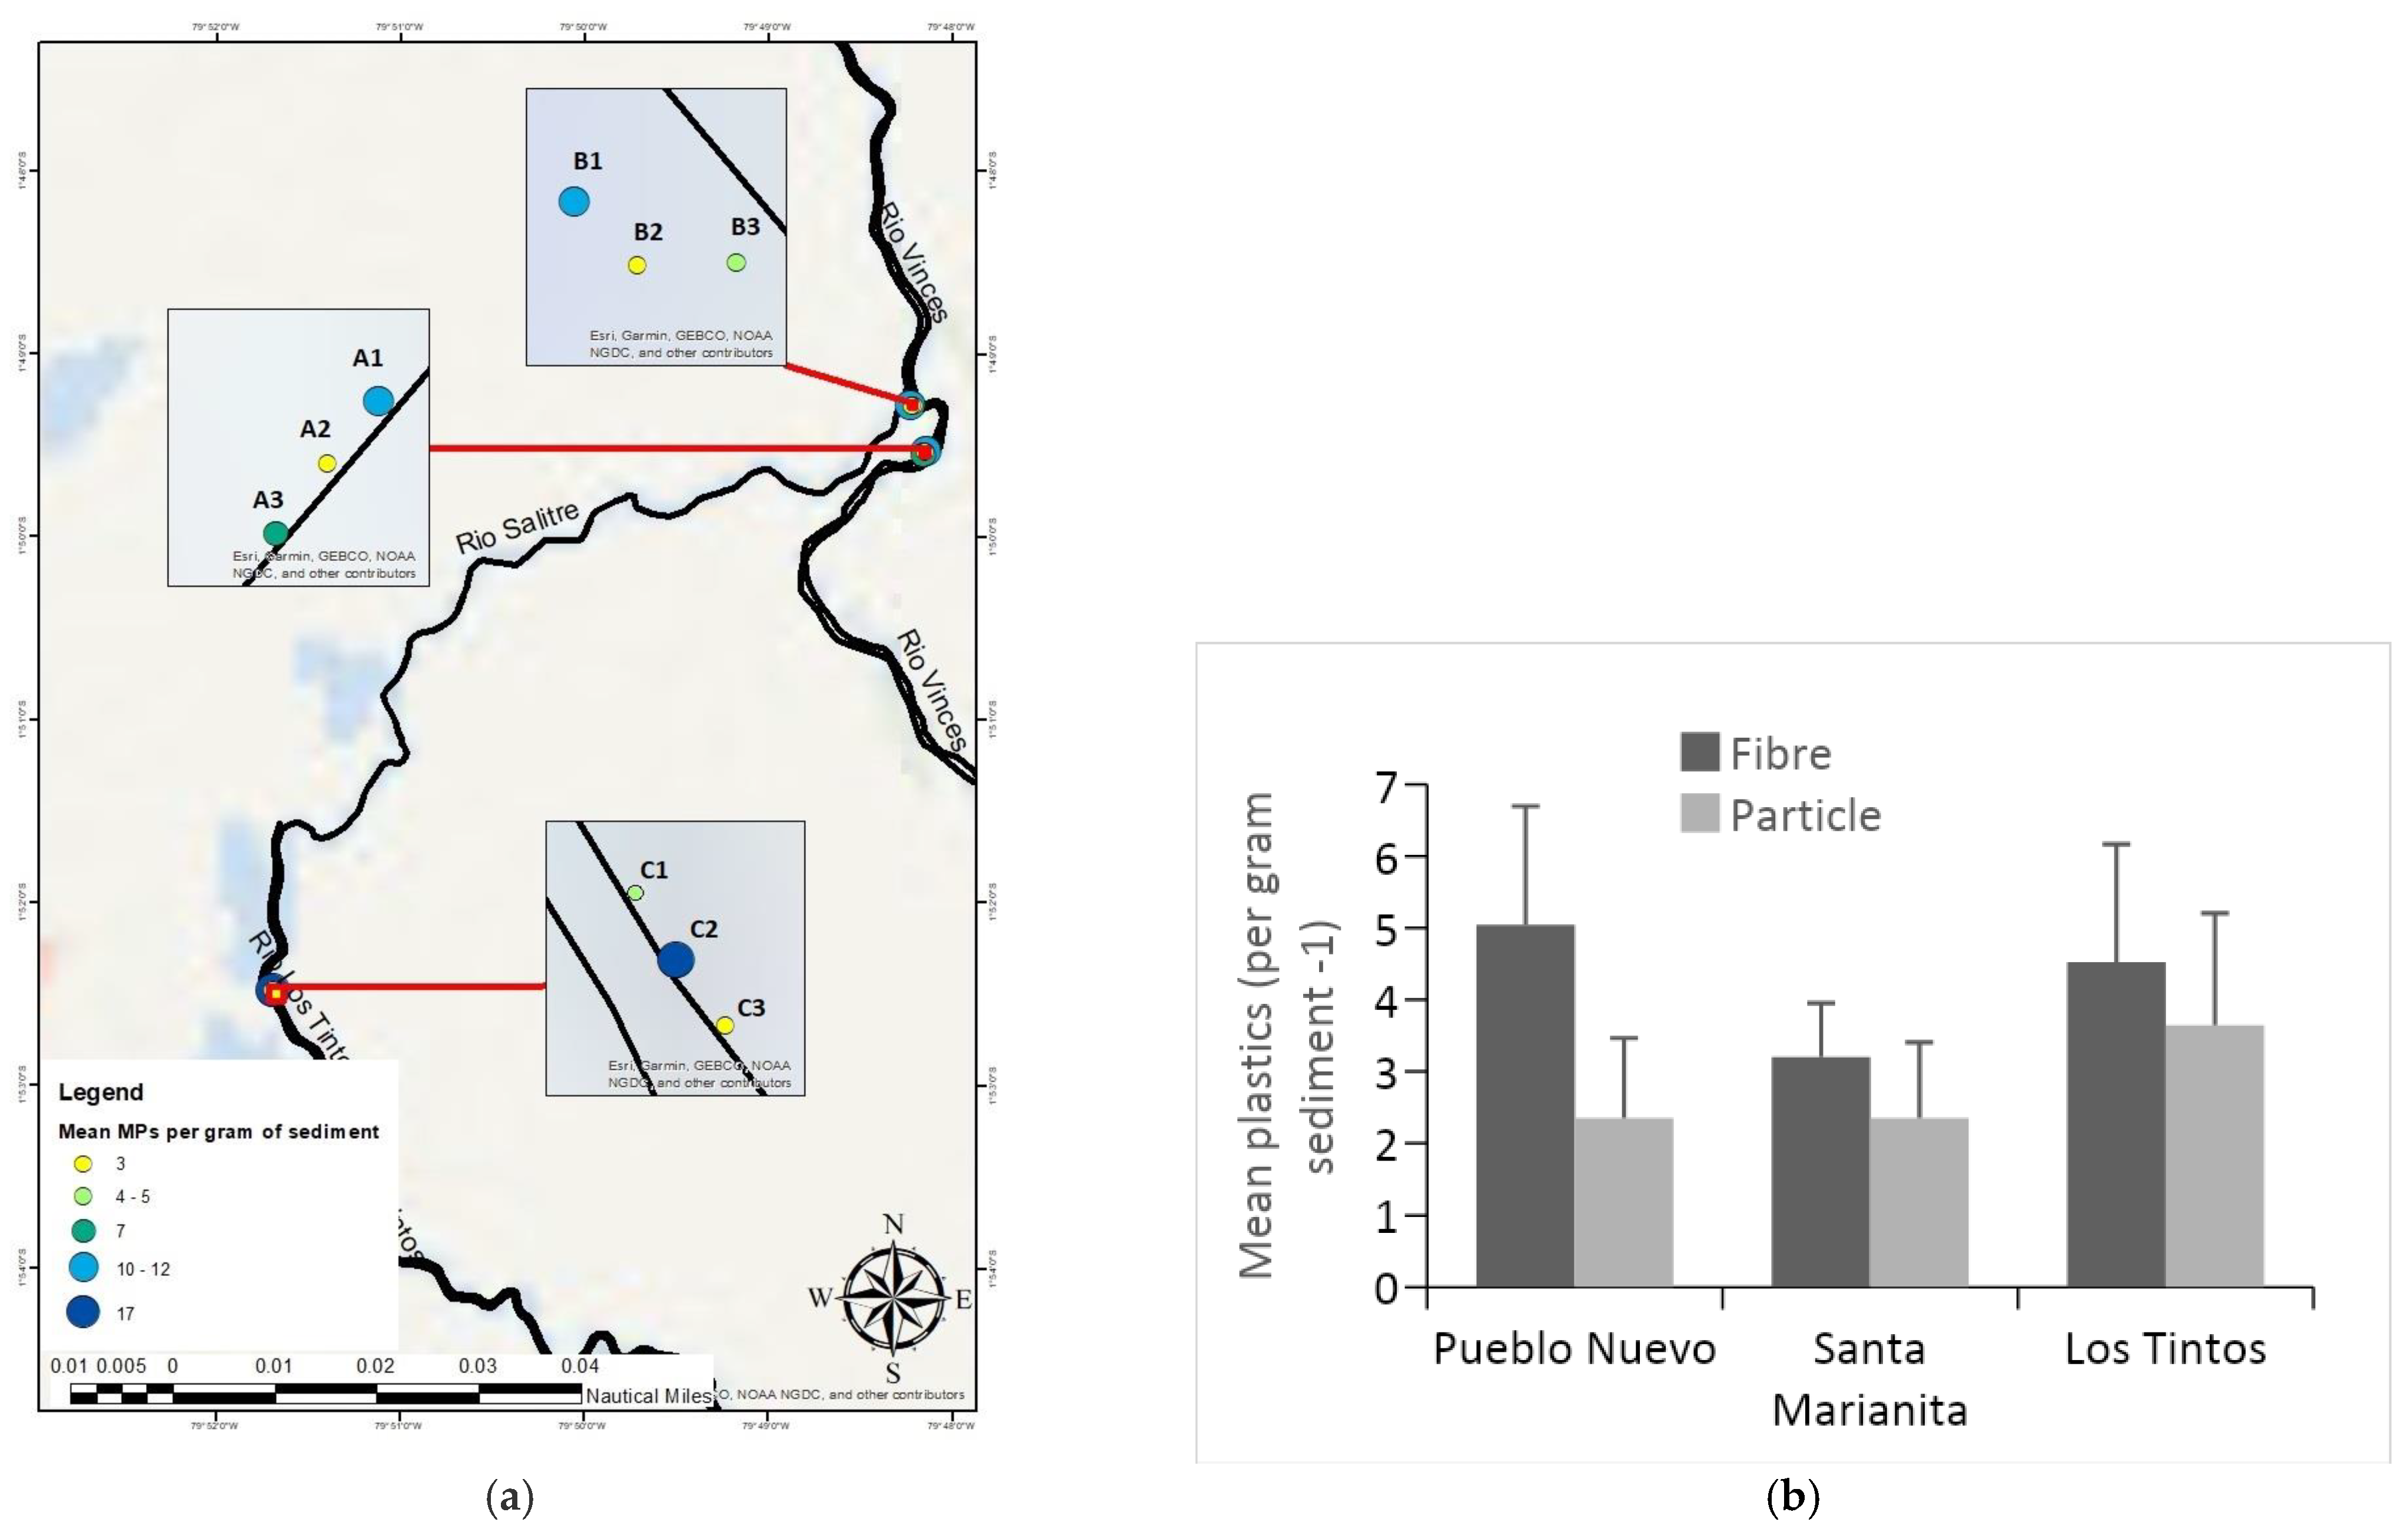
2.2. Sample Collection

Sample collection was carried out in June 2018 in the dry season at three sites within the Guayas province: Santa Marianita (1°49′16′ ′S, 79°48′14′′ W), Pueblo Nuevo (1°49′31′′ S, 79°48′9′′ W) and Los Tintos (1°52′29′′ S, 79°51′42′′ W). The geographic locations of the sampling sites are given in Table 1 and Figure 1. MP in sediments were collected using survey techniques from [3], and MAPs using the standing stock survey protocol developed by NOAA [42]. A 40–50 m transect line along the strandline was used for both surveys. A total of nine stations were surveyed, three stations per site. In addition, granulometry analysis was carried out to apply the MP density separation technique widely used in coastal areas of the United Kingdom [3]. The maps were produced using ArcGIS (ArcMap version 10.6), from an Ecuador landmass shapefile, and GPS coordinates were added to indicate the sites and stations sampled.
C o n c e n t r a t i o n   C = t o t a l   n u m b e r   o f   r e c o r d e d   i t e m s   n t r a n s e c t   w i d t h   w   ·   t o t a l   t r a n s e c t   l e n g t h   l

2.3. Contamination Prevention Measures

To prevent risk of contamination in the field, specific measures were taken, such as avoidance of clothing containing synthetic fibres. A dampened Microfibre filter MF 300 (Fisherbrand, 70 mm) was used to act as the control and collect any atmospheric fibres/particles during sampling, and sampling was conducted into the wind to mitigate operator contamination further.

2.4. Macroplastic Standing Stock Survey

To provide source analysis of the area, the same transect line was used at each site. The standing-stock protocol was adopted from NOAA [42] to ensure that the technique was a reputable assessment of the distribution and types of litter identified [43]. Four random transects were chosen at each site, which were selected in 5 m segments, and data, including litter types and substrate, were recorded. Each site was closely surveyed by walking from the transect line to the back of the shoreline (first barrier) and GPS coordinates were recorded in the centre. Debris items measuring over 2.5 cm were recorded by visual census.

2.5. Microplastic Sediment Sampling

Firstly, a 40–50 m transect line was laid out along the water’s edge (strandline) at each site. Three replica samples were collected at all three stations per site: both ends and at the centre of the transect, recording GPS coordinates at each station. The samples were collected approximately 1 m from the strandline by pushing a 5 mL glass bijoux jar into the sediment, which acted as a miniature corer and was then sealed with a metal screw cap (Figure 2). The most representative accumulations of microplastics were sampled within the top 3 cm of sediment. This methodology was based on a study also sampling MP in sediment [3].

2.6. Laboratory Analysis

Laboratory analysis began by weighing each sample prior to MP extraction. Sediment weight was determined by decanting each sample into an individual pre-weighed 250 mL glass beaker, covering with Pyrex glass covers or foil (to prevent contamination) and placing into a drying oven at 50 °C for 24 h, after which the glass was re-weighed, and the difference taken to calculate the dry weight of the sediment.

2.6.1. Microplastic Extraction

Plastic fibres and particles were extracted using density separation in a saturated solution of NaCl The sediment was agitated with a Teflon-coated magnetic stirrer for 1 min in 100 mL of saturated NaCl solution (384 g per litre (g L−1)) and left for 1 min to allow the sediment to settle. The surface of the sample was then carefully vacuumed, (BOECO R-300 vacuum pump 110 V) using a glass Pasteur pipette attached to a silicone hose, into a three-neck-distilling flask. The extracted solution was filtered through a Microfibre filter MF 300 (Fisherbrand, 47 mm, pore size 0.7 μm) using the vacuum pump, and placed inside a labelled petri dish to put aside and dry at room temperature for 24 h. Each replicate was re-washed and filtered three times due to slightly muddy sediment. The filters (n = 81) were examined under a high-powered Leica MC170 dissecting microscope and fibres and particles were removed using fine, steel forceps and transferred onto fresh filters. A Leica MZ8 compound microscope with 90× magnification power was then used to differentiate between plastic and non-plastic. This fast-screening technique allowed rapid identification of size, shape and colour of MPs.
Plastic fibres and particles were determined based on no cellular or organic structures visible, equal thickness (sometimes fraying or splitting), clear and homogeneous colour, shine, and upon prodding either spring or do not break [44]. The suspected MPs were counted and sorted into sections on the filter paper in terms of shape and colour. In order to account for atmospheric contamination in the lab, an open petri-dish with a damp Microfiber filter MF 300 (Fisherbrand, 70 mm) was used throughout the entire procedure.

2.6.2. Grain Size Analysis

Following MP extraction, the grain size analysis was performed using seven sieves of decreasing mesh size (2000 micrometre (µm), 1000 µm, 500 µm, 300 µm, 250 µm, 125 µm and 63 µm). Each sample was passed through the sieve stack (ELE International Ltd., Bedfordshire, UK) using distilled water, and placed into a drying oven at 105 °C for approximately 45 min. The retained sediment in each sieve was then weighed and the cumulative percentage calculated.

2.7. Plastic Categories

To easily sort and distinguish MPs and macro-plastics, they were categorised as follows. Two types of MP morphotypes were identified in this study: fibres and particles. The macro-plastic types were food wrappers, beverage bottles, bottle lids, bags, production cables, cups/plates (including polystyrene (PS)), utensils, straws, personal care products and polypropylene (PP) sandbags.

2.8. Statistical Analysis

All data were tested for the basic assumptions for normality and homogeneity of variance. The Shapiro–Wilk test was performed to analyse the normality of the data distribution. In order to determine the difference of MAPs and MP abundance at each site a non-parametric ANOVA was performed, after the assumptions were not fulfilled, using the Kruskal–Wallis test. Statistical tests were performed using R version 3.3.2 [45]. The Principal Component Analysis (PCA) was conducted to determine the effect of site characteristics and human activities on macro items and MP (fibres and particles) distribution, and the previous square root transformation and data normalisation of abundance of items conducted using PRIMER V7 [46]. The variables tested were number of macro items, plastic, wood, metal, glass, rubber, fabric material, fibres, particles and direction of river flow (DRF).

3. Results

3.1. Macro Items

A total of 336 macro items were found, and 286 of those were recorded as MAPs across all sampling sites. Plastics were the predominant debris in the three study sites with 85.2% (286 items), followed by fabric materials (17 items) with 5.06% and metals with 4.17% (14 items). Relevant metadata recorded at the sites are shown in Table 2. Pueblo Nuevo had significantly more plastic (89%) recorded compared to 11% of the other materials (metal, glass, rubber, processed lumber and cloth) (p < 0.05) (Figure 3).
The abundance of the macro items varied between study sites; the largest number was registered in Pueblo Nuevo with 213 items, Santa Marianita with 98 items and Los Tintos with 25 items. Wood, metals and fabric material were commonly recorded in the studied sites. High levels of MAPs have been found in the Vinces River, mainly in Pueblo Nuevo and especially in the riverine zone used for recreational activities and outdoor restaurants. Santa Marianita was the second site with a major abundance of MAP, followed by metals and fabrics. These localities are exposed to a variety of sources, including recreation, fishing, navigation, a landing area for boats and a slaughterhouse.
The mean total concentration of macroplastics (Macro average) was 9.1 items/m2 in Pueblo Nuevo, 3.52 items/m2 in Santa Marianita and 1 items/m2 in Los Tintos. The majority of MAPs recorded were 33.2% poly sandbags (n = 95), 23.1% plastic bags (n = 66), 16.7% food packaging (n = 48) and 8% foamed plastic (EPS) (n = 23). The greatest debris item recorded was polypropylene (PP). There was no significant difference between plastic and other items at Santa Marianita and Los Tintos. The average concentrations for MAPs across all sites did not differ significantly.

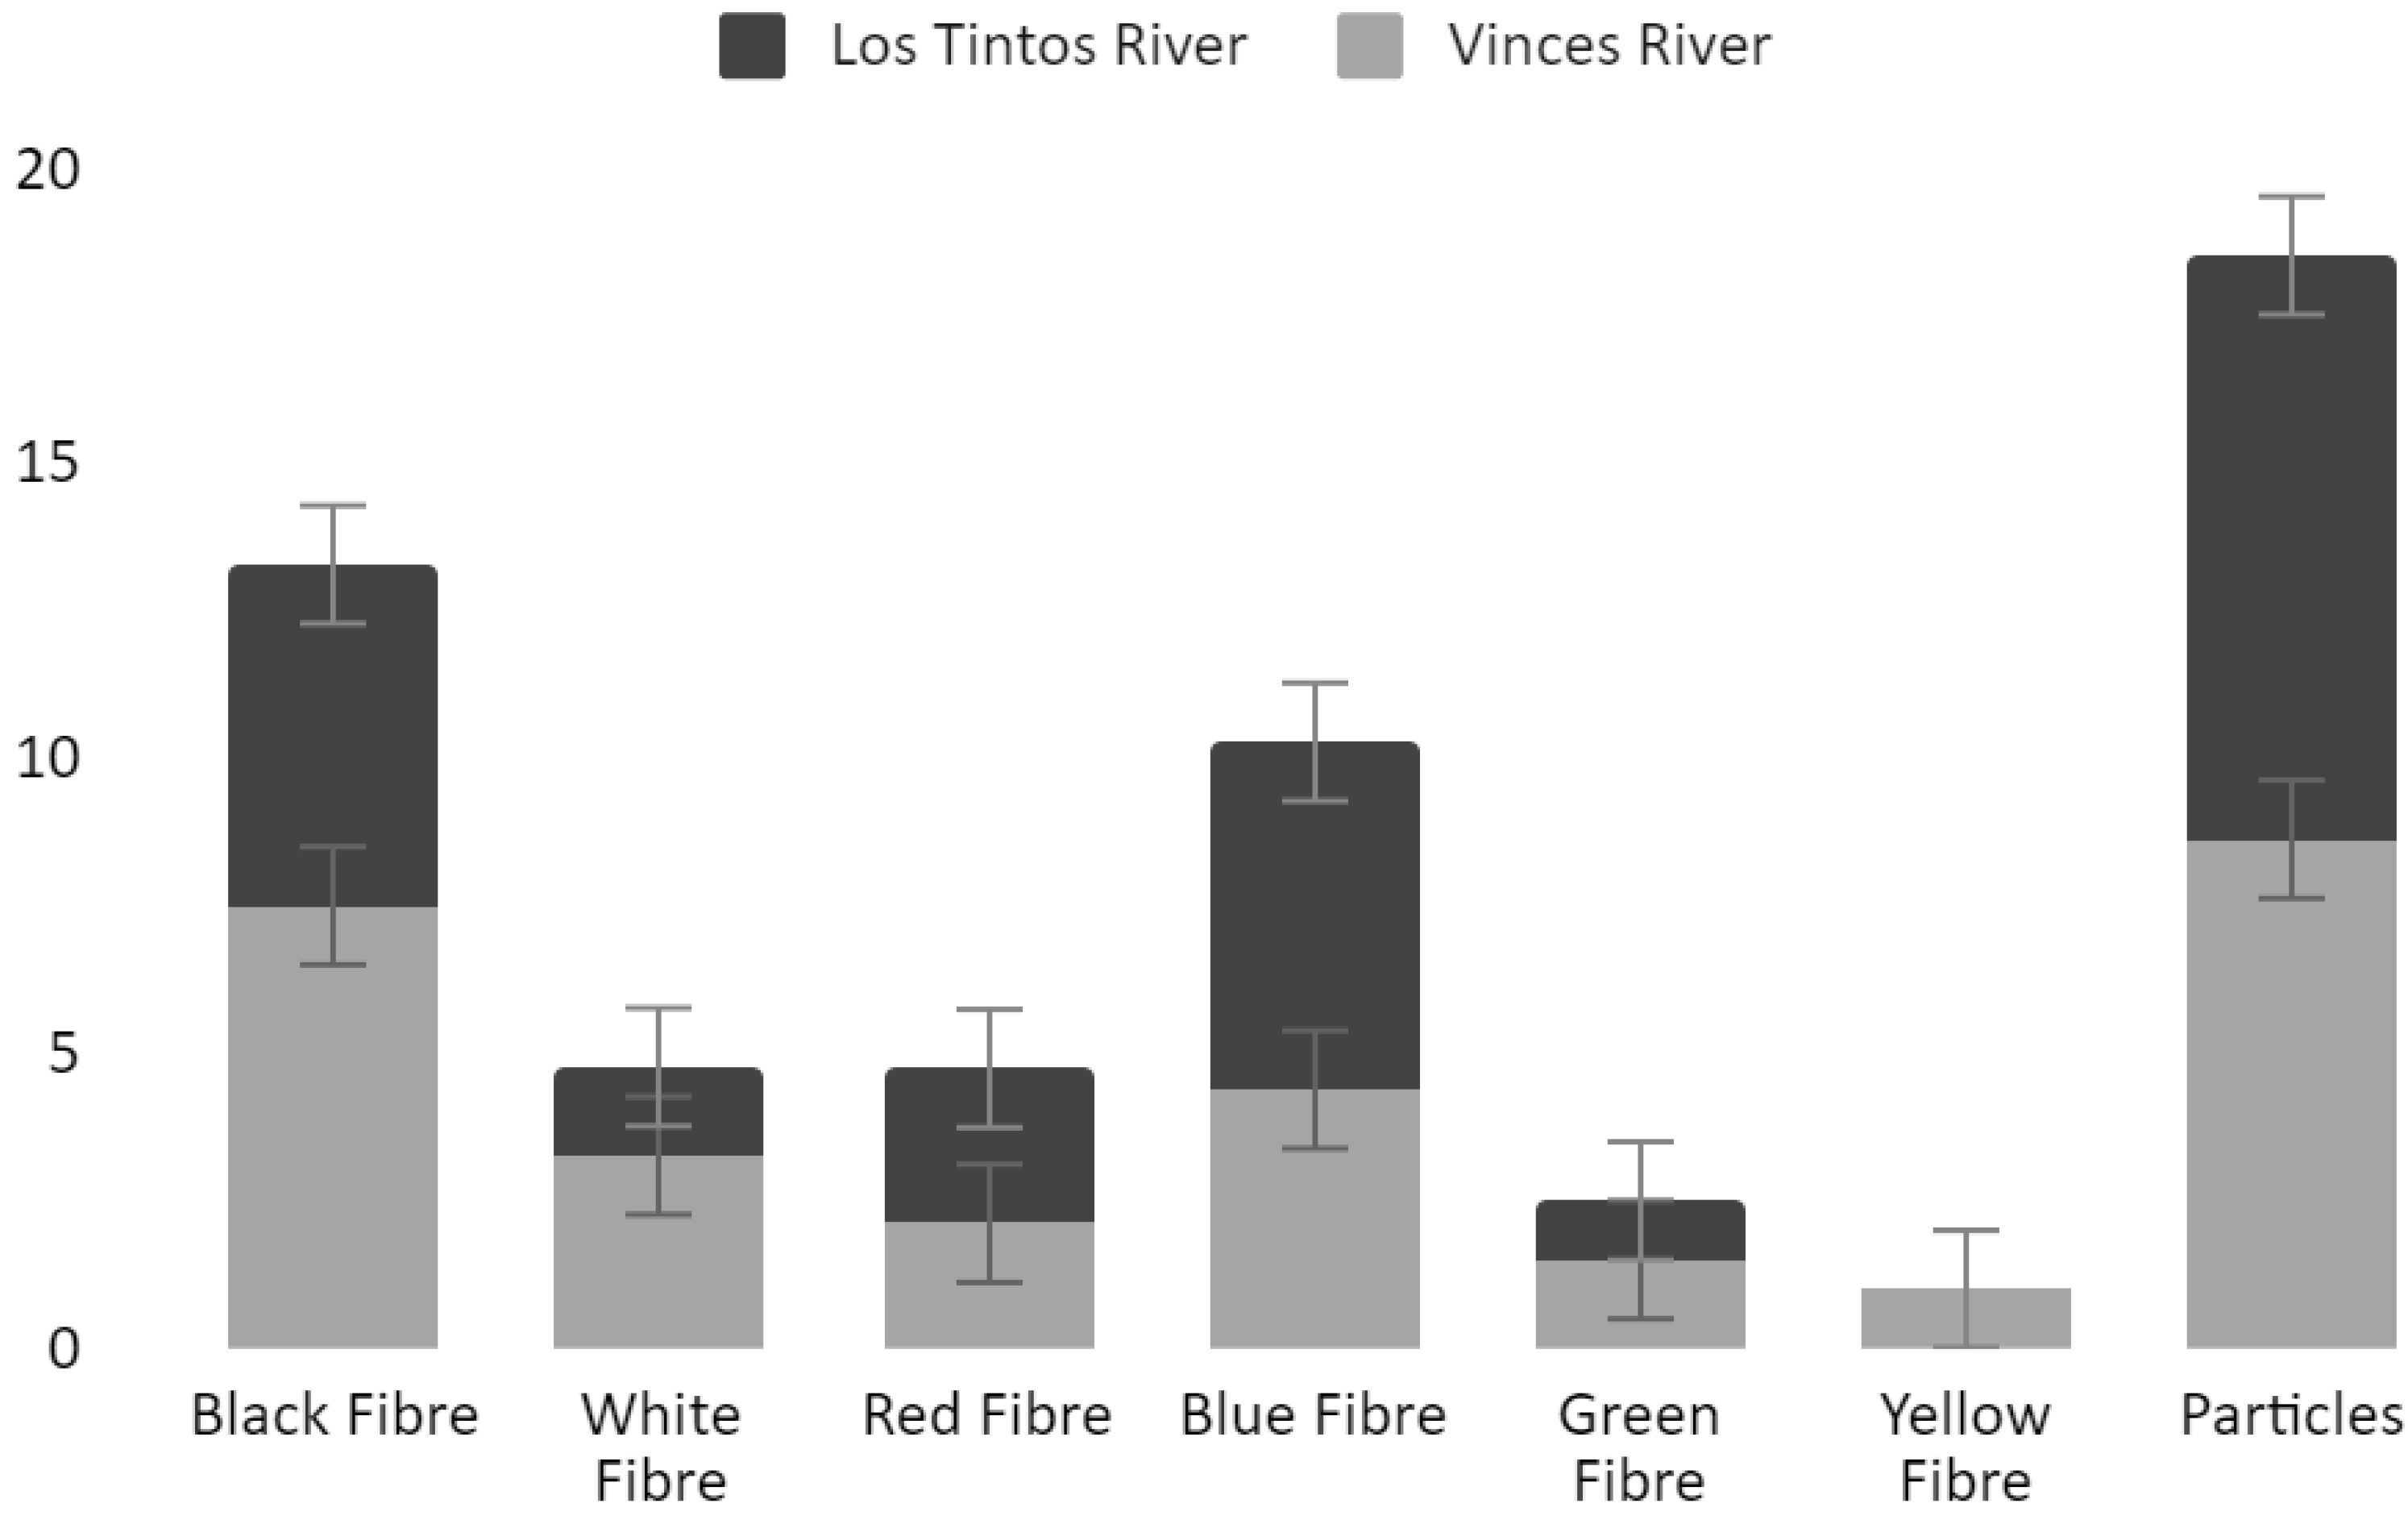
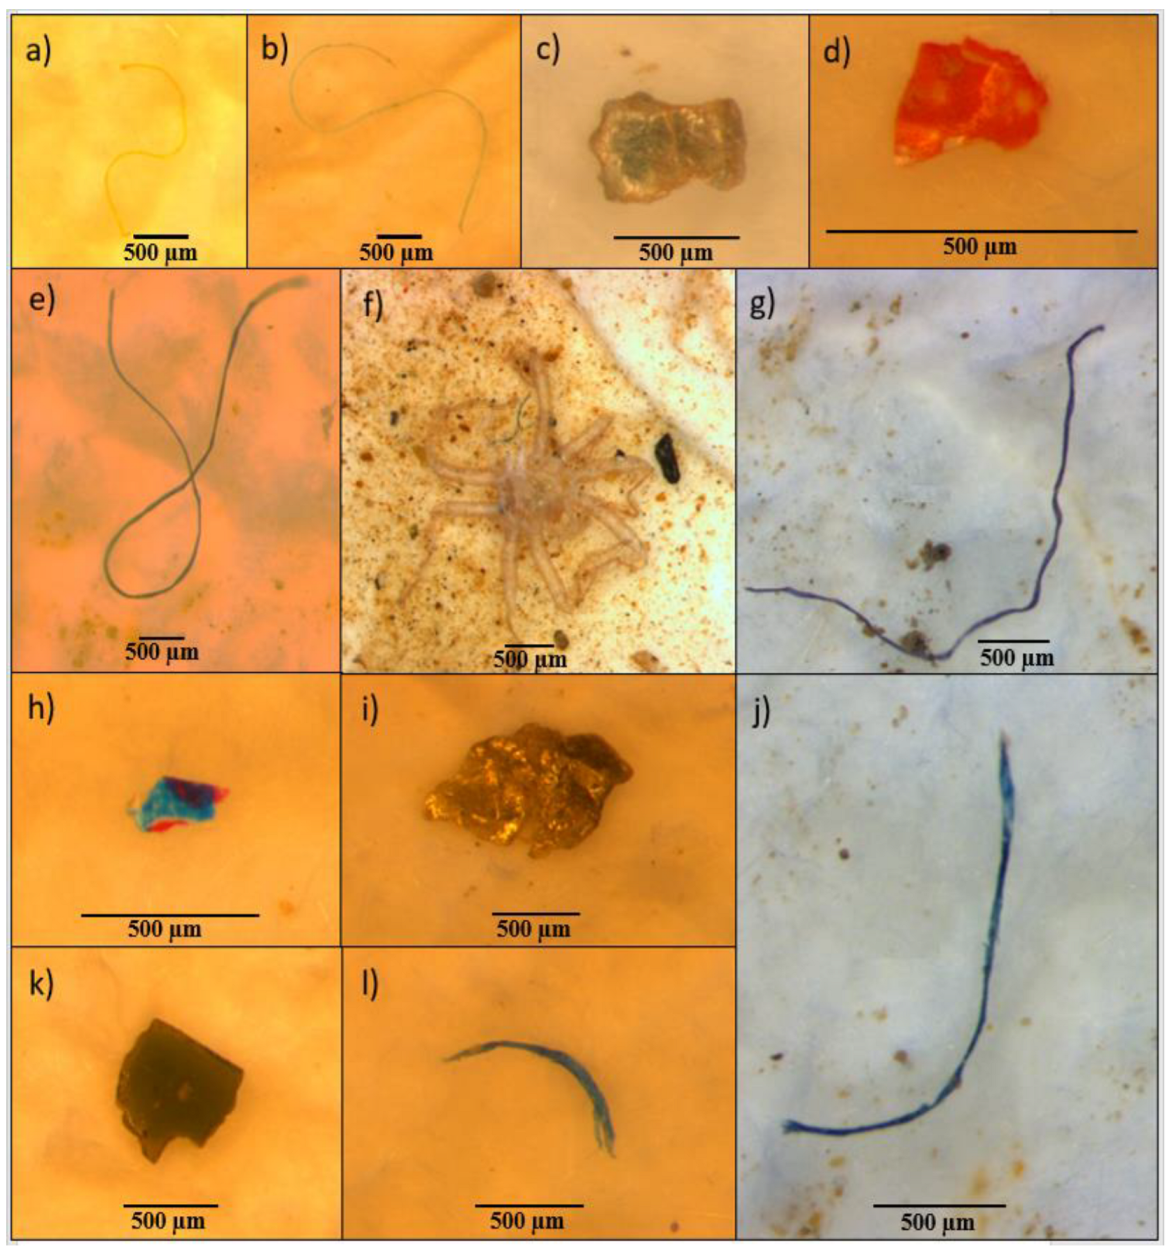
3.2. Microplastic Composition in Sediment

MP particles and fibres (<5 mm) were detected in each replicate intertidal sediment sample. A total of 654 MPs were found at the study sites; 65.2% were fibres and 34.8% MP particles. The down-stream MP contamination was most pronounced at Los Tintos, with 34.6% (226 items), followed by Santa Marianita with 33.9% (222 items). The fibres were measurable at high concentration in Pueblo Nuevo and the particles in Los Tintos (Table 2). The average abundance of large MPs (1–5 mm) in sediments ranged from 1 to 2.522 items/m and the average number of small microplastics (<1 mm) in sediment samples was 0.154–0.613 items/m, respectively (Table 2; Figure 4). The average MP concentrations g−1 sediment across all sampling sites ranged from 5.55 g−1 to 8.17 g−1 and did not differ significantly. However, a significantly greater concentration of fibres (5.04 g−1) was identified in Pueblo Nuevo compared to particles (2.35 g−1) (p < 0.05) (Figure 4). The average MP concentrations/g−1 for all particles and fibres within Los Tintos and Vinces River had no significant difference.

3.3. Microplastic Colours

In Los Tintos River, recovered MPs were found in a variety of colours including black, white, red, blue and green (Figure 5). These colours, including yellow, were found in Vinces River. This river accounted for 38% of black microfibres, making them the most abundant colour. Los Tintos river identified an abundance of 35% blue and 34% black fibres (Figure 5 and Figure 6).

3.4. Contamination

During sediment sampling, contamination control filters were used to collect any airborne fibres. No fibres were found upon microscopic analysis. During laboratory analysis, the same protocol was applied and two red and three blue plastic microfibres were recorded. These fibres were identical in colour, structure and length and such fibres were therefore ruled out and eliminated from the sorting process.

3.5. Sediment Weight and Grain Size

Across all sampling sites, microplastics were found to be less abundant as particle size became greater in density. The sediment type of highest abundance across all three sampling sites consisted of 61% very fine sand (125 µm) (Table 3). Los Tintos contained the greatest percentage of very fine sand, whilst larger coarse sand/granules (500 µm to 2 mm) were the least abundant. Pueblo Nuevo consisted of a significantly greater concentration of medium (300 µm)/fine (250 µm) sand compared to other sampling sites. The highest abundance of silt clay content was also found at Pueblo Nuevo.

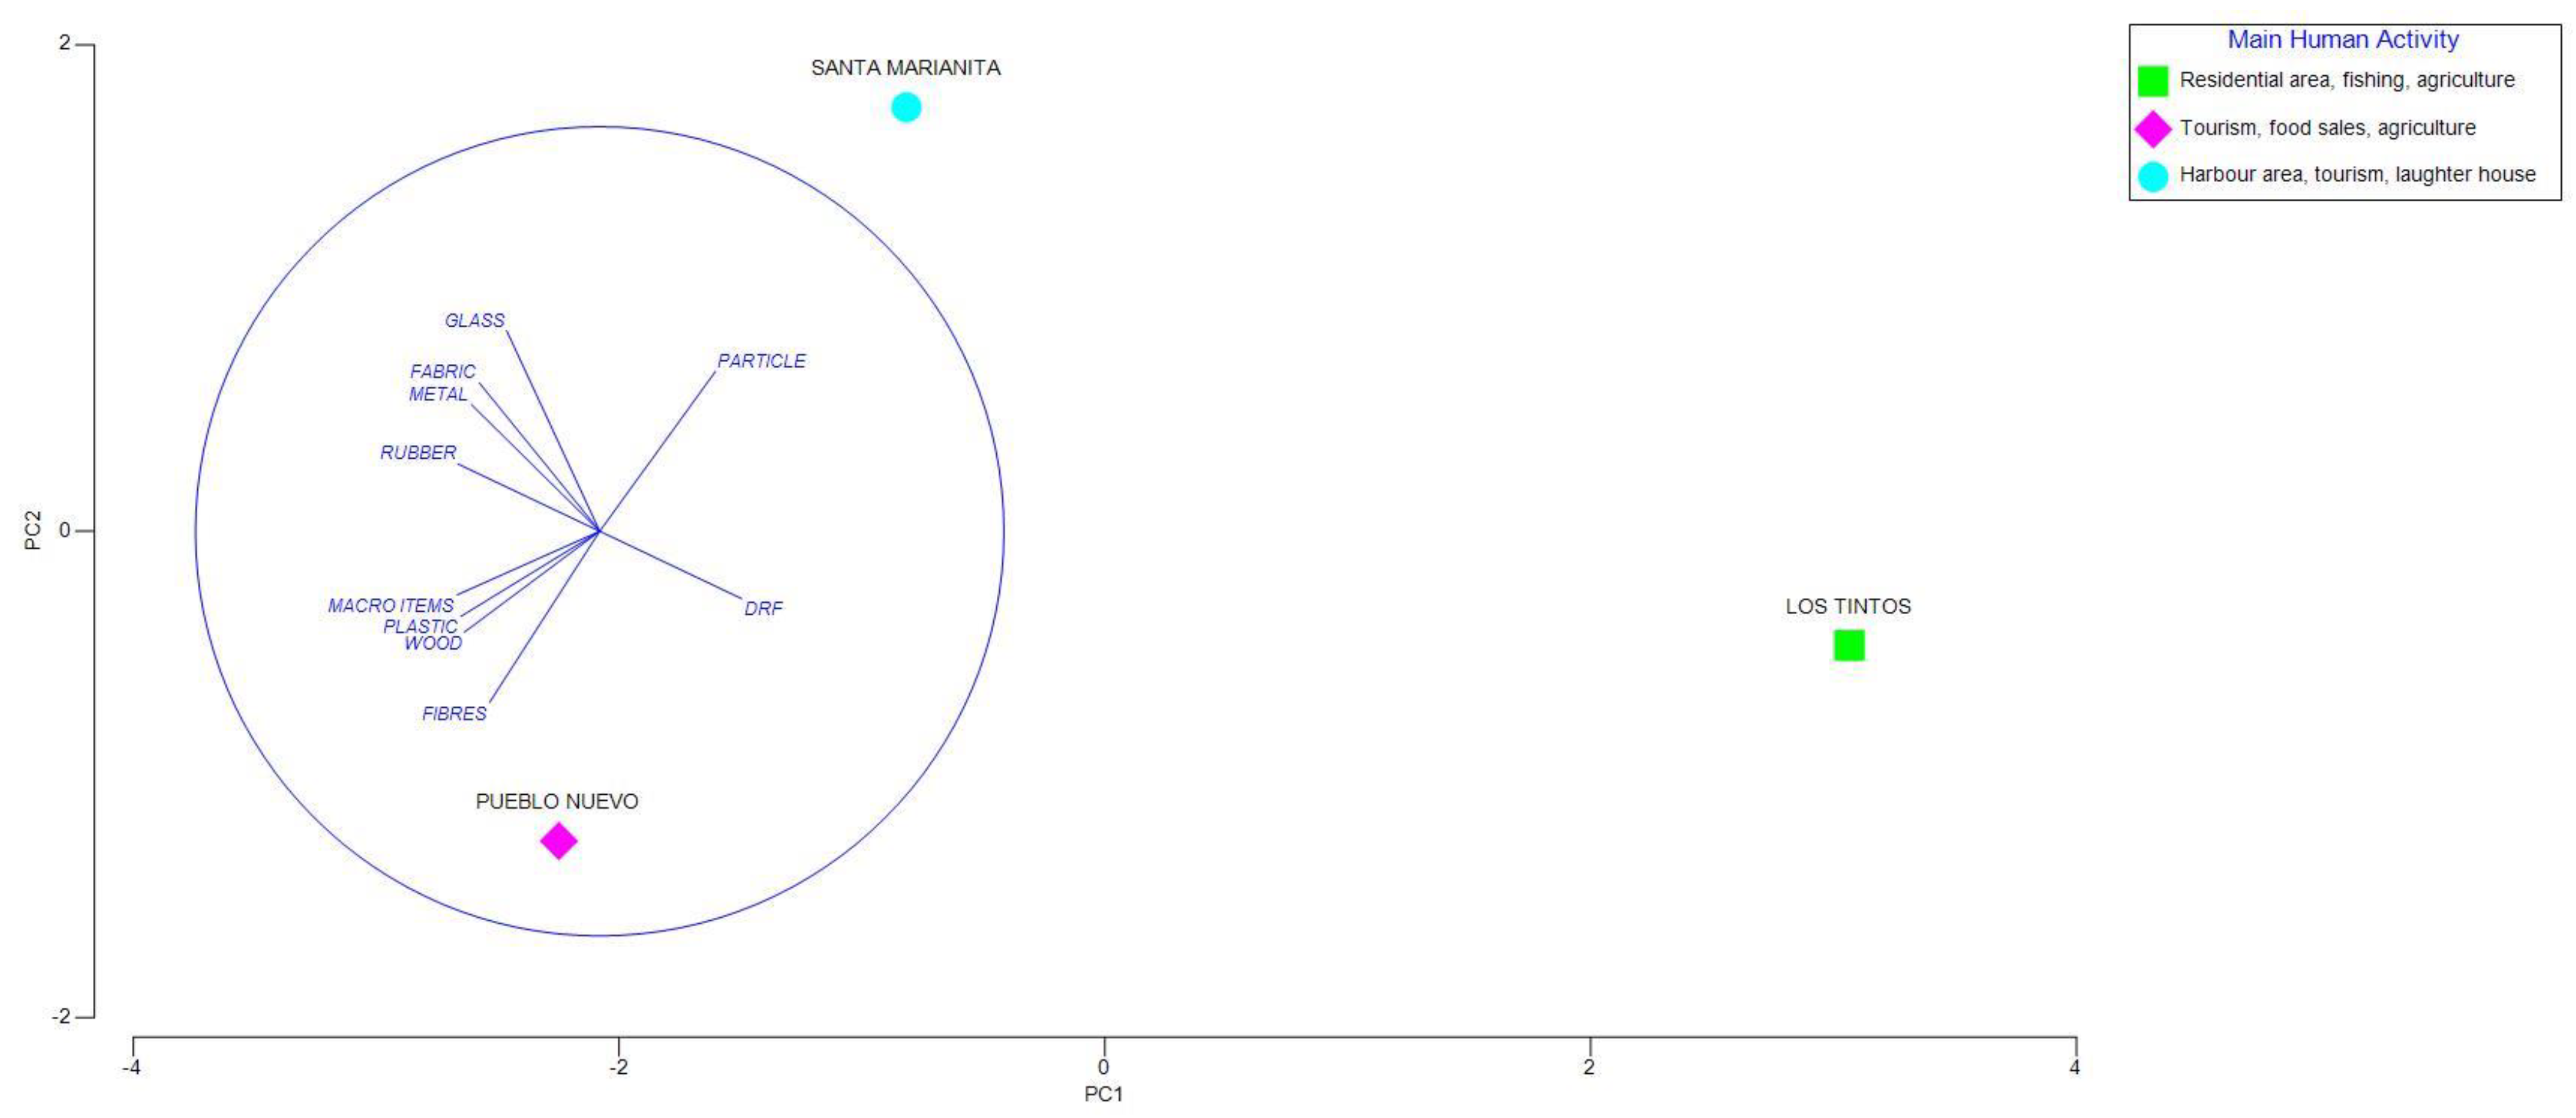
3.6. Anthropogenic Activity

Both rivers are influenced by anthropogenic activity. The greatest number of MPs and MAPs were recorded in Vinces River (74.62%) with 738 items, 418 items distributed in Pueblo Nuevo and 320 in Santa Marianita (Figure 7). Pueblo Nuevo has a small, public beach located 464 metres (m) upstream, and a slaughterhouse is situated 119 m away from Santa Marianita. Both are potential factors contributing to plastic pollution. At Los Tintos River there were low numbers of MP and MAPs (25.38%) with 251 items; this site is influenced by an unknown marine outfall and is located 212 m further upstream.
PCA analysis showed a clear difference between the studied sites. Two principal components account for 100% of the data variance. (Figure 7). The first component (PC1) explained 75.6% of the data variability, and the variables with higher incidence were macro items, rubber, direction of river flow and plastics (MAPs). The second component (PC2) explained 24.4% of the data variability and was positively correlated with glass and particles and negatively correlated with fibres (Figure 7).
The spatial patterns and abundance of plastics is determined by the direction of river flow, population and human activities according to the PCA (Figure 7). This is represented by the increase of plastics. Pueblo Nuevo’s population (17,579 inhabitants), and Santa Marianita with 65,765 inhabitants, are both influenced by activities such as recreation activities (rural and gastronomic tourism, recreational waters), agriculture, fishing, navigation, the harbour and the slaughterhouse.

4. Discussion

Plastic mass differed at all selected sampling sites, indicating various sources and environmental factors contributing to the movement of plastics in the Vinces and Los Tintos rivers. In the three study sites, the sources of contamination for MAPs and MPs were personal usage, landfill disposal, wastewater discharge, agriculture and recreational activity. In Vinces River, high concentrations of MP fibres (73%) could be related to the photodegradation and erosion caused by wind and water from PP bags settled in large quantities, which directly entered the water body. This problem has been evident since 2012 due to the presence of high levels of faecal coliforms 574.58 NMP/100 mL and suspended solids (200 mg/L) compared to the Los Tintos River (30 mg/L) [47]. Since MAPs are distributed via passive dispersion by wind and water currents [48], they are likely retained in beaches and sediment, whereas larger MAPs from low-density polymers are transported from rivers to the ocean [49]. This corresponds to the spatial distribution of plastics at Pueblo Nuevo, located 464 m downstream from a small public beach. Higher concentrations of larger size classes (>1 mm) are more prone to direct drift from wind and waves, as identified in the North Adriatic and Algerian and Eastern Levantine coast [50]. This is accountable for 89% of MAPs and 33.2% of MPs identified at this site. A high number of MP fibres were justified at all sites, originating mostly from PP sandbags (33.2%), plastic bags (23.1%), food wrappers (16.8%) and EPS cups/plates (8%) [51]. A predominance of fibres (43%) was also recorded in the province of Esmeraldas [52].
Further upstream in the Vinces River a slaughterhouse is located 119 m north of Santa Marianita, a likely factor for river contamination due to the high content of organics and nutrients resulting from the slaughtering process and cleaning of facilities [53]. The high percentage (60.6%) of MP fibres at Santa Marianita could be associated with untreated wastewater that is discharged into estuaries [54]. WWTPs are an important concern throughout Ecuador; however, the development of water supply sources has higher priority. Consequently, few WWTP incidents are reported and water quality is poor due to industrial and domestic wastewater discharge. One study reported that 61 WWTPs have been installed in the city of Guayaquil, consisting of 3926 km of sanitary sewer systems [55]. These sanitary sewer networks discharge to the Daule and Guayas rivers, whilst a separate system of storm drainage discharges into Estero Salado. In the Guayas province, 62.5% of these wastewater treatment systems flow into the rivers within the Gulf of Guayaquil, a likely cause of MPs at both the Vinces and Los Tintos rivers.
PCA analysis further determined that variables such as anthropogenic activity influenced the distribution of MAPs and MPs (Figure 7). Recreational activity heavily influenced the number of MAPs recorded amongst the sites at Vinces River. These data coincided with the National Institute of Census and Statistics of Ecuador (INEC) where it is estimated that Ecuadorians threw away 12,739 tons of garbage daily, of which 11.43% was plastic (531,461 tons), corresponding to single-use plastic, such as bags and EPS containers [56]. Human activity also correlated with the number of MPs at all three sites (Pueblo Nuevo: 396, Santa Marianita: 296, Los Tintos: 247), especially in Santa Marianita where up to 100,000 visitors have been registered in the high season, generating environmental impacts [57]. Clusters from the PCA analysis determined that population density and river flow direction influenced the composition of items recorded. At Los Tintos River, despite few litter items being recorded (7.3% plastic bags and food packaging), the greatest concentration of MPs (8.17 g−1) were recorded (Figure 3). A likely reason for this is due to increased rainfall and alongshore winds producing onshore/offshore currents (known as Ekman transport), moving debris items further downstream. Hydrographic conditions, anthropogenic activity, wastewater discharge and population density are just some factors that influence MP distribution [6,58].
MP abundance quantified between 0.15 and 2.52 mm in intertidal, very fine sandy sediment and decreased in abundance with increasing grain size [59]. Visually determining MPs from sediment grains using a stereomicroscope was sufficient in this study due to high-quality resolution easily identifying fibres and particles >0.15 mm; fractions smaller than 0.125 mm are increasingly difficult to identify and it is nearly impossible to distinguish between plastic and non-plastic debris [60]. To separate these (less dense) MPs, NaCI solution was the best method due to its cost effectiveness and having a smaller sample size [44]. The preliminary experiments to validate the NaCI extraction process were performed with weathered plastic particles of a known polymer type. The yielded recovery rates were 80% and 85% for PET and PVC particles <1 mm with densities of 1.38 and 1.3, respectively (Table 4). Particles were lost at the smaller end of the scale due to size.
It is therefore highly likely that MPs of these polymer types and size classes are underestimated in this study. An important limitation in the study was the FTIR not being available and therefore polymer identification could not be attempted. Therefore, this study relied on visual inspection as a methodological approach for initial enumeration and acknowledged the potential for selection bias [44]. The absence of data in this region means the current study provides a first assessment of plastic litter and MP contamination and contributes significantly to the efforts to improve environmental standards. Overall, more fibres were found compared to particles, with similar results observed in other studies [6,61]. To better understand potential source regions of MPs, fibre colour has been used as a proxy for polymer type [62]. The most dominant MP morphotypes at both rivers were black and blue fibres. These colours were the most prevalent in the digestive tracts of commercial fishes [23], a concern for a country that showed high MP ingestion by fish in coastal waters close to urban areas [24]. Based on our results both rivers are dominant pathways of litter and MPs, which are deposited in the ocean [63].

5. Conclusions

The Guayas province is highly industrialised and it is influenced by agriculture, fishing, navigation, animal breeding, recreational waters and the pressure of human settlements (Table 1). Levels of plastic pollution reported in this study show an increment of MAPs and MPs which increases with anthropogenic activity. MPs were the most abundant plastics in the studied sites which increased with human activities and the direction of water flow: Los Tintos 8.17 g−1, Pueblo Nuevo 7.39 g−1, Santa Marianita 5.55 g−1. MP abundance decreased as the sediment increased in grain size. Significant differences were recorded between the litter types, whereby plastic was the most abundant. The Vinces River was the most polluted river. In particular, the locality of Pueblo Nuevo accounted for a wide variety of plastic items, tyres, boots, clothing and sandbags. The plastic spatial distribution showed a major abundance in areas closest to towns that were influenced by tourism and recreational activities.
Sediments from intertidal zones presented mainly black and blue MPs, consisting more of fibres than of particles. River sediments act as a sink for MP pollutants. Consequently, the downstream river flow is discharging plastics into the SE Pacific Ocean. Establishing a plastic waste monitoring program by applying the techniques used in this study can be undertaken efficiently and at low cost and can be easily managed. Economic sanctions should be implemented for owners of restaurants and businesses associated with providing tourist services, especially focusing on the management of solid waste and residual water articulated by the Ministry of Tourism and Environment. Educating the local community on reducing their plastic use and implementing alternatives is essential to combating plastic pollution in Ecuador. This baseline study will provide data towards future environmental education projects.

Author Contributions

Conceptualization, M.G.J.H. and R.T.; methodology, M.G.J.H. and R.T.; software, M.G.J.H. and M.C.-C.; validation, M.G.J.H.; formal analysis, M.G.J.H. and B.P.; investigation, R.T., M.C.-C., F.L. and G.C.; resources, F.L. and G.C.; data curation, R.T.; writing—original draft preparation, R.T.; writing—review and editing, M.C.-C. and J.M.M.; visualization, J.M.M.; supervision, M.G.J.H. and M.C.-C.; project administration, M.G.J.H.; funding acquisition, M.U. All authors have read and agreed to the published version of the manuscript.

Funding

This research received no external funding.

Institutional Review Board Statement

Not applicable.

Informed Consent Statement

Not applicable.

Acknowledgments

The authors wish to acknowledge the students Miguel Barrera, from the Faculty of Chemical Engineering at the University of Guayaquil, and Miguel Triviño from Environment Division-Bioelite for their assistance in collating data in the field. We also appreciated the collaboration of Mónica Prado for the facilities in the microscopy room of The National Fishing Institute of Ecuador. We are grateful to professors and authorities from the Faculty of Chemical Engineering at the University of Guayaquil for supporting facilities, and the water quality laboratory for work in Ecuador and Heriot-Watt University in the United Kingdom. Finally, we thank the Ministry of Environment in Ecuador (Subsecretaría de Gestión Marina Costera) for giving permission to carry out this research.

Conflicts of Interest

The authors declare no conflict of interest.

References

  1. Chilton, D.; Hamilton, D.P.; Nagelkerken, I.; Cook, P.; Hipsey, M.R.; Reid, R.; Sheaves, M.; Waltham, N.J.; Brookes, J. Environmental Flow Requirements of Estuaries: Providing Resilience to Current and Future Climate and Direct Anthropogenic Changes. Front. Environ. Sci. 2021, 9, 534. [Google Scholar] [CrossRef]
  2. Subhankar, C.; Shivika, S. Microplastics in Our Oceans and Marine Health. Available online: http://journals.openedition.org/factsreports/5257 (accessed on 5 January 2021).
  3. Blumenröder, J.; Sechet, P.; Kakkonen, J.E.; Hartl, M.G.J. Microplastic Contamination of Intertidal Sediments of Scapa Flow, Orkney: A First Assessment. Mar. Pollut. Bull. 2017, 124, 112–120. [Google Scholar] [CrossRef] [PubMed]
  4. Martin, J.; Lusher, A.; Thompson, R.C.; Morley, A. The Deposition and Accumulation of Microplastics in Marine Sediments and Bottom Water from the Irish Continental Shelf. Sci. Rep. 2017, 7, 10772. [Google Scholar] [CrossRef] [Green Version]
  5. Amelia, T.S.M.; Khalik, W.M.A.W.M.; Ong, M.C.; Shao, Y.T.; Pan, H.J.; Bhubalan, K. Marine Microplastics as Vectors of Major Ocean Pollutants and its Hazards to the Marine Ecosystem and Humans. Prog. Earth Planet Sci. 2021, 8, 12. [Google Scholar] [CrossRef]
  6. Thevenon, F.; Carroll, C.; Sousa, J. Plastic Debris in the Ocean. The Characterization of Marine Plastics and their Environmental Impacts, Situation Analysis Report. In International Union for Conservation of Nature Global Marine and Polar Programme (IUCN); IUCN: Gland, Switzerland, 2014; p. 55. [Google Scholar] [CrossRef] [Green Version]
  7. Van Sebille, E.; Wilcox, C.; Lebreton, L.; Maximenko, N.; Hardesty, B.D.; Van Franeker, J.A.; Eriksen, M.; Siegel, D.; Galgani, F.; Law, K.L. A Global Inventory of Small Floating Plastic Debris. Environ. Res. Lett. 2015, 10, 12. [Google Scholar] [CrossRef]
  8. Galloway, T.S.; Cole, M.; Lewis, C. Interactions of Microplastic Debris throughout the Marine Ecosystem. Nat. Ecol. Evol. 2017, 116, 1–8. [Google Scholar] [CrossRef]
  9. Hitchcock, J.N.; Mitrovic, S.M. Microplastic Pollution in Estuaries across a Gradient of Human Impact. Environ. Pollut. 2019, 247, 457–466. [Google Scholar] [CrossRef]
  10. Phuong, N.N.; Duong, T.T.; Quynh Le, T.P.; Hoang, T.K.; Ngo, H.M.; Phuong, N.A.; Pham, Q.T.; Doan, T.O.; Ho, T.C.; Le, N.D.; et al. Microplastics in Asian Freshwater Ecosystems: Current Knowledge and Perspectives. Sci. Total Environ. 2022, 808, 151989. [Google Scholar] [CrossRef] [PubMed]
  11. Zhang, H. Transport of Microplastics in Coastal Seas. Estuar. Coast. Shelf Sci. 2017, 199, 74–86. [Google Scholar] [CrossRef]
  12. Gross, M. Oceans of Plastic Waste. Curr. Biol. 2015, 25, 93–96. [Google Scholar] [CrossRef] [Green Version]
  13. Galgani, F.; Ryan, P.G.; Reisser, J. Plastic Pollution in the World’s Oceans: More than 5 Trillion Plastic Pieces Weighing over 250,000 Tons Afloat at Sea. PLoS ONE 2014, 12, 165–173. [Google Scholar] [CrossRef] [Green Version]
  14. Jambeck, J.R.; Geyer, R.; Wilcox, C.; Siegler, T.R.; Perryman, M.; Andrady, A.; Narayan, R.; Law, K.L. Plastic Waste Inputs from Land into the Ocean. Science 2015, 347, 768–771. [Google Scholar] [CrossRef] [PubMed]
  15. Sadri, S.S.; Thompson, R.C. On the Quantity and Composition of Floating Plastic Debris Entering and Leaving the Tamar Estuary, Southwest England. Mar. Pollut. Bull. 2014, 81, 55–60. [Google Scholar] [CrossRef] [PubMed]
  16. Eriksen, M.; Maximenko, N.; Thiel, M.; Cummins, A.; Lattin, G.; Wilson, S.; Hafner, J.; Zellers, A.; Rifman, S. Plastic Pollution in the South Pacific Subtropical Gyre. Mar. Pollut. Bull. 2013, 68, 71–76. [Google Scholar] [CrossRef] [PubMed]
  17. Mcgoran, A.; Morritt, D.; Clark, P.F.; Cowie, P.R.; McEvoy, J.P. Ingestion of plastic by fish: A comparison of Thames Estuary and Firth of Clyde populations. Mar. Pollut. Bull. 2018, 137, 12–23. [Google Scholar] [CrossRef] [Green Version]
  18. Collard, F.; Gilbert, B.; Compère, P.; Eppe, G.; Das, K.; Jauniaux, T.; Parmentier, E. Microplastics in Livers of European Anchovies (Engraulis encrasicolus, L.). Environ. Pollut. 2017, 229, 1000–1005. [Google Scholar] [CrossRef]
  19. Vendel, A.L.; Bessa, F.; Alves, V.E.N.; Amorim, A.L.A.; Patrício, J.; Palma, A.R.T. Widespread Microplastic Ingestion by Fish Assemblages in Tropical Estuaries Subjected to Anthropogenic Pressures. Mar. Pollut. Bull. 2017, 117, 448–455. [Google Scholar] [CrossRef]
  20. Bruge, A.; Barreau, C.; Carlot, J.; Collin, H.; Moreno, C.; Maison, P. Monitoring Litter Inputs from the Adour River (Southwest France) to the Marine Environment. J. Mar. Sci. Eng. 2018, 6, 24. [Google Scholar] [CrossRef] [Green Version]
  21. Naidoo, T.; Glassom, D.; Smit, A.J. Plastic Pollution in Five Urban Estuaries of KwaZulu-Natal, South Africa. Mar. Pollut. Bull. 2015, 101, 473–480. [Google Scholar] [CrossRef]
  22. Wu, C.; Zhang, K.; Xiong, X. Microplastic Pollution in Inland Waters Focusing on Asia. In Freshwater Microplastics: The Handbook of Environmental Chemistry, 58; Springer: Cham, Switzerland, 2018. [Google Scholar] [CrossRef] [Green Version]
  23. Costa, M.F.; Barletta, M. Microplastics in Coastal and Marine Environments of the Western Tropical and Sub-Tropical Atlantic Ocean. Environ. Sci. Process. Impacts 2015, 17, 1868–1879. [Google Scholar] [CrossRef]
  24. Ory, N.; Chagnon, C.; Felix, F.; Fernández, C.; Ferreira, J.L.; Gallardo, C.; Ordóñez, O.G.; Henostroza, A.; Laaz, E.; Mizraji, R.; et al. Low Prevalence of Microplastic Contamination in Planktivorous Fish Species from the Southeast Pacific Ocean. Mar. Pollut. Bull. 2018, 127, 211–216. [Google Scholar] [CrossRef]
  25. Figueroa-Pico, J.; Mero del Valle, D.; Castillo, R.; Macias-Mayorga, D. Marine debris: Implications for conservation of rocky reefs in Manabi, Ecuador (Se Pacific Coast). Mar. Pollut. Bull. 2016, 109, 7–13. [Google Scholar] [CrossRef] [PubMed]
  26. Mestanza, C.; Botero, C.M.; Anfuso, G.; Chica-Ruiz, J.A.; Pranzini, E.; Mooser, A. Beach Litter in Ecuador and the Galapagos islands: A Baseline to Enhance Environmental Conservation and Sustainable Beach Tourism. Mar. Pollut. Bull. 2019, 140, 573–578. [Google Scholar] [CrossRef] [PubMed]
  27. Gaibor, N.; Condo-Espinel, V.; Cornejo-Rodríguez, M.H.; Darquea, J.; Pernia, B.; Domínguez, G.; Briz, M.E.; Márquez, L.; Laaz, E.; Alemán-Dyer, C.; et al. Composition, Abundance and Sources of Anthropogenic Marine Debris on the Beaches from Ecuador—A volunteer-supported study. Mar. Pollut. Bull. 2020, 154, 111068. [Google Scholar] [CrossRef] [PubMed]
  28. Tercera Comunicación Nacional del Ecuador a la Convención Marco de las Naciones Unidas sobre el Cambio Climático. Available online: https://www.academia.edu/35703383/Tercera_Comunicaci%C3%B3n_Nacional_del_Ecuador_a_la_Convenci%C3%B3n_Marco_de_las_Naciones_Unidas_sobre_el_Cambio_Clim%C3%A1tico (accessed on 20 March 2022).
  29. Constitución de la República del Ecuador. Available online: https://www.oas.org/juridico/pdfs/mesicic4_ecu_const.pdf (accessed on 20 October 2022).
  30. Código Orgánico del Ambiente (COA). Registro Oficial de la República del Ecuador, Suplemento No. 983, Quito, Ecuador. Available online: http://www.ambiente.gob.ec/wp-content/uploads/downloads/2018/01/CODIGO_ORGANICO_AMBIENTE.pdf (accessed on 20 June 2022).
  31. Jara-Samaniego, J.; Moral, M.R.; Perez-Murcia, D.; Parades, C.; Galvez-Sola, L.; Gavilanes-Teran, I.; Bustamante, M.A. Urban Waste Management and Potential Agricultural Use in South American Developing Countries: A Case Study of Chimborazo Region (Ecuador). Commun. Soil Sci. Plant Anal. 2016, 46, 157–169. [Google Scholar] [CrossRef]
  32. INEC 2010. Fascículo Provincial Guayas. Available online: https://www.ecuadorencifras.gob.ec/wp-content/descargas/Manu-lateral/Resultados-provinciales/guayas.pdf (accessed on 20 January 2022).
  33. Plan de Desarrollo de la Provincia del Guayas 2012–2021. Available online: https://studylib.es/doc/5697708/plan-de-desarrollo-de-la-provincia-del-guayas-2012 (accessed on 23 June 2022).
  34. Chinacalle-Martinez, N.; Garcia-Rada, E.; Lopez-Macias, J.; Pinoargote, S.; Loor, G.; Zevallos-Rosado, J.; Cruz, P.; Pablo, D.; Andrade, B.; Robalino-Mejia, C.; et al. Oceanic Primary Production Trend Patterns Along Coast of Ecuador. Neotrop. Biodivers. 2021, 7, 379–391. [Google Scholar] [CrossRef]
  35. Damanik-Ambarita, M.N.; Lock, K.; Boets, P.; Everaert, G.; Nguyen, T.H.T.; Forio, M.A.E.; Musonge, P.L.S.; Suhareva, N.; Bennetsen, E.; Landuyt, D.; et al. Ecological Water Quality Analysis of the Guayas River Basin (Ecuador) Based on Macroinvertebrates Indices. Limnologica 2016, 57, 27–59. [Google Scholar] [CrossRef]
  36. Hidalgo, M.E.A. A Decision Framework for Integrated Wetland-River Basin Management in a Tropical and Data Scarce Environment; CRC Press: Boca Raton, FL, USA, 2012. [Google Scholar] [CrossRef]
  37. Castro, B. The Guayas River Basin. Guayaquil. Available online: http://repositorio.educacionsuperior.gob.ec/bitstream/28000/1039/1/T-SENESCYT-0415.pdf (accessed on 20 June 2022).
  38. Ecured. Cantόn Vinces (Ecuador). Available online: https://www.ecured.cu/Cantόn_Vinces_(Ecuador) (accessed on 20 July 2022).
  39. Ilbay Yupa, M.L.; Ruiz Depablos, J.L.; Cueva Jaramillo, E.G.; Ortiz Bustamante, V.M.; Morales Alarco, D.O. Empirical Model for Estimating the Ecological Footprint in Ecuador Based on Demographic, Economic and Environmental Indicators. J. Ecol. Eng. 2021, 22, 59–67. [Google Scholar] [CrossRef]
  40. Desarrollo y Problemática Ambiental del Área del Golfo de Guayaquil. Available online: https://books.google.com.sv/books/about/Desarrollo_y_problem%C3%A1tica_ambiental_del.html?id=fQJjAAAAMAAJ&utm_source=gb-gplus-shareDesarrollo (accessed on 5 May 2022).
  41. Owens, K.A.; Divakaran Sarasamma, J.; Conlon, K.; Kiruba, S.; Biju, A.; Vijay, N.; Subramanian, M.; Asok Vijayamma, S.; Jayadev, A.; Hoon, V.; et al. Empowering Local Practitioners to Collect and Report on Anthropogenic Riverine and Marine Debris Using Inexpensive Methods in India. Sustainability 2022, 14, 1928. [Google Scholar] [CrossRef]
  42. Lippiatt, S.; Opfer, S.; Arthur, C. Marine Debris Monitoring and Assessment: Recommendations for Monitoring Debris Trends in the Marine Environment. In NOAA Technical Memorandum NOS-OR&R-46; NOAA Marine Debris Division: Silver Spring, MD, USA, 2013; p. 82. [Google Scholar] [CrossRef]
  43. GESAMP. Guidelines for the Monitoring and Assessment of Plastic Litter and Microplastics in the Ocean; Kershaw, P.J., Turra, A., Galgani, F., Eds.; IMO/FAO/UNESCO-IOC/UNIDO/WMO/IAEA/UN/UNEP/UNDP/ISA Joint Group of Experts on the Scientific Aspects of Marine Environmental Protection: London, UK, 2019; Volume 99, p. 130. [Google Scholar]
  44. Hidalgo-Ruz, V.; Gutow, L.; Thompson, R.C.; Thiel, M. Microplastics in the Marine Environment: A Review of the Methods Used for Identification and Quantification. Environ. Sci. Technol. 2012, 46, 3060–3075. [Google Scholar] [CrossRef]
  45. R Core Team. R: A Language and Environment for Statistical Computing. In R Foundation for Statistical Computing; European Environment Agency: Vienna, Austria, 2017. [Google Scholar]
  46. Clarke, K.R.; Gorley, R.N. Getting Started with PRIMER v7; PRIMER-E: Plymouth, UK, 2015; Volume 20, p. 192. [Google Scholar]
  47. Determinación de la Calidad del Río Babahoyo, Informe Técnico no Publicado. Available online: file:///C:/Users/MDPI/Downloads/INFORMEBABAHOYO03DEAGOSTODEL2012-1.pdf (accessed on 23 June 2022).
  48. Lechthaler, S.; Waldschläger, K.; Stauch, G.; Schüttrumpf, H. The Way of Macroplastic through the Environment. Environments 2020, 2, 73. [Google Scholar] [CrossRef]
  49. Graca, B.; Szewc, K.; Zakrzewska, D.; Dołęga, A.; Szczerbowska-Boruchowska, M. Sources and Fate of Microplastics in Marine and Beach Sediments of the Southern Baltic Sea—A Preliminary Study. Environ. Sci. Pollut. Res. 2017, 24, 7650–7661. [Google Scholar] [CrossRef] [PubMed] [Green Version]
  50. Tsiaras, K.; Hatzonikolakis, Y.; Kalaroni, S.; Pollani, A.; Triantafyllou, G. Modeling the Pathways and Accumulation Patterns of Micro- and Macro-Plastics in the Mediterranean. Front. Mar. Sci. 2021, 8, 743117. [Google Scholar] [CrossRef]
  51. Akkajit, P.; Thongnonghin, S.; Sriraksa, S.; Pumsri, S. Preliminary Study of Distribution and Quantity of Plastic-debris on Beaches Along the Coast at Phuket Province. App. Envi. Res. 2019, 41, 54–62. [Google Scholar] [CrossRef]
  52. Capparelli, M.V.; Molinero, J.; Moulatlet, G.M.; Barrado, M.; Prado-Alcívar, S.; Cabrera, M.; Gimiliani, G.; Ñacato, C.; Pinos-Velez, V.; Cipriani-Avila, I. Microplastics in Rivers and Coastal Waters of the Province of Esmeraldas, Ecuador. Mar. Pollut. Bull. 2021, 173, 113067. [Google Scholar] [CrossRef]
  53. Bustillo-Lecompte, C.; Mehrvar, M. Slaughterhouse Wastewater: Treatment, Management and Resource Recovery. Phys. Chem. Wastewater Treat. Resour. Recovery 2017, 8, 153–174. [Google Scholar] [CrossRef]
  54. Haddout, S.; Gimiliani, G.; Priya, K.L.; Hoguane, A.; Casila, J.C.; Ljubenkov, I. Microplastics in Surface Waters and Sediments in the Sebou Estuary and Atlantic Coast, Morocco. Anal. Lett. 2021, 66, 256–268. [Google Scholar] [CrossRef]
  55. Alcivar, M.S.G.; Pérez, A.V.; Gilert, B.I.C.; Gámez, M.R. Zeolite in Wastewater Decontamination as a Local Development Solution. Int. J. Life Sci. 2017, 3, 1–13. [Google Scholar] [CrossRef]
  56. Instituto Nacional de Estadística y Censos (INEC). Documento Metodológico de la Estadística de Información Ambiental Económica en Gobiernos Autónomos Descentralizados Municipales; GAD Munic: Quito, Ecuador, 2018. [Google Scholar]
  57. Vera, W. Determinación de la Capacidad de Carga Turística del Balneario de Agua Dulce Santa Marianita, Canton Salitre para el Desarrollo Sostenible del Sector. 2017. Available online: http://repositorio.ug.edu.ec/handle/redug/18397 (accessed on 15 June 2022).
  58. Astudillo, J.; Bravo, M.; Dumont, C.; Thiel, M. Detached Aquaculture Buoys in the SE Pacific: Potential Dispersal Vehicles for Associated Organisms. Aquat. Biol. 2009, 5, 219–231. [Google Scholar] [CrossRef] [Green Version]
  59. Vermeiren, P.; Lercari, D.; Munoz, C.C.; Ikejima, K.; Celentano, E.; Jorge-Romero, G.; Defeo, O. Sediment Grain Size Determines Microplastic Exposure Landscapes for Sandy Beach Macroinfauna. Environ. Pollut. 2021, 286, 117308. [Google Scholar] [CrossRef]
  60. Blair, R.M.; Waldron, S.; Phoenix, V.R.; Gauchotte-Lindsay, C. Microscopy and Elemental Analysis Characterisation of Microplastics in Sediment of a Freshwater Urban River in Scotland, UK. Environ. Sci. Pollut. Res. 2019, 26, 12491–12504. [Google Scholar] [CrossRef] [PubMed] [Green Version]
  61. Alomar, C.; Estarellas, F.; Deudero, S. Microplastics in the Mediterranean Sea: Deposition in Coastal Shallow Sediments, Spatial Variation and Preferential Grain Size. Mar. Environ. Res. 2016, 115, 1–10. [Google Scholar] [CrossRef] [PubMed]
  62. Shim, W.J.; Hong, S.H.; Eo, S.E. Identification Methods in Microplastics Analysis: A Review. Anal. Methods 2017, 9, 1384–1391. [Google Scholar] [CrossRef]
  63. Lebreton, L.; Slat, B.; Ferrari, F.; Sainte-Rose, B.; Aitken, J.; Marthouse, R.; Hajbane, S.; Cunsolo, S.; Schwarz, A.; Levivier, A.; et al. Evidence that the Great Pacific Garbage Patch is Rapidly Accumulating Plastic. Sci. Rep. 2018, 8, 4666. [Google Scholar] [CrossRef] [PubMed]
Figure 1. Sample points in Vinces and Los Tintos Rivers.
Microplastics 01 00045 g001
Figure 2. Photographs taken during microplastic sediment sampling; (a) transect line laid over plastic litter, (b) control placed next to the sampling station, (c) glass vial pushed into the sediment, (d) three replicate samples, sealed and labelled ready for analysis.
Microplastics 01 00045 g002
Figure 3. Abundance and distribution of microplastics and macroplastics in the sediments of study sites in Guayas Province, Ecuador. Percentage distribution of debris items recorded by sites.
Microplastics 01 00045 g003
Figure 4. Mean microplastics recorded; (a) per gram of sediment−1 at each sampling station (ArcGIS, version 10.6), (b) fibre and particle abundance per gram of sediment (g−1) across all sampling stations (±SE, n = 3).
Microplastics 01 00045 g004
Figure 5. Coloured fibres recovered from microscopic analysis (Mean ± SE; black n = 27; white n = 21; red n = 25; blue n = 22; green n = 10; yellow n = 1).
Microplastics 01 00045 g005
Figure 6. Photographic evidence of a few microplastic fragments identified during microscopic analysis (recording each site and station); (a) yellow plastic fibre: A1 (2.522 mm), (b) green plastic fibre: A2 (5.434 mm), (c) shiny plastic particle: A3 (0.576 mm), (d) red plastic particle: B2 (0.326 × 0.289 mm), (e) black plastic fibre: B2 (6.233 mm), (f) unknown crustacean (3.168 × 2.982 mm) with blue plastic fibre: B3 (0.878 mm), (g) blue plastic fibre: C2 (4.166 mm), (h) red/blue plastic particle: C3 (0.291 mm), (i) shiny plastic particle: C1 (0.490 mm), (j) blue plastic fibre in contamination control filters (1.902 mm), (k) dark plastic particle: C1 (0.616 mm), (l) blue non-plastic fibre: C3 (1.055 m).
Microplastics 01 00045 g006
Figure 7. The correlation of the three study sites is represented using Principal component analysis (PCA) and explains 100% of the variance within the data set.
Microplastics 01 00045 g007
Table 1. Main characteristics of sampling sites.
Pueblo NuevoSanta MarianitaLos Tintos
Latitude1°49′31′′ S1°49′16′′ S1°52′29′′ S
Longitude79°48′9′′ W79°48′14′′ W79°51′42′′ W
AspectNorth-EastNorthSouth-East
LocationSuburban townRural/suburban villageSuburban town
Major usageRecreation and agricultureBoatsRecreation, agriculture and fishing
River nameVinces riverVinces riverLos Tintos river
Water flow directionEastSouth-EastSouth-West
Landward limitStreet (tyres used as barriers along shore)Boat rampVegetation
DescriptionResidential area, vehicle and boat activity, used for fishing and agricultureFew residences surrounding riverside, small harbour area, canoe and boat accessVery residential, regular boat traffic, heavy fishing and agricultural use
Nearest landmarks Beach and restaurants SlaughterhouseBridge, shops, restaurants, residences
Table 2. Details of macro items and microplastics (fibres and particles) recorded in sediments of Vinces and Los Tintos rivers.
RiverTotal MAPsMacro Average (Items/m2)No of Black FibresNo of White FibresNo of Red FibresNo of Blue Fibres No of Green Fibres No of Yellow Fibres No of Particles Size Classes (mm)MPs (Item g−1)Total Items (MAPS + MPs)
Vinces River: Pueblo Nuevo2139.17627152941540.43–2.527.39419
Vinces River: Santa Marianita983.52592221288 840.25–0.355.55320
Los Tintos River: Los Tintos25152921532 890.15–0.618.17251
Table 3. Grain size analysis of sediment sampled at each site.
phi (Φ)mmPueblo Nuevo
(%)
Santa Marianita
(%)
Los Tintos
(%)
Granules−120.250.360.08
V. coarse sand010.570.220.05
Coarse sand10.51.630.470.35
Medium sand1.50.313.023.741.65
Fine sand20.258.493.652.58
V. fine sand30.12548.2565.5070.27
Silt clay3.50.06327.8026.0625.02
100100100
Table 4. Microplastic polymer types, and rates of recovery.
Sample IDPolymer *DensitySizeColourSample 1Sample 2Sample 3AverageNotes
3(1-3)LDPE0.93500–710 µmwhite89959091 (±3)
5(1-3)PVC1.3<100 µmwhite0000too small
12(1-3)PVC ≤1 mmGrey60909080 (±17)
4(1-3)PET1.382 mmGrey100100100100did not float/easy to see
6(1-3)PET 3 mmWhite100100100100did not float/easy to see
7(1-3)PET1.38<1 mmWhite90609080 (±17)
10(1-3)PET1.381–2 mmGrey907010086 (±15)
8(1-3)HDPE0.97<1 mmWhite100909093 (±5)
9(1-3)PP0.9461–2 mmRed8010010093 (±11)
11(1-3)PS1.041–2 mmBlack1001008093 (±11)
* LDPE: Low Density Polyethylene; PVC: Polyvinyl Chloride; PET: Polyethylene Tetraphthalate; HDPE: High Density Polyethylene; PP: Polypropylene; PS: Polystyrene.
Publisher’s Note: MDPI stays neutral with regard to jurisdictional claims in published maps and institutional affiliations.

