Article

Effects of Silica Fume and Micro Silica on the Properties of Mortars Containing Waste PVC Plastic Fibers

by
Rawa Ahmed Mahmood
* and
Niyazi Ugur Kockal
Department of Civil Engineering, Akdeniz University, Antalya Tr-07058, Turkey
*
Author to whom correspondence should be addressed.
Microplastics 2022, 1(4), 587-609; https://doi.org/10.3390/microplastics1040041
Submission received: 30 July 2022 / Revised: 7 September 2022 / Accepted: 1 October 2022 / Published: 7 October 2022
(This article belongs to the Collection Current Opinion in Microplastics)

Abstract

:
Investigations on the usability of waste plastics as a new generation of construction materials have become one of the main concerns of researchers and engineers in recent decades. Waste plastics can be used either as aggregate replacement or as fiber reinforcement to enhance the properties of cementitious mixtures. This study focuses on the properties of waste PVC fiber-reinforced mortars containing silica fume and micro silica. Plastic fibers were added to the mortar mixes by volume fractions of 0%, 1%, 2%, and 3%. Cement was replaced by micro silica and silica fume by 5%, 10%, and 15% by weight of cement, respectively. In total, 28 different groups of mortars were produced. The results showed an enhanced ductility and deformation behavior of mortars upon the addition of waste PVC plastic fibers. It can be seen that fibers restricted crack propagation and maintained integrity, hence improving the ductility of the mortars. On the other hand, the addition of fibers led to a reduction in the physical and mechanical properties of the mortar samples. The compressive strength of the mortar samples decreased gradually by increasing the fiber content. Cement replacement by silica fume improved mechanical and microstructural properties of the mortars. The results also demonstrated that silica fume significantly decreased the porosity and water absorption capacity of mortar samples.

Graphical Abstract

1. Introduction

Continuous use of many different types of plastics, especially in recent decades, has a huge effect on the pollution of the environment. Plastic utilization gained popularity due to some favorable properties of plastics such as high strength-to-weight ratio, low density, and high durability [1]. The most common applications of plastics are bottles, food packages, house equipment, industrial products, etc. Reports show that in 2020, plastic production in the world had reached about 367 million tonnes, whereas in 2016, it was about 335 million tonnes. In 2020 the collected plastic wastes to be treated in EU27 + 3 amounted to 29.5 million tons; out of this amount, 42% was energy recovered, 34.6% was recycled and 23.4% was landfilled [2]. The rate of landfilling of plastic wastes is still in high amounts and needs to be reduced more to minimize its crucial damage to the environment, since it takes thousands of years for biodegradation to occur [3]. Studies have been conducted to reduce the hazardous environmental effects of waste plastics by reusing or recycling them. Waste plastics have been used in the construction industry as new construction materials such as aggregate replacement (coarse or fine) or fiber in the production of cementitious mixtures [4,5]. Cementitious materials perform well under compression force; however, they are considered to be weak under tensile force. The brittleness of cement-based materials, due to their rigid body, causes crack propagation and deformation when exposed to forces. Mechanical properties of cementitious mixtures such as tensile strength, low energy absorption, and weak cracking resistance can be enhanced with the use of fibers. In recent years, many different types of waste plastic fibers such as polyethylene terephthalate (PET), polyvinyl chloride (PVC), polypropylene (PP), and many others have been used as fiber reinforcement in the production of cement-based mixtures.
The type and length of plastic fibers are two of the main factors that affect the deformation behavior of cement-based materials. In a study, it was revealed that long fibers perform better in reducing crack width than shorter ones, and it was also reported that deformed fibers show better performance over straight ones [6]. It is reported that using plastic fibers with greater tensile strength can develop the strength of the matrix [7]. The bending capacity of concrete is improved by the addition of plastic fiber. Specimens incorporating plastic fiber had less crack propagation and had failure after reaching maximum load while normal concrete failed and broke into two pieces at the ultimate load [8]. The toughness of concrete reinforced with shredded PET bottles was considerably improved due to the “O”-shaped PET fibers which played a good role in bonding concrete on each side of a cracked section [9]. The ductility of concrete, which is a big parameter while considering the sustainability of cementitious materials, can also be improved with the addition of fibers. The toughness of concrete was increased by about 321% upon the addition of waste plastic fiber compared to plain concrete. The incorporation of waste plastic fiber further improved the deformation behavior of concrete [10]. Suksiripattanapong et al. [11] investigated the effects of the combination of virgin PP and recycled PP on the properties of concrete. The authors stated an enhancement in mechanical properties such as compressive strength, flexural strength, and toughness for specimens containing plastic fiber in comparison to the reference specimens. In another study conducted by Suksiripattanapong et al. [12], the utilization of HDPE waste plastic fiber in asphalt concrete pavement has been observed to be effective in improving the pavement age of asphalt concrete pavement. The specimen containing 5% (by aggregate weight) of waste HDPE fiber had maximum pavement age [12].
Incorporation of industrial wastes such as silica fume (SF), steel slag powder (SSP), and glass powder (GP) as supplementary cementitious materials (SCM) in the cementitious mixtures leads to the improvement in mechanical, microstructural, and durability-related properties of the mixtures [13,14,15]. Furthermore, the utilization of industrial wastes in cementitious mixtures plays a positive role in protecting natural resources and reducing the cost of the mixture as well as protecting the environment from pollution [13]. Silica fume plays an essential role in improving the strength of the cementitious materials, since it causes the formation of calcium silicate hydrate (CSH), which is an important byproduct in terms of strength [16]. Fallah and Nematzadeh [17] reported that silica fume could improve the compressive strength and tensile strength by 41.1% and 28.4% with 12% and 10% of silica fume, respectively. Mastali and Dalvand [18] indicated that cement replacement with silica fume could increase the first crack impact resistance and the ultimate crack impact resistance by 40% and 36.40%, respectively. The authors also reported an improvement in first and ultimate crack impact resistance with polypropylene (PP) fiber reinforcement.
Although studies have been conducted regarding the use of waste plastic fibers in cementitious mixtures, plastic fibers have not been used in the received form. In the current research, the PVC fibers were used as industrial waste, and no chemical or physical modifications were made to them. The main focus was to use the PVC fibers in their waste form as a reinforcement material to investigate their effects on various properties of the mortar. Furthermore, in this study, industrial byproducts such as silica fume (SF) and micro silica have been used as cement replacement separately, which is another significant aim of this study to reduce the CO2 emission caused by cement production. This research will encourage the utilization of waste plastics to be used as fiber reinforcement in cementitious mixtures, which will lead to the reduction in the environmental pollution caused by the landfill disposal and incineration of waste plastics. In this study waste, PVC plastic fibers were used as reinforcement material. It aimed to develop the mechanical properties and ductility of cementitious mixtures so that the effects of waste PVC plastic fiber on the physical, mechanical, microstructural, and durability-related properties of the reinforced mortars could be investigated.

2. Materials and Methods
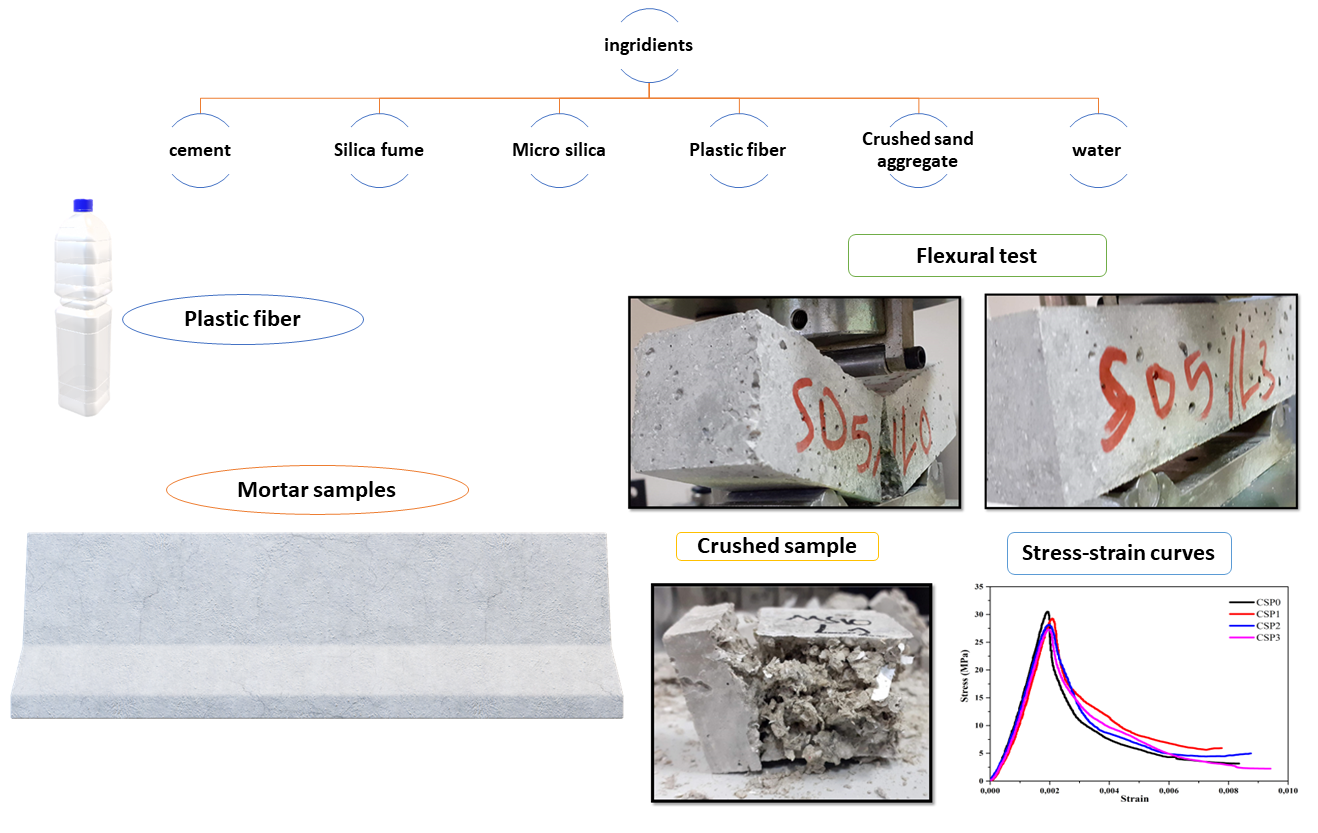
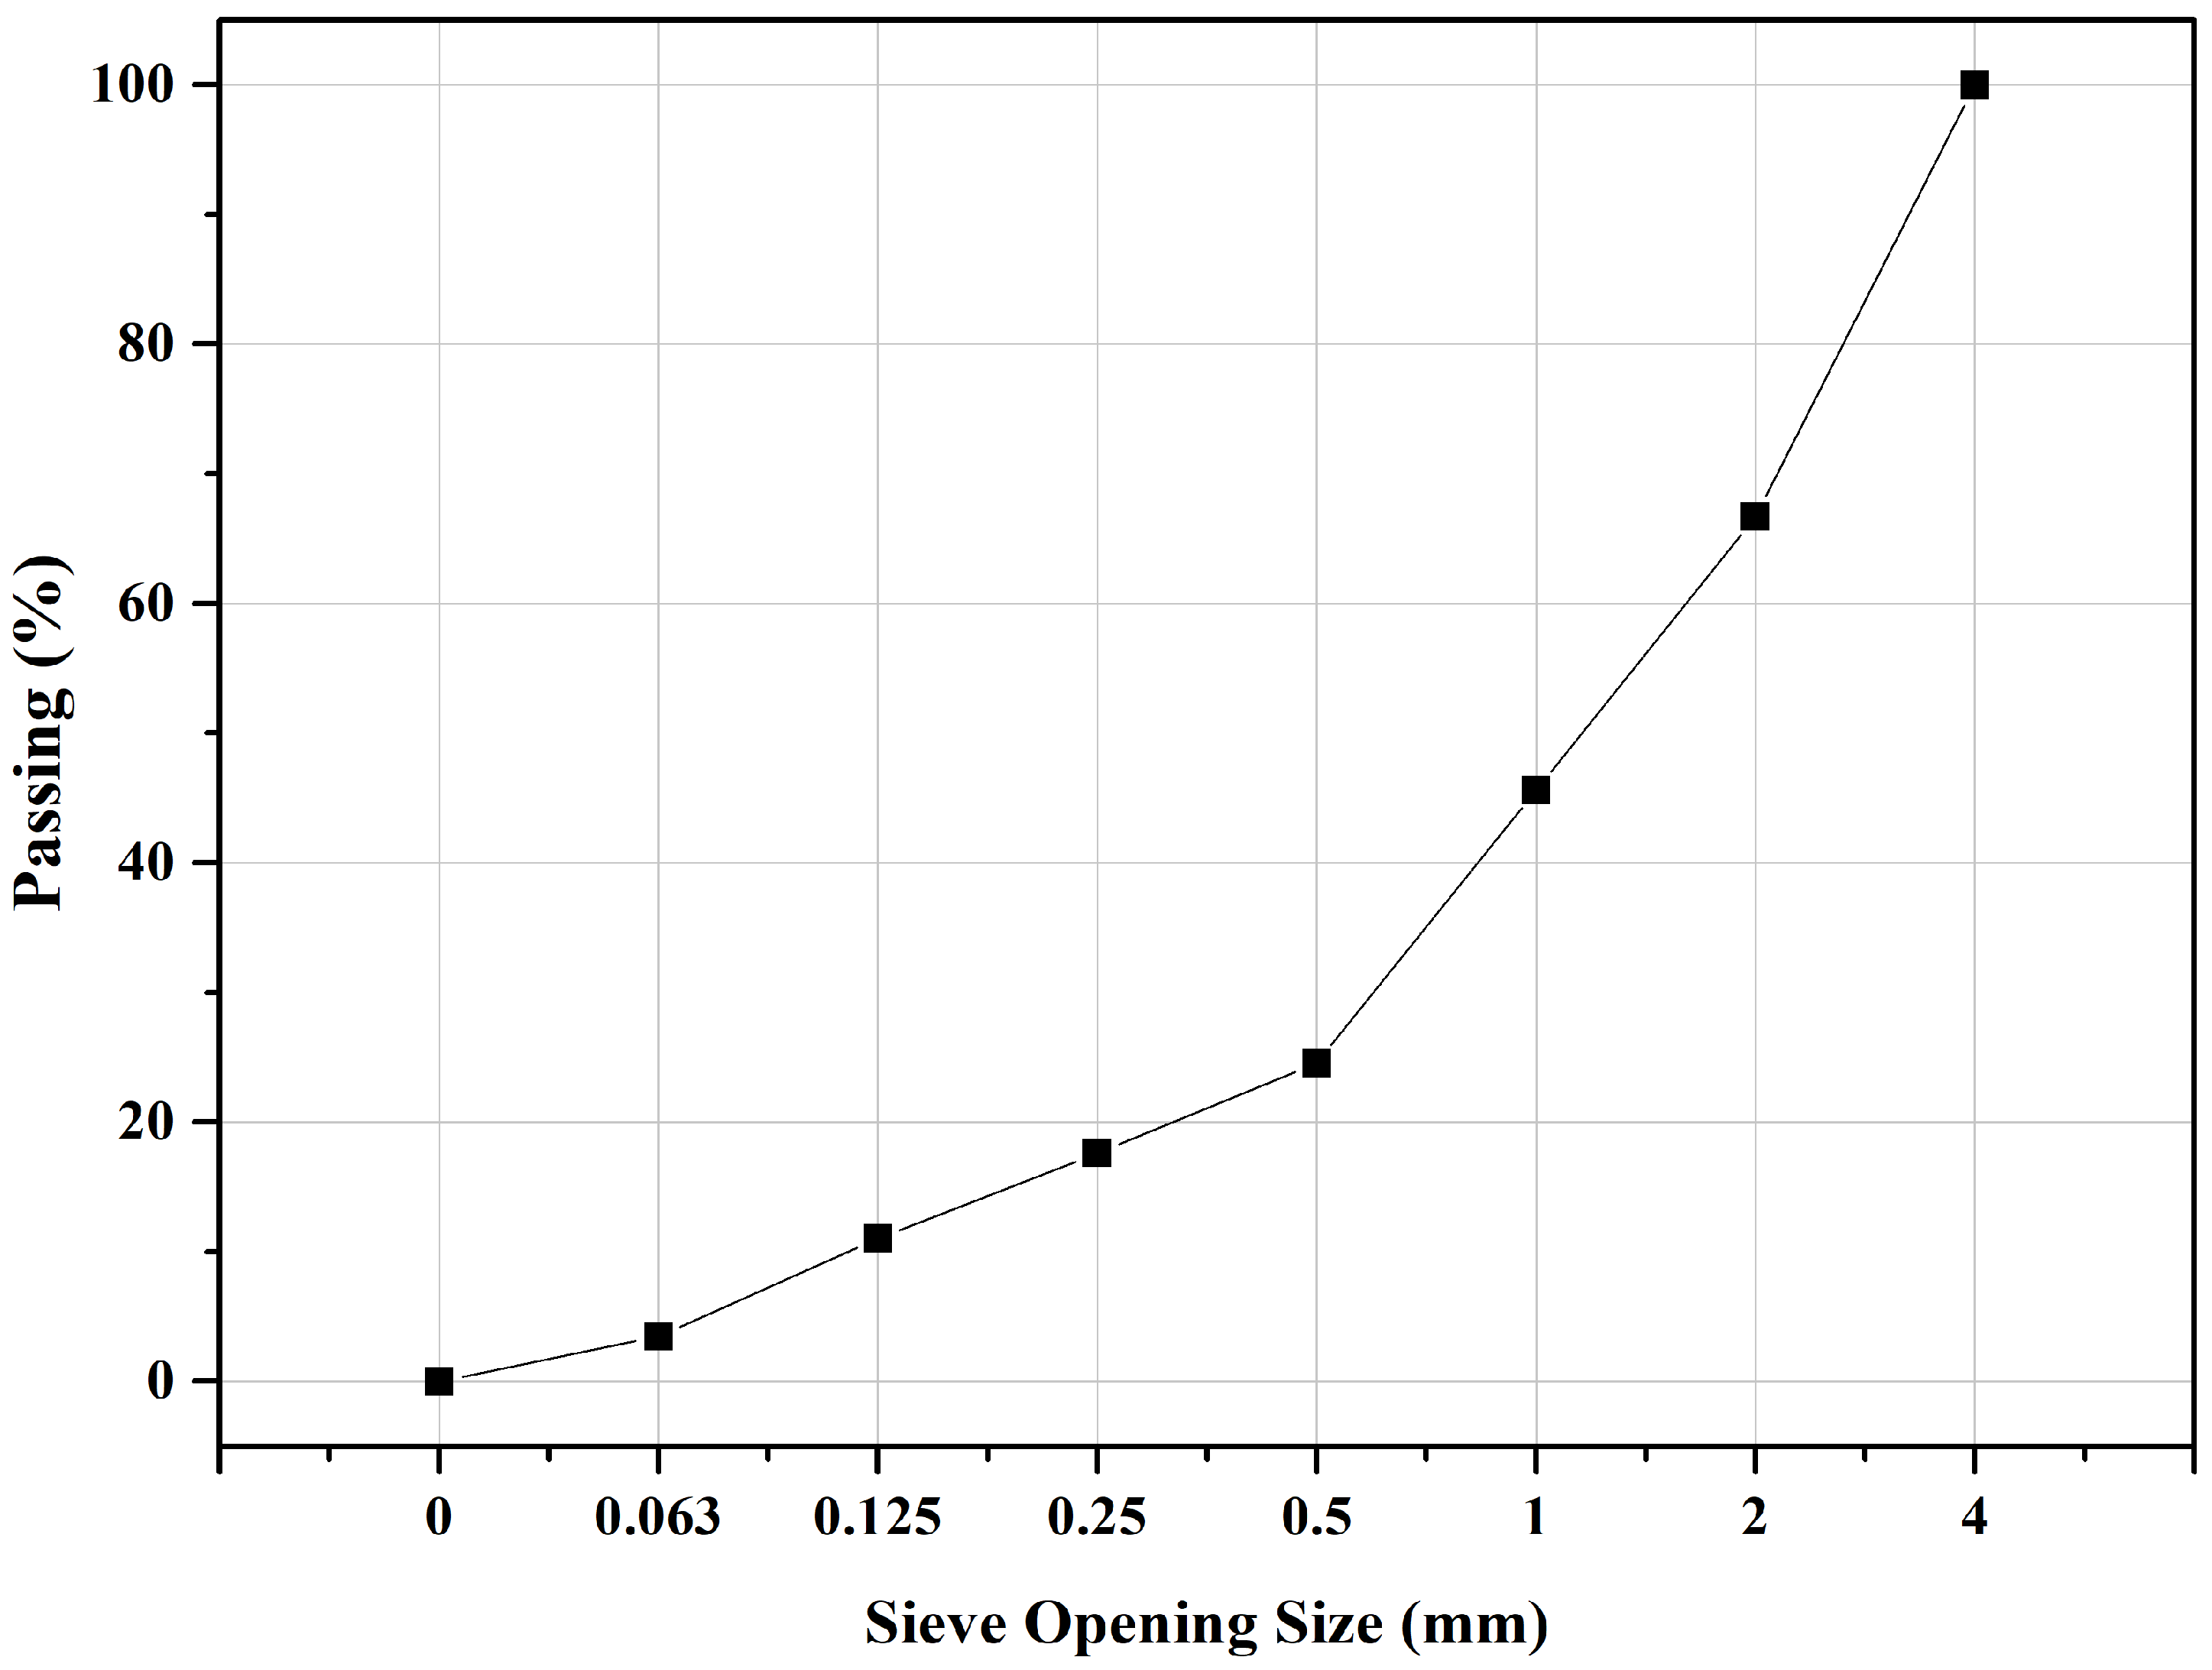
2.1. Materials

Crushed sand with a maximum grain size of 4 mm was used as fine aggregate in the production of mortar samples. Fine aggregate was put in the oven at the temperature of 105 ± 5 to bring it to the oven-dry state. Specific gravity and water absorption of crushed sand were 2.68 g/cm3 and 2.08%, respectively. Rodded and loose unit weight of aggregates were 1.74 and 1.60 g/cm3, respectively. The particle size distribution of aggregates was determined according to TS EN 933-1 [19] as illustrated in Figure 1. Fineness modulus of aggregates was 4.31. PVC waste plastic fibers that were used as reinforcement material were obtained from the Antalya industry zone. Fibers were added to the cementitious mixture in a ratio of 0%, 1%, 2%, and 3 vol%. The PVC fibers were taken as industrial waste resulting from the PVC joinery process. The fibers were completely used as waste material, and no chemical or physical modification was taken on them. Therefore, the length and diameter of the fibers differed. Some typical properties of the PVC fiber are provided in Table 1. CEM I 42.5 R with a specific gravity of 3.11 g/cm3 was used, and the water/cement (W/C) ratio was assigned as 0.7. Silica fume (SF) and micro silica (MS) were used as cement replacements in various amounts ranging from 0% to 15% by weight in a 5% interval. SF was supplied from the ferrochrome production plant in Antalya. To reduce energy consumption micro silica was used as received without being passed through any further processes. The specific gravities of SF and MS are 2.26 g/cm3 and 2 g/cm3, respectively. Table 2 shows the chemical compositions of binders obtained from X-ray fluorescence (XRF). To keep the flow table diameter in the range of 19 ± 2, a modified lignin sulfonate-based water-reducing/plasticizer admixture with a specific gravity of 1.07 complying with TS EN 934-2 [20] was used in the reinforced specimens in a ratio of 1% and 2%.

2.2. Preparation of Samples

A benchtop laboratory mixture was used in the manufacturing process of the waste plastic fiber-reinforced mortars. The mixing process was as follows: The aggregates and the cement were added to the bowl, then 2/3 of the water was introduced, and the mixer was started in the low cycle; while the mixing process was continuing at the end of the 1st minute, the waste PVC fibers were slowly added to the mixture and mixed for 1 more minute in the low cycle. To prevent the loss of homogeneity, the bottom of the bowl was mixed with the help of a spatula, and then, dispersed and adhered particles were returned to the mixture. In the final stage, the mixer was switched to a high cycle, and the mixing process was repeated for 2 more minutes by adding the remaining water and plasticizer to the mixture.
Prepared homogenous mixtures were molded in 40 × 40 × 160 mm prism steel molds and covered with a plastic foil to prevent the evaporation of water (Figure 2). After 24 h, casted prism samples were demolded and put in a lime-saturated water tank which has a temperature of 20 ± 2 °C for the curing process. After 28 days, cured samples were taken out from the water tank and put in the laboratory conditions to let them dry for a few hours at a temperature of 22 ± 2 °C before conducting the tests. In total, 28 different types of mortar mixes were produced. The mix proportions and notations of produced mortar samples are given in Table 3.

2.3. Experimental Procedure

The consistency of the fresh mortar was determined immediately after the production according to TS EN 1015-3 [21]. In the determination of the fresh density, TS 1015-6 [22] standard was followed. The water absorption, porosity, and bulk density values were measured by testing 40 × 40 × 160 prism specimens according to ASTM C 642 [23] by using the following equations [24]:
Dry bulk density = W1/(W2 − W3)
SSD bulk density = W2/(W2 − W3)
Porosity (%) = ((W2 − W1)/(W2 − W3)) × 100
Water absorption (%) = ((W2 − W1/W1) × 100
where W1 is the mass of the oven-dried sample in the air (g), W2 is the mass of the saturated surface (SSD) dry sample in the air (g), and W3 is the mass of the SSD sample in water (g).
The flexural and compressive strength of mortar samples were determined according to TS EN 1015-11 [25]. The flexural strength was evaluated by a three-point bending strength test of 40 × 40 × 160 prism specimens. After the breakage of the prism specimen, the compressive strength test was carried out on each half. Tests were performed by displacement-controlled hydraulic machine at a pacing rate of 0.5 mm/min for flexural strength and 1 mm/min for compressive strength.
Modulus of elasticity was obtained from stress–strain curves. The equation given below was used to calculate the values of elasticity modulus [26]:
σ 2 σ 1 ε 2 ε 1
σ1: stress at a longitudinal strain;
σ2: stress at 40% of ultimate load;
ε1: of 5 × 10⁻⁵;
ε2: longitudinal strain produced by stress σ2.
Stress–strain curves were plotted by following ASTM C 109 [27]. Toughness values were obtained by calculating the area under the stress–strain curve.
Capillary absorption tests were performed at the age of 28 and 90 days. The capillary absorption coefficient was obtained using the following equation:
K = Q/(A × t1/2)
where K is the coefficient of capillarity (cm/s1/2), Q is the amount of water absorbed (cm3), A is the area of the surface exposed to the water (cm2), and t is the time (s).

3. Results and Discussion

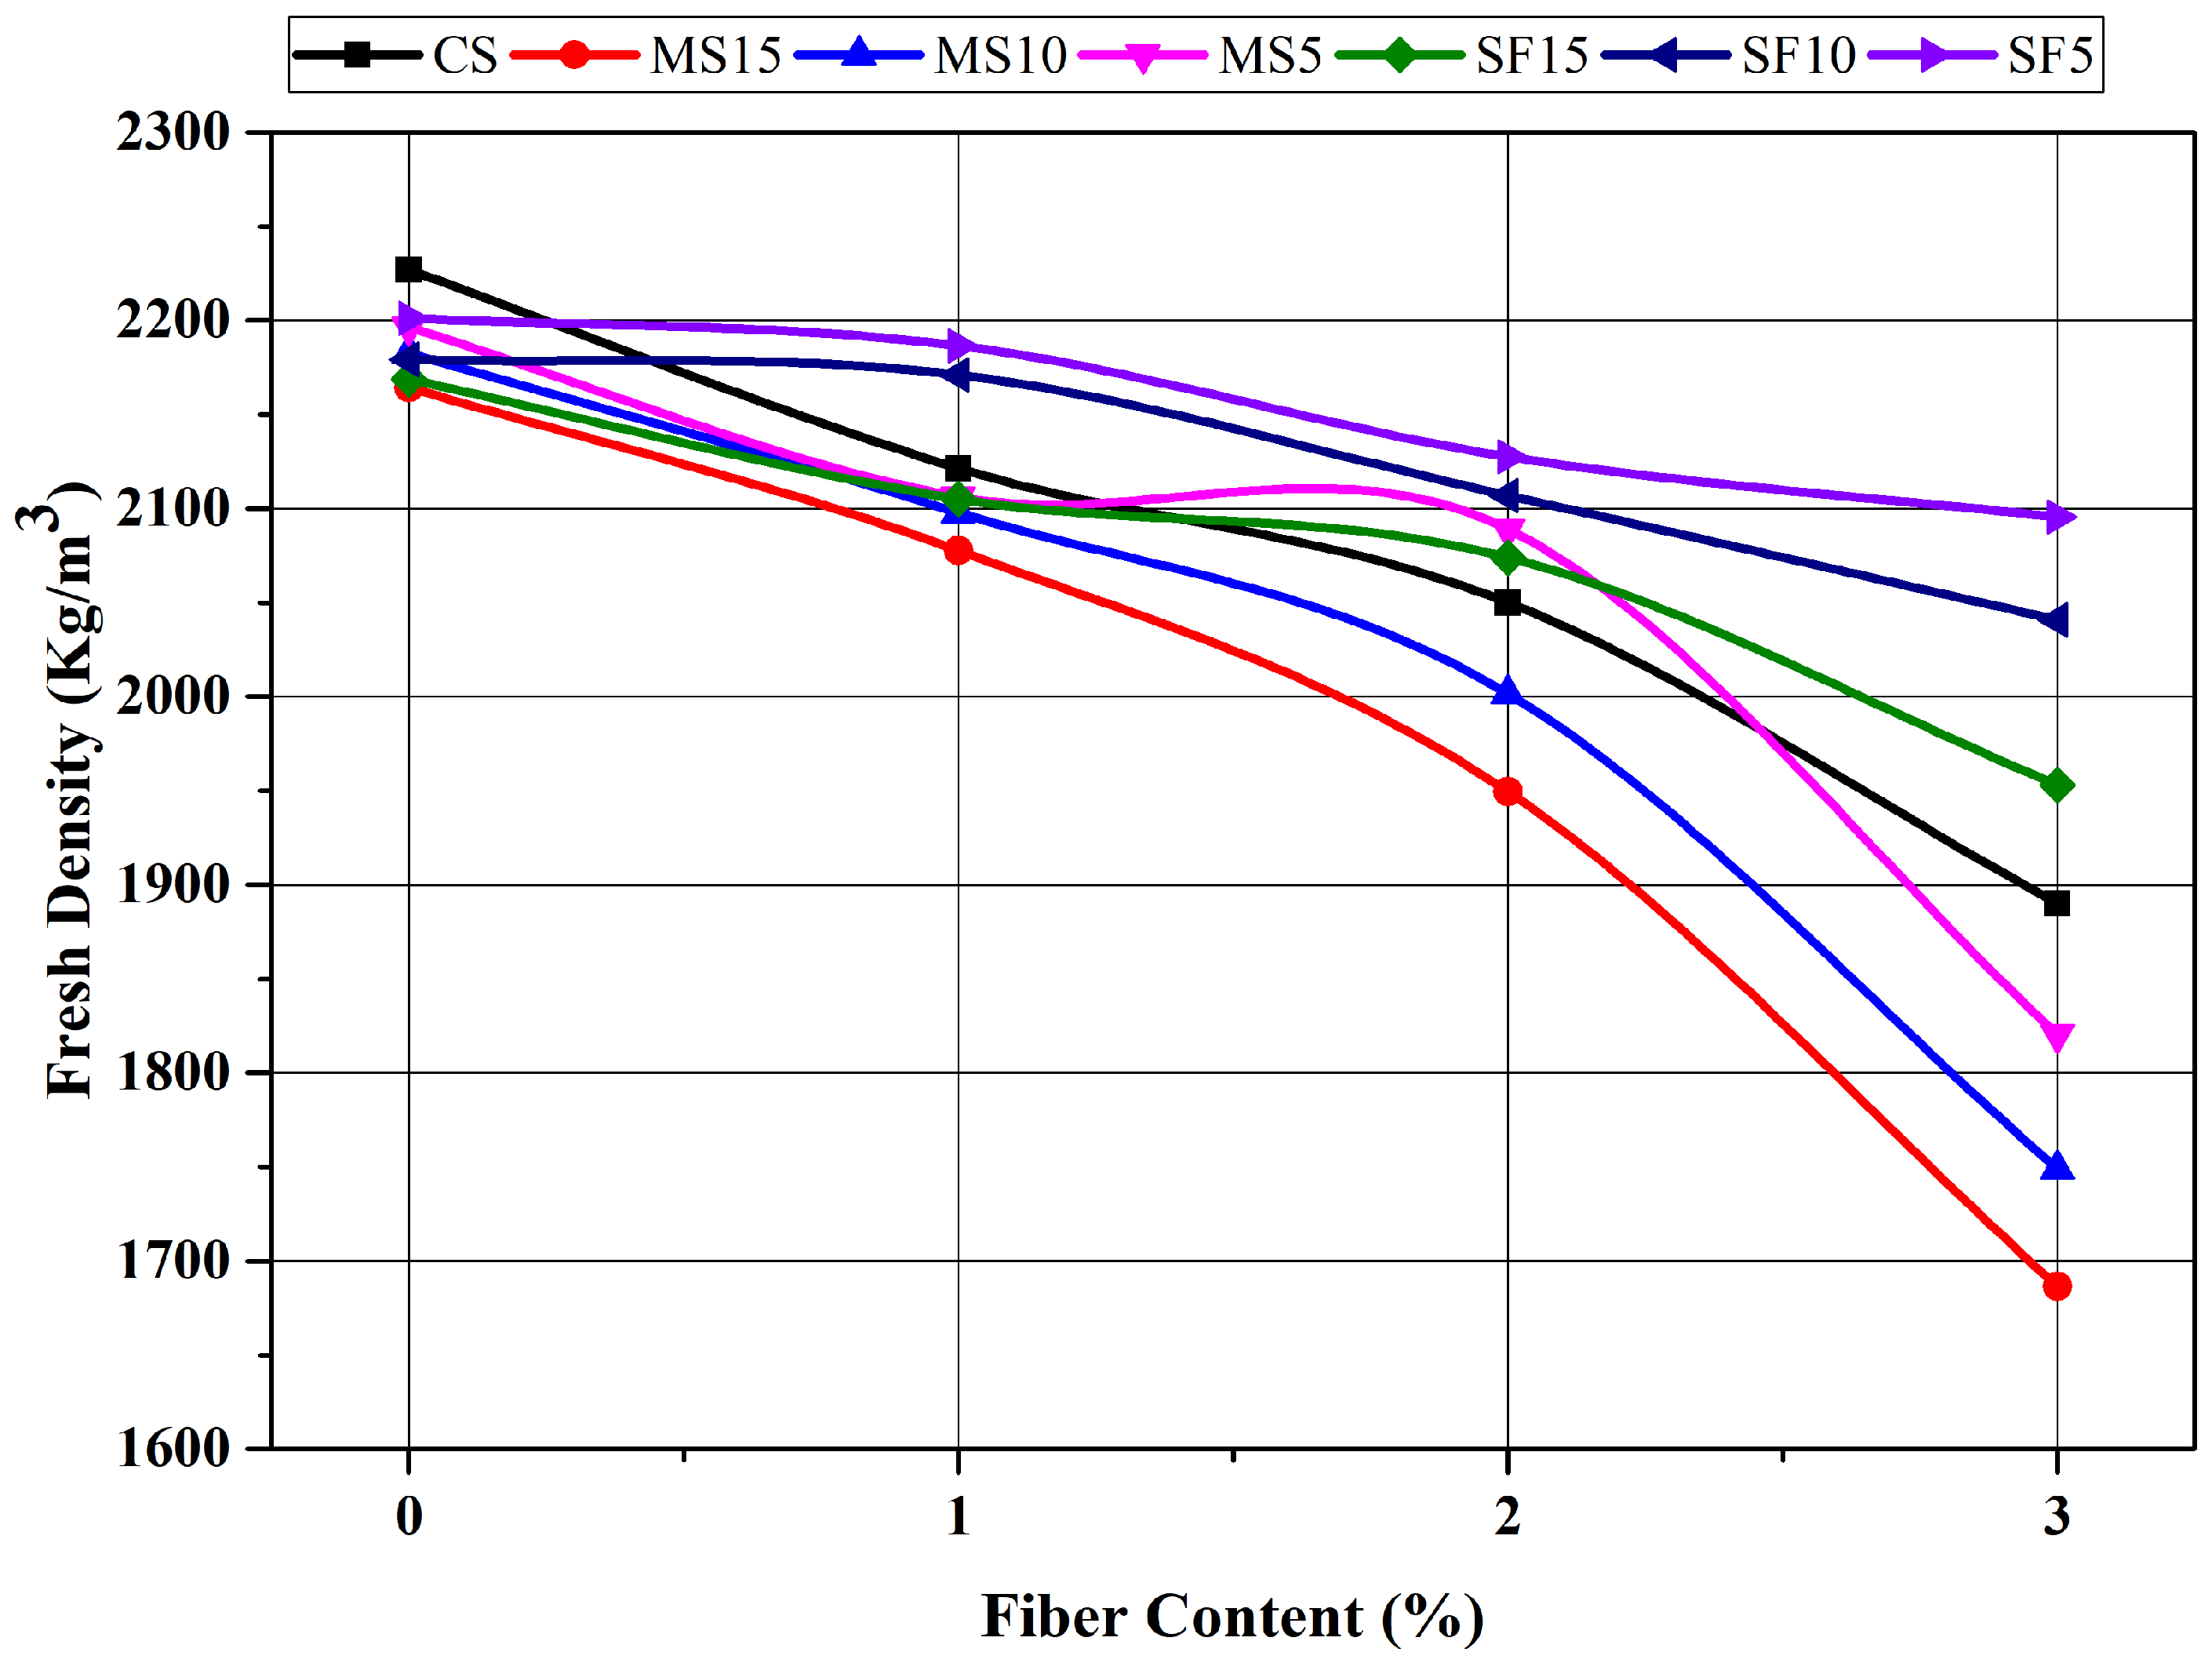
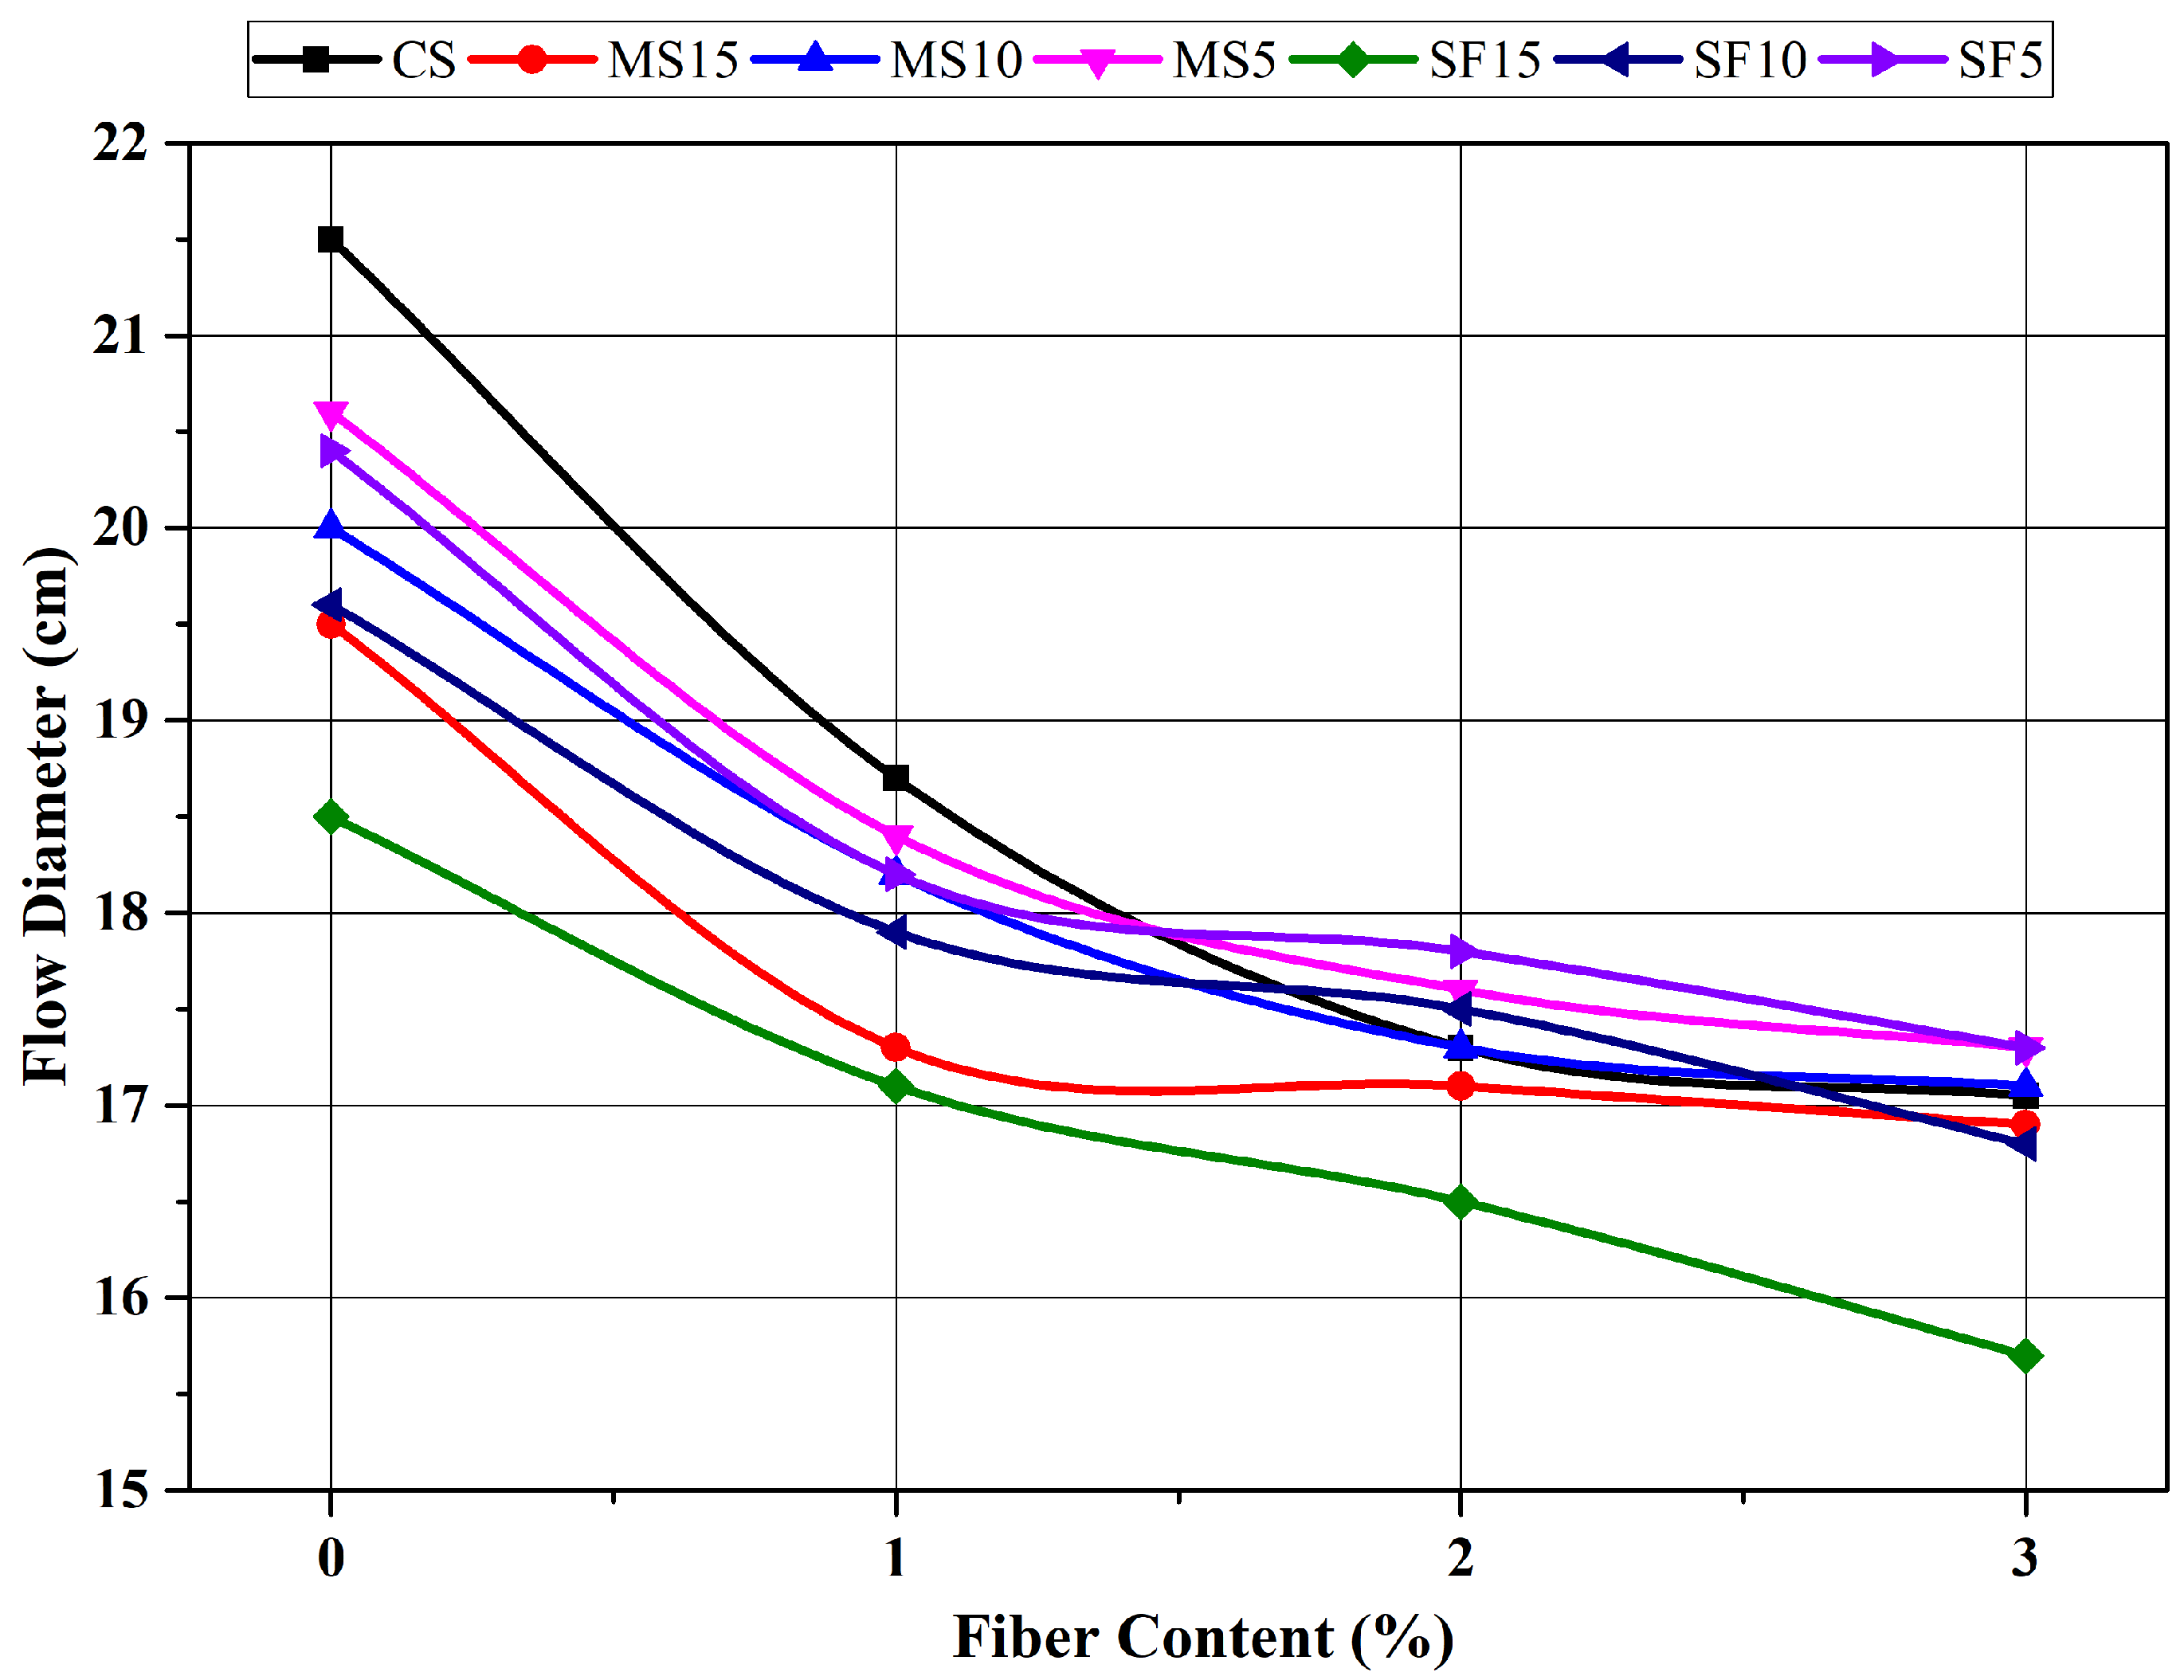
3.1. Fresh State Properties

The fresh density and flow diameter of mortar samples are depicted in Figure 3 and Figure 4, respectively. The fresh density of the mortars decreased with the increase in fiber ratio in all mixes. This also applied to the flow diameter of the mortars. The flow diameter and density values of all mixtures with maximum fiber (3%) content were found to have the lowest value. Increasing the fiber amount causes the formation of a porous structure, which leads to a reduction in the unit weights and workability of the mortars. The fact that the length and size of the waste plastic fiber used in this study are not the same, and that they are not distributed homogeneously in the cement matrix, can be explained as the reason for the decrease in both the fresh density and the flow diameter of the mortars.
The fiber increased the viscosity of the mortar and prevented the dispersion of the cement matrix, thus decreasing the workability. The findings obtained are consistent with the previous studies. In studies conducted on the use of plastic fibers in cement mixtures, it has been stated that its workability declines independently of the type and ratio of the fiber. Al-Hadithi and Hilal [28] reported that the flow diameter of concrete decreases with the increase in plastic fibers in their study to investigate the effects of waste plastic fibers on the properties of self-compacting concrete. The authors explained that the entanglement of the fibers to form clusters prevents the concrete from spreading and is the reason for the decrease in the flow diameter. Karahan and aAtiş [29] stated that polypropylene fibers decrease the unit weight and slump of concrete. They also concluded that increasing the amount of fiber reduced workability.
Mortar samples containing silica fume and micro silica had lower fresh density and flow diameter than the control sample. This could be due to the fact that the addition of silica fume requires more use of superplasticizer [30].

3.2. Physical Properties

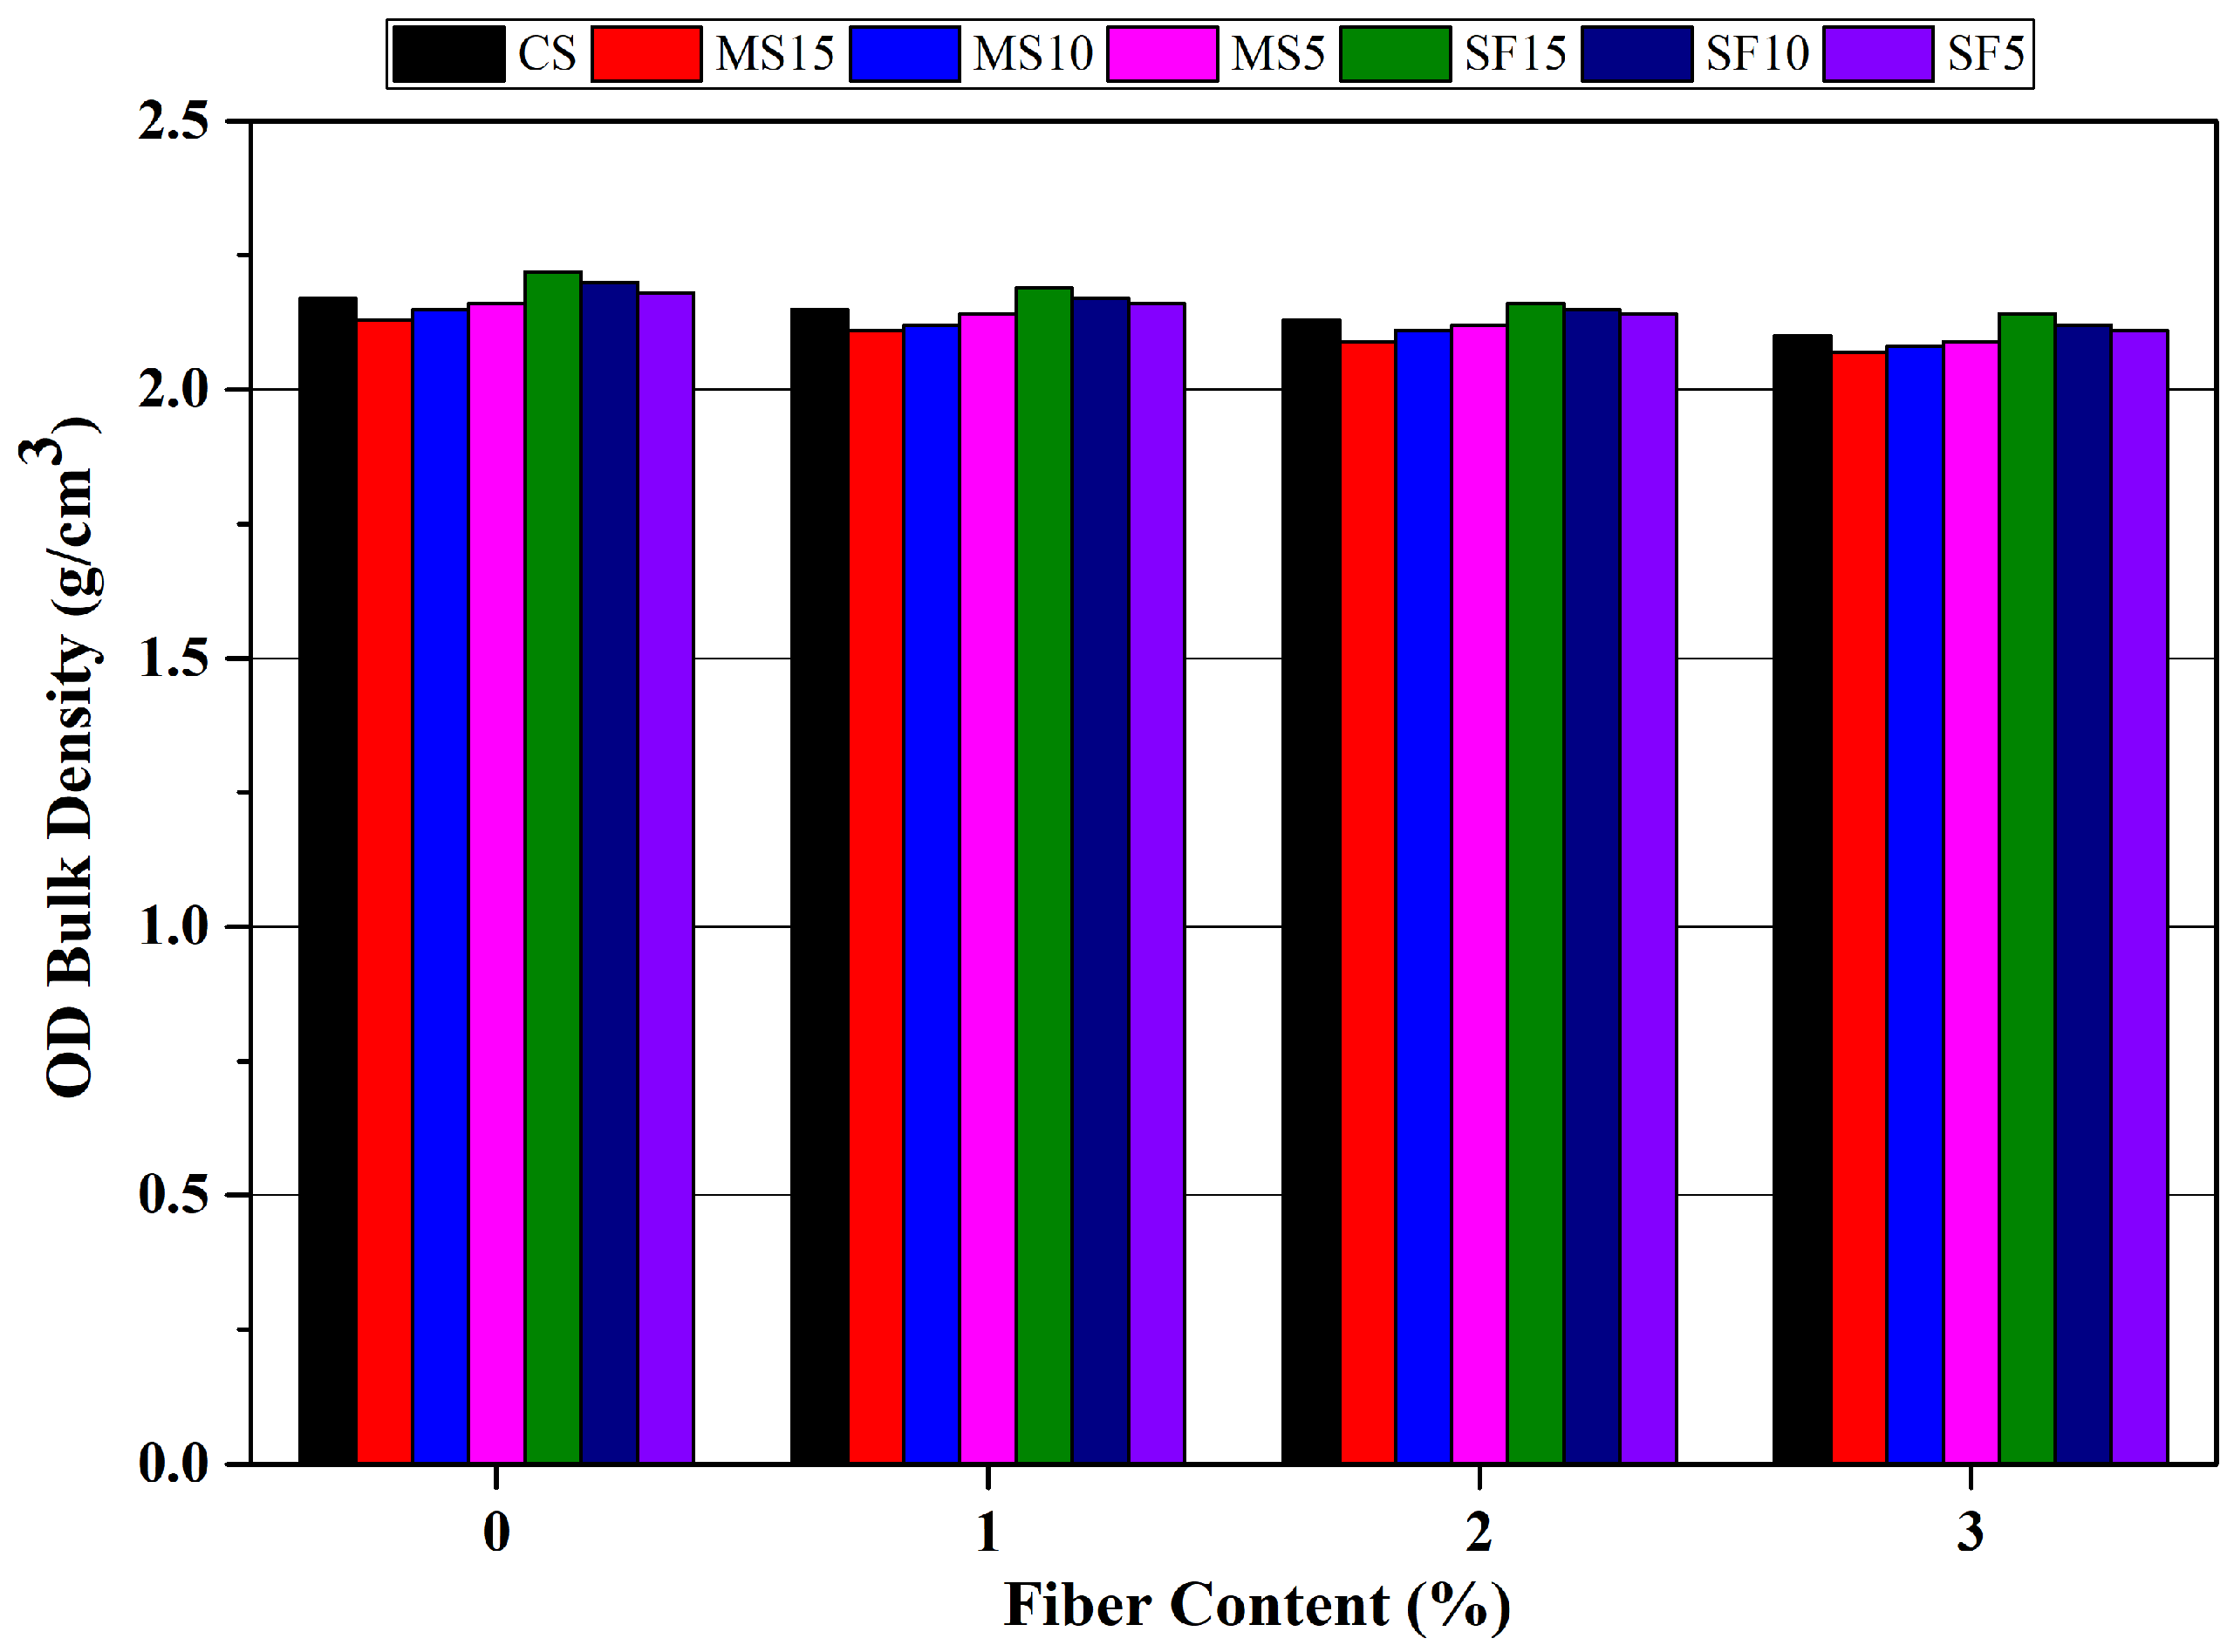
3.2.1. Dry Bulk Density Values

The dry bulk density of the mortar samples is shown in Figure 5. It can be seen from the figure that in all of the mortar samples, the increase in the ratio of plastic fiber caused the dry bulk density values to gradually decrease. The bulk density of the mortars was reduced by 5% upon the addition of waste plastic fibers. This decrease can be attributed to the lower specific gravity of the PVC plastic fiber than that of the crushed sand aggregate. Dry bulk density of mortars was in the range of 2.10–2.17 g/cm3, 2.07–2.16 g/cm3, and 2.11–2.22 g/cm3 for CS, MS, and SF series, respectively.
It can be seen that the use of silica fume as a cement replacement increased the dry bulk density values. As the silica fume displacement ratio increased, the bulk density increased. The particle size of the silica fume is smaller than that of the cement, and this led to the formation of a more compact and less porous structure, which hence increased the density. Gupta et al. [31] reported that the replacement of cement with 10% of silica fume could enhance the density of concrete by 1.2%, 1.4%, and 1.7% for the w/c ratios of 0.35, 0.45, and 0.55, respectively.
In a study by Senhadji et al. [32], the effects of waste PVC plastic on the mortar were investigated. Waste PVC replaced fine sand at the rates of 0%, 10%, 30%, 50%, and 70% by volume. As the PVC substitution rate increased, a significant decrease was observed in the density values. The density of the mortar, in which 70% of the fine sand was replaced by PVC plastic, decreased by 30% compared to the control mortar. This decrease was attributed to the lower density of PVC particles than normal sand.
Although the dry bulk density values of the mortars containing micro silica as cement replacement were lower than the control sample, it was observed that the difference was not much.

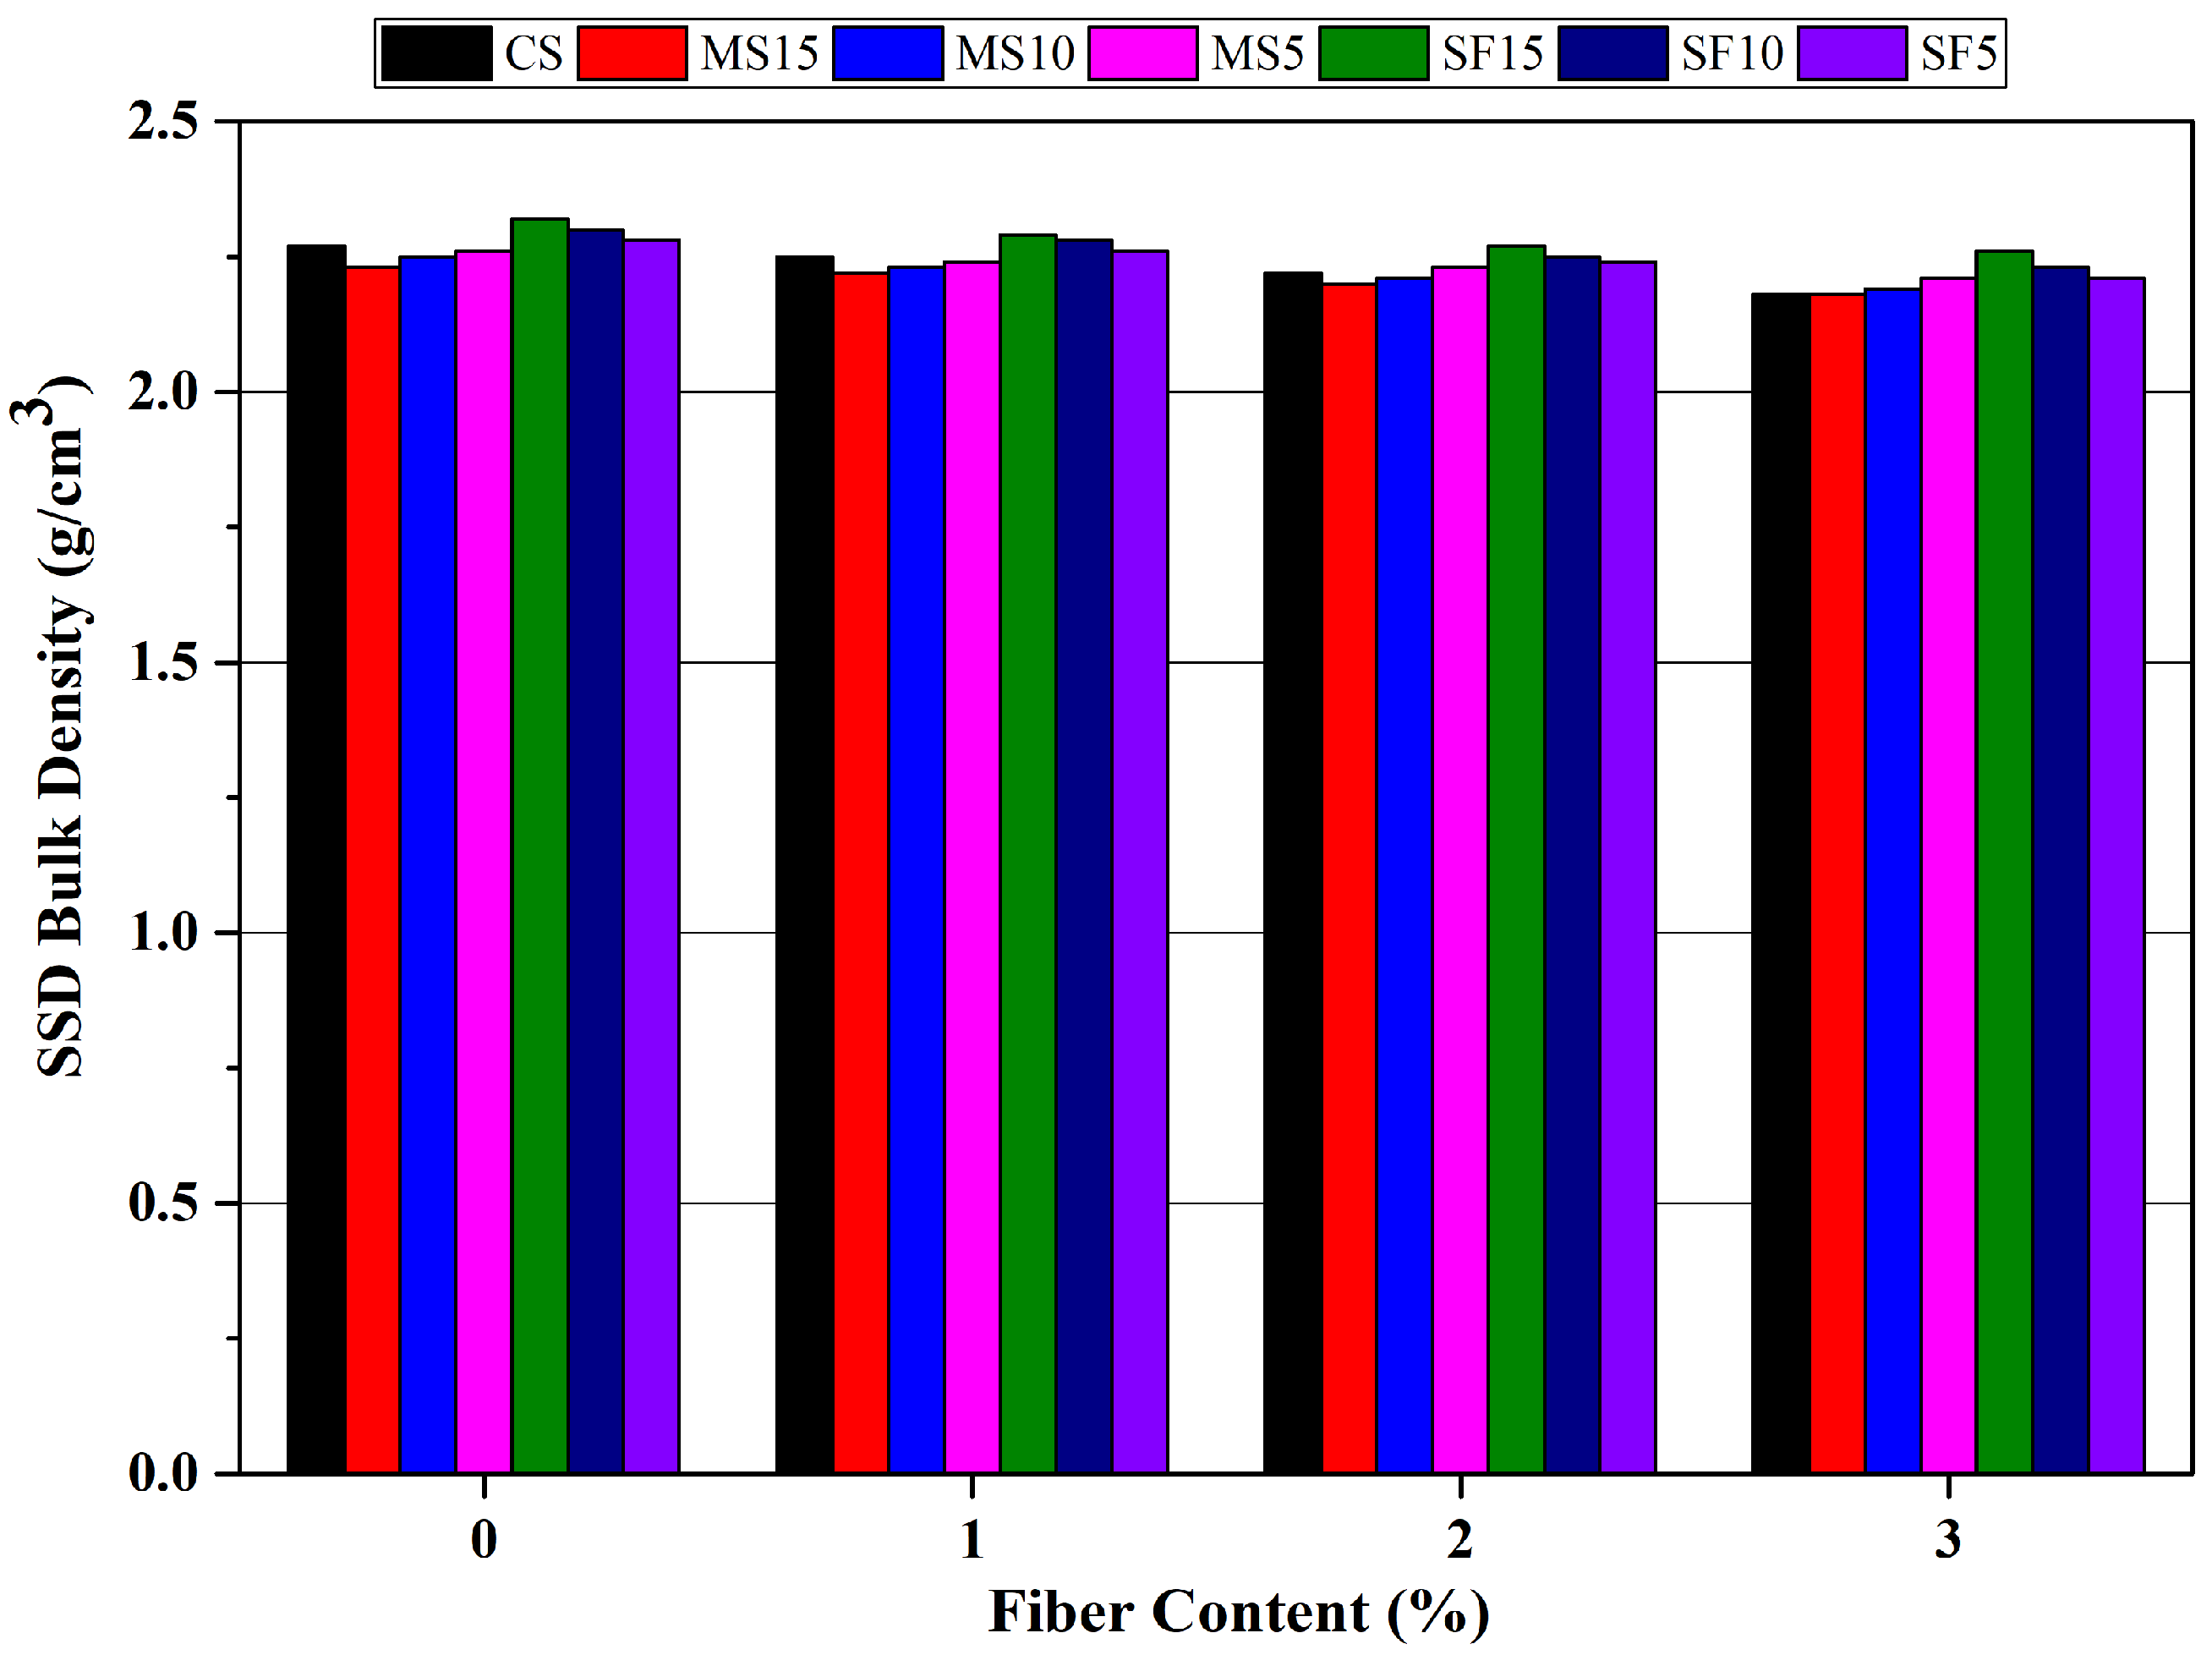
3.2.2. SSD Bulk Density Values

Figure 6 demonstrates the SSD bulk density of the mortar samples. Increasing the plastic PVC fiber ratio in the mixtures caused a decrease in the SSD bulk density values. This decline in the density can be attributed to the lower density of the plastic fiber than those of the cement and the crushed sand aggregate. Kockal and Camurlu [33] stated that SSD bulk density values decreased as a result of the increase in the ratio of polypropylene fiber in the mortar samples in which calcareous sand was used as aggregate. They attributed this decrease to the hydrophobic behavior of the polypropylene fibers and the low density of the fibers, which could cause porosity.
SSD bulk density values of mixtures containing silica fume were higher than both control samples and samples containing micro silica. The particle size of the silica fume is smaller than that of cement, and due to its mineral structure, it has shown a better particle size distribution effect, thus reducing the void ratio and increasing the weight of the mixture. In addition, as the amount of silica fume as a cement replacement increased, SSD bulk density values also increased. However, this was the opposite with mixtures containing micro silica. As the displacement of micro silica increased, the bulk density values decreased.

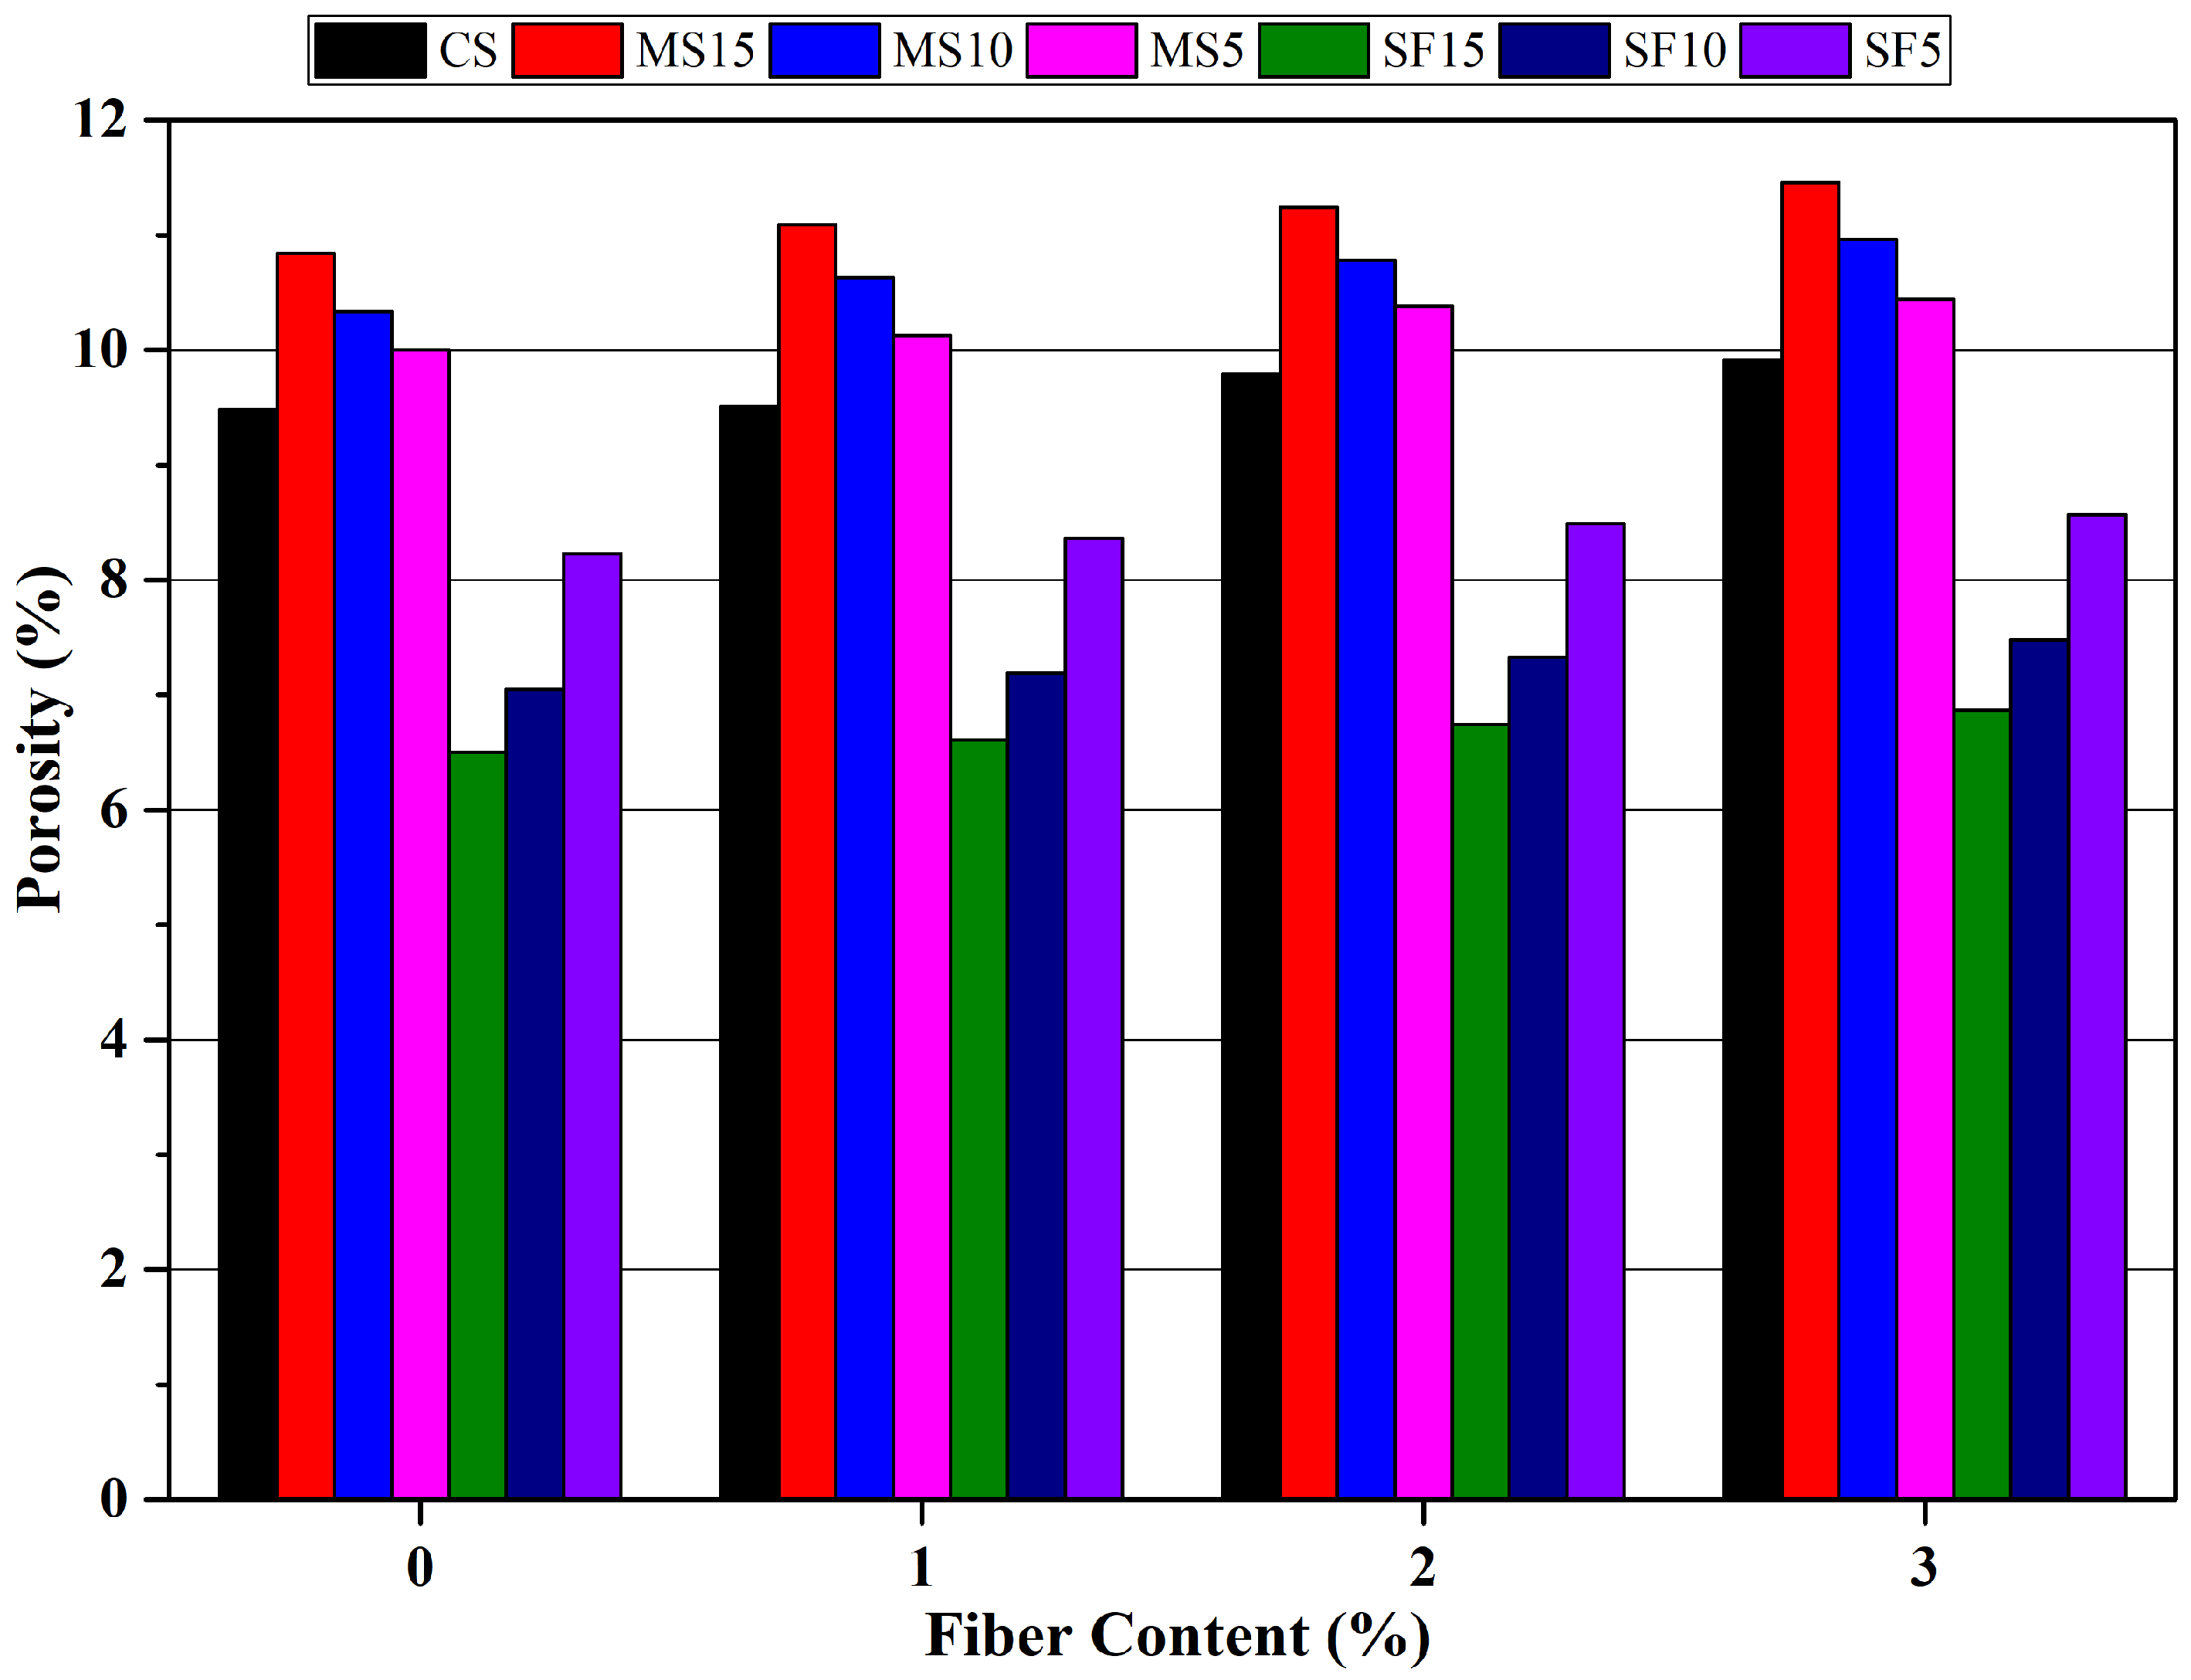
3.2.3. Apparent Porosity Values

Figure 7 depicts the apparent porosity of mortar samples. Micro silica and silica fume, which were used in different proportions as cement substitutes, had different effects on the void ratios. While the void ratios of the mortars containing silica fume were lower than those of the control samples, the void ratios of the micro silica-containing mortars were higher than the control samples. While a decrease in the void ratios was observed as the content of silica fume increased, it was observed that the void ratios of mortars increased with the increasing content of micro silica. In other words, while the porosity demonstrated a decreasing trend with the increase in silica fume, an increasing trend was observed in the porosity with the increase in micro silica.
Compared to the control sample, the apparent porosity values measured on day 28 decreased by 31.44%, 25.63%, and 13.18% for samples containing 15%, 10%, and 5% silica fume, respectively. Compared to mortars containing micro silica, the apparent porosity values measured on the 28th day were 40.04%, 31.75%, and 17.70%, respectively, for samples with 15%, 10%, and 5% silica fume content compared to those with the same micro silica content. When the effect of fiber content on the apparent porosity was taken into consideration, it was observed that the increase in the fiber percentage caused an increase in the porosity ratio in the mixtures. The fact that the fibers did not show a homogeneous distribution in the cement matrix led to an increase in the void ratio, thus creating a porous structure and increasing the void ratio of the mortars. Studies have revealed that the poor distribution and orientation of fibers is a reason for the low compactness, porosity, and density of hardened fiber-reinforced concrete (FRC) [34].

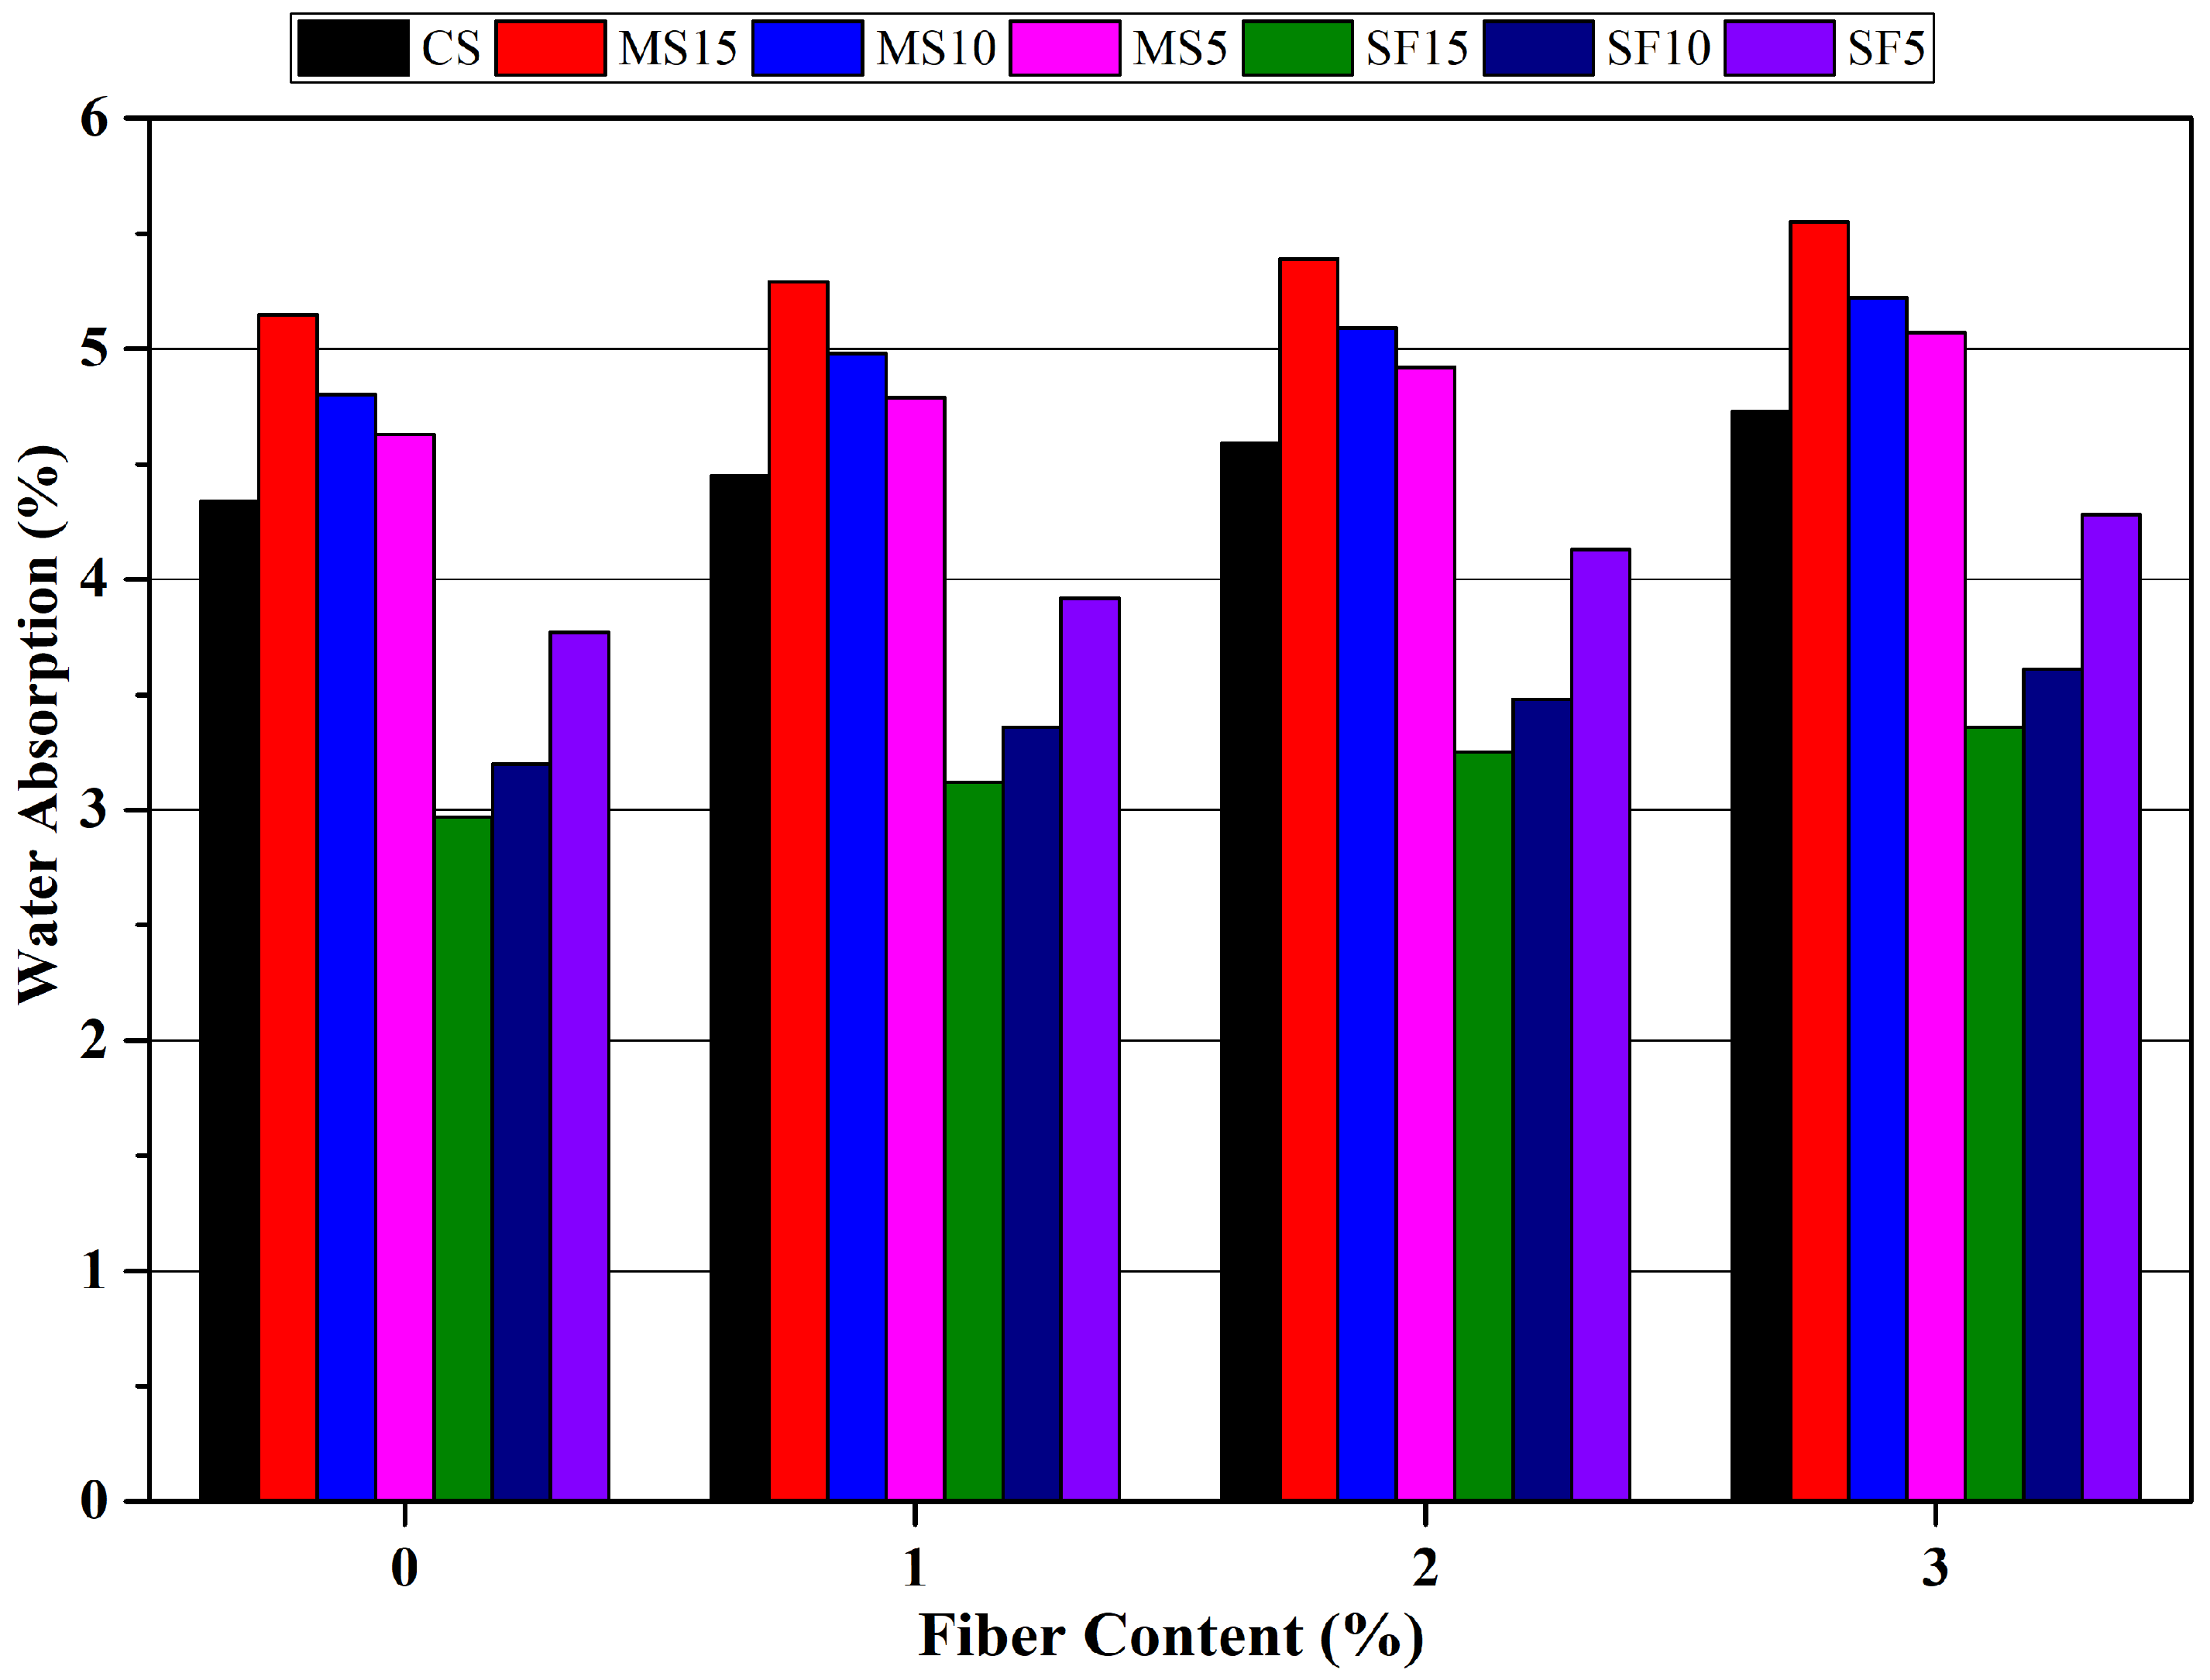
3.2.4. Water Absorption

The water absorption percentages of the mixtures obtained different results with varying micro silica and silica fume ratios as can be seen in Figure 8. Silica fume-containing mortars demonstrated a decreasing trend in water absorption; however, an increasing trend was noticed in the mortars containing micro silica. While the water absorption values of mortars decreased with increasing silica fume values, it was observed that water absorption gained higher values with increasing content of micro silica. In other words, while a decrease in water absorption values was observed with the increase in silica fume, it was determined that these values increased with the increase in micro silica.
The particle size of the silica fume is smaller than that of cement, which has caused an increase in the proportion of fine material in the matrix, thus filling the gaps and increasing the impermeability. However, the grain size of the micro silica used in this study was larger than that of both cement and silica fume, leading to an increase in the pore ratio and an increase in the water absorption rate. Compared to the control sample, the water absorption values by weight measured on day 28 decreased by 31.57%, 26.26%, and 13.13% for samples containing 15%, 10%, and 5% silica fume, respectively. When compared to mortars containing micro silica, the water absorption values measured on day 28 for samples with 15%, 10%, and 5% silica fume content were reduced by 41.76%, 33.33%, and 18.57%, respectively, compared to those with the same micro silica content.
When the effect of fiber content on water absorption values was examined, it was observed that the increase in fiber percentage caused an increase in water absorption values in the mortars. The fact that the fibers did not show a homogeneous distribution in the cement matrix and their agglomeration led to an increase in the void ratio, thus allowing the formation of a porous structure and the mortars to absorb excess water [17].
An inverse relationship was found between the water absorption rate and the dry bulk density of the mortars. The water absorption values of the mortars with low dry bulk density were found to be high. There is a directly proportional relationship between the water absorption values of the mortars and their apparent void ratios.

3.3. Mechanical Properties

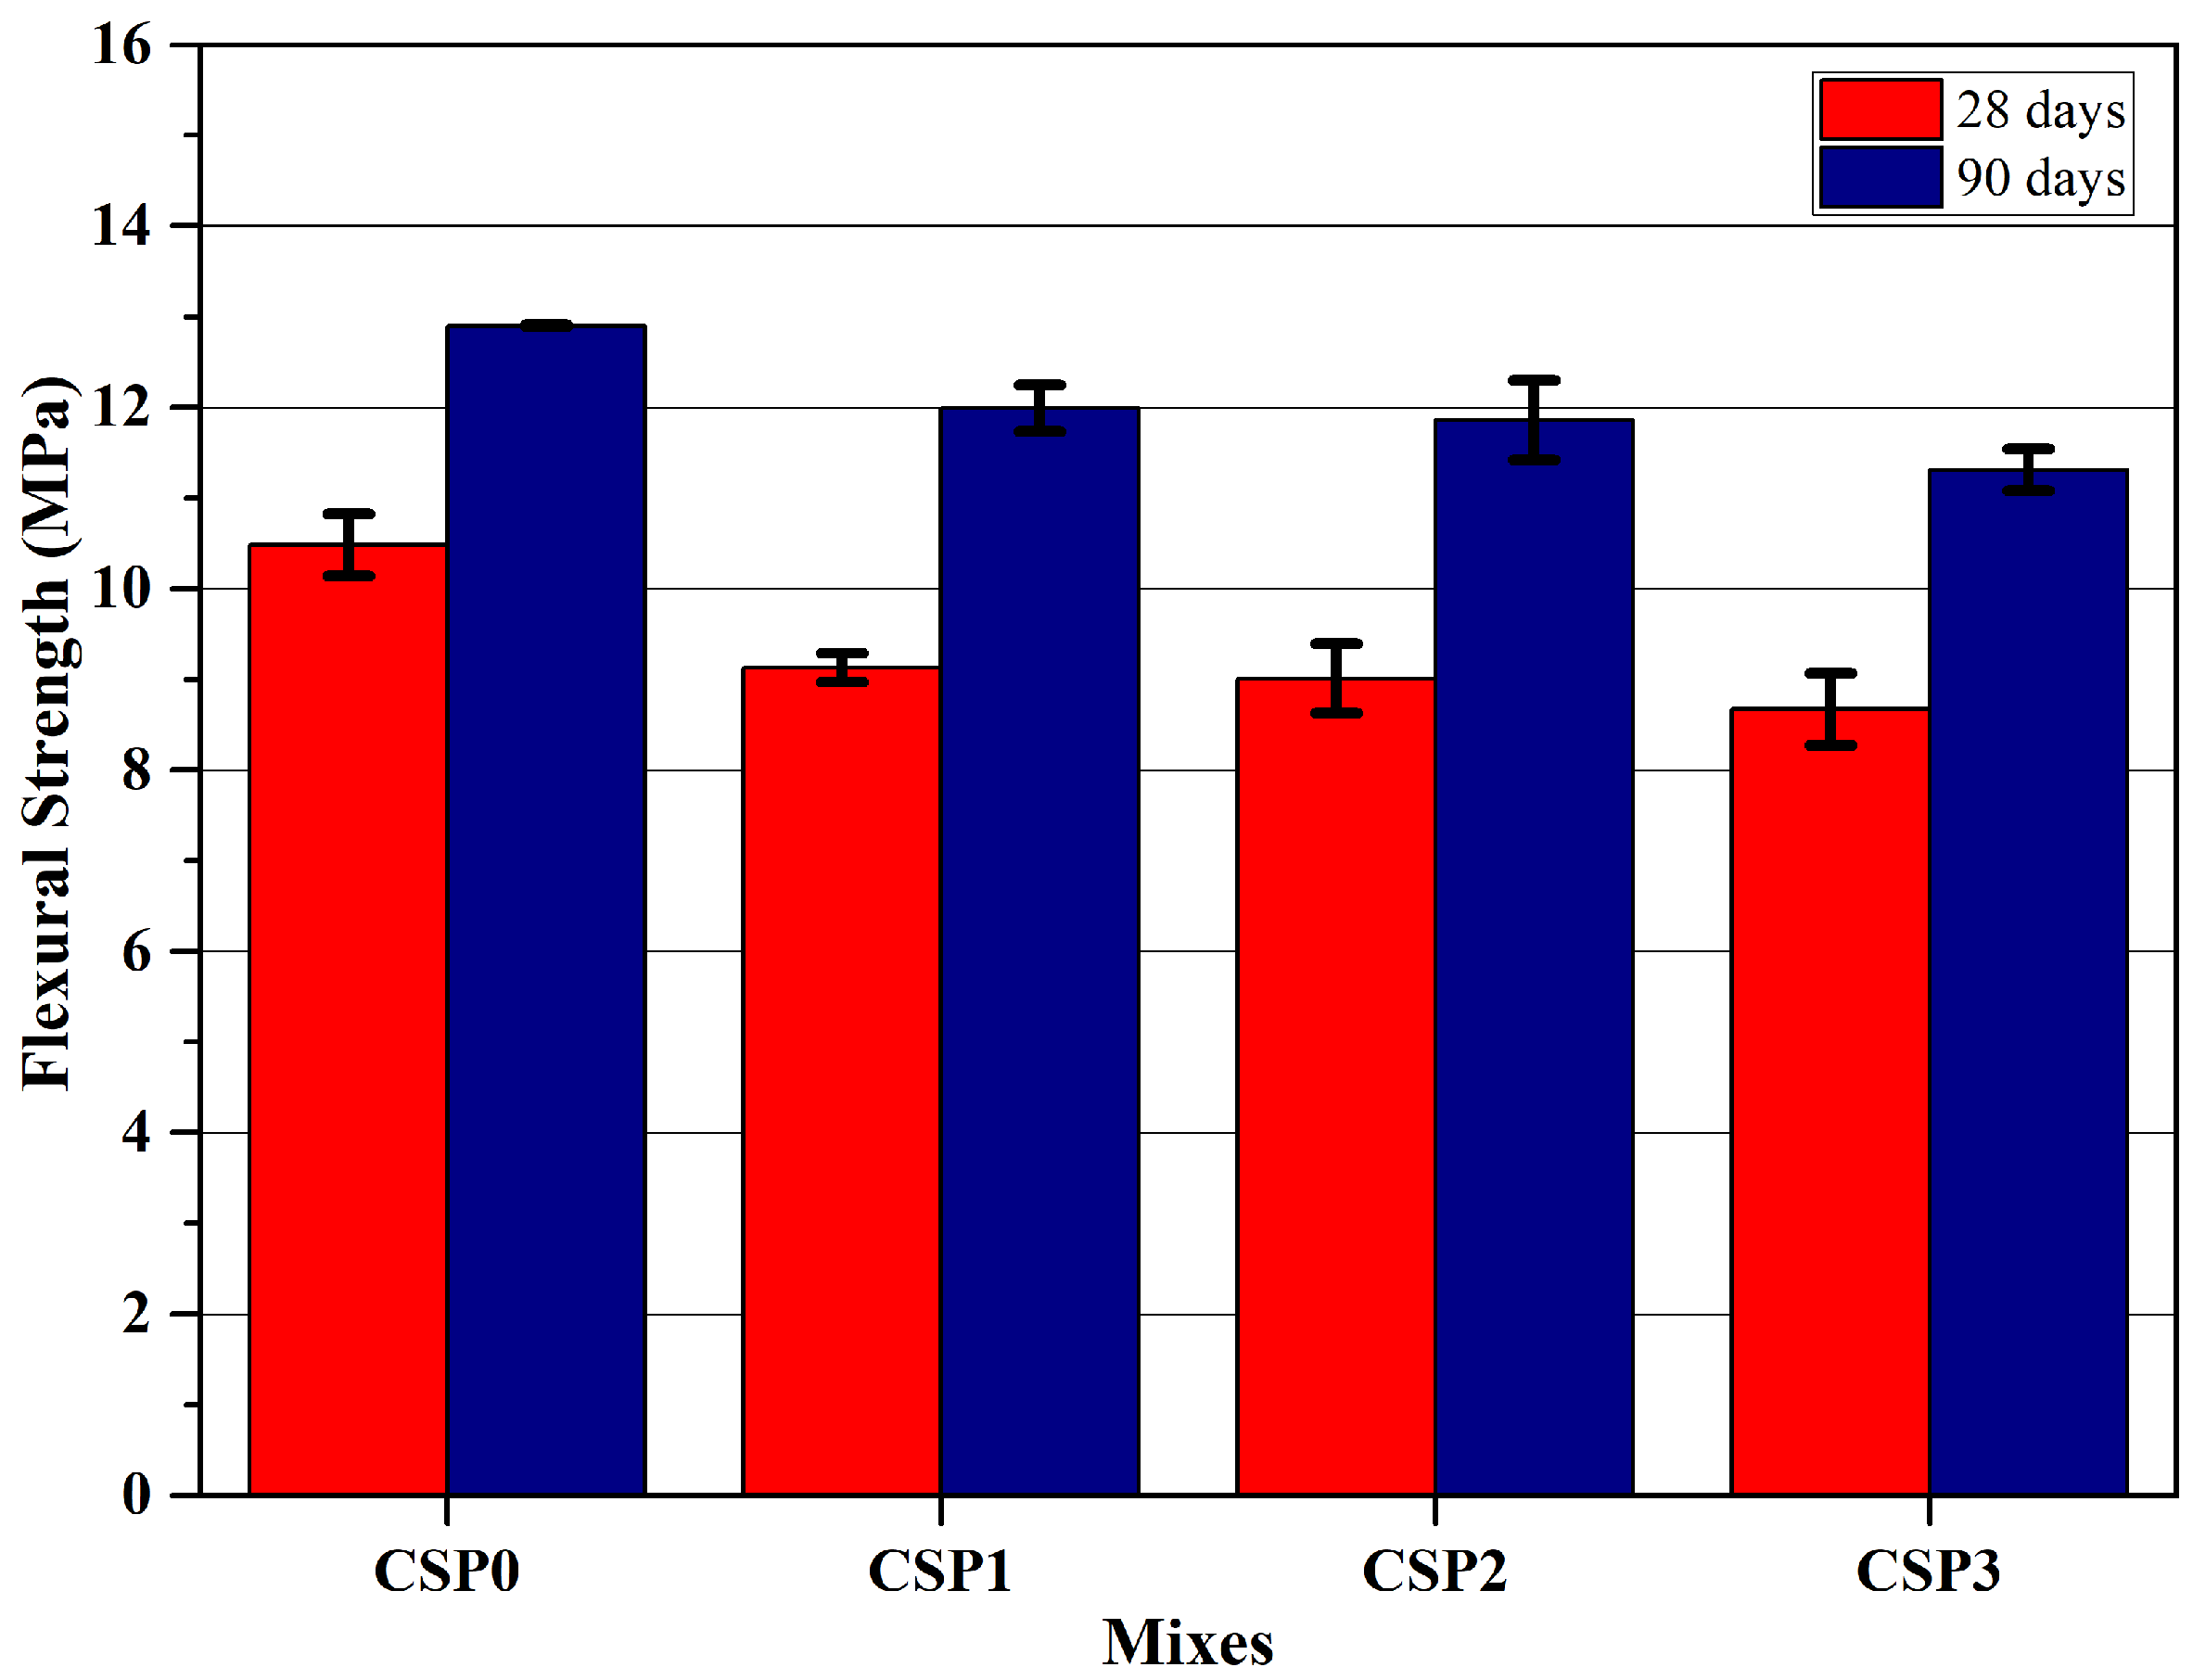
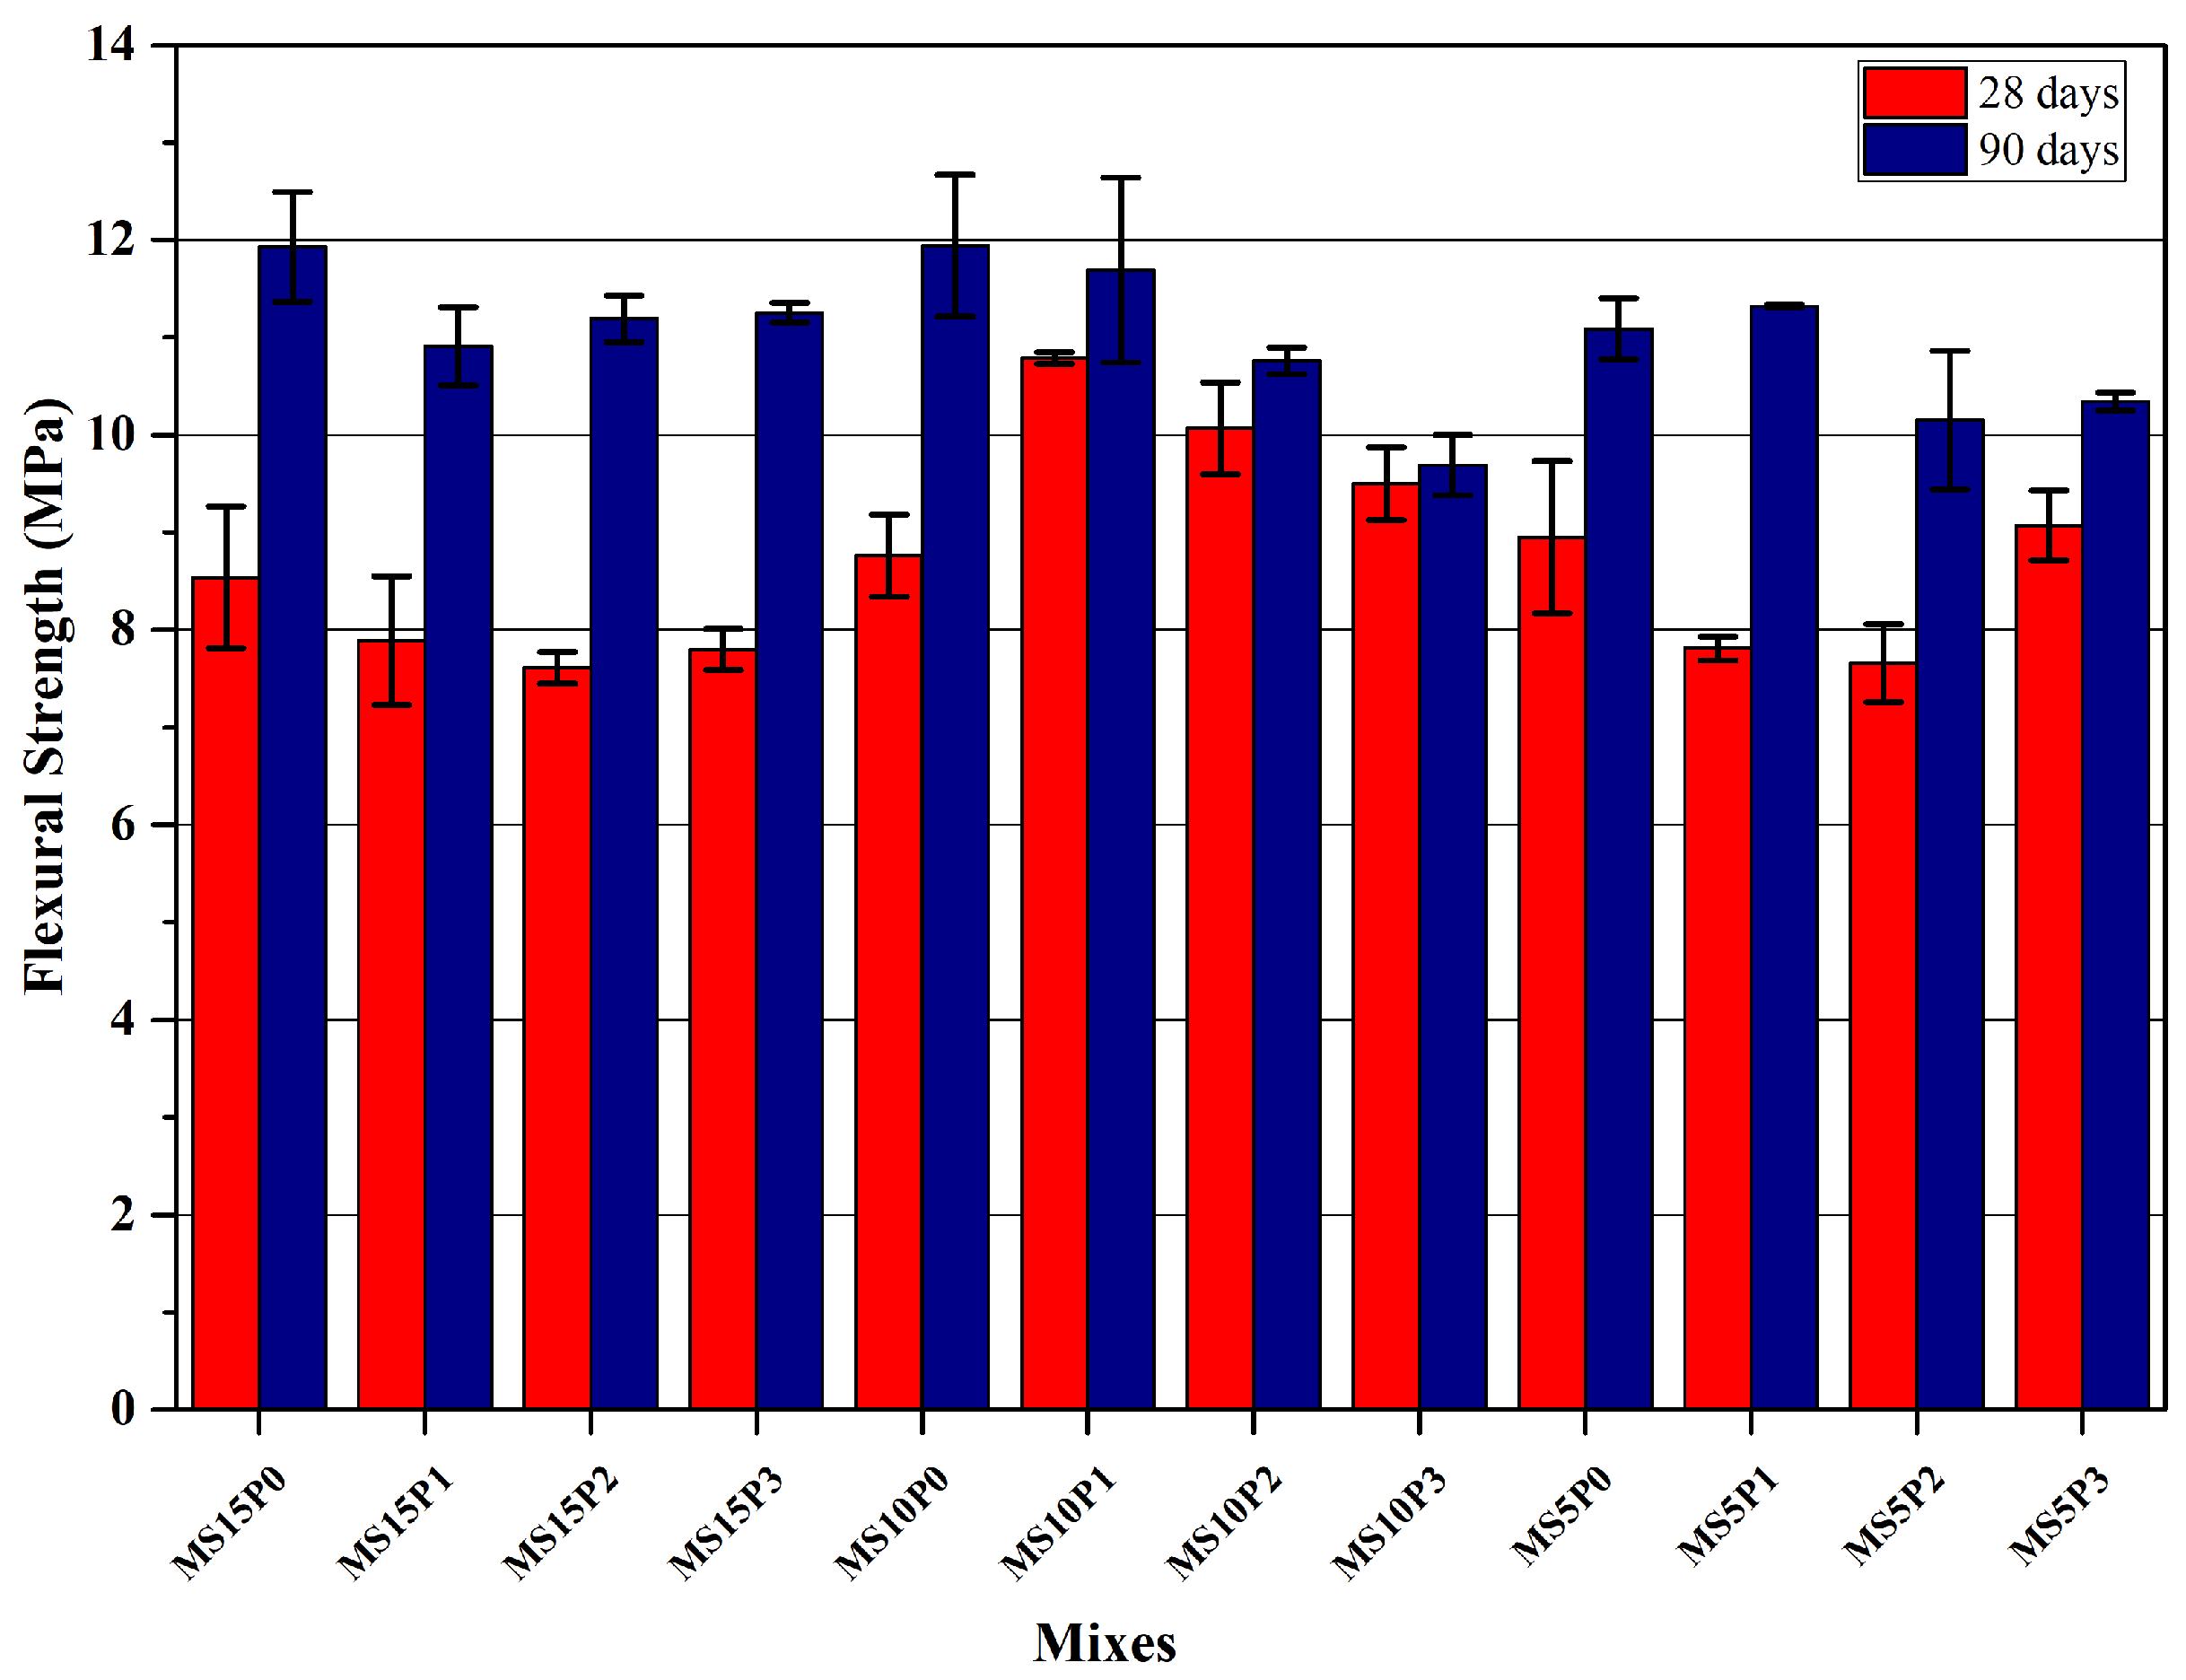
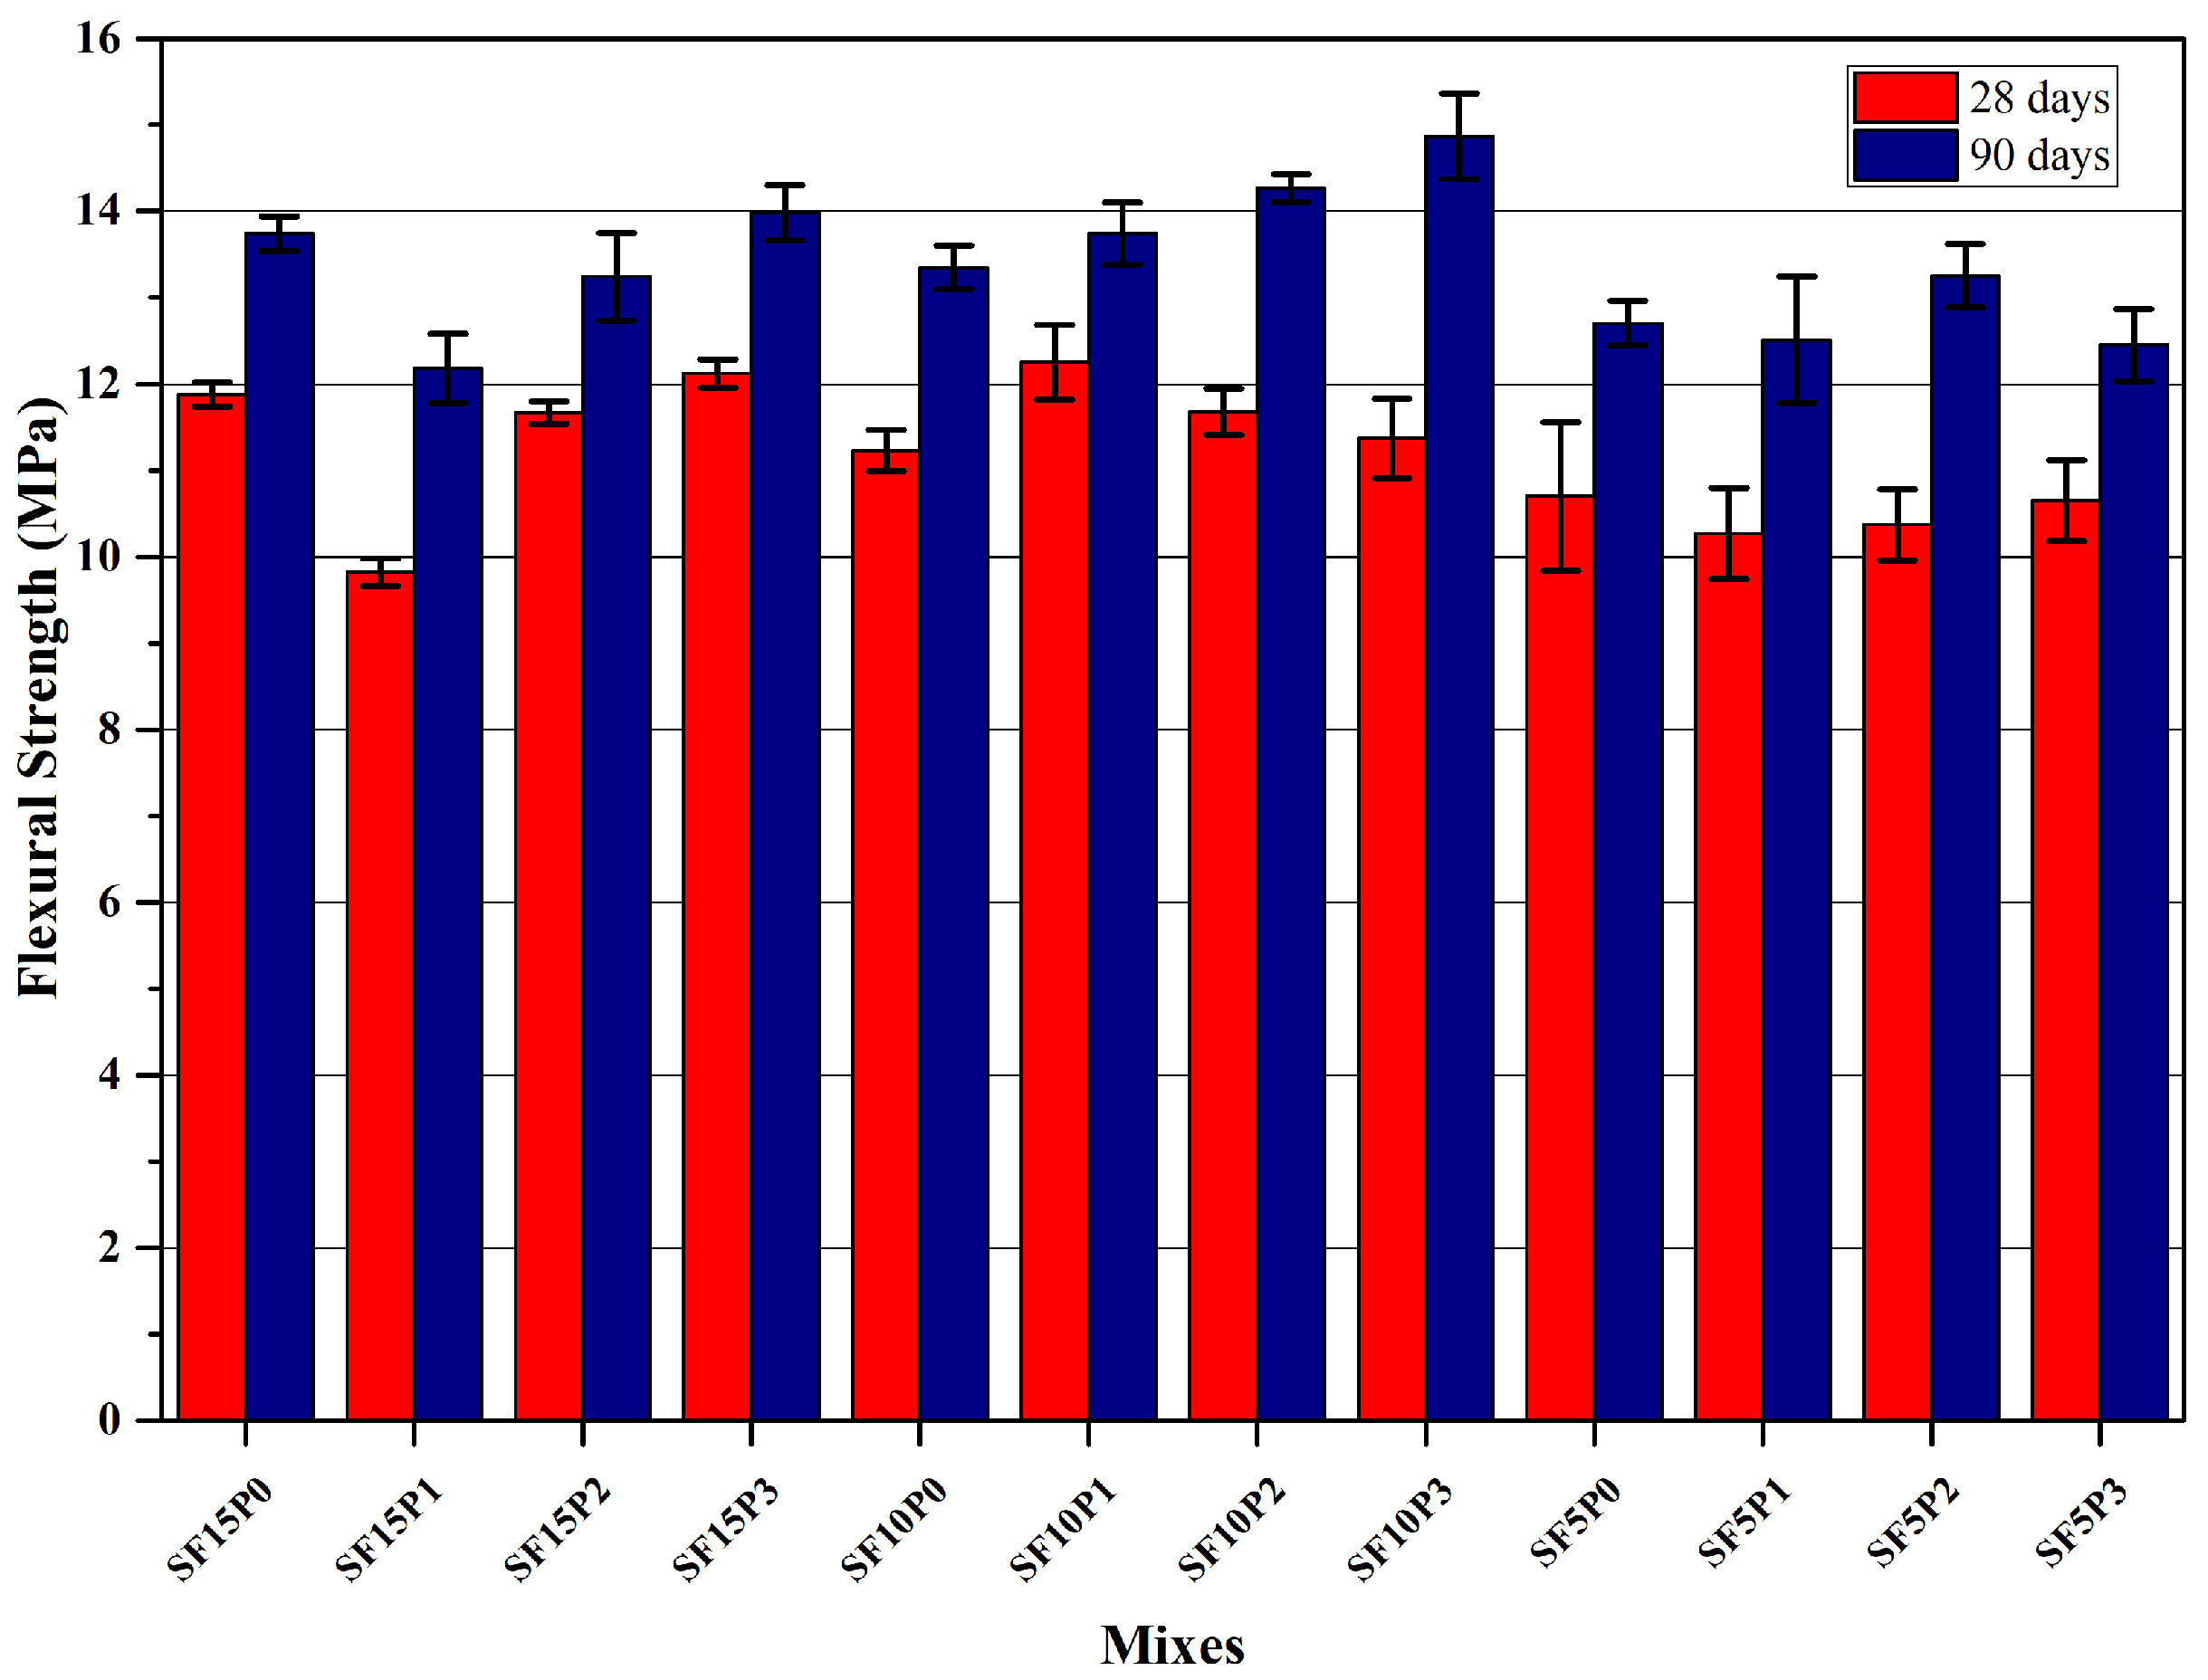
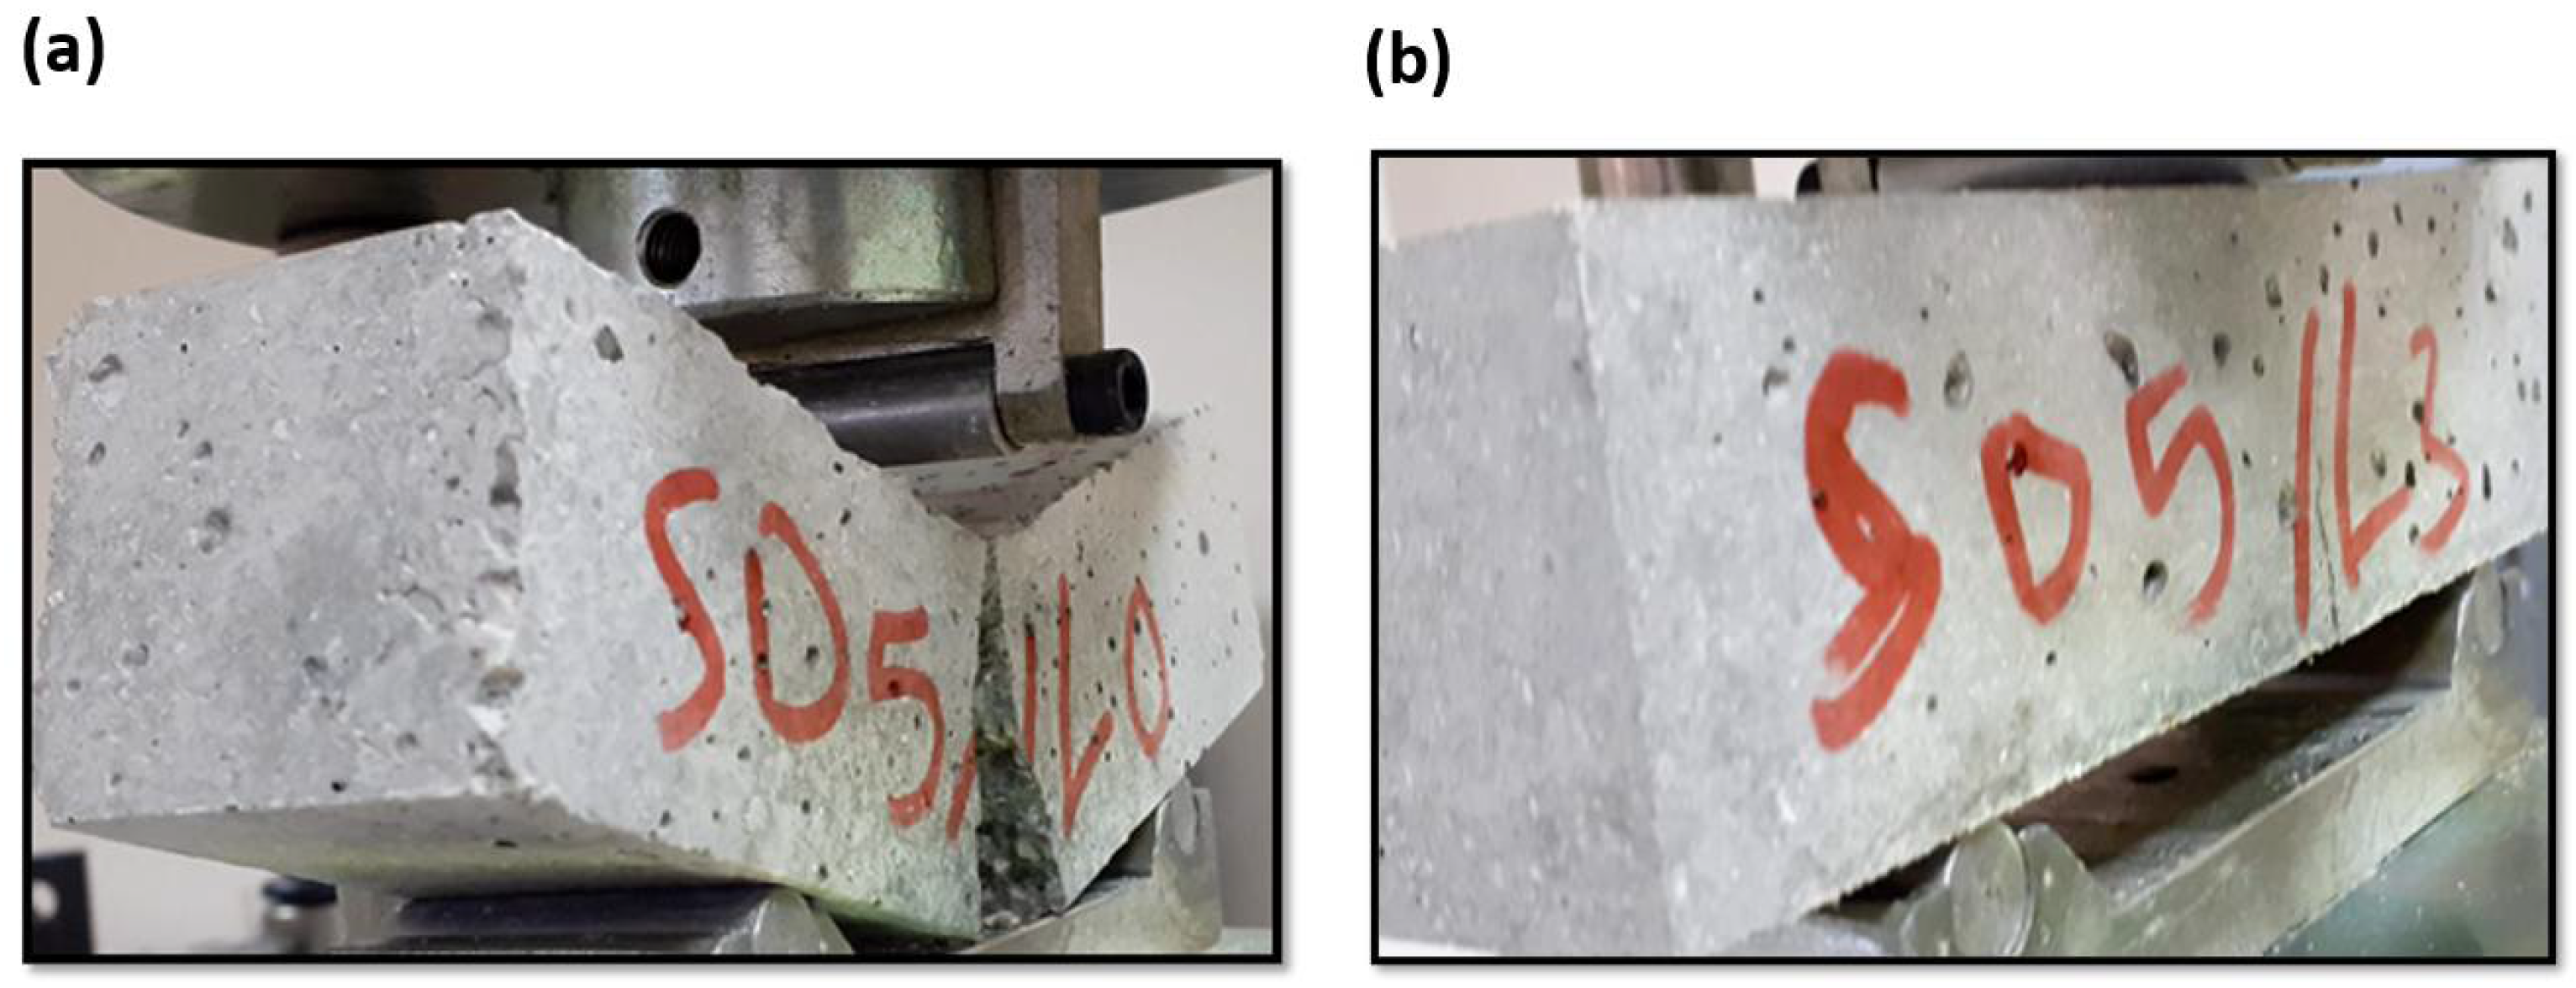
3.3.1. Flexural Strength

Figure 9, Figure 10 and Figure 11 demonstrate the flexural strength of mortars. The incorporation of fiber in different proportions puts different effects on the mortar samples. The added fibers caused both losses of strength and strength gain. This can be attributed to the way the experiment was conducted, the length of the fibers, and the random distribution of the fibers in the matrix. While determining the flexural strength, the load is applied with linear support in the middle of the sample. The cement matrix shows low performance under the tensile loads. However, the presence of fibers in the area where the tensile load is applied can improve this behavior, so it can be considered as the cause of the decrease and increase in strength caused by the addition of fibers. Meddah and Bencheikh [35] reported that different lengths of fiber could have different effects. It is stated that the incorporation of short fibers (30 mm) slightly decreased the flexural strength; however, when longer fibers were incorporated (50 and 60 mm), no significant effects on the flexural strength were observed.
The most significant rise in strength was noted in the sample coded SF10P1 for the results obtained at the age of 28 days, compared to the control sample with the CS0 code, it was noted that the flexural strength increased by 16.89%. Considering the strength rise obtained on the 90th day, the highest strength increase was seen in the SF10P3 sample, compared with the CS3 control sample, the flexural strength increased by 31.47%. In previous studies, observations were made that plastic fibers increase the flexural strength of concrete [36,37,38,39].
While the use of silica fume has been observed to improve flexural strength, micro silica has been observed to reduce strength. Flexural strength exhibited an increasing trend upon the increase in the silica fume content; however, with increasing the content of micro silica flexural, strength demonstrated a decreasing trend. This is because silica fume and micro silica had different particle sizes. The small particle size of the silica fume and the fact that it is a filler material provide a more compact structure by filling the gaps, while the micro silica has a large particle size, increasing the void ratio and decreasing the flexural strength. The micro silica was used as received without having any modification on it, and it was not passed through any process such as sintering. Flexural strength increased by 13.36%, 7.16%, and 2.10% compared to the control mixture for mixtures with 15%, 10%, and 5% silica fume content, while for mixtures with the same proportions of micro silica content, the flexural strength decreased by 18.51%, 16.41%, and 14.60%, respectively.
As seen in Figure 12, while the fiber-free specimens were divided into two; it was observed that the integrity of the piece was preserved owing to the added fibers even though cracks were formed in the mixtures with 3% fiber content. This was due to a sudden break or crack prevention of the fibers.

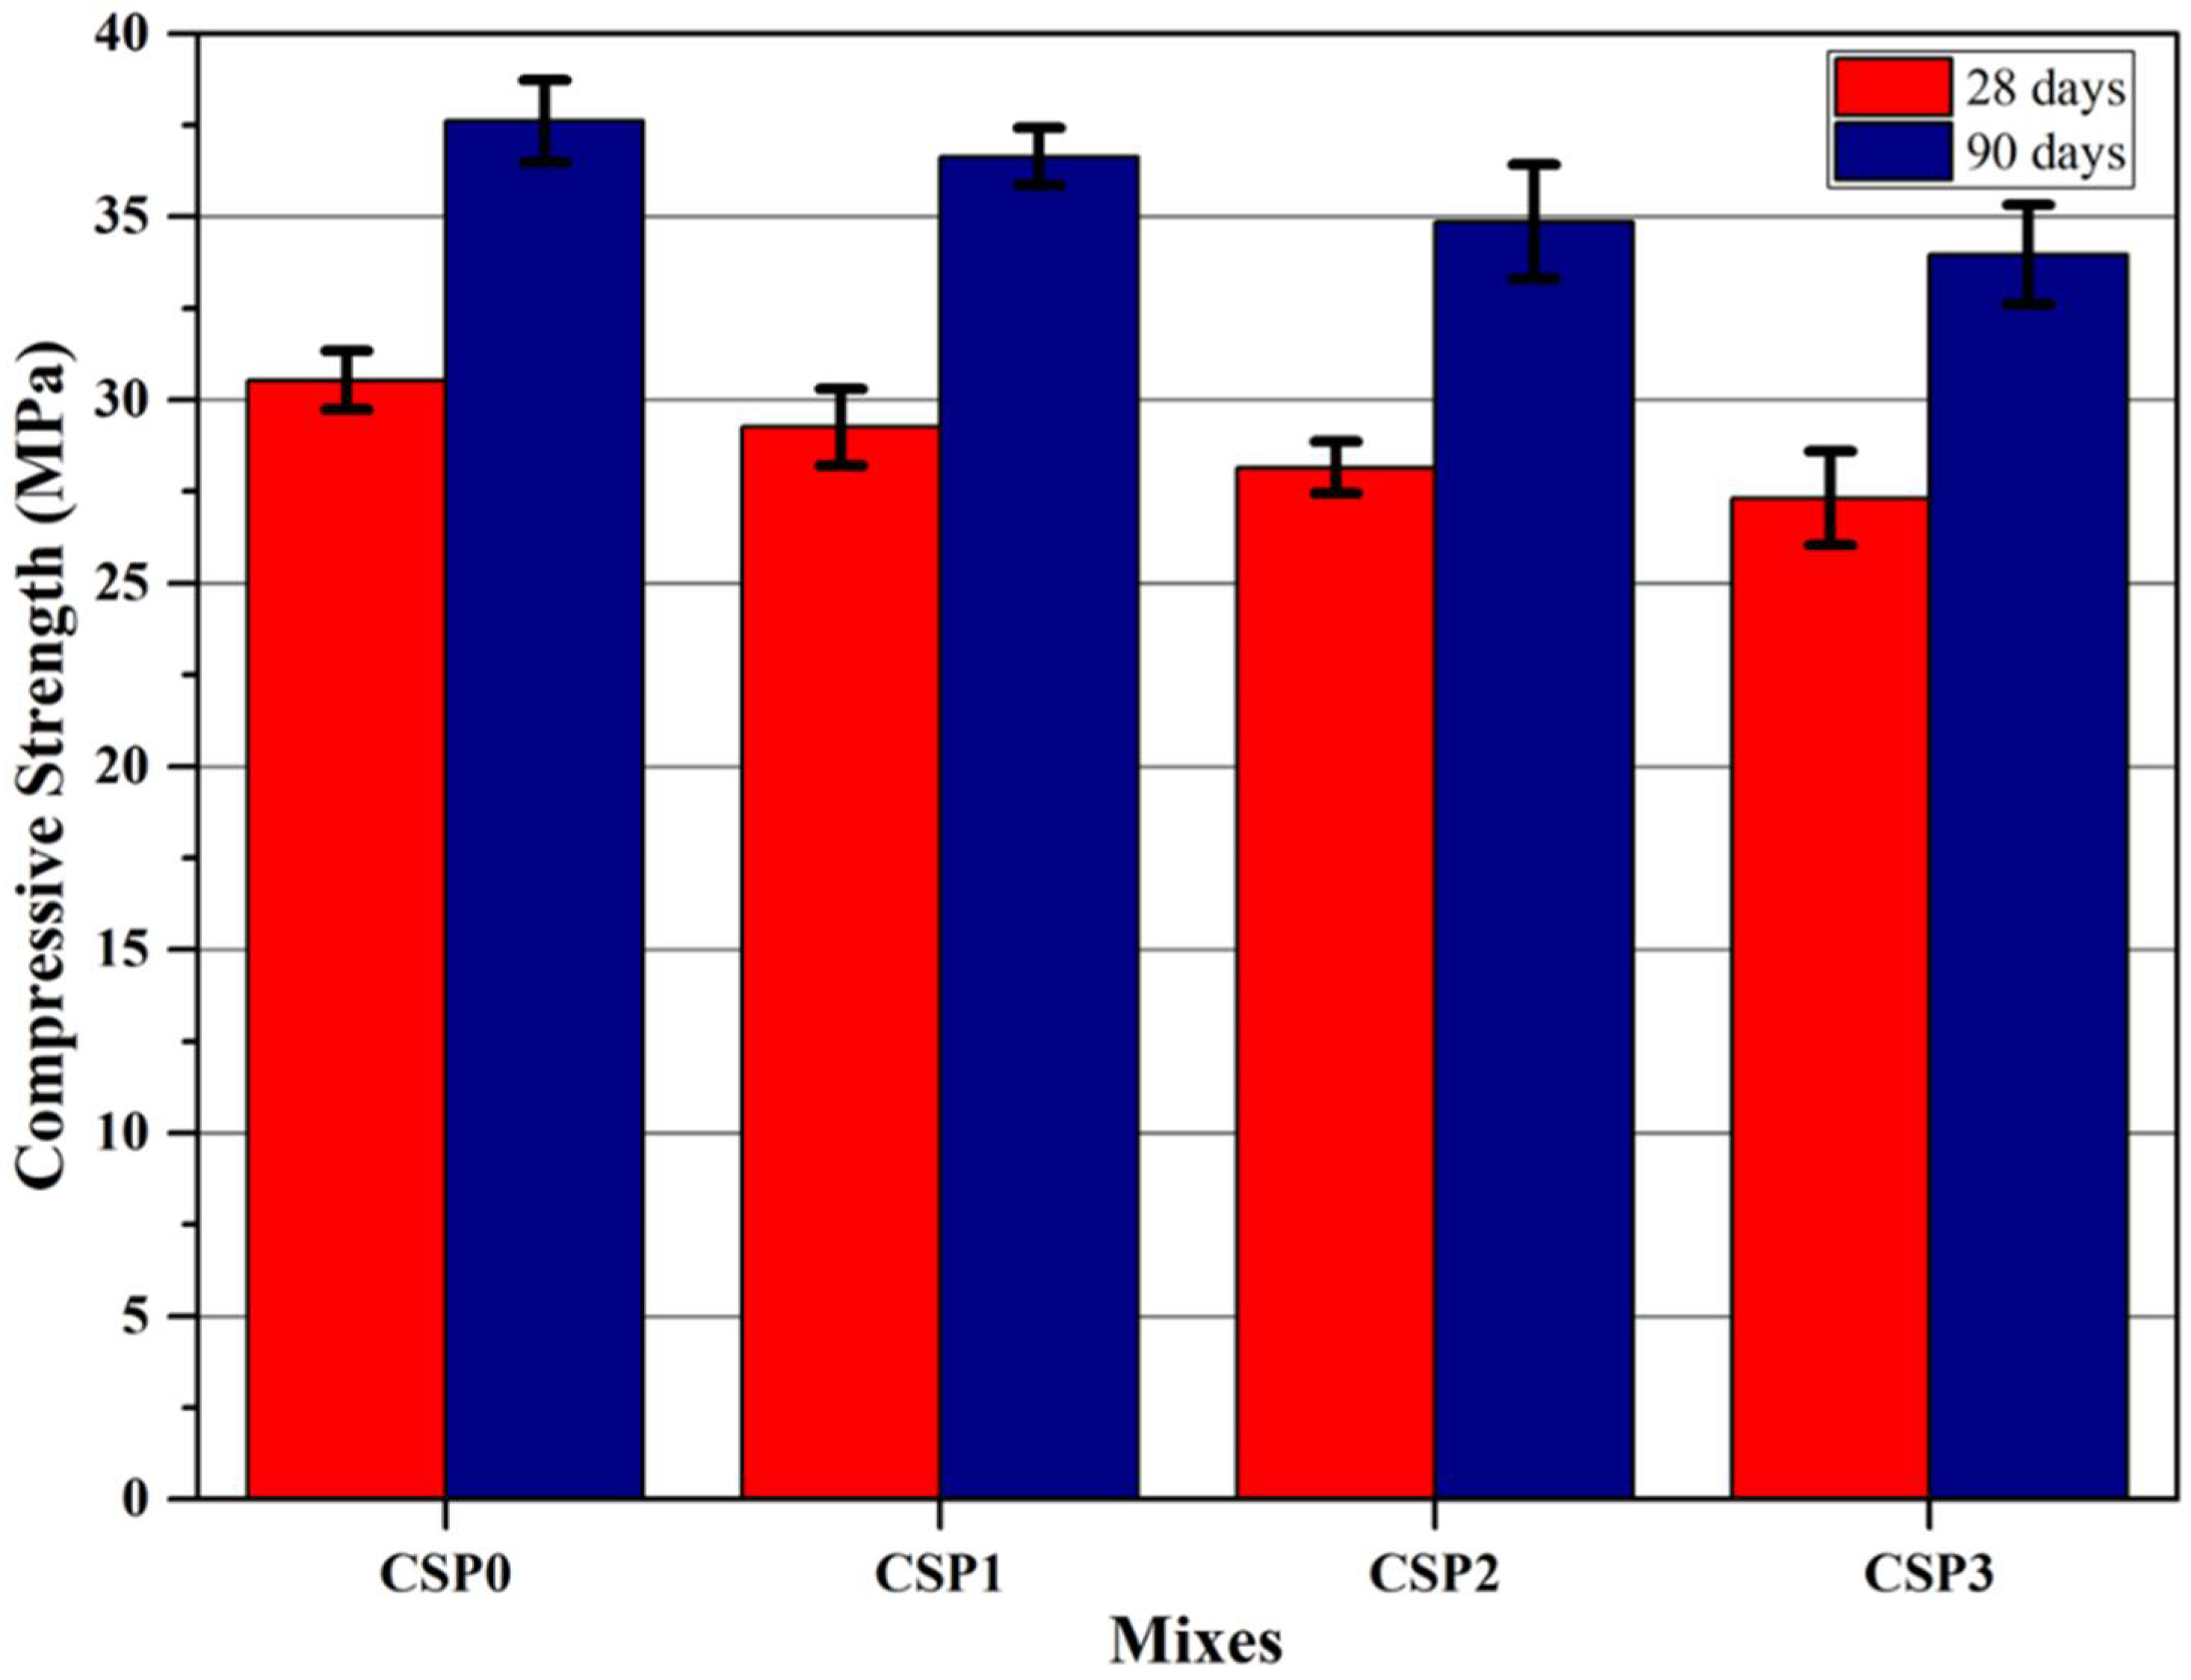
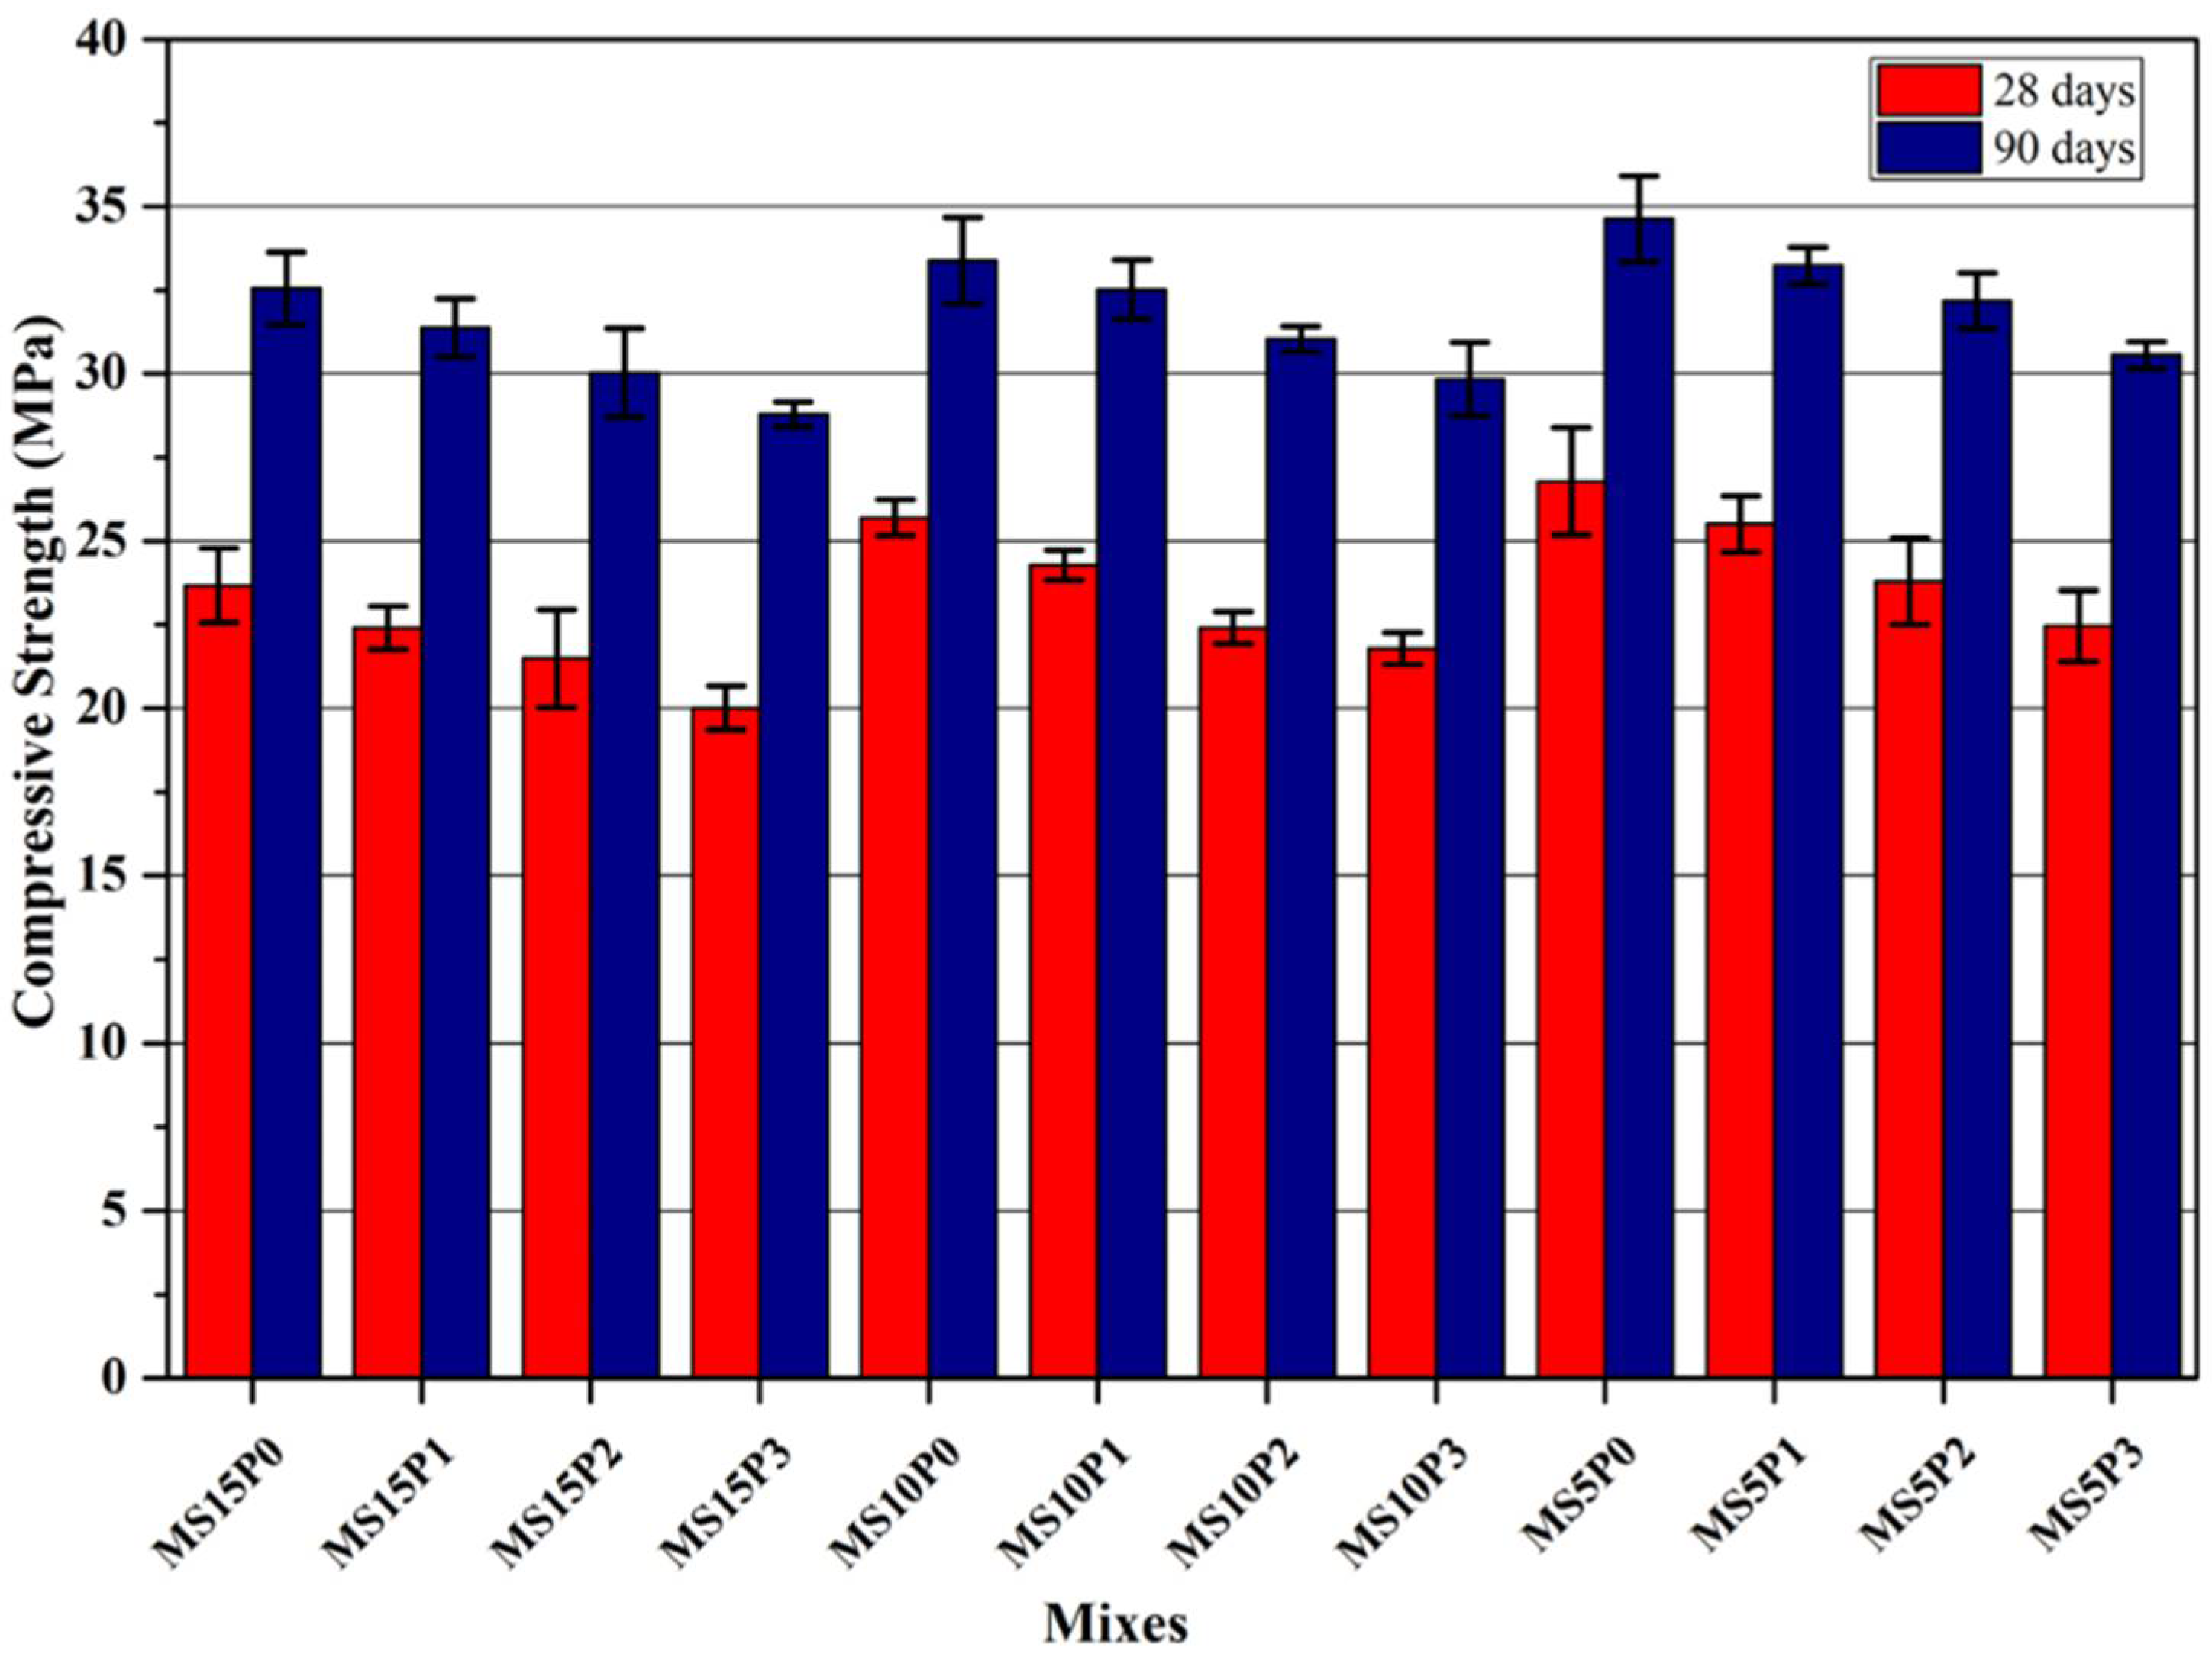
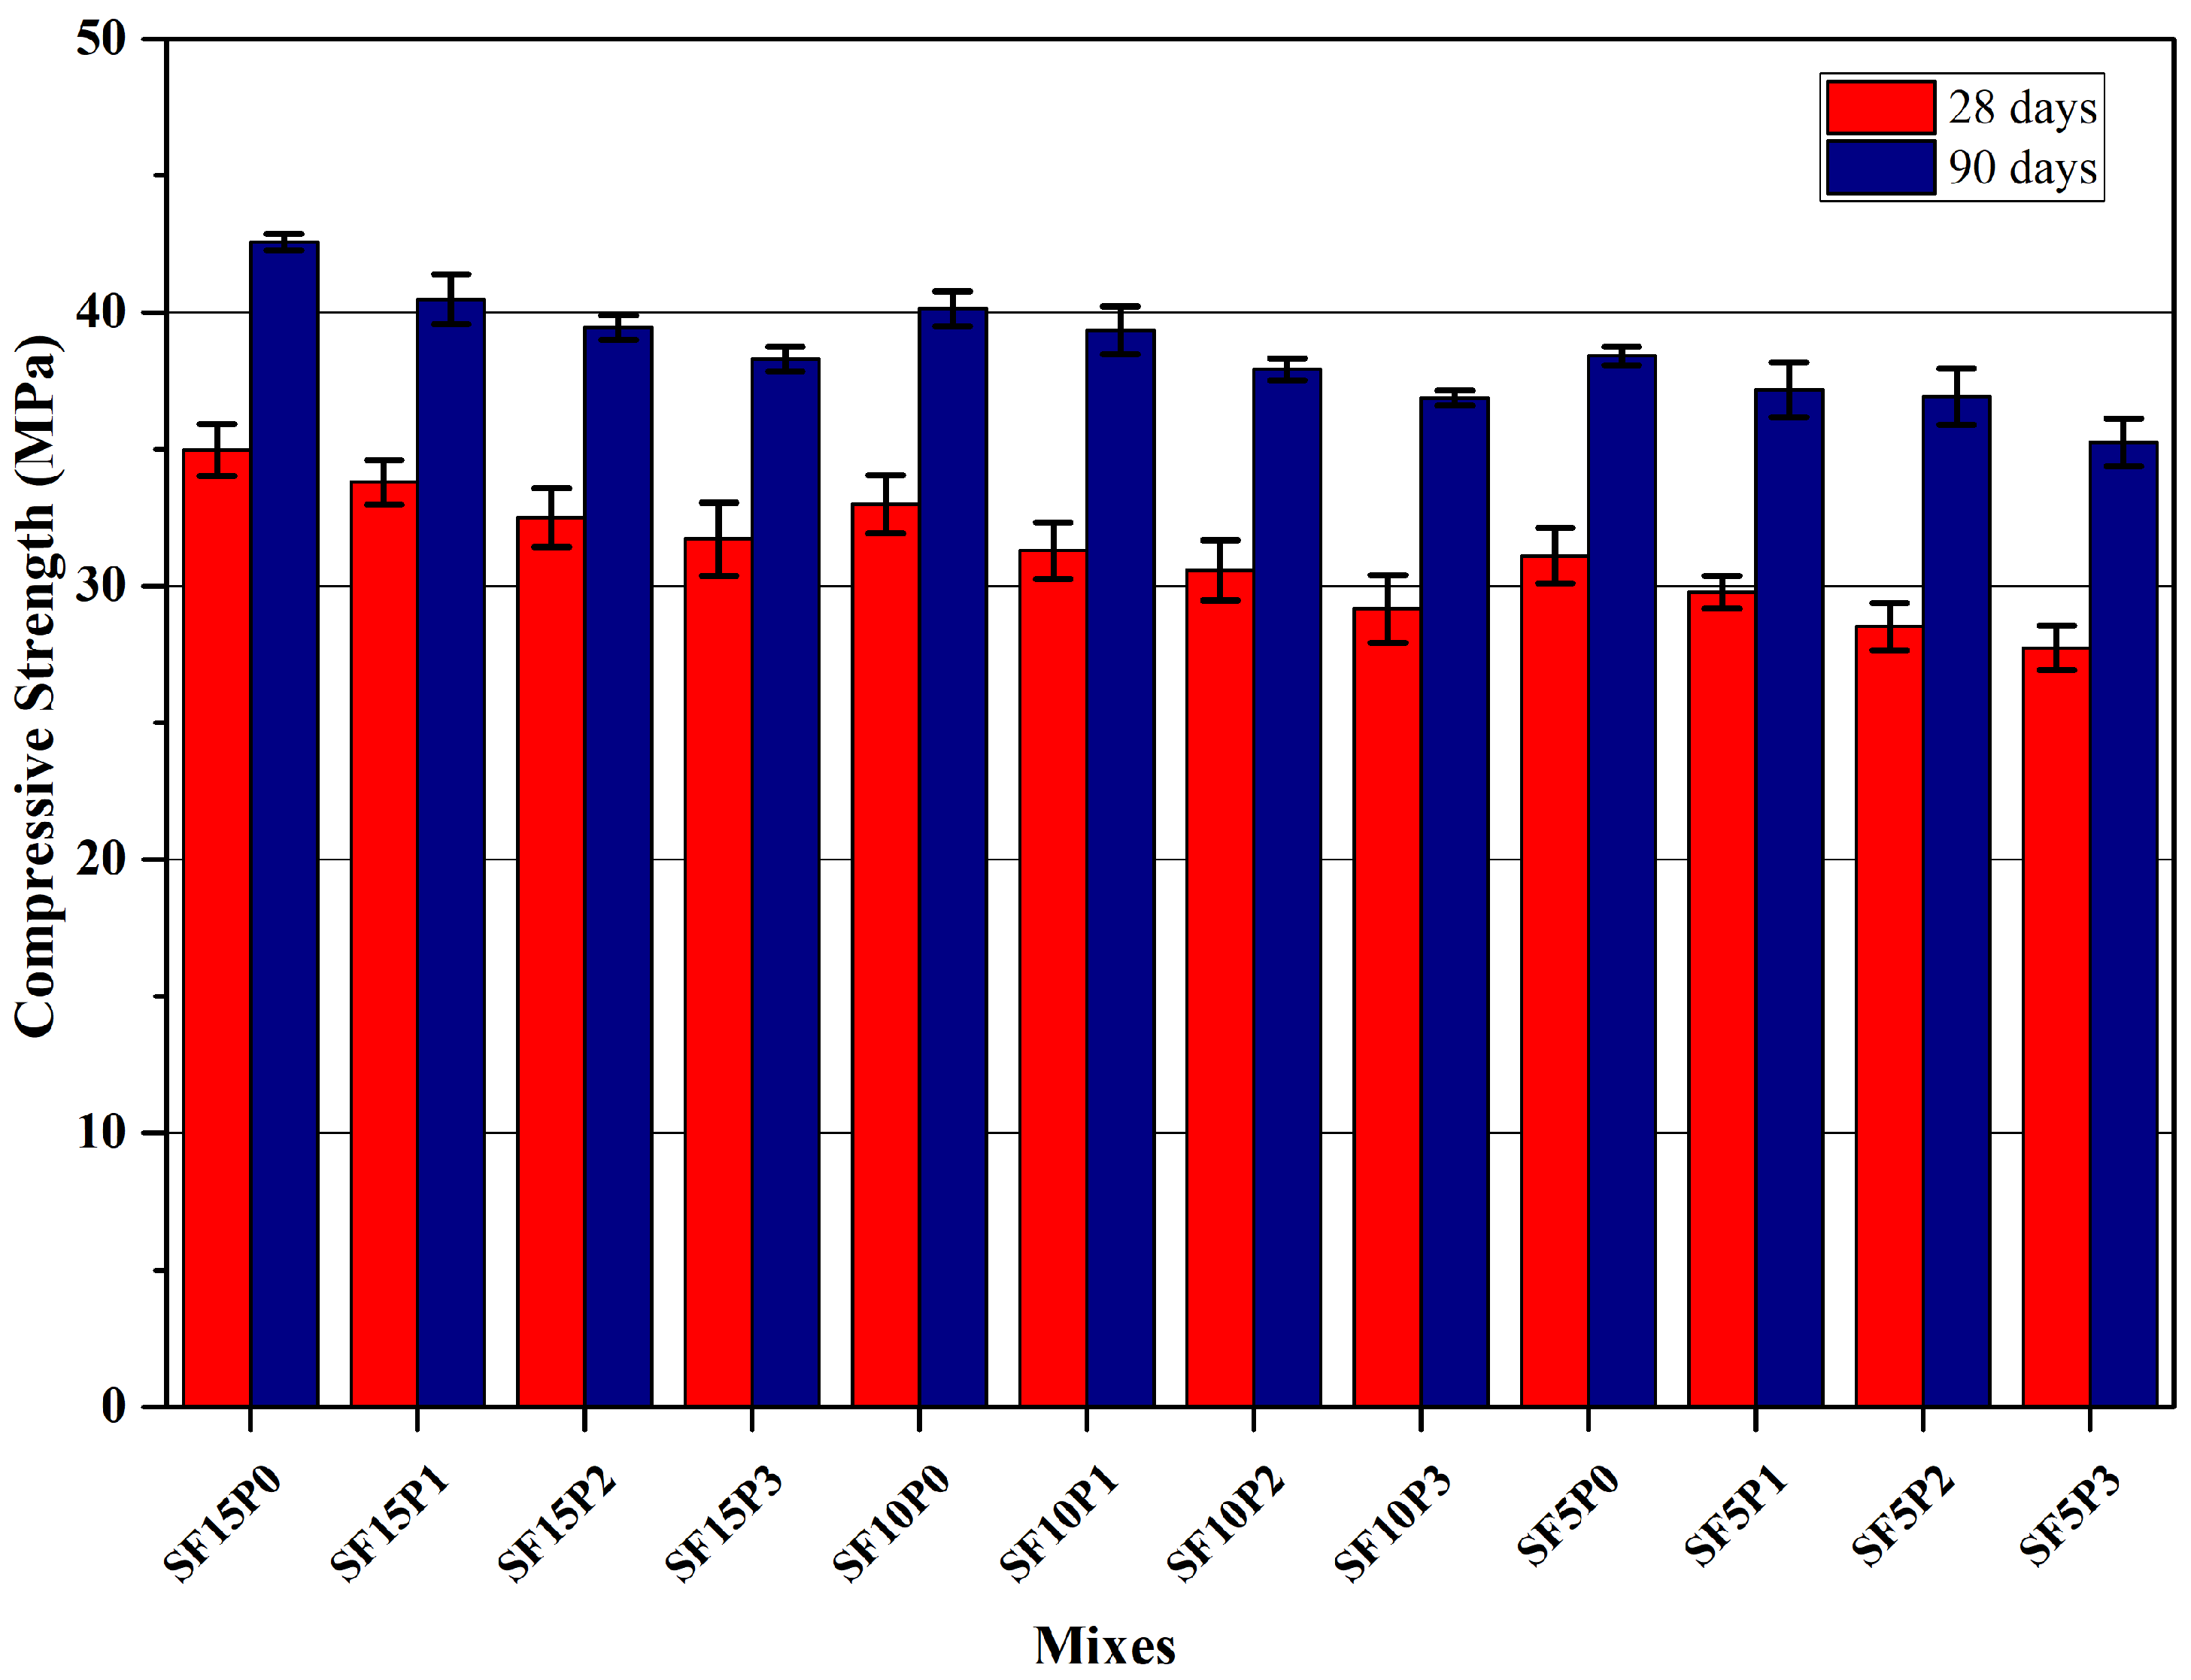
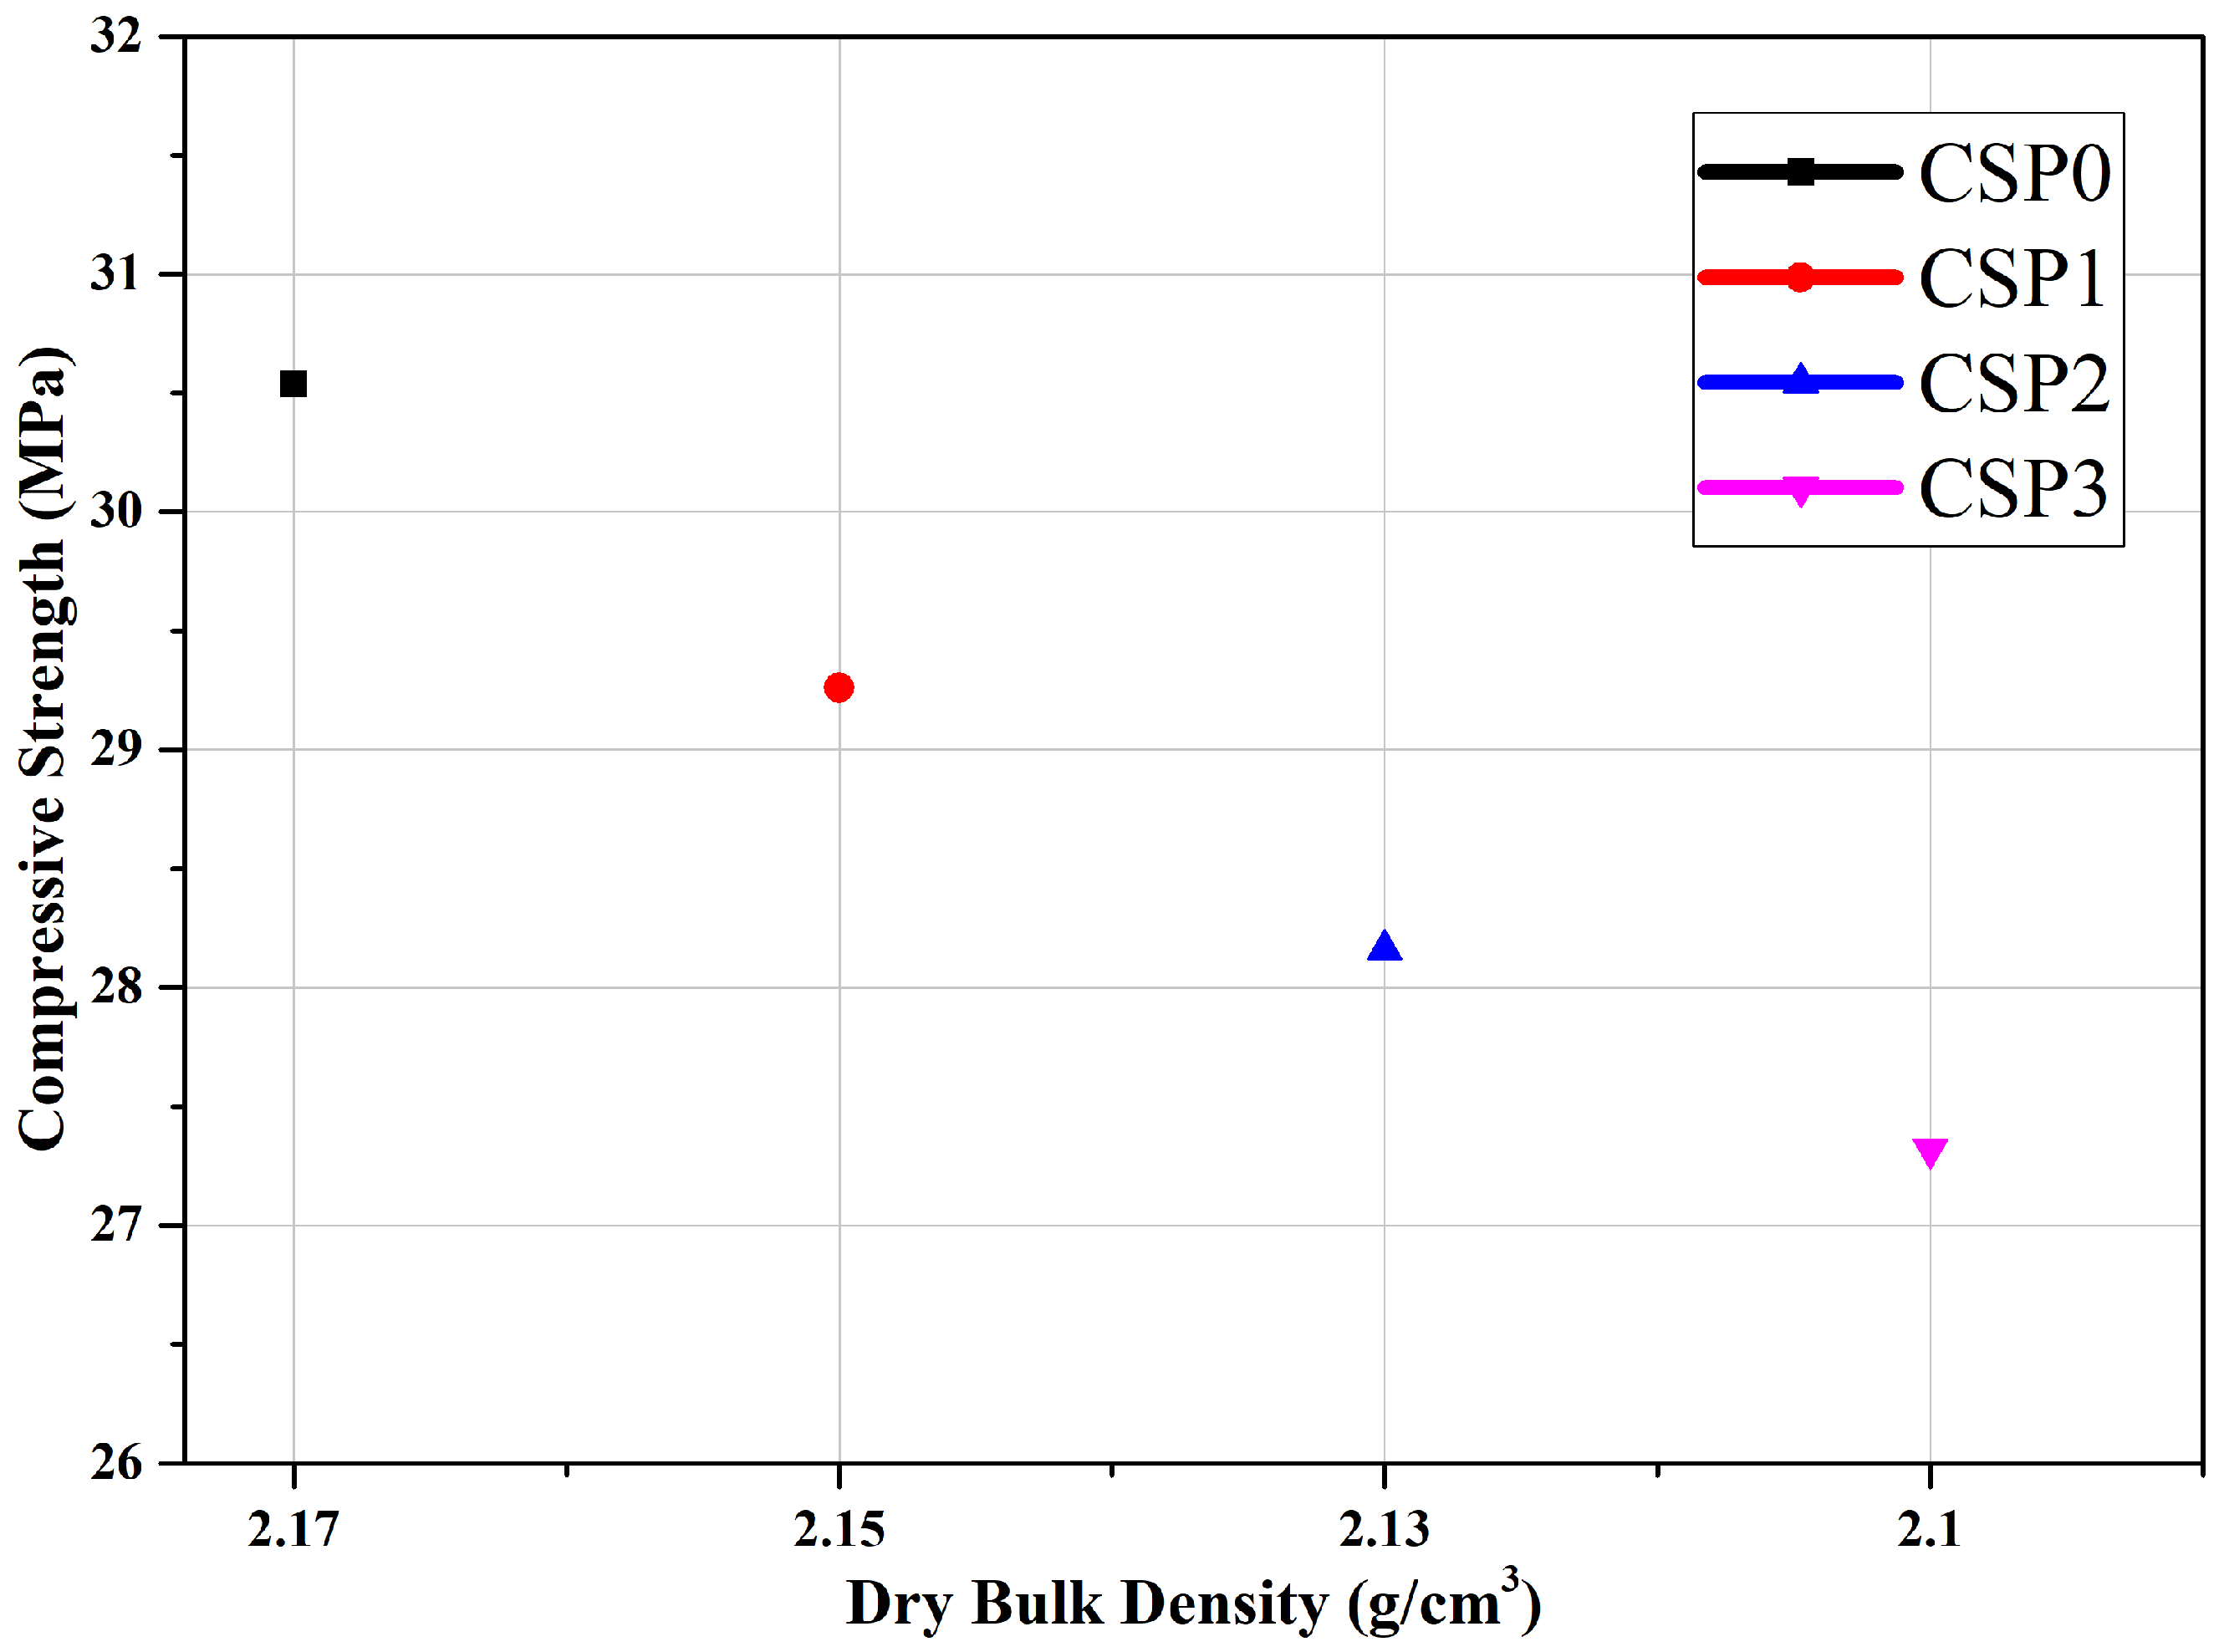
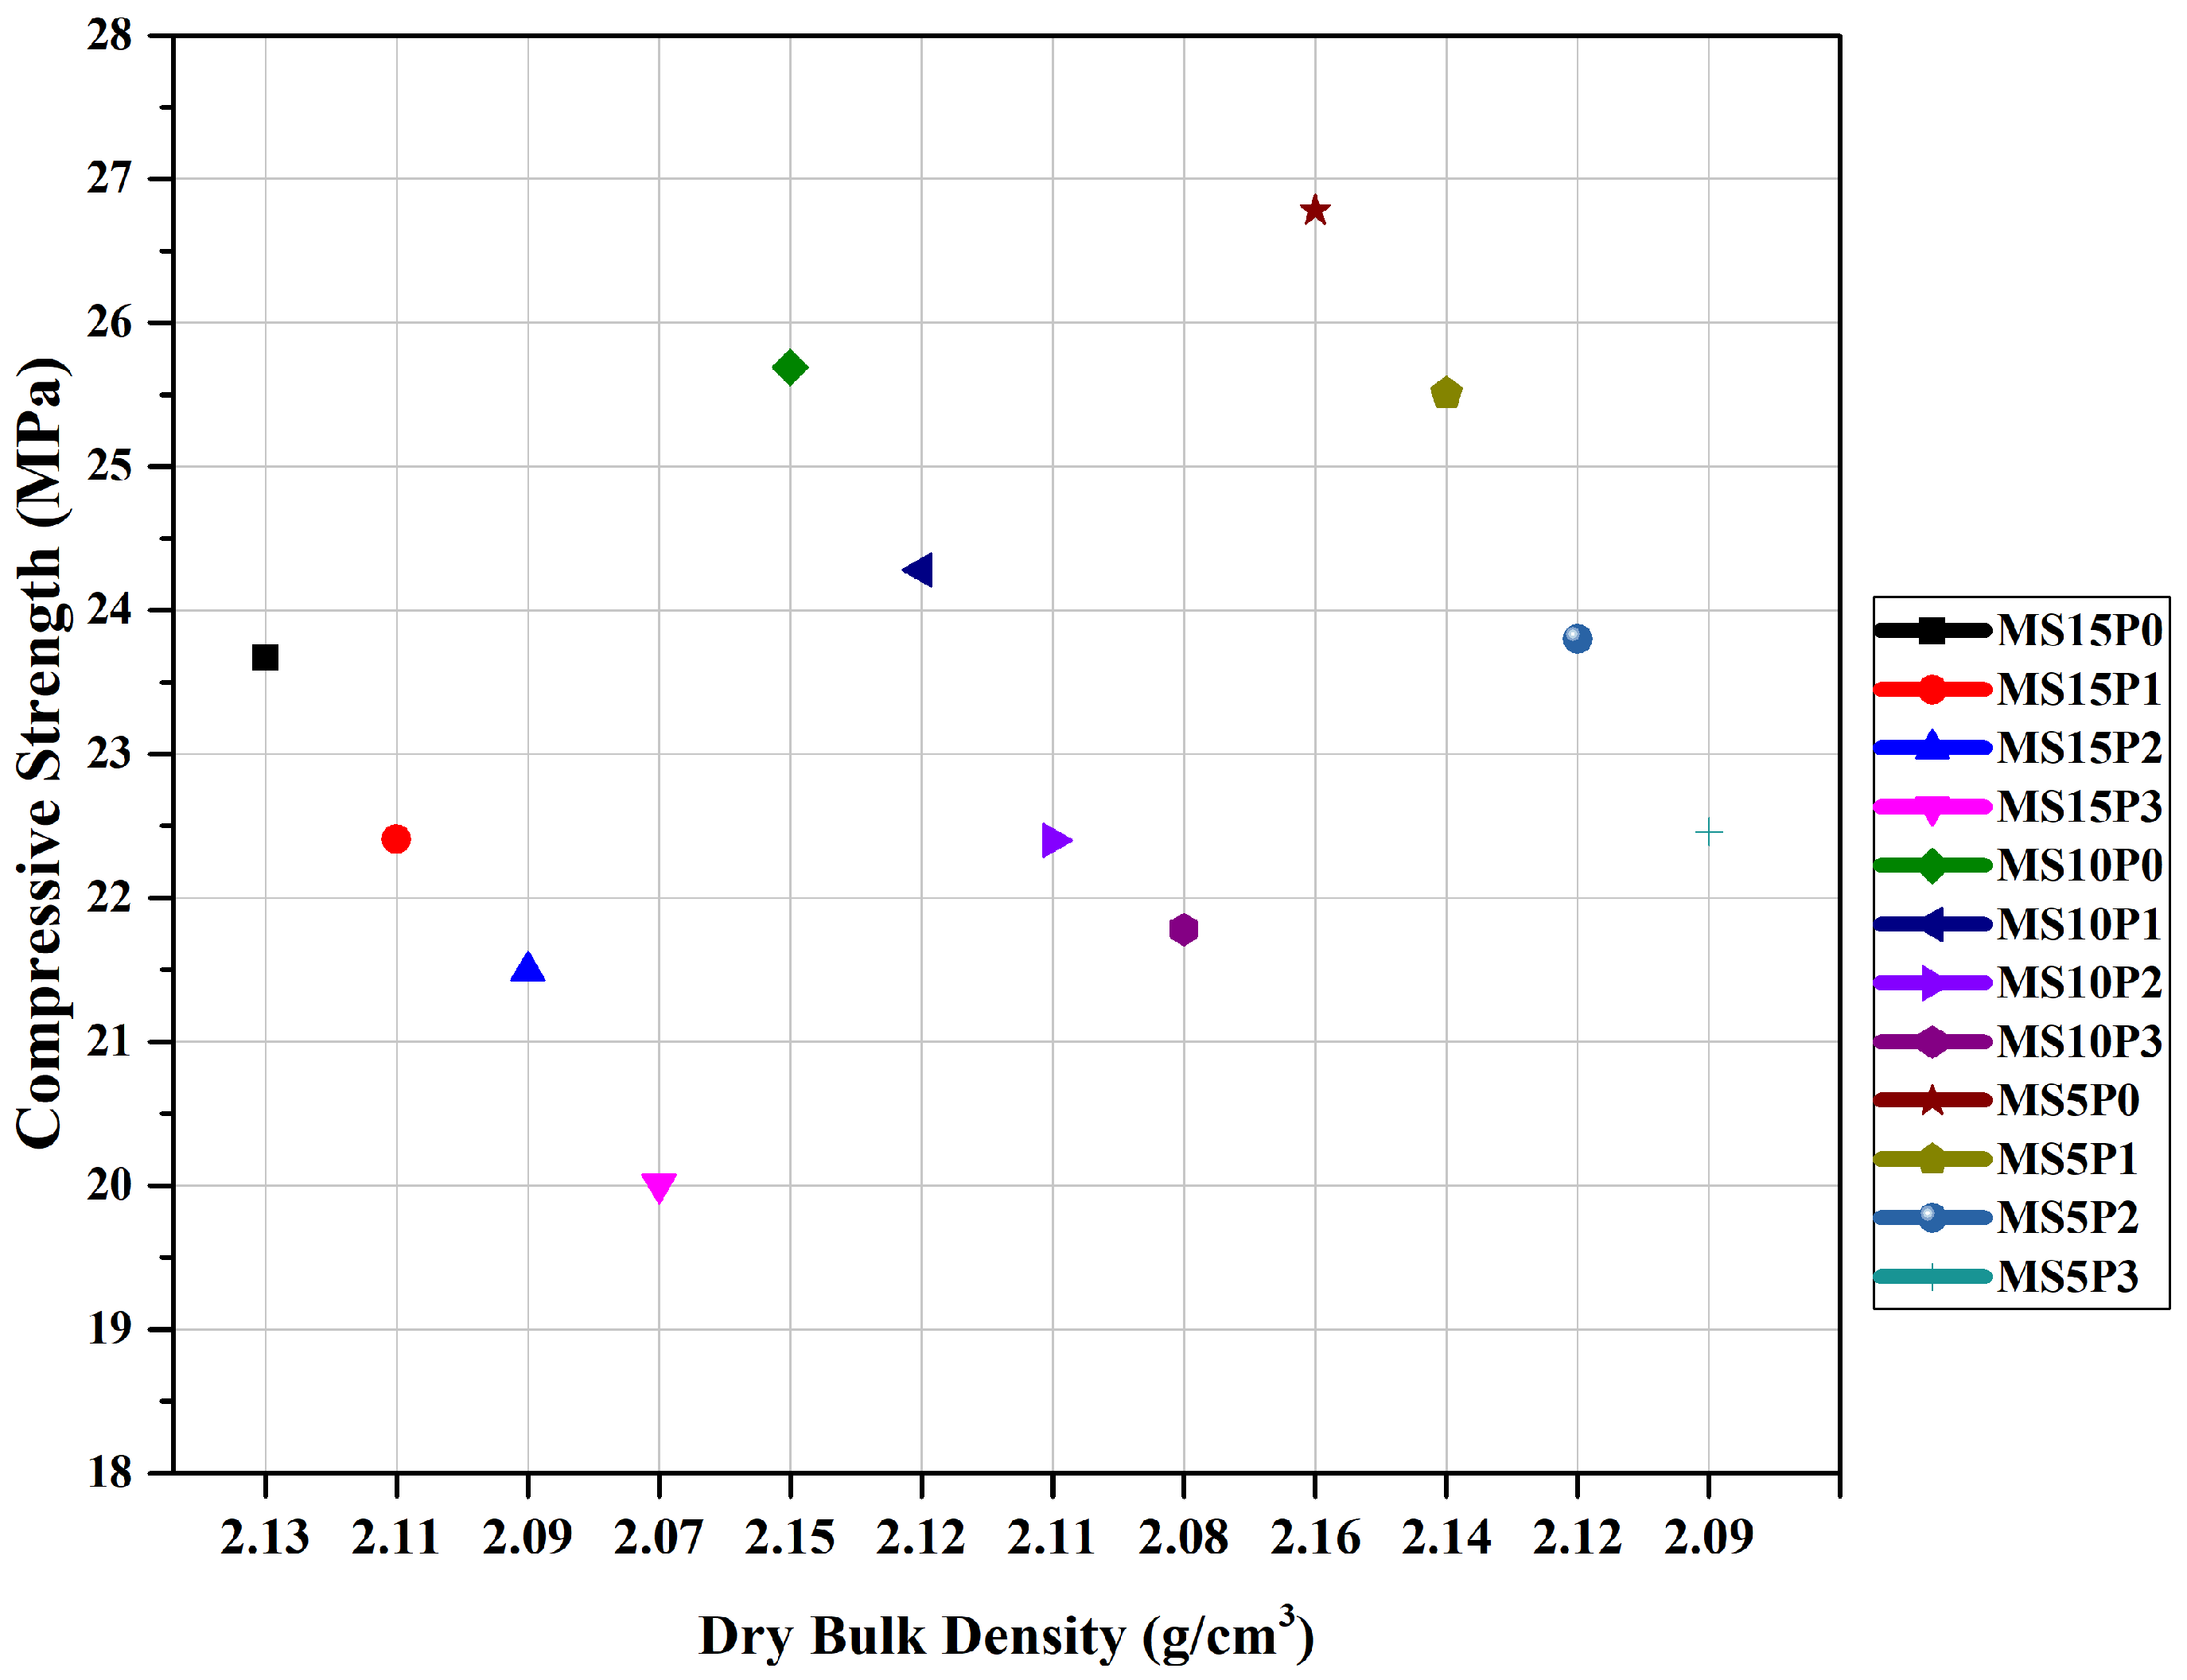
3.3.2. Compressive Strength

Figure 13, Figure 14 and Figure 15 demonstrate the compressive strength of mortars. The obtained results showed that micro silica and silica fume have different effects. While the use of silica fume increased the compressive strength, the use of micro silica led to a decrease in the compressive strength. The difference in strength can be attributed to the particle size of the pozzolanic materials used and the void ratio they created. The porosity test results described in the previous sections support these findings. The specimens containing micro silica had a more porous structure compared to the specimens having silica fume due to the larger particle sizes of micro silica. The small particle size of the silica fume has reduced the void ratios, resulting in a more compact structure.
The highest increase in compressive strength was seen in the fiber-free specimen with 15% silica fume content. Compared to the control sample, the compressive strength increased by 14.47%, 8.02%, and 1.83% for specimens with 15%, 10%, and 5% silica fume, respectively. This increase in compressive strength can be explained by the fact that the addition of silica fume improves the adhesion and interface transition zone between cement paste and aggregates, and also fills the voids in the cement paste, producing a denser cement matrix, consequently increasing the compressive strength [30]. On the other hand, considering the samples containing 15%, 10%, and 5% micro silica, the compressive strength decreased by 22.50%, 15.88%, and 12.31%, respectively, compared to the control sample.
It has been observed that the compressive strength gradually decreases with the increase in fiber ratio in all mixtures, but this decrease is not more than 11.12%. The obtained results agree with the previous literature, which states a decline in the compressive strength with the increase in the plastic fiber content [1,30,40]. Fraternali et al. [40] reported a reduction of up to 8.3% in the compressive strength of concrete samples containing plastic fiber compared to the non-fiber-containing reference sample.
Although the added fiber does not show a positive effect in terms of improving the strength, it is possible to say that it has a positive effect in terms of protecting the integrity of the mortar and preventing its breakdown (Figure 16). The highest loss of compressive strength was detected in specimens with 3% fiber. The void ratio was higher in the reinforced samples than in the non-reinforced ones. The decrease in strength can be attributed to the increased amount of voids and the low interfacial bond between fiber and cement matrix [29]. In addition, since the strength of the fiber is lower than the strength of the matrix, it can be said that the mortar acts to reduce the strength by acting as a hollow structure. The aspect ratio (defined as the ratio of fiber length to diameter) and geometry of the fibers are one of the factors affecting the compressive strength of mixtures containing plastic fibers.
A directly proportional relationship was noticed between compressive strength and dry bulk density. The compressive strength of the mortars increased with the increase in the dry bulk density and took lower values with the decrease. This trend is observed in all mixes with different ratios and ingredients (Figure 17, Figure 18 and Figure 19).

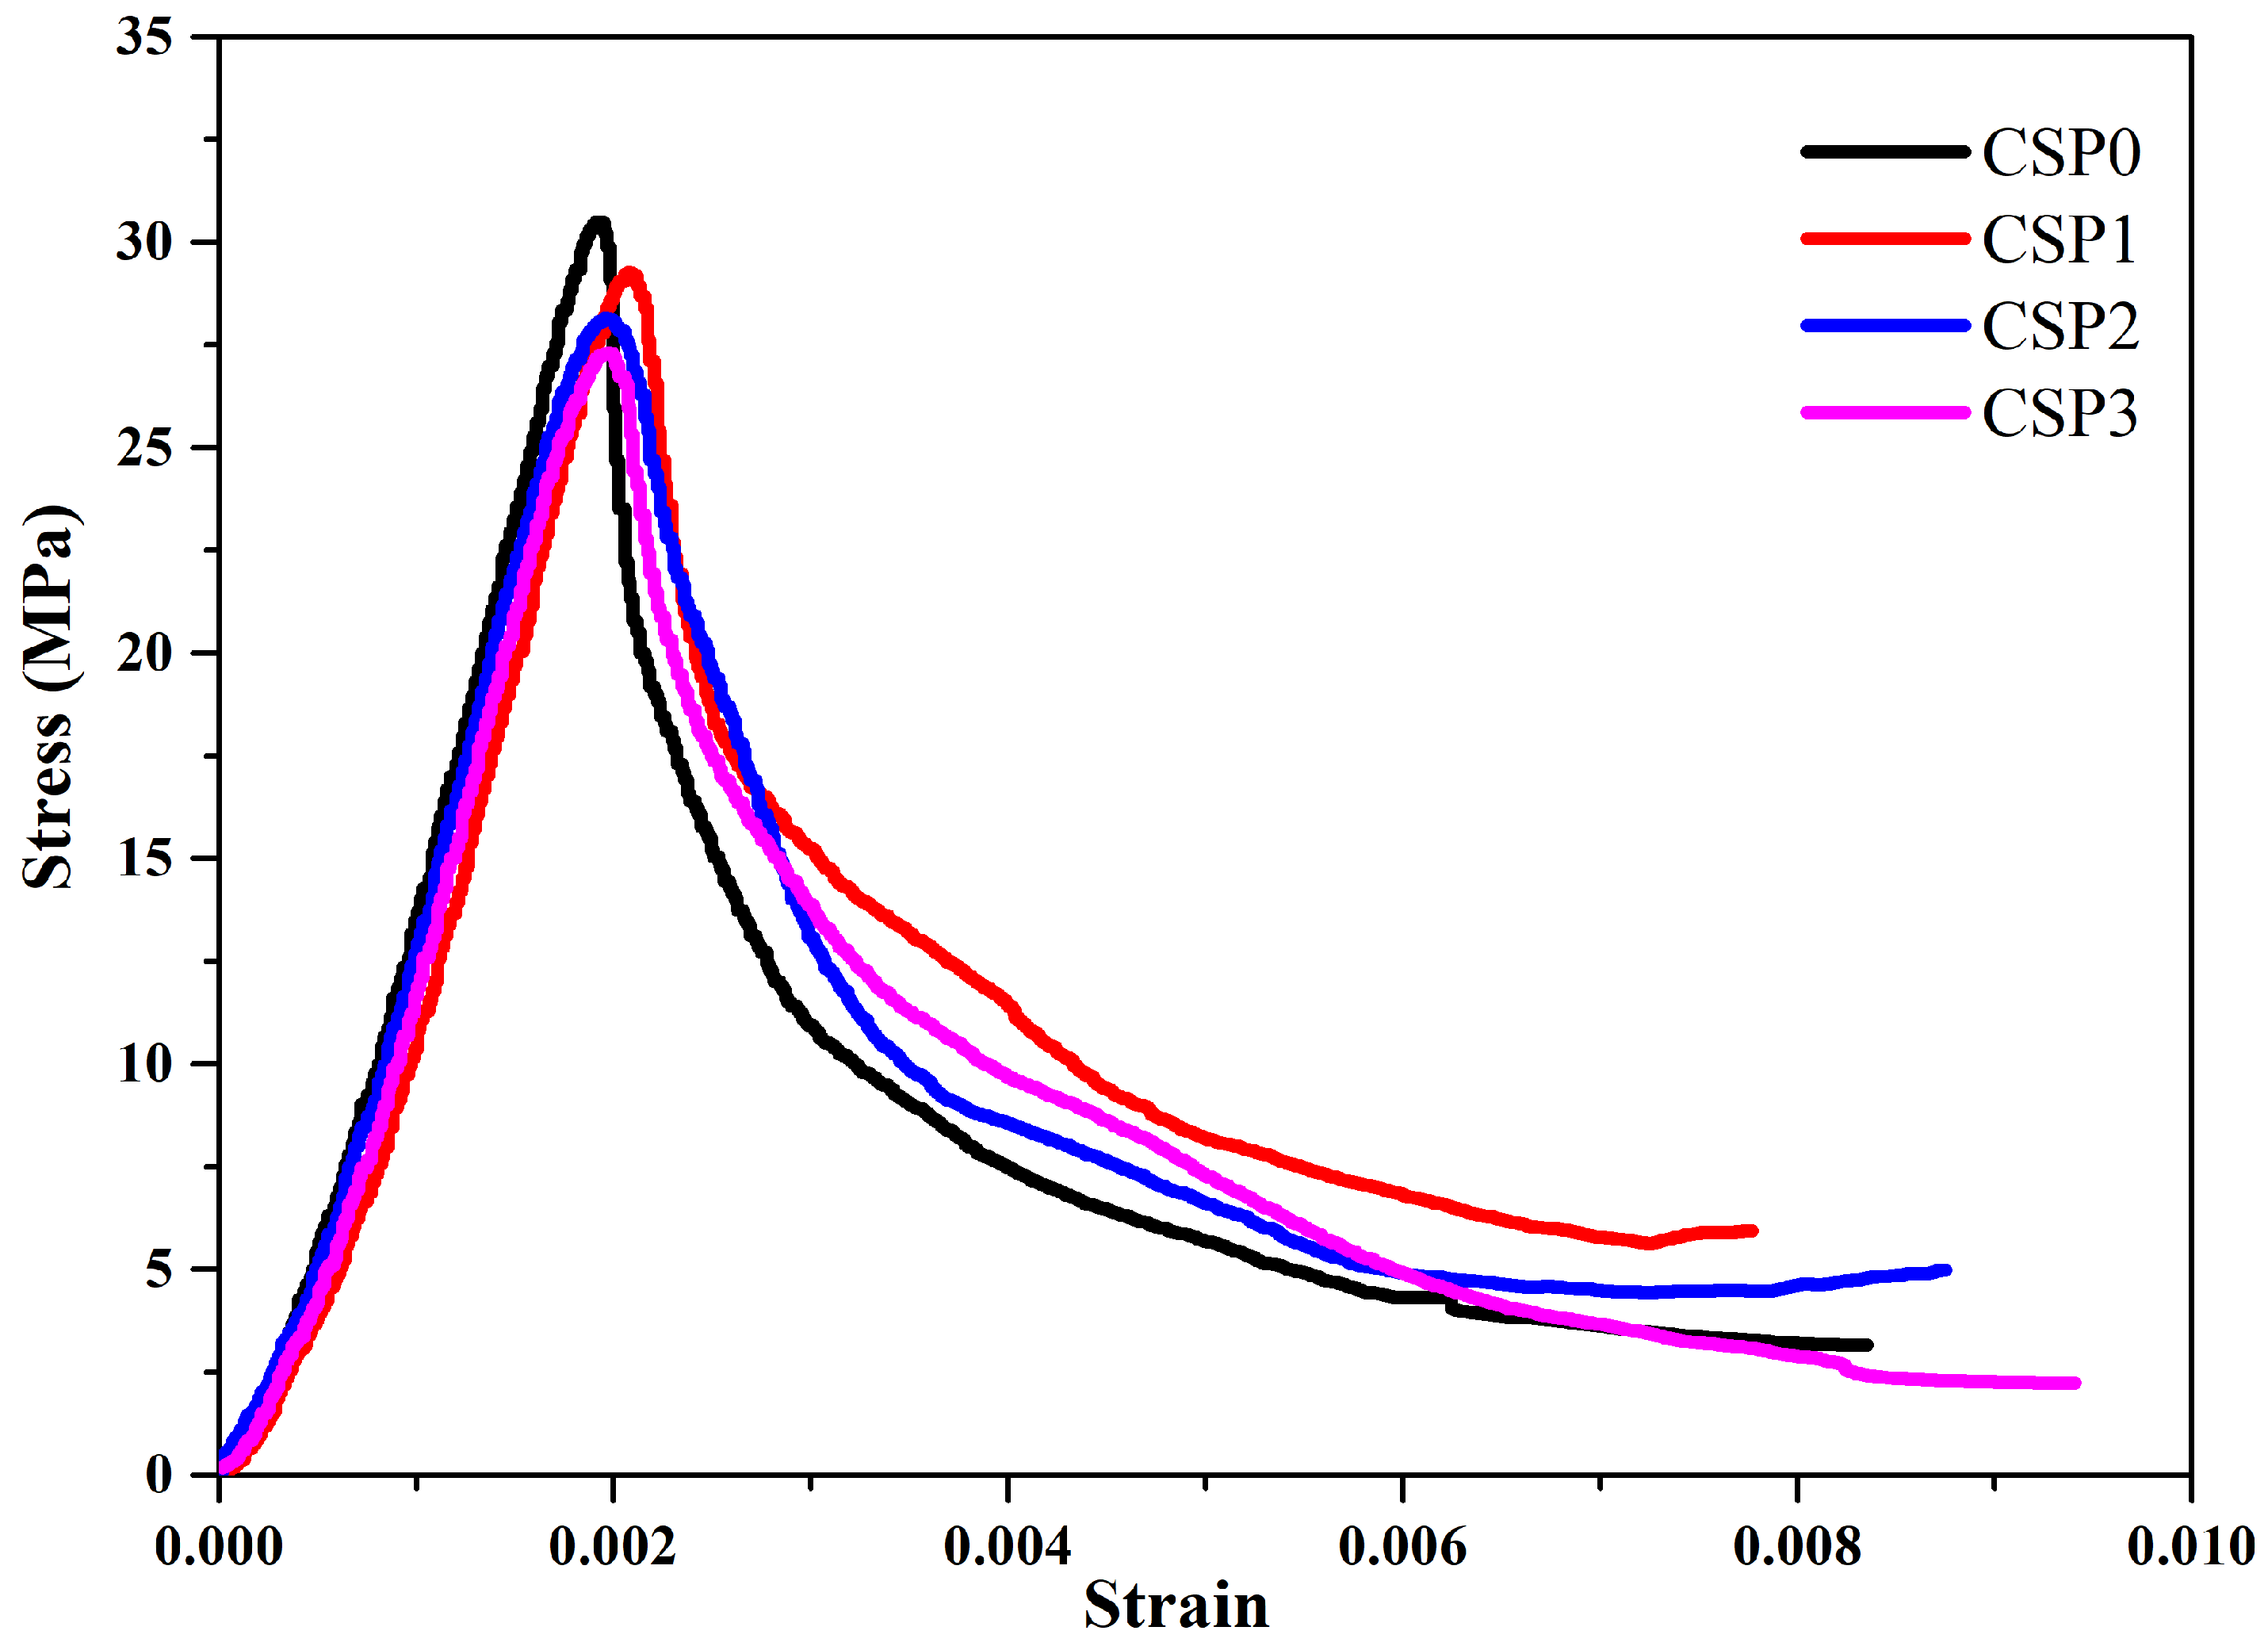
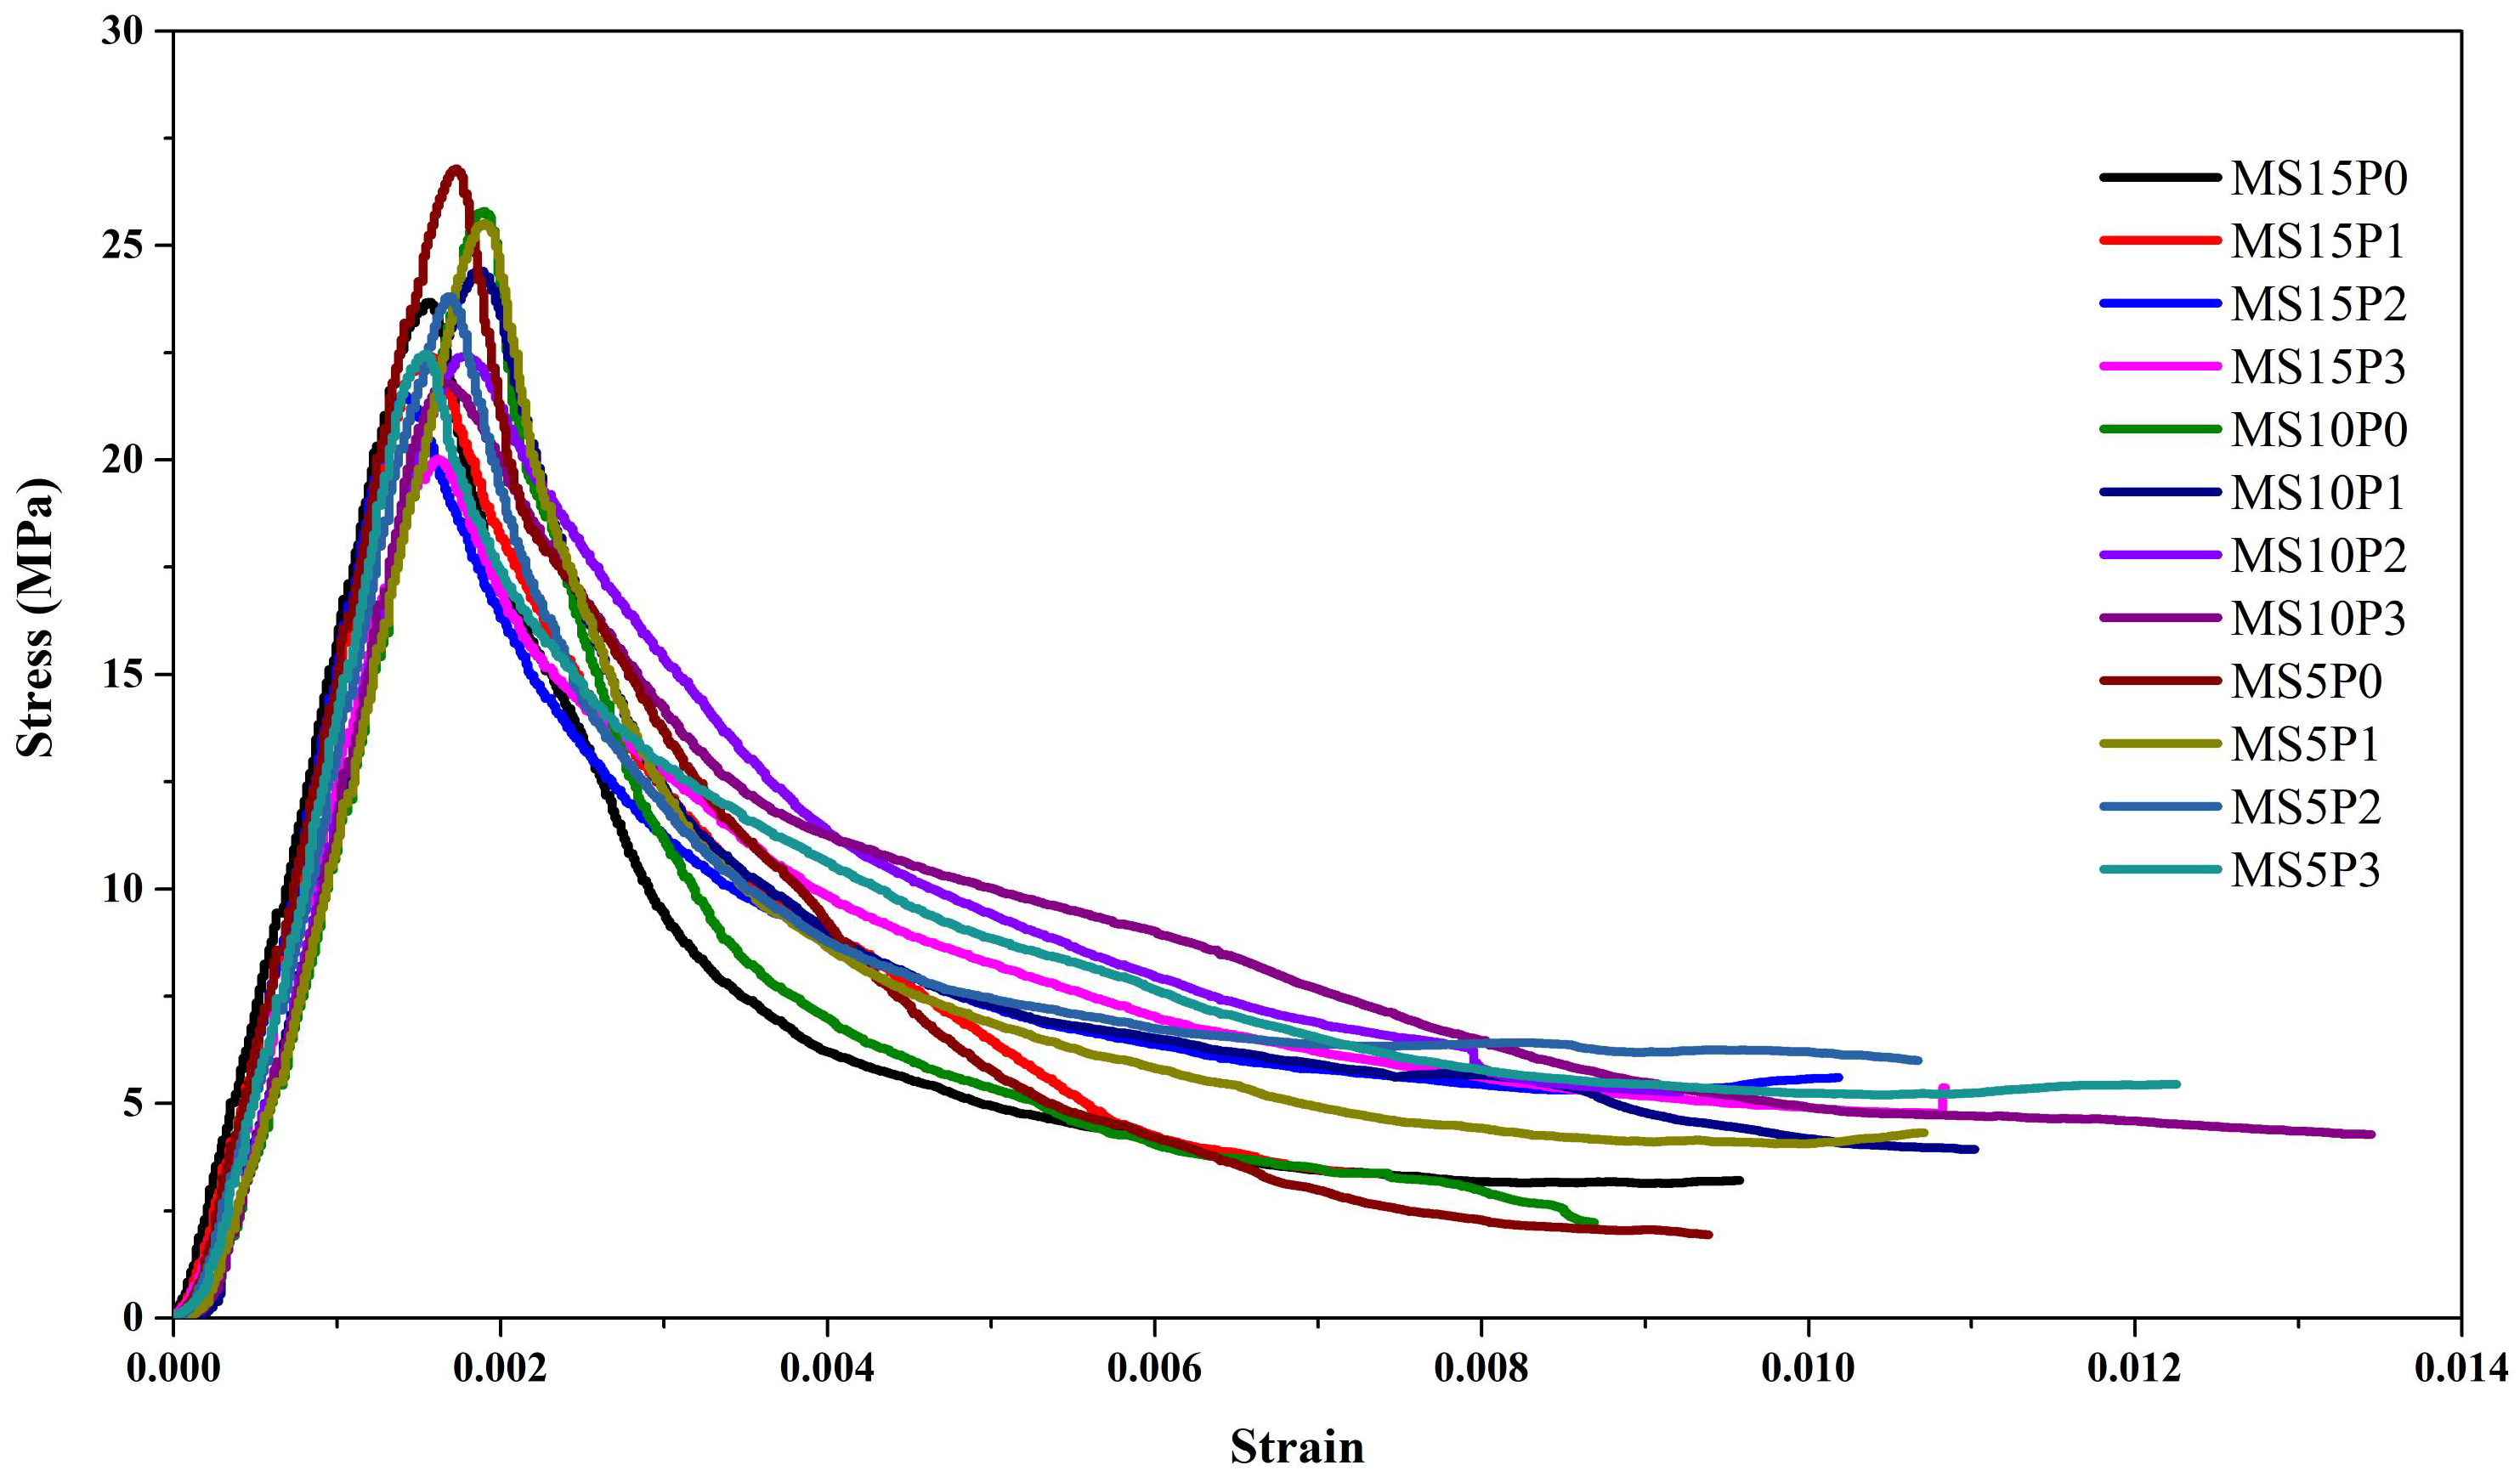
3.3.3. Stress–Strain Behavior

The stress-strain curves are shown are in Figure 20 and Figure 21. When the stress–strain curves are examined, although the strength gradually decreased with the increase in the fiber ratio in all of the mixtures, the mixtures showed more deformation and reached the final strength by carrying more loads. In other words, mixtures with high fiber content showed a more ductile behavior than those without fiber. The resistance of the randomly dispersed fibers in the mortar matrix against crushing, splitting, and crusting of the mortar under load improved the strain behavior of the mortar (Figure 16).
It can be said that the added fibers improved the post-fracture behavior of the mortars and prevented crack formation and spreading. Considering the MS10 series, the compressive strength values for 0%, 1%, 2% and 3% fiber ratio at 0.0075 strain were 3.24, 5.65, 6.52 and 6.96 MPa, respectively. While the stress–strain curve in the elastic region exhibits almost the same behavior in all mixtures regardless of the fiber ratio, it has been observed that it exhibits a more ductile behavior with the increase in the fiber ratio in the plastic region.

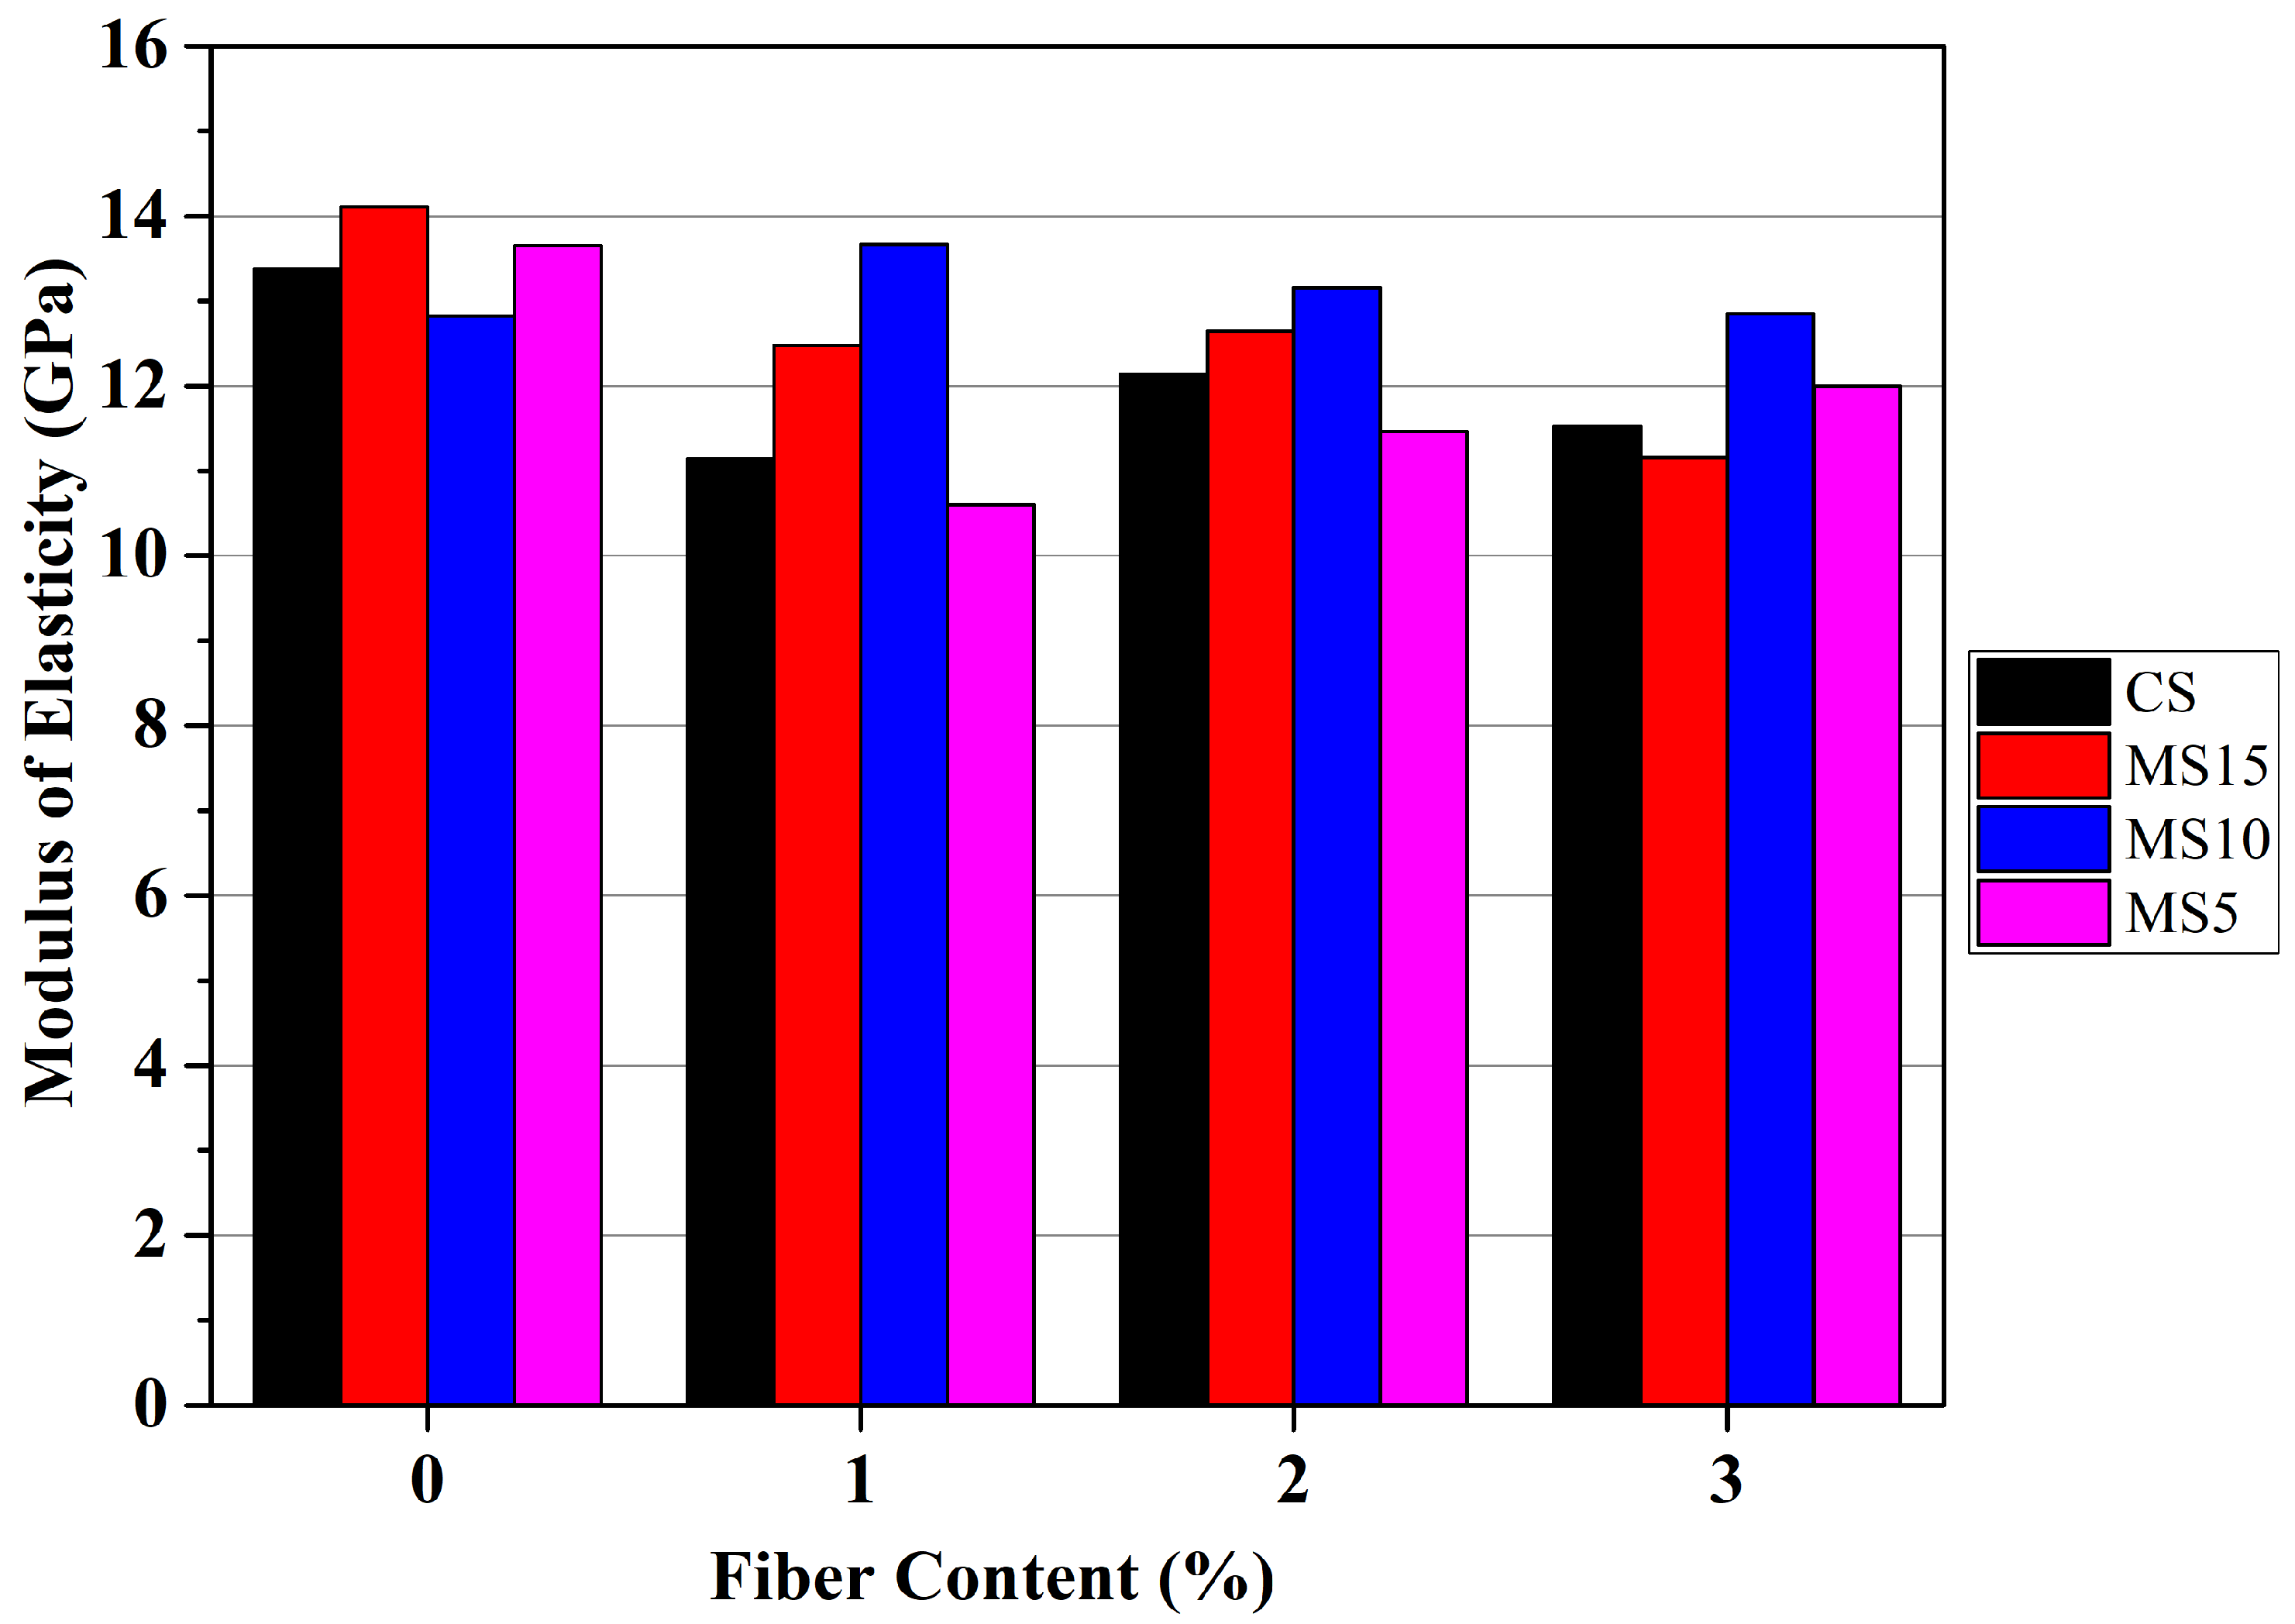
3.3.4. Modulus of Elasticity
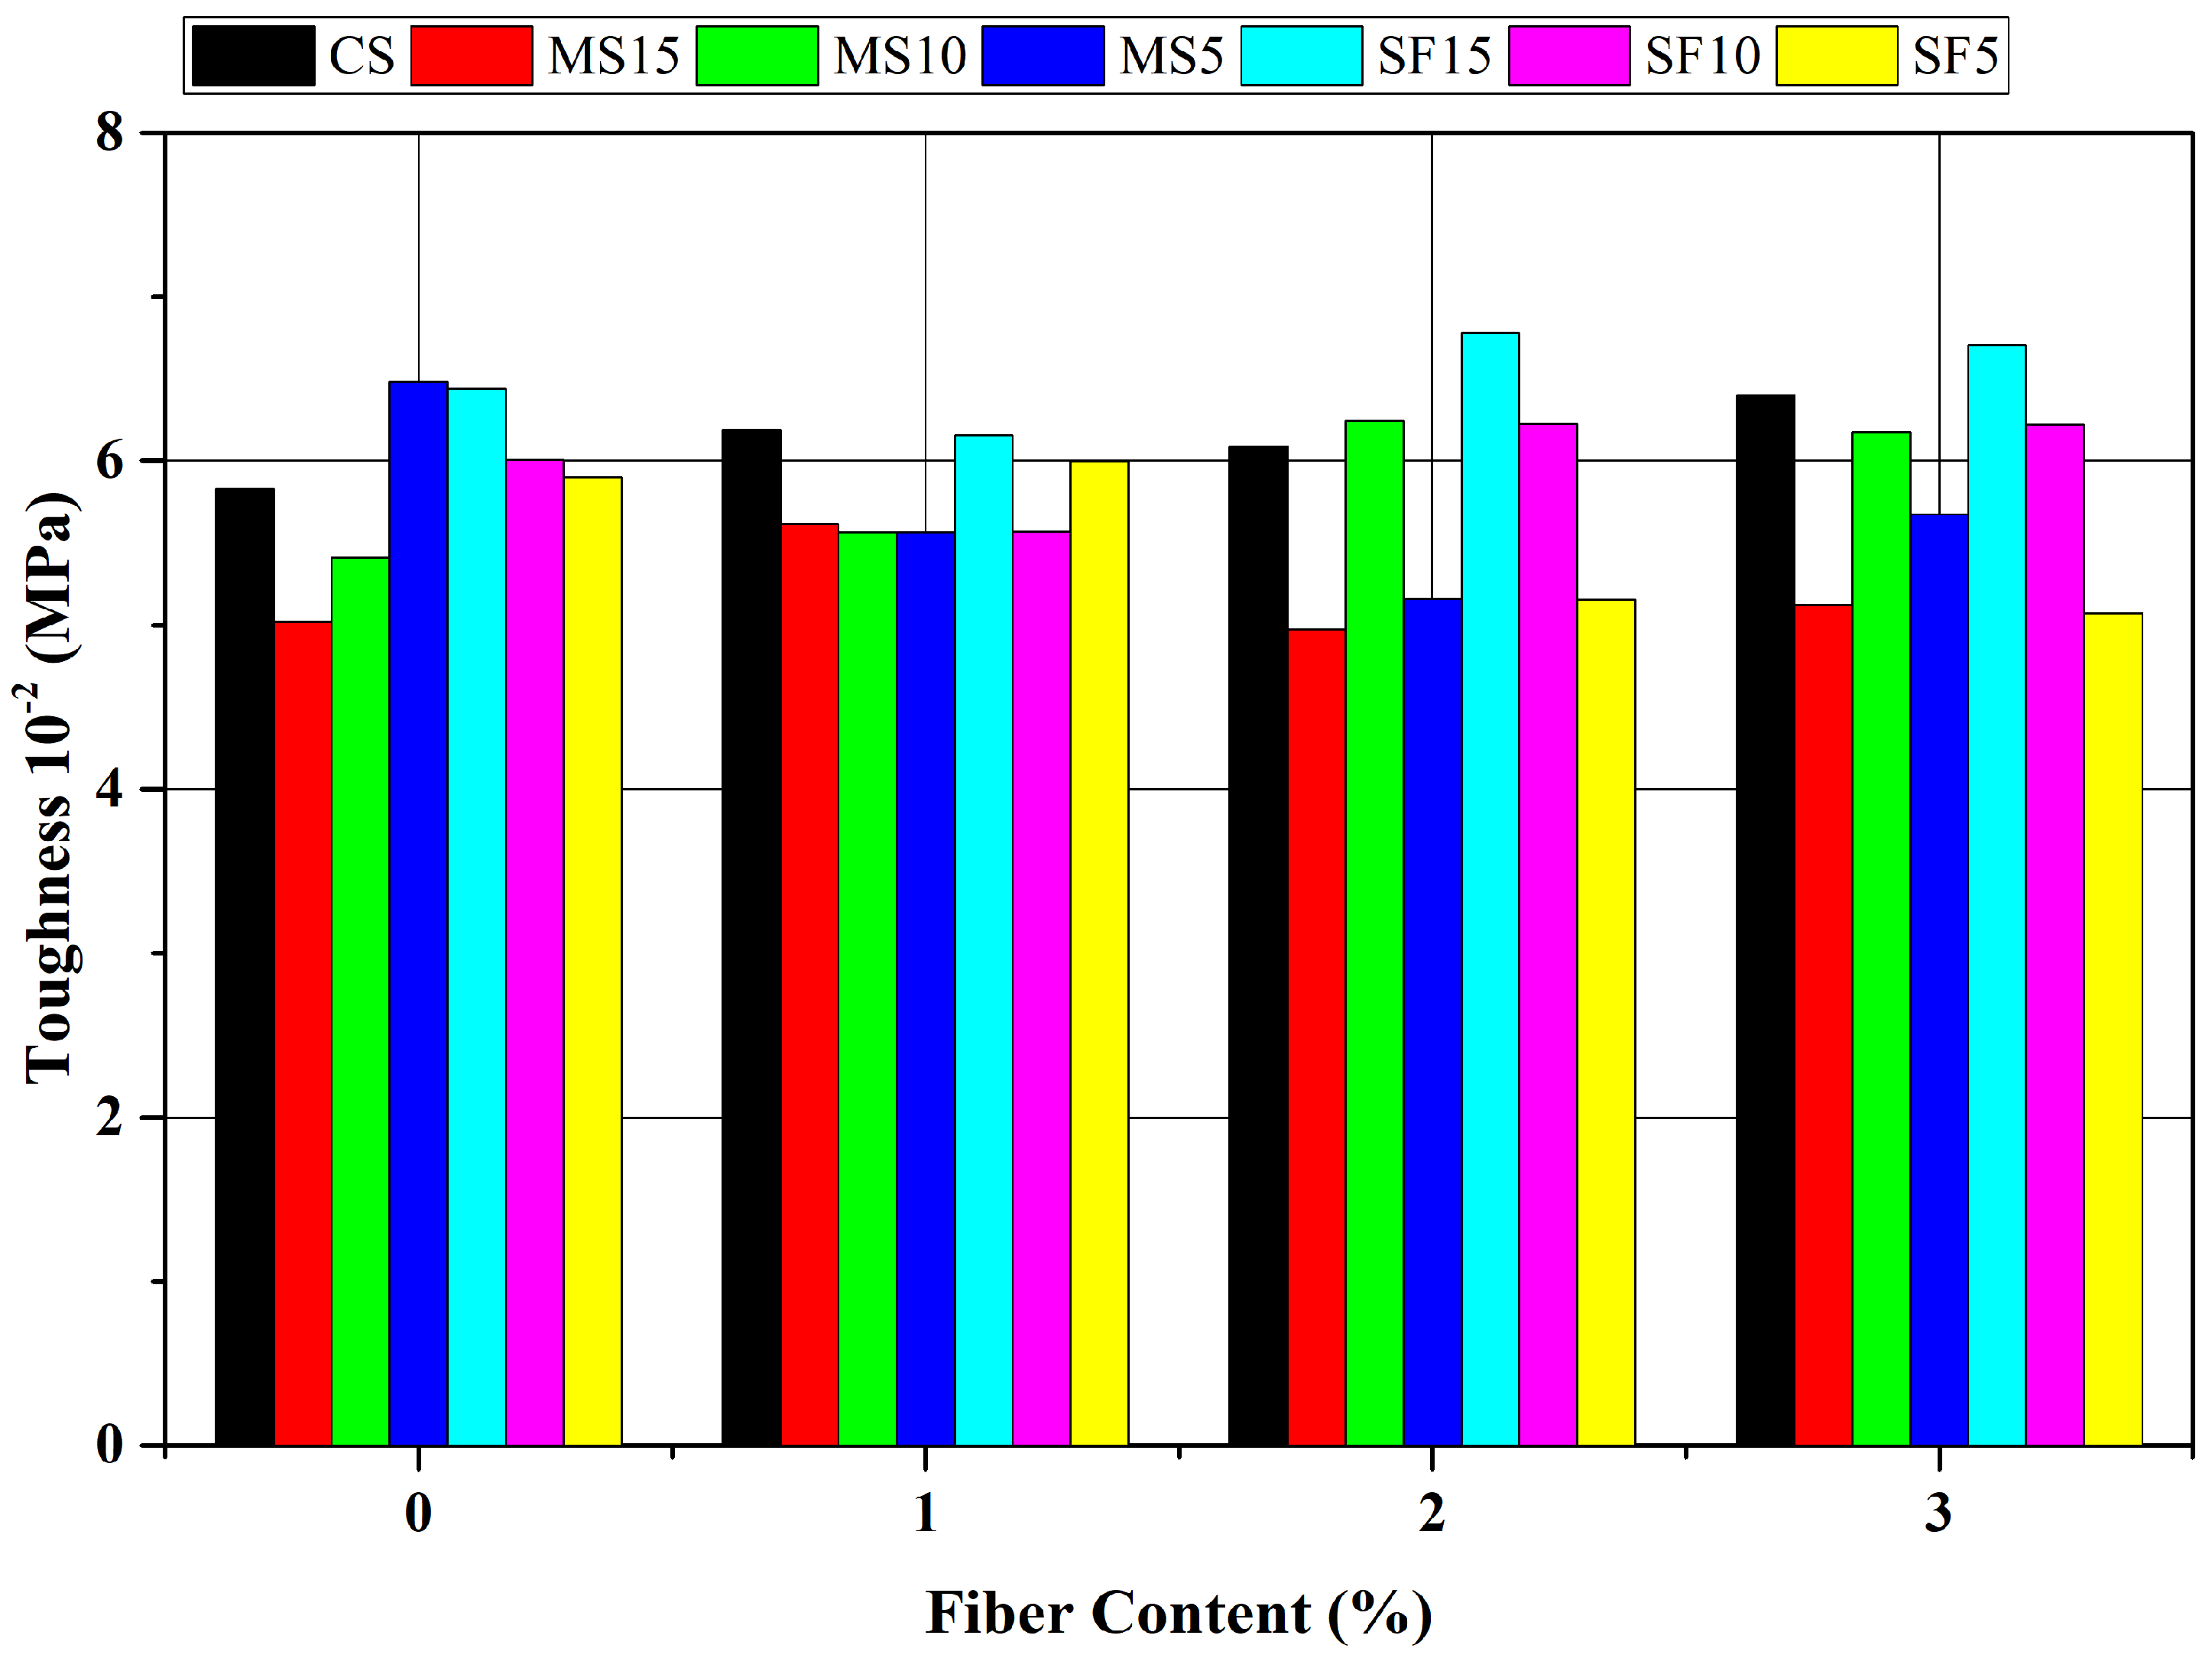
Elasticity modulus determination was carried out on the samples tested at the age of 28 days and the results are demonstrated in Figure 22. Elasticity modulus values tended to decrease with increasing fiber ratios. The decline in the modulus of elasticity can be attributed to the lower elasticity modulus of the added fibers than that of the cement matrix. In the series of mixtures containing micro silica, the most significant decrease was seen in mixtures MS15P3 and MS5P1. Compared to MS15P0 and MS5P0 mixtures, the modulus of elasticity decreased by 20.85% and 22.34% for MS15P3 and MS5P1 mixtures, respectively. In the MS5 series, with the increase in fiber ratio from 1% to 3%, the modulus of elasticity increased from 10.6 GPa to 12 and increased by 11.66%. In general, the modulus of elasticity is primarily affected by the elasticity modulus and volume ratio of each component in concrete. Although plastic fiber has a lower modulus of elasticity than conventional concrete, this difference has only a small effect on the modulus of elasticity, due to the low plastic fiber content in fiber-reinforced concrete [1].

3.3.5. Toughness

When the compressive toughness values which are obtained on the age of 28 days are taken into consideration, it can be seen that the fibers put different effects on the samples (Figure 23). Although the toughness values of some fiber ratios were lower than the samples without fiber, it was observed that the added fibers in some samples improved the toughness capacity of the mortar. A 3% fiber ratio in the control mixtures increased the toughness value by 7.31% compared to the non-fiber mixtures. The most significant increase in toughness in samples containing micro silica was observed in the MS10P2 sample, compared to the MS10P0 sample, the toughness value increased by 16.16%. The SF15P3 mixture had the highest toughness value in mixtures containing silica fume.
Compared with the SF15P0 mixture, it was observed that the SF15P3 mixture increased the toughness capacity by 8.07%. It was examined that the addition of fibers developed the post-crack behavior of the mortars. This can be attributed to the resistance of the fibers to the formation or propagation of cracks. In addition, fiber-reinforced mortars showed more deformation after reaching the final strength, showing a more ductile behavior.

3.4. Durability Properties

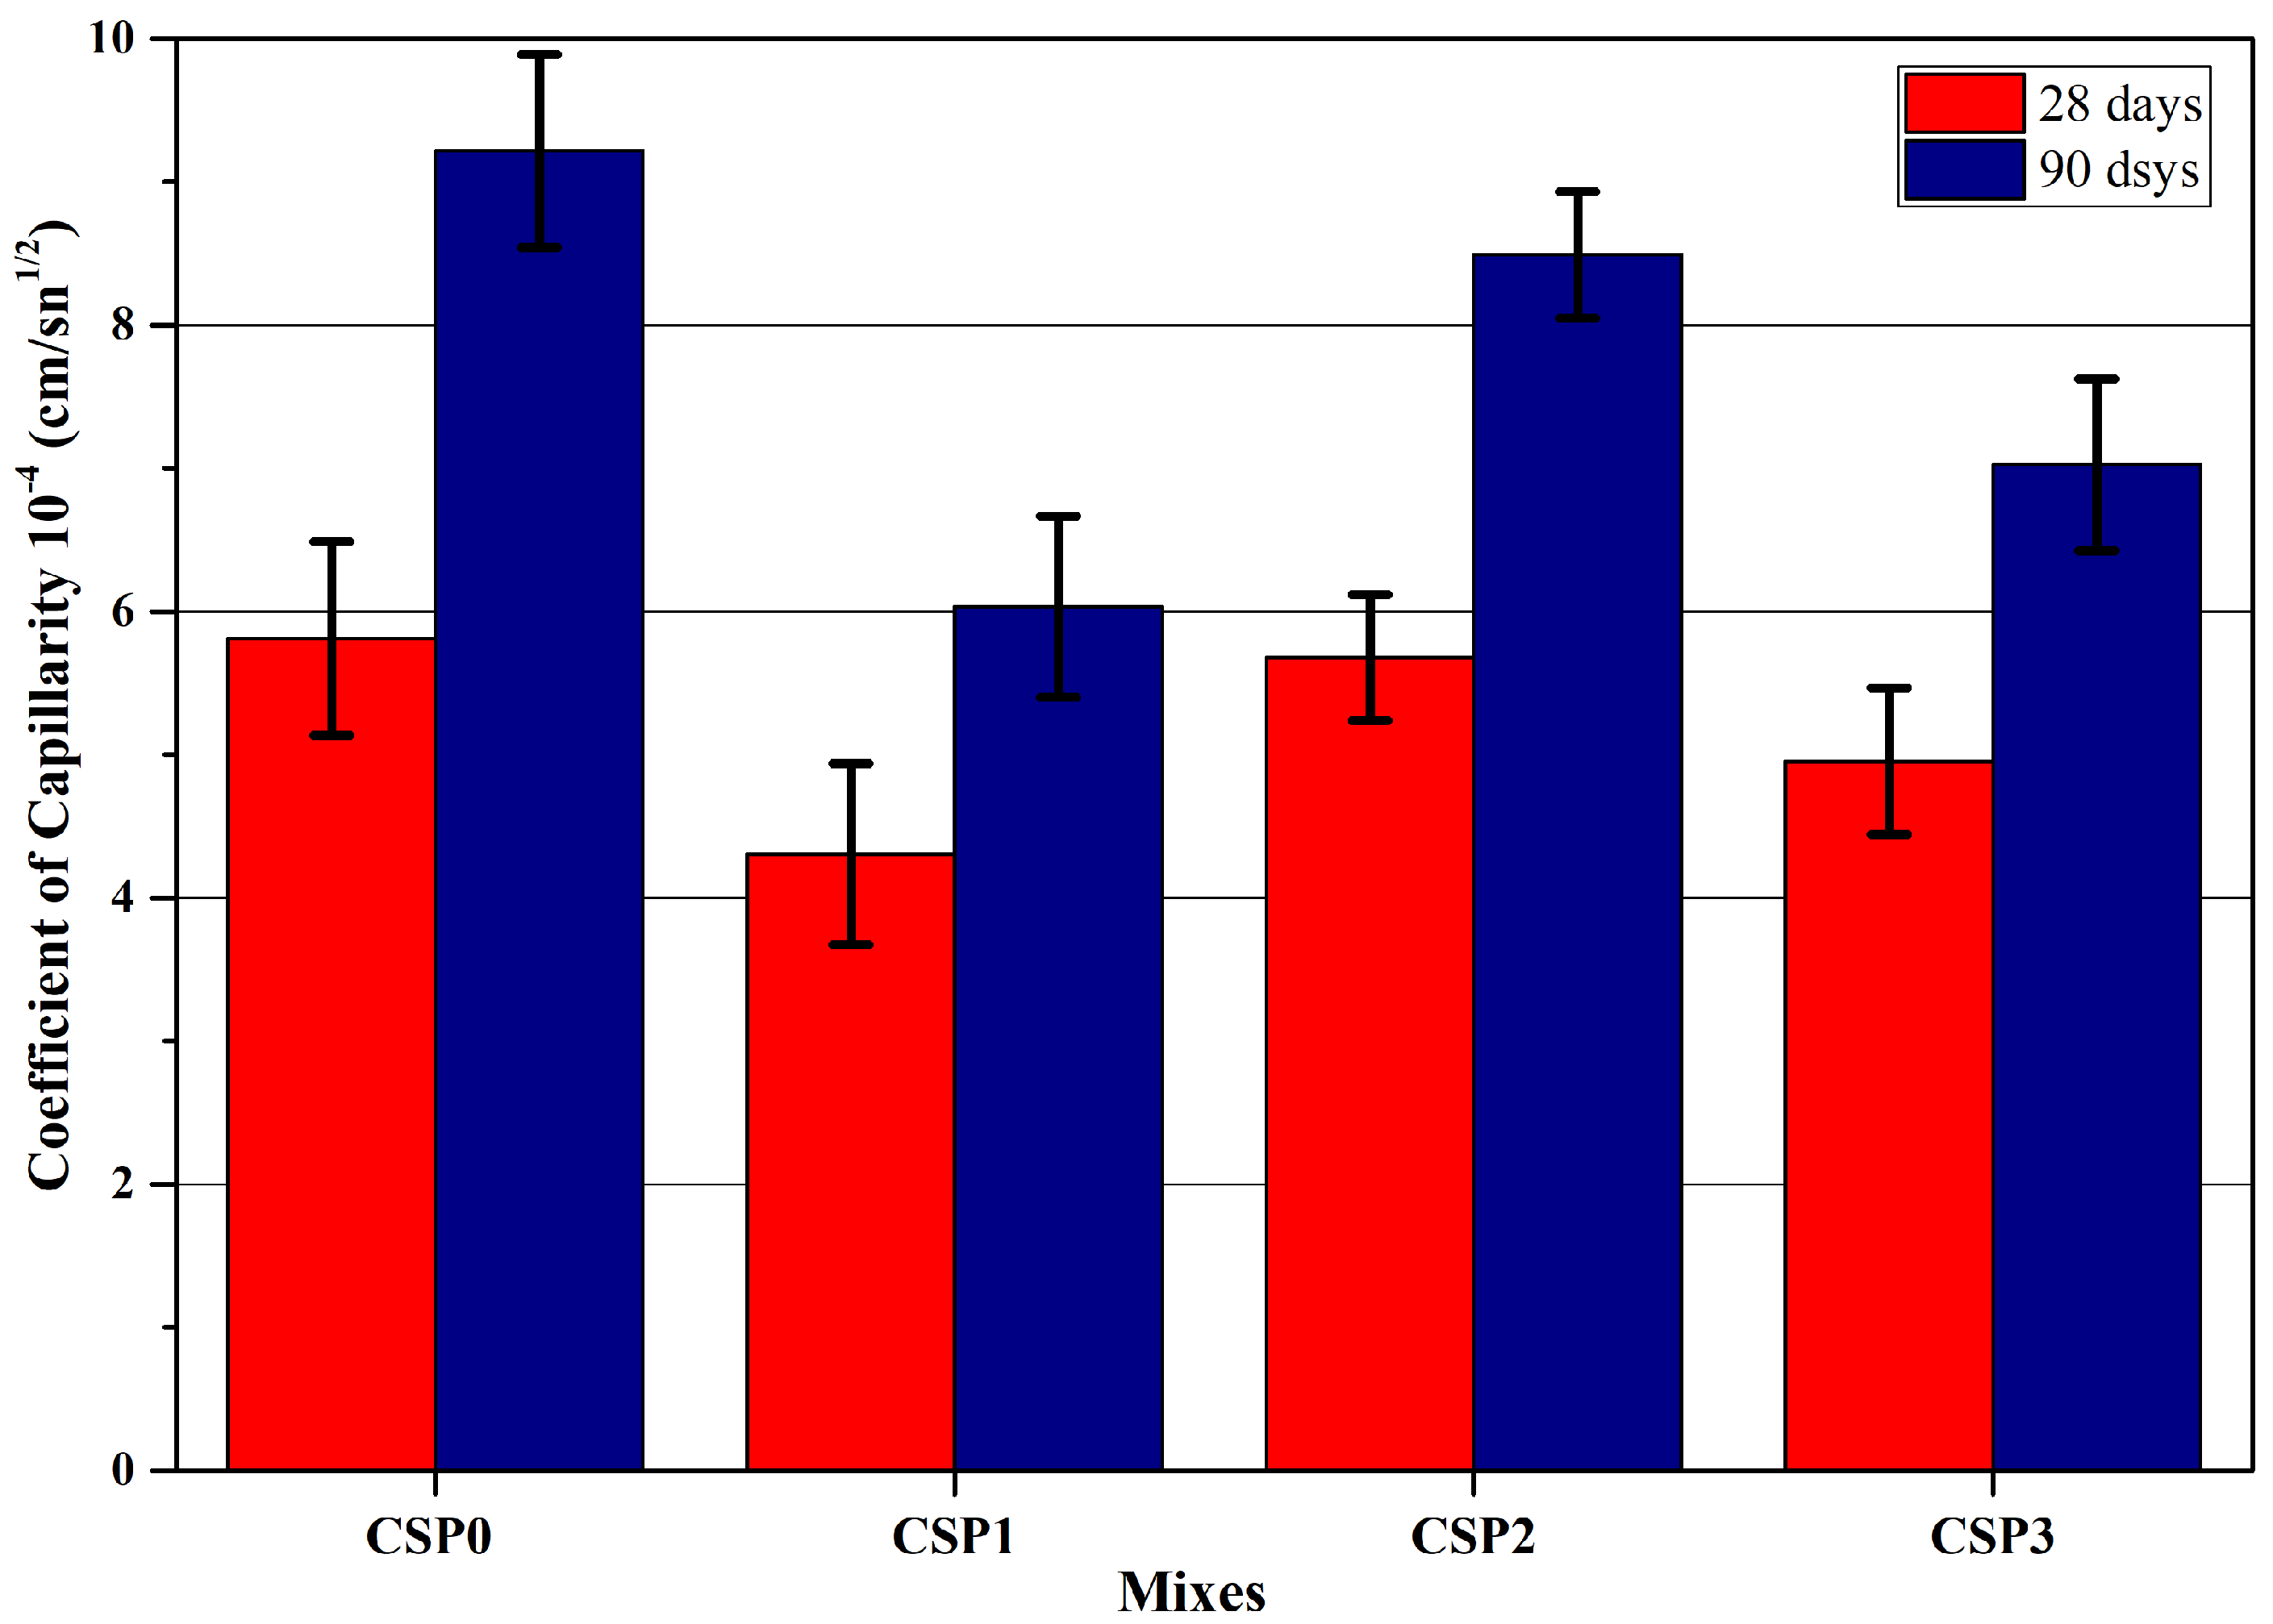
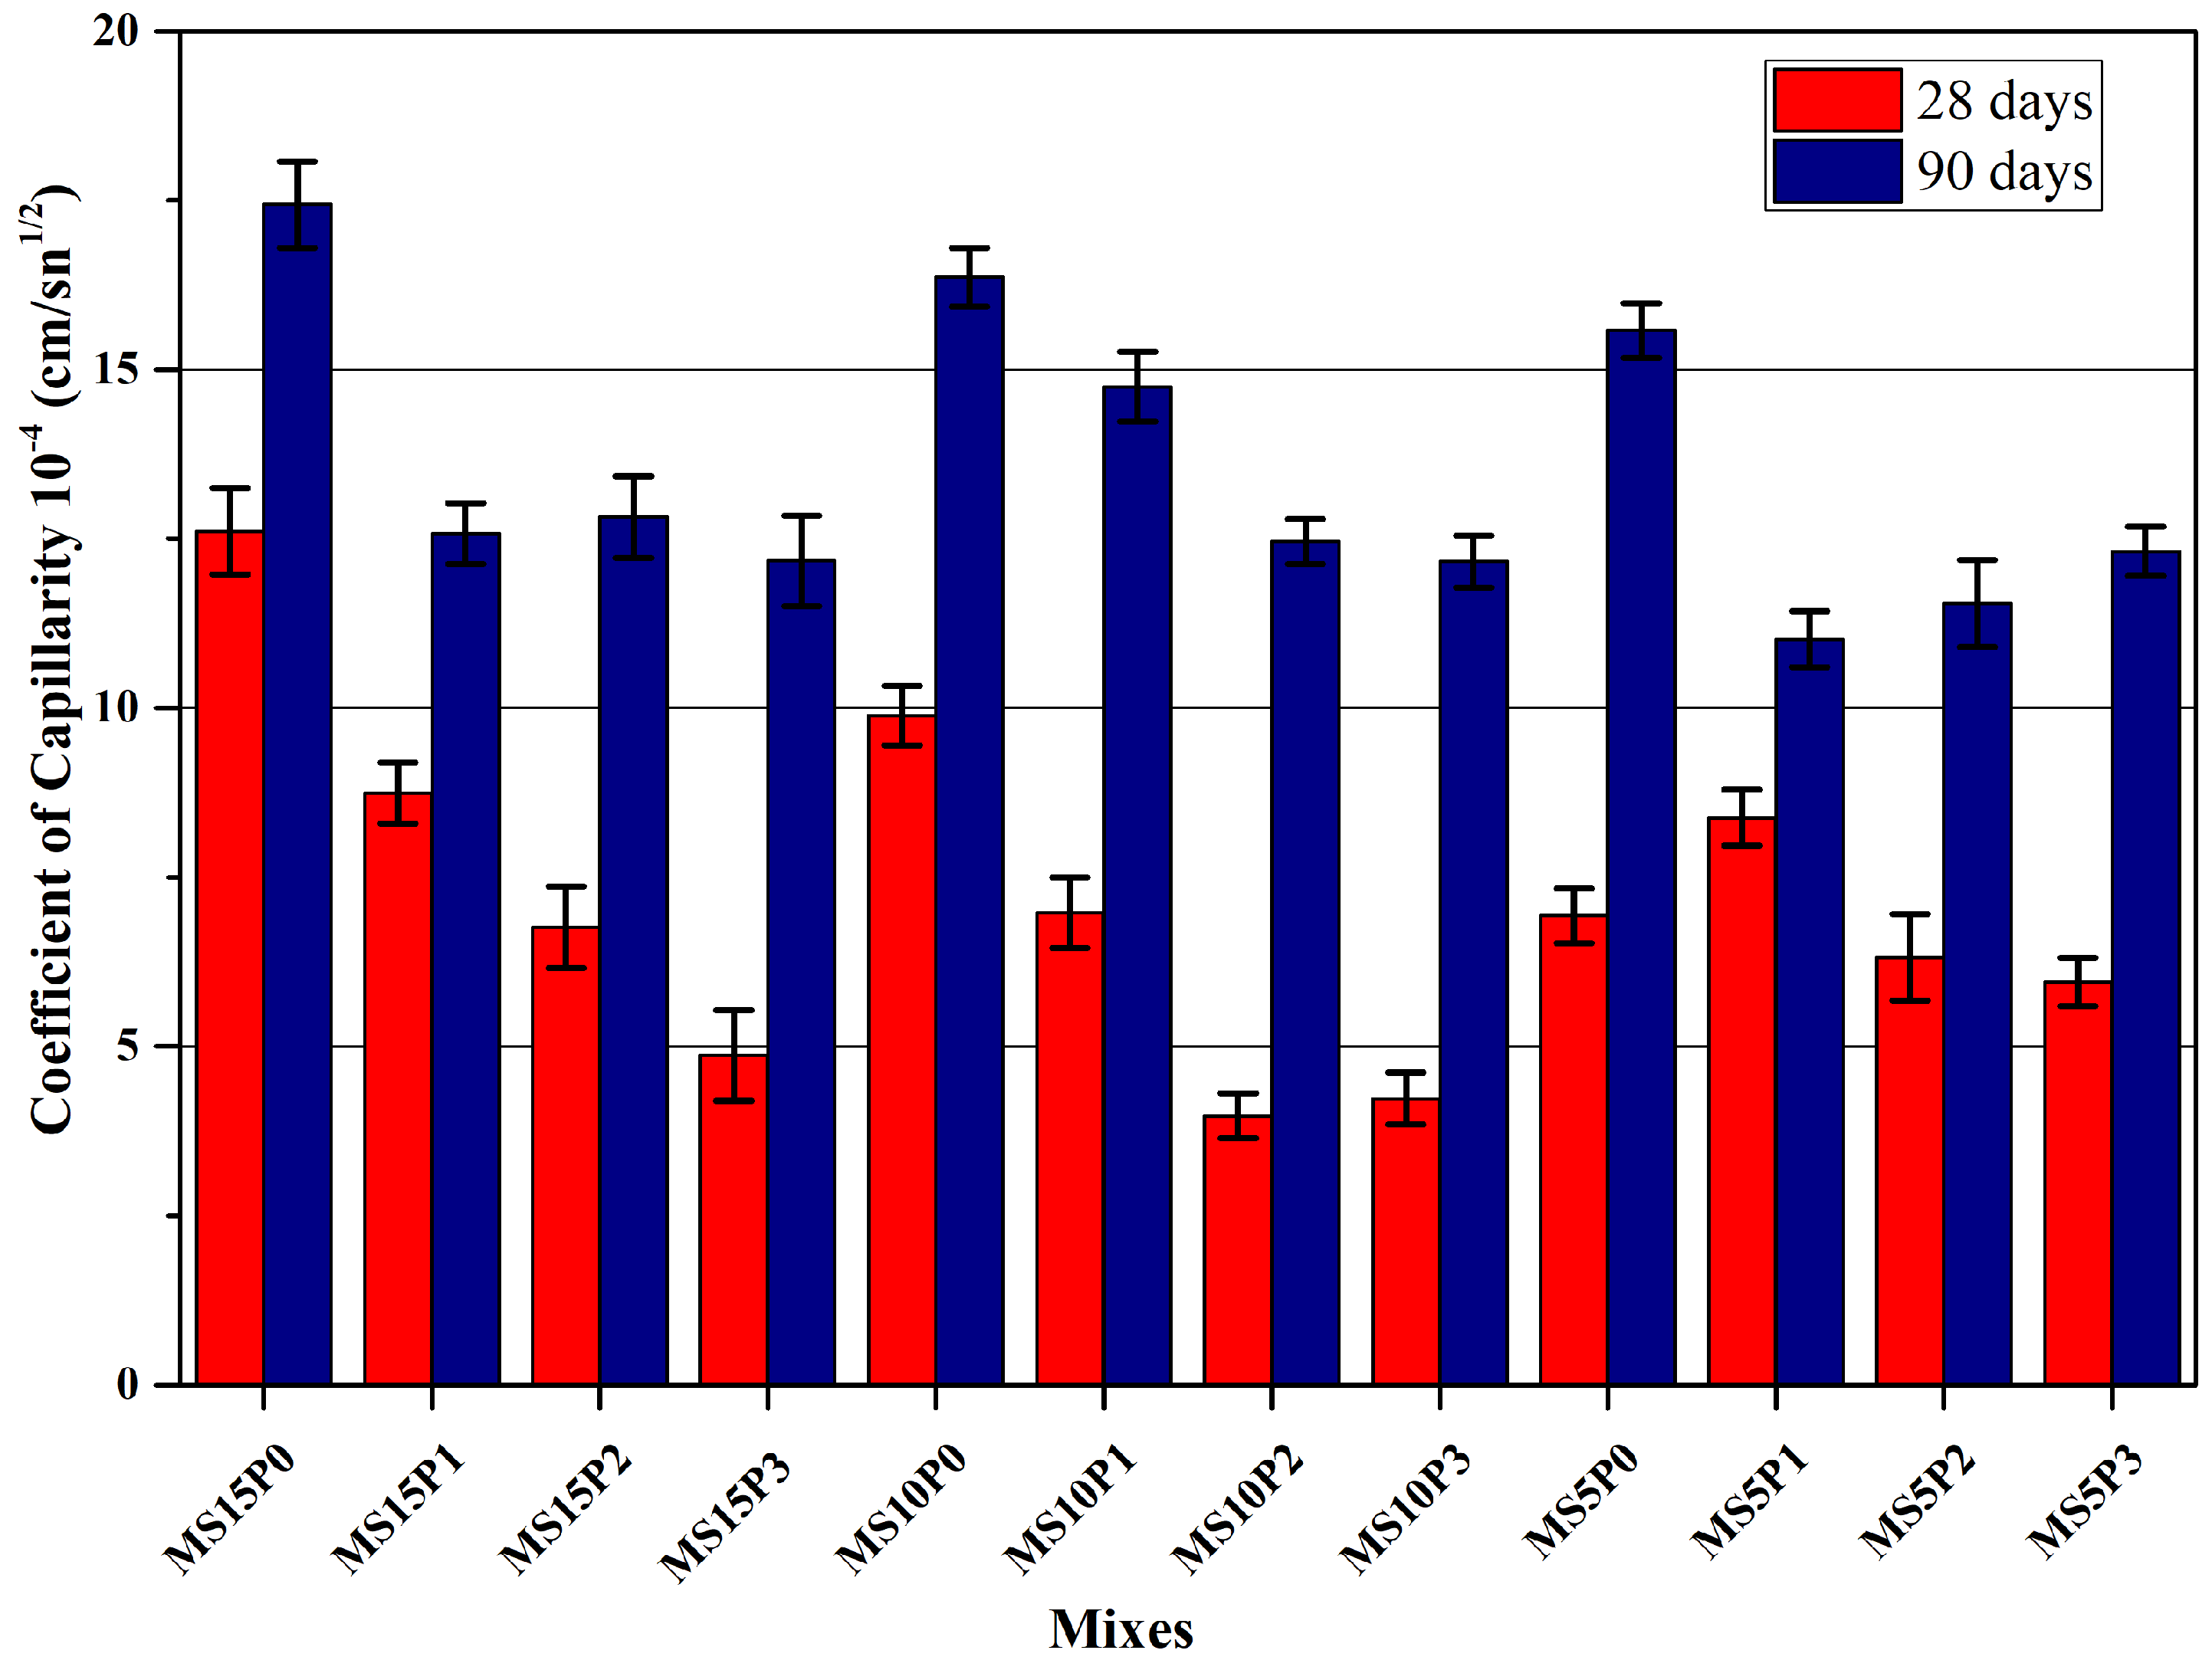
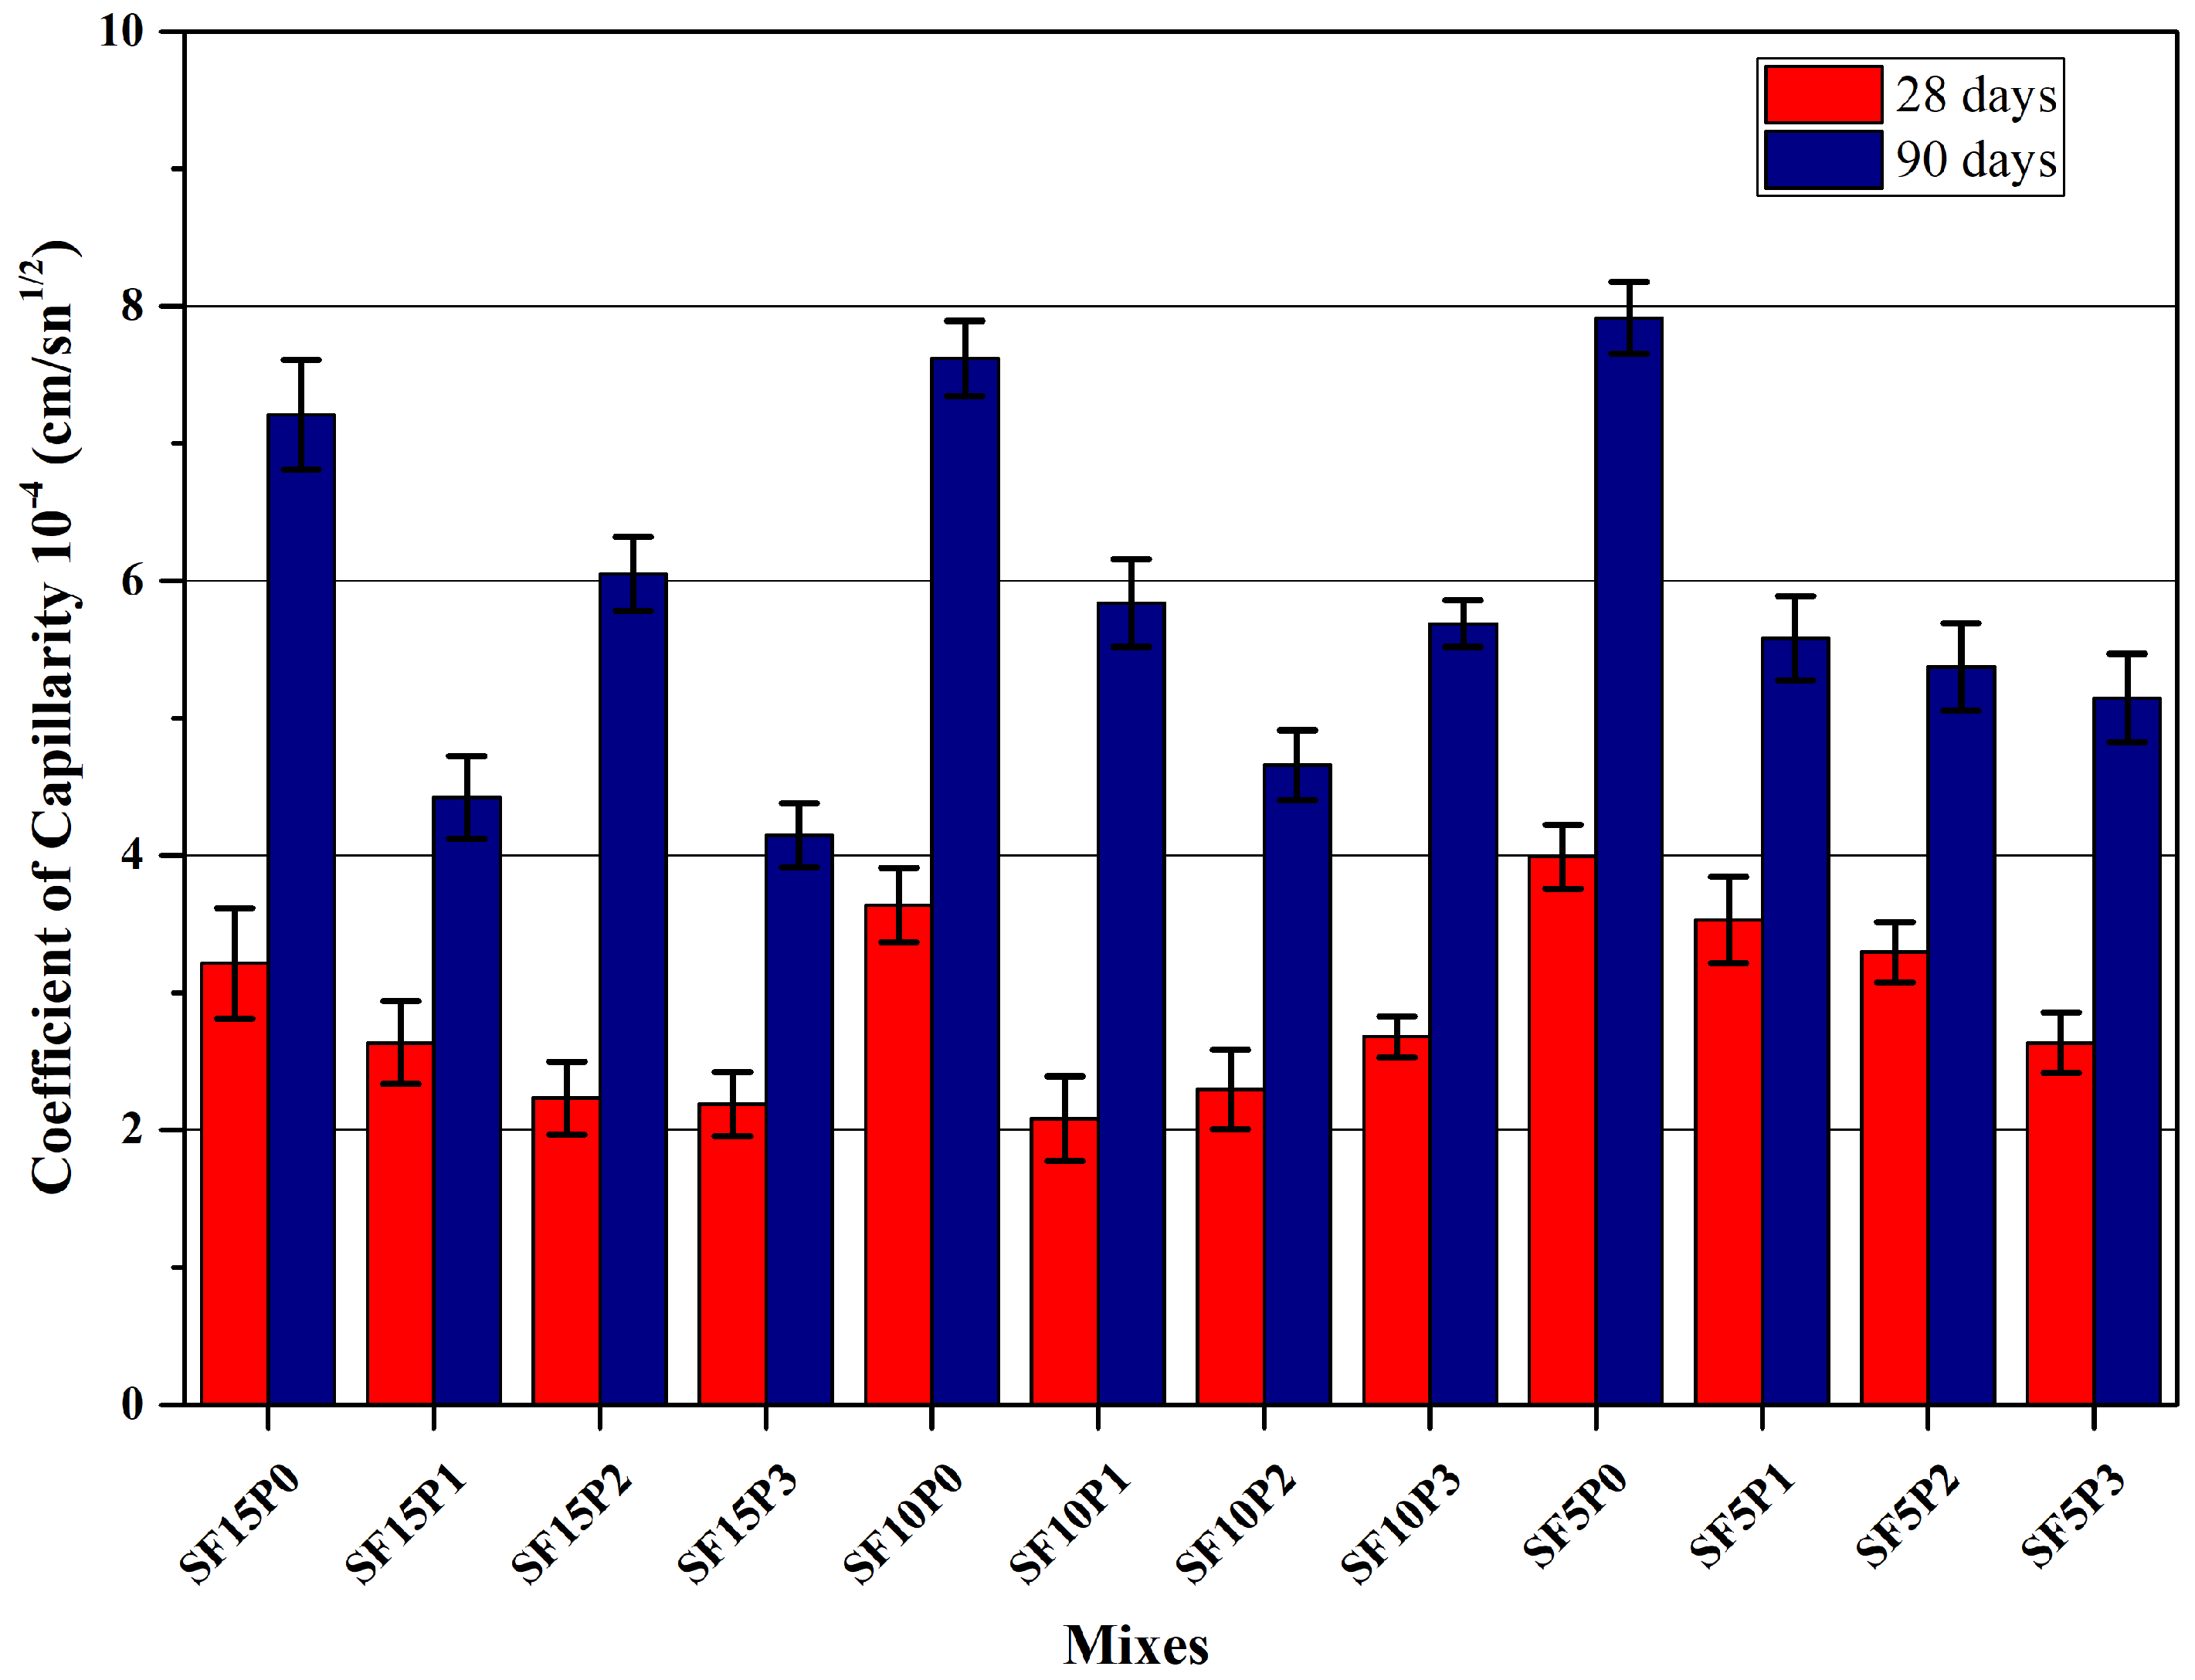
Capillary Water Absorption
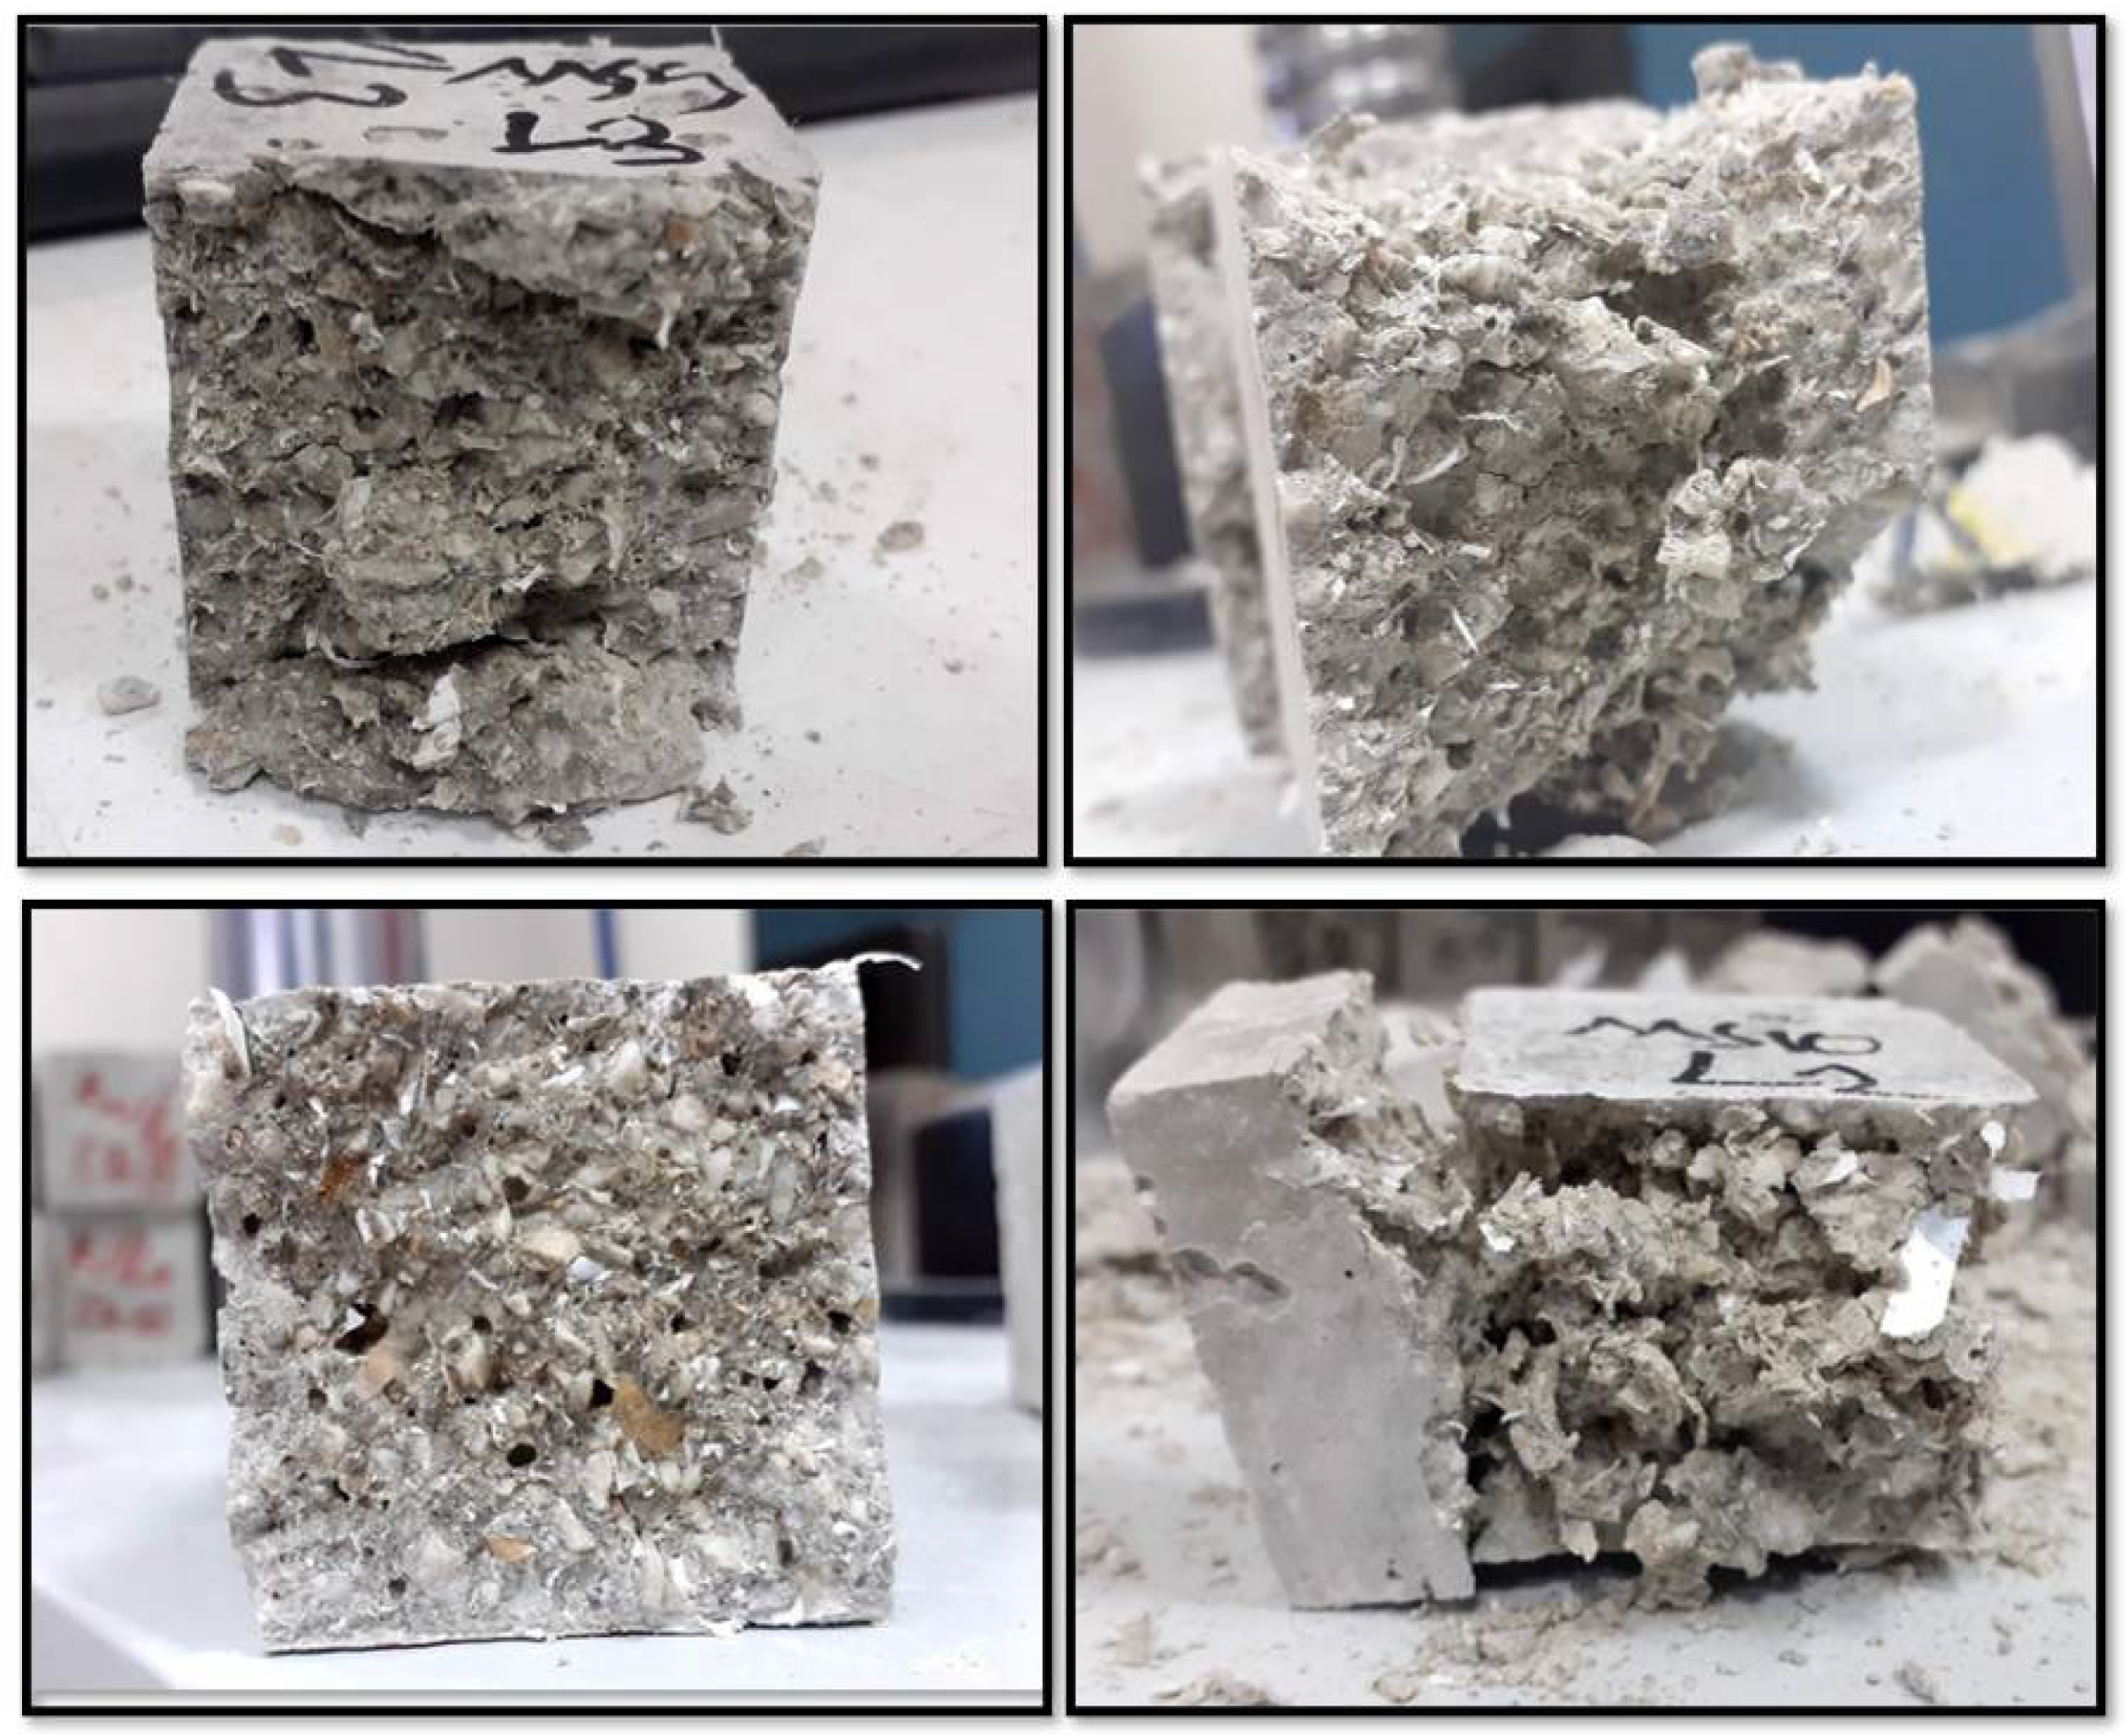
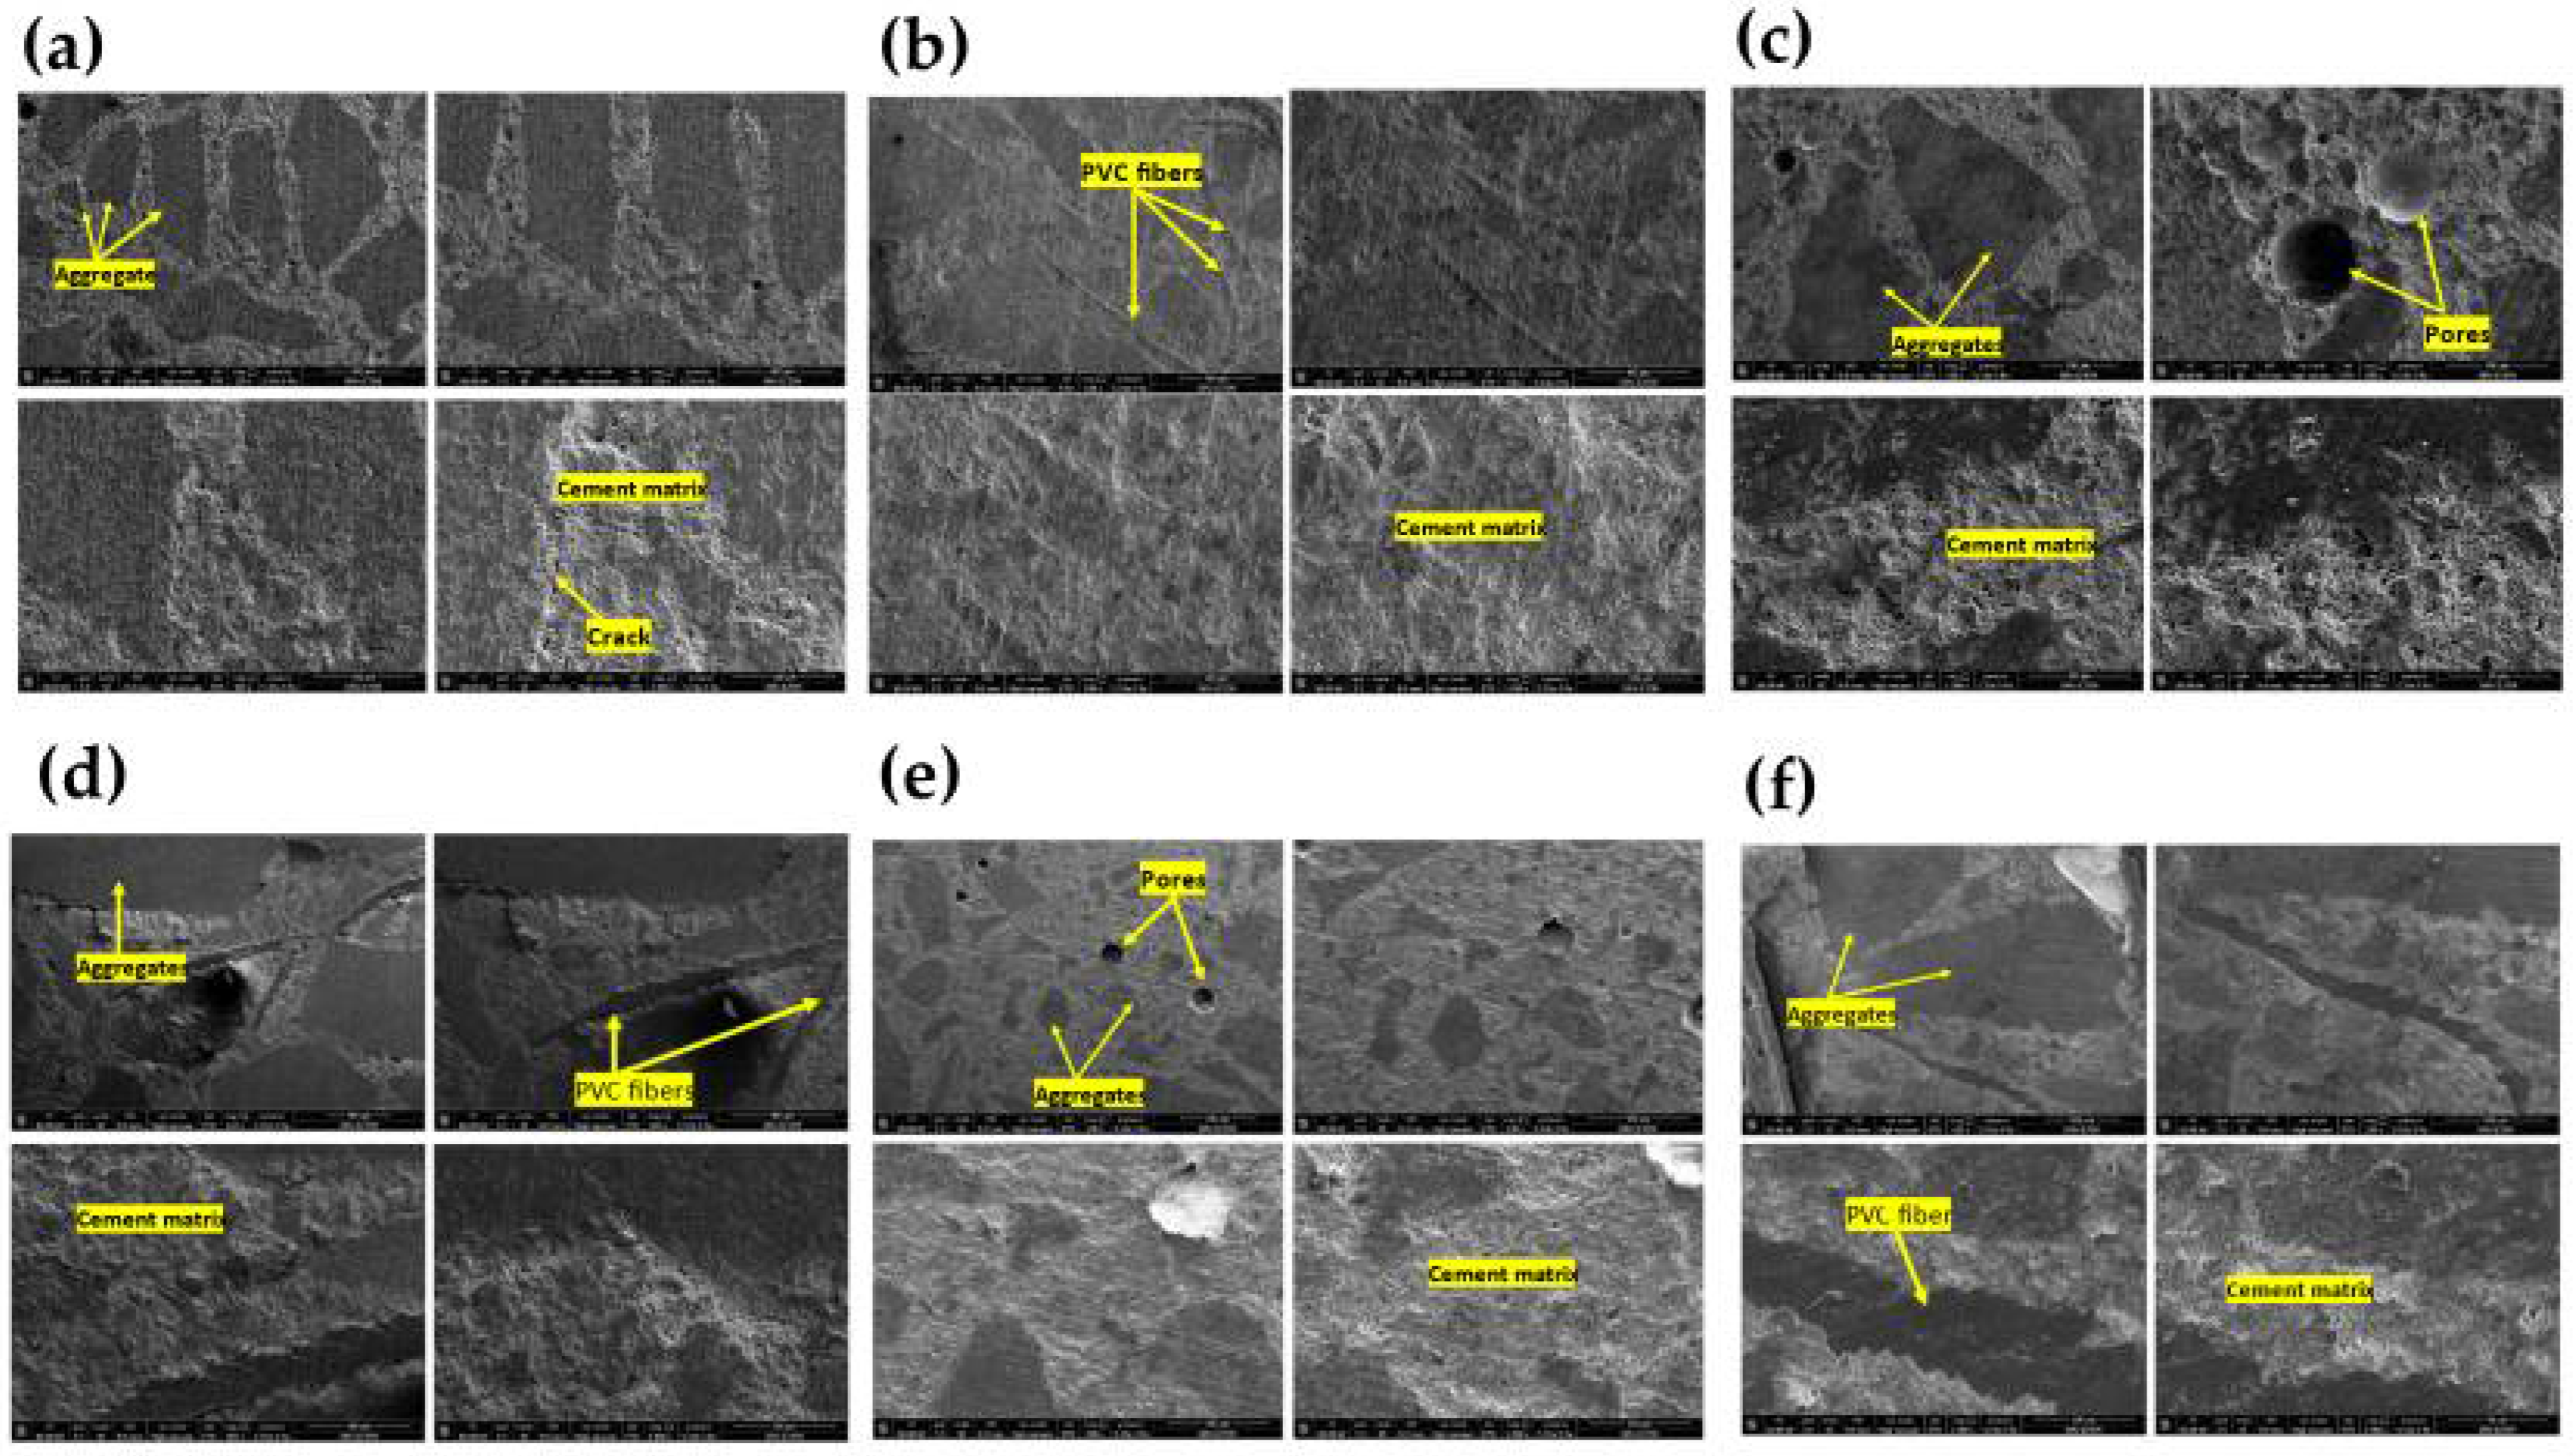
The capillarity values of cement mortars are exhibited in Figure 24, Figure 25 and Figure 26. Due to fine particles of silica fume, as the dosage of the silica fume in the specimens increased, the values of the capillary water absorption coefficient reduced. However, as the rate of replacement of micro silica with cement increased, a higher capillary water absorption coefficient was obtained. When compared with the control samples, it was observed that the capillary water absorption coefficients obtained at the age of 28 days decreased by 44.75%, 36.60%, 60.74%, and 55.75% for the SF15P0, SF15P1, SF15P2, and SF15P3 samples, respectively. When the effect of fiber ratio was evaluated, it was noted that even though it had different effects on the samples, when compared to the samples without fiber, the samples containing plastic fiber had lower capillary water absorption coefficient values. This may be attributed to the random distribution of the fibers in the matrix.

3.5. Microstructure

The microstructure of mortar samples was examined by SEM micrographs. Figure 27 shows the SEM micrographs of the sample with and without fiber reinforcement. Some microcracks can be seen in the cement matrix of the non-fiber mortar sample; however, a good bond can be observed between the cement and aggregate. A great bond between fibers and cement matrix can be seen in the fiber-reinforced mortars, which act as a crack inhibitor and, hence, improves the crack behavior of the mortar. The obtained results are in accordance with previous studies which show the distribution of the fibers among the cracks and inhibiting the cracks [41]. Figure 27e,f show a compact and relatively impermeable structure of the matrix of both reinforced and unreinforced samples which can be due to the filling effects of fine silica fume particles. However, in Figure 27c,d, quite porous structure can be observed due to the larger particle sizes of micro silica compared to the silica fume particles. These observations can be approved by the water absorption and void ratio results which are mentioned above.

4. Conclusions

Plastic production and usage have been increasing in recent years. This situation has a significant impact on the environment and marine pollution. Various studies are carried out to reduce the damage caused by plastics to the environment and human health to some extent.
The addition of PVC plastic fibers in different proportions adversely affected the fresh unit weight and workability of the mortars produced. The unit weight values in the fresh form of the mixtures containing micro silica and silica fume were lower than the control mixtures.
Dry and SSD bulk density values of the samples tended to decrease as the ratio of waste PVC plastic fibers increased. The lowest values were obtained in the mortars containing the highest fiber ratio (%3). Bulk density values of mixtures containing silica fume were found to be higher than both control mixtures and mortars containing micro silica.
The apparent porosity and water absorption values of the mixtures took parallel values. It has been observed that mixtures with high porosity have a high water absorption ability. When the effect of PVC plastic fiber was examined, it was found that the porosity and water absorption capability increased with the increase in fiber ratio in mortars. The increase in the silica fume content decreased the water absorption and porosity values of the mixtures.
Mechanical tests such as compressive strength and flexural strength were carried out on the mortar samples. Compressive strength took lower values in fiber-reinforced mortars than in mortars without fiber, and this value gradually decreased with the increase in fiber ratio. In samples where silica fume replaced cement, the compressive strength was higher than both control samples and samples containing micro silica. The highest compressive strength was obtained in the SF15P0 sample.
Regarding the flexural strength results, it was observed that the added PVC plastic fibers created different effects. However, mortars with a high fiber content showed more ductile behavior than mortars without fiber and preserved their integrity without causing a sudden break under load. It was observed that the compressive strength increased with the increase in silica fume content in the mixtures and also the strength of mixtures containing silica fume was higher compared to the control mixtures and mixtures containing micro silica.
The micro silica was used as received without applying any chemical or physical processing to it and its effect on the produced mortars was investigated. Since micro silica is not ground, it has coarse grains, and when it is replaced with cement, it could not gain the desired binding property. Therefore, it harmed strength, unit weight, and water permeability. The purpose of using micro silica without processing was to reduce costs and energy.
The modulus of elasticity values of the mortars was lower in the mixtures containing PVC plastic fiber than in the non-reinforced samples.
Capillary water absorption coefficient values were lower in fiber-containing mortars than in non-fiber-containing mortars. Mixtures containing silica fume had lower values than both control mixes and mixtures containing micro silica.
It can be stated that the utilization of waste plastics as fiber reinforcement can enhance the bending and deformation behavior of cementitious composites. Even though fibers reduced the strength of the mortars, they played a significant role in preserving the unity of the mortar samples, preventing a sudden failure, and improving the ductility of the mortars. Silica fume improved the physical, mechanical, and durability-related properties of the mortars.
Various studies have been conducted regarding the utilization of waste plastics as aggregate or fiber in cementitious composites. However, until now, no studies have been encountered on the recycling of cement-based mixtures containing plastic waste. For future studies, it can be suggested that the mixtures containing waste plastics are used in the production of concrete or mortar by turning them into recycled aggregates as waste, after their life cycle is over. Carrying out such studies will make an important contribution to the construction industry in terms of producing sustainable building materials. Thus, the environmental impact of plastic waste will decrease, and these wastes will have a wider range of use in sustainable building construction.

Author Contributions

Conceptualization, N.U.K.; Data curation, R.A.M.; Formal analysis, R.A.M. and N.U.K.; Investigation, R.A.M.; Methodology, R.A.M. and N.U.K.; Project administration, N.U.K.; Resources, R.A.M.; Software, R.A.M.; Supervision, N.U.K.; Validation, R.A.M. and N.U.K.; Visualization, R.A.M. and N.U.K.; Writing—original draft, R.A.M.; Writing—review & editing, R.A.M. and N.U.K. All authors have read and agreed to the published version of the manuscript.

Funding

This study was supported by Akdeniz University Scientific Research Center with project ID 4287.

Institutional Review Board Statement

Not applicable.

Informed Consent Statement

Not applicable.

Data Availability Statement

Not applicable.

Conflicts of Interest

The authors declare no conflict of interest.

References

  1. Gu, L.; Ozbakkaloglu, T. Use of Recycled Plastics in Concrete: A Critical Review. Waste Manag. 2016, 51, 19–42. [Google Scholar] [CrossRef] [PubMed]
  2. Plastics Europe Plastics Europe Association of Plastics Manufacturers Plastics—The Facts 2021 an Analysis of European Plastics Production, Demand and Waste Data. Available online: https://plasticseurope.org/knowledge-hub/plastics-the-facts-2021/ (accessed on 17 July 2022).
  3. Madhavan Nampoothiri, K.; Nair, N.R.; John, R.P. An Overview of the Recent Developments in Polylactide (PLA) Research. Bioresour. Technol. 2010, 101, 8493–8501. [Google Scholar] [CrossRef]
  4. Yang, S.; Yue, X.; Liu, X.; Tong, Y. Properties of Self-Compacting Lightweight Concrete Containing Recycled Plastic Particles. Constr. Build. Mater. 2015, 84, 444–453. [Google Scholar] [CrossRef]
  5. Ghernouti, Y.; Rabehi, B.; Bouziani, T.; Ghezraoui, H.; Makhloufi, A. Fresh and Hardened Properties of Self-Compacting Concrete Containing Plastic Bag Waste Fibers (WFSCC); Elsevier: Amsterdam, The Netherlands, 2015. [Google Scholar]
  6. Borg, R.P.; Baldacchino, O.; Ferrara, L. Early Age Performance and Mechanical Characteristics of Recycled PET Fibre Reinforced Concrete. Constr. Build. Mater. 2016, 108, 29–47. [Google Scholar] [CrossRef] [Green Version]
  7. Mahmood, R.A.; Kockal, N.U. Cementitious Materials Incorporating Waste Plastics: A Review. SN Appl. Sci. 2020, 2, 13. [Google Scholar] [CrossRef]
  8. Kurup, A.R.; Kumar, K.S. Novel Fibrous Concrete Mixture Made from Recycled PVC Fibers from Electronic Waste. J. Hazard. Toxic Radioact. Waste 2017, 21, 04016020. [Google Scholar] [CrossRef]
  9. Foti, D. Preliminary Analysis of Concrete Reinforced with Waste Bottles PET Fibers. Constr. Build. Mater. 2011, 25, 1906–1915. [Google Scholar] [CrossRef]
  10. Anandan, S.; Alsubih, M. Mechanical Strength Characterization of Plastic Fiber Reinforced Cement Concrete Composites. Appl. Sci. 2021, 11, 852. [Google Scholar] [CrossRef]
  11. Suksiripattanapong, C.; Phetprapai, T.; Singsang, W.; Phetchuay, C.; Thumrongvut, J.; Tabyang, W. Utilization of Recycled Plastic Waste in Fiber Reinforced Concrete for Eco-Friendly Footpath and Pavement Applications. Sustainability 2022, 14, 6839. [Google Scholar] [CrossRef]
  12. Suksiripattanapong, C.; Uraikhot, K.; Tiyasangthong, S.; Wonglakorn, N.; Tabyang, W.; Jomnonkwao, S.; Phetchuay, C. Performance of Asphalt Concrete Pavement Reinforced with High-Density Polyethylene Plastic Waste. Infrastructures 2022, 7, 72. [Google Scholar] [CrossRef]
  13. Amin, M.; Zeyad, A.M.; Tayeh, B.A.; Saad Agwa, I. Effect of Ferrosilicon and Silica Fume on Mechanical, Durability, and Microstructure Characteristics of Ultra High-Performance Concrete. Constr. Build. Mater. 2022, 320, 126233. [Google Scholar] [CrossRef]
  14. Yang, J.; Lu, J.; Wu, Q.; Xia, M.F.; Li, X. Influence of Steel Slag Powders on the Properties of MKPC Paste. Constr. Build. Mater. 2018, 159, 137–146. [Google Scholar] [CrossRef]
  15. Kamali, M.; Ghahremaninezhad, A. Effect of Glass Powders on the Mechanical and Durability Properties of Cementitious Materials. Constr. Build. Mater. 2015, 98, 407–416. [Google Scholar] [CrossRef]
  16. Mehta, A.; Ashish, D.K. Silica Fume and Waste Glass in Cement Concrete Production: A Review. J. Build. Eng. 2020, 29, 100888. [Google Scholar] [CrossRef]
  17. Fallah, S.; Nematzadeh, M. Mechanical Properties and Durability of High-Strength Concrete Containing Macro-Polymeric and Polypropylene Fibers with Nano-Silica and Silica Fume. Constr. Build. Mater. 2017, 132, 170–187. [Google Scholar] [CrossRef]
  18. Mastali, M.; Dalvand, A. The impact resistance and mechanical properties of fiber reinforced self-compacting concrete (SCC) containing nano-SiO2 and silica fume. Eur. J. Environ. Civ. Eng. 2016, 22, 1–27. [Google Scholar] [CrossRef]
  19. Tests for Geometrical Properties of Aggregates Part 1: Determination of Particle Size Distribution—Sieving Method. Available online: https://knowledge.bsigroup.com/products/tests-for-geometrical-properties-of-aggregates-determination-of-particle-size-distribution-sieving-method-1/standard (accessed on 17 July 2022).
  20. Admixtures for Concrete—Definitions and Requirements. Turk. Stand. Insti. Ankara, Turkey | Engineering360. Available online: https://standards.globalspec.com/std/1056936/TSEN1015-3 (accessed on 17 July 2022).
  21. TSE-TS EN 1015-3—Methods of Test for Mortar for Masonry—Part 3: Determination of Consistence of Fresh Mortar (by Flow Table)|Engineering360. Available online: https://standards.globalspec.com/std/1056936/TSEN1015-3 (accessed on 17 July 2022).
  22. TSE-TS EN 1015-6/A1—Methods of Test for Mortar for Masonry—Part 6: Determination of Bulk Density of Fresh Mortar | Engineering360. Available online: https://standards.globalspec.com/std/14259534/TSEN1015-6/A1 (accessed on 17 July 2022).
  23. ASTM C642: Standard Test Method for Density, Absorption, and Voids in Hardened Concrete. Available online: https://global.ihs.com/doc_detail.cfm?document_name=ASTMC642&item_s_key=00014902 (accessed on 17 July 2022).
  24. Kockal, N.U. Investigation about the Effect of Different Fine Aggregates on Physical, Mechanical and Thermal Properties of Mortars. Constr. Build. Mater. 2016, 124, 816–825. [Google Scholar] [CrossRef]
  25. TSE-TS EN 1015-11—Methods of Test for Mortar for Masonry—Part 11: Determination of Flexural and Compressive Strength of Hardened Mortar | Engineering360. Available online: https://standards.globalspec.com/std/1057272/ts-en-1015-11 (accessed on 17 July 2022).
  26. Kockal, N.U.; Kocaer, T.Z. Effects of Using Metal Granules on Strength and Stiffness. In Proceedings of the IOP Conference Series: Materials Science and Engineering, Kiev, Ukraine, 1 September 2019; IOP Publishing: Bristol, UK, 2019; Volume 629, p. 012032. [Google Scholar]
  27. ASTM C109 / C109M Standard Test Method for Comprehensive Strength of Hydraulic Cement Mortars—ELearning Course. Available online: https://www.astm.org/astm-tpt-182.html (accessed on 17 July 2022).
  28. Al-Hadithi, A.I.; Hilal, N.N. The Possibility of Enhancing Some Properties of Self-Compacting Concrete by Adding Waste Plastic Fibers. J. Build. Eng. 2016, 8, 20–28. [Google Scholar] [CrossRef]
  29. Karahan, O.; Atiş, C.D. The Durability Properties of Polypropylene Fiber Reinforced Fly Ash Concrete. Mater. Des. 2011, 32, 1044–1049. [Google Scholar] [CrossRef]
  30. Faraj, R.H.; Sherwani, A.F.H.; Daraei, A. Mechanical, Fracture and Durability Properties of Self-Compacting High Strength Concrete Containing Recycled Polypropylene Plastic Particles. J. Build. Eng. 2019, 25, 100808. [Google Scholar] [CrossRef]
  31. Gupta, T.; Chaudhary, S.; Sharma, R.K. Mechanical and Durability Properties of Waste Rubber Fiber Concrete with and without Silica Fume. J. Clean. Prod. 2016, 112, 702–711. [Google Scholar] [CrossRef]
  32. Senhadji, Y.; Siad, H.; Escadeillas, G.; Benosman, A.S.; Chihaoui, R.; Mouli, M.; Lachemi, M. Physical, Mechanical and Thermal Properties of Lightweight Composite Mortars Containing Recycled Polyvinyl Chloride. Constr. Build. Mater. 2019, 195, 198–207. [Google Scholar] [CrossRef]
  33. Kockal, N.U.; Camurlu, H.E. Lightweight Pumice Mortars with Polypropylene Fiber Reinforcement. Arab. J. Sci. Eng. 2020, 45, 8087–8097. [Google Scholar] [CrossRef]
  34. Wang, W.; Shen, A.; Lyu, Z.; He, Z.; Nguyen, K.T.Q. Fresh and Rheological Characteristics of Fiber Reinforced Concrete—A Review. Constr. Build. Mater. 2021, 296, 123734. [Google Scholar] [CrossRef]
  35. Meddah, M.S.; Bencheikh, M. Properties of Concrete Reinforced with Different Kinds of Industrial Waste Fibre Materials. Constr. Build. Mater. 2009, 23, 3196–3205. [Google Scholar] [CrossRef]
  36. Bagherzadeh, R.; Sadeghi, A.H.; Latifi, M. Utilizing Polypropylene Fibers to Improve Physical and Mechanical Properties of Concrete. Text. Res. J. 2012, 82, 88–96. [Google Scholar] [CrossRef]
  37. López-Buendía, A.M.; Romero-Sánchez, M.D.; Climent, V.; Guillem, C. Surface Treated Polypropylene (PP) Fibres for Reinforced Concrete. Cem. Concr. Res. 2013, 54, 29–35. [Google Scholar] [CrossRef]
  38. Mazaheripour, H.; Ghanbarpour, S.; Mirmoradi, S.H.; Hosseinpour, I. The Effect of Polypropylene Fibers on the Properties of Fresh and Hardened Lightweight Self-Compacting Concrete. Constr. Build. Mater. 2011, 25, 351–358. [Google Scholar] [CrossRef]
  39. Nili, M.; Afroughsabet, V. The Effects of Silica Fume and Polypropylene Fibers on the Impact Resistance and Mechanical Properties of Concrete. Constr. Build. Mater. 2010, 24, 927–933. [Google Scholar] [CrossRef]
  40. Fraternali, F.; Spadea, S.; Berardi, V.P. Effects of Recycled PET Fibres on the Mechanical Properties and Seawater Curing of Portland Cement-Based Concretes. Constr. Build. Mater. 2014, 61, 293–302. [Google Scholar] [CrossRef]
  41. Liu, K.; Wang, S.; Quan, X.; Duan, W.; Nan, Z.; Wei, T.; Xu, F.; Li, B. Study on the Mechanical Properties and Microstructure of Fiber Reinforced Metakaolin-Based Recycled Aggregate Concrete. Constr. Build. Mater. 2021, 294, 123554. [Google Scholar] [CrossRef]
Figure 1. Particle size distribution of crushed sand aggregates.
Microplastics 01 00041 g001
Figure 2. (a) Mixer, (b) casted mortar samples, (c) samples after demolding, (d) samples in the curing tank.
Microplastics 01 00041 g002
Figure 3. Fresh density values of the mortar samples.
Microplastics 01 00041 g003
Figure 4. Flow diameter values of the mortar samples.
Microplastics 01 00041 g004
Figure 5. Dry bulk density values of the mortar samples.
Microplastics 01 00041 g005
Figure 6. SSD bulk density values of the mortar samples.
Microplastics 01 00041 g006
Figure 7. Apparent porosity values of the mortar samples.
Microplastics 01 00041 g007
Figure 8. Water absorption values of the mortar samples.
Microplastics 01 00041 g008
Figure 9. Flexural strength values of the control samples.
Microplastics 01 00041 g009
Figure 10. Flexural strength values of the MS samples.
Microplastics 01 00041 g010
Figure 11. Flexural strength values of the SF samples.
Microplastics 01 00041 g011
Figure 12. Failure behavior of (a) non-fiber-reinforced sample and (b) 15% fiber reinforced sample.
Microplastics 01 00041 g012
Figure 13. Compressive strength values of the control samples.
Microplastics 01 00041 g013
Figure 14. Compressive strength values of the MS samples.
Microplastics 01 00041 g014
Figure 15. Compressive strength values of the SF samples.
Microplastics 01 00041 g015
Figure 16. Fiber-reinforced mortar samples after compressive strength test.
Microplastics 01 00041 g016
Figure 17. Relationship between compressive strength and dry bulk density of the control samples.
Microplastics 01 00041 g017
Figure 18. Relationship between compressive strength and dry bulk density of the MS samples.
Microplastics 01 00041 g018
Figure 19. Relationship between compressive strength and dry bulk density of the SF samples.
Microplastics 01 00041 g019
Figure 20. Stress–strain behavior of the control samples.
Microplastics 01 00041 g020
Figure 21. Stress–strain behavior of the MS samples.
Microplastics 01 00041 g021
Figure 22. Modulus of elasticity values of the mortar samples with various fiber content.
Microplastics 01 00041 g022
Figure 23. Toughness values of the mortar samples with various fiber contents.
Microplastics 01 00041 g023
Figure 24. Capillary water absorption values of the control samples.
Microplastics 01 00041 g024
Figure 25. Capillary water absorption values of the MS samples.
Microplastics 01 00041 g025
Figure 26. Capillary water absorption values of the SF samples.
Microplastics 01 00041 g026
Figure 27. SEM micrographs of (a) CS0 sample, (b) CS3 sample, (c) MS15 sample, (d) MS15P3 sample, (e) SF15 sample, (f) SF15P3 sample.
Microplastics 01 00041 g027
Table 1. Typical properties of fibers.
Specific Gravity (g/cm3)1.40
Diameter (mm)2–3
Length (mm)8–12
Bulk modulus (GPa) 4.70
Tensile strength (MPa) 52
Softening point (°C)82
Poisson’s ratio0.40
Table 2. Chemical compositions of materials (wt.%).
ConstituentsCementSilica FumeMicro Silica
NA2O-2.1500.09
MgO1.9114.3200.08
Al2O34.061.6840.12
SiO218.378.02097.52
P2O50.08450.02396-
SO33.740.29840
CI-0.02678-
K2O0.7881.0970.01
CaO67.70.19310.06
TiO20.369-1.07
Cr2O30.07531.405-
MnO0.03710.0560-
Fe2O32.770.31700.16
CuO0.0047--
ZnO0.00590.1950-
SrO0.0878--
ZrO2-<0.068-
Table 3. Mix proportions used in the manufacturing of mortars.
Mix IDCement (kg/m3)Silica Fume (kg/m3)Micro Silica (kg/m3)Crushed Sand Aggregate (kg/m3)PVC Fiber (%)PVC Fiber
(kg/m3)
Water (kg/m3)Plasticizer (kg/m3)
CSP0340--1712.2900274.380
CSP1340--1712.29114274.383.4
CSP2340--1712.29228274.386.8
CSP3340--1712.29342274.386.8
MS15P0289-511688.9000273.880
MS15P1289-511688.90114273.883.4
MS15P2289-511688.90228273.886.8
MS15P3289-511688.90342273.886.8
MS10P0306-341696.8600274.040
MS10P1306-341696.86114274.043.4
MS10P2306-341696.86228274.046.8
MS10P3306-341696.86342274.046.8
MS5P0323-171704.8300274.210
MS5P1323-171704.83114274.213.4
MS5P2323-171704.83228274.216.8
MS5P3323-171704.83342274.216.8
SF15P028951-1696.6000274.040
SF15P128951-1696.60114274.043.4
SF15P228951-1696.60228274.046.8
SF15P328951-1696.60342274.046.8
SF10P030634-170200274.150
SF10130634-1702114274.153.4
SF10P230634-1702228274.156.8
SF10P330634-1702342274.156.8
SF5P032317-1707.3900274.270
SF5P132317-1707.39114274.273.4
SF5P232317-1707.39228274.276.8
SF5P332317-1707.39342274.276.8
Publisher’s Note: MDPI stays neutral with regard to jurisdictional claims in published maps and institutional affiliations.

