
W Chromosome Evolution by Repeated Recycling in the Frog Glandirana rugosa


1
Preservation and Research Center, 155-1 Asahi Ward, Yokohama 241-0804, Japan
2
Institute for Applied Ecology, University of Canberra, Canberra, ACT 2617, Australia
3
Department of Biology, Faculty of Science, Kyushu University, Fukuoka 819-0395, Japan
4
Amphibian Research Center, Hiroshima University, Higashi-Hiroshima 739-8526, Japan
*
Authors to whom correspondence should be addressed.
DNA 2022, 2(3), 172-184; https://doi.org/10.3390/dna2030012
Submission received: 16 May 2022
/
Revised: 1 July 2022
/
Accepted: 20 July 2022
/
Published: 1 August 2022
(This article belongs to the Special Issue Selected Papers from the Joint Meeting of the 23rd International Chromosome Conference (ICC) and the 24th International Colloquium in Animal Cytogenetics and Genomics (ICACG))
Abstract
:The Y or W sex chromosome of a heteromorphic pair is usually heterochromatinised and degenerated. However, whether chromosome degeneration constantly proceeds toward an extreme end is not fully understood. Here, we present a case of intermittent evolution of W chromosomes caused by interpopulation hybridisation in the Japanese soil-frog, Glandirana rugosa. This species includes two heteromorphic sex chromosome systems, which are separated into geographic populations, namely the XY and ZW groups. In this study, to uncover the evolutionary mechanisms of the heterogeneous W chromosomes, we genetically investigated the geographic differentiation of the ZW populations along with the closely located XY populations. Analysis of mitochondrial cytochrome b sequences detected three distinct clades, named ZW1, ZW2, and ZW3. High throughput analyses of nuclear genomic DNA showed that autosomal alleles of XY populations were deeply introgressed into the ZW3 sub-group. Based on the genotypes of sex-linked single nucleotide polymorphisms, W-borne androgen receptor gene expression, and WW developmental mortality, we concluded that the X chromosomes were recycled to W chromosomes. Upon inclusion of two cases from another group, Neo-ZW, we observed that the X chromosomes were recycled independently at least four times to the new W chromosomes: a repetition of degeneration and resurrection.
1. Introduction
Sex chromosomes are originally homomorphic in both sexes and can be shifted to a heteromorphic state in either sex, which involves the heterochromatinisation and degeneration of the Y or W chromosome [1,2,3]. In mammals, the degeneration process is accelerated by an inversion on the Y chromosome, which inhibits recombination with the corresponding region of the X chromosome, thus forming a stratum on the sex chromosomes [4,5]. In addition, an old Y chromosome rarely reaches an extreme end and becomes extinct, as observed in three rodents [6,7,8,9]. In contrast, although avian ZW sex chromosomes share their evolutionary origin (which occurred 100 million years ago) for the same homomorphic pair, the W chromosome degeneration depth differs in the two major taxa, Neognathae and Palaeognathae. In the Neognathae lineage that includes chickens, the W chromosomes are tiny, highly differentiated, degenerated, and heterochromatinised [10,11], whereas in the Palaeognathae lineage that includes Emu, these continue to conserve similar sizes keeping lots of genes to the Z chromosomes [10,12,13,14]. The degeneration process of Y or W chromosomes does not always proceed at a constant rate, being extremely rapid in some cases (or initially after recombination arrest), while quite slow in others (or later) [15]. What controls the degeneration rate? Does it depend on chromosomal rearrangements such as inversion, or the time elapsed since recombination arrest between the sex chromosome pair?
In 2012, we encountered an unexplainable case of W chromosome heterogeneity in the Japanese soil-frog, Glandirana rugosa, suggesting independent evolution of the W chromosomes in two different populations (Niigata and Kanazawa), whose geographic locations are approximately 260 km apart, despite belonging to the same geographic group [16]. The frog species comprises six geographic groups based on sex determination, sex chromosomes, and mitochondrial haplotypes (Figure 1) [17,18,19]. Of these, three groups possess heteromorphic sex chromosomes of the ZZ-ZW or XX-XY type and are termed as ZW group in north-eastern Japan, Neo-ZW group in west-central Japan, and XY group in east-central Japan [17,18,19]. The sex chromosomes in all three groups are represented by homologous chromosome 7 in the 13 haploid complements: the X and W chromosomes are metacentric, sharing one origin, while the Y and Z chromosomes are subtelocentric, sharing the other origin [16,17,18]. The Neo-ZW group has a recent origin from the XY group and is divided into two sub-groups of Neo-ZW1 and Neo-ZW2 based on the mitochondrial haplotypes: the latter is proved to be derived from more recent hybridisation between the Neo-ZW1 sub-group and the XY group [20]. It has been reported in previous studies that the artificially constructed WW embryos of the ZW group die at an early developmental stage due to the presence of lethal genes degenerated on the W chromosomes, but the stages of developmental arrest as well as the symptoms of morphological anomalies differ in the two populations, Niigata (N) of Niigata Prefecture and Kanazawa (K) of Ishikawa Prefecture, occurring at 10 days post fertilisation (dpf) of edemata and 40 dpf of underdevelopment, respectively. In addition, it was reported that artificially constructed hybrid WNWK embryos of the two populations were completely viable. This depicted that the W chromosomes do not share the recessive lethal genes, thus proving that they evolved independently, but not serially from the original W chromosome.
In this study, to uncover the evolutionary mechanisms of W chromosome evolution in the ZW group of G. rugosa, we conducted analyses of its mitochondrial as well as nuclear genomic DNA.
2. Materials and Methods
2.1. Experimental Animals
A total of 195 G. rugosa frogs were collected from 26 populations in the northern and central regions of the Japanese archipelago (Table 1; Figure 1). The sex of the specimens was determined by inspection of the gonads after euthanasia. Animal care and experimental procedures were approved by the Committee for Ethics in Animal Experimentation at Hiroshima University (Permit Number: G18-2-3).
2.2. Identification of Heterogametic Sex
Total genomic DNA was extracted from the blood cells using a DNeasy blood and tissue kit (QIAGEN, Hilden, Germany) according to the manufacturer’s instructions. The heterogametic sex of the frogs was determined based on the genotypes of two sex-linked genes, ADP/ATP translocase and steroidogenic factor 1, according to a previously described genotyping protocol [20]. We previously reported the heterogametic sex of G. rugosa frogs collected from nine populations in the Kinki district of Central Japan, indicated by * in Table 1 [20,21].
2.3. Amplification of Mitochondrial DNA and Construction of Phylogenetic Trees
A 918-base pair (bp) partial fragment of the mitochondrial cytochrome b gene was amplified by polymerase chain reaction using the following primer set: forward 5′-TYA CCG GCC TAT TCC TAG C-3′ and reverse 5′-CCTARKGTGGGDAYAAGAAGGAC-3′. The cytochrome b sequence of one female from each of the 16 populations was determined (Table 1) using an ABI PRISM 370 genetic analyser (Thermo Fisher Scientific, Waltham, MA, USA) according to the manufacturer’s instructions. DNA sequences were aligned using MEGA 6 [22] and deposited in the DDBJ Data Libraries (accession number LC671792-671810). For construction of gene trees, the best substitution model for each gene was selected using Kakusan4 [23] based on the Akaike information criterion (AIC). Phylogenetic trees were constructed on the basis of the maximum-likelihood method (ML) and Bayesian inference (BI) using TREEFINDER ver. March 2011 (Munich, Germany) [24] and MrBayes ver. 3.2.1 [25]. For the ML tree, nonparametric bootstrap analysis was conducted using 1000 replicates; branches with a bootstrap value of 70% or greater were regarded as significantly supported. In the BI analysis, two independent runs of four Markov chains were conducted for 10 million generations (sampling frequency of one tree per 100 generations) of which the first three million generations were discarded as burn-in. The convergence of the parameters was checked using Tracer ver. 1.5 [26]. A Bayesian posterior probability of 0.95 or greater was accessed as significant support. To construct the phylogenetic trees, the sequence data of Pelophylax nigromaculatus, Pelophylax fukienensis, and Pelophylax lessonae were used as outgroups (AB980710/AB980717, AB980780, AB980716).
2.4. RT-PCR of Sex-Linked Androgen Receptor
To investigate the expression of Androgen Receptor (Ar) located on the W chromosome of frogs collected from P12-17 populations in the Fukui as well as Kyoto Prefectures, total RNA was extracted from the fingers of frogs using SV Total RNA Extraction Kit (Promega, Madison, WI, USA) according to the manufacturer’s instructions. cDNA was synthesised using a PrimeScript 1st strand cDNA synthesis kit (TaKaRa, Kyoto, Japan) with a (dT)20 oligonucleotide primer. RT-PCR was performed according to a previously described method [21].
2.5. Microsatellite DNA Amplification of Sex-Linked Sox3 Upstream Region
Microsatellite DNA from the sex-linked Sox3 upstream region was amplified from female and male frogs according to a previously described method [20]. Two kinds of fluorochrome (5Hex and 6 FAM) were attached to the 5′ end of the forward primers. Electrophoresis of the PCR product was performed using an ABI Prism 310 genetic analyser with GS500 size marker. GeneScan2 (Thermo Fisher Scientific, Waltham, MA, USA) was used for genotyping.
2.6. Genome Analysis to Determine Population Genetic Structure
To investigate the genetic structures of populations, genotyping-by-sequencing (GBS) was performed using diversity arrays technology sequencing (DArTseq) as described in [20]. DArTseq uses genome complexity reduction coupled with high-throughput next generation sequencing (NGS) to identify alleles displaying single nucleotide polymorphisms (SNPs) [27]. A total of 76 frogs from 12 populations (P3, 7, 9, 11, 12, 14, 19, 20–24) were genotyped; those with asterisks in Table 1 were obtained from a previous study [20]. From a total of 89,468 SNP sites identified by DArT sequences, 1626 autosomal SNPs were identified with no missing alleles across all samples (Tables S1 and S2). To characterise the genetic relationships amongst the 76 frogs, STUCTURE (ver. 2.3) [28] was run on the 1626 sites for 10,000 Markov chain Monte Carlo cycles following 10,000 burns in cycles, using an admixture model with independent allele frequencies. Ten replications were performed for each K, in the range K = 1–10, and the optimal K was estimated using STRUCTURE HARVESTER [29].
2.7. Genome Analysis to Determine the Genome Structure of Sex Chromosomes
A total of 220 sex-linked SNPs were used to investigate the genome structure of the sex chromosomes (Tables S3 and S4). The sex-linked alleles were identified based on data from our previous study [20]. Call rates of the 220 SNPs in the 76 frogs were above 0.8. To characterise the genome structure of the sex chromosomes, STUCTURE was run on 220 sites under the same conditions as that used for autosomal alleles. ZZ homogametic frogs were used to characterise Z chromosomes, while ZW and XY heterogametic frogs were used to characterise the ZW and XY chromosomes, respectively. Phylogenetic analysis based on 220 sex-linked SNPs was performed as on the autosomal SNPs.
3. Results
3.1. Identification of Three ZW Sub-Groups Based on Mitochondrial DNA Sequence
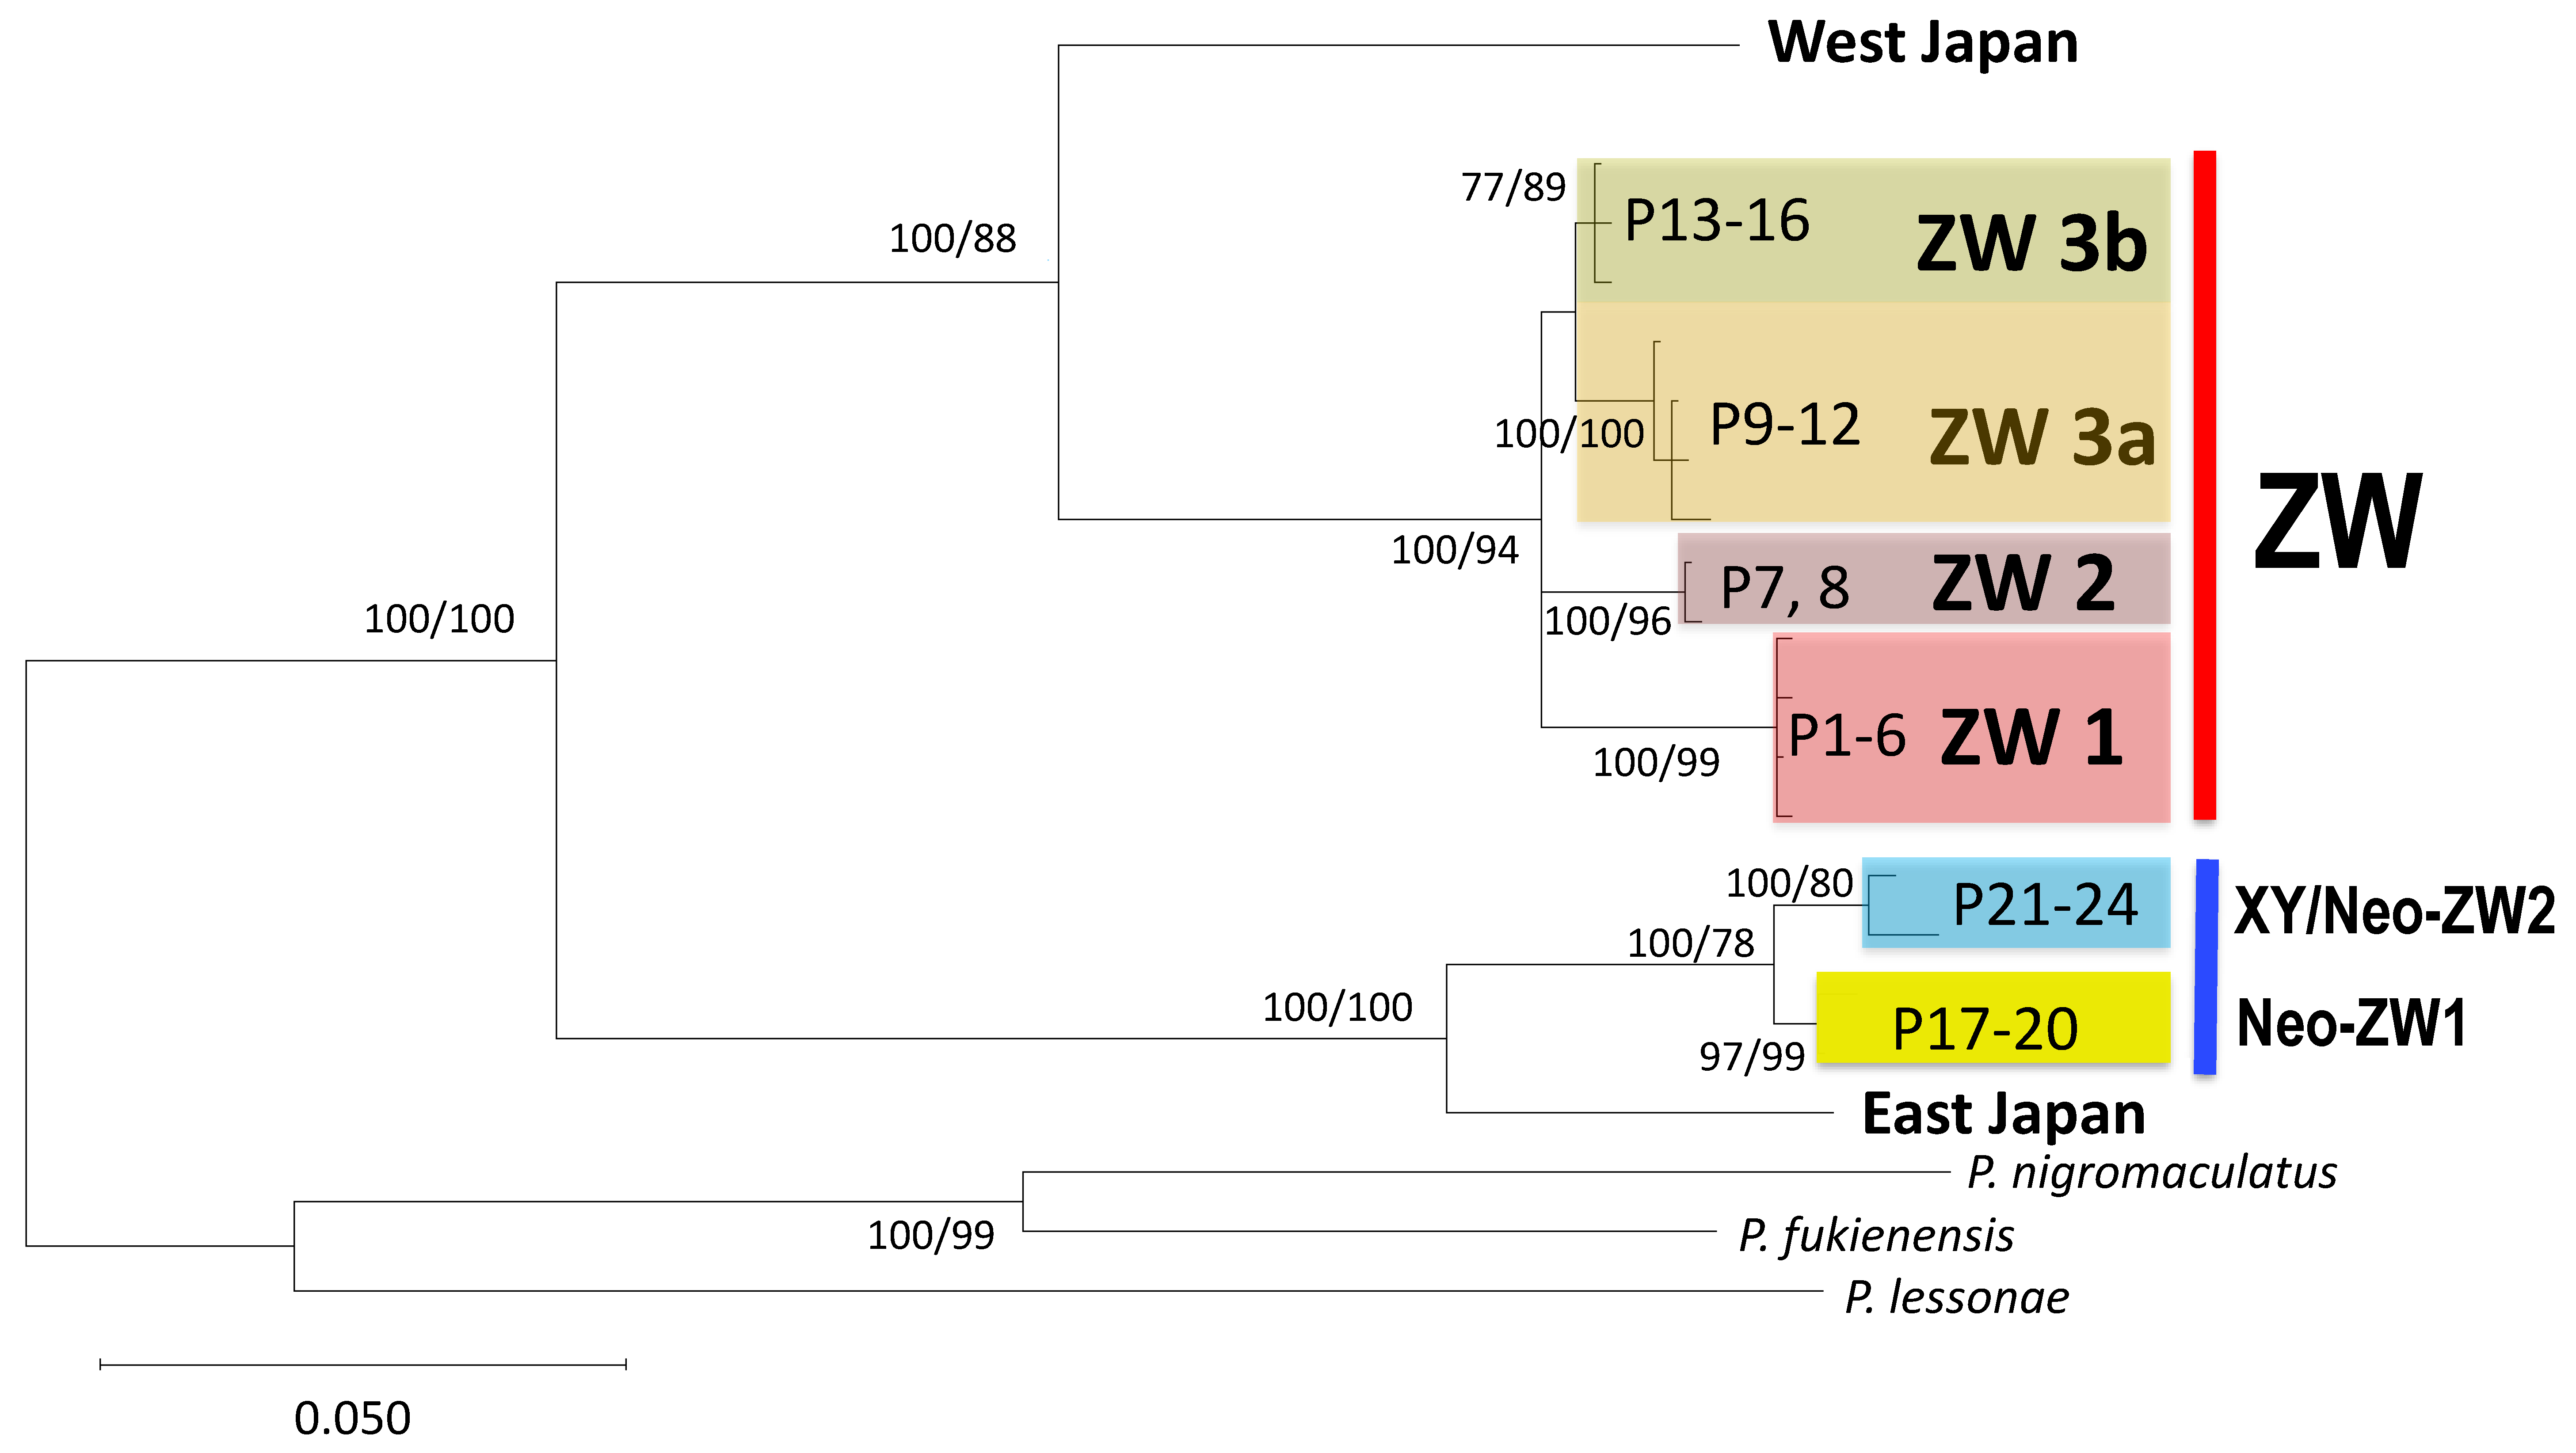
A total of 13 haplotypes of cytochrome b were identified in 16 frogs from 16 populations (P1–16) belonging to the ZW group (Table 1). Based on ML or Bayesian methods (Bayes), the haplotypes were found to constitute three distinct clades (ZW1, ZW2, and ZW3). Of these, ZW1 and ZW2 were significantly supported by both methods, whereas ZW3 was not supported by the Bayesian method (BPB = 0.79) (Figure 2). The ZW3 haplotypes were further divided into two subclades, ZW3a and ZW3b.
3.2. Three ZW Sub-Groups Based on Nuclear Genomes
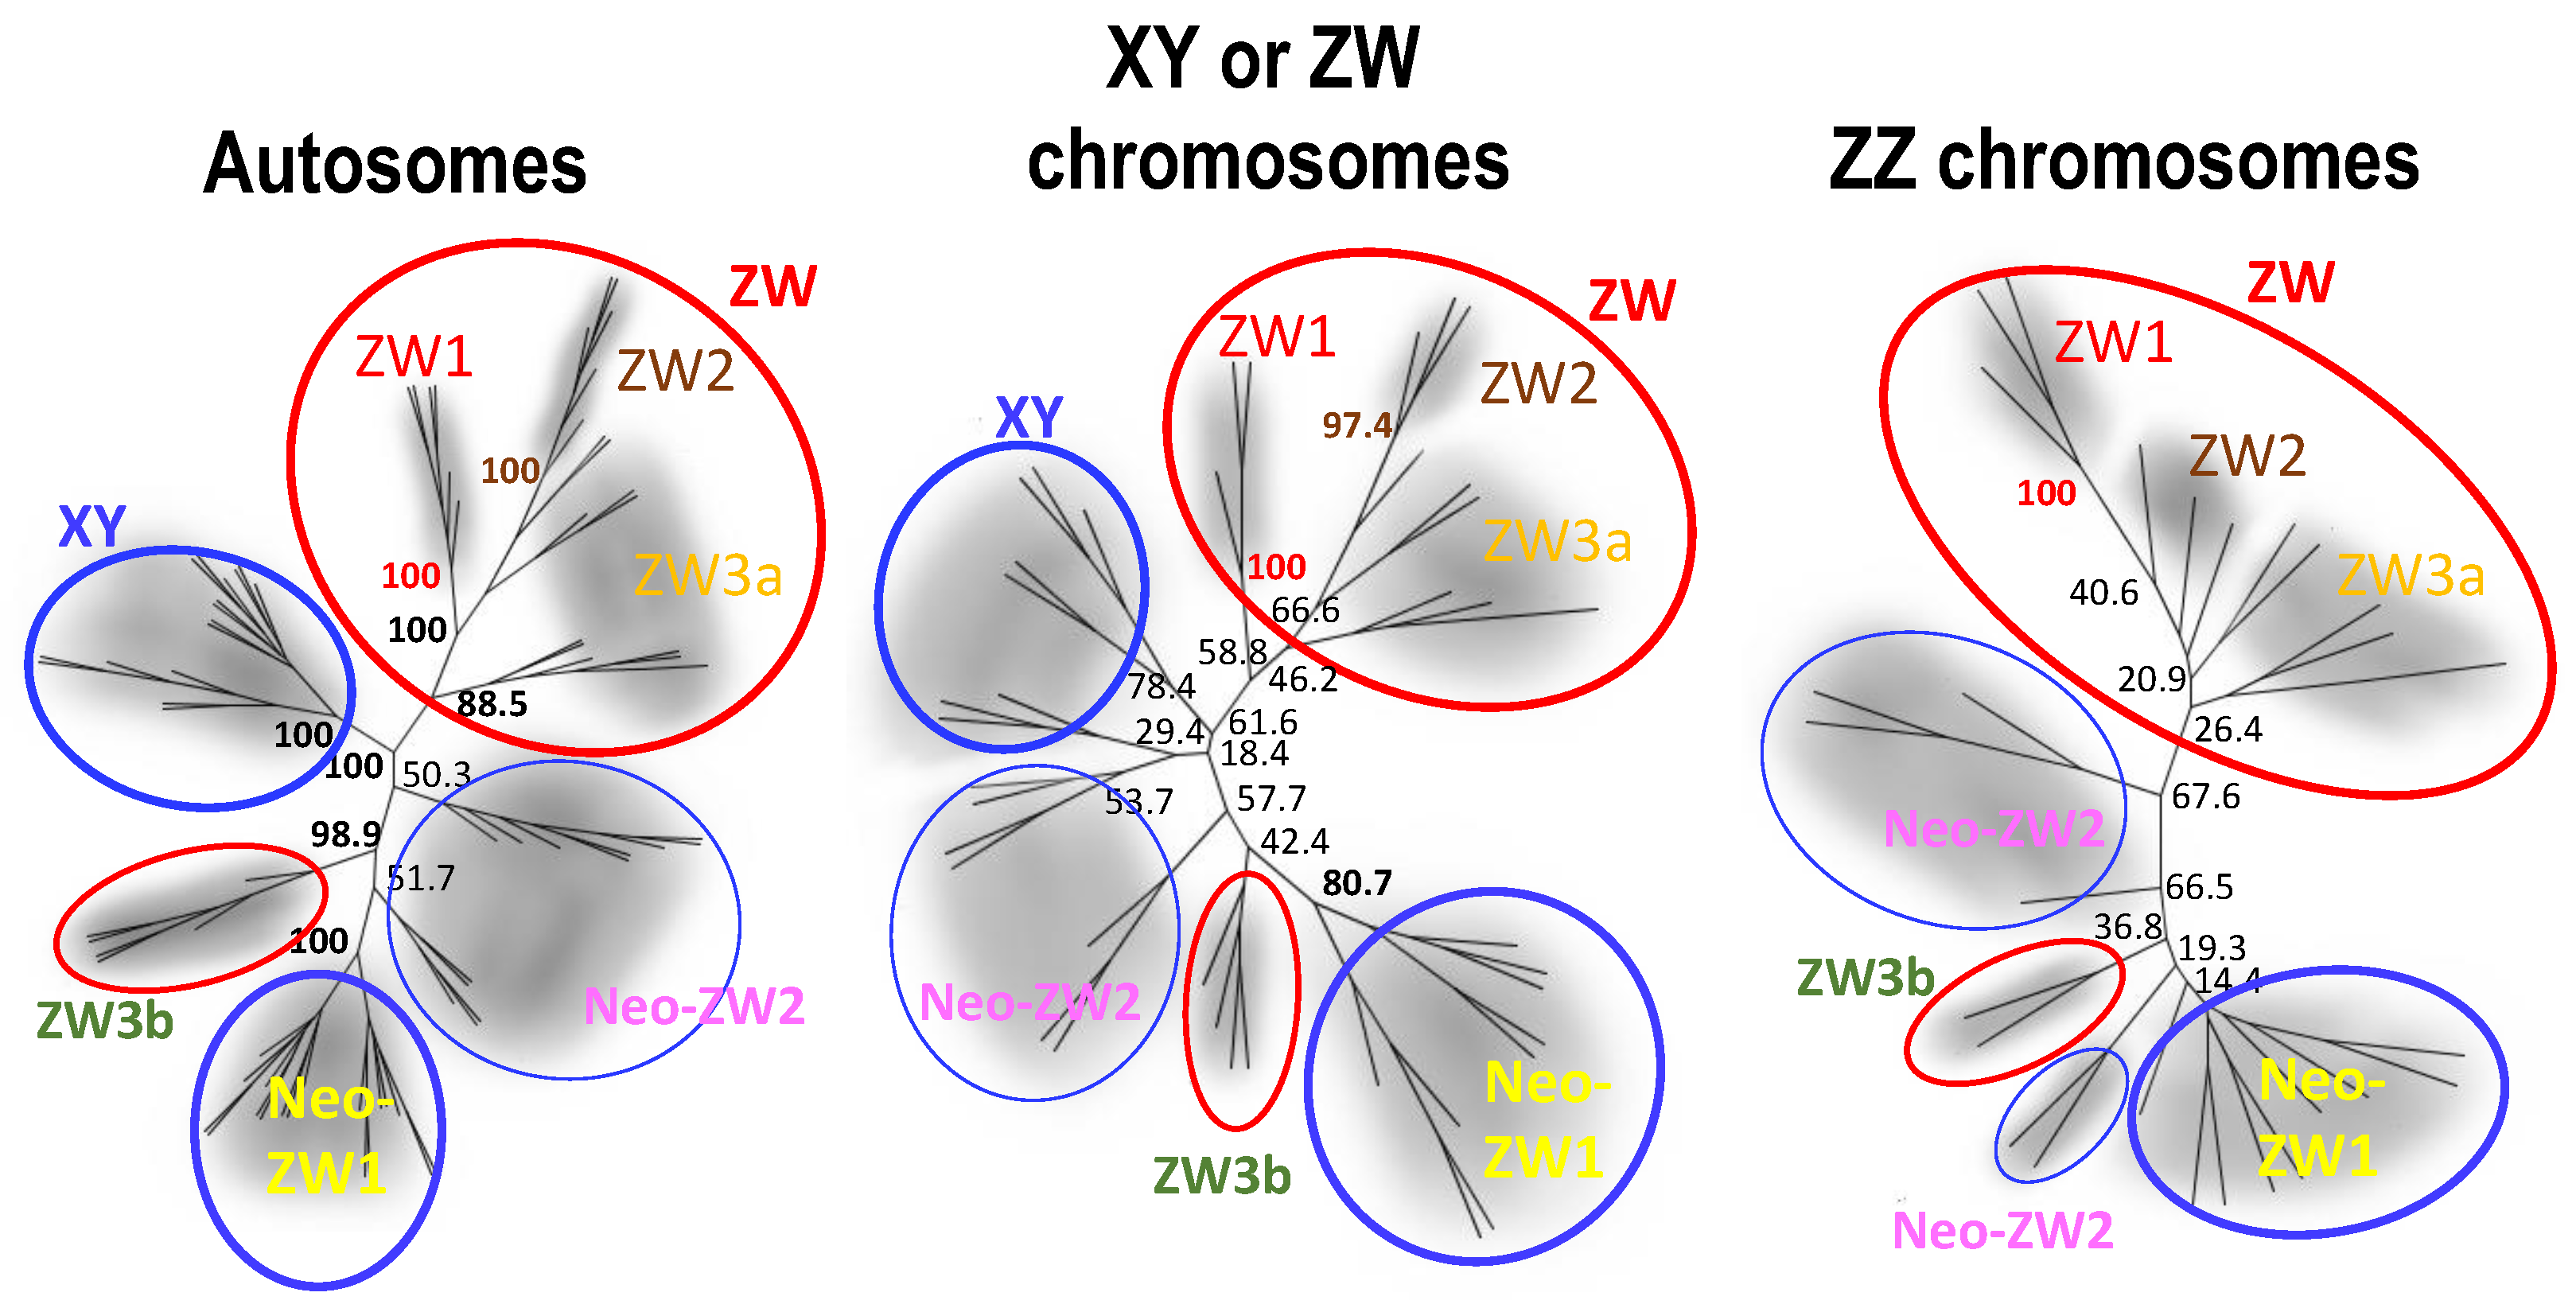
To confirm the three ZW sub-groups identified on the basis of mitochondrial haplotypes, we investigated the nuclear genomes using diversity arrays technology sequencing (DArTseq). The neighbour-joining trees based on 1626 autosomal SNPs and 200 sex-linked (XY or ZW chromosomes and ZZ chromosomes) SNPs identified in 76 frogs from 12 populations (superscript “$” on the right of the numbers in Table 1; Tables S1 and S2) clearly separated the sub-groups of ZW1, ZW2 and ZW3a from the XY and Neo-ZW groups, but not the ZW3b, which was perfectly located close to the latter (Figure 3). ZW3a did not constitute any monophyly, sharing branches with the ZW2 sub-group.
3.3. Population Genetic Structure
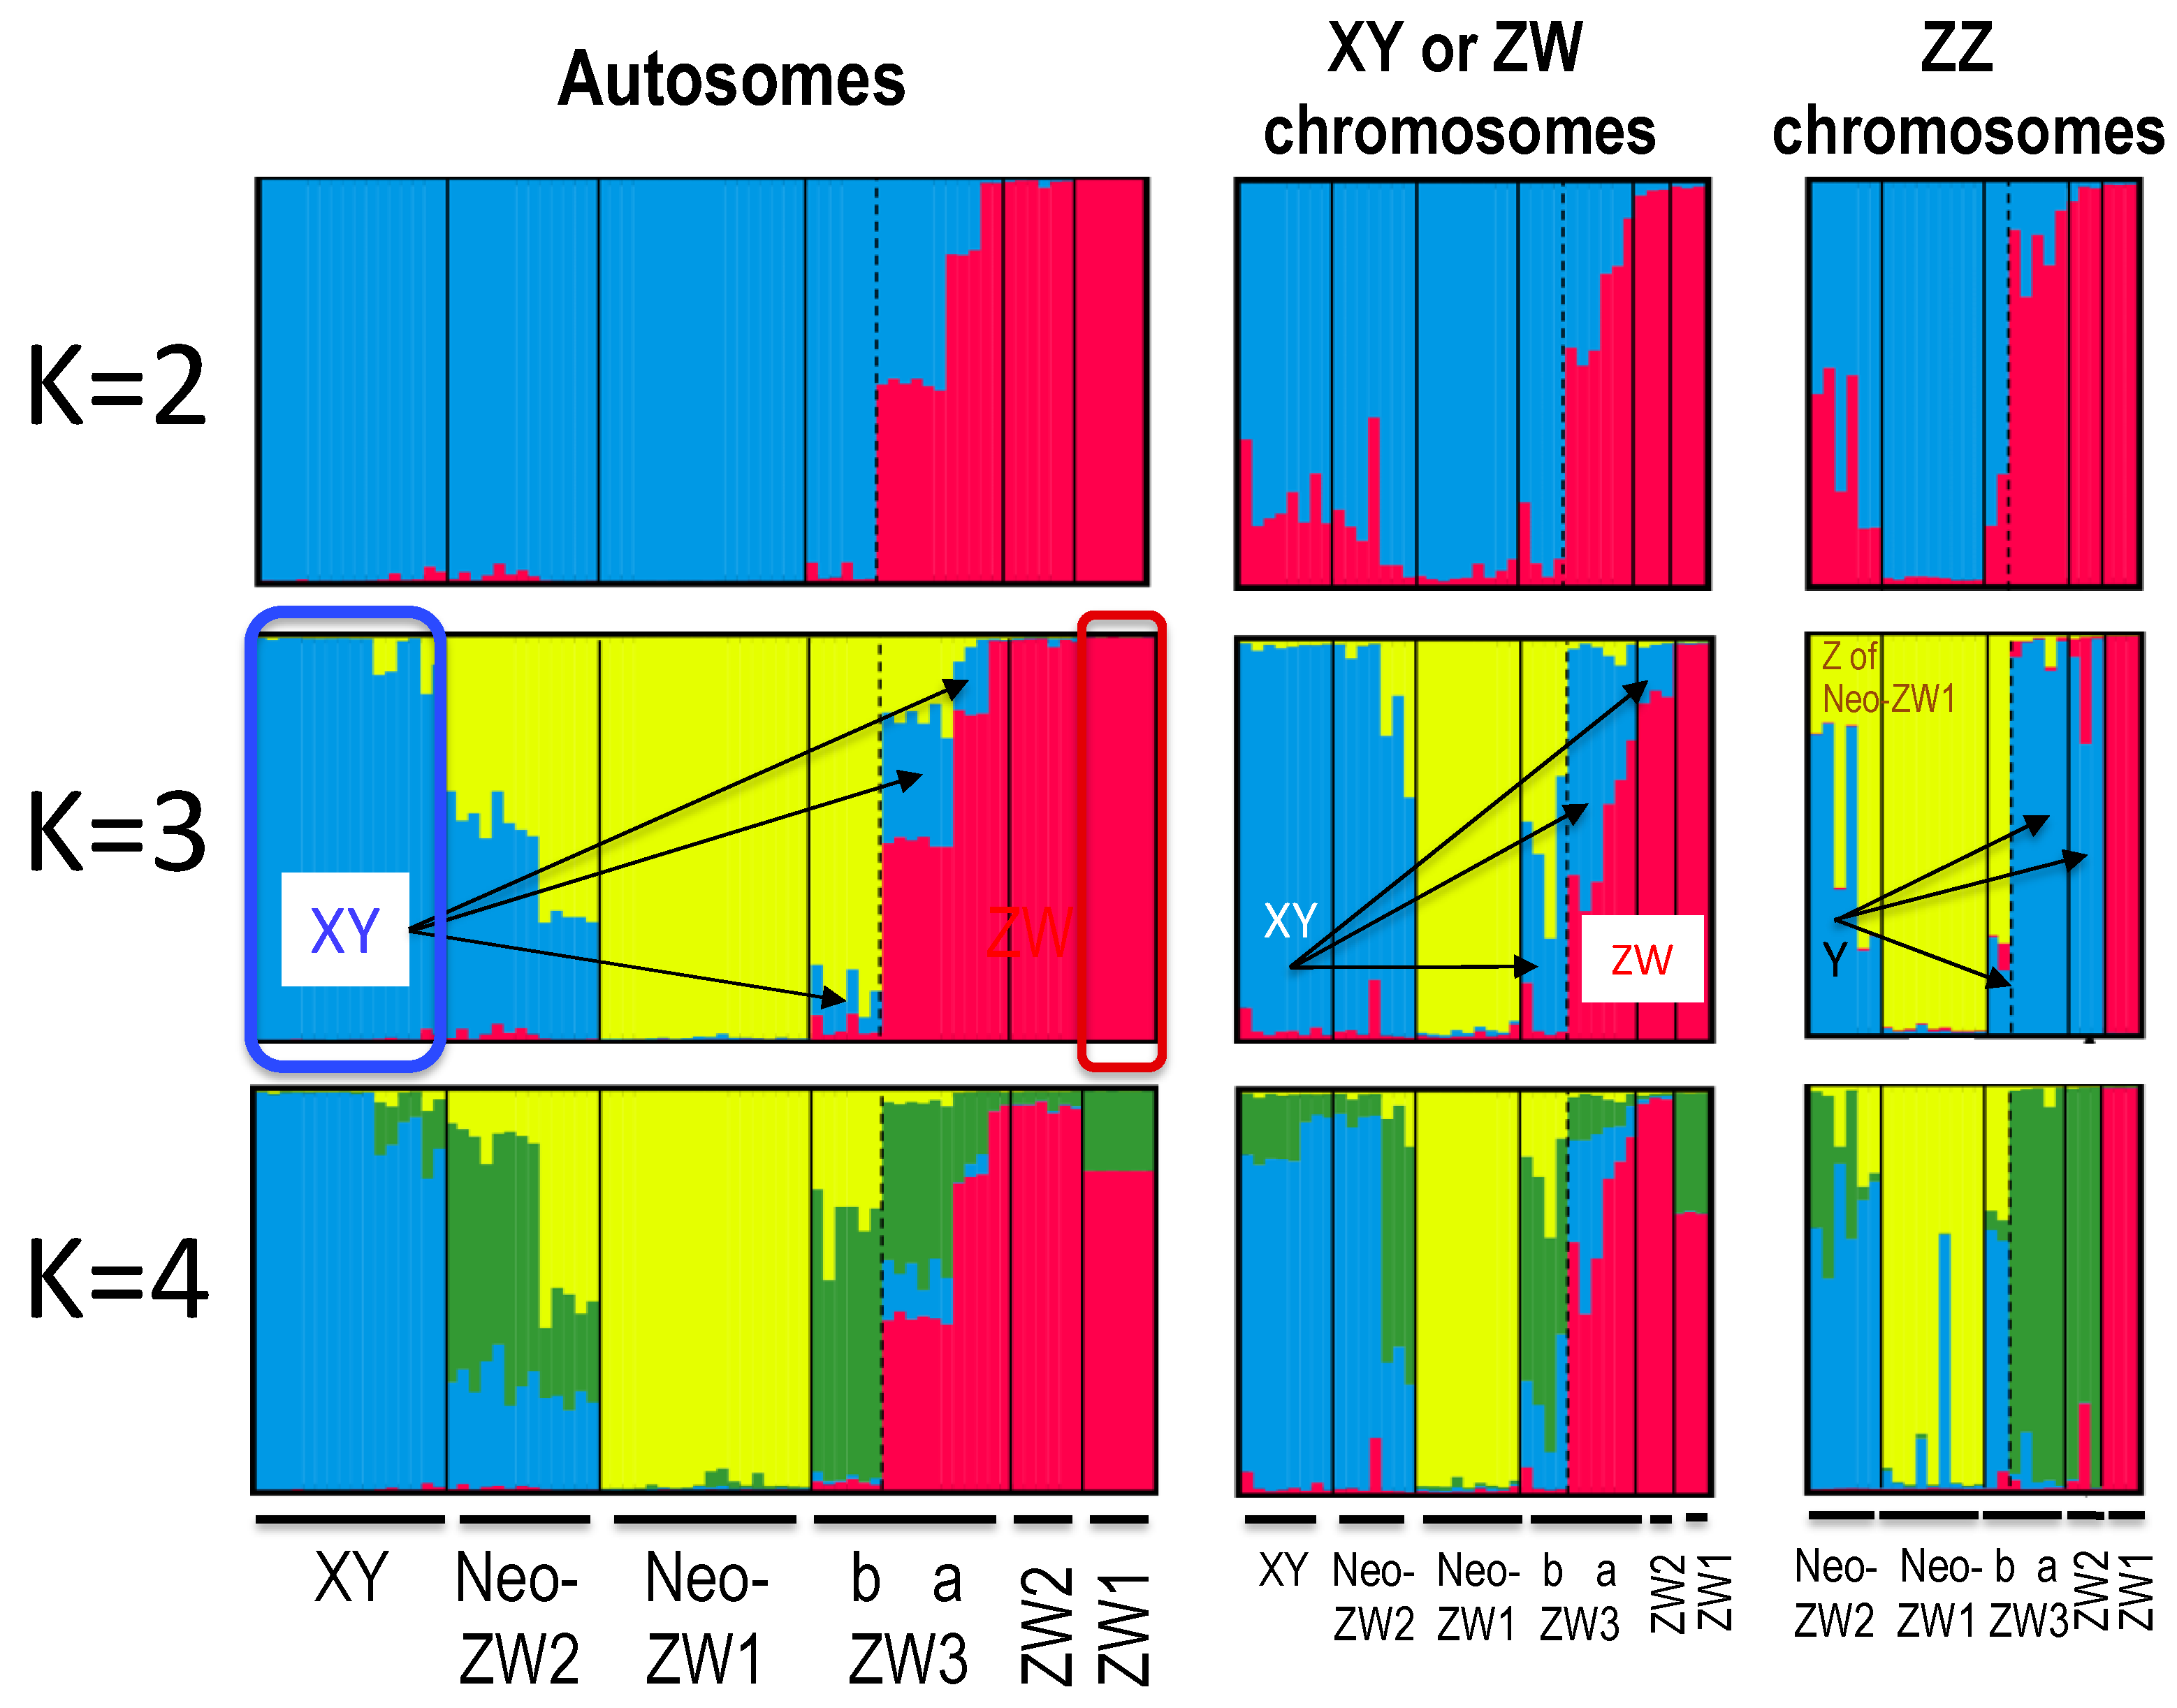
To investigate the genetic structure of the ZW populations, we conducted STRUCTURE analysis based on the same set of autosomal SNPs as those used in the phylogenetic tree (Figure 4; Figures S1 and S2). The delta K value was the largest (358.15) in k = 2, 25.26 in k = 3, and 5.82 in k = 4. The K-3 map clearly identified three distinct clusters, XY group (blue), Neo-ZW1 sub-group (yellow), and ZW1 sub-group (red) (Figure 4): XY and ZW1 evolved first [17] and Neo-ZW1 was secondarily derived from the XY group [21]. ZW3a was found to be genetically composed of three different clusters: blue, yellow, and red, and ZW3b was almost dominated by Neo-ZW1 genome clusters (yellow) (Figure 4, K = 3).
3.4. Genomic Structure of Sex Chromosomes
To investigate the genomic structure of the sex chromosomes in the ZW populations, separate allele distributions were created for homogametic ZZ males as well as for heterogametic ZW females and XY males in structure maps of 220 sex-linked SNPs (Tables S3 and S4; Figure 4, Figures S1 and S2). Delta K values for heterogametic frogs were 24.60 (k = 2), 17.21 (k = 3), and 1.38 (k = 4), while those for homogametic ZZ frogs were 35.21 (k = 2), 21.94 (k = 3), and 6.95 (k = 4). In the K3 map of heterogametic frogs, XY alleles (blue) constituted half or less of ZW females of the ZW3a or ZW3b sub-groups. In the homogametic ZZ frog map, Y alleles (blue indicates Y alleles while yellow indicates Z alleles from Neo-ZW1 in ZZ males of Neo-ZW2, because this sub-group has a more recent origin at hybridisation between XY and Neo-ZW1, see [20]) constituted one-third of ZZ males from ZW3b, and almost all of ZZ males from ZW3a and ZW2 (arrows in K = 3 map of ZZ chromosomes in Figure 4).
3.5. Expression of the Ar Gene on W Chromosome
The Ar gene is sex-linked in ZW and XY groups [32,33]: Z-, Y-, or X-borne Ar are normally expressed, whereas W-borne Ar is not or very faintly expressed [16,34]. To characterise the W chromosomes, we examined Ar expression in ZW females from the ZW as well as Neo-ZW groups. W-Ar was not expressed in any of the 15 ZW females from the ZW1 or ZW2 sub-groups (P2, P4, P7, and P8) (Table 1). In contrast, it was normally expressed in 20 out of the 21 ZW females from Neo-ZW populations (P17, P20–P22) and 29 out of 37 ZW females of the ZW3 sub-group (P10–P16) (Table 1).
3.6. Microsatellite Locus of Sex-Linked Sox3 Upstream Region
Haplotypes of the Sox3 upstream region, another sex-linked locus, were investigated. A single allele (230), which was characterised by all ZW females of the ZW1 sub-group (P1–P6) (Table 1), was found in one population (P11) of the ZW3a sub-group. In contrast, a single allele (240), which was characterised by all ZW females of the Neo-ZW1 sub-group (P17–20), was found in four populations (P13–16) of the ZW3b sub-groups and in XX females of the XY group (P24). Allele 248, which was identified in one population (P12) of the ZW3a sub-group, was in common with the females of the Neo-ZW2 sub-group (P22) and XY group (P24). These alleles support X chromosome introduction from XY into ZW3 populations. Another four alleles were unique in the remaining population (P9) of the ZW3a sub-group and two populations (P7 and P8) of the ZW2 sub-group (Table 1).
4. Discussion
4.1. Geographic Differentiation of the Three ZW Sub-Groups
The Japanese frog G. rugosa has two heteromorphic sex chromosome systems of XX-XY and ZZ-ZW. Both sex chromosomes are represented by homologous chromosome 7 in the complements. In our previous study [16], we encountered an unexplainable case of W chromosome differentiation: the W chromosomes from two different populations did not share the degenerated lethal genes to cause WW embryo mortality. To uncover the mechanisms of W chromosome heterogeneity, we conducted this study and found out the following.
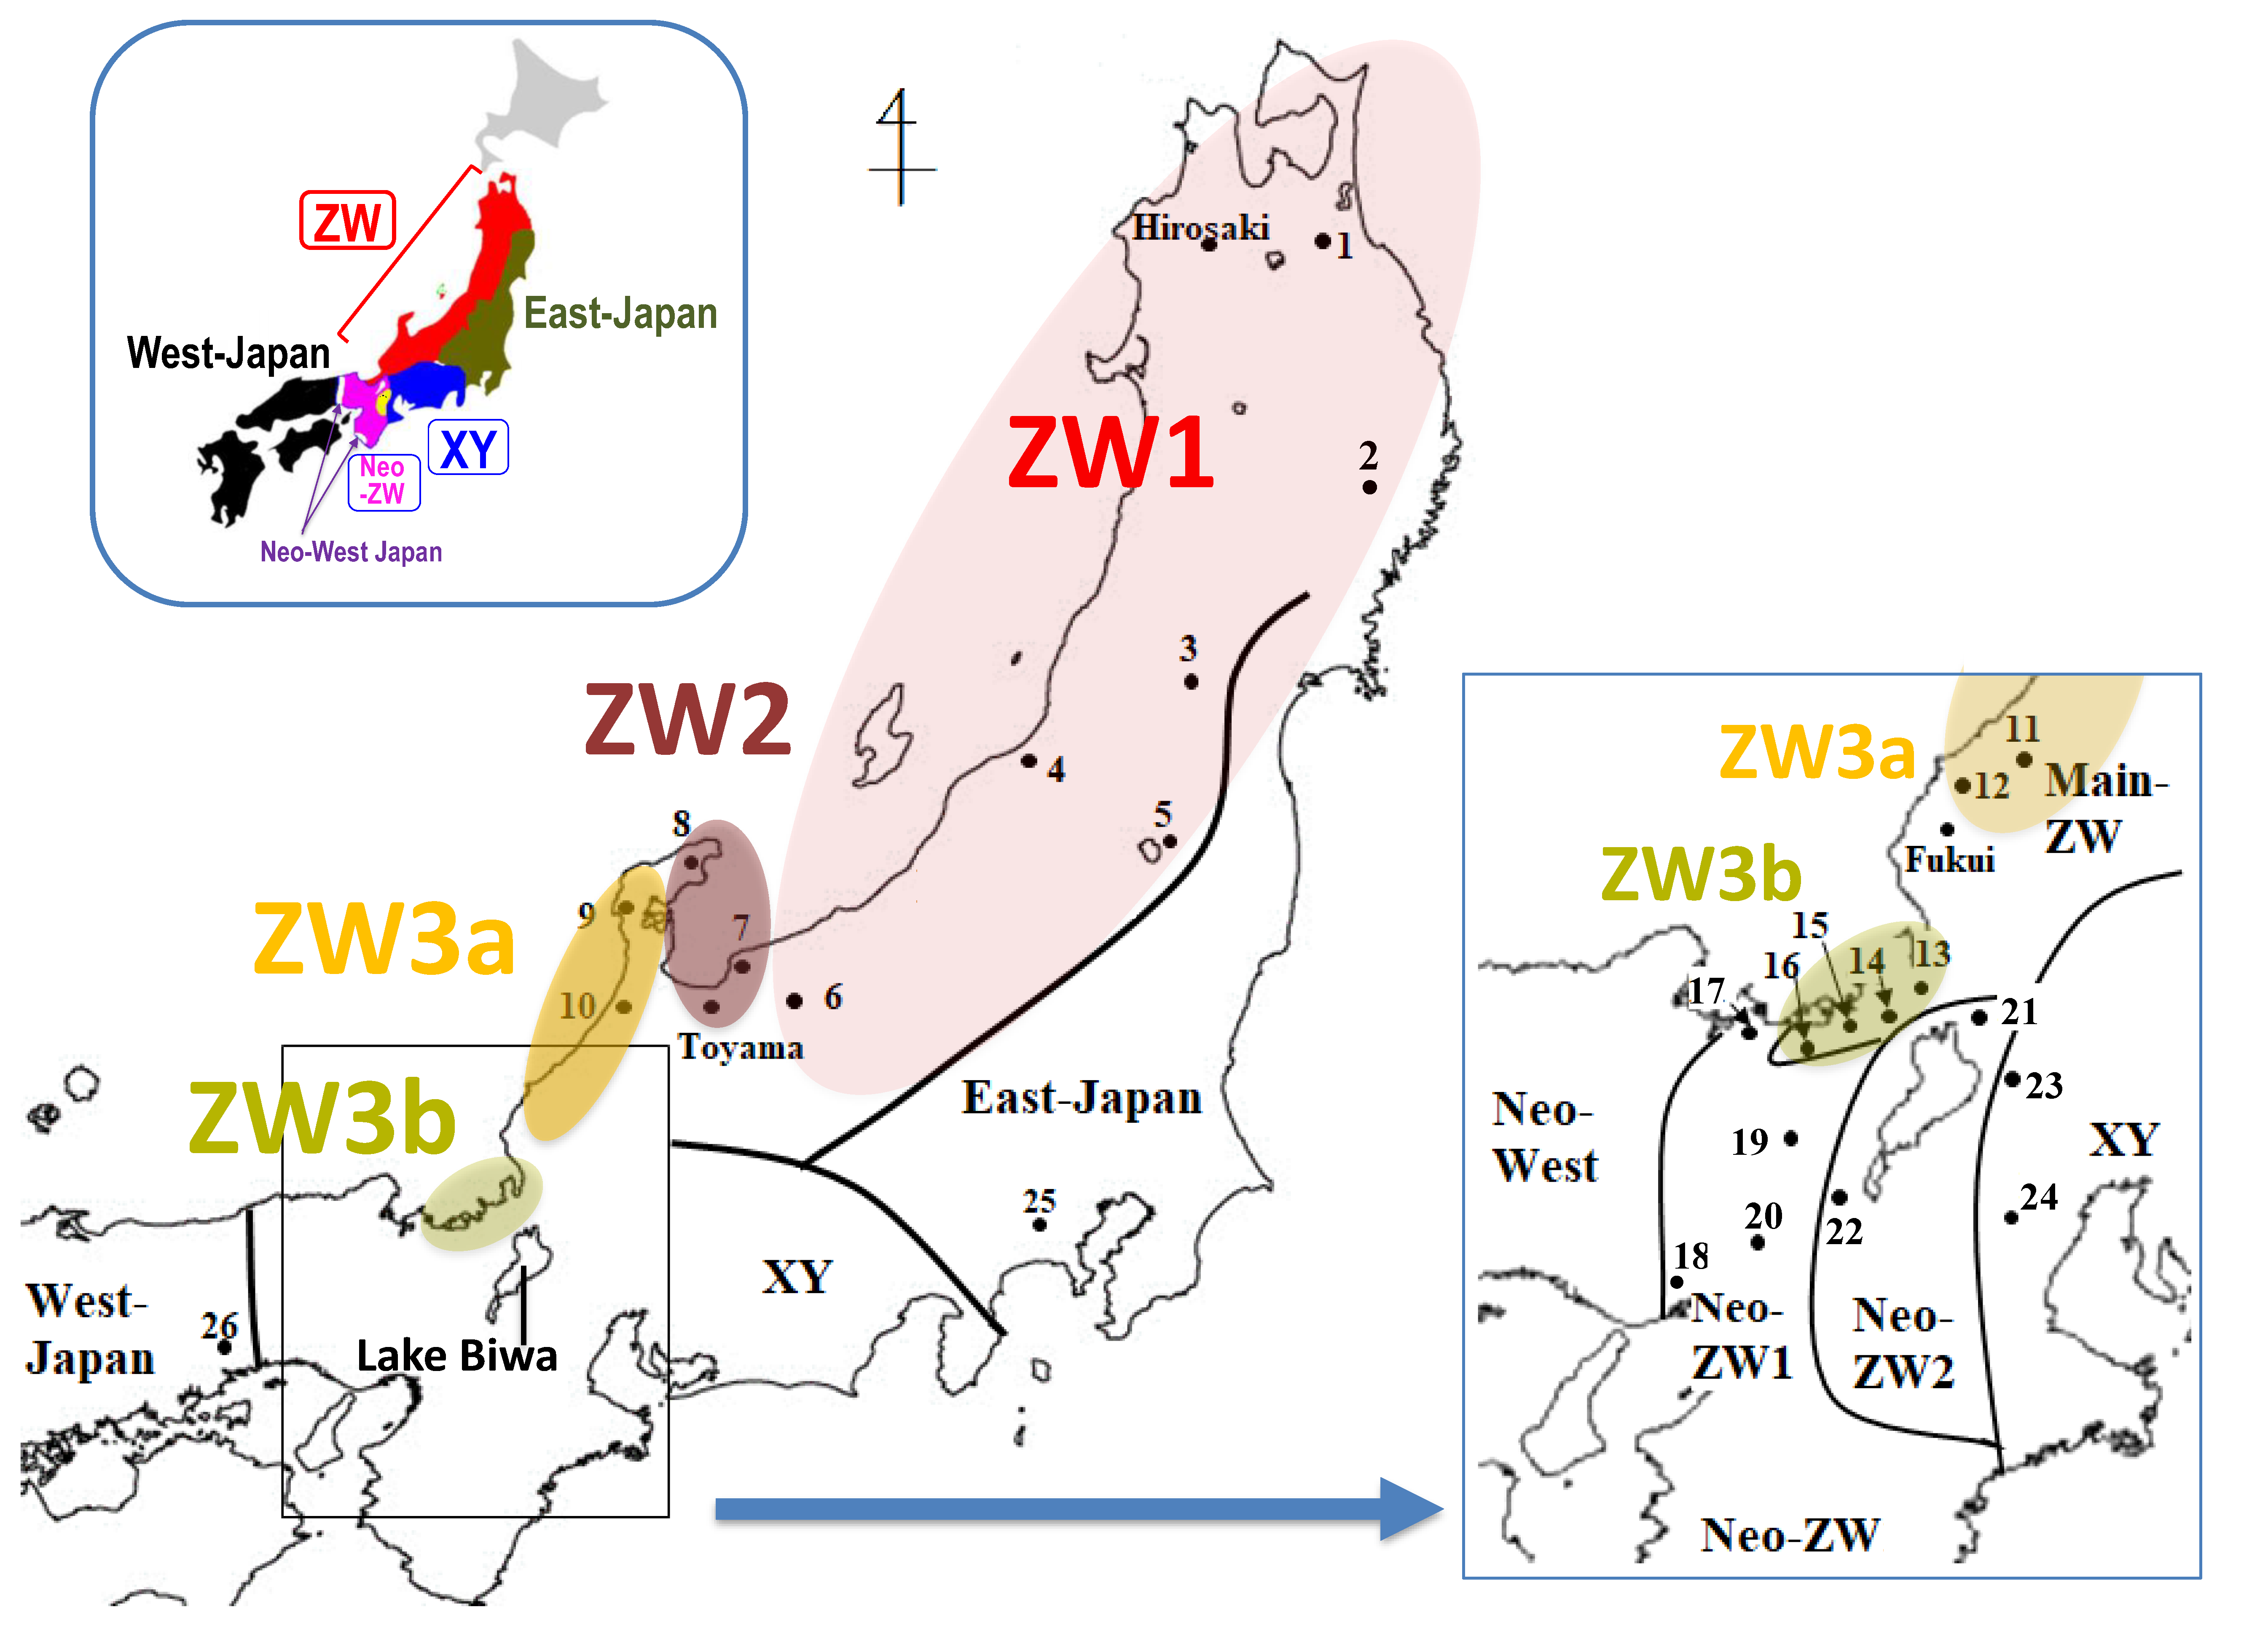
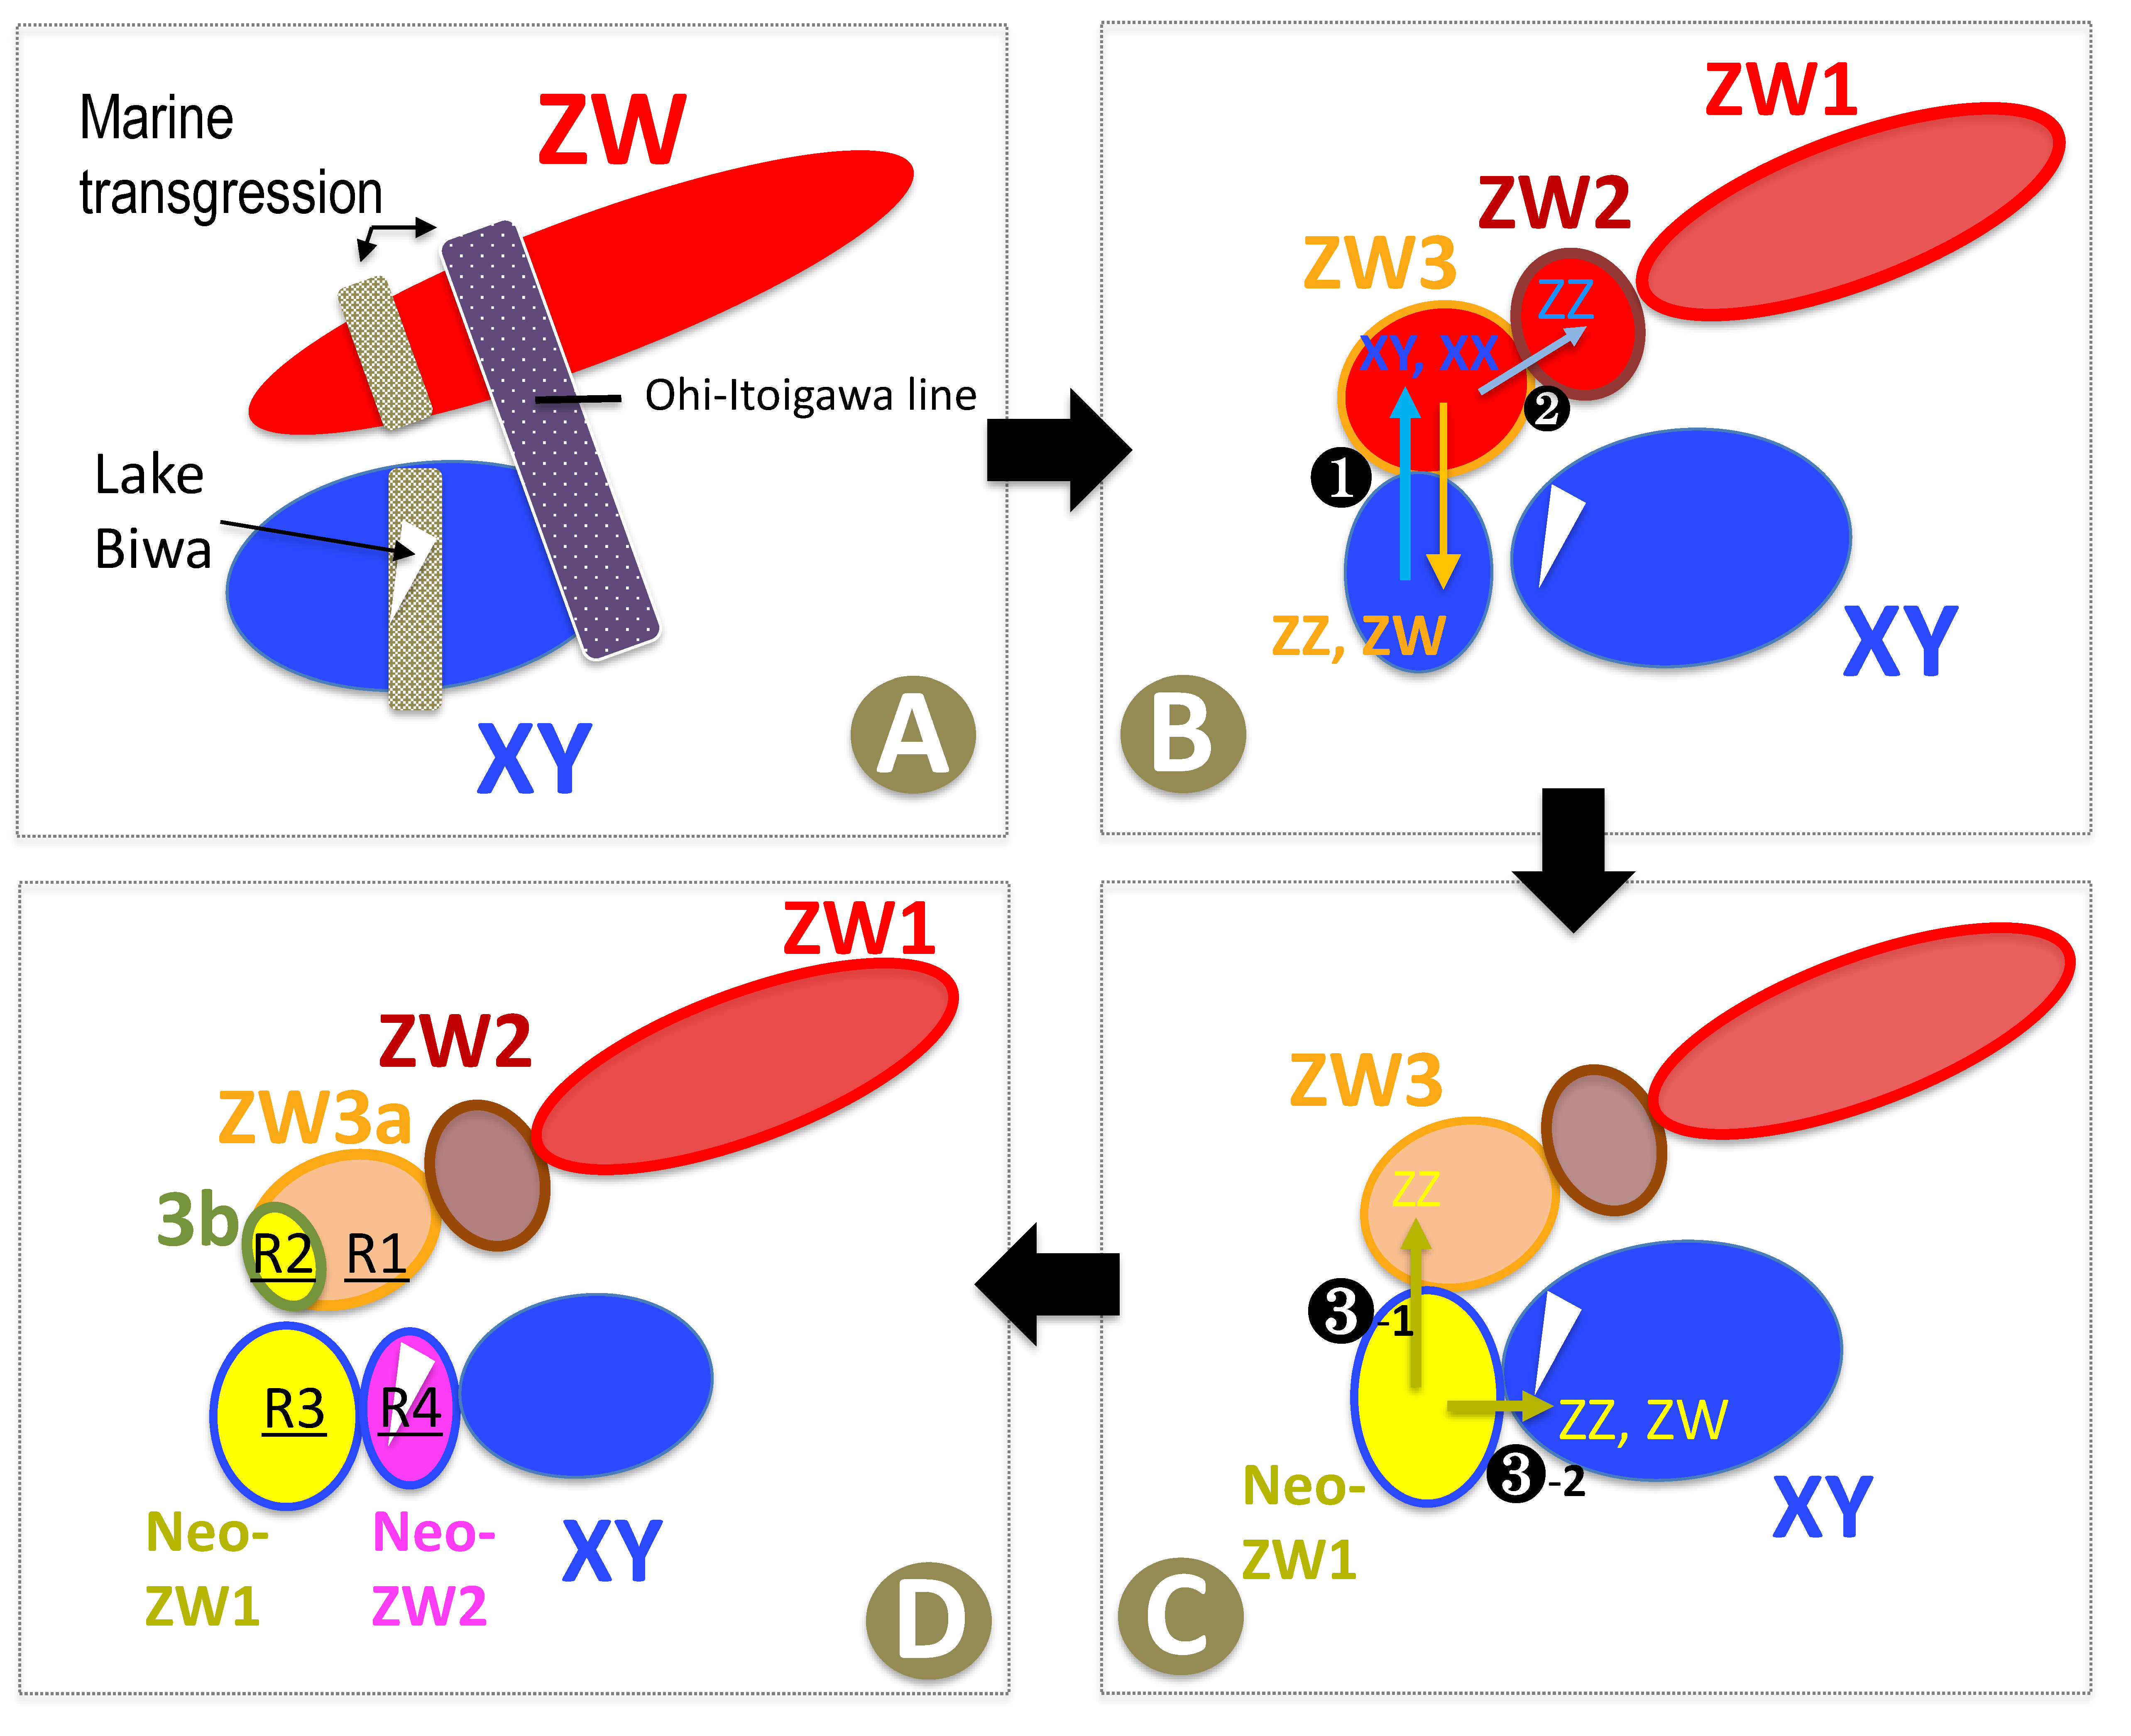
First, we elucidated that the ZW group bearing ZZ-ZW heteromorphic sex chromosomes comprises three sub-groups (ZW1, ZW2, and ZW3, in the order from north to south geographic region), based on haplotypes of the mitochondrial cytochrome b gene (Figure 2). The ZW3 sub-group can be further separated into smaller sub-groups of ZW3a (P9–P12) and ZW3b (P13–P16). Geographically, the boundary between the ZW1 and ZW2 sub-groups, which is located between P6 (Ohmachi) and P7 (Kurobe), almost coincides with the historical boundary between the east and west region of the Japanese mainland, called the Ohi-Itoigawa line [35]. Thus, it is plausible that the ZW1 and the other ZW2–ZW3 sub-groups were separated from each other (and thus genetically differentiated) by a large geographic event in the past that isolated the Eastern and Western Japanese mainland (Figure 5). In addition, according to the geological history of the Hokuriku region, the Ishikawa, Fukui, and Toyama areas (corresponding to the ZW2 and ZW3a areas in Figure 1) were repeatedly submerged in the sea during the late Pliocene and middle Pleistocene periods [35]. Such submergence may have induced further geographic isolation of the ZW populations and resulted in the formation of the three sub-groups, ZW1, ZW2, and ZW3. Subsequent to the ZW3 sub-group and XY group coming into contact and hybridising in the southern Fukui region (corresponding to the ZW3b region in Figure 1), the ZW3 group might have been divided into ZW3a and ZW3b by sea transgression (Figure 5A–D).
4.2. W Chromosome Heterogeneity as a Result of Repeated X Chromosome Recycling
Second, we found that the sex chromosomes of the ZW (three sub-groups) and Neo-ZW groups (two sub-groups) were genomically classified into six types of Z chromosomes (Z1, Z2, Z3a, Z3b, ZN1, and ZN2) and five types of W chromosomes (W1, W3a, W3b, WN1, and WN2), respectively, based on sex-linked SNPs and Sox3 upstream microsatellite, W-Ar expression, and WW embryo mortality (Figure 6). The evolutionary mechanisms of the Z and W chromosomes in the Neo-ZW1 and Neo-ZW2 sub-groups have been described in our previous studies [20,21]. In this study, the W1 chromosomes in the ZW group were found to be shared by the ZW1 and ZW2 sub-groups: W-borne Ar was not expressed, and WW embryos died at 10 dpf with oedema (L10 in Figure 6). On the other hand, their Z chromosomes are not shared: the Z2 chromosomes of ZW2 are almost entirely replaced with Y chromosomal segments of the XY group, as ZZ clusters of ZW2 sub-group are mostly indicated in blue, which are the Y chromosomal segments of Neo-ZW2 in K3 map of Figure 4 and Figure 6). Although autosomal SNPs did not indicate genomic introgression of the XY group into the ZW2, the genomic region of the Y chromosomes might have been introduced via XY males following separation from ZW1, and then may have been replaced with the Z1 chromosome (Figure 4, Figure 5B-❷ and Figure 6). The genetic structures of the ZW sex chromosomes differ from each other between the ZW3a and 3b sub-groups: the major part of W3a chromosome mostly comprises the original W1 chromosome except for the Ar or lethal genes, whereas W3b mostly comprises parts of X chromosomes, as ZZ clusters of ZW3b are mostly indicated in yellow (ZNeo1) while ZW clusters are equally both in yellow and blue showing that the W3b chromosomes originated from X chromosomes (blue) (in K3 map of Figure 4 and Figure 6). W3ab-borne Ar was or was not expressed, and W3aW3a embryos died at 40 dpf owing to underdevelopment (L40). Experimental data for the development of W3bW3b embryos is not available. Z3a chromosomes of ZW3a are almost entirely replaced with Y chromosomes (shown in blue in K3 map of Figure 4, Figure 5B-❶ and Figure 6), while major parts of Z3b have accepted introgression from ZN1 of Neo-ZW1 sub-groups (shown in yellow in K3 map of Figure 4, Figure 5C-❸-1 and Figure 6).
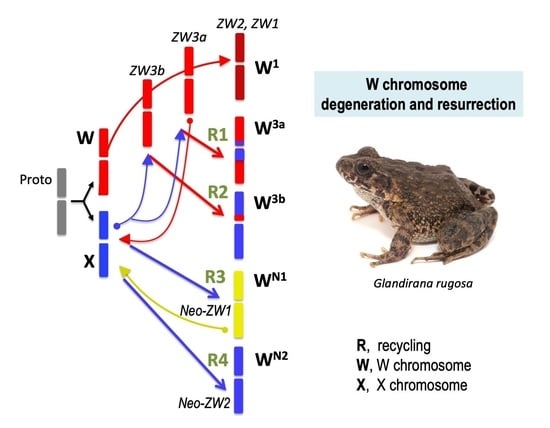
How were the W3ab chromosomes of the ZW3 sub-group reconstructed from the X chromosomes without replacing the mitochondrial haplogroups? Normally, mtDNA as well as W chromosomes are maternally inherited. Therefore, it has been predicted that patterns of phylogenetic differentiation in mtDNA as well as W chromosomes occur in parallel, as reported in avian species [36,37]. In this study, we assumed that the X chromosomes may have been introduced via XY males of the XY group that emigrated into the ZW3 sub-group, without any replacement of mitochondrial haplotypes. A cross between ZW females and XY males would have produced WX hybrid females, in which the W and X chromosomes had undergone a normal recombination because of their identical morphology (metacentric) [38]. The W-X recombination was subsequently confirmed in artificially designed WX hybrid females where chiasmata were observed along the WX bivalent chromosomes [39]. The W-X recombination may have replaced the original W chromosomes, bearing degenerated lethal genes and Ar, with those bearing the active form of the genes, finally leading to the heterogeneity of W chromosomes in the ZW group. Upon inclusion of the cases of the Neo-ZW group in our previous study [21], we have concluded that in the past, X chromosomes derived from the XY group had independently recycled into the new W chromosomes at least four times: W chromosomes of Neo-ZW group (Neo-ZW1 and Neo-ZW2) on the one hand (R3 and R4 in Figure 5 and Figure 6), and W chromosomes of ZW group (ZW3a and ZW3b) on the other hand (R1 and R2 in Figure 5 and Figure 6). Recycling revived the W chromosomes by removing degenerated genes such as the lethal recessive genes that arrest development at an early stage as well as the nonactive Ar. Thus, X chromosome recycling to the W chromosome can explain the nature of W chromosome heterogeneity in the ZW group that was mentioned in our previous study [16]. These results reveal that the W chromosomes in G. rugosa repeated the cycle of degeneration and resurrection, causing intermittent degeneration, by introducing X chromosomes from XY populations of other geographic regions.
4.3. Another Model of the W Chromosome Evolution
In this study, our theory of W chromosome reconstruction in the ZW group is based on the X chromosome introgression into the ZW populations through emigration of the XY populations. Another model to explain the W chromosome heterogeneity might be proposed. This one is based on a recent bottle neck effect [40]: originally, the W chromosomes were heterogeneous in the ZW populations and then the W1 chromosome has recently reached an extreme homogeneity through geographic isolations and a bottle neck effect, while the W3ab chromosomes still conserve the heterogeneity. However, this model could not explain the discordance between mitochondrial and nuclear genomes in the ZW3b sub-group. Moreover, if it is a recent bottle neck, the theory cannot explain the fact that the degenerated lethal genes to arrest development of WW embryos are not shared between the W1 and W3a chromosomes. In addition, a prerequisite is that no W chromosome degeneration proceeded before separation of the three ZW sub-groups but occurred rapidly and individually after the separations. Or another model might be of ghost admixture to explain the genetic heterogeneity of ZW3 sub-groups [40], but we have never known any ZW population (a ghost) of which genomic constitution (on chromosomes or allozymes) is unique or exceptional in the ZW group. Therefore, our theory based on the sex chromosome recycling is the best candidate to explain the W chromosome heterogeneity in G. rugosa that we can propose at present.
4.4. Novel Evolutionary Theory on the Origin of Neo-ZW Group
Based on its phylogenetic origin, we had hypothesised in a previous study that the Neo-ZW group had originated by hybridisation between the XY group (with heteromorphic sex chromosomes) and the West-Japan group (with homomorphic XX-XY type of sex chromosomes) [21]. In fact, the mitochondrial haplogroups of the Neo-ZW group are certainly different from those of the ZW group and instead, share homology with those of the XY group. In addition, based on allozymes, the nuclear genomes of the Neo-ZW group supported hybridisation, including that with the West-Japan group [41]. However, the following two findings on hybridisation between different sex determining and sex chromosome systems in this frog species require a revision of the previous hypothesis: (1) in sex determination, female heterogamety dominates male heterogamety [20], and (2) in sex chromosomes, homomorphy dominates heteromorphy [19]. In addition, the present study revealed that the Neo-ZW group evolved by emigration from the ZW3 sub-group into the XY group that was originally located in the present region of the Neo-ZW group. It has been proven experimentally that reproductive isolation is not established amongst the geographic groups of this species [42,43,44], and that geographic barriers are unconfirmed around the boundaries between the ZW3b sub-group and Neo-ZW group. In addition, hybridisation between the two different species of medaka fish has been reported in the regions corresponding to the boundary between the ZW3b sub-group and Neo-ZW group (Oryzias sakaizumii from north and Oryzias latipes from the south) [45]. Thus, we reconsidered the involvement of the ZW group in the evolution of the Neo-ZW group and propose that the evolutionary origin of the Neo-ZW group was driven mainly by hybridisation between the ZW (ZW3 sub-group) and XY groups, with slight genetic introgression from the West-Japan group (Figure 5 and Figure 6).
5. Conclusions
The geographic ZW group bearing ZZ-ZW heteromorphic sex chromosomes are genetically classified into three sub-groups, ZW1, ZW2, and ZW3 (a and b) based on mitochondrial cytochrome b sequences. The high-throughput analyses of nuclear genomes (autosomes as well as sex chromosomes) uncovered the mechanisms responsible for genetic heterogeneity of the W chromosomes in geographic populations. X chromosomes were recycled into new W chromosomes via recombination between the W and X chromosomes in WX female hybrids (hybrids between ZW females of the ZW3 sub-group and XY males of the XY group). Putting together the results derived from our previous studies in the cases of Neo-ZW1 and Neo-ZW2, it was concluded that the W chromosomes evolved from the X chromosomes independently at least four times in the ZW and Neo-ZW groups. This is a case of intermittent evolution of W chromosomes via interpopulation hybridisation: a repetition of degeneration and resurrection. Finally, one question remains to be answered: Why is female heterogamety always dominant over male heterogamety in this species? The X chromosomes were recycled into W chromosomes in hybrid populations between the sex-chromosome differentiated groups, even though the original W chromosomes were removed from the hybrid populations due to WW mortality and the WY hybrid could be differentiated into a male or a female [20,43]. This seems to contradict the previously reported theory that there is no significant bias in the transition rate between XY and ZW systems in amphibians [46,47]. The evolutionary significance of heterogametic sex choice or epistasis may still be an issue to be resolved to further the understanding of the evolution of sex-determining mechanisms and sex chromosomes.
Supplementary Materials
The following supporting information can be downloaded at: https://www.mdpi.com/article/10.3390/dna2030012/s1, Table S1: Autosomal genetic markers (1626 SNPs) isolated from 12 populations, Table S2: Sequences of the autosomal genetic markers (1626 SNPs), Table S3: Sex-linked markers (220 SNPs) isolated from 12 populations, Table S4: Sequences of the sex-linked markers (220 SNPs), Figure S1: Histograms of STRUCTURE assignment test (K = 5, 6 and 7) for autosomal and sex-linked SNPs, Figure S2: Histograms of STRUCTURE assignment test (K = 8, 9 and 10) for autosomal and sex-linked SNPs.
Author Contributions
Conceptualization, M.O. and I.M.; methodology, M.O. and T.E.; software, F.S. and M.O.; formal analysis, M.O. and F.S.; resources, M.O. and Y.Y.; writing—original draft preparation, M.O.; writing—review and editing, I.M. and T.E.; funding acquisition, I.M. All authors have read and agreed to the published version of the manuscript.
Funding
This research was funded by a grant-in-aid for scientific research from the Ministry of Education, Culture, Sports, Science and Technology of Japan awarded to I.M. (No. 19K06788).
Institutional Review Board Statement
Animal care and experimental procedures were approved by the Committee for Ethics in Animal Experimentation at Hiroshima University (Permit Number: G18-2-2).
Informed Consent Statement
Not applicable.
Data Availability Statement
Mitochondrial cytochrome b sequences were deposited in the DDBJ Data Libraries (accession number LC671792-671810).
Acknowledgments
We express our sincere thanks to Shintaro Seki for taking and providing the photo of Glandirana rugosa used in the graphic abstract.
Conflicts of Interest
The authors declare no conflict of interest. The funders had no role in the design of the study; in the collection, analyses, or interpretation of data; in the writing of the manuscript, or in the decision to publish the results.
References
- Muller, H.J. A gene for the fourth chromosome of Drosophila. J. Exp. Zool. 1914, 17, 325–336. [Google Scholar] [CrossRef] [Green Version]
- Ohno, S. Sex Chromosomes and Sex-Linked Genes; Springer: Berlin/Heidelberg, Germany, 1967. [Google Scholar]
- Charlesworth, D.; Charlesworth, B.; Marais, G. Steps in the evolution of heteromorphic sex chromosomes. Heredity 2005, 95, 118–128. [Google Scholar] [CrossRef] [Green Version]
- Lahn, B.T.; Page, D.C. Four evolutionary strata on the human X chromosome. Science 1999, 286, 964–967. [Google Scholar] [CrossRef] [Green Version]
- Hughes, J.F.; Skaletsky, H.; Brown, L.G.; Pyntikova, T.; Graves, T.; Fulton, R.S.; Dugan, S.; Ding, Y.; Buhay, C.J.; Kremitzki, C.; et al. Strict evolutionary conservation followed rapid gene loss on human and rhesus Y chromosomes. Nature 2012, 483, 82–86. [Google Scholar] [CrossRef] [Green Version]
- Matthey, R. La formule chromosomique et le pro-blème de la détermination sexuelle chez Ellobius lutescens Thomas (Rodentia-Muri- dae-Microtinae). Arch Klaus-Stift VererbForsch 1953, 28, 65–73. (In French) [Google Scholar]
- Just, W.; Rau, W.; Vogel, W.; Akhverdian, M.; Fredga, K.; Graves, J.A.M.; Lyapunova, E. Absence of Sry in species of the vole Ellobius. Nat. Genet. 1995, 11, 117–118. [Google Scholar] [CrossRef] [PubMed]
- Honda, T.; Suzuki, H.; Itoh, M. An unusual sex chromosome constitution found in the ama- mi spinous country-rat, Tokudaia osimensis. Jap. J. Genet. 1977, 52, 247–249. [Google Scholar] [CrossRef] [Green Version]
- Soullier, S.; Hanni, C.; Catzeflis, F.; Berta, P.; Laudet, V. Male sex determination in the spiny rat Tokudaia osimensis (Rodentia: Muridae) is not Sry dependent. Mamm. Genome 1998, 9, 590–592. [Google Scholar] [CrossRef] [PubMed]
- Takagi, N.; Itoh, M.; Sasaki, M. Chromosome studies in four species of Ratitae (Aves). Chromosoma 1972, 36, 281–291. [Google Scholar] [CrossRef] [PubMed]
- Schmid, M.; Enderle, E.; Schindler, D.; Schempp, W. Chromosome banding and DNA replication patterns in bird karyotypes. Cytogenet. Cell Genet. 1989, 52, 139–146. [Google Scholar] [CrossRef] [PubMed]
- de Boer, L.E.M. Do the chromosomes of the kiwi provide evidence for a monophyletic origin of the ratites? Nature 1980, 287, 84–85. [Google Scholar] [CrossRef]
- Ansari, H.A.; Takagi, N.; Sasaki, M. Morphological differentiation of sex chromosomes in three species of ratite birds. Cytogenet. Cell Genet. 1988, 47, 185–188. [Google Scholar] [CrossRef]
- Nishida-Umehara, C.; Tsuda, Y.; Ishijima, J.; Ando, J.; Fujiwara, A.; Matsuda, Y.; Griffin, D. The molecular basis of chromosome orthologies and sex chromosomal differentiation in palaeognathous birds. Chromosome Res. 2007, 15, 721–734. [Google Scholar] [CrossRef]
- Charlesworth, D. The timing of genetic degeneration of sex chromosomes. Philos. Trans. R. Soc. Lond. B Biol. Sci. 2021, 376, 20200093. [Google Scholar] [CrossRef]
- Miura, I.; Ohtani, H.; Ogata, M. Independent degeneration of the W and Y sex chromosomes in frog Rana rugosa. Chromosome Res. 2012, 20, 47–55. [Google Scholar] [CrossRef] [Green Version]
- Miura, I. An evolutionary witness: The frog Rana rugosa underwent change of heterogametic sex from XY male to ZW female. Sex. Dev. 2007, 1, 323–331. [Google Scholar] [CrossRef]
- Miura, I. Sex Determination and Sex Chromosomes in Amphibia. Sex. Dev. 2017, 11, 298–306. [Google Scholar] [CrossRef]
- Ogata, M.; Suzuki, K.; Yuasa, Y.; Miura, I. Sex-chromosome evolution from a heteromorphic to a homomorphic system by inter-population hybridization in a frog. Philos. Trans. R. Soc. B 2021, 376, 20200105. [Google Scholar] [CrossRef]
- Ogata, M.; Lambert, M.; Ezaz, T.; Miura, I. Reconstruction of female heterogamety from admixture of XX-XY and ZZ-ZW sex chromosome systems within a frog species. Mol. Ecol. 2018, 27, 4078–4089. [Google Scholar] [CrossRef]
- Ogata, M.; Hasegawa, Y.; Ohtani, H.; Mineyama, M.; Miura, I. The ZZ/ZW sex-determining mechanism originated twice and independently during evolution of the frog, Rana Rugosa. Heredity 2008, 100, 92–99. [Google Scholar] [CrossRef] [PubMed]
- Tamura, K.; Stecher, G.; Peterson, D.; Filipski, A.; Kumar, S. MEGA6: Molecular Evolutionary Genetics Analysis version 6.0. Mol. Biol. Evol. 2013, 30, 2725–2729. [Google Scholar] [CrossRef] [PubMed] [Green Version]
- Tanabe, A. Kakusan and Aminosan: Two programs for comparing nonpartitioned, proportional, and separate models for combined molecular phylogenetic analyses of multilocus sequence data. Mol. Ecol. Res. 2011, 11, 914–921. [Google Scholar] [CrossRef] [PubMed]
- Jobb, G. TREEFINDER Version of March 2011. Munich, Germany. Available online: www.treefinder.de (accessed on 25 March 2014).
- Ronquist, F.; Teslenko, M.; van der Mark, P.; Ayres, D.L.; Darling, A.; Höhna, S.; Larget, B.; Liu, L.; Suchard, M.A.; Huelsenbeck, J.P. MrBayes 3.2: Efficient Bayesian phylogenetic inference and model choice across a large model space. Syst. Biol. 2011, 61, 539–542. [Google Scholar] [CrossRef] [PubMed] [Green Version]
- Rambaut, A.; Drummond, A. Tracer Ver. 1.5.0; University of Edinburgh: Edinburgh, UK, 2009; Available online: http://tree.bio.ed.ac.uk/software/tracer/ (accessed on 1 November 2018).
- Kilian, A.; Wenzl, P.; Huttner, E.; Carling, J.; Xia, L.; Blois, H.; Caig, V.; Heller-Uszynska, K.; Jaccoud, D.; Hopper, C. Diversity arrays technology: A generic genome profiling technology on open platforms. In Data Production and Analysis in Population Genomics; Methods in Molecular Biology 888; Humana Press: Totowa, NJ, USA, 2012; pp. 67–89. [Google Scholar]
- Prichard, J. Doculentation for Structure Software: Version 2.3. 2010. Available online: http://pritch.bsd.uchicago.edu/structure.html (accessed on 2 August 2015).
- Earl, D.A.; von Holdt, B.M. STRUCTURE HARVESTER: A website and program for visualizing STRUCTURE output and implementing the Evanno method. Conserv. Genet. Resour. 2012, 4, 359–361. [Google Scholar] [CrossRef]
- Gruber, B.; Unmack, P.J.; Berry, O.F.; Georges, A. dartR: An r package to facilitate analysis of SNP data generated from reduced representation genome sequencing. Mol. Ecol. Resour. 2018, 18, 691–699. [Google Scholar] [CrossRef]
- Felsenstein, J. PHYLIP-Phylogeny Inference Package (Version 3.2). Cladistics 1989, 5, 164–166. [Google Scholar]
- Ohtani, H.; Miura, I.; Ichikawa, Y. Role of aromatase and androgen receptor expression in gonadal sex differentiation of ZW/ZZ-type frogs, Rana rugosa. Comp. Biochem. Physiol. C-Tox. Pharm. 2003, 134, 215–225. [Google Scholar] [CrossRef]
- Uno, Y.; Nishida, C.; Oshima, Y.; Yokoyama, S.; Miura, I.; Matsuda, Y.; Nakamura, M. Comparative chromosome mapping of sex-linked genes and identification of sex chromosomal rearrangements in the Japanese wrinkled frog (Rana rugosa, Ranidae) with ZW and XY sex chromosome systems. Chromosome Res. 2008, 16, 637–647. [Google Scholar] [CrossRef]
- Miura, I.; Ezaz, T.; Ohtani, H.; Uno, Y.; Nishida, C.; Matsuda, Y.; Graves, J.A.M. The W chromosome evolution and sex-linked gene expression in the Japanese frog Rana rugosa. In Sex Chromosomes: Genetics, Abnormalities and Disorders; Nova Science Publishers Inc.: Weingarten, CN, USA; Jefferson, SE, USA, 2009; pp. 123–140. [Google Scholar]
- Machida, H.; Matsuda, T.; Umitsu, M.; Koizumi, T. Regional Geomorphology of the Japanese Islands; Geomorphology of Chubu region University of Tokyo Press: Tokyo, Japan, 2006; Volume 5, p. 385. [Google Scholar]
- Berlin, S.; Ellegren, H. Clonal inheritance of avian mitochondrial DNA. Nature 2001, 413, 37–38. [Google Scholar] [CrossRef]
- Smeds, L.; Warmuth, V.; Bolivar, P.; Uebbing, S.; Burri, R.; Suh, A.; Nater, A.; Bureš, S.; Garamszegi, L.Z.; Hogner, S.; et al. Evolutionary analysis of the female-specific avian W chromosome. Nat. Commun. 2015, 6, 7330. [Google Scholar] [CrossRef] [PubMed] [Green Version]
- Nishioka, M.; Hanada, H.; Miura, I.; Ryuzaki, M. Four Kinds of Sex Chromosomes in Rana rugosa. Sci. Rep. Lab. Amphib. Biol. Hiroshima Univ. 1994, 13, 1–34. [Google Scholar]
- Ohtani, H.; Miura, I.; Hanada, H.; Ichikawa, Y. Alteration of the sex determining system resulting from structural change of the sex chromosomes in the frog Rana rugosa. J. Exp. Zool. 2000, 286, 313–319. [Google Scholar] [CrossRef]
- Lawson, D.J.; van Dorp, L.; Falush, D. A tutorial on how not to over-interpret STRUCTURE and ADMIXTURE bar plots. Nat. Commun. 2018, 9, 3258. [Google Scholar] [CrossRef] [PubMed] [Green Version]
- Nishioka, M.; Kodama, Y.; Sumida, M.; Ryuzaki, M. Systematic evolution of 40 populations of Rana rugosa distributed in Japan elucidated by electrophoresis. Sci. Rep. Lab. Amphib. Biol. Hiroshima Univ. 1993, 12, 83–131. [Google Scholar]
- Nishioka, M.; Miura, I.; Saitoh, K. Sex chromosomes of Rana rugosa with special reference to local differences in sex determining mechanism. Sci. Rep. Lab. Amphib. Biol. Hiroshima Univ. 1993, 12, 55–81. [Google Scholar]
- Nishioka, M.; Hanada, H. Sex of reciprocal hybrids between the Hamakita (XX-XY type) population and the Murakami (ZW-ZZ type) population of Rana rugosa. Sci. Rep. Lab. Amphib. Biol. Hiroshima Univ. 1994, 13, 35–50. [Google Scholar]
- Hasegawa, Y.; Ueda, H.; Sumida, M. Clinal geographic variation in the advertisement call of the wrinkled frog, Rana rugosa. Herpetologica 1999, 55, 318–324. [Google Scholar]
- Takehana, Y.; Sakai, M.; Narita, T.; Sato, T.; Naruse, K.; Sakaizumi, M. Origin of boundary populations in medaka (Oryzias latipes species complex). Zool. Sci. 2016, 33, 125–131. [Google Scholar] [CrossRef]
- Pennell, M.W.; Mank, J.E.; Peichel, C.L. Transitions in sex determination and sex chromosomes across vertebrate species. Mol. Ecol. 2018, 27, 3950–3963. [Google Scholar] [CrossRef] [Green Version]
- Evans, B.J.; Alexander, P.R.; Wiens, J.J. Polyploidization and sex chromosome evolution in amphibians. In Polyploidy and Genome Evolution; Soltis, P.S., Soltis, E.E., Eds.; Springer: Berlin/Heidelberg, Germany, 2012; pp. 385–410. [Google Scholar] [CrossRef] [Green Version]
Figure 1.
Map showing locations of 26 populations in Glandirana rugosa used in this study. The populations of ZW group are divided into three sub-groups closed in colored circles. Dots with numbers indicate 26 populations used in this study and three cities (with names of Hirosaki, Toyama and Fukui, shown in the study of Miura et al. [16]). The major six geographic groups are shown at top left and magnification of the central Japan area is shown at bottom right.

Figure 2.
Bayesian tree based on 918 bp partial sequences of mitochondrial cytochrome b. Numbers at each node are bootstrap probability calculated by maximum likelihood method and Bayesian posterior probability by Bayesian method.
Figure 2.
Bayesian tree based on 918 bp partial sequences of mitochondrial cytochrome b. Numbers at each node are bootstrap probability calculated by maximum likelihood method and Bayesian posterior probability by Bayesian method.

Figure 3.
Neighbour-joining trees based on SNPs of autosomes, XY or ZW chromosomes, and ZZ chromosomes. Bootstrap probabilities are put on the major nodes. The coloured outlines of circles indicate two major mitochondrial haplogroups of ZW group (red) and XY group (blue). Abbreviations are the same as those of Figure 2.

Figure 4.
Histograms of STRUCTURE assignment test for autosomal 1626 SNPs and 220 sex-linked SNPs. K values (No. of clusters) are 2, 3 and 4. The populations used for the analysis and their locations are shown in Table 1 and Figure 1. The sex-linked SNPs of heterogametic XY males and ZW females were used for investigating genomic structures of ZW and XY chromosomes, while homogametic ZZ males were used for those of Z chromosomes. Arrows indicate introgressions of genomes from XY group to ZW group. Clusters of XY group and ZW1 sub-group are boxed in K = 3 map (autosomes).

Figure 5.
Assumed evolutionary process of geographic differentiation of the ZW and Neo-ZW groups and evolution of the W chromosomes in Glandirana rugosa (A–D). Arrows indicate four major emigrations of populations between XY and ZW groups and one emigration from ZW3a to ZW2. R1–R4 denote four times recycling of the W chromosomes from X chromosomes.

Figure 6.
Highlights of autosomal and sex-linked clusters selected from STRUCTURE histograms of the geographic groups and sub-groups (upper) and the assumed genomic structures of autosomes and sex chromosomes (lower). Abbreviations are shown in the box at bottom. Six kinds of Z chromosomes and five kinds of W chromosomes were identified. Population emigrations are indicated by dotted lines with 1, 2, 3-1 and 3-2. Four times reconstruction of the W chromosomes are denoted with R1–R4.


Table 1.
Sex-linked genotypes and mitochondrial haplogroups in 24 populations of ZW, Neo-ZW and XY groups and 2 populations of East-Japan and West-Japan groups.
Table 1.
Sex-linked genotypes and mitochondrial haplogroups in 24 populations of ZW, Neo-ZW and XY groups and 2 populations of East-Japan and West-Japan groups.
| Population Number | Population (City) | Prefecture | No. of Frogs Examined | Heterogametic Sex Based on SF1 Genotype | Microsatellite Allele of Sox3-UTR on W or X Chromosome | Expression of Androgen receptor Gene on W or X Chromosome | Cytochrome b Haplotype (Accession No.) | Cytochrome b Haplogroup | |
|---|---|---|---|---|---|---|---|---|---|
| Male | Female | ||||||||
| 1 | Towada | Aomori | 6 | 8 | Female | 230 | NE | L671792 | ZW1 |
| 2 | Toono | Iwate | 0 | 1 | Female | NE | − | L671793 | ZW1 |
| 3 $ | Yamagata | Yamagata | 7 | 3 | Female | 230 | NE | L671794 | ZW1 |
| 4 * | Niigata | Niigata | 0 | 1 | Female | NE | − * | L671795 | ZW1 |
| 5 | Inawashiro | Fukushima | 4 | 7 | Female | 230 | NE | L671793 | ZW1 |
| 6 | Oomachi | Nagano | 2 | 1 | Female | 230 | NE | L671792 | ZW1 |
| 7 $ | Kurobe | Toyama | 9 | 5 | Female | 223 | − | L671796 | ZW2 |
| 8 | Suzu | Ishikawa | 3 | 4 | Female | 275 | − | L671797 | ZW2 |
| 9 $ | Tomiki | Ishikawa | 1 | 3 | Female | 266/284 | NE | L671798 | ZW3a |
| 10 * | Kanazawa | Ishikawa | 0 | 1 | Female | NE | − * | L671799 | ZW3a |
| 11 $ | Yamanaka | Ishikawa | 1 | 2 | Female | 230 | − | L671800 | ZW3a |
| 12 $ | Awara | Fukui | 3 | 6 | Female | 248 | +3/−3 | L6717801 | ZW3a |
| 13 | Tsuruga | Fukui | 3 | 7 | Female | 240 | +6/−1 | L6717804 | ZW3b |
| 14 $ | Wakasa | Fukui | 2 | 8 | Female | 240 | + | L6717802 | ZW3b |
| 15 | Obama | Fukui | 3 | 7 | Female | 240 | +6/−1 | L6717803 | ZW3b |
| 16 | Kamikato | Fukui | 4 | 6 | Female | 240 | + | L6717804 | ZW3b |
| 17 | Maizuru | Kyoto | 1 | 4 | Female | 240 | +3/−1 | L6717808 | Neo-ZW1 |
| 18 * | Sanda | Hyogo | 0 | 1 | Female | 240 | NE | L6717809 | Neo-ZW1 |
| 19 *$ | Kashiwabara | Kyoto | 8 | 4 | Female | 240 | NE | NE (Neo-ZW1) | |
| 20*$ | Osaka | Osaka | 5 | 6 | Female | 240 | + | NE (Neo-ZW1) | |
| 21 *$ | Kinomoto | Shiga | 4 | 8 | Female | 222/232 | + | L6717805 | Neo-ZW2 |
| 22 *$ | Kyoto | Kyoto | 3 | 3 | Female | 248 | + | L6717807 | Neo-ZW2 |
| 23 *$ | Sekigahara | Gifu | 3 | 3 | Male | 222/232 | + | L6717805 | XY |
| 24 *$ | Kameyama | Mie | 5 | 10 | Male | 222/232/240/248 /250 | + | XY | |
| 25 | Isehara | Kanagawa | 0 | 1 | Homo # | NE | NE | L6717810 | East-J |
| 26 | Kamigoori | Hyogo | 0 | 1 | Homo # | NE | NE | L6717806 | West-J |
| Total | 79 | 116 | |||||||
NE, not examined, #, sex linked genes are homozygous in both sexes, *, heterogametic sex, microsatellite allele of Sox3-upstream region and expression of Ar gene on W chromosome or X chromosome are previously reported [20], $, used for DArT analysis, −, Ar is not expressed; +, expressed.
Publisher’s Note: MDPI stays neutral with regard to jurisdictional claims in published maps and institutional affiliations. |
© 2022 by the authors. Licensee MDPI, Basel, Switzerland. This article is an open access article distributed under the terms and conditions of the Creative Commons Attribution (CC BY) license (https://creativecommons.org/licenses/by/4.0/).
Share and Cite
MDPI and ACS Style
Ogata, M.; Shams, F.; Yoshimura, Y.; Ezaz, T.; Miura, I. W Chromosome Evolution by Repeated Recycling in the Frog Glandirana rugosa. DNA 2022, 2, 172-184. https://doi.org/10.3390/dna2030012
AMA Style
Ogata M, Shams F, Yoshimura Y, Ezaz T, Miura I. W Chromosome Evolution by Repeated Recycling in the Frog Glandirana rugosa. DNA. 2022; 2(3):172-184. https://doi.org/10.3390/dna2030012
Chicago/Turabian StyleOgata, Mitsuaki, Foyez Shams, Yuri Yoshimura, Tariq Ezaz, and Ikuo Miura. 2022. "W Chromosome Evolution by Repeated Recycling in the Frog Glandirana rugosa" DNA 2, no. 3: 172-184. https://doi.org/10.3390/dna2030012