1. Introduction
The bioeconomy comprises different sectors of the economy that produce, process, and re-use renewable biological resources. These sectors are typically agriculture, forestry, fishing, chemicals, food, bio-based materials, and bioenergy. Therefore, it is in our interest to analyze the possible impacts of sectoral policies at the national and regional levels, as well as cross-sectoral policies that address social challenges such as increasing food demand and climate change [
1]. The European Commission defines the scope of bioeconomy as encompassing all sectors and systems that rely on biological resources (animals, plants, micro-organisms, and derived biomass, including organic waste), their functions, and their principles. Interlinks are also included, such as land and marine ecosystems and the services they provide; all primary production sectors that use and produce biological resources, i.e., agriculture, forestry, fisheries, and aquaculture; and all economic and industrial sectors that use biological resources and processes to produce food, feed, bio-based products, energy, and services [
2].
A major barrier to analyzing the activities of the bioeconomy is the lack of available data. More specifically, in the framework of the standard National Accounts, bioeconomy sectors are represented as broad sectoral aggregates (i.e., agriculture, food processing, forestry, fisheries, wood, and pulp) or even subsumed within their parent sectors (for example, chemical industries, clothing, energy). Furthermore, while the coverage of secondary data on traditional bioeconomy activities is ‘relatively’ accessible, data inventories of more contemporary biomass sources and bio-based activities are scarce, which severely hampers our ability to estimate the economic importance of these evolving sectors within national economies [
3].
While bio-based products and materials are on the rise, it is still difficult to quantify and monitor the development of the bioeconomy. This is because bio-based materials and products are increasingly used to substitute petrochemicals, but are not separately captured by statistical classifications. Using coefficients to determine the bio-based shares per product category is the best method currently available to measure the size of the bioeconomy, but it is not sufficiently accurate to reliably capture small developments [
4].
Numerous attempts have been made to measure the size of the bioeconomy. The most widely used indicators to monitor the impact of national bioeconomy strategies and to measure the size of bioeconomy include the gross output (turnover), value added, investments, exports of bioeconomy goods, and employment [
5]. Cingiz et.al. [
6] analyzed the value added of the bioeconomy in 28 EU member states using an input–output (IO) model. The IO model is suitable for tracking biomass inputs, for determining the contribution of different industries to the bioeconomy, and, consequently, for assessing the bioeconomy’s contribution to the total economy. Lazorcakova et.al. [
7] used IO analysis to quantify economic as well as environmental indicators for the purpose of measuring the bioeconomy. These studies involve a high aggregation level of commodities and sectors that do not display physical volumes of specific bio-based commodities.
The Joint Research Centre (JRC) of the European Commission (EC) developed the biomass flow diagram that describes the flow of biomass across sectors of the economy [
8]. In this case, the physical flows were directly estimated without conversion from monetary data at a higher level of sectorial aggregation. Meanwhile, the Material Flow Monitor (MFM) was developed by Statistics Netherlands [
9], and describes the physical material flows of the Dutch economy, measured in millions of kilograms. Physical flows also include imports and exports of goods. The MFM originates from the monetary supply and use tables published in the National Accounts, and is converted into physical flows of materials. The level of disaggregation achieved with these material flows makes it possible to estimate the size of the bioeconomy, in physical terms, relative to the entire Dutch economy. Currently, this tool is only available for the Netherlands.
The aim of this paper is to develop a bio-based material flow monitor (BFM) to measure the physical contributions of different sectors to the bioeconomy of Latvia. It is structured as follows.
Section 2 describes the bioeconomy in the EU and Latvia.
Section 3 presents the method and data.
Section 4 presents and discusses the results obtained using the method.
Section 5 concludes the paper and provides a general discussion and limitations.
2. Measuring Bioeconomy in EU and Latvia
The bioeconomy is an important part of the EU economy. In 2018, the total number of employed persons in the EU bioeconomy amounted to 18.4 million, with a declining trend which was mainly due to the decrease in employment in the agricultural sector, caused by consolidation across the agricultural sector [
10] and increasing efficiency through optimization, automation, and digitalization of the sector [
11,
12]. The data for EU-28 show a continuous increase in turnover in the bioeconomy from less than EUR 2 trillion in 2008 to more than EUR 2.43 trillion in 2018, with the food sector being the largest contributor [
13]. The focus on the potential of the bioeconomy highlighted in the EU policy narratives (e.g., EU Bioeconomy strategy and Green Deal) makes it essential to monitor the bioeconomy and to understand its driving forces.
For Latvia, bio-based sectors are an essential part of the national economy. In 2018, the Ministry of Agriculture of Latvia defined the Latvian Bioeconomy Strategy for 2030 [
14], with an aim to become the EU leader in the preservation, growth, and sustainable use of natural capital. The Strategy also recognizes the necessity of raising awareness of the significance of the bioeconomy in Latvia and of determining the potential directions for development up to 2030. Thus, it also indicates the need for a comprehensive data collection and analysis of the bioeconomy that would enable researchers to monitor the bioeconomy sectors more thoroughly.
According to the Strategy, the bioeconomy includes agriculture, forestry, fisheries, aquaculture, production of food, cellulose, and paper, as well as, in part, the chemical, biotechnology, and energy sectors. This definition excludes other industries that use bio-based inputs in production. The objectives of this strategy are to maintain or increase exports and value provided by traditional bioeconomy sectors, namely agriculture (A01); forestry (A02); fisheries (A03); processing of food, beverages, and tobacco (C10, C11, C12); manufacturing of leather and related products (C15); manufacturing of wood, straw, plaiting materials, and paper products (C16, C17); and manufacturing of furniture (C31). Using the structure of the bioeconomy defined in the Strategy is the only approach to measure the size of the bioeconomy of Latvia. Furthermore, it is expressed in monetary values, and volatility of price can create biased increases in these values. Therefore, it would be advisable, rather, to use physical volumes, as they would provide an unbiased outlook on the size of the bioeconomy.
In
Table 1, the main indicators of the bioeconomy are shown for EU-27 and Latvia.
Table 1 shows that the size of the bioeconomy is growing, both in EU and in Latvia. Gross value added (GVA) and turnover per employed person are higher in the EU than in Latvia, while the bio-based share of the bioeconomy is above 80% in Latvia and above 60% in the EU.
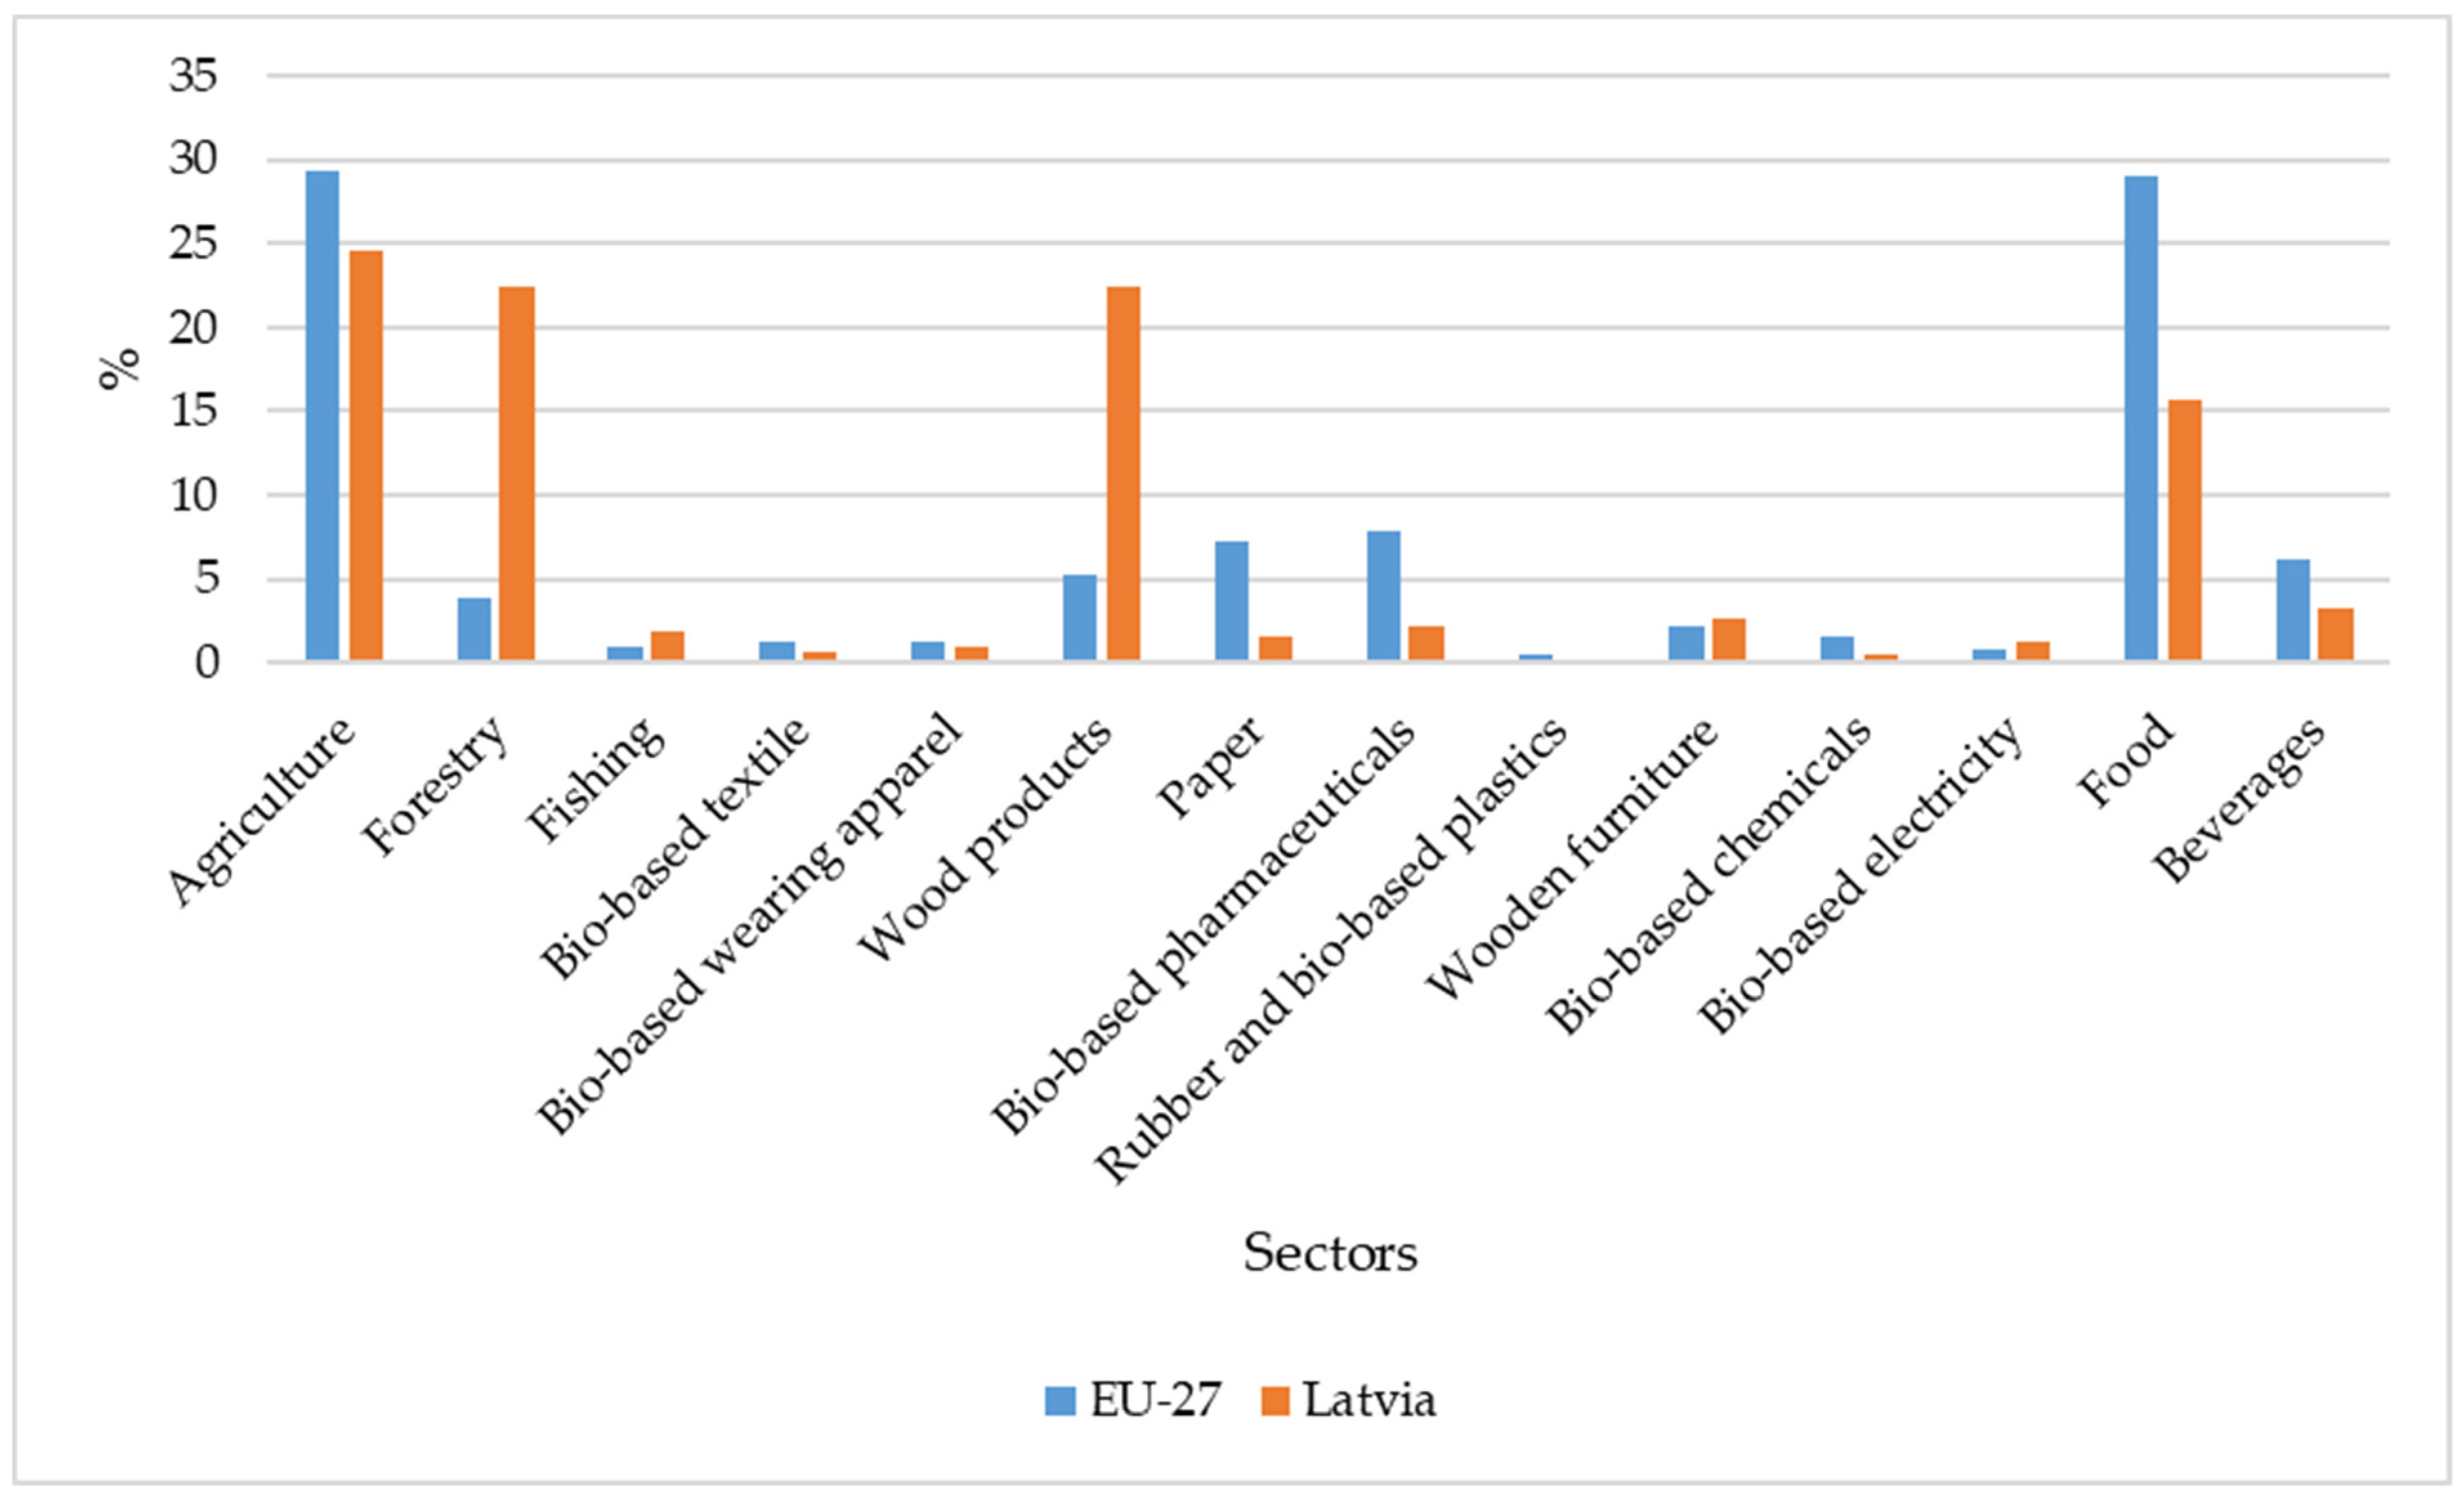
In both the EU and Latvia, the largest share of value added is created by traditional bioeconomy sectors such as agriculture and food production, but other sectors also contribute (
Figure 1). In Latvia, a large share of the bioeconomy (48.7%) is taken up by forestry and production of wood products and furniture. This share is considerably higher than the EU average in these sectors. It is also noticeable that more advanced sectors with a higher value added (e.g., bio-based pharmaceuticals and bio-based chemicals) are not as prominent in the bioeconomic structure of Latvia compared to the EU average. These tendencies indicate a lower value added for the produced goods within the national bioeconomy, and are also visible in the data regarding the GVA and turnover per employed person, as is reflected in
Table 1.
3. Materials and Methods
3.1. Data
According to the definition of the European Commission [
2], the bioeconomy encompasses not only the primary sectors that employ and produce biological resources, but also the activities that depend on biological resources to generate value added products (i.e., food, feed, materials, and energy).
Crucial data need to be gathered regarding the methodology of compiling the bio-based material flow monitor (BFM) to measure the significance of the bioeconomy. Detailed monetary supply and use tables (MSUT), as well as unit values, are the basic data required. There are several options for dealing with unavailable MSUT. The first option is to take the 64 commodities, according to the SUT of 64 sectors, that every national statistics institution reports to Eurostat. An advantage of this is the availability of data, because the data are published annually by Eurostat, while a disadvantage is that the aggregated table gives very rough estimates when converting to physical units. The reason for this is that the commodities and sectors are very heterogeneous, even within a single group. Therefore, it is difficult to find a unit value that represents a group. The 64-by-64 tables can further be disaggregated by using the PRODCOM dataset. An advantage of this is that it is a detailed dataset, but disaggregation of only the supply side is possible, as there are no data for the use table. PRODCOM dataset has limited (confidential) data in the publicly available statistical files, especially for a small-sized country like Latvia. Therefore, PRODCOM dataset was not used in this research. The Exiobase dataset is another option for obtaining detailed supply and use tables of a country. However, the Exiobase has not been updated for a long time and is, therefore, not up-to-date.
Another option is to use a BioSAM (Social Accounting Matrix) developed by EC JRC [
16]. The advantage is that it is publicly available, while the disadvantage is that the use and supply should be separated, and there is no direct link with the monetary data of the National Accounts [
9]. For each of the EU member states, and for the EU aggregate, a set of highly disaggregated bio-based sector account splits within the framework of BioSAM were constructed for the first time for the year 2010. Since then, BioSAM has been constructed every five years, with the latest version developed in 2015. The systematic method of estimation is used based on the reconciliation of four main databases, namely, (i) the complete and consistent (CoCo) database from the Common Agricultural Policy Regionalized Impacts (CAPRI) model, using re-estimated AgroSAMs (
Table A1); (ii) the National Accounts; (iii) the Economic Accounts for Agriculture (EAA) from Eurostat; and, finally, (iv) the database of the computable general equilibrium model (MAGNET) [
1].
In addition, diverse types of data sources were used to compile unit values (prices) for domestically produced commodities. First, sectoral data from the national statistics [
17], and second, data on international trade [
18], were used to develop unit values for domestically produced and used commodities. Unit values of international trade statistics are a quantity-weighted average of the different prices at which the product is purchased/imported or sold/exported. Unit values of imported goods are given in the use table, and unit values of exported goods are given in the supply table.
Data on CO
2 emissions [
19] and waste generation [
20] and treatment [
21] were included from Eurostat. Due to biannual data reports, waste management data were taken from 2016.
To calculate bio-based shares of the supplied/used commodities, a variety of data sources, e.g., nova-Institute, Statistics Netherlands, Classification of Products by Activity (CPA), and 4-digit aggregation of commodities (where available) were used based on international trade data and unpublished researchers’ opinions (
Table A3).
3.2. Methods
This article reflects an attempt to apply the approach developed by Statistics Netherlands (SN) to the datasets available for Latvia, intending to become one of the pilot countries to test the validity of this approach. For this analysis, BioSAM data from 2015 were used. To the best of our knowledge, for the EU and its member states, including for Latvia, this dataset is the most complete multisector database that exists with detailed coverage on the bioeconomy sectors and their links with other activities and institutional sectors.
The approach of SN was combined with the BioSAM dataset and price information from different sources to measure the bio-based material flow in Latvia. SN instead used the SUT and price information with a high disaggregation level which they collected for the Netherlands.
After separating the supply and use of BioSAM, a structure was obtained for commodities, services, and sectors, and is reflected in
Table 2 and
Table 3.
Initially, BioSAM contained 171 accounts for 2015, including 80 activity/commodity accounts (see
Table A2). According to the available data for Latvia, there were 63 commodities and 69 activities/sectors and households. In the supply table, an additional column for other activities (
Table A4) was added into which allocate supplied volumes which were not mentioned elsewhere in BioSAM accounts. In addition, the BioSAM contained one account for the rest of the world (exports/imports).
As a next step, unit values were used to calculate physical supply and use tables (PSUT) using monetary supply and use tables (MSUT) as a basis. The unit value of a commodity is assessed in EUR per kilogram (kg). For this reason, services are excluded from the PSUT for Latvia.
To calculate physical (
p) supply (
S) of a commodity (
i) by sector (
j) in millions of kg, the unit price (
p) of the commodity was applied to the monetary (
m) supply of the commodity supplied by the sector, in increments of EUR 1 million.
For the calculation of the use (
U) in millions of kg, the same approach was used.
The PSUT can be enhanced by adding additional information (rows and columns). Conversion from MSUT to PSUT has not yet provided a complete overview of all the material flows. Material flows may exist where there is no monetary component in the MSUT, such as CO2 emissions or waste. These flows are include in the MFM and are used for balancing the sectors.
Some production processes use resources that are extracted from the environment. For example, trees for the timber industry or grain harvests in agriculture are also considered extraction. Data on extraction were taken from Material Flow Accounts (MFA). The MFA covers the extraction of crops, livestock crops, wood, fish, salt, limestone, clay, sand, gravel, natural gas, and crude oil.
Due to differences in sources and in the quality of the data, it was possible that supply would not equal use, even with balancing items (BI) such as emissions and waste. Therefore, the last step to complete the MFM was to balance the supply and use of goods and the input and output of sectors. Supply was expected to equal use for each product group (rows), because logically, all materials supplied in the economy must be used. Likewise, for each sector (columns), the amount of materials used was also supplied in one form or another. The result of this methodology was a complete and balanced physical supply and use table (see
Table 4 and
Table 5).
After balancing the tables, the bio-based shares (
Table A3) were applied to commodities to obtain physical bio-based material flow monitor data (BFM). Using the waste generation dataset, part of the waste was indicated as bio-based (paper and cardboard wastes; wood wastes; textile wastes; animal and mixed food waste; and animal feces, urine, and manure). The shares of these waste categories were used to calculate bio-based waste. Calculating the share of bio-based energy carriers (biodiesel, biochemicals, and biogas) provides the option to calculate bio-based CO
2 emissions. The coefficients were fixed in this study, but they may vary by sector in practice.
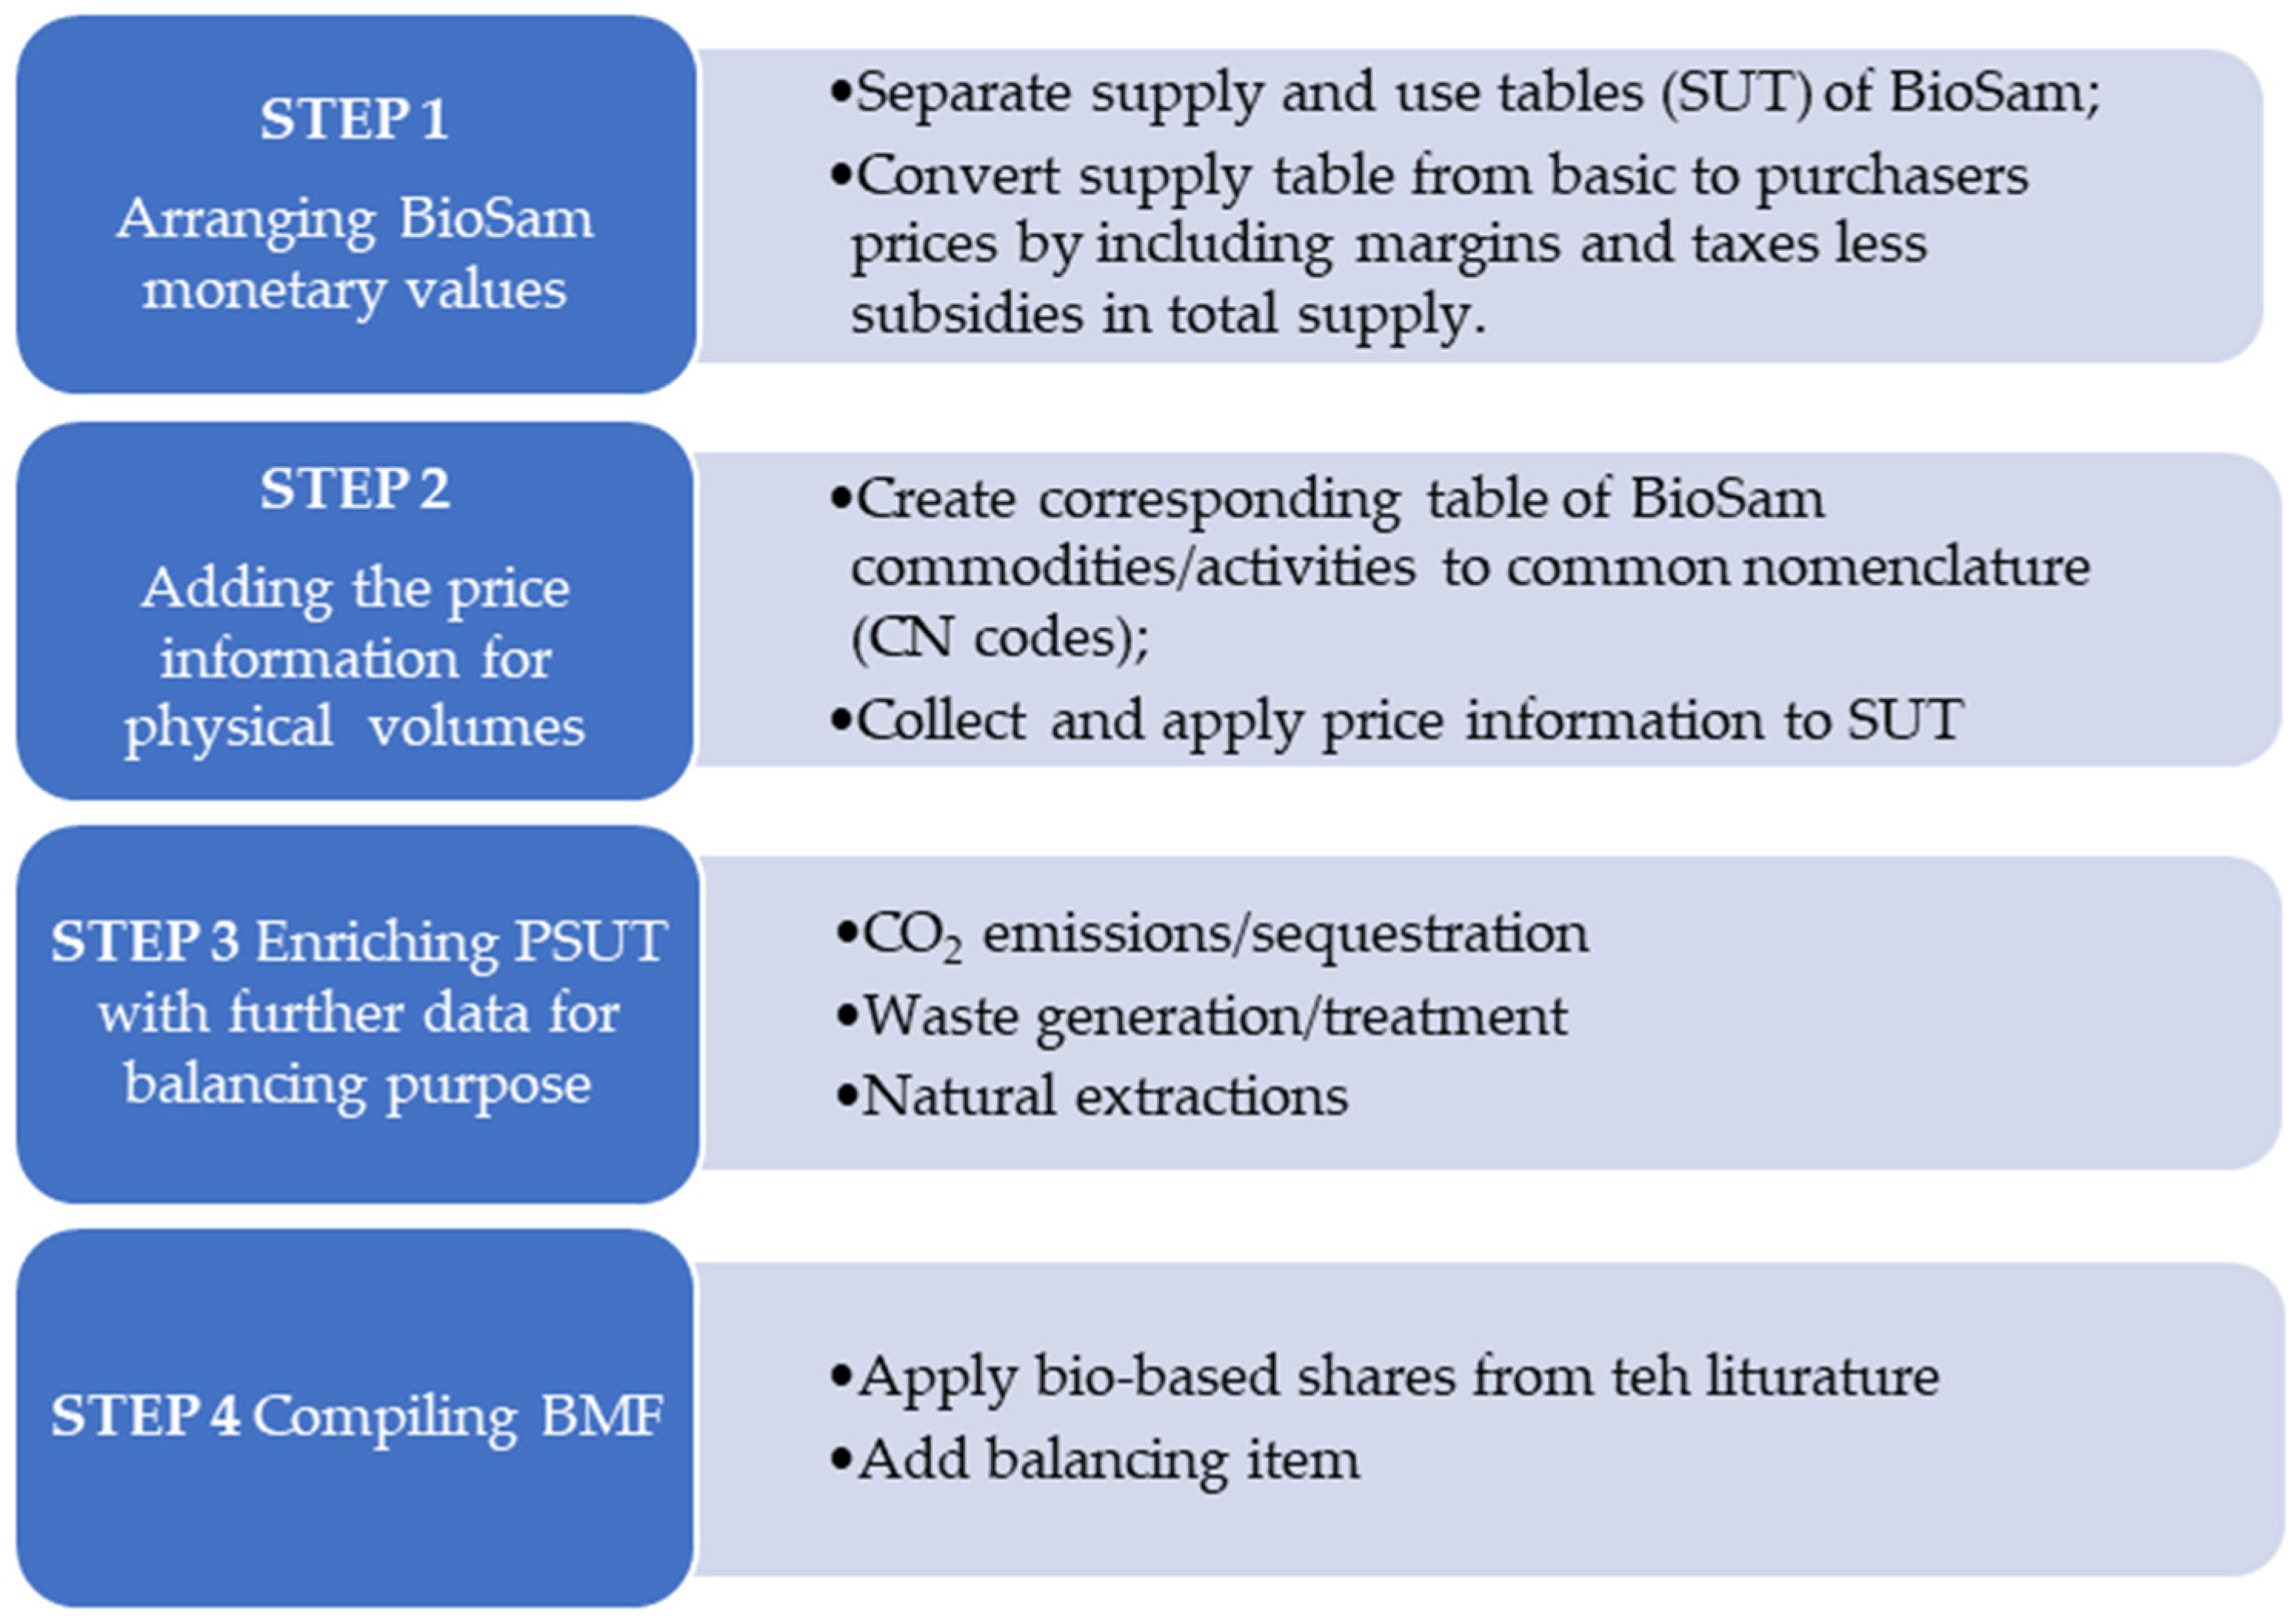
Figure 2 presents a summary of the method applied in this research.
4. Results and Discussion
The application of the methodology previously described for the data on the Latvian bioeconomy enabled us to review the contribution of bio-based material flows to the bioeconomy and to distinguish the bio-based and non-bio-based material flows within the sectors.
There are sectors such as construction, administration, education, and manufacturing that are not considered in Knowledge Center data nor in the Latvian Bioeconomy Strategy, but these sectors are included in the BSUT of BioSAM.
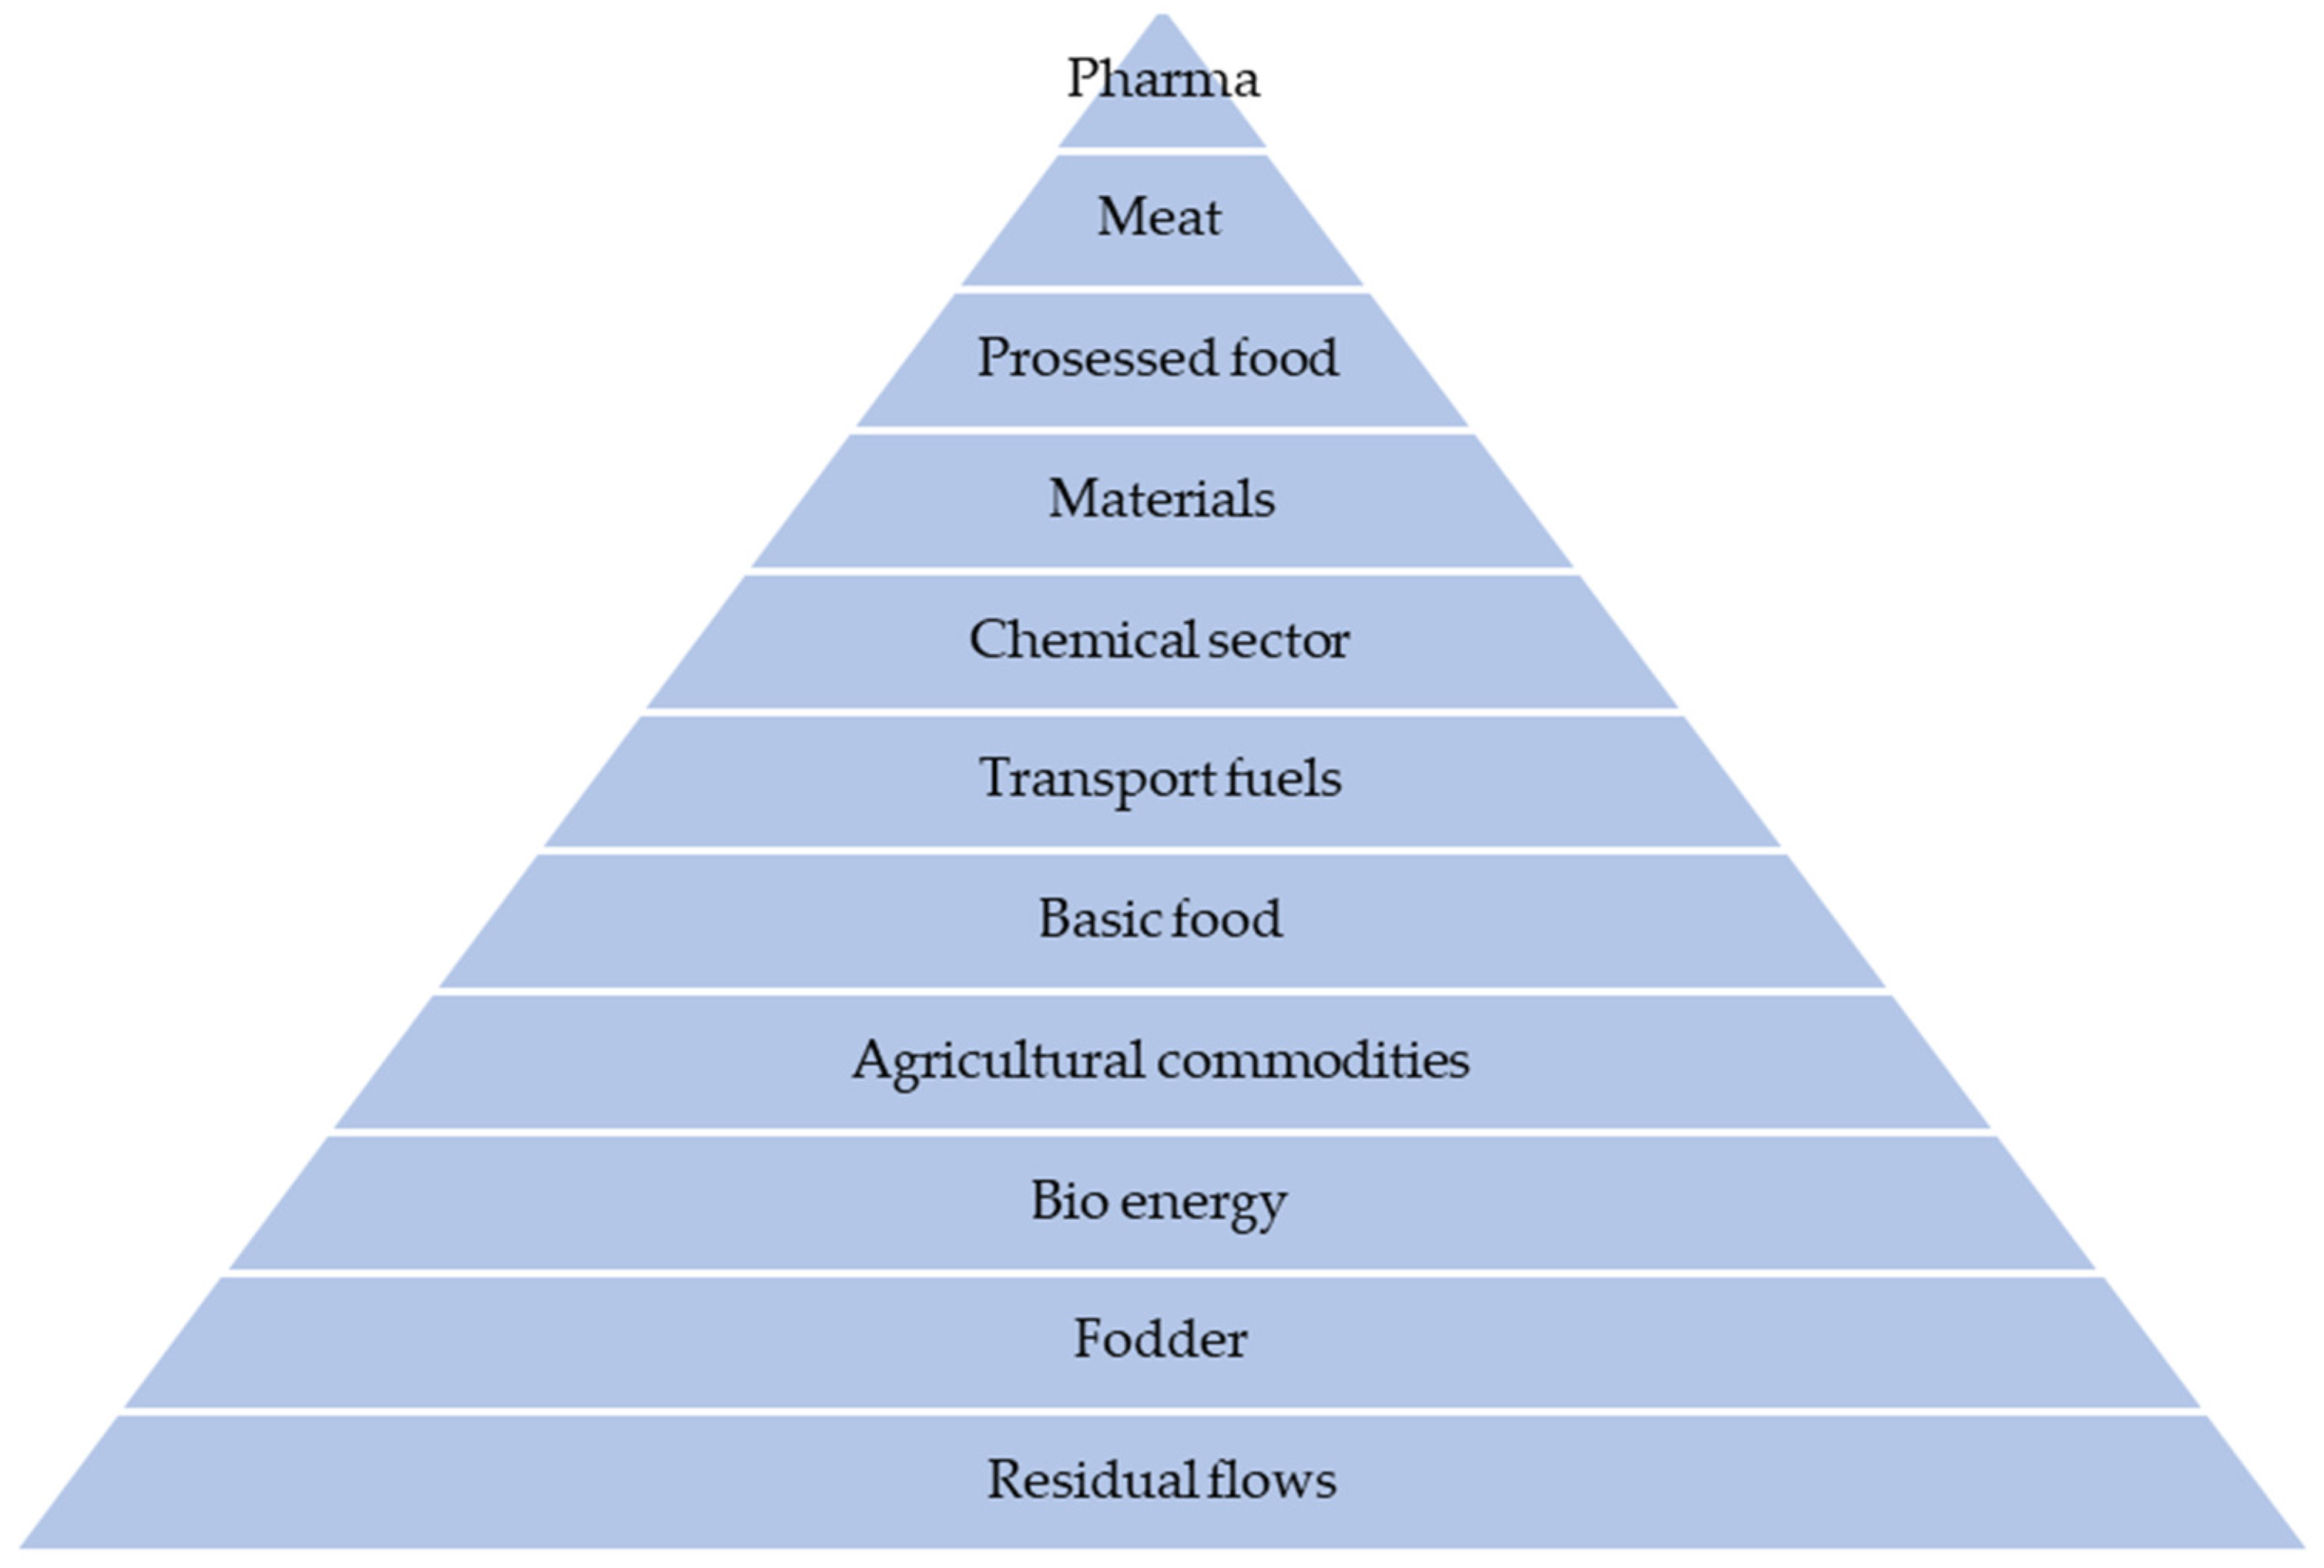
Few assumptions have been made to estimate the results. First, from a commodity perspective, a value pyramid based on the financial value of biomass applications developed by Bos et al. [
22] (
Figure 3) was used. Each commodity is allocated to a category irrespective of which sector uses the commodity, and all waste is allocated to residual flows without considering if it is used for energy generation, fodder, or materials.
The layer at the bottom of the pyramid represents large volumes of relatively low-value biomass. Higher in the pyramid, biomass that has been transformed into other products is represented; these types typically have smaller volumes, but higher values.
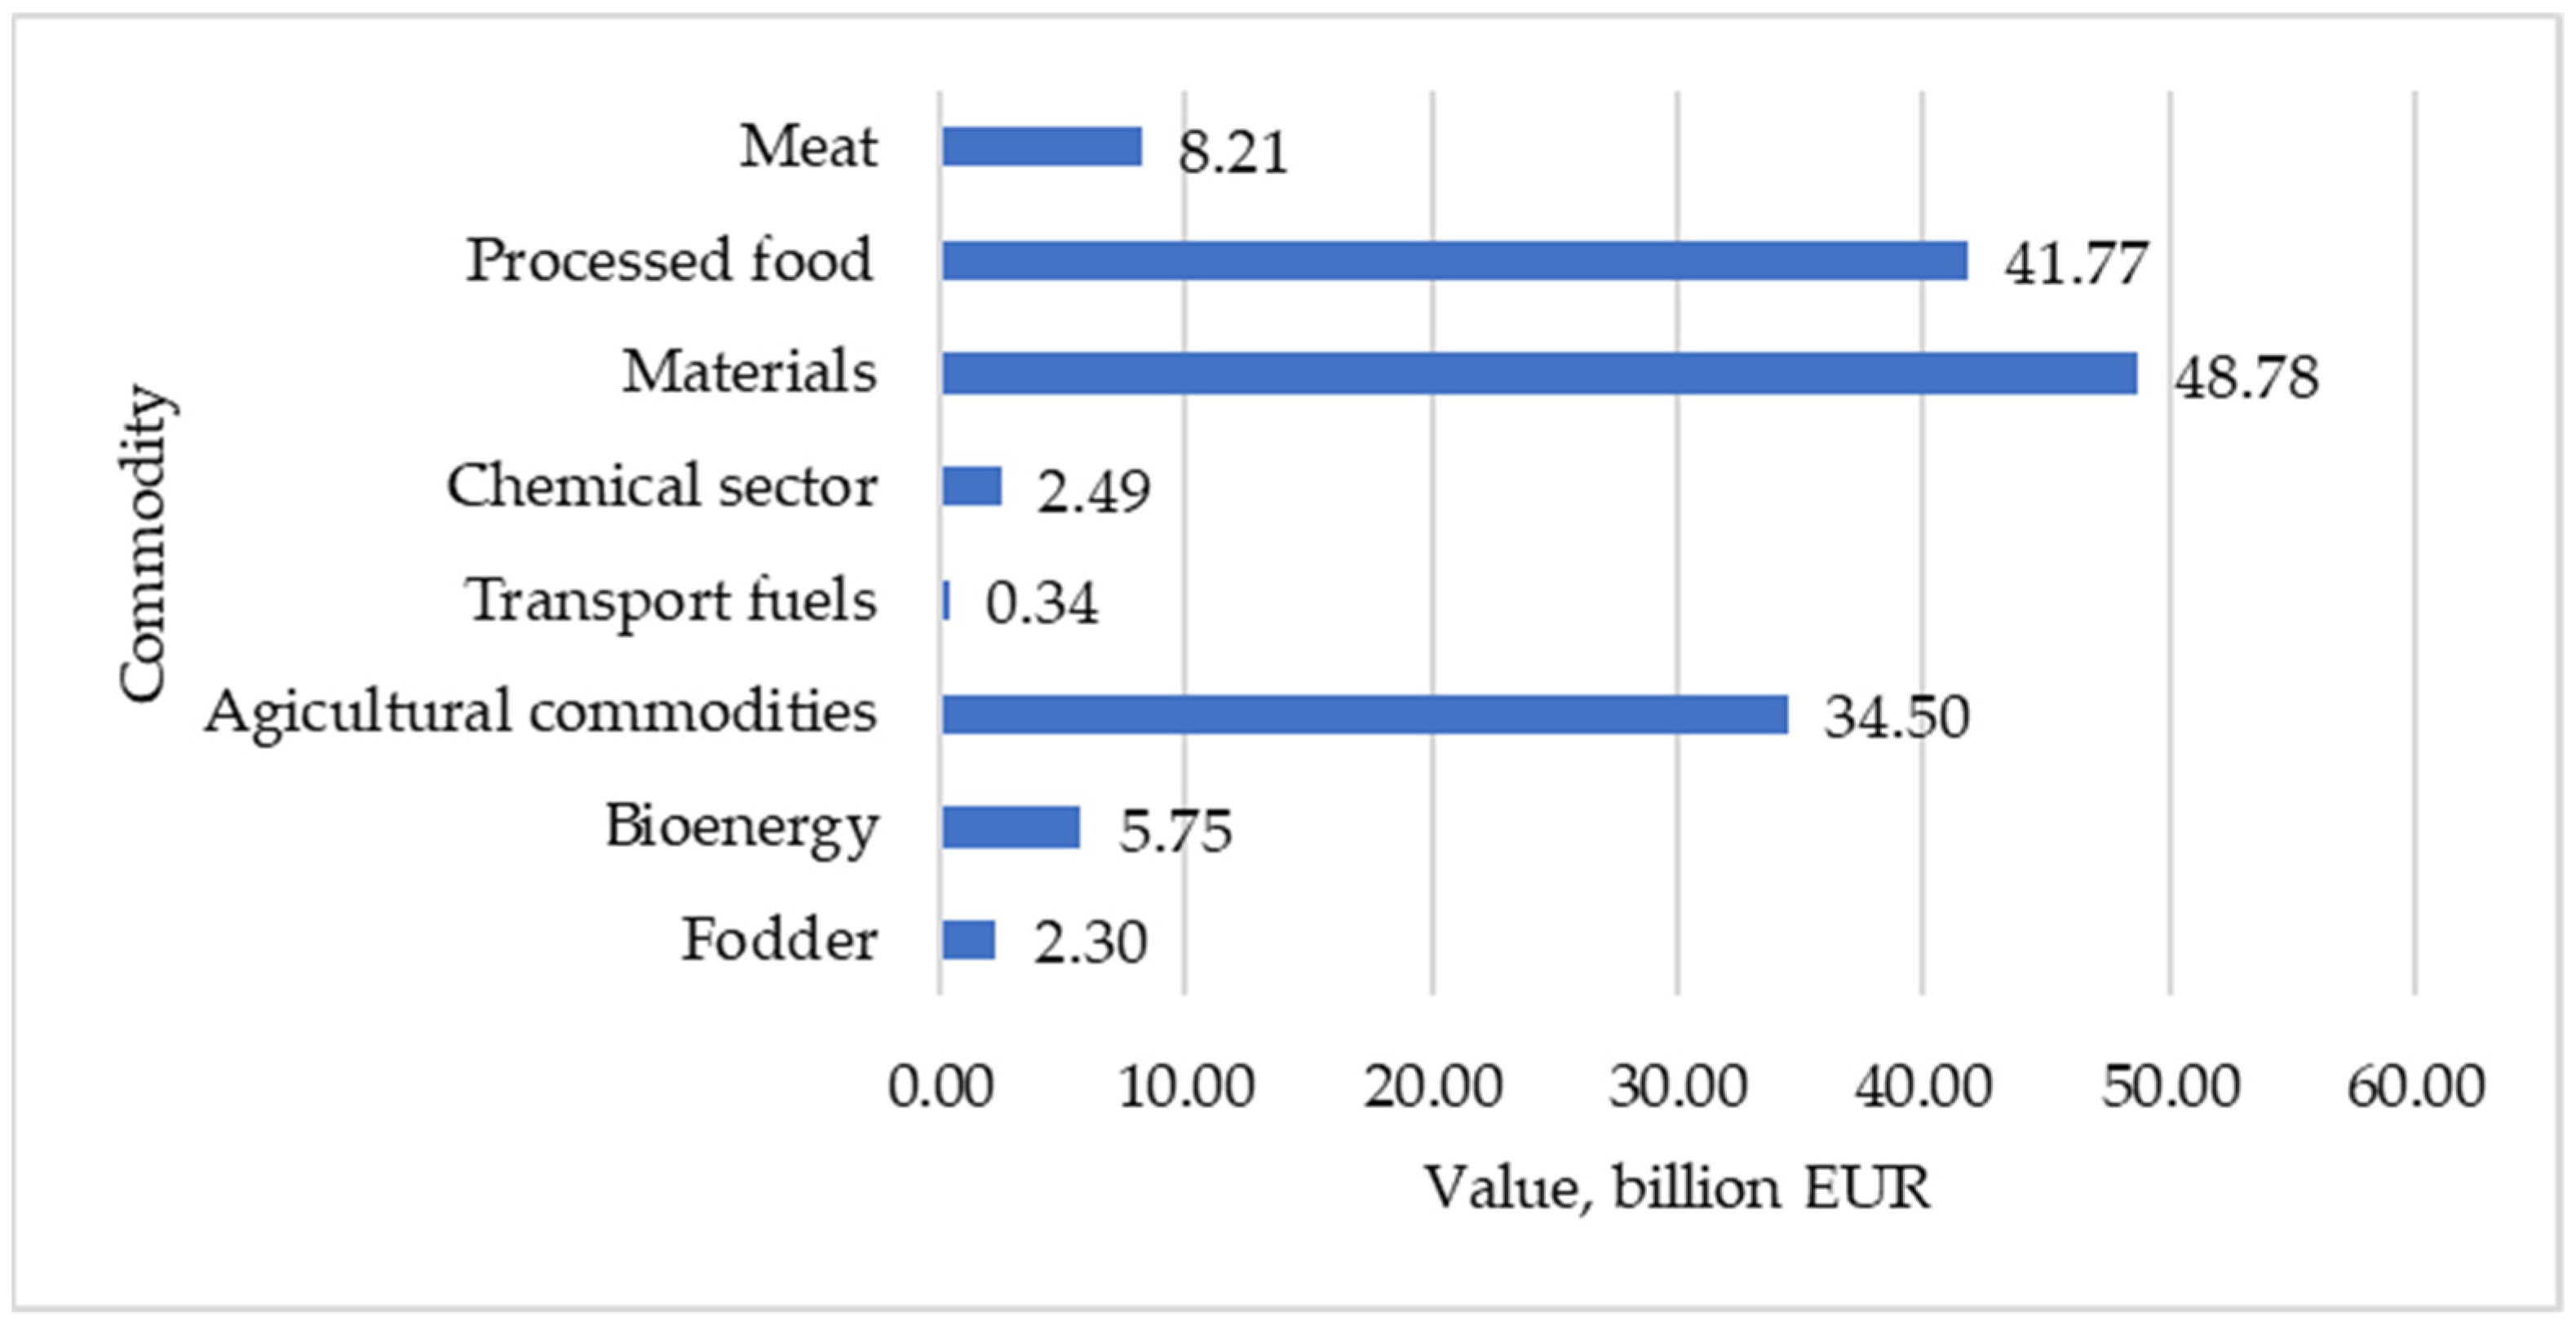
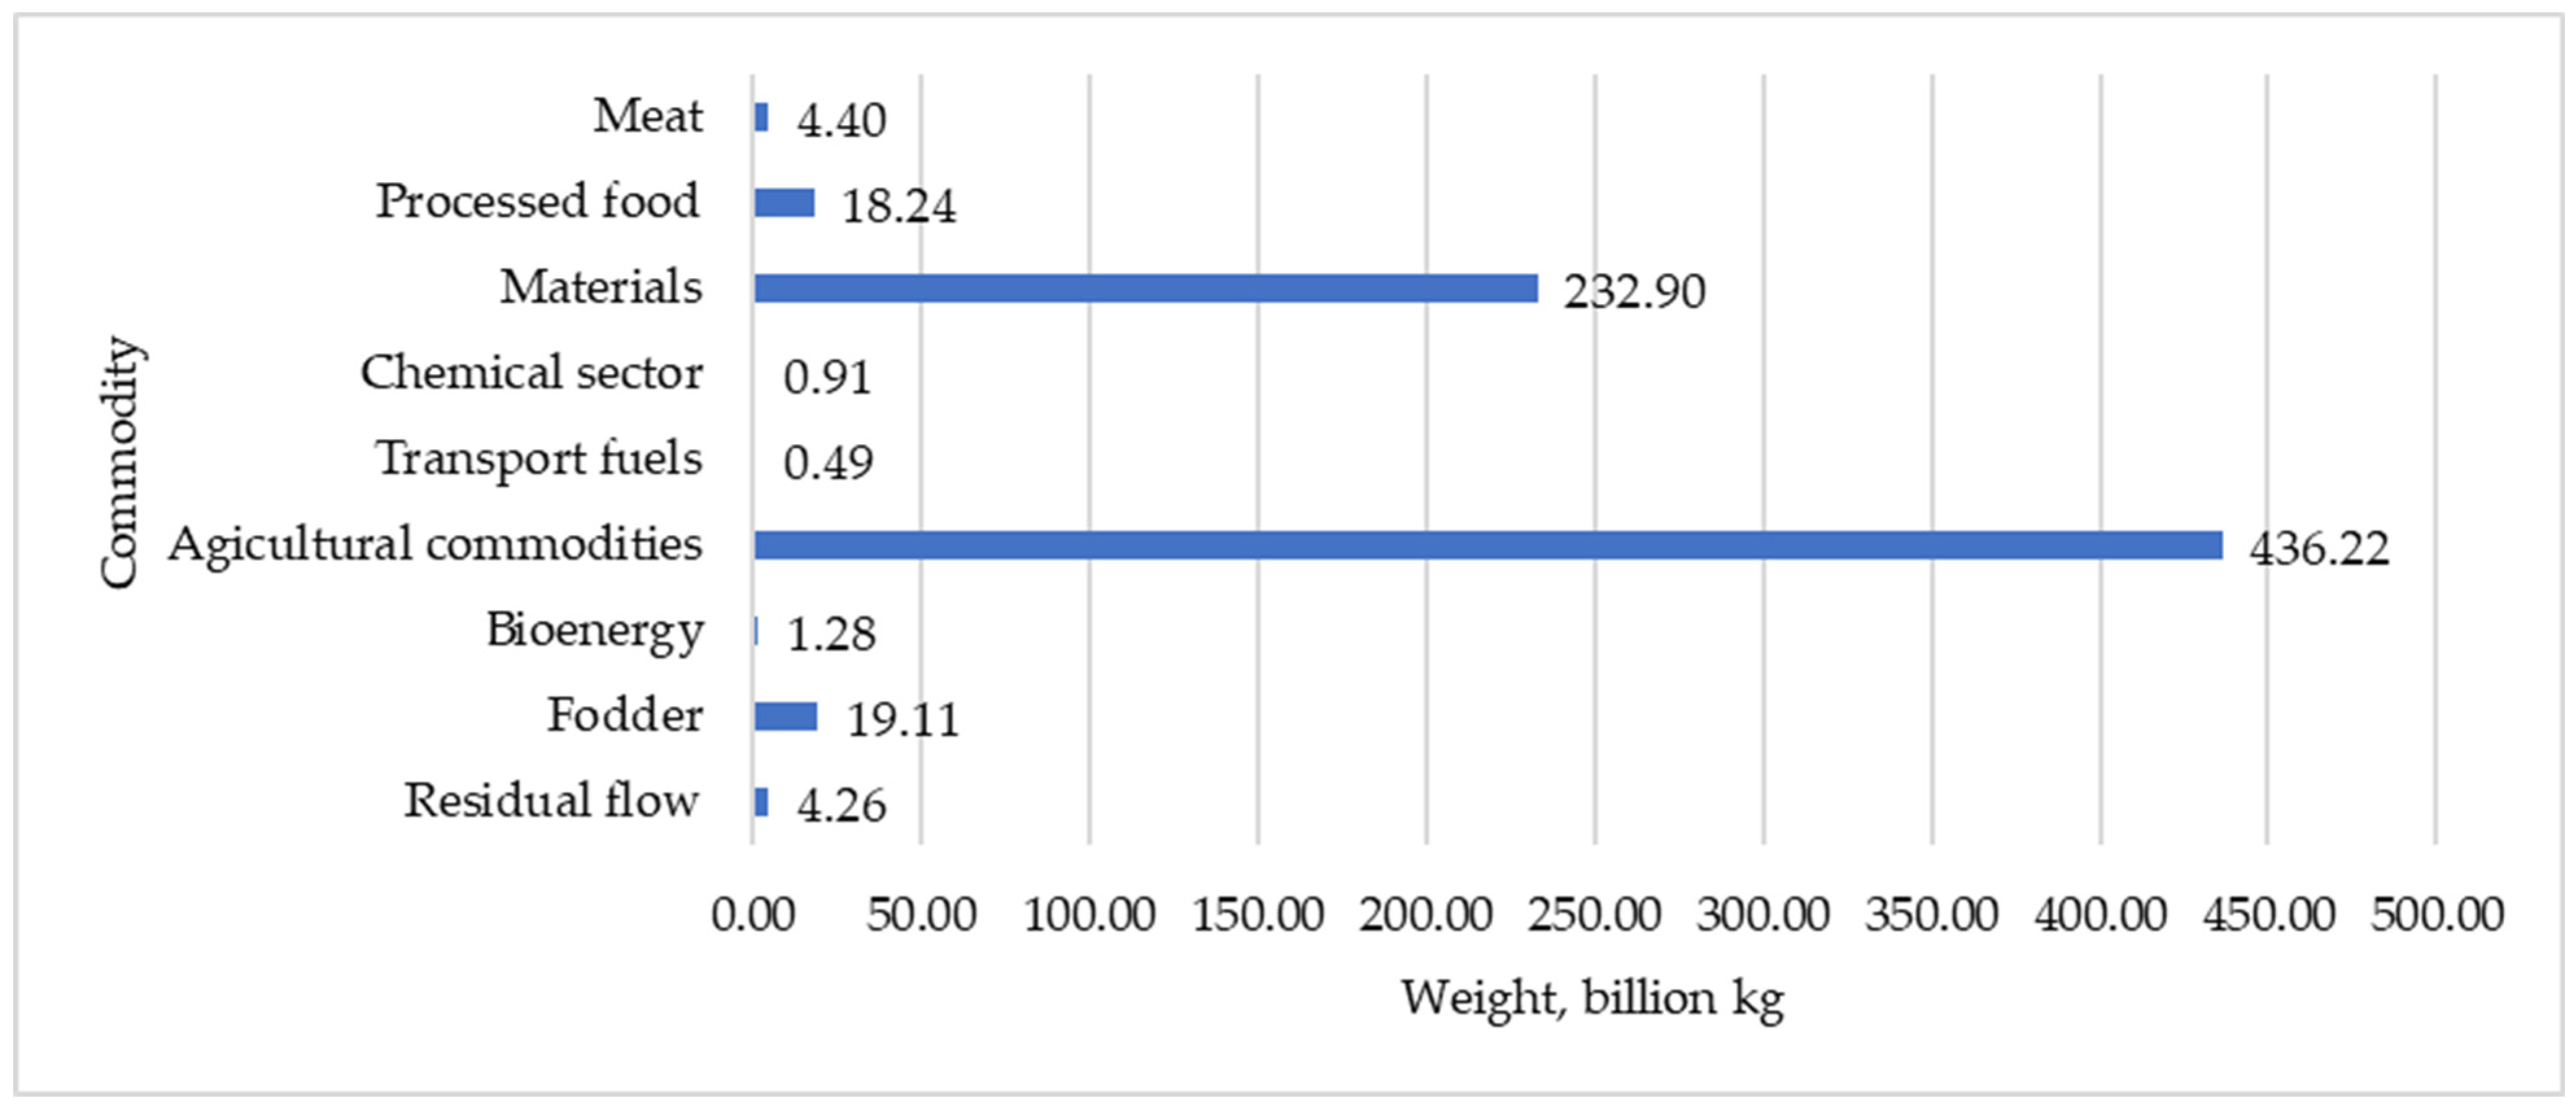
When commodities are cascaded in Latvia, according to the value hierarchy developed by Bos et al. [
22] (
Figure 4), it can be observed that materials form the share with the largest value (EUR 48.78 billion), followed by processed food (EUR 41.77 billion) and agricultural commodities (EUR 34.50 billion). The lowest value is formed by the production of transport fuels (EUR 0.34 billion).
Agriculture commodities form by far the largest share of volume (436.22 billion kg). These commodities are mainly used by the agriculture sector itself (40%) and the food processing sector (20%). More advanced materials, such as transport fuels and chemistry-related bio-based commodities, form the smallest share (0.49 and 0.91 billion kg, respectively). In general, most biomass is contained in the bottom half of the pyramid. Nevertheless, the category “Materials”, in the top half of the pyramid, forms a relatively large share as well. As the wood processing sector is prevalent in the bioeconomy of Latvia, commodities in this category, namely, paper, wood products, and textiles, highlight the specialization of the bioeconomy sector of Latvia in wood processing.
The cascade of biomass in Latvia includes all types of commodities for which biomass is used, except pharmaceuticals and basic food, which are not included due to the aggregation level of the BioSAM data. It can be observed that agriculture commodities comprise the largest share in the cascade of biomass, followed by materials, which is not in accordance with the value pyramid by Bos et al. [
22]; however, it is expected for Latvia due to the high availability and use of forest biomass.
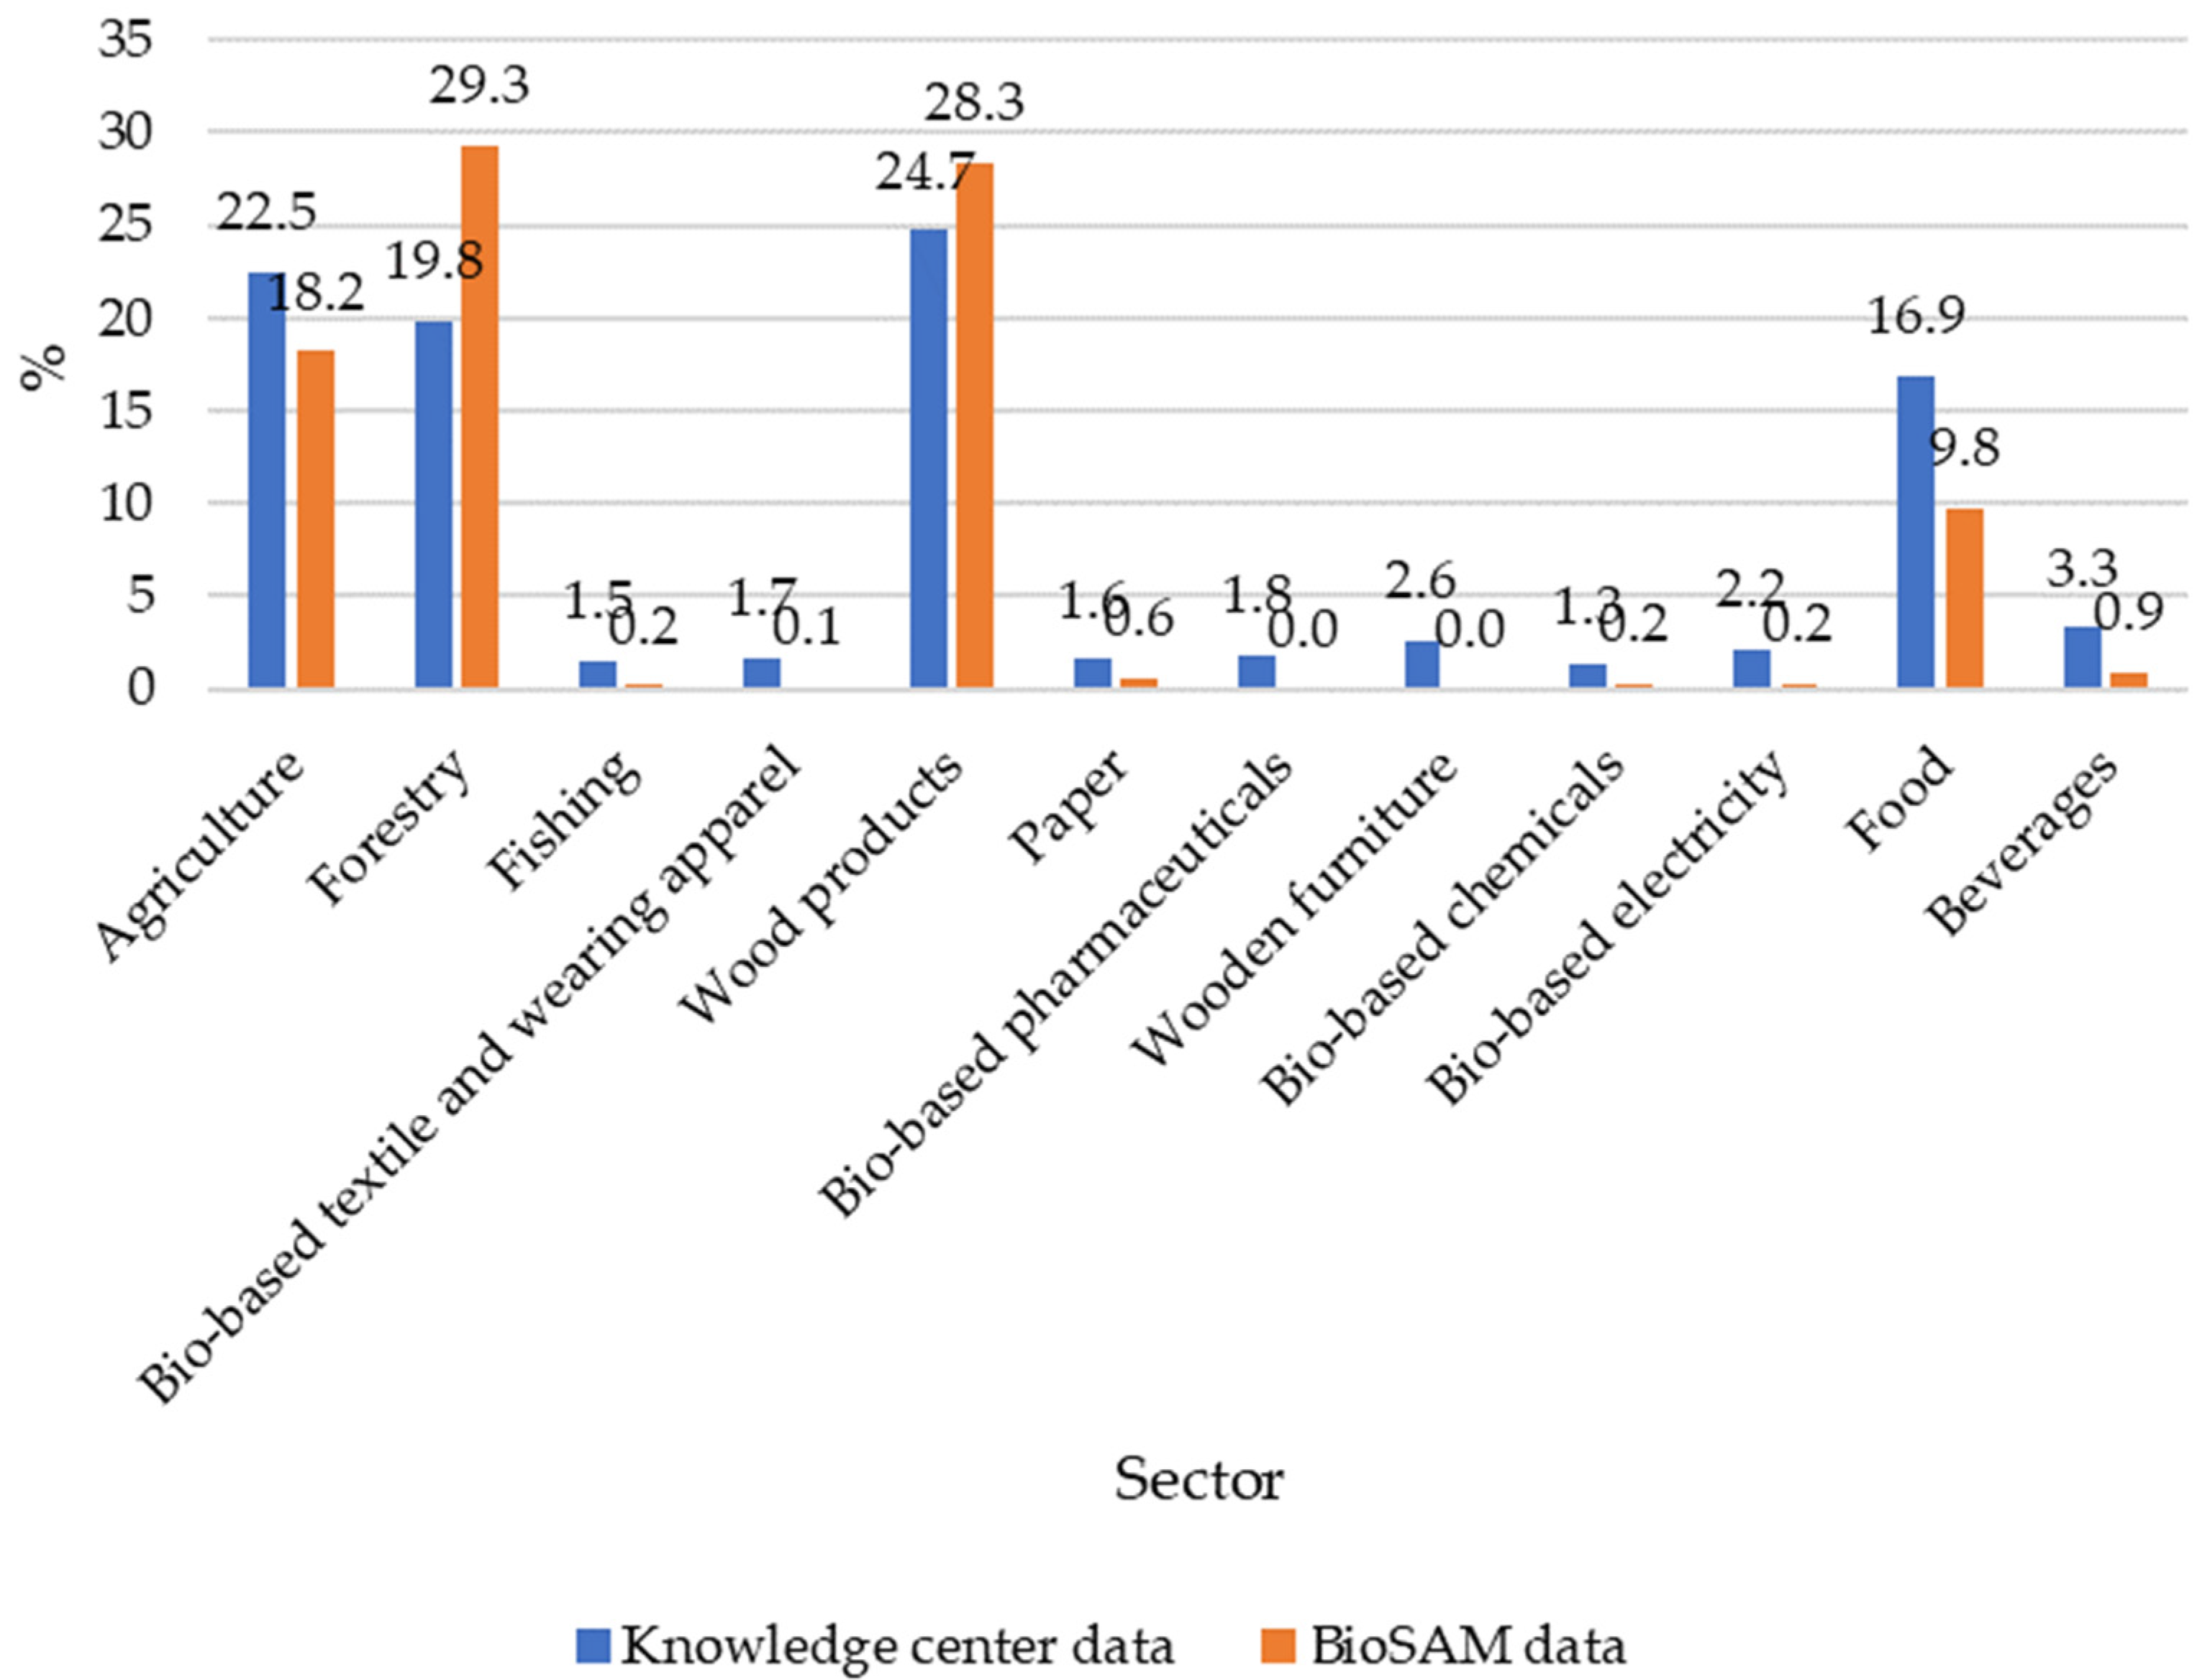
The sectors compared in
Figure 5 from the BioSAM dataset form 87.8% of the total bioeconomy, and when compared to the data from the knowledge center, it can be observed that there are several sectors, e.g., forestry, where differences are as large as almost 10%.
The results indicate that there are more sectors contributing to the bioeconomy than reported.
Figure 6 demonstrate the results of the study, which show that the share of the bioeconomy’s sectors differ according to the data source.
Furthermore, the results of the adopted methodology can be used to describe the material flows of Latvia’s economy.
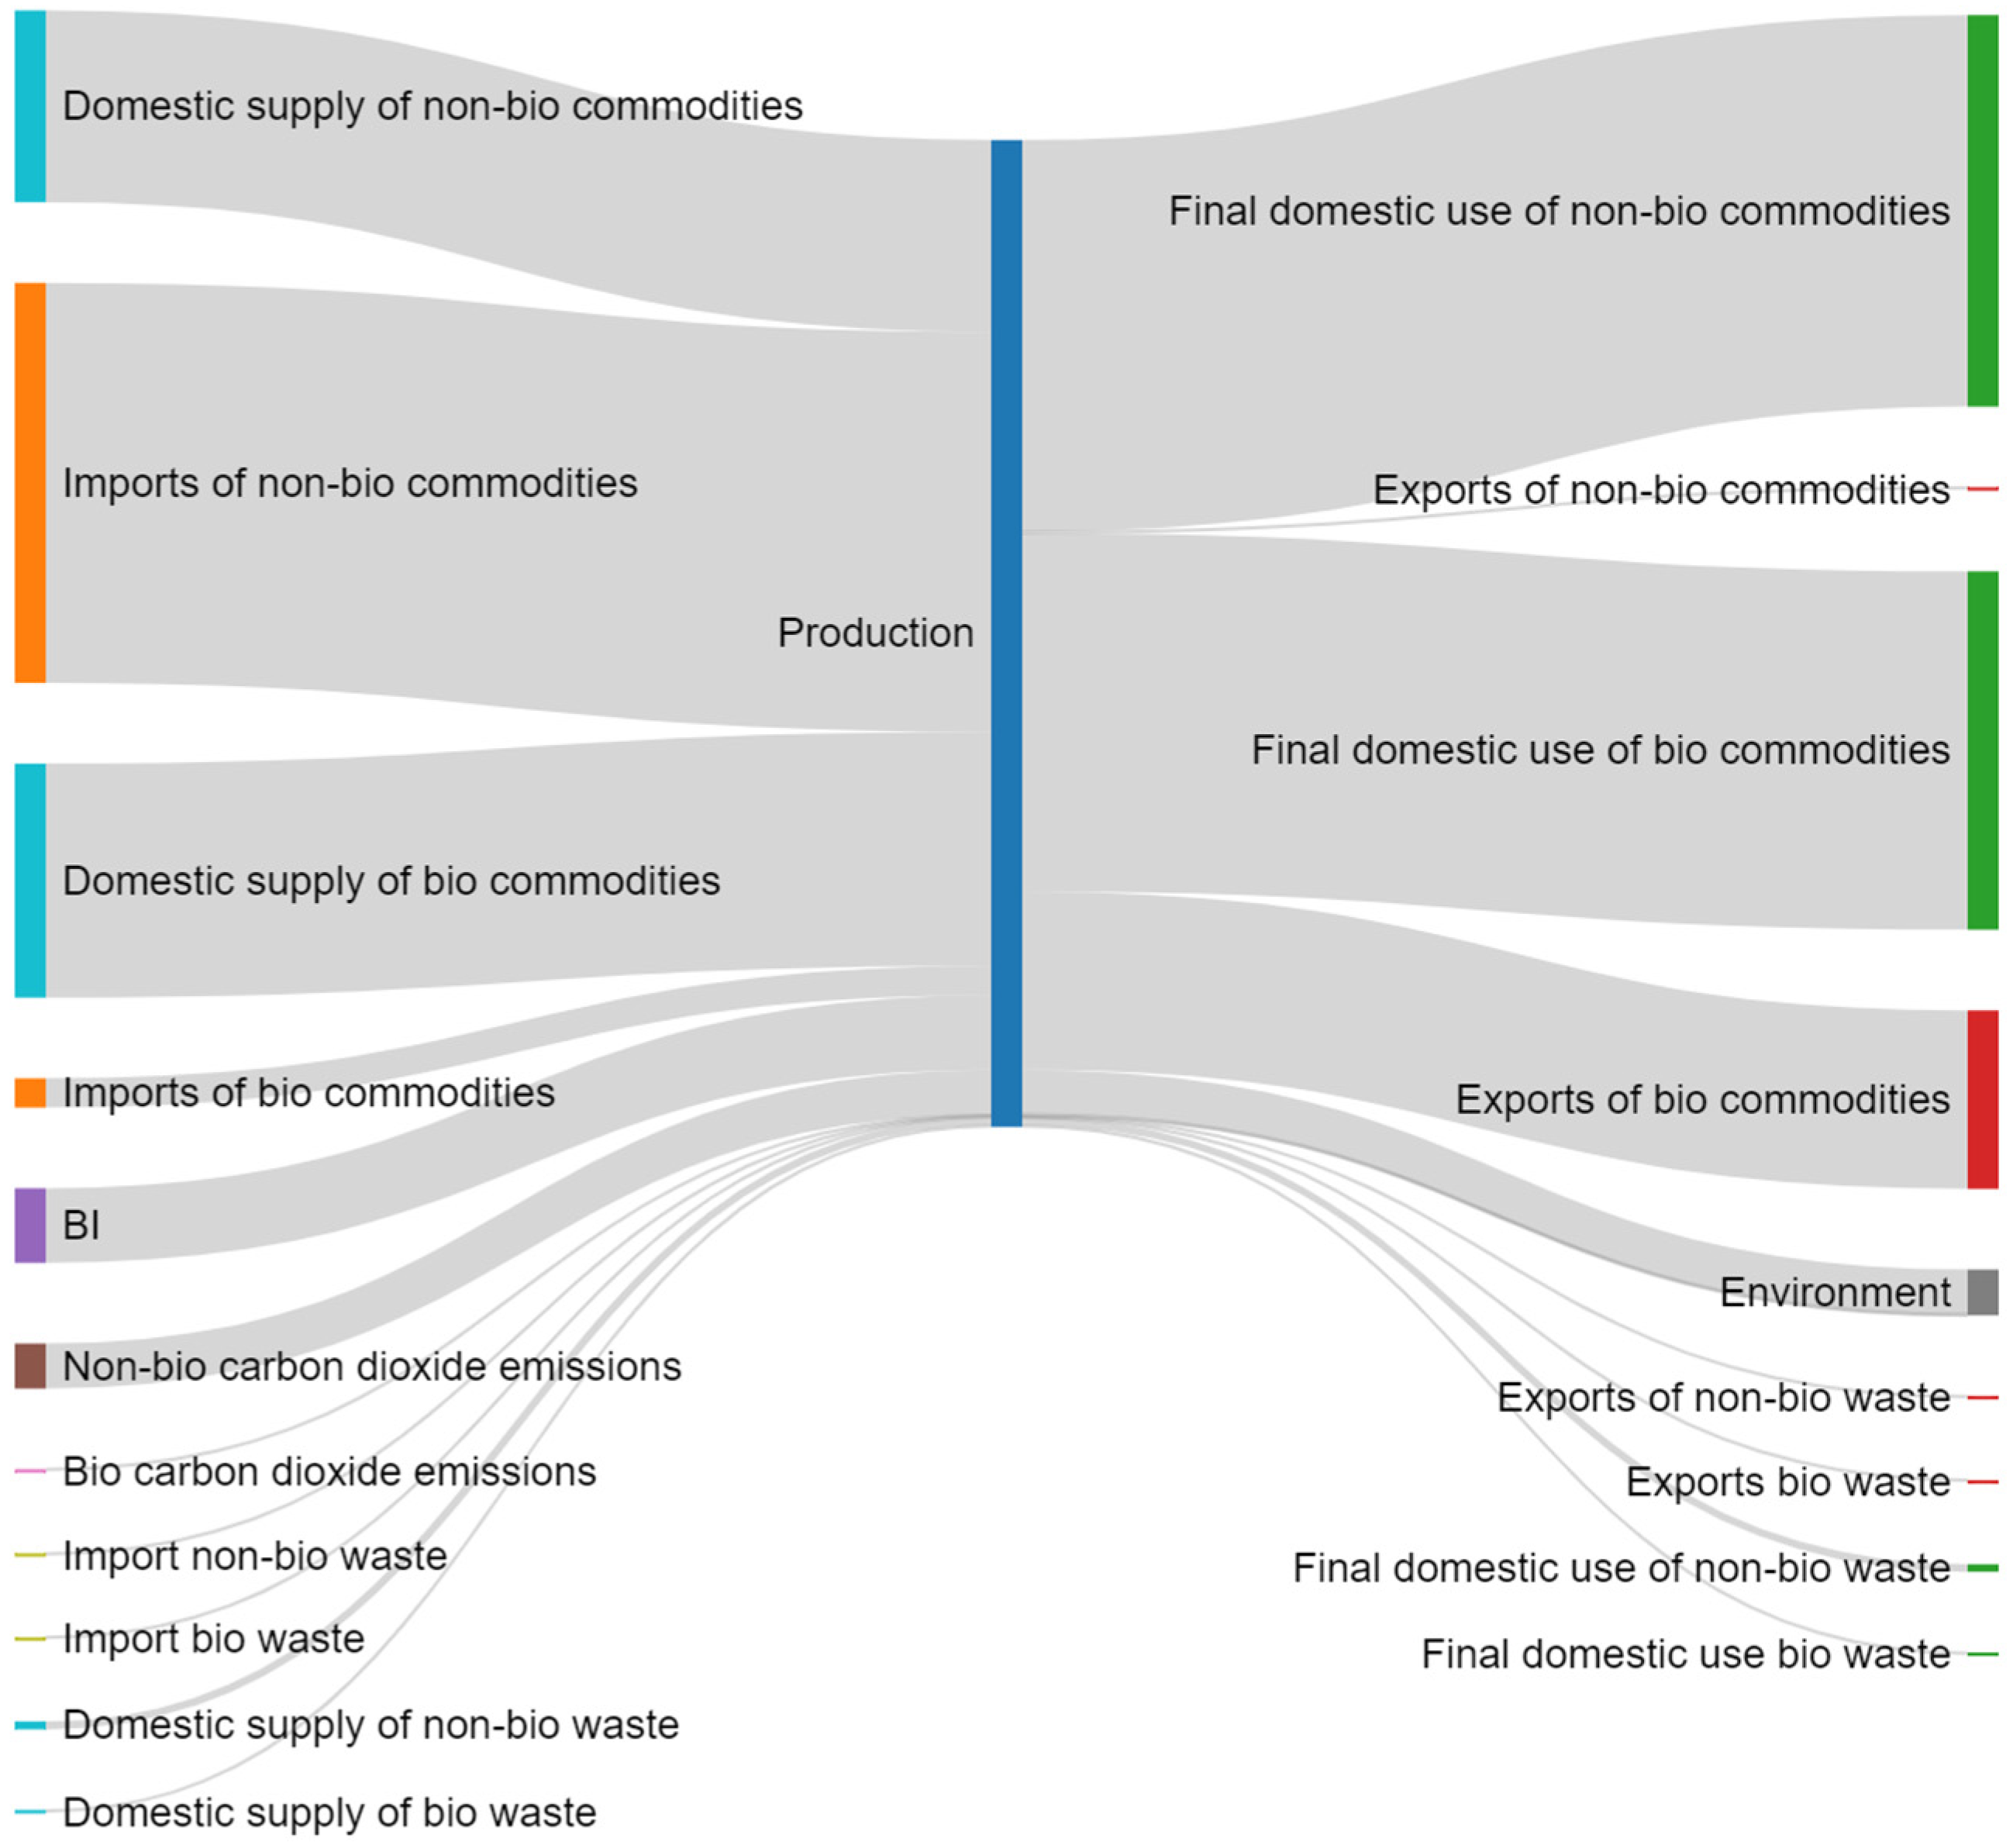
Figure 7 reflects the material flow between the supply and use of bio-based and non-bio-based commodities, carbon dioxide (CO
2) emissions, and waste. In total, 49.79% of all commodities are domestically supplied and 50.21% are imported; of that proportion, 93.18% non-bio-based commodities are imported. Latvia’s bioeconomy is largely self-sufficient in terms of the use of bio-based commodities, with only a minor flow of bio-based commodity imports (6.81% of all imports).
On the use side, it can be observed that the produced commodities are mainly used domestically—80.66%—while 19.34% are exported. Of those exported, 99.19% are bio-based commodities, and only 0.8% are non-bio-based commodities.
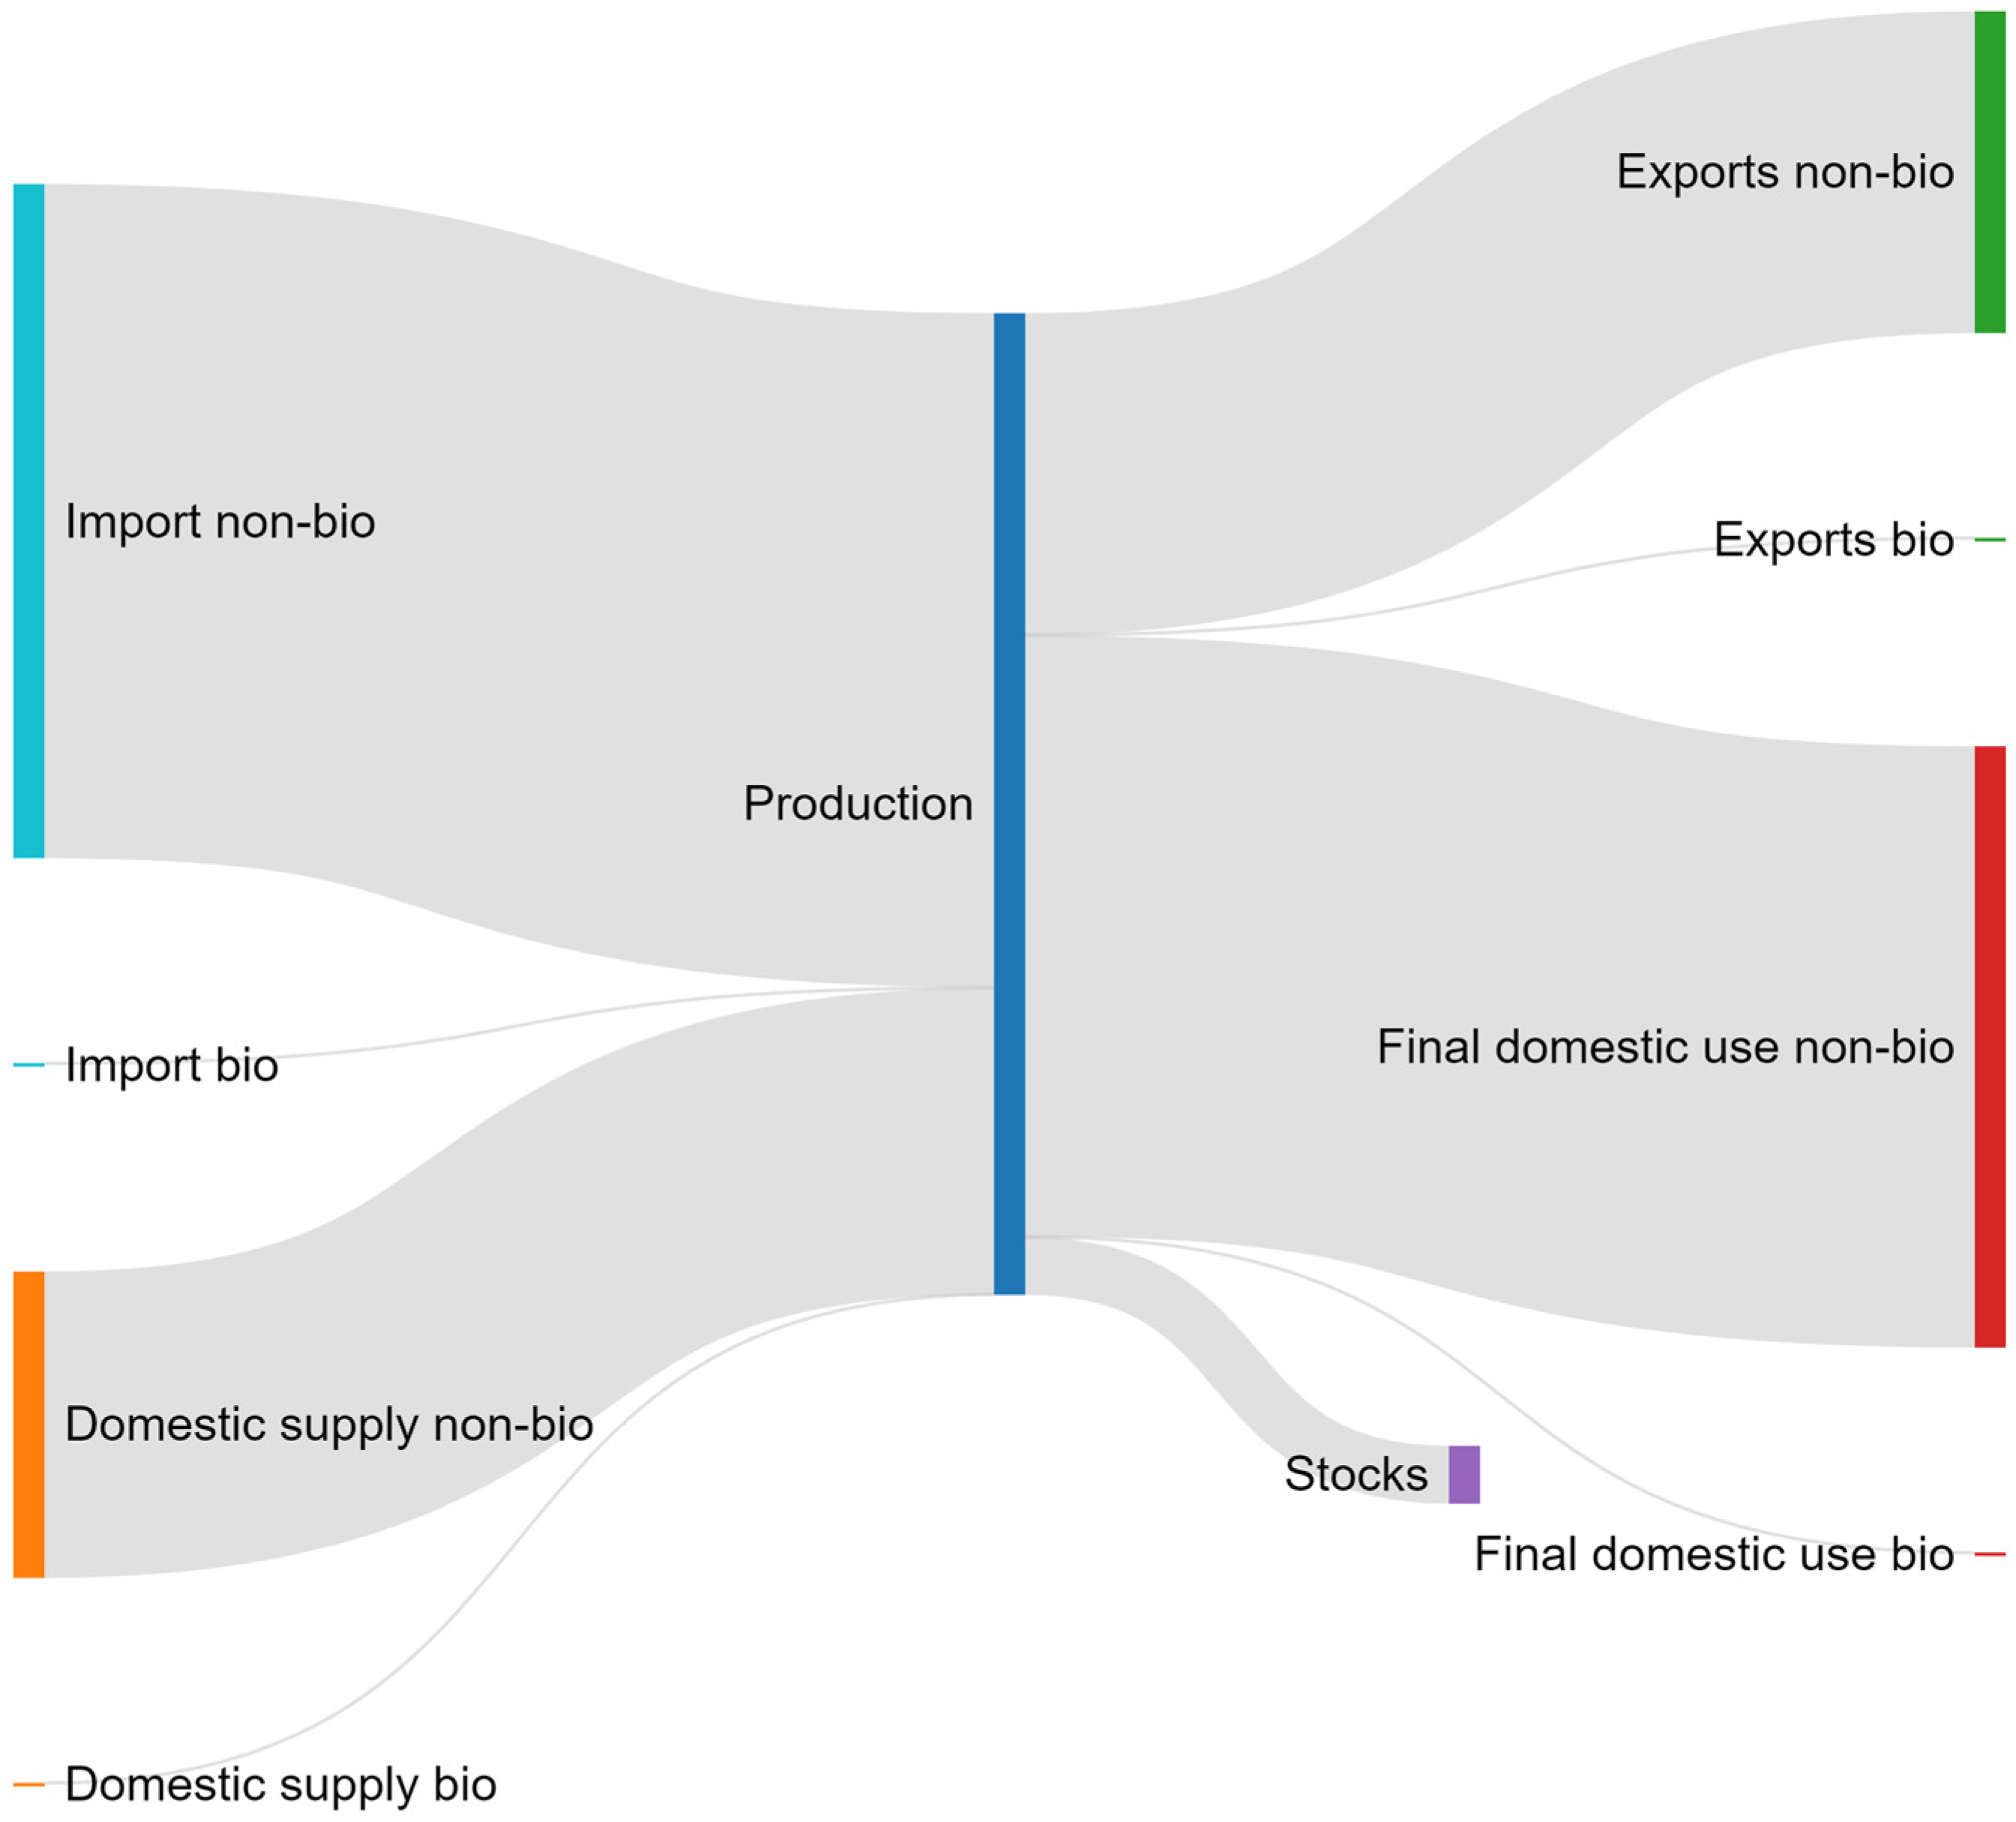
Material flows can be also constructed for each sector of the economy or each commodity separately (e.g., “Fertilizers” in
Figure 8). In this case, the material flow shows the supply and use of bio-based and non-bio-based streams of fertilizers within the economy.
Figure 8 indicates that the material flow of fertilizers is dominated by the import of non-bio-based fertilizers (167.83 million kg, or 99.9% of all imports and 68.67% of all supply). The import of bio-based fertilizers is only 0.17 million kg, or 0.1% of all imports of fertilizers. Domestic supply is also dominated by non-bio-based supply—76.29 million kg or 99.9% of the domestic supply—and only 0.08 million kg of bio-based fertilizers are supplied domestically. Exports form 32.81% of the total use, and 99.3% of those are non-bio-based, while 0.07% are bio-based fertilizer exports. In addition, 61.29% of all fertilizers are used domestically, with the same proportion of bio-based and non-bio-based fertilizers as are exported. A total of 14.41 million kg or 5.9% of fertilizers are stored domestically as stock.
5. Conclusions
The paper represents the first attempt to close the gap in the data to measure the bioeconomy in Latvia. In some cases, it required arbitrary assumptions to be made to compile a BFM for Latvia and identify the data gaps for further research.
With available data, this approach can be applied to any country aiming to measure the size of its bioeconomy.
According to the results of the bio-based material flow monitor (BFM), we conclude that the bioeconomy includes more sectors than mentioned in previous reviews of the literature. This should be considered by Latvian policy makers when defining the bioeconomic strategy for the next period. There are significant differences when measuring the bioeconomy in terms of monetary values and physical volumes, which emphasizes the importance of high-added-value sectors in the bioeconomy.
There are some shortcomings of the use of BioSAM. Initial BioSAM supply and use tables are not balanced. The BioSAM has a higher disaggregation level than SUTs do; nevertheless, it does not cover all the sectors of national SUTs. For example, waste management is included in SUTs, but it is not included in BioSAM.
The definitions of BioSAM commodities should be elaborated to set correspondence with common nomenclature (CN) and Prodcom codes. Otherwise, the granularity may include a diverse set of commodities for a BioSAM commodity that hampers pricing.
To promote the credibility of the results, national statistics officers should be involved to validate the results of the approach used in this paper.
This study can be built upon by applying data regarding the total physical volumes of commodities that are mostly available by national statistics to BioSAM shares of commodities supplied/used by the different sectors. This might provide an opportunity for BioSAM tables in volumes that result in physical supply and use tables, to check the robustness of the results. The release of BioSAM 2020 data is expected in 2023, and it will provide opportunities to analyze more recent data and observe the dynamics.


