Article

Quantifying Alternative Food Potential of Agricultural Residue in Rural Communities of Sub-Saharan Africa

1
Energy Center Lab, Department of Energy Politecnico di Torino Italy, Via Paolo Borsellino 38, 1, 10138 Torino, Italy
2
Alliance to Feed the Earth in Disasters (ALLFED), Fairbanks, AK 99775, USA
3
Faculty of Engineering, University of Canterbury, Christchurch 8140, New Zealand
4
Department of Electrical & Computer Engineering, Ivey School of Business, Western University, 1151 Richmond St. N., London, ON N6A 3K7, Canada
*
Author to whom correspondence should be addressed.
Biomass 2023, 3(2), 138-162; https://doi.org/10.3390/biomass3020010
Submission received: 19 March 2023 / Revised: 18 April 2023 / Accepted: 26 April 2023 / Published: 10 May 2023
(This article belongs to the Special Issue Biomass for Resilient Foods)

Abstract

:
African countries have been severely affected by food insecurity such that 54% of the population (73 million people) are acutely food insecure, in crisis or worse. Recent work has found technical potential for feeding humanity during global catastrophes using leaves as stop-gap alternative foods. To determine the potential for adopting agricultural residue (especially crop leaves) as food in food-insecure areas, this study provides a new methodology to quantify the calories available from agricultural residue as alternative foods at the community scale. A case study is performed on thirteen communities in Nigeria to compare national level values to those available in rural communities. Two residue utilization cases were considered, including a pessimistic and an optimistic case for human-edible calories gained. Here, we show that between 3.0 and 13.8 million Gcal are available in Nigeria per year from harvesting agricultural residue as alternative food. This is enough to feed between 3.9 and 18.1 million people per year, covering from 10 to 48% of Nigeria’s current estimated total food deficit.

1. Introduction

There is a risk of global hunger due to a confluence of regional catastrophes attributed to rising cases of conflicts, civil unrest, weather extremes and adverse climate, crop pests (e.g., desert locusts) and economic shocks, all of which were further exacerbated by the global coronavirus (COVID-19) pandemic [1,2]. Since 2015, the number of people battling acute hunger has been steadily rising, and it was estimated that in 2019 this figure had reached 135 million people (who were in crisis or worse, having reached IPC/CH Phase 3 or above), according to the Integrated Food Security Phase Classification (IPC) and the Cadre Harmonisé (CH), which estimate the populations of people in need of food, nutrition and livelihood assistance [2]. Some studies have attributed micronutrient deficiencies to difficulties learning; decreased academic productivity; some health issues, including chronic physical conditions such as asthma; and some mental health issues, such as anxiety, depression and substance use disorders, to the incidence of hunger [3,4,5]. Hunger has also been pegged as a global problem associated with suicide attempts [6]. Therefore, addressing this problem could translate to improvements in mental health worldwide, especially for adolescents [6,7].
In addition to these current problems, there is a risk of hunger caused by global catastrophic risks (GCRs). There are a number of catastrophes that could cause an abrupt 10% reduction in global food supply. These include abrupt regional climate change (~10 °C drop in one decade, which has happened in the past) [8]; multiple breadbasket failures due to coincident extreme weather on multiple continents [9]; super-resistant crop pests that are resistant to pesticides; super-resistant pathogens that are resistant to pesticides; superweeds that outcompete crops; bacteria that outcompete beneficial plant bacteria; gamma ray bursts; large volcanic eruption such as that of Mount Tambora that caused the year without a summer in 1816 and famine in parts of Europe [10]; a large asteroid/comet [11]; and an abrupt loss of pollinating bees [12]. Particularly concerning would be regional nuclear war, causing the burning of cities and smoke to remain in the stratosphere for years. A nuclear war, such as one between India and Pakistan, for example, could put between 1 [13] and 2 billion people at risk of starvation [14]. Additionally, although not abrupt, extreme climate change over a century of 5 °C or 10 °C could have a similar impact. Furthermore, an extreme pandemic that disrupts trade could kill hundreds of millions [15]. More extreme events would be sun blocking catastrophes, including an asteroid/comet that is very large (similar to the one that caused the extinction of the dinosaurs); a super volcanic eruption such as that of Toba 74,000 years ago, which some people think nearly caused the extinction of humans [16]; and full-scale nuclear war between Russia, the US, and/or China [17]. Sun blocking catastrophes would kill around 90% of people without resilient foods [18].
Thus, food insecurity is a major global issue affecting all countries. However, ten countries in the world constituted 65% (88 million people) of the worst cases in 2019. Among these, African countries have been severely affected such that 73 million people were acutely food-insecure, in crisis or even worse, with 54% of this population belonging to the latter categories [2]. Nigeria emerged as one of the African countries in this group, and falls within the IPC/CH Phase 4 classification correlating to the emergency phase, which requires the dissemination of urgent actions to save lives and livelihoods. Insurgency and insecurity, especially in northern Nigeria, have led to the massive internal displacement of populations, the destruction or closure of basic social services, the disruption of productive activities and markets, etc. [2].
The acute food insecurity situation in Nigeria primarily falls on three regions: Zamfara, Yobe and Borno [2]. Zamfara and Yobe have areas in phases two and three of food insecurity: stressed and in crisis, respectively. Borno, the country’s most northeastern state, is presently the most food insecure, having areas in phase four, emergency, as well as in phases two and three. These trends are reflected by HungerMap Live: the weekly snapshot for 12 February 2021 indicates that there are 62.6 million people with insufficient food consumption [19]. Specific impacts on children (under 5 years old) include chronic malnutrition, which affects 36.8% of children, and acute malnutrition, which affects 6.8% [19].
The dialogue addressing global food security emphasizes bulk production and the consumption of sufficient amounts of calories to curb hunger and ensure survival rather than nutrition for well-being and development [20]. Regardless, there is a call for strategies to tackle the increasing food shortages commensurate to the rising world population [21]. The current strategies of providing food security are not viable with current food production practices [21,22,23]. Therefore, alternative strategies are required to optimize these limited resources and valorize resource efficiency in food production. These potential strategies have given rise to several investigations on alternative sources of food including plant-based meat or meat analogues [24], food production from insects [25], plant-based superfoods [26], etc. Additional resilient strategies include methane (natural gas)-consuming single cell protein (SCP) [27], hydrogen-consuming SCP [28], transforming cellulose into sugar [29], low-cost greenhouses [30], and seaweed and rabbits that can consume cellulose [31]. Almost universally, the majority of humans’ calorie intake comes from seeds (grains and pulses) [32]. Edible leaves, however, have been known to possess more nutritional value than seeds in terms of protein quality, vitamins, minerals and omega 6/omega 3 fatty acid ratios [33].
There are three ways of extracting calories from leaves other than by directly eating them. One of the challenges is extracting the high fiber content. The lowest infrastructure method is chewing leaves and spitting out the solids [34]. The next method is making leaf tea by boiling the leaves/needles [35]. Finally, there is the method of grinding the leaves, pressing the liquid out, boiling the liquid, and then skimming off the protein rich coagulate (leaf protein concentrate (LPC)) [36]. A large advantage of the latter technique is that many of the toxins remain in the liquid. A previous study found that the forests near the hungry populations determine the potential to make food from tree leaves at the national scale [37]. Agricultural residues could be fed directly to ruminants, but it is better to extract human-edible calories first and then give them to ruminants or industrial processes that can turn cellulose into sugar.
Though some agricultural catastrophes would destroy some industry/infrastructure, the destruction would not be global [38]. Therefore, most transportation and industrial capability would remain. However, there are scenarios that would disrupt transportation/electricity/industry globally. These include a severe solar storm; multiple detonations of nuclear weapons at a high altitude, causing electromagnetic pulses (EMPs); a coordinated cyberattack; and an extreme pandemic causing the desertion of critical industries [39]. These scenarios would create many difficulties for humans that would stop them from meeting their needs, including shelter, water and transportation [40]. For food, solutions need to be considered at the household level. Some promising candidates include cold-tolerant plants, mushrooms and LPC [39]. If international trade is lost, along with electricity/industry, many countries would not be able to feed themselves by conventional means [41].
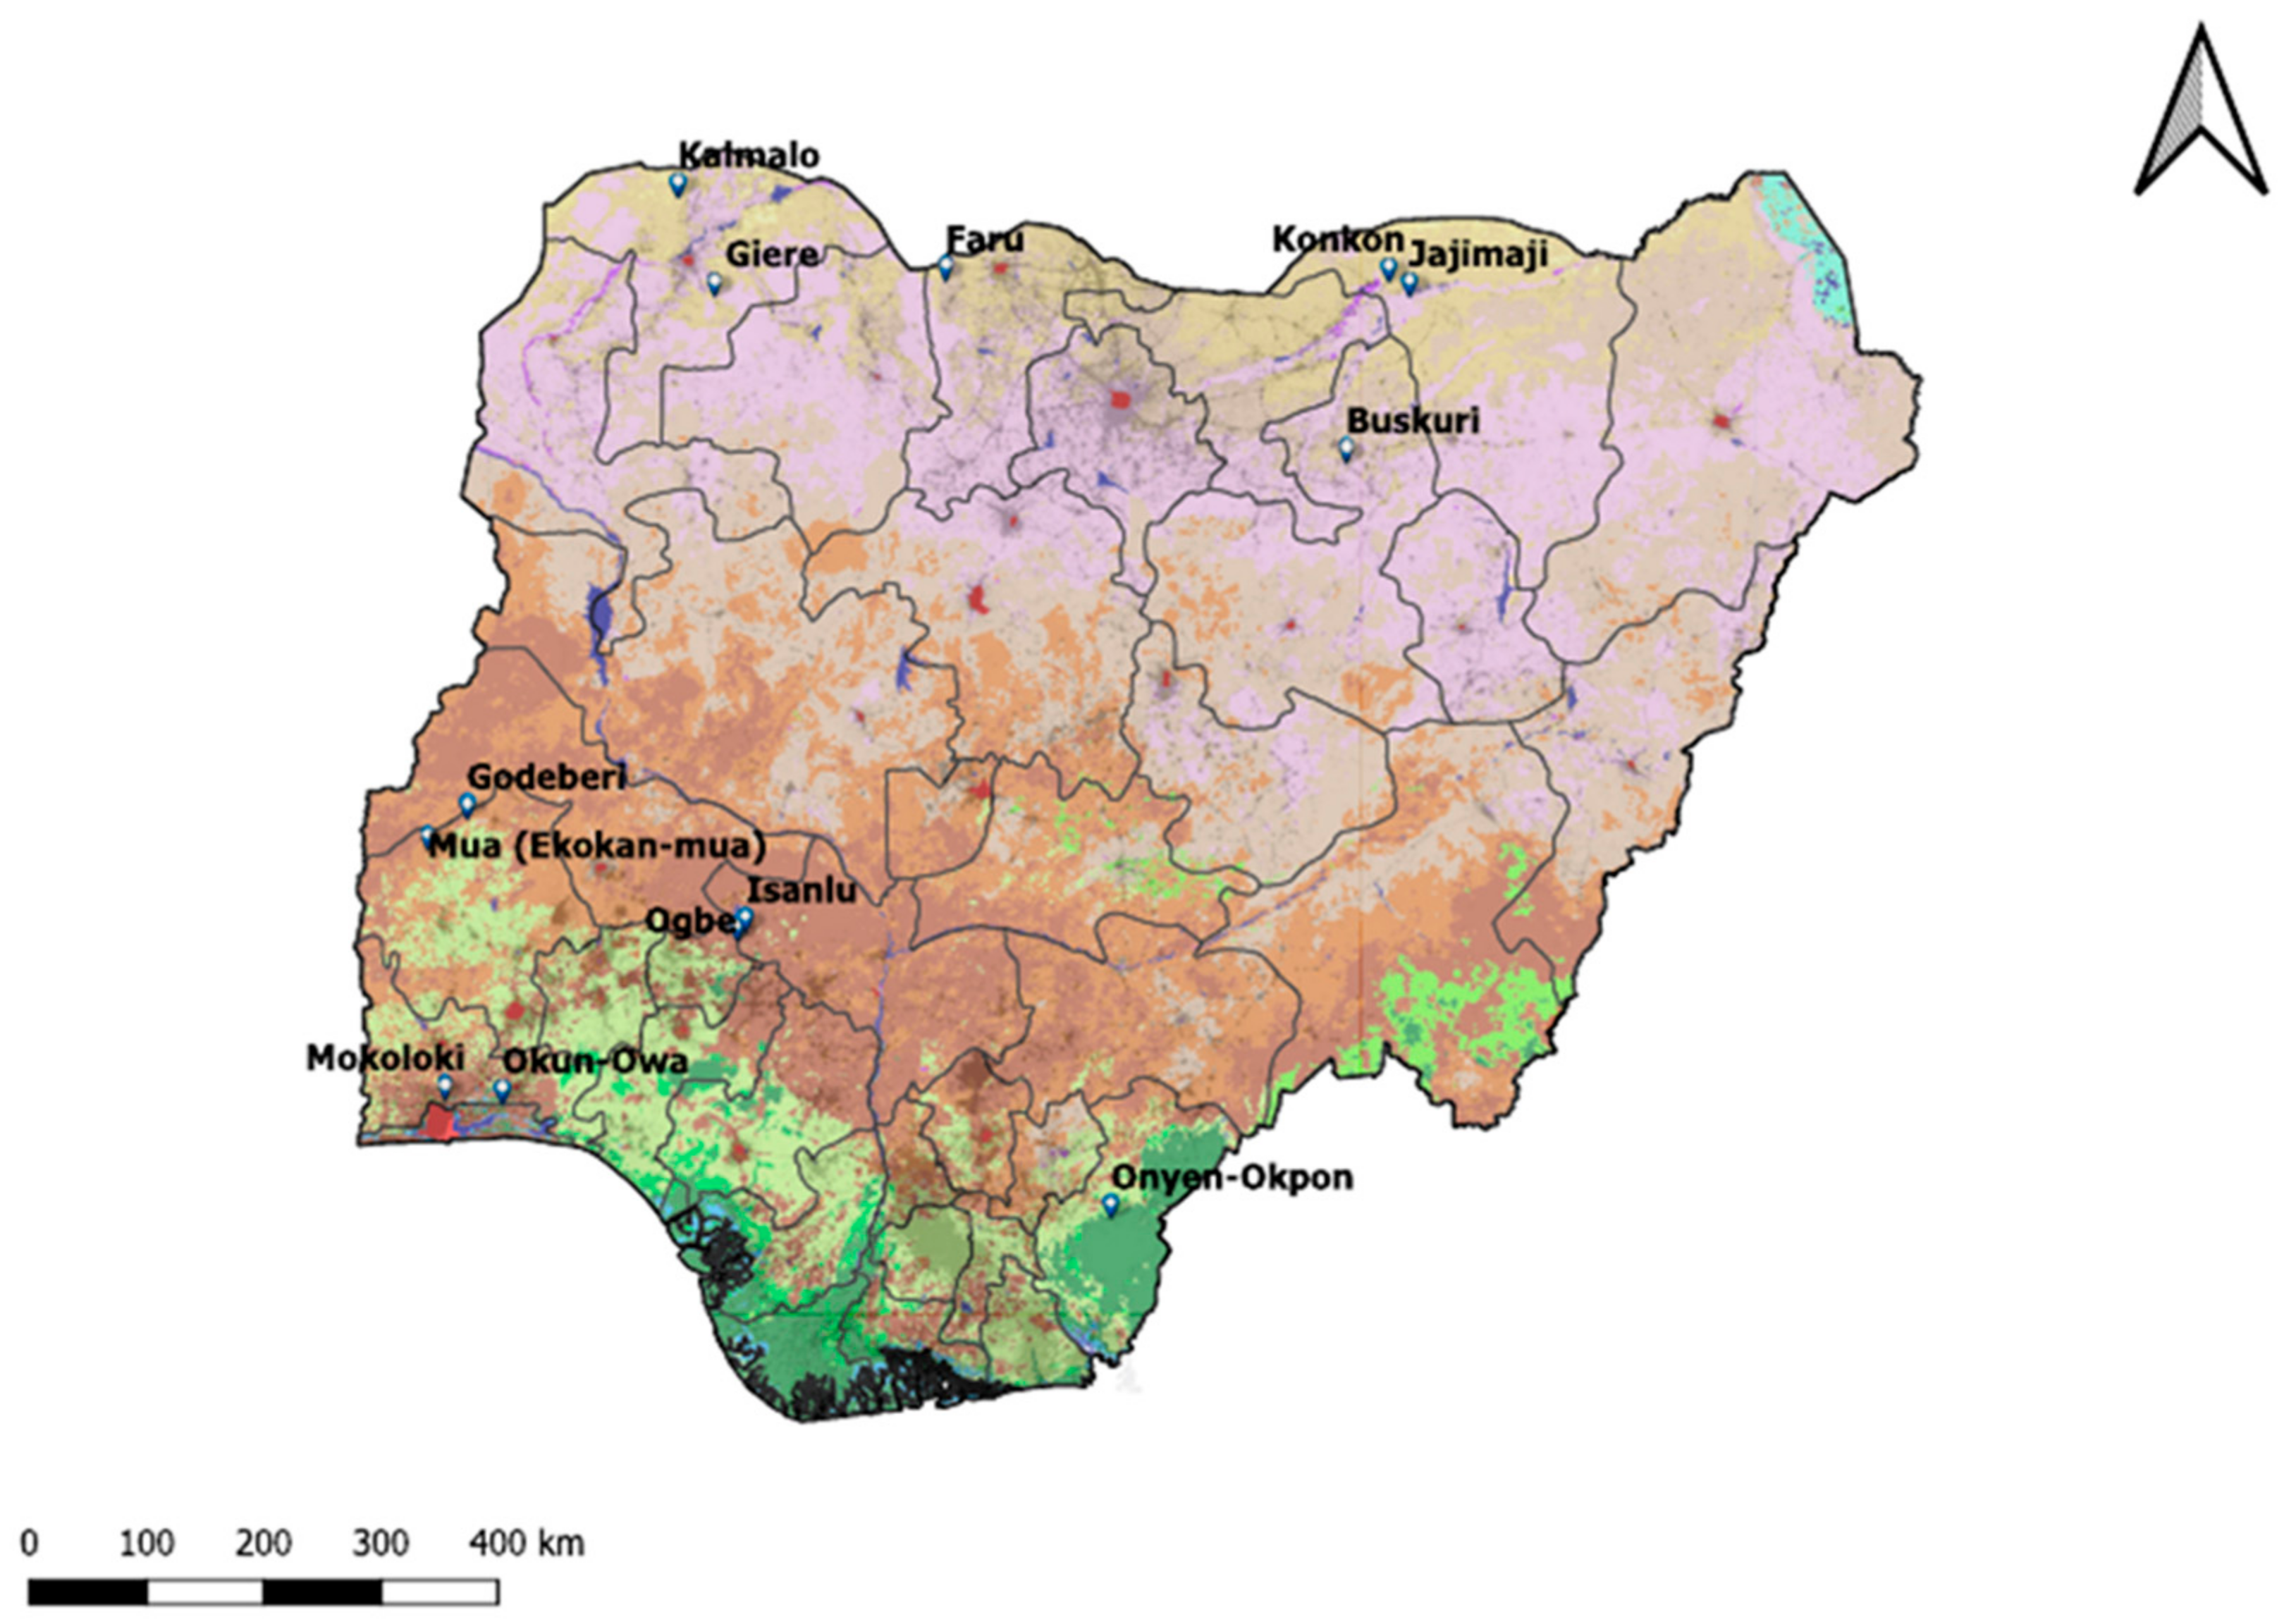
Therefore, a case may be made for exploring the potential of adopting agricultural residue, and crop leaves in particular, as food. This study provides a new methodology to quantify the calories available from residue as a resilient food at the community scale that could be used to expand these estimates and reduce hunger now. A case study is performed on thirteen communities in Nigeria to compare national level values to those available in rural communities. The results are presented and discussed in the context of applying the new method in sub-Saharan Africa and of how it can be generalized to relieve both current hunger and future hunger caused by a GCR event anywhere in the world.

2. Materials and Methods

2.1. Nigeria

Half of the Nigerian population resides in rural areas (51%) [42]. Among the rural population, only 36% has electricity access, which is well below the 55% electricity access for the urban population in Nigeria [43]. Nigeria’s rural areas chiefly depend on agriculture for sustenance, which still drives the Nigerian economy, with farming and fishing making up nearly half (47%) of Nigeria’s gross domestic product (GDP) [44]. Nigeria has 0.219 hectares and a GDP of $2130 per capita. In the event of the loss of industry and international trade, an estimated 76 million would die, which accounts for roughly 40% of the population.
This study will determine how many additional calories would be made available by harvesting food from agricultural residue. Thirteen rural communities in Nigeria were evaluated and are shown in Figure 1.

2.2. Algorithm

The approach for estimating the agriculture crop residues entailed estimating the net primary production of the plant matter in the target communities. Then, the residue to crop ratio and the availability factor of the residue for energy production was applied to deduce the amount of available agricultural crop residues. Only harvested crop production areas in use are considered; however, future work could be performed to consider the impact of the utilization of additional areas. Forest areas, protected areas and other unfarmed arable land were excluded zones from the assessment. These analyses were facilitated by the Global Atlas for Renewable Energy and Global Agro-Ecological Zones (GAEZ) model developed by the Food and Agriculture Organization (FAO) and the International Institute for Applied Systems Analysis (IIASA) [45]. The analysis resulted from estimating the residue generated within a typical temporal cycle of 1 year for a given geographic area. The available residue (Rbio) in t/year for a rural community was estimated as follows:
R b i o = i R i   r i   a i ,
where Ri is the annual production of a crop, i, in t/year. This was obtained as a product of the harvested land in 1000 ha [45] and the average productivity per yield in t/ha/year [46]. ri is the residue-to-product ratio of a crop, i [47]. The residue availability fraction, ai, was 95% for rice, 90% for millet, 30% for maize (corn), 35% for soybean and 100% for cassava [48], while that of other crop residues was 60% [49]. The crop types and residue are shown in detail in Appendix A.

2.3. Classifying Uses and Potential Edibility of Agricultural Residues

As a first step, the different crops grown in the communities listed in Table A1 are broken up into their different residue types, such as stalks and husks. These crop types and their residues were then analyzed using the following steps:
  • These individual residue types are then compared to databases/online libraries (Feedipedia [50] and Dairy Knowledge [51]) to assess their usage as forage and their nutritional value and to identify potential processing steps. The crop residues were broken into three streams: (a) known edible, (b) known edible with LPC [52] and (c) forage [50].
  • Calculations were performed to determine the calories available for human consumption as LPC for each crop residue for category (b) based on a range of the yield of the LPC process as a percentage of the initial dry mass. Left over mass from the creation of LPC that could be further utilized is returned as forage (c), from which a meat yield from animals fed the forage is calculated (discussed in Section 2.4).
  • Hypothetical yield consumption for (a) and (b) and (c) are summed for each crop residue to obtain additional direct food, and comparisons are performed between calories available and current hunger and between estimated mortality and estimate lives saved in the current situation and in a GCR. Finally, estimates of additional calories for people currently and in a GCR are outlined for future work.
To determine the number of calories gained from agricultural residues, several conversions must be undertaken. First, the digestible energy (DE) (gained from Feedipedia [50]) is converted into metabolizable energy (ME). For decades, ME has been calculated from DE using a factor of 0.82 [53]. Recent research shows that factors above 0.9 can be achieved with high-concentrate diets [54]; however, here, it is conservatively assumed that agricultural residues deviate from the ideal factor, and we proceed with the lower established factor of 0.82. In the next step, the Feed Conversion Rate (FCR), also commonly referred to as feed efficiency or dry matter intake efficiency, is determined for cattle, pigs and goats. The FCR describes the ratio of feed (dry mass) to bodyweight gain (kg/kg). The FCR for an animal can vary significantly depending on many factors. For instance, activity level (confined vs. free range), diet (especially protein content) and thermal environment (climate) can all impact FCR [55,56]. The FCR is dependent on the ME (diet) of the fed diet, and to allow for a kg-to-kg comparison between the weight of the agricultural residues and the weight gain in the animal, the FCR has to be adjusted. This is achieved in a third step by factoring in ME (agricultural residue)/ME (diet). In the fourth step, the carcass rate (CR, in %) is factored in to approximate the amount of meat gained. CR reports the percentage yield of live animal weight to dressed carcass weight, where the dressed carcass represents the total weight of the sellable product. It is important to note that dressed weight is, thus, dependent on how the carcass is dressed, which can differ significantly globally depending on the market for given cuts. Caloric values (kcal/g) for meat from each animal were determined using macronutrient composition (protein, fat and carbohydrate) for standard meat cuts (beef, pork, lamb and goat) [57] before applying generic Atwater caloric values for macronutrients (Table A3) [58]. Thus, human consumable calories in the form of meat (Emeat) for a given animal fed a given amount of residues can be calculated by Equation (2), where (Emeat) is the energy value of the meat product (kcal/g), Rbio is as defined in Equation (1), MEdiet is metabolizable energy in the reported FCR diet, Rme is the metabolizable energy in the residue and mcal is the energy density of the meat, as presented in Table 1.
E m e a t = R b i o × M E d i e t × C R × m c a l F C R × R m e
In addition, the Leaf for Life database [52] is searched for the specific crop species for which a known edible LPC has been reported.

2.4. Determine Leaf Protein Concentrate Yields

The method utilized for extraction of LPC from agricultural residues was accomplished in the following steps. Agricultural residues were harvested, and a known mass of fresh leaves was dried at 66 °C (152 °F) for approximately 16 h until weight no longer decreased (control), and dry mass was determined with a digital scale. The same known mass of fresh leaves was blended in a food processor with additional water until a fine pulp and green liquid was obtained. The liquid was separated from pulp and captured by passing through a finely woven polyester bag under compression. LPC fiber mass (FM) was retained and dried at 66 °C for approximately 16 h until weight no longer decreased, and dry mass was determined with a digital scale. The dry yield of CR was calculated using the following equation:
Y F M = m F M m T
where mFM and mT are the dry mass of the LPC FM and the total dry mass of the control, respectively. The extracted liquid was quickly heated on a stove top until a rolling boil was achieved to yield a coagulated green (and light green) mass and a brown/green liquid. The coagulated mass was skimmed off the top of the liquid and placed on parchment paper and dried at 66 °C for ~16 h until the weight no longer decreased (control), and dry mass was determined with a scale. Finally, the dry yield of LPC was calculated using the following equation:
Y L P C = m L P C m T
where mLPC and mT are the dry mass of the LPC and the total dry mass of the control, respectively.

3. Results

The results of the edibility from the agricultural residue review are shown in Table 2 using Leaf for Life data and Feedipedia. For the agricultural residue from Table 1, which could be either directly eaten or used as forage, the calories available and the gross energy for dry mass (MJ/kg) are shown in Table 2. The proportion of the gross energy able to be extracted is dependent on the residue type and the digestive capabilities of the animals, as well as other factors such as the treatment of residues (chemical and physical).
Following the method shown above for a wide range of crop residues, the yields for LPC are taken as a range of 4–14%. A standard caloric value of 3.89 kcal/g was calculated for LPC by using the mean proximate composition (protein, fat and carbohydrate) of eight reported LPC varieties [64] (see Appendix A, Table A3). The potential calories from LPC obtained from agricultural residues were then determined using these values (Table 3). Several residues, roughly those lacking green color and, thus, having a low concentration of chloroplasts, are ill suited for processing into LPC due to their low protein content. As such, maize cobs, palm fiber press, rice husk and coffee husk were excluded from LPC calculations (Table 3).
LPC FM and calories remaining in liquid fraction from LPC production can be combined and fed to ruminants in order to maximize energy utilization (Table 3). To account for such reutilization within the model, the metabolizable energy density (MJ/kg) of residues were decreased proportionally to the human metabolizable energy extracted in the form of LPC. Apart from decreased energy value, the nutritional makeup of LPC FM is assumed to be equivalent to virgin residues, implying that animal performance is the same per kcal of LPC FM as virgin residues.
Using the agricultural residues as forage, the digestible energy for ruminants (cattle, sheep and goats) and pigs is shown in Table 4. Using Equation (2) and the relevant values from Table 1, the gained/produced meat are calculated and shown in Table 5. Meat produced from LPCFM is calculated in an analogous way, utilizing the LPCFM ruminant digestible energy values from Table 3, to calculate meat produced by ruminants from LPCFM in Table 6.

Residue Utilization Case

Two residue utilization cases were considered, including a pessimistic and an optimistic case for human-edible calories gained (see Table 7 and Table 8). The optimistic case utilizes the highest of the upper bound yield for the residue conversion (food production) method for each residue. The pessimistic case utilizes the highest of the lower bound residue conversion yield for each residue type.
The residue availability factor discussed in Section 2 describes the fraction of the residues, which can be gathered and made available for use to generate energy, providing a hypothetical upper limit for the extractable residues. The survey results demonstrate several residue utilization cases that would further decrease residue availability, such as in burning (on field), fuel, construction, among other uses, and these cases could be used with ~60% of total residue for cereals and ~6% for legumes [64]. To account for uses in which residue energy is removed from the system, a residue utilization factor was applied to both cases. For the optimistic case, a residue utilization of 0.95 is estimated as, in the event of a severe catastrophe, residue utilization for food production would be prioritized in order to feed as many people as possible, implying a factor close to one. For the pessimistic case, a utilization factor of 0.67 is used, which is equivalent to the average of cereal and legume residues that exit the farm systems (~33%) in Kano State, Nigeria, as previously reported [
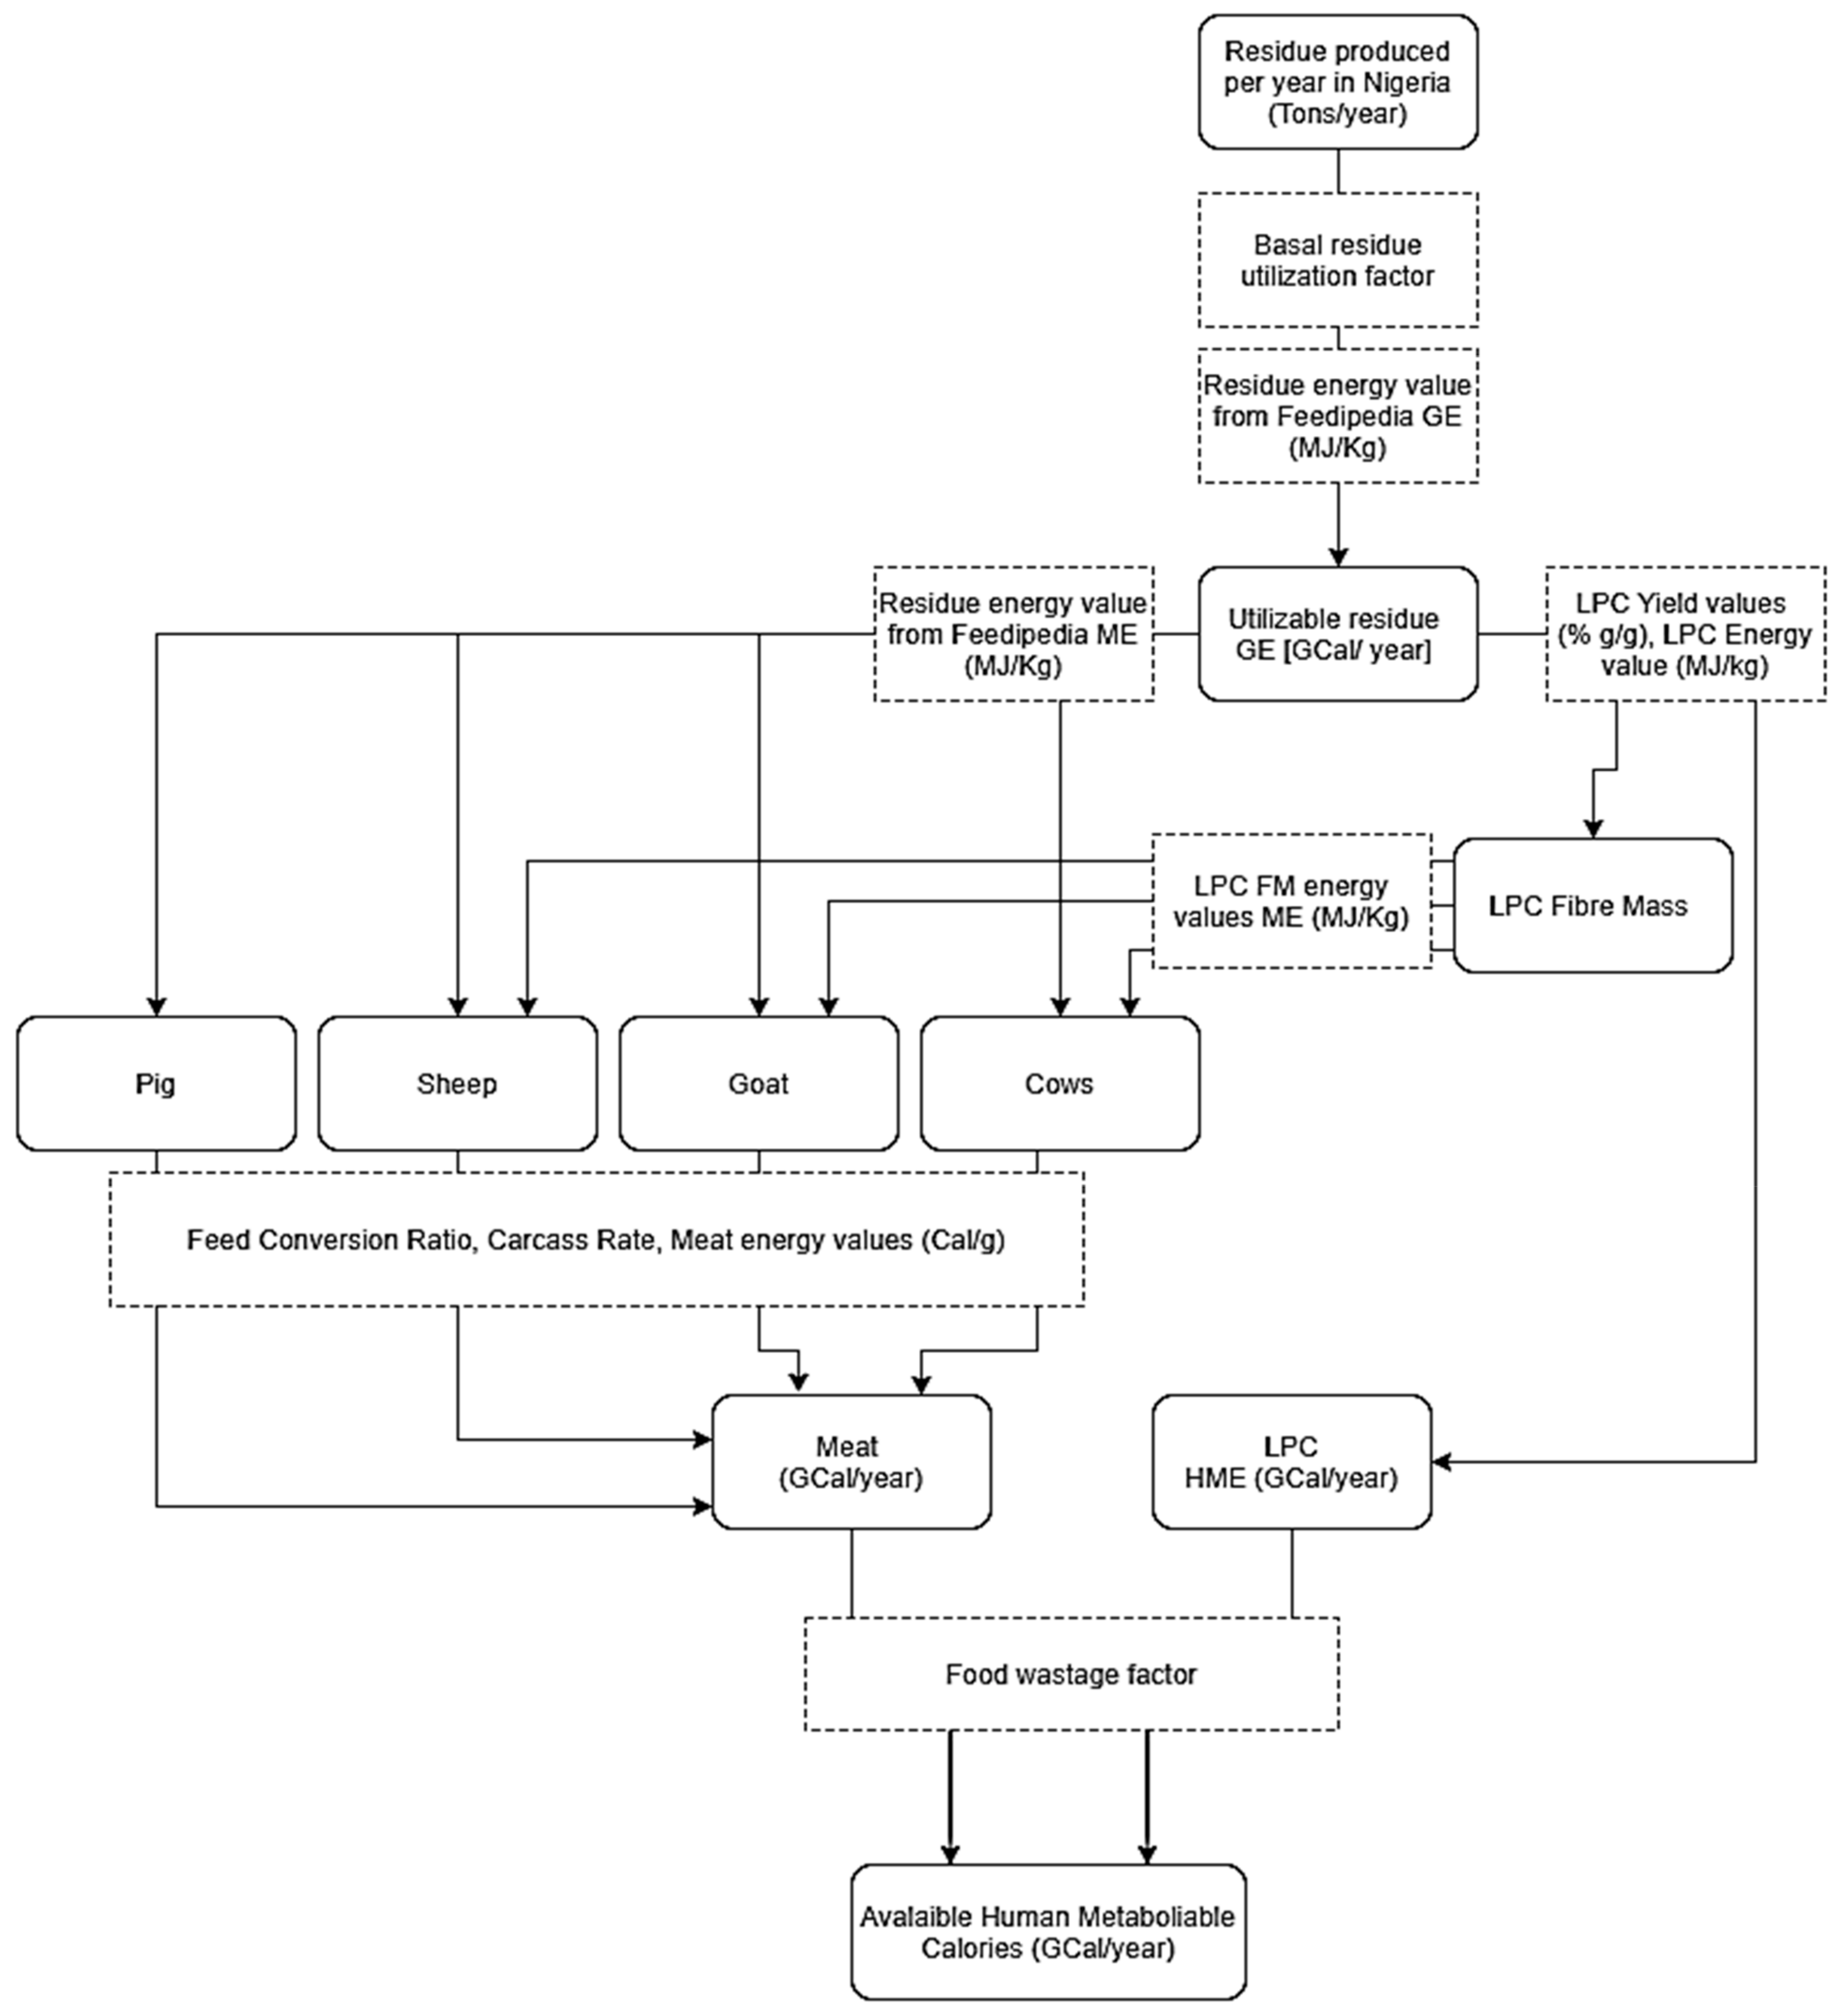
65]. The model diagram demonstrating the pathway by which one residue type could be utilized to produce calories is presented in Figure 2.
The waste of harvested food can occur at many steps of the food supply chain including spoilage, losses during transport, losses due to pests such as rats and more. These losses will be expected to be lower for subsistence farmers, for which there are fewer steps in the food supply chain, and further reduced again in instances of food shortage or famine as scarcity further incentivizes reduced wastage. The food waste factor is applied to both cases to represent such losses. The optimistic case uses a factor of 0.13. This number is intended to represent concerted efforts to minimize waste, as would be expected during times of scarcity, such as famine. The pessimistic cases use a factor of 0.3, representing that the status quo of wastage is maintained even in famine.
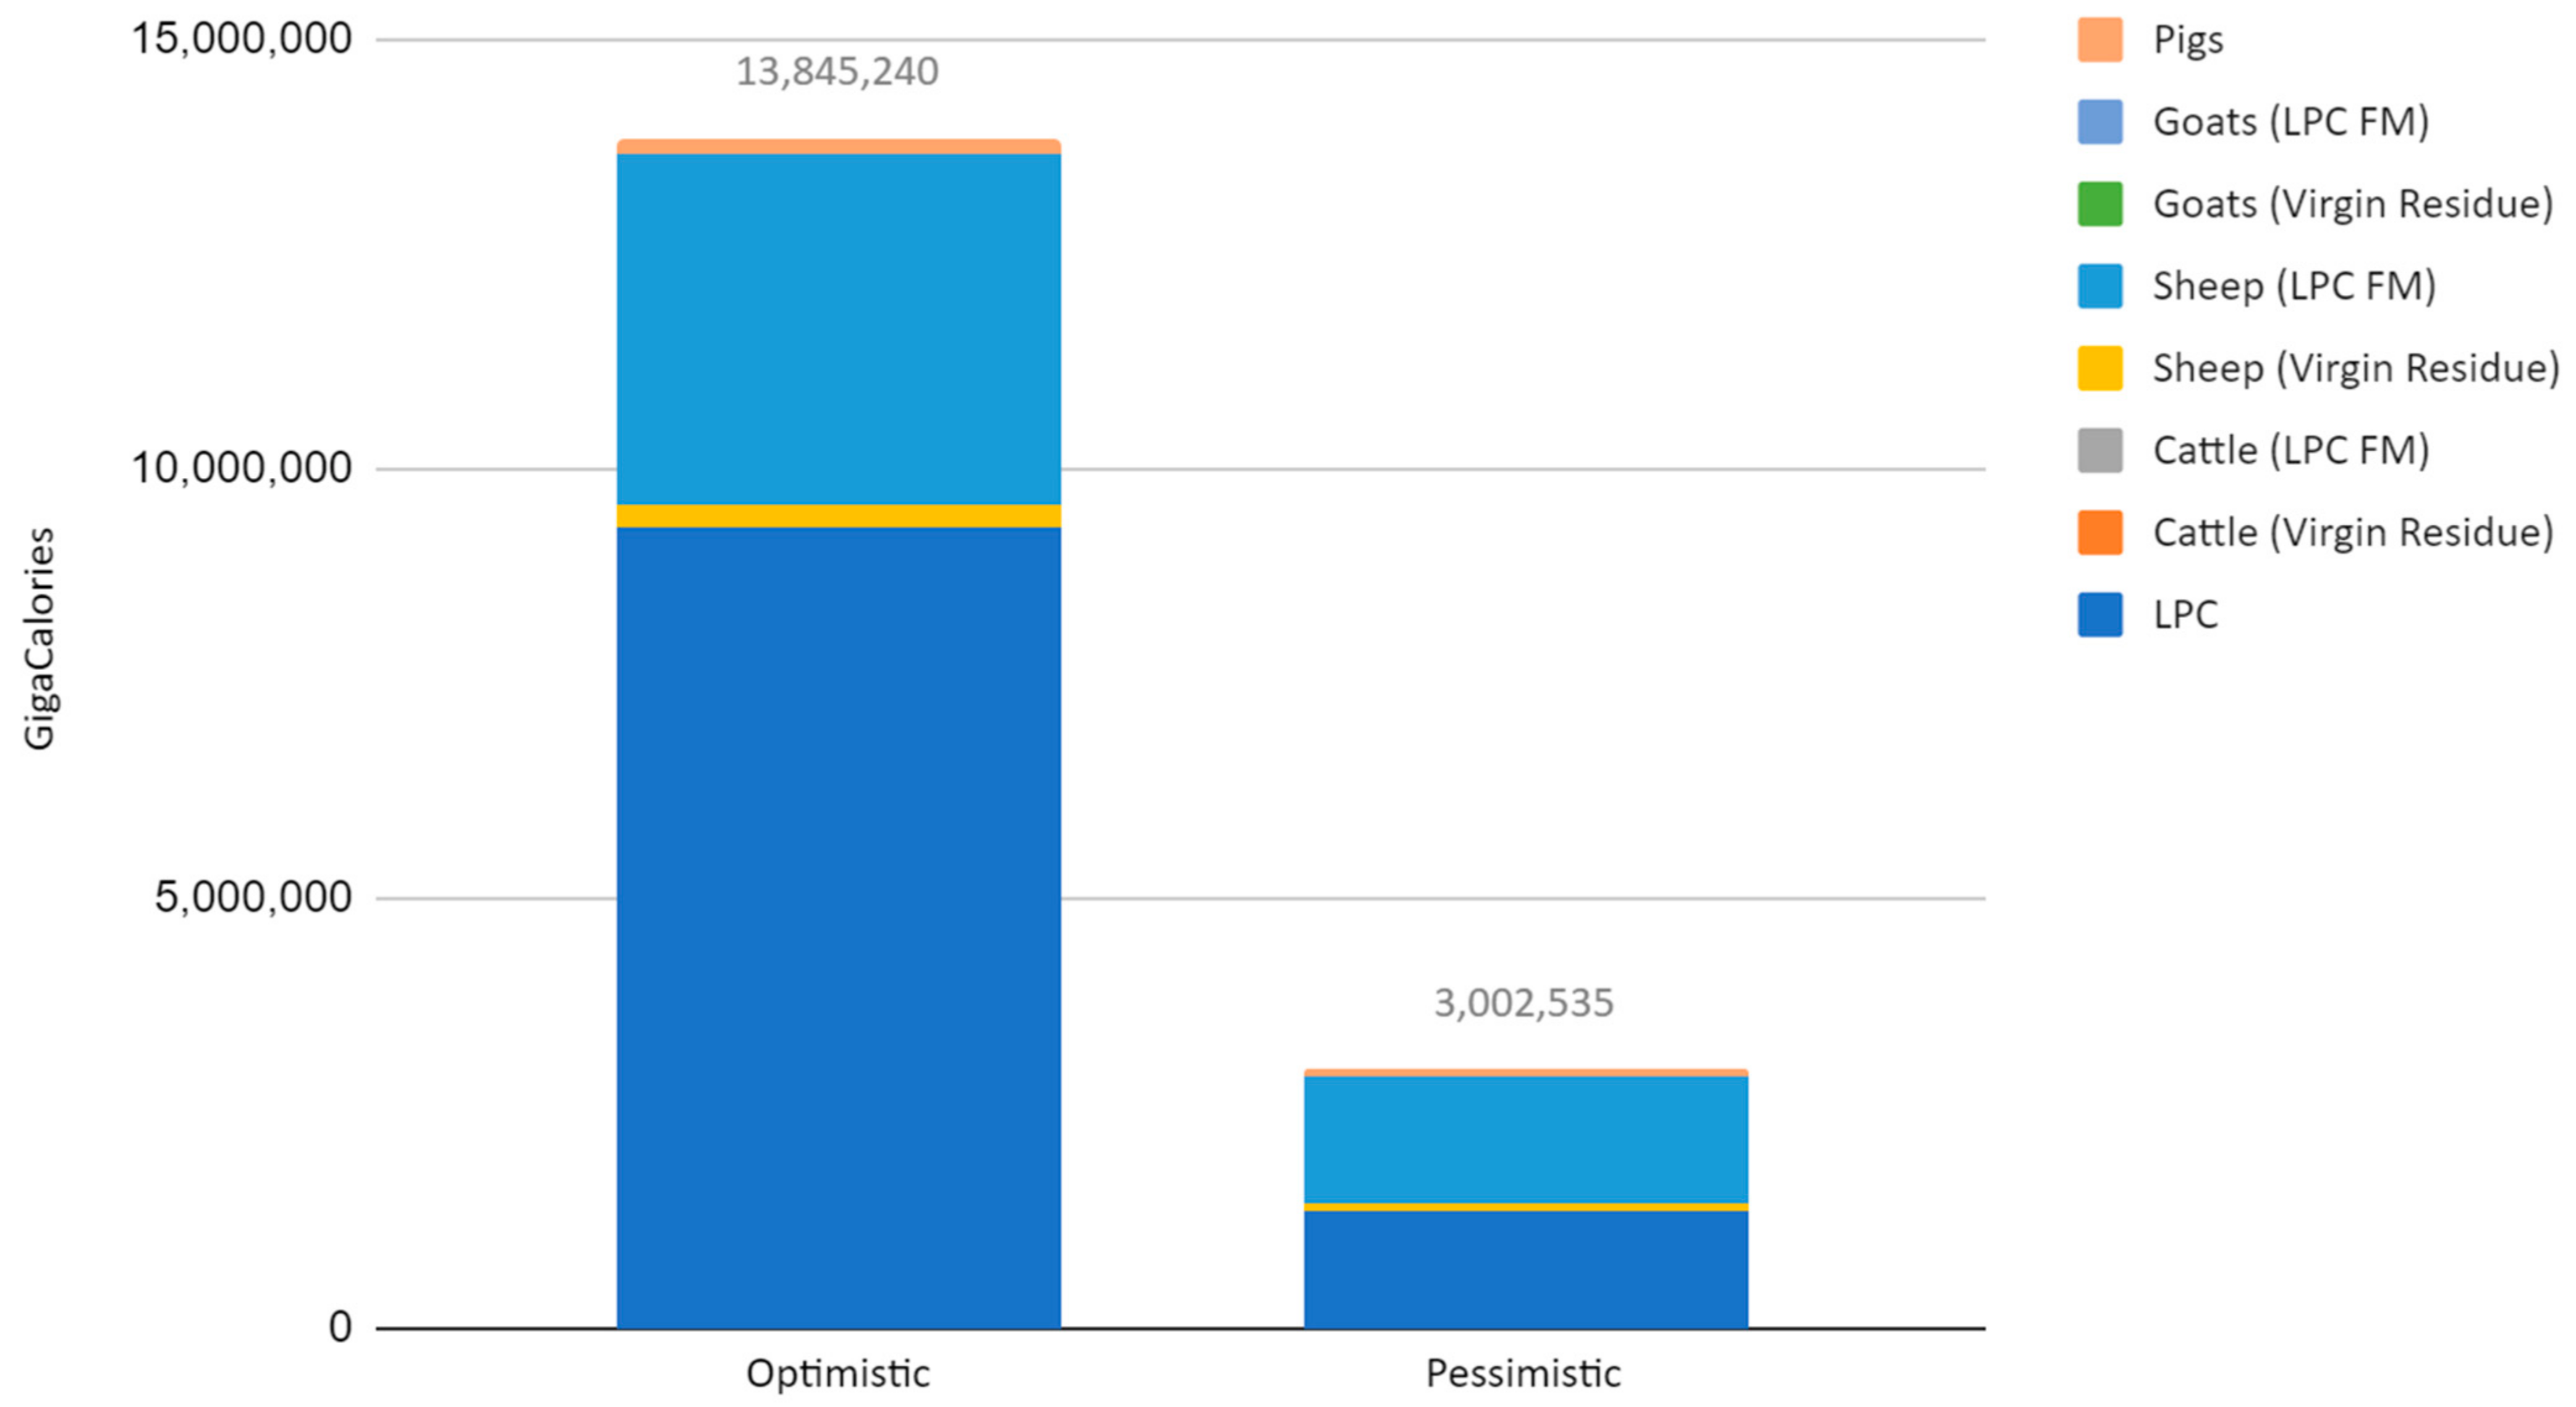
To demonstrate an improvement in total calories available from residues by the proposed utilization strategy, a status quo food production value was calculated. Livestock production numbers for Nigeria in 2012 (tons of meat per year) [66] (Figure 3) and existing FCR and metabolizable energy data were used to infer the allocation of available residues per year for each livestock category (Table 1 and Table 3), which was then used to adjust proposed residue utilization cases (Table A6 and Table A7, Appendix B). All calorie production for the status quo was assumed to be meat.
The above cases demonstrate an additional 13.8 million and 3.0 million Gcal available in Nigeria per year for the optimistic and pessimistic cases, respectively (Figure 3). To better demonstrate the potential to alleviate food insecurity, additional calorie availability was converted to additional yearly energy requirements, meeting the FAO-recommended daily calorie intake of 2100 kcal per person. The additional calories would be able to provide between 18.0 million and 3.92 million additional people with the FAO-recommended daily calorie intake for a year (Table A8). Finally, the potential to bridge Nigeria’s national food gap (calorie deficit) was calculated using the following equation:
F G c o v e r e d = E t o t a l 365 F G P
where F G c o v e r e d is the food gap covered; E t o t a l   is the status quo-corrected total energy for the improved residue utilization case, FG is the daily food gap, reported at 354.5 (kcal/day/capita) in 2020 [67]; P is population, reported at 219 million [68]. Converting to percentages, this demonstrates that the improved residue utilization could cover between 10% and 48% of Nigeria’s food gap (Table A9).

4. Discussion

An important consideration beyond the scope of this article is the nutritional quality of calories gained from LPC and livestock fed on residues. The food sources investigated in this paper are high protein (LPC) and high protein and high fat (livestock). As such, the calories from these food sources have greater utility in meeting basic nutrient requirements than from plants; i.e., they can aid in meeting a “balanced food basket” calorie consumption of 2100 kcal per person per day, as represented by the following macronutrient ranges: protein 52.5–78.7 g, fats 35–70 g, and carbohydrates 315–367 g [69]. Furthermore, the production of such nutritional calories within the region, as opposed to the transportation of food aid, also decreases logistical challenges.
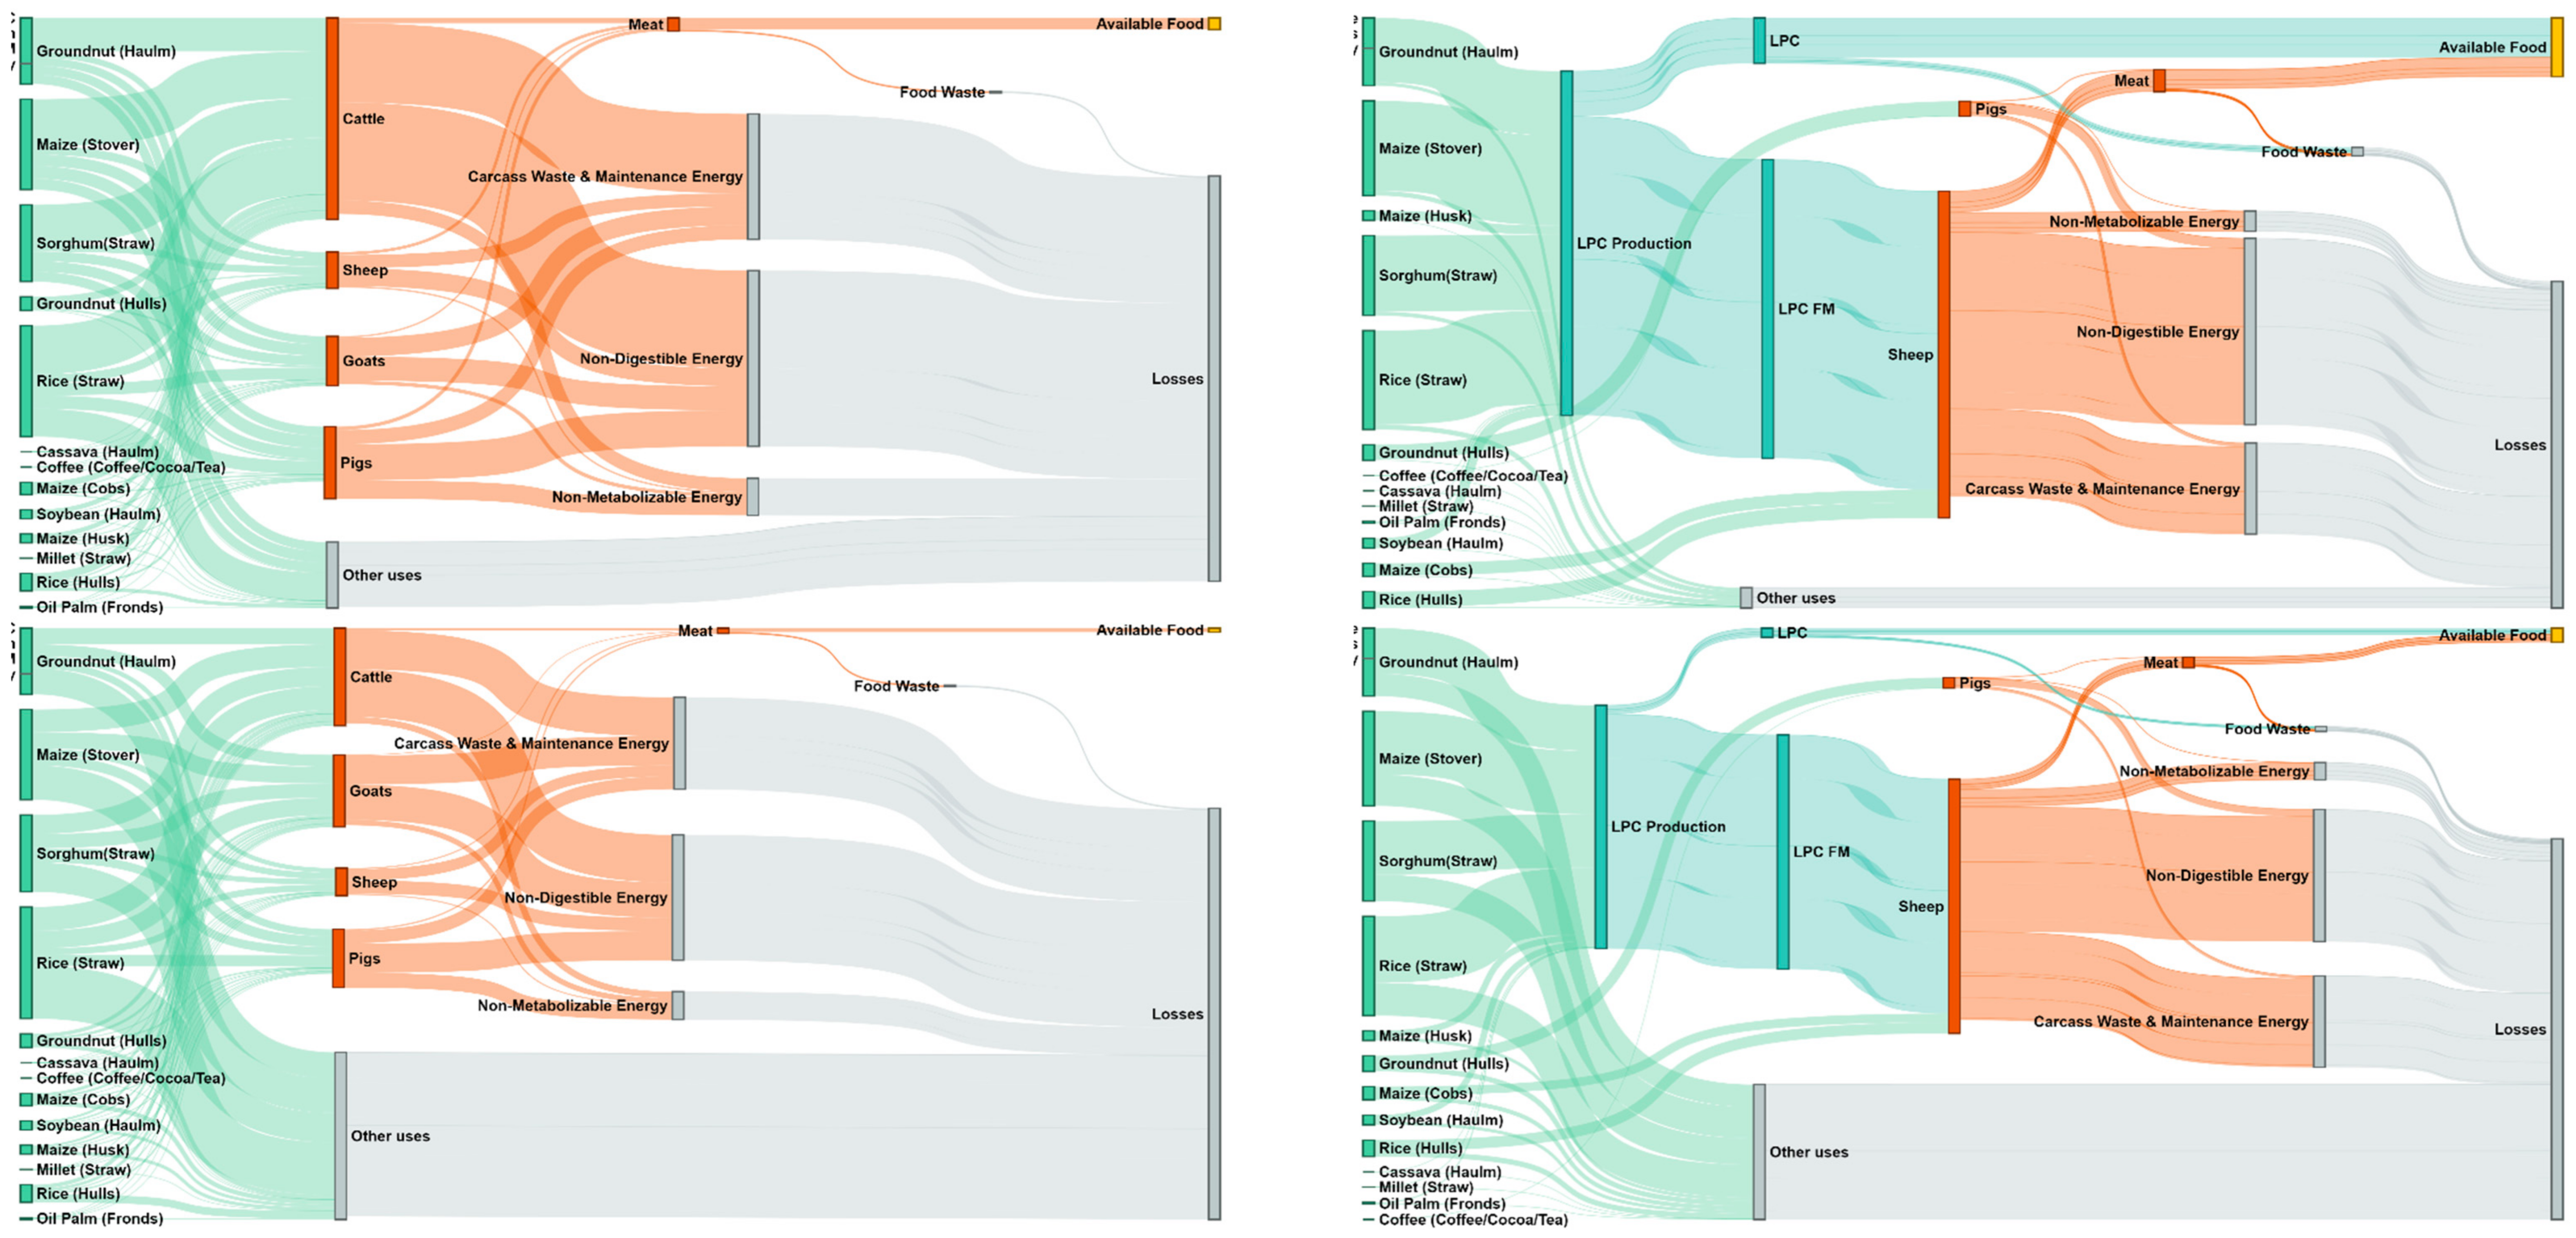
The analyses captured in the energy flow diagrams (Figure 4) reutilize LPC FM (hemicellulose and cellulose) and water-soluble calories left over from LPC extraction by feeding to ruminants/pigs. The nutritional quality of LPC FM was assumed to be sufficient to achieve an equivalent FCR to animals fed virgin residues. In reality, the nutritional value would be lower than for virgin residues, due to the bulk of crude protein and fat being extracted, along with some of the partially water-soluble carbohydrates. As ruminants can use energy stored as cellulose or hemicellulose, caloric requirements will likely be met; however, protein, fat and other key macronutrients, anticipated to be significantly lower post-processing, may become growth limiting. Future research conducted to determine the expected nutritional content of LPC FM produced from various crops via a specified method (the production method impacts the nutrient content of LPC FM) will allow an accurate account of total residue nutritional value to be determined. Feeding trials of animals on LPC FM diets would allow an accurate FCR to be determined, forming a base to investigate strategies to improve animal performance on LPC FM, such as combining LPC FM with various virgin residues or supplementing with ammonia.
It is assumed that harvested residues will be either (1) processed into LPC, with the remainder of LPC FM consumed by cattle then returned to fields as manure, or (2) eaten by animals grazing residues in the fields. In either case, a significant portion of carbon content can be returned to soil (as animals cannot digest the lignin, which is the long-lived soil carbon) in order to maintain productive soil characteristics. Nutrient content may diminish over time and have to be replaced by fertilizers.
The utilization of residues appears variable in Nigeria depending on residue types and farmer practices. A survey conducted with farmers in the Irepodun Local Government Area showed that 53.7% of respondents did not utilize farm wastes, including maize cobs, husks and stalk, soybean straw and pods, and cassava stalk and leaves [70]. A separate survey reported a utilization of ~40% for cereals and ~94% for legumes [65]. Groundnut Haulm already makes up 80% of livestock feed in Nigeria in certain areas [65]. These results highlight the uncertainty in practical residue availability as opposed to hypothetical residue availability. Future research that performs increased surveying to more accurately determine current contributions to residues in food production would be valuable.
The above method only considered the production of meat from livestock, with milk production considered beyond the scope of the paper. As calorie production from milk is comparatively efficient compared to meat production, the values obtained are likely lower than would be possible for a herd with some proportion of milk-producing animals. The incorporation of milk production as well as chicken meat and egg production would represent a valuable improvement to the proposed methodology.

5. Policy Implications

The above analysis method demonstrated that between 3.0 million and 13.8 million Gcal of food could be available in Nigeria per year with the utilization of LPC production and livestock, pending toxicity testing of LPC. These calories could feed between 3.9 million and 18.1 million additional people, even with the FAO-recommended daily calorie intake of 2100 kcal, for one year. If implemented now, this would meet between 10% and 48% of Nigeria’s current total food deficit (Table A9) of 354.5 kcal per person per day [67].
This method could be expanded globally by developing an assessment tool in which residue numbers are input, automatically converted to additional food availability under given production methods and then stored in a global database. Data could be geographical linked to create a world map of additional food stores held as residues. This would allow the improved management of residue resources and the advanced planning of how residue can be converted into food in the present or during a global catastrophe. The database could be updated as new information is made available, e.g., updating numbers on the conversion efficiency of residues to LPC, the nutritional content of specific LPC, the FCR of animals on a given LPC FM, etc., allowing the anticipated food availability from residues to increase in accuracy over time.
One of the clearest conclusions of this work is the need for additional toxicity testing of both the crop residue and LPC from the crop residue. Although the total calories available for each process for each crop residue were calculated here, the food may not be edible because of its potential toxicity or may have reduced value due to antinutritional factors. To overcome this challenge, future work can use LPC toxicity testing following protocols established for the LPC of tree leaves [71].
Although LPC production using commonly available tools could be initiated immediately, the development of low-cost community scale production equipment would drastically increase the efficiency of production and yield. The adaptation of continuous extrusion processes commonly used in commercial food production to LPC represents a potentially valuable direction of research [72]. Such an extruder would allow the various LPC production steps (grinding, the separation of LPCFM, the coagulation of LPC from leaf juice, and the pressing of LPC) to be achieved in a continuous process and by a single piece of equipment. Utilizing open-source and DIY paradigms in an LPC extruder design would increase accessibility to food-insecure groups aiming to increase the efficiency of production.
In addition, it may be possible to extract human-edible calories out of toxic agricultural residue by feeding it to animals. As seen in Table 2, there are considerable edible calories for animals. Future work is needed to determine the potential for animals to convert all of the residue to meat, eggs and milk for human consumption and then compare this source with direct eating and LPC. Milk production is more efficient than meat production in terms of calories, which could influence the optimal distribution of residues. In addition, there may be other conversion methods that could prove viable, such as the use of bacteria or fungi to consume toxic agricultural residue, which warrants exploration. Determining how best to distribute available residues among various production methods to create an adequate diet during times of disasters is also required to ensure an effective response at the onset of a disaster.
The long-term sustainability of this approach must be considered, as most of the residues play a vital role in maintaining soil health, by minimizing erosion and increasing soil moisture retention due to the increased carbon content from decomposed residues. The residues are currently sometimes ploughed under or left to decompose on top of the fields. This is crucial for humus/topsoil and using this approach could be a poor trade-off if, for instance, a community used most of the agricultural residues to fight off hunger today, only to find regions suffering from hunger with reduced yields and more problems in a few years. So long as lignin, which would remain intact following LPC production and consumption by ruminants, is returned to the soil as manure, sufficient soil quality may be maintained.
Substantial future work is needed in this area before making policy suggestions regarding the immediate use of agriculture residue to feed today’s hungry in Nigeria, sub-Saharan Africa and the rest of the world. That said, the use of agricultural residues in a severe global catastrophe would be warranted, regardless of the impact on soil, to help humanity survive through the first year, until other sources of resilient foods have scaled up to provide food for all of humanity.

6. Conclusions

Agricultural residues can provide edible calories to humans via indirect consumption by feeding them to ruminants to provide meat for humans or by processing them into LPC. Currently the potential of agricultural residues to feed humans is underutilized. Thus, improving the utilization of agricultural residues could address the acute food insecurity experienced by millions of people at present or provide a critical food source during a severe food system shock. To test the potential of agricultural residues to increase caloric availability, this study developed a new methodology to quantify the potential calories available from agricultural residues as resilient foods. The methodology was applied to residue data obtained from two communities in Nigeria to obtain a pessimistic and an optimistic case for human-edible calories gained. The results found that between 3.0 and 13.8 million additional Gcal of human-edible food are available in Nigeria per year by harvesting and converting agricultural residues to resilient foods. This could feed an additional 3.9 to 18.1 million people given the FAO-recommended daily calorie intake of 2100 kcal, for a year and bridge between 10% to 48% of Nigeria’s calorie deficit. The results demonstrate the potential of agricultural residues to address food insecurity by improved utilization. This highlights the improved capacity to convert agricultural residues to human-edible calories via improved agricultural residue management, the deployment of LPC production processes and the expedition of toxicity testing of LPC samples to demonstrate food safety.

Author Contributions

Conceptualization, D.D. and J.M.P.; methodology, B.U., R.T. and A.M.; validation, B.U., R.T. and A.M.; formal analysis, B.U., R.T. and A.M.; investigation, B.U., R.T. and A.M.; resources, D.D. and J.M.P.; data curation, B.U., R.T. and A.M.; writing—original draft preparation, B.U., R.T., A.M., D.D. and J.M.P.; writing—review and editing, B.U., R.T., A.M., D.D. and J.M.P.; visualization, B.U., R.T. and A.M; supervision, D.D. and J.M.P.; project administration, D.D. and J.M.P.; funding acquisition, D.D. and J.M.P. All authors have read and agreed to the published version of the manuscript.

Funding

This research was supported by the Thompson Endowment and ALLFED.

Data Availability Statement

No new data were created or analyzed in this study. Data sharing is not applicable to this article.

Acknowledgments

The authors give their thanks Alexander Vocaet.

Conflicts of Interest

The authors declare no conflict of interest.

Appendix A

Table A1. Available crop residue as a function of a community using rainfed low input agriculture.
SettlementStateGeopolitical ZoneCrop TypeResidue Type/Viable FeedstockHarvested Land [1000 ha] GAEZAve Productivity/Yield [t/ha*year] IRENA 2Production [t/year]Residue to Product Ratio (RPR)
JajimajiYobeNortheastGroundnutHaulm 0.020.122.3
GroundnutHusk0.020.120.477
MilletStraw0.070.2141.75
MaizeCob0.010.330.273
MaizeStover0.010.332
MaizeHusk0.010.330.2
KonkonYobeNortheastGroundnutHaulm0.140.1142.3
GroundnutHusk0.140.1140.477
MilletStraw0.450.2901.75
MaizeCob0.110.3330.273
MaizeStover0.110.3332
MaizeHusk0.110.3330.2
BuskuriBauchiNortheastGroundnutHaulm0.790.43162.3
GroundnutHusk0.790.43160.477
MilletStraw1.380.68281.75
MaizeCob0.731.39490.273
MaizeStover0.731.39492
MaizeHusk0.731.39490.2
SoybeanStraw0.030.5152.66
Cassava (cassava, yams and other roots and plantains)Stalk0.760.21520.4
GodeberiKwaraNorth CentralGroundnutHaulm0.110.3332.3
GroundnutHusk0.110.3330.477
MilletStraw0.040.3121.75
MaizeCob0.41.56000.273
MaizeStover0.41.56002
MaizeHusk0.41.56000.2
SoybeanStraw0.160.4642.66
Cassava (cassava, yams and other roots and plantains)Stalk0.171.32210.4
RiceStraw0.351.13851.69
RiceHusk0.351.13850.267
Mua (Ekokan-mua)OyoSouthwestGroundnutHaulm0.20.3602.3
GroundnutHusk0.20.3600.477
MilletStraw0.080.3241.75
MaizeCob0.711.49940.273
MaizeStover0.711.49942
MaizeHusk0.711.49940.2
SoybeanStraw0.280.41122.66
Cassava (cassava, yams and other roots and plantains)Stalk0.451.25400.4
RiceStraw0.621.16821.695
RiceHusk0.621.16820.267
OgbeKogiNorth CentralGroundnutHaulm0.150.4602.3
GroundnutHusk0.150.4600.477
MilletStraw0.090.3271.75
MaizeCob0.551.79350.273
MaizeStover0.551.79352
MaizeHusk0.551.79350.2
SoybeanStraw0.220.51102.66
Cassava (cassava, yams and other roots and plantains)Stalk0.171.93230.4
RiceStraw0.4814801.695
RiceHusk0.4814800.267
IsanluKogiNorth CentralGroundnutHaulm0.210.4842.3
GroundnutHusk0.210.4840.477
MilletStraw0.10.3301.75
MaizeCob0.791.713400.273
MaizeStover0.791.713402
MaizeHusk0.791.713400.2
SoybeanStraw0.310.51552.66
Cassava (cassava, yams and other roots and plantains)Stalk0.251.94750.4
RiceStraw0.741.18141.695
RiceHusk0.741.18140.267
KalmaloSokotoNorthwestGroundnutHaulm0.020.242.3
GroundnutHusk0.020.240.477
MilletStraw0.090.4361.75
MaizeCob0.020.7140.273
MaizeStover0.020.7142
MaizeHusk0.020.7140.2
GiereSokotoNorthwestGroundnutHaulm0.190.3572.3
GroundnutHusk0.190.3570.477
MilletStraw0.660.42641.75
MaizeCob0.160.81280.273
MaizeStover0.160.81282
MaizeHusk0.160.81280.2
FaruKatsinaNorthwestGroundnutHaulm0.160.3482.3
GroundnutHusk0.160.3480.477
MilletStraw0.570.52851.75
MaizeCob0.1711700.273
MaizeStover0.1711702
MaizeHusk0.1711700.2
SoybeanStraw0.010.442.66
Okun-OwaOgunSouthwestMaizeCob0.250.82000.273
MaizeStover0.250.82002
MaizeHusk0.250.82000.2
SoybeanStraw0.020.242.66
Cassava (cassava, yams and other roots and plantains)Stalk0.11.21200.4
Coffee (Coffee/Cocoa/Tea)Husk0.670.32011
RiceStraw0.050.7351.695
RiceHusk0.050.7350.267
Oil PalmFiber1.820.35460.14
Oil PalmShell1.820.35460.065
Oil PalmEmpty bunches1.820.35460.23
MokolokiOgunSouthwestMaizeCob0.20.91800.273
MaizeStover0.20.91802
MaizeHusk0.20.91800.2
SoybeanStraw0.010.222.66
Cassava (cassava, yams and other roots and plantains)Stalk0.011.3130.4
Coffee (Coffee/Cocoa/Tea)Husk0.550.31651
RiceStraw0.040.9361.7
RiceHusk0.040.9360.267
Oil PalmFiber1.50.46000.14
Oil PalmShell1.50.46000.065
Oil PalmEmpty bunches1.50.46000.23
Onyen-OkponCross RiverSouth GroundnutHaulm0.040.142.3
GroundnutHusk0.040.140.477
MaizeCob0.280.92520.273
MaizeStover0.280.92522
MaizeHusk0.280.92520.2
SoybeanStraw0.050.2102.66
Cassava (cassava, yams and other roots and plantains)Stalk0.851.512700.4
Coffee (Coffee/Cocoa/Tea)Husk0.510.42041
RiceStraw0.491.36371.7
RiceHusk0.491.36370.267
Oil PalmFiber2.790.616700.14
Oil PalmShell2.790.616700.065
Oil PalmEmpty bunches2.790.616700.23
2 International Renewable Energy Agency (IRENA).
Table A2. Edibility of agricultural residue [50]. * indicates residue information obtained from separate source.
Crop TypeResidue TypeForage Feedipedia
Cassava (cassava, yams and other roots and plantains)StalkCassava foliage (stems and leaves): crude protein, crude fiber, neutral detergent fiber (NDF), acid detergent fiber (ADF), lignin, ether extract, ash, starch (polarimetry), total sugars, and minerals (Ca, P, K, Na, Mg and trace elements).
Coffee (Coffee/Cocoa/Tea)HuskCoffee husk: crude protein, NDF and ADF, and minerals (Ca and P) * [51]. Coffee leaves: crude protein, crude fiber, ether extract, ash and minerals (Ca, P, K, Na and Mg).
GroundnutHuskPeanut husks or hulls: crude protein, crude fiber, neutral detergent fiber (NDF), acid detergent fiber (ADF), lignin, ether extract, ash and minerals (Ca, P, K, Na, Mg and trace elements).
GroundnutHaulm (stem)Peanut haulms, hay or stover: crude protein, crude fiber, neutral detergent fiber (NDF), acid detergent fiber (ADF), lignin, ether extract, ash and minerals (Ca, P, K, Na, Mg and trace elements).
MaizeStover (leaves and stem)Maize stover: crude protein, crude fiber, neutral detergent fiber (NDF), acid detergent fiber (ADF), lignin, ether extract, ash, insoluble ash, starch (polarimetry) and minerals (Ca, P, K, Na, Mg and trace elements).
MaizeCobMaize cob: crude protein, crude fiber, neutral detergent fiber (NDF), acid detergent fiber (ADF), lignin, ether extract, ash, starch (polarimetry) and minerals (Ca, P, K, Na, Mg and trace elements).
MaizeHuskMaize husk: crude protein, crude fiber, neutral detergent fiber (NDF), acid detergent fiber (ADF), lignin, ether extract, ash, starch (enzymatic), total sugars and minerals (Ca, P, K, Na, Mg and trace elements).
MilletHuskMillet husk: crude protein, crude fiber, neutral detergent fiber (NDF), acid detergent fiber (ADF), lignin, ether extract, ash and minerals (P, K, Na and Mg).
SorghumStrawSorghum: crude protein, crude fiber, neutral detergent fiber (NDF), acid detergent fiber (ADF), lignin, ether extract, ash, minerals (Ca, P, K, Na, Mg and trace elements).
Oil PalmEmpty bunchesOil palm fronds: crude protein, crude fiber, neutral detergent fiber (NDF), acid detergent fiber (ADF), lignin, ether extract, ash, minerals (Ca, P, K, Na, Mg and trace elements).
Oil PalmFiberPalm press fiber: crude protein, crude fiber, neutral detergent fiber (NDF), acid detergent fiber (ADF), lignin, ether extract, ash and minerals (Ca, P, K, Na, Mg and trace elements).
RiceStrawRice straw: crude protein, crude fiber, neutral detergent fiber (NDF), acid detergent fiber (ADF), lignin, ether extract, ash and minerals (Ca, P, K, Na, Mg and trace elements).
RiceHuskRice hull: Crude protein, crude fiber, neutral detergent fiber (NDF), acid detergent fiber (ADF), lignin, ether extract, ash, starch (polarimetry) and minerals (Ca, P, K, Na, Mg and trace elements).
SoybeanStrawSoybean straw: crude protein, crude fiber, neutral detergent fiber (NDF), acid detergent fiber (ADF), lignin, ether extract, ash, starch (polarimetry) and minerals (Ca, P, K, Na, Mg and trace elements).
Table A3. Macronutrient composition and calculated energy values of standard food products.
Food ProductMacronutrient Content (% of Product)ReferenceTotal Energy [kcal/g Product]
ProteinFatCarbohydrate
LPC36.46%12.67%32.26%[64]3.89
Beef27.29%15.01%0.00%[57]2.44
Pork27.34%17.04%0.00%[57]2.63
Lamb24.32%20.77%0.00%[57]2.84
Goat20.60%2.31%0.00%[57]1.03
Table A4. Energy content of residues and conversion factors of cattle, sheep, goats and pigs.
Crop TypeGE [MJ/kg]Ruminant DE [MJ/kg]Ruminant ME [MJ/kg]Ruminant DE/GERuminant ME/DEPig DE [MJ/kg]Pig ME [MJ/kg]
Cassava (Haulm)19.713.210.40.670.7912.511.6
Coffee (Coffee/Cocoa/Tea)19.5----6.5-
Groundnut (Haulm)17.89.87.90.550.816.6-
Groundnut (Hulls)19.83.42.70.170.796.4-
Maize (Stover)18.210.38.40.570.82--
Maize (Cobs)18.58.46.90.450.82--
Maize (Husk)18.511.79.60.630.82--
Millet (Straw)17.79.57.70.540.81--
Sorghum (Straw)18.110.98.80.60.81--
Oil Palm (Fronds)16.76.95.70.410.83--
Rice (Straw)15.57.25.80.460.815.4-
Rice (Hulls)16.33.730.230.81--
Soybean (Haulm)199.47.50.490.8--
Table A5. Energy content of LPCFM.
Crop TypeLPCFM Adjusted Gross Energy (GE); [MJ/kg]LPCFM Adjusted Digestible Energy (DE) Ruminants; [MJ/Kg]LPCFM Adjusted Metabolizable Energy (ME) Ruminants; [MJ/kg]
UpperLowerUpperLowerUpperLower
Cassava (Haulm) 17.41910.912.58.19.7
Coffee (Coffee/Cocoa/Tea)17.218.8
Groundnut (Haulm)15.517.17.59.15.67.2
Groundnut (Hulls)17.519.11.12.70.42
Maize (Stover)15.917.589.66.17.7
Maize (Cobs) 16.217.86.17.74.66.2
Maize (Husk)16.217.89.4117.38.9
Millet (Straw) 15.4177.28.85.47
Sorghum (Straw) 15.817.48.610.26.58.1
Oil Palm (Fronds)14.4164.66.23.45
Rice (Straw)13.214.84.96.53.55.1
Rice (Hulls)1415.61.430.72.3
Soybean (Haulm)16.718.37.18.75.26.8
Table A6. Status Quo Case: equivalent amounts of residues split between livestock, according to Nigeria’s 2012 meat production.
Production MethodHerd SizeTons Meat Per Animal in 2012Carcass Waste Weight Per AnimalAverage Digestible Energy Per Residue Type for AnimalResidue Consumed to Match 2012 Meat Production for Nigeria (Low Efficiency) [Tons]Residues Consumed to Match 2012 Meat Production for Nigeria (High Efficiency) [Tons]Fraction of Total Feed Used to Meet Reported Meat Production (Lower)Fraction of Total Feed Used to Meet Reported Meat Production (Upper)100% of Residues Go to Livestock Now (Lower) [Tons/Year]100% of Residues Go to Livestock Now (Upper) [Tons/Year]100% Residues to Livestock Calories (Lower) [Gcal]100% Residues to Livestock Calories (Upper) [Gcal]
Cattle (Virgin Residue)20,700,000392,000123.791,070,220,526896,083,9060.40480.5893295,879.5729,513.5722,6861,781,837
Pigs6,500,000249,00046.06483,189,260242,851,0380.18280.1597187,943.9463,390.0493,7661,217,418
Sheep (Virgin Residue)42,500,000197,25712.19300,876,439162,206,0250.11380.1067148,888.3367,095.6423,1561,043,322
Goats (Virgin Residue)80,800,000270,74315.19789,697,464219,368,4240.29870.1443204,355.6503,854.3210,875519,927
Table A7. Total human-edible calories produced—status quo corrected.
Status Quo Production Methods for Total Human-Edible Calories [Gcal]
Conversion EfficiencyLPCCattle (Virgin Residue)Cattle (LPC FM)Sheep (Virgin Residue)Sheep (LPC FM)Goats (Virgin Residue)Goats (LPC FM)PigsTotal
Optimistic01,550,0000908,0000452,00001,060,0003,970,000
Pessimistic0506,0000296,000063,3000346,0001,210,000
Table A8. Total additional people with yearly calorie requirements met—status quo corrected.
Total Additional Yearly Calorie Requirements of 2100 kcal Per Day
Conversion EfficiencyLPCCattle (Virgin Residue)Cattle (LPC FM)Sheep (Virgin Residue)Sheep (LPC FM)Goats (Virgin Residue)Goats (LPC FM)PigsTotal
Optimistic12,100,00000377,0005,300,00000246,00018,100,000
Pessimistic1,800,00000106,0001,940,0000064,3003,920,000
Table A9. Optimistic vs Pessimistic total Gcal per year—status quo corrected.
Total Human-Edible Calories Produced by Improved Residue Utilization Factoring in Status Quo Residue Utilization [Gcal]
CaseLPCCattle (Virgin Residue)Cattle (LPC FM)Sheep (Virgin Residue)Sheep (LPC FM)Goats (Virgin Residue)Goats (LPC FM)PigsTotal
Optimistic9,300,00000289,0004,060,00000188,00013,800,000
Pessimistic1,380,0000081,0001,490,0000049,3003,000,000
Table A10. % of Nigeria’s national food gap met per category for residue utilization cases—status quo corrected.
% of Nigeria national Food Gap (2020 food Gap = 354.5 kcal/Person/Day 3) (2021 Population = 219 Million 4)
CaseLPCCattle (Virgin Residue)Cattle (LPC FM)Sheep (Virgin Residue)Sheep (LPC FM)Goats (Virgin Residue)Goats (LPC FM)PigsTotal
Optimistic320011400148
Pessimistic5000500010
3 Nigeria food gap per capita (kcal/day) as reported in USDA International Food Security Assessment 2020–2030 Table A9. Page 34. [66]. 4 Nigeria population as reported in July 2021 by the CIA world fact book [67].

Appendix B. Status Quo Residue Utilization and Status Quo Adjusted Cases

Status quo energy availability was calculated by the below procedure to obtain values reported in Table A6. Status quo values were then used to adjust improved residue utilization cases such that improved residue utilization cases reflect improvement from status quo (Table A6, Table A7, Table A8 and Table A9).
Status quo cases were determined by calculating the following procedure:
1. Herd characteristics and corresponding meat production for major livestock classes (cattle, pigs, sheep, goats) for Nigeria in 2012 were obtained from [66]
2. Average digestible energy per residue for animal type was determined by obtaining the weighted average of residues consumable by a given livestock class i.e., ruminant (cattle, sheep, goat) or pig.
3. Residues (tonnes) required to produce reported meat (tonnes) per livestock category from 1. was calculated used Equation (2) for both optimistic and pessimistic efficiency values (Table 3).
4. Fraction of total residues used per livestock category to meet reported meat production was determined for both optimistic and pessimistic case.
5. Status quo food availability (Gcal/year) per livestock class for optimistic and pessimistic case was then calculated using total yearly available residue values and values obtained from 4. and 2.
Status quo correction of improved residue utilization values:
6. Status Quo-Total Food production (Gcal/year) was divided by improved utilization case-Total Food production (Gcal/year) to obtain a status quo correction factor, this was undertaken for both optimistic and pessimistic efficiency values.
7. Status quo correction factor was then applied to individual food production method outputs (Gcal/year) for improved utilization cases e.g., LPC, Sheep (virgin residues etc.) such that status quo corrected values represent increase from status quo utilization case.

References

  1. FAO; IFAD; UNICEF; WFP; WHO. The State of Food Security and Nutrition in the World 2017: Building Resilience for Peace and Food Security; FAO: Rome, Italy, 2017; ISBN 978-92-5-109888-2. [Google Scholar]
  2. Food Security Information Network (FSIN). Global Report on Food Crises; FSIN: Rome, Italy, 2020. [Google Scholar]
  3. Lee, Y.S.; Kim, T.H. Household Food Insecurity and Breakfast Skipping: Their Association with Depressive Symptoms. Psychiatry Res. 2019, 271, 83–88. [Google Scholar] [CrossRef] [PubMed]
  4. Becker, C.B.; Middlemass, K.; Taylor, B.; Johnson, C.; Gomez, F. Food Insecurity and Eating Disorder Pathology. Int. J. Eat. Disord. 2017, 50, 1031–1040. [Google Scholar] [CrossRef] [PubMed]
  5. Shankar, P.; Chung, R.; Frank, D.A. Association of Food Insecurity with Children’s Behavioral, Emotional, and Academic Outcomes: A Systematic Review. J. Dev. Behav. Pediatr. 2017, 38, 135–150. [Google Scholar] [CrossRef] [PubMed]
  6. Davison, K.M.; Marshall-Fabien, G.L.; Tecson, A. Association of Moderate and Severe Food Insecurity with Suicidal Ideation in Adults: National Survey Data from Three Canadian Provinces. Soc. Psychiatry Psychiatr. Epidemiol. 2015, 50, 963–972. [Google Scholar] [CrossRef]
  7. Koyanagi, A.; Stubbs, B.; Oh, H.; Veronese, N.; Smith, L.; Haro, J.M.; Vancampfort, D. Food Insecurity (Hunger) and Suicide Attempts among 179,771 Adolescents Attending School from 9 High-Income, 31 Middle-Income, and 4 Low-Income Countries: A Cross-Sectional Study. J. Affect. Disord. 2019, 248, 91–98. [Google Scholar] [CrossRef]
  8. Valdes, P. Built for Stability. Nat. Geosci. 2011, 4, 414–416. [Google Scholar] [CrossRef]
  9. Bailey, R.; Benton, T.G.; Challinor, A.; Elliott, J.; Gustafson, D.; Hiller, B.; Jones, A.; Jahn, M.; Kent, C.; Lewis, K.; et al. Extreme Weather and Resilience of the Global Food System; Global Food Security: Swindon, UK, 2015. [Google Scholar]
  10. Gao, C.; Gao, Y.; Zhang, Q.; Shi, C. Climatic Aftermath of the 1815 Tambora Eruption in China. J. Meteorol. Res. 2017, 31, 28–38. [Google Scholar] [CrossRef]
  11. Napier, W. Hazards from Comets and Asteroids. In Global Catastrophic Risks; Oxford University Press: New York, NY, USA, 2008. [Google Scholar]
  12. Aizen, M.A.; Garibaldi, L.A.; Cunningham, S.A.; Klein, A.M. How Much Does Agriculture Depend on Pollinators? Lessons from Long-Term Trends in Crop Production. Ann. Bot. 2009, 103, 1579–1588. [Google Scholar] [CrossRef]
  13. Helfand, I. Nuclear Famine: A Billion People at Risk; International Physicians for the Prevention of Nuclear War: Somerville, MA, USA; Physicians for Social Responsibility (PSR): Washington, DC, USA, 2012. [Google Scholar]
  14. Helfand, I. Nuclear Famine: Two Billion People at Risk; National Priorities Project: Northampton, MA, USA, 2013. [Google Scholar]
  15. Denkenberger, D.C.; Pearce, J.M. Cost-Effectiveness of Interventions for Alternate Food to Address Agricultural Catastrophes Globally. Int. J. Disaster Risk Sci. 2016, 7, 205–215. [Google Scholar] [CrossRef]
  16. Rampino, M.R. Supereruptions as a Threat to Civilizations on Earth-like Planets. Icarus 2002, 156, 562–569. [Google Scholar] [CrossRef]
  17. Coupe, J.; Bardeen, C.G.; Robock, A.; Toon, O.B. Nuclear Winter Responses to Nuclear War between the United States and Russia in the Whole Atmosphere Community Climate Model Version 4 and the Goddard Institute for Space Studies ModelE. J. Geophys. Res. Atmos. 2019, 124, 8522–8543. [Google Scholar] [CrossRef]
  18. Denkenberger, D.; Pearce, J.; Taylor, A.R.; Black, R. Food without Sun: Price and Life-Saving Potential. Foresight 2019, 21, 118–129. [Google Scholar] [CrossRef]
  19. World Food Programme (WFP). Hunger Snapshots-Dataviz|WFP-VAM. Available online: https://dataviz.vam.wfp.org/Dashboards/Hunger-Snapshots-Countries (accessed on 22 March 2021).
  20. Fanzo, J. Ethical Issues for Human Nutrition in the Context of Global Food Security and Sustainable Development. Glob. Food Secur. 2015, 7, 15–23. [Google Scholar] [CrossRef]
  21. Mc Carthy, U.; Uysal, I.; Badia-Melis, R.; Mercier, S.; O’Donnell, C.; Ktenioudaki, A. Global Food Security—Issues, Challenges and Technological Solutions. Trends Food Sci. Technol. 2018, 77, 11–20. [Google Scholar] [CrossRef]
  22. Vira, B.; Wildburger, C.; Mansourian, S. Forests, Trees and Landscapes for Food Security and Nutrition: A Global Assessment Report; International Union of Forest Research Organizations (IUFRO): Bogor, Indonesia, 2015; ISBN 9783902762405. [Google Scholar]
  23. Maggio, A.; Van Criekinge, T.; Malingreau, J.P. Global Food Security: Assessing Trends in View of Guiding Future EU Policies. Foresight 2016, 18, 551–560. [Google Scholar] [CrossRef]
  24. Kyriakopoulou, K.; Dekkers, B.; van der Goot, A.J. Plant-Based Meat Analogues. In Sustainable Meat Production and Processing; Academic Press: Cambridge, MA, USA, 2018. [Google Scholar]
  25. Sun-Waterhouse, D.; Waterhouse, G.I.N.; You, L.; Zhang, J.; Liu, Y.; Ma, L.; Gao, J.; Dong, Y. Transforming Insect Biomass into Consumer Wellness Foods: A Review. Food Res. Int. 2016, 89, 129–151. [Google Scholar] [CrossRef] [PubMed]
  26. Ekesa, B.N. Selected Superfoods and Their Derived Superdiets. In Superfood and Functional Food—The Development of Superfoods and Their Roles as Medicine; IntechOpen Limited: London, UK, 2017. [Google Scholar]
  27. Martínez, J.B.G.; Pearce, J.M.; Cates, J.; Denkenberger, D. Methane Single Cell Protein: Securing Protein Supply during Global Food Catastrophes. OSF Prepr. 2020, 29. [Google Scholar] [CrossRef]
  28. García Martínez, J.B.; Egbejimba, J.; Throup, J.; Matassa, S.; Pearce, J.M.; Denkenberger, D.C. Potential of Microbial Protein from Hydrogen for Preventing Mass Starvation in Catastrophic Scenarios. Sustain. Prod. Consum. 2021, 25, 234–247. [Google Scholar] [CrossRef]
  29. Throup, J.; Bals, B.; Cates, J.; Martínez, J.B.G.; Pearce, J.M.; Denkenberger, D. Rapid Repurposing of Pulp and Paper Mills, Biorefineries, and Breweries for Lignocellulosic Sugar Production in Global Food Catastrophes. Food Bioprod. Process. 2022, 131, 22–39. [Google Scholar] [CrossRef]
  30. Alvarado, K.A.; Mill, A.; Pearce, J.M.; Vocaet, A.; Denkenberger, D. Scaling of Greenhouse Crop Production in Low Sunlight Scenarios. Sci. Total Environ. 2020, 707, 136012. [Google Scholar] [CrossRef]
  31. Meyer, T.K.; Pascaris, A.; Denkenberger, D.; Pearce, J.M. U.S. Potential of Sustainable Backyard Distributed Animal and Plant Protein Production during & after Pandemics. Sustainability 2021, 13, 5067. [Google Scholar]
  32. Krishna, J.G.; Chandrasekaran, M. Cereals. In Valorization of Food Processing By-Products; CRC Press: Boca Raton, FL, USA, 2012; ISBN 9781439848876. [Google Scholar]
  33. Edelman, M.; Colt, M. Nutrient Value of Leaf vs. Seed. Front. Chem. 2016, 4, 32. [Google Scholar] [CrossRef] [PubMed]
  34. Denkenberger, D.; Pearce, J.M. Feeding Everyone No Matter What: Managing Food Security after Global Catastrophe, 1st ed.; Elsevier: New York, NY, USA, 2014; ISBN 9780128021507. [Google Scholar]
  35. Kim, K.Y.; Chung, H.J. Flavor Compounds of Pine Sprout Tea and Pine Needle Tea. J. Agric. Food Chem. 2000, 48, 1269–1272. [Google Scholar] [CrossRef] [PubMed]
  36. Kennedy, D. Leaf Concentrate: A Field Guide for Small-Scale Programs; Leaf for Life: Interlachen, FL, USA, 1993. [Google Scholar]
  37. Fist, T.; Adesanya, A.A.; Denkenberger, D.; Pearce, J.M. Global Distribution of Forest Classes and Leaf Biomass for Use as Alternative Foods to Minimize Malnutrition. World Food Policy 2021, 7, 128–146. [Google Scholar] [CrossRef]
  38. Denkenberger, D.C.; Pearce, J.M. Feeding Everyone: Solving the Food Crisis in Event of Global Catastrophes That Kill Crops or Obscure the Sun. Futures 2015, 72, 57–68. [Google Scholar] [CrossRef]
  39. Denkenberger, D.C.; Cole, D.D.; Abdelkhaliq, M.; Griswold, M.; Hundley, A.B.; Pearce, J.M. Feeding Everyone If the Sun Is Obscured and Industry Is Disabled. Int. J. Disaster Risk Reduct. 2017, 21, 284–290. [Google Scholar] [CrossRef]
  40. Abdelkhaliq, M.; Denkenberger, D.; Griswold, M.; Cole, D.; Pearce, J. Providing Non-Food Needs If Industry Is Disabled. In Proceedings of the Integrative Risk Management-towards Resilient Cities, Davos, Switzerland, 28 August–1 September 2016. [Google Scholar]
  41. Pearce, J.M.; Denkenberger, D.C. A National Pragmatic Safety Limit for Nuclear Weapon Quantities. Safety 2018, 4, 25. [Google Scholar] [CrossRef]
  42. Trading Economics Nigeria Rural Population Percent of Total Population. Available online: https://tradingeconomics.com/nigeria/rural-population-percent-of-total-population-wb-data.html (accessed on 22 May 2019).
  43. USAID. Power Africa in Nigeria: Fact Sheet. Available online: https://www.usaid.gov/powerafrica/nigeria (accessed on 23 July 2020).
  44. Nigeria National Bureau of Statistics (NBS). NBS E-Library. Available online: https://www.nigerianstat.gov.ng/ (accessed on 26 February 2019).
  45. Food and Agriculture Organization (FAO); the International Institute for Applied Systems Analysis (IIASA). GAEZ: Global Agro-Ecological Zones. Available online: http://gaez.fao.org/Main.html# (accessed on 26 February 2019).
  46. Global Atlas Consortium. Global Atlas for Renewable Energy. Available online: https://irena.masdar.ac.ae/gallery/#gallery (accessed on 26 February 2019).
  47. Okello, C. Assessing Sustainability of Bioenergy Systems in Developing Countries: Methodological Development and Application. Ph.D. Thesis, University Of Naples Federico II, Naples, Italy, 2014; p. 210. [Google Scholar]
  48. Smil, V. Biomass Energies, 1st ed.; Plenum Press: New York, NY, USA, 1983; ISBN 9781461336914. [Google Scholar]
  49. Gómez, A.; Rodrigues, M.; Montañés, C.; Dopazo, C.; Fueyo, N. The Potential for Electricity Generation from Crop and Forestry Residues in Spain. Biomass Bioenergy 2010, 34, 703–719. [Google Scholar] [CrossRef]
  50. Feedipedia-INRAE; CIRAD; AFZ; FAO. Feedipedia: An Online Encyclopedia of Animal Feeds. Available online: https://www.feedipedia.org/ (accessed on 29 October 2020).
  51. National Dairy Development Board (NDDB). Dairy Knowledge Portal. Available online: https://www.dairyknowledge.in/article/coffee-husk (accessed on 25 November 2020).
  52. Leaf for Life Plant Species with Leaves That Have Reportedly Been Eaten by People. Available online: https://www.leafforlife.org/gen/reported-edible.html (accessed on 26 November 2020).
  53. Agricultural Research Council (ARC). The Nutrient Requirements of Farm Livestock: No 2—Ruminants. Available online: https://books.google.it/books/about/The_Nutrient_Requirements_of_Farm_Livest.html?id=WyWgwQEACAAJ&redir_esc=y (accessed on 26 November 2020).
  54. Hales, K.E. Relationships between Digestible Energy and Metabolizable Energy in Current Feedlot Diets. Transl. Anim. Sci. 2019, 3, 945–952. [Google Scholar] [CrossRef]
  55. Ames, D. Thermal Environment Affects Production Efficiency of Livestock. BioScience 1980, 30, 457–460. [Google Scholar] [CrossRef]
  56. Smil, V. Worldwide Transformation of Diets, Burdens of Meat Production and Opportunities for Novel Food Proteins. Enzym. Microb. Technol. 2002, 30, 305–311. [Google Scholar] [CrossRef]
  57. U.S. Department of Agriculture. FoodData Central. Available online: https://fdc.nal.usda.gov/ (accessed on 8 November 2021).
  58. Food and Agriculture Organization (FAO). Chapter 3: Calculation of the Energy Content of Foods—Energy Coversion Factors. Available online: http://www.fao.org/3/Y5022E/y5022e04.htm (accessed on 26 November 2020).
  59. Madziga, I.I.; Alawa, C.B.I.; Lamidi, O.S.; Goska, D.Y.; Adesote, A.A. Feedlot Assessment of Four Indigenous Breeds of Cattle in Nigeria. Int. J. Life Sci. Med. Res. 2013, 3, 35–38. [Google Scholar] [CrossRef]
  60. Agriculture and Rural Development Department. Beef Production: The Basics Useful Statistics; Agriculture and Rural Development Department: Hilo, HI, USA, 2016.
  61. Okeudo, N.J.; Aladi, N.O.; Okoli, I.C.; Akanno, E.C. Comparative Study of the Growth and Carcass Characteristics of the Nigerian Indigenous and Large White Pigs. Asian J. Anim. Sci. 2007, 1, 57–66. [Google Scholar] [CrossRef]
  62. Akinleye, S.B.; Afolabi, K.D.; Luka, J.S. Performance and Carcass Characteristics of Four Breeds of Rams in Nigeria Under Fattening Condition. J. Meat Sci. Technol. 2019, 7, 31–37. [Google Scholar]
  63. Anya, M.I.; Ozung, P.O. Performance and Carcass Characteristics of West African Dwarf (WAD) Goats Fed Cassava Peel Meal Based Diets Supplemented with African Yambean Concentrate. Int. J. Adv. Agric. Sci. Technol. 2018, 5, 95–108. [Google Scholar]
  64. Agbede, J.; Adeyeye, S.; Adegbenro, M. Nutritional, Functional Property and Bioactive Components of the Leaf Products from Edible Vegetables. Rev. Científica UDO Agrícola 2012, 12, 741–748. [Google Scholar]
  65. Akinola, A.A.; Ayedun, B.; Abubakar, M.; Sheu, M.; Abdoulaye, T. Crop Residue Usage and Its Determinants in Kano State, Nigeria. J. Dev. Agric. Econ. 2015, 7, 162–173. [Google Scholar] [CrossRef]
  66. Wisser, D.; Odunze, E.; Boussini, H.; Mikecz, O.; PicaCiamarra, U. Transforming Livestock Sectors Nigeria What Do Long Term Projects Say? Available online: https://www.fao.org/documents/card/en/c/CA3374EN/ (accessed on 8 November 2021).
  67. Baquedano, F.G.; Christensen, C.; Ajewole, K.; Beckman, J. International Food Security Assessment, 2020–2030. Available online: https://www.ers.usda.gov/publications/pub-details/?pubid=99087 (accessed on 8 November 2021).
  68. Central Intelligence Agency Nigeria-People and Society. Available online: https://www.cia.gov/the-world-factbook/countries/nigeria/ (accessed on 8 November 2021).
  69. Kakwani, N.; Son, H.H. Measuring Food Insecurity: Global Estimates. Soc. Welf. Funct. Dev. 2016, 253–294. [Google Scholar] [CrossRef]
  70. Oladipo, F.O.; Olorunfemi, O.D.; Adetoro, O.D.; Oladele, T.O. Farm Waste Utilization among Farmers in Irepodun Local Government Area, Kwara State, Nigeria: Implication for Extension Education Service Delivery. Ruhuna J. Sci. 2017, 8, 1. [Google Scholar] [CrossRef]
  71. Pearce, J.M.; Khaksari, M.; Denkenberger, D. Preliminary Automated Determination of Edibility of Alternative Foods: Non-Targeted Screening for Toxins in Red Maple Leaf Concentrate. Plants 2019, 8, 110. [Google Scholar] [CrossRef]
  72. Cornet, S.H.V.; Snel, S.J.E.; Schreuders, F.K.G.; van der Sman, R.G.M.; Beyrer, M.; van der Goot, A.J. Thermo-Mechanical Processing of Plant Proteins Using Shear Cell and High-Moisture Extrusion Cooking. Crit. Rev. Food Sci. Nutr. 2021, 62, 3264–3280. [Google Scholar] [CrossRef] [PubMed]
Figure 1. Case study communities geographically dispersed across Nigeria.
Biomass 03 00010 g001
Figure 2. Model diagram demonstrating the pathway through which one residue type could be utilized to produce calories. Total calorie availability represents the summation of the model outputs for every residue. Different efficiencies and residue utilizations can be used to construct different cases, as in Section 3.
Biomass 03 00010 g002
Figure 3. Optimistic and pessimistic case total calorie availability for Nigeria.
Biomass 03 00010 g003
Figure 4. Energy flow diagrams for the four considered residue utilization cases. Diagrams represent energy flows per year. All diagrams are to scale, and, thus, energy flows can be compared across diagrams. Top left: status quo utilization assuming optimistic efficiencies. Top right: improved utilization assuming optimistic efficiencies. Bottom left: status quo utilization assuming pessimistic efficiencies. Bottom right: improved utilization assuming pessimistic efficiencies.
Biomass 03 00010 g004
Table 1. Inputs for computing calories from agricultural residues.
LivestockFCR [kg/kg]FCR [kg/kg]FCRMEdiet [MJ/kg diet]CR [%]CR [%]CRCaloric 1 Value of Meat-Mcal [kcal/g]
LowHighReference LowHighReference
Cattle8.899.48[59]10.525056[60]2.44
Pigs3.56.5[61]10.9164.769.3[61]2.63
Sheep3.15.1[62]11.5950.256.6[62]2.84
Goats3.810.9[63]7.664050.2[63]1.03
1 See Table A3 for macronutrient compositions of standard meats for each animal type.
Table 2. Calories from agricultural residues with sources [50,51].
Crop TypeResidue TypeKnown EdibleResidue Produced in Tons/Year in NigeriaGross Energy for Dry Mass [MJ/kg]
CassavaStalkCassava stems (with starch content between 22 and 39% by dry mass): simple water-based technique (stem starch extraction), including milling, washing and sedimentation. Cassava foliage (for fodder for livestock): fed fresh and dried; sun-drying with chopping and wilting (cassava leaf meal); ensiled in pit silos (as silage); mixed with starchy cassava tubers to make nutritious food; LPC.1250 (only community data available)19.7
Coffee
(Coffee/Cocoa/Tea)
HuskCoffee pulp as a feedstuff: drying by solar dehydration, forced hot air-drying or a combination of both; ensiling with sugar cane molasses or mixed grasses, sorghum or corn. Coffee husk (livestock feed): ensiling and mixing them with energy rich feeds (e.g., cereal straws).342 (only community data available)19.5
GroundnutHaulmPeanut crop residues as livestock feed or fodder (as a supplement or as a sole feed): fed fresh, dried or ensiled.4.83 million17.8
GroundnutHuskGroundnut husk as livestock feed: milling and adding molasses and one percent urea to this ground product may improve its palatability. 1.00 million19.8
MaizeStoverStover as livestock feed: green feeding green maize stover tops; grazing; cut-and-carry after drying by stacking or baling in the field or at the farm; silage has to be chopped, moistened, well compacted and sealed (with various degrees of processing and feed supplements). These processes include physical treatments (grinding and extrusion), chemical treatments (urea, NaOH, CaO, ammonia and sulfuric acid) and biological treatments with microorganisms (fungi and bacteria) or mushrooms, such as Pleurotus ostreatus. 6.6 million18.2
MaizeCobCob as livestock fodder: by supplementation, processing or both. Supplementation with green forage or browse plants, or readily available source of carbohydrates and nitrogen such as cassava tops or peels by grinding and/or pelleting; treating maize cobs with alkali NaOH and urea. 0.90 million18.5
MaizeHuskMaize green forage: fed fresh; ensiling; grazing. 0.66 million18.2
MilletHusk/strawMillet husks as livestock feed: hard-hulled and finely grounded. Millet green forage: grazed directly by the animals or used in cut-and-carry feeding systems.2540 (only community data available)17.7
SorghumStrawSorghum straw (forage) as livestock feed: grazed (young or as deferred fodder), cut fresh (green chop), made into hay or ensiled5.60 million18.1
Oil PalmOil palm fronds Oil palm fronds as livestock feed: physical and/or mechanical processing such as chopped and fed either fresh or dried; ground; pelleted or ensiled in combination with other ingredients as total mixed rations. Other processes include pre-digestion of fiber via chemical and biological treatment and stimulation of rumen microbes by supplementation with energy and protein-rich ingredients. and supplementation with essential minerals. 0.14 million16.7
Oil PalmPalm press fiberPalm press fiber as livestock feed: dried and pelleted. Processes by supplementation with a protein source; chemical treatment (urea, ammonia and NaOH) and by manipulating the ration to optimize rumen fermentation.0.09 million23.5
RiceStrawRice straw as livestock feed: By mechanical, chemical, heat and pressure treatments/processing. Mechanical treatments: Chopping and grinding. Chemical treatments: (NaOH, ammonia and urea). Heat and pressure treatments: Steam pressure and association of steam pressure and ammonia.8.12 million15.5
RiceHuskRice hulls as livestock feed: ground and included as a roughage concentrate in feeds; ammoniation under pressure and toasting; pelleted.1.28 million16.3
SoybeanStrawSoybean forage as livestock feed: grazed, ensiled or dried to make hay 0.65 million19
Table 3. Calories and LPC FM from agricultural residues using LPC.
Crop TypeResidue TypeAvailable Tons/Year in NigeriaAvailable Residue [Tons/Year]LPC Production [Gcal/Year] at LPC% Yield [DM/DM]LPC FM Ruminant Digestible Energy [Gcal/Year]
UpperLower14%4%UpperLower
CassavaStalk1250119083664513012,90010,500
Coffee (Coffee/Cocoa/Tea)Husk342000000
GroundnutHaulm4,830,0004,590,0003,240,0002,500,000503,00034,200,00029,500,000
GroundnutHusk1,000,00000001,000,0001,830,000
MaizeStover6,600,0006,270,0004,420,0003,410,000688,00049,900,00042,600,000
MaizeCob901,00000005,180,0004,670,000
MaizeHusk660,000627,000442,000341,00068,8005,870,0004,880,000
MilletStraw254024101700131026417,20015,000
SorghumStraw5,600,0005,320,0003,750,0002,900,000584,00045,500,00038,400,000
Oil PalmOil palm Fronds141,000134,00094,30072,80014,700604,000584,000
RiceStraw8,120,0007,710,0005,440,0004,200,000846,00037,400,00035,500,000
RiceHusk1,280,00000001,650,0002,600,000
SoybeanStraw652,000619,000437,000337,00067,9004,370,0003,810,000
Table 4. Digestible energy (DE) from agricultural residues used as forage (ND is no data).
Crop TypeResidue TypeAvailable Tons/Year in NigeriaDigestible Energy (DE) of Ruminants; MJ/kgDigestible Energy (DE) of Growing Pig; MJ/kg
CassavaStalk1250 (only community data available)13.212.5
Coffee (Coffee/Cocoa/Tea)Husk342 (only community data available)ND6.5
GroundnutHaulm4.83 million9.86.6
GroundnutHusk1.00 million3.46.4
MaizeStover6.6 million11.7ND
MaizeCob0.901 million9.4ND
MaizeHusk0.66 million11.7ND
MilletStraw2540 (only community data available)9.51.1
SorghumStraw5.60 million10.9ND
Oil PalmOil palm fronds0.141 million6.9ND
RiceStraw8.12 million7.25.4
RiceHusk1.28 million3.7ND
SoybeanStraw0.652 million9.4ND
Table 5. Potential meat produced from virgin residues (Gcal is 1 billion calories).
Crop Type (Residue)Cattle Upper Gcal/YearCattle Lower Gcal/YearSheep Upper Gcal/YearSheep Lower Gcal/YearGoat Upper Gcal/YearGoat Lower Gcal/YearPigs Upper Gcal/YearPigs Lower Gcal/Year
Cassava Haulm18011455221021942672238
Coffee Coffee/Cocoa/Tea0000009634
Groundnut Haulm530,000334,0001,620,000617,000644,000126,0001,390,000491,000
Groundnut Hulls37,60023,700115,00043,70045,7008950279,00098,800
Maize Stover770,000485,0002,360,000896,000936,000183,00000
Maize Cobs86,40054,400264,000100,000105,00020,60000
Maize Husk88,00055,400269,000102,000107,00021,00000
Millet Straw2711718303163306412143
Sorghum Straw685,000431,0002,100,000797,000833,000163,00000
Oil Palm Fronds11,100702034,10013,00013,600265000
Rice Straw654,000412,0002,000,000761,000795,000156,0001,900,000675,000
Rice Hulls53,30033,600163,00062,00064,80012,70000
Soybean Haulm67,90042,800208,00079,00082,60016,20000
Table 6. Potential meat gained from ruminants fed LPC FM.
Crop Type (Residue)LPC FM Ruminant Digestible Energy Upper Gcal/YearLPC FM Ruminant Digestible Energy Lower Gcal/YearLPC FM Cattle Upper Gcal/YearLPC FM Cattle Lower Gcal/YearLPC FM Sheep Upper Gcal/YearLPC FM Sheep Lower Gcal/YearLPC FM Goat Upper Gcal/YearLPC FM Goat Lower Gcal/Year
Cassava (Haulm)12,90010,50014110641133317140
Coffee (Coffee/Cocoa/Tea)00000000
Groundnut (Haulm)34,500,00029,600,000377,000306,0001,100,000940,000459,000116,000
Groundnut (Hulls)00000000
Maize (Stover)50,300,00042,700,000561,000447,0001,600,0001,360,000682,000169,000
Maize (Cobs)00000000
Maize (Husk)5,910,0004,890,00067,10051,700188,000155,00081,60019,500
Millet (Straw)17,40015,00019115655347823259
Sorghum (Straw)45,900,00038,500,000508,000399,0001,460,0001,220,000617,000151,000
Oil Palm (Fronds)613,000586,0006690622019,50018,60081302350
Rice (Straw)37,900,00035,600,000397,000366,0001,210,0001,130,000483,000138,000
Rice (Hulls)00000000
Soybean (Haulm)4,410,0003,820,00047,30039,000140,000121,00057,50014,800
Table 7. Optimistic residue utilization case by residue type and production method. Optimistic Case by Residue and Production Method (Including Residue Usage Factor and Food Losses) [Gcal] Residue Utilization 95%; Food Wastage 13%.
ResidueLPCCattle (Virgin Residue)Cattle (LPC FM)Sheep (Virgin Residue)Sheep (LPC FM)Goats (Virgin Residue)Goats (LPC FM)Pigs
Cassava (Stalk)561000375000
Coffee/Cocoa/Tea (Husk)000000084
Groundnut (Haulm)2,170,0000001,000,000000
Groundnut (Husk)0000000242,000
Maize (Stover)2,970,0000001,490,000000
Maize (Cob)000230,0000000
Maize (Husk)297,000000179,000000
Millet (Straw)1140000508000
Sorghum (Straw)2,520,0000001,350,000000
Oil Palm (Fronds)63,30000017,800000
Rice (Straw)3,650,0000001,060,000000
Rice (Husk)000142,0000000
Soybean (Straw)293,000000126,000000
Total Calories per category [Gcal]12,000,00000372,0005,230,00000243,000
Table 8. Pessimistic residue utilization case by residue and production method. Pessimistic Case by Residue and Production Method (Including Residue Usage Factor and Food Losses) [Gcal] Residue Utilization 67%; Food Wastage 30%.
CaloriesLPCCattle (Virgin Residue)Cattle (LPC FM)Sheep (Virgin Residue)Sheep (LPC FM)Goats (Virgin Residue)Goats (LPC FM)Pigs
Cassava (Stalk)91000138000
Coffee/Cocoa/Tea (Husk)000000024
Groundnut (Haulm)352,000000396,000000
Groundnut (Husk)000000069,100
Maize (Stover)482,000000579,000000
Maize (Cob) 00070,3000000
Maize (Husk)48,20000066,800000
Millet (Straw)185000202000
Sorghum (Straw)409,000000517,000000
Oil Palm (Fronds)10,3000008,040000
Rice (Straw)592,000000473,000000
Rice (Husk)00043,4000000
Soybean (Straw)47,50000050,500000
Total
Calories per category [Gcal]
1,940,00000114,0002,090,0000069,200
Disclaimer/Publisher’s Note: The statements, opinions and data contained in all publications are solely those of the individual author(s) and contributor(s) and not of MDPI and/or the editor(s). MDPI and/or the editor(s) disclaim responsibility for any injury to people or property resulting from any ideas, methods, instructions or products referred to in the content.

