Article

Metaproteomic Analysis of the Anaerobic Community Involved in the Co-Digestion of Residues from Sugarcane Ethanol Production for Biogas Generation

by
Maria Paula. C. Volpi
1,2,*,
Larissa O. Magalhães
3,
Flávia V. Winck
3,4,
Mônica T. V. Labate
5 and
Bruna S. Moraes
1
1
Center of Energy Planning, University of Campinas (NIPE/UNICAMP), R. Cora Coralina, 330-Cidade Universitária, Campinas 13083-896, SP, Brazil
2
Interdisciplinary Research Group on Biotechnology Applied to the Agriculture and the Environment (GBMA), School of Agricultural Engineering (FEAGRI), University of Campinas (UNICAMP), Av. Candido Rondon, 501-Cidade Universitária, Campinas 13083-875, SP, Brazil
3
Institute of Chemistry, University of São Paulo (IQ-USP), Av. Prof. Lineu Prestes, 748-Butantã, São Paulo 05508-900, SP, Brazil
4
Center for Nuclear Energy in Agriculture, University of São Paulo, Av. Centenário, 303-São Dimas, Piracicaba 13400-970, SP, Brazil
5
Max Feffer Laboratory of Plant Genetics, Department of Genetics, University of São Paulo, Campus Piracicaba, Av. Pádua Dias, 235-Agronomia, Piracicaba 13418-900, SP, Brazil
*
Author to whom correspondence should be addressed.
Biomass 2022, 2(4), 358-373; https://doi.org/10.3390/biomass2040024
Submission received: 26 September 2022 / Revised: 17 November 2022 / Accepted: 22 November 2022 / Published: 5 December 2022
(This article belongs to the Topic Anaerobic Digestion Processes)

Abstract

:
The proteomics analysis could contribute to better understand about metabolic pathways in anaerobic digestion community because it still as a “black-box” process. This study aimed to analyze the proteins of the anaerobic co-digestion performed in reactors containing residues from the first and second generation ethanol production. Metaproteomics analysis was carried out for three types of samples: anaerobic sludge without substrate (SI), semi-continuous stirred reactor (s-CSTR) with co-digestion of filter cake, vinasse, and deacetylation liquor (R-CoAD) and s-CSTR with co-digestion of these aforementioned residues adding Fe3O4 nanoparticles (R-NP). The R-CoAD reactor achieved 234 NmLCH4 gVS−1 and 65% of CH4 in the biogas, while the R-NP reactor reached 2800 NmLCH4 gVS−1 and 80% of CH4. The main proteins found were enolase, xylose isomerase, pyruvate phosphate dikinase, with different proportion in each sample, indicating some change in pathways. However, according to those identified proteins, the main metabolic routes involved in the co-digestion was the syntrophic acetate oxidation coupled with hydrogenotrophic methanogenesis, with the CH4 production occurring preferentially via CO2 reduction. These findings contributed to unravel the anaerobic co-digestion at a micromolecular level, and may select a more appropriate inoculum for biogas production according to that residue, reducing reaction time and increasing productivity.

1. Introduction

Biogas production through anaerobic digestion (AD) and energy recovery from methane (CH4) are some of the ways that have been studied to generate renewable energy and reduce greenhouse gas (GHG) emissions [1]. The literature shows that the use of different wastes can be used as substrates for AD, such as restaurant food waste, agro-industrial waste, animal manure, lignocellulosic waste, and domestic sewage [2,3,4]. Among several agro-industry residues, the use of by-products from ethanol production, such as vinasse, stands out in biogas production. The vinasse is a residue with a high amount of organic matter and provides a way for integrating ethanol plants in biorefinery concepts, as it converts waste into energy [5,6].
First-generation (1G) ethanol production distilleries generate residues, in addition to vinasse, such as filter cake and sugarcane straw, which also have the huge potential to produce methane (CH4) within anaerobic digestion [7]. This fact makes sugarcane plants become biorefineries, since, in addition to producing ethanol as a biofuel, they can produce other types of bioenergy through the use of their residues. An additional strategy to produce biogas is from the residues of second-generation ethanol (2G) production from lignocellulosic residues, such as sugarcane straw [1]. To produce 2G ethanol, several pretreatments are applied to lignocellulosic materials, and Brenelli et al. [8] demonstrated the efficiency of acetic group removal through the alkaline pretreatment of sugarcane straw to produce 2G ethanol. From this process, a residue rich in acetate emerged, called deacetylation liquor, that had a high biochemical methane potential (BMP) [7]. In the work of Volpi et al. [7], in-depth investigation comparing the mono-digestion of vinasse 1G, mono-digestion of filter cake, and the addition of 2G ethanol residue were performed, and the results clearly showed that the deacetylation liquor increased the production of CH4 when placed in co-digestion with the filter cake and vinasse.
To promote the integration of 1G2G ethanol biorefineries, we previously demonstrated that the anaerobic co-digestion of vinasse and filter cake, both from the production of 1G ethanol and the deacetylation liquor (2G ethanol) in a continuous reactor, allows for the recovery of 234 NmLCH4 gVS−1 [9]. In addition, by converting the biogas produced into electricity, an installed capacity of 58 MW can be obtained for a 1G2G ethanol plant, and if this biogas is purified using biomethane, the entire truck fleet of the largest ethanol plant in Brazil can be supplied during the harvest period [10]. The co-digestion was important for the balance of nutrients in the process, mainly as the C:N ratio of the residues used and phosphorus (P) contents. For anaerobic digestion, the recommended C:N ratio can range from 10 to 40 [11]. The vinasse used in the tests had a C:N ratio, ranging from 28:1–40:1, fitting within the requirements for AD; however, the deacetylation liquor had a C:N ratio of 90:1–137:1, quite exceeding the condition considered ideal for AD [9]. On the other hand, the filter cake had a C:N ratio close to 18:1 [7], well below the recommended, reinforcing the importance of co-digestion and evidencing that the use of these three residues was beneficial to the process of obtaining CH4. The P content for vinasse and the deacetylation liquor was 9 mg L−1 and 2 mg L−1, respectively, both being at low concentrations, and thus, not interfering with the accumulation of this nutrient and consequent nutritional imbalance in the process. In order to optimize biogas production, our research group carried out another operation in a continuous reactor for the co-digestion of the same residues (vinasse 1G, filter cake, and deacetylation liquor 2G), adding Fe3O4 nanoparticles (NP). The literature has shown the good performance of reactors, introducing micronutrients using NP [12,13,14]. The choice of Fe3O4 NP was due to the stimulating properties that iron ions (Fe) have on methanogenic archaea. Fe is a micronutrient that stimulates the formation of cytochromes and ferredoxins, important for cellular energy metabolism, especially of archaea. The hydrolysis and acidification phase of AD is also benefited by Fe as a growth factor, since Fe supplementation can accelerate these steps [12,13]. The results obtained from this reactor operation showed a 91% increase in CH4 production, compared to the previous operation, and also allowed for an increase in the organic load rate (OLR), which consequently allowed for an increase in the volume of waste to be treated, improving AD in general [15].
Despite all the operational discussions of the co-digestion of residues from ethanol production for CH4 recuperation, biochemical aspects of the process need to be better understood. The AD process is quite complex from a microbiological point of view. The bacterial consortium responsible for the metabolism of waste to the final product comprises several species of bacteria and archaea, and they may prefer different metabolic routes, depending on the experimental conditions and the substrates used, as there are numerous metabolic routes within the process [16]. We have demonstrated that, in the microbial consortium of co-digestion of vinasse, filter cake, and deacetylation liquor, in both reactor operations (with and without NP), the predominant archaea group was Methanoculleus. This methanogenic group is characterized by the metabolic route syntrophic acetate oxidation (SAO), coupled with hydrogenotrophic methanogenesis [9], which indicates this metabolic route was possibly the main one to produce CH4 from these residues. However, just by identifying the existing microorganisms, it is difficult to distinguish which possible route is being preferred in the process according to the experimental conditions. Little is known about the functional activities of the various abundant groups of anaerobic sludges from AD bioreactors [16]. Therefore, it is important to gain insights into the biochemistry of the bioprocess to ensure a better performance and optimization of sugarcane residue co-digestion.
The literature is quite scarce regarding the proteomics analysis of anaerobic reactors that use sugarcane residues, mainly 2G ethanol residues. Even less information is found on the proteomics analysis of the residue’s anaerobic co-digestion from the sugar-energy industry. According to studies, the metaproteomics approach was successfully used to examine the expression of essential microbial functions in a variety of environments, such as enhanced biological phosphorus removal reactors, activated sludge, and local mine acid drainage, as well as beneath local soil and seascapes [17].
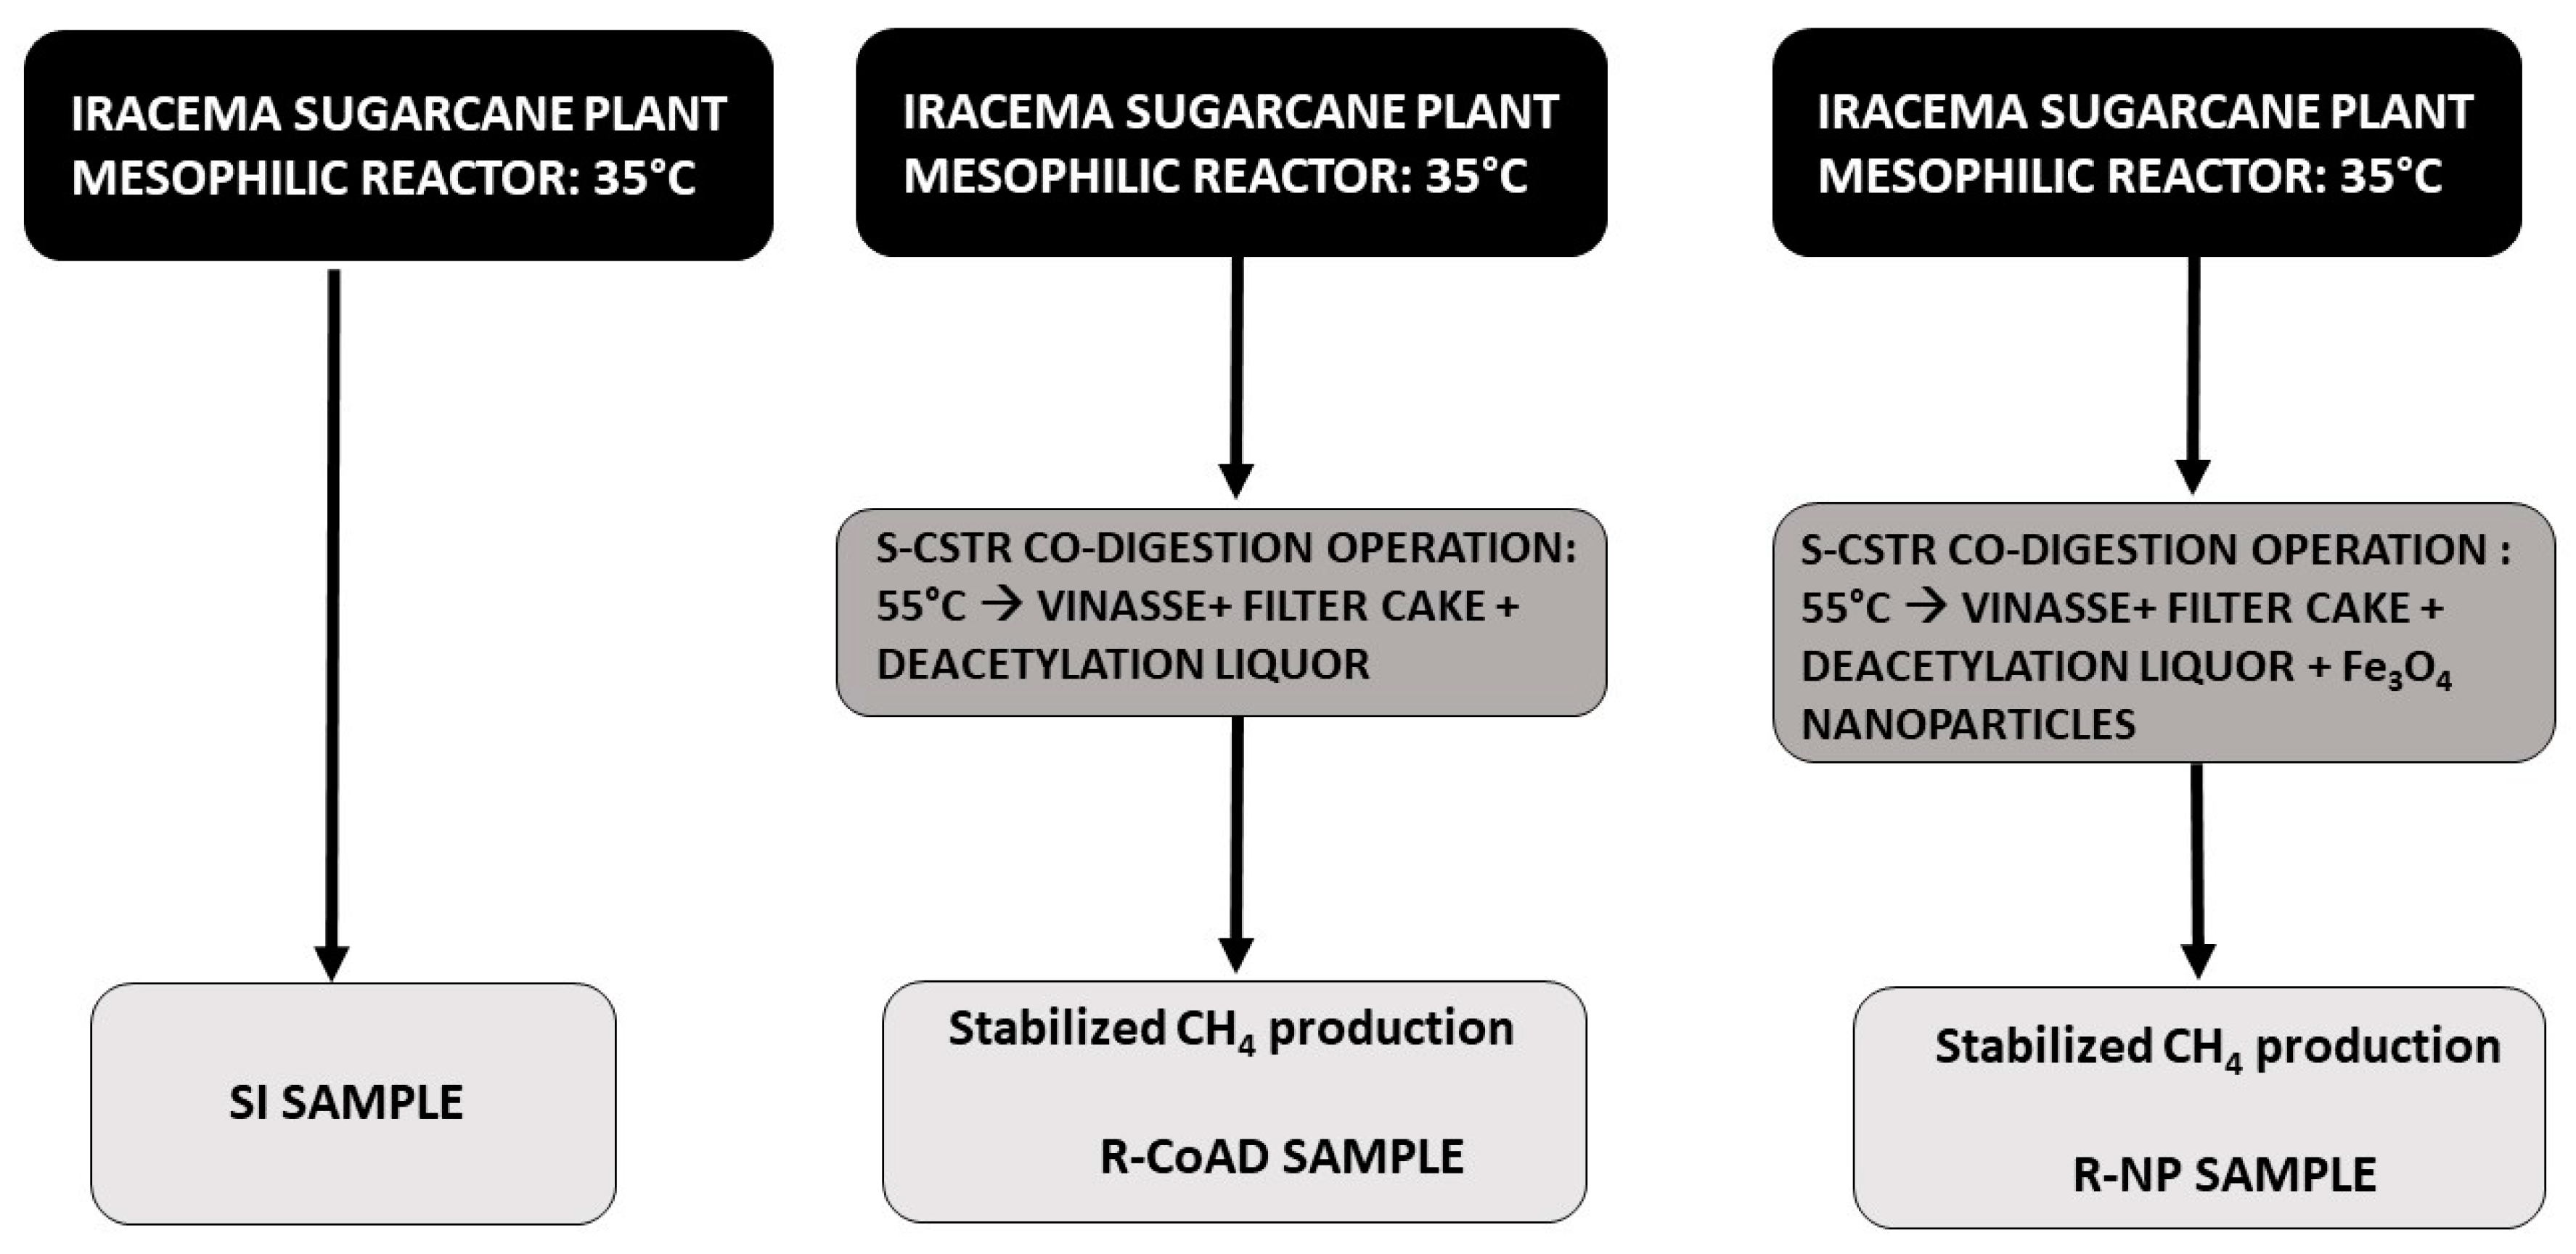
Therefore, the objective of the present work was to carry out a metaproteomic analysis of samples from anaerobic reactors that contained residues from 1G ethanol production and 2G ethanol production in co-digestion for biogas production. Metaproteomic analyses were performed for three types of samples: the first type is the anaerobic sludge alone, before adding substrate, that is, the seed inoculum; the second type is from a reactor with the co-digestion of filter cake, vinasse, and deacetylation liquor; and the last sample type is from another reactor with the same previous co-digestion condition adding Fe3O4 NP. The goal was to analyze whether there would be changes in the abundance of the proteins between the different sample types and if there could be a change or preference in the metabolic routes detected in these complex microorganism communities.

2. Materials and Methods

2.1. Residues and Inoculum

Vinasse, filter cake, and deacetylation liquid were the residues utilized in the reactor operation as substrate. Vinasse and filter cake from the manufacturing of 1G ethanol were obtained from the Iracema sugarcane plant in Iracemápolis, São Paulo state, Brazil. The liquor came from the pretreatment of straw at the National Bio-renewables Laboratory (LNBR) from the Brazilian Center for Research in Energy and Materials (CNPEM).
The microbial consortium, used as inoculum in the process, was obtained from a mesophilic reactor (35 °C) BIOPAC®ICX—Paques—also from the same Iracema sugarcane plant in Iracemápolis, SP.
Table 1 shows the main characteristics of the substrates (used in both reactors), in relation to their composition of volatile fatty acids (VFA), volatile solids, total solids, carbon, nitrogen, and chemical oxygen demand. The elemental composition was performed for the filter cake characterization in the Elementary Carbon, Nitrogen, Hydrogen, and Sulfur Analyzer equipment (brand: Elementar; model: Vario MACRO Cube—Hanau, Germany), and 1.88% of N, 31.07% of C, 6.56% of H, and 0.3% of S were obtained, all in terms of TS.

2.2. Operation of the Semi-Continuous Stirred Reactor (s-CSTR)

Proteomics analysis was performed on three different samples: one sample was the seed inoculum, that is, before the inoculum was inserted into the reactor, called sample SI, and two samples from two different semi-continuously stirred reactors. The sample from the first reactor is called the R-CoAD sample, which comprised the co-digestion of vinasse, filter cake, and deacetylation liquor. The sample from the second reactor is called the sample R-NP, which consists of the same co-digestion as the first reactor, but with the addition of Fe3O4NP. The NP concentration in s-CSTR was 5 mg L−1.
The sample R-CoAD was obtained from the reactor operation described in our previous work [9], and the sample R-NP was obtained from the reactor operation, as described in our previous work [9,15]. The two s-CSTR were operated under 55 °C, with a total of 5 L and 4 L—working volume and the co-digestion of the residues were added in the proportion of volatile solids (VS): 70% vs. of vinasse, 20% vs. of filter cake, and 10% vs. of deacetylation liquor. These proportions were added according to the waste availability in the sugarcane industry, with the vinasse being considered the main substrate (most voluminous waste) and filter cake and deacetylation liquor being considered the co-substrates. The two reactors had an OLR increase over time. Increasing OLR were applied, and samples for proteomic analysis were taken on the largest OLR when the production of CH4 was stabilized, which was 4.80 gVS L−1d−1 for the R-CoAD reactor and 5.5 gVS L−1d−1 for the R-NP reactor. The reactor without NP (sample R-CoAD) operated with ORLs ranging from 1.50 gVS L−1 day−1 to 5.23 gVS L−1 day−1, and the reactor with NP (sample R-NP) operated with ORLs from 2 gVS L−1 day−1 to 9 gVS L−1 day−1. The pH of the two reactors remained around 7 after the stabilization of methanogenesis. Considering the entire reactor operation, the oxidation-reduction potential (ORP) of the reactor without NP (R-CoAD sample) ranged from −800 mV to −100 mV, while the ORP of the reactor with NP (R-NP sample) had a smaller variation, from −600 mV to −300 mV. Regarding alkalinity, both reactors varied the intermediate/partial alkalinity between 1 and 0.3 in the methanogenesis phase; however, the reactor with NP reached this stability in a shorter time (60 days) than the reactor without NP (90 days). Considering the OLR of 4.80 gVS L−1d−1 (largest OLR when the production of CH4 was stabilized) applied to the reactor without NP (R-CoAD sample), the main volatile fatty acids (VFA) concentrations found were: 1499.92 mg L−1 of lactic acid, 504.54 mg L−1 of acetic acid, 280 mg L−1 of propionic acid, 103 mg L−1 of isobutyric acid, and 214 mg L−1 of butyric acid. For the operation with NP (R-NP sample), the main VFA concentrations found at the ORL of 5.23 gVS L−1 day−1 were 480.81 mg L−1 of acetic acid and 2058.01 mg L−1 of propionic acid, and at the end of the operation, all VFA concentrations in both reactors were reduced. The use of nanoparticles structured greater stability for the reactor operation as a whole, when compared to the reactor that did not have NP, in addition to increasing CH4 production (91%). Parameters such as alkalinity, pH, and ORP maintained greater stability with smaller variations from the use of NP. Figure 1 exemplifies how the samples from the microbial consortium were obtained to perform the metaproteomic analyses. Table 2 summarizes some indicators of the process during the stable operation of the two reactors [9,15]. More details about operation parameters have already been published and are available in Volpi et al. [9] and Volpi et al. [15].

2.3. Metaproteomic Analysis

2.3.1. Protein Extraction and Digestion

Proteins were extracted from the sludge, based on the metagenome of samples, following the protocol of Hurkman and Tanaka [18] in technical triplicate with a few modifications. Aliquots (100 μL) from each sample were lyophilized in the Modulyod FR-Drying Digital Unit lyophilizer (Thermo Fisher, Waltham, MA, USA). Following lyophilization, samples were homogenized at 4 °C for 30 min in 1 mL of extraction buffer, which contained the following ingredients: 0.5 M TrisHCl, pH 7.5; 0.1 M KCl; 0.05 M EDTA; 0.7 M sucrose; 2% v/v 2-mercaptoethanol; 2 mM PMSF; and 1% w/v polyvinylpyrrolidone. The samples were then given the equivalent volume of the buffer (10 mM TrisHCl, pH 8.0) and saturated phenol. The phases were separated by centrifugation (10,000× g, 30 min, 4 °C), following 30 min of shaking. After being recovered, the phenolic phase was extracted using the equivalent volume of extraction buffer. By adding 1 mL of 0.1 M ammonium acetate in methanol and incubating for 1h at −20 °C, followed by centrifugation (16,000× g, 30 min, 4 °C), proteins were precipitated from the phenolic phase. The pellet was centrifuged (16,000× g, 30 min, 4 °C) after being washed four times with ammonium acetate in methanol and once with 1mL of 100% cold acetone. In 400 L of TCT buffer (7 M urea, 2 M thiourea, 10 mM DTT, and 0.1 percent (v/v) Triton X-100), the resultant pellet was dried and then dissolved. Amicon® Ultra-0.5 mL 3K-NMWL filter systems were used to desalinate protein extracts (Millipore, Burlington, MA, USA).
The Bradford assay [19] was used to measure the protein concentration, and SDS-PAGE electrophoresis was used to confirm it [20]. Ten micrograms of protein sample were treated with 2.5 L of RapiGest SF (0.2%) at 80 °C for 15 min, 2.5 L of 100 mM dithiothreitol (GE Healthcare, Chicago, IL, USA) at 60 °C for 30 min, and 2.5 L of 300 mM iodoacetamide (GE Healthcare) at room temperature for 30 min in the dark. A 1:100 (w/w) enzyme to protein ratio of trypsin (sequencing grade modified trypsin, Promega, Madison, WI, USA) was used to enzymatically digest the samples. The digested mixture was then mixed with 10 L of 5% (v:v) trifluoroacetic acid. After being incubated at 37 °C for 90 min, the digested samples hydrolyzed the RapiGest. The RapiGest was then hydrolyzed by the digested samples after being incubated at 37 °C for 90 min. According to the maker (Millipore) of the ZipTip Reversed-Phase ZipTip C18, the mixture of peptides was desalted after digestion [21]. The lyophilized desalted peptide sample to be analysed was added to 0.1 percent formic acid LC-MS H2O solution to obtain the final concentration of 200 ng/L, and the final volume of 50 L was obtained.

2.3.2. Two-Dimensional LC-MS/MS Analysis

The LC-MS was performed on a NanoElute (Bruker Daltonik) system coupled online to a hybrid TIMS-quadrupole TOF mass spectrometer (timsTOF Pro) (2) (Bruker Daltoniks, Bremen, Germany) via a nano-electrospray ion source captive spray (Bruker Daltoniks, Germany). For the gradient run (22 min. total run), approximately 200 ng of peptides were separated on a Bruker TEN column 10 cm × 75 µm ID, 1.9 µm C18 reversed-phase column (Bruker) at a flow rate of 500 nL min−1 in an oven compartment heated to 50 °C. To analyze samples from whole-proteome digests, we used a gradient starting with a linear increase from 2% B to 35% B over 18 min, followed by a further linear increase to 95% B in 2 min, which was held constant for 2 min. The column was equilibrated using 4 volumes of solvent A. In data-dependent PASEF mode [22], the mass spectrometer was run with 1 survey TIMS-MS and 4 PASEF MS/MS scans per acquisition cycle. The dual TIMS analyzer was used to evaluate the ion mobility range from 1/K0 = 1.3 to 0.85 vs. cm−2, with identical ramp and accumulation times of 100 ms each. By swiftly switching the quadrupole position in time with the elution of precursors from the TIMS device, suitable precursor ions for MS/MS analysis were separated in a window of 2 Th for m/z 700 and 3 Th for m/z > 700. As ion mobility increased, the collision energy gradually decreased, going from 27 eV for 1/K0 = 0.85 vs. cm−2 to 45 eV for 1/K0 = 1.3 vs. cm−2. We employed a polygon filter mask to filter out singly charged precursor ions using the m/z and ion mobility information. We then used “dynamic exclusion” to prevent re-sequencing of precursors that achieved a “target value” of 20,000 a.u. The ion mobility dimension was calibrated linearly using three ions from the Agilent ESI LC/MS tuning mix (m/z, 1/K0: 622.0289, 0.9848 vs. cm−2; 922.0097, 1.1895 vs. cm−2; and 1221.9906, 1.3820 vs. cm−2). The mass spectrometry was performed at the Max Feffer Laboratory of Plant Genetics Department of Genetics Esalq/Usp.

2.3.3. Processing Parameters and Database Search

All MS/MS samples were processed using PEAKS Studio Version 10.6 (Bioinformatics Solutions Inc., Waterloo, ON, USA) software. Mass spectra were searched, compared to the UniProtKB/SwissProt database (date the database was downloaded: 16 January 2021), using the following search parameters. Carbamidomethylation of cysteine was used as fixed amino acid modification, with oxidation of methionine and acetylation (Protein N-term) as variable modifications. Trypsin was selected as the proteolytic enzyme, with a maximum of two potential missed cleavages. Peptide and fragment ion tolerances were set to 20 ppm and 0.05 Da, respectively. The maximum false-positive discovery rate (FDR) in scaffold was set up to 1% at protein and peptide levels, with one unique peptide criterion to report protein identification. All the protein’s correct responses were identified with a confidence of >95%. Protein quantification was performed using signal intensity (area under the curve, AUC).
The predicted protein identifications were obtained with the embedded ion accounting algorithm of PEAKS software, searching the database for NCBI non-redundant database. The mass spectrometry proteomics data were deposited in the ProteomeXchange consortium via the PRIDE partner repository with the dataset identifier PXD029938.

2.3.4. Data Analysis

For metaproteomics data analysis, a list of potential contaminant proteins that were not from microorganisms, including plant and animal proteins, were removed from our main data set of identified proteins. One protein from each protein group was included in the data set. For quantitative analysis, the intensities were transformed to log base two and filtered to have at least two valid values in each group. More than two non-valid values for the same protein identified were assigned as zero. Differentially abundant proteins between biological samples were examined by two-tailed Student’s t-test, and those proteins that had values lower than 0.5% of significance were considered differentially expressed. To calculate the relative abundance, the intensities of the protein peaks were summed for the same replicate, and the percentage of each protein was obtained concerning the total identified.
The annotation of the identified proteins was performed with the updated Gene Ontology analysis of frequency of GO terms in ID/mapping module from UniProt and database of the Kyoto Encyclopedia of Genes and Genomes (KEGG) (http://www.kegg.jp/kegg/) accessed on 15 July 2021. The version of KEGG used for annotation was number 5 of KEGG Mapper (2), accessed on 20 August 2021. KEGG was mainly used to trace the metabolic routes of the samples. Protein sequences were submitted to BlastKOALA (https://www.kegg.jp/blastkoala/) accessed on 25 July 2021 in the KEGG for functional annotation [23].
To analyze the correlation between samples in the protein expression, a heatmap was created with R version 4.1.2 (http://www.r-project.org) accessed on 14 June 2021 using the heatmap function, a heat map 2 function in R’s ‘gplot’ package (version 3.0.1). The proteins were classified based on the Pearson correlation coefficients, as a similarity measure in protein expression and Euclidean hierarchical clustering method. Figure S1 in Supplementary Materials (SM) shows the Pearson correlation graphic.

3. Results

In general, a total of 439 proteins were found, which included 319 proteins for the SI sample, 293 proteins for the R-CoAD sample, and 299 proteins for the R-NP sample. From this data, contaminating proteins and proteins from other organisms were excluded, but considering proteins of the same suggested function attributed to different microbial species. Tables S1–S3 in the SM show the identified proteins that were differentially abundant among the samples. These tables also contain the NCBI-Uniprot identifier for each protein.
Figure 2 shows the relative abundance of the proteins found in each of the samples.
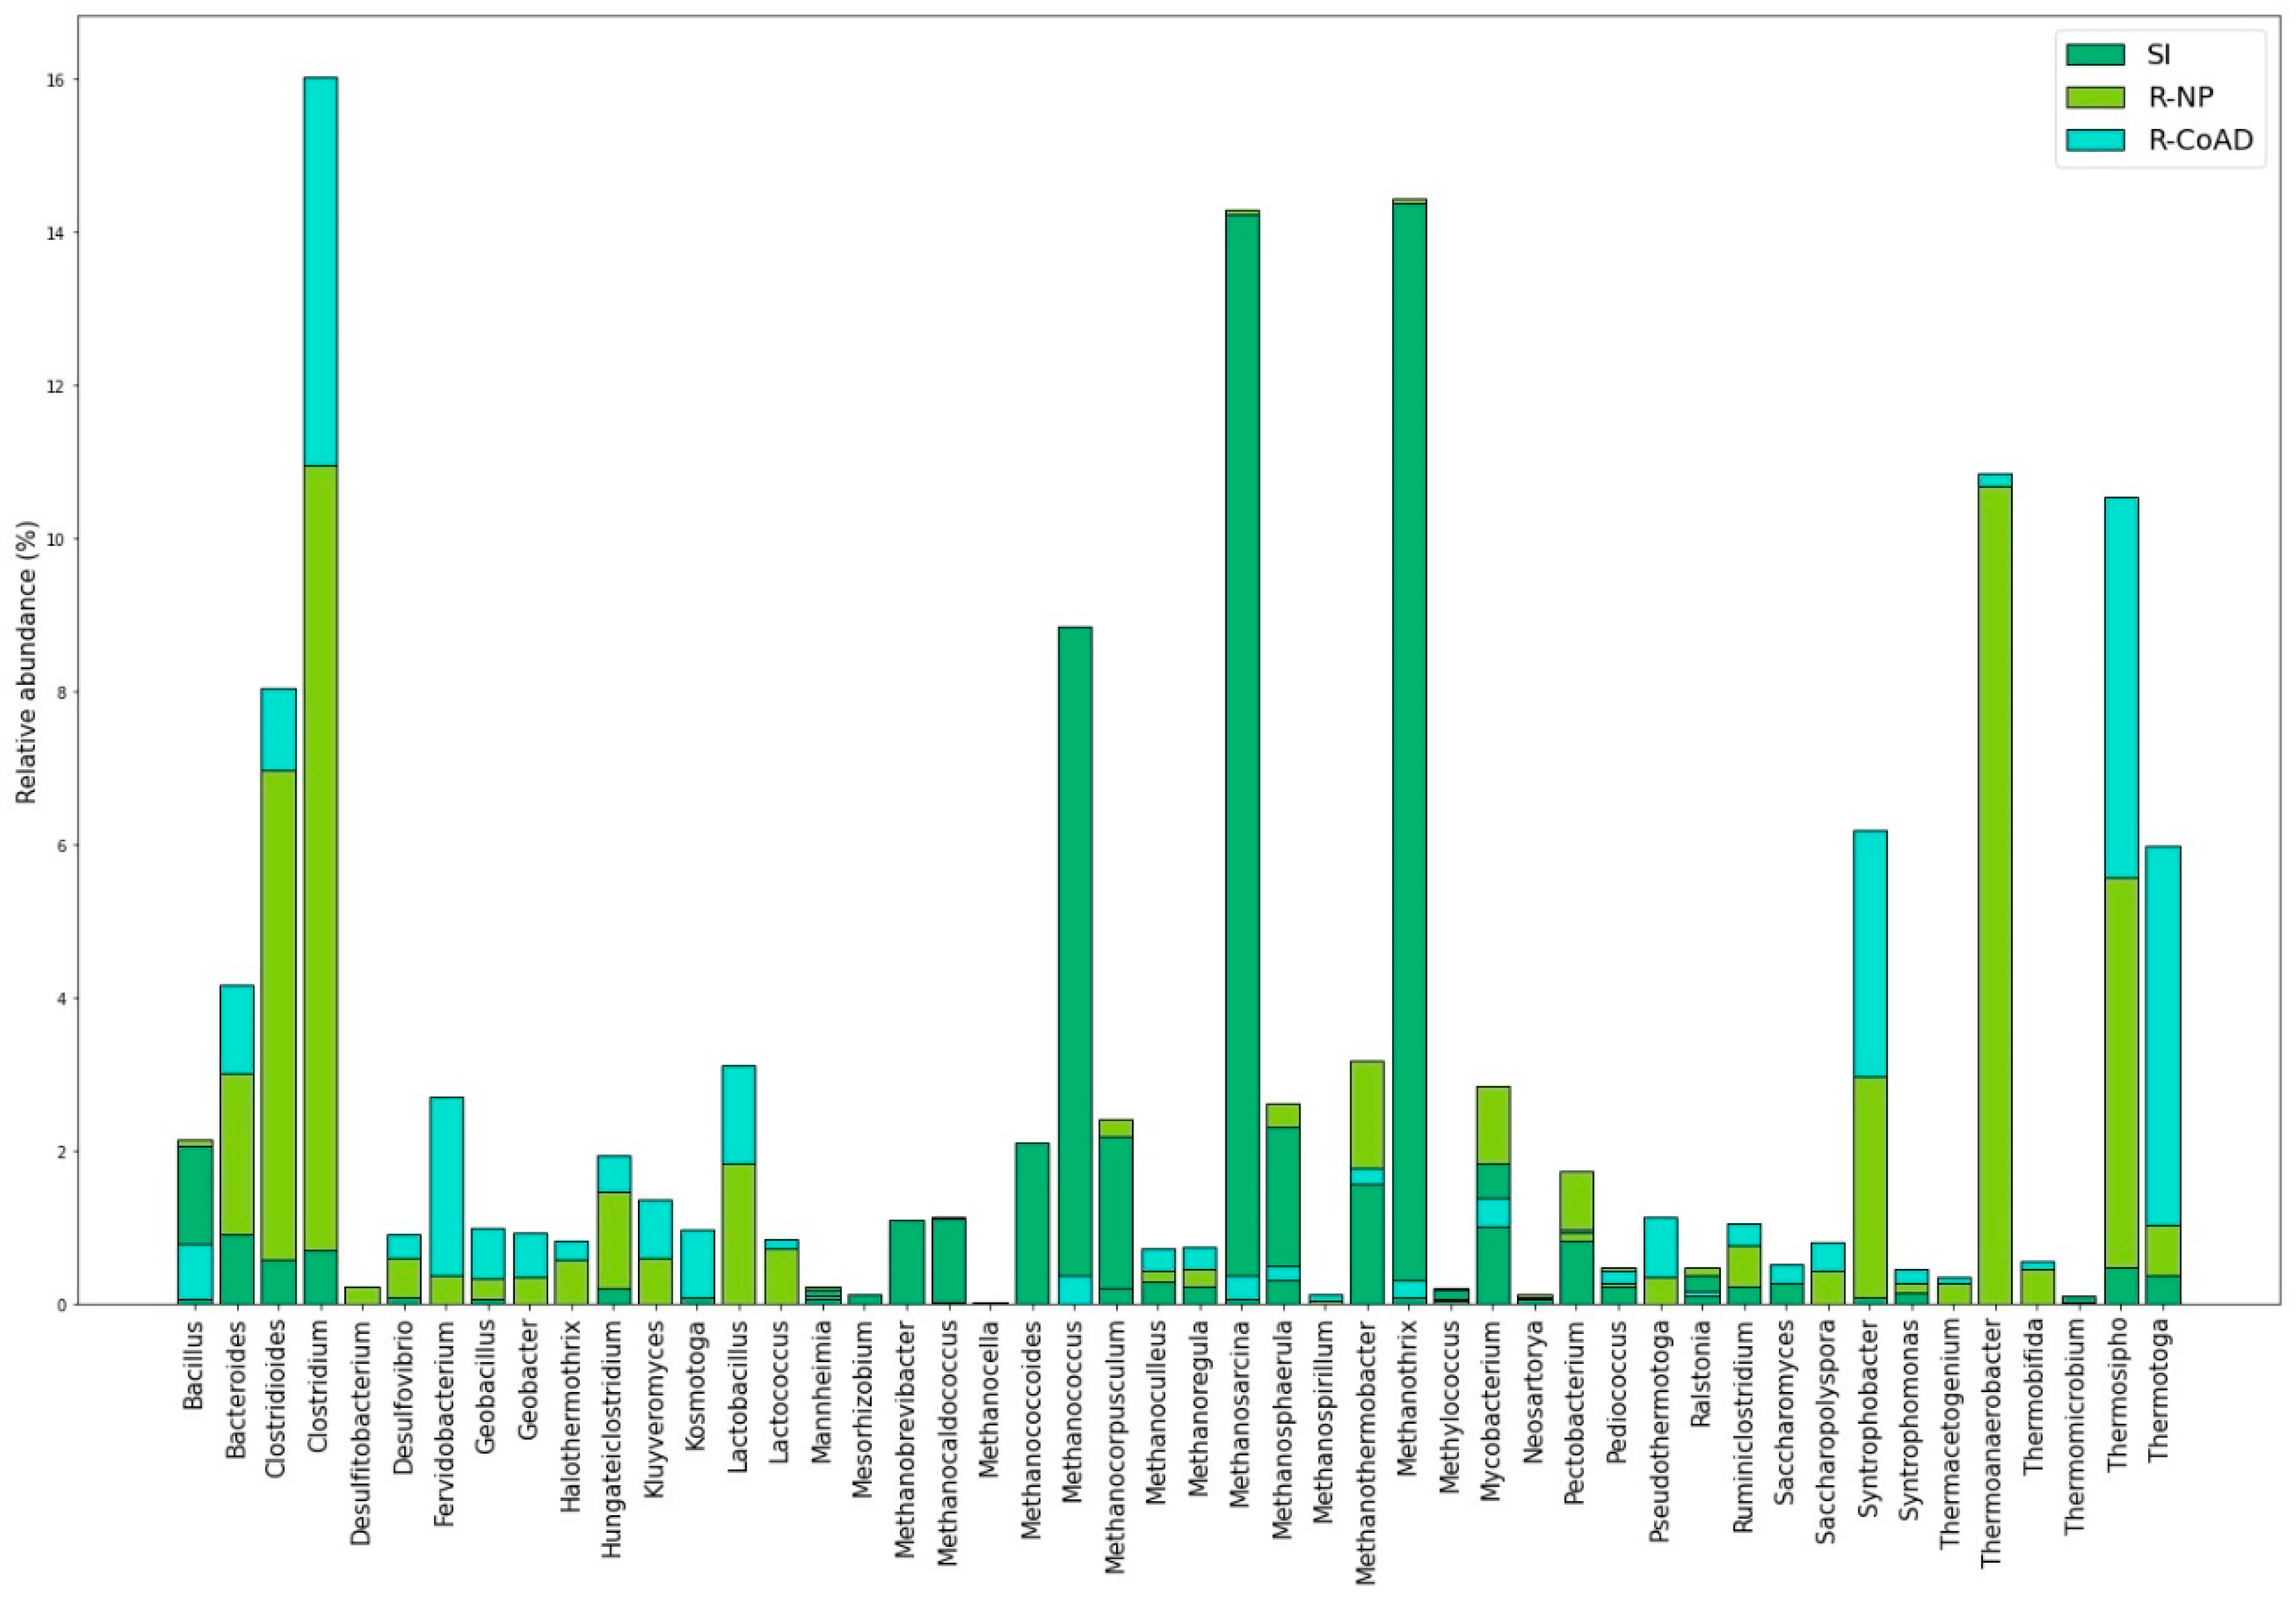
Figure 3 shows the relative abundance of proteins of the main microorganism genus. The relationship between the protein abundance and the possible microorganism that synthesized it resulted from the LC-MS analysis, as the database in which the cross was performed (NCBI non-redundant database) also had these data on the microbial community. The three samples have already been carried out and were published in studies on reactor operation [9,15]. Table S4 brings the results of all identified microorganism genus, with the respective relative abundance of identified proteins. The R-NP and R-CoAD samples also had proteins that were produced by methanogenic archaea and also by groups of bacteria that are important for AD, such as Thermoanaerobacter, Thermobifida, Thermomicrobium, Thermosipho, Thermotoga, Syntrophomonas, Ruminiclostridium, and Pseudomonas.
Figure 4A shows the heatmap of the results obtained from clustering the protein groups of the three samples with the three repetitions performed. This graph shows that the samples were clustered into two groups, one in purple and the other two in red. As it is not possible to read the IDs of the proteins in Figure 4A and Figure S2 in the SM, a larger figure with the ID of each of the proteins can be found.
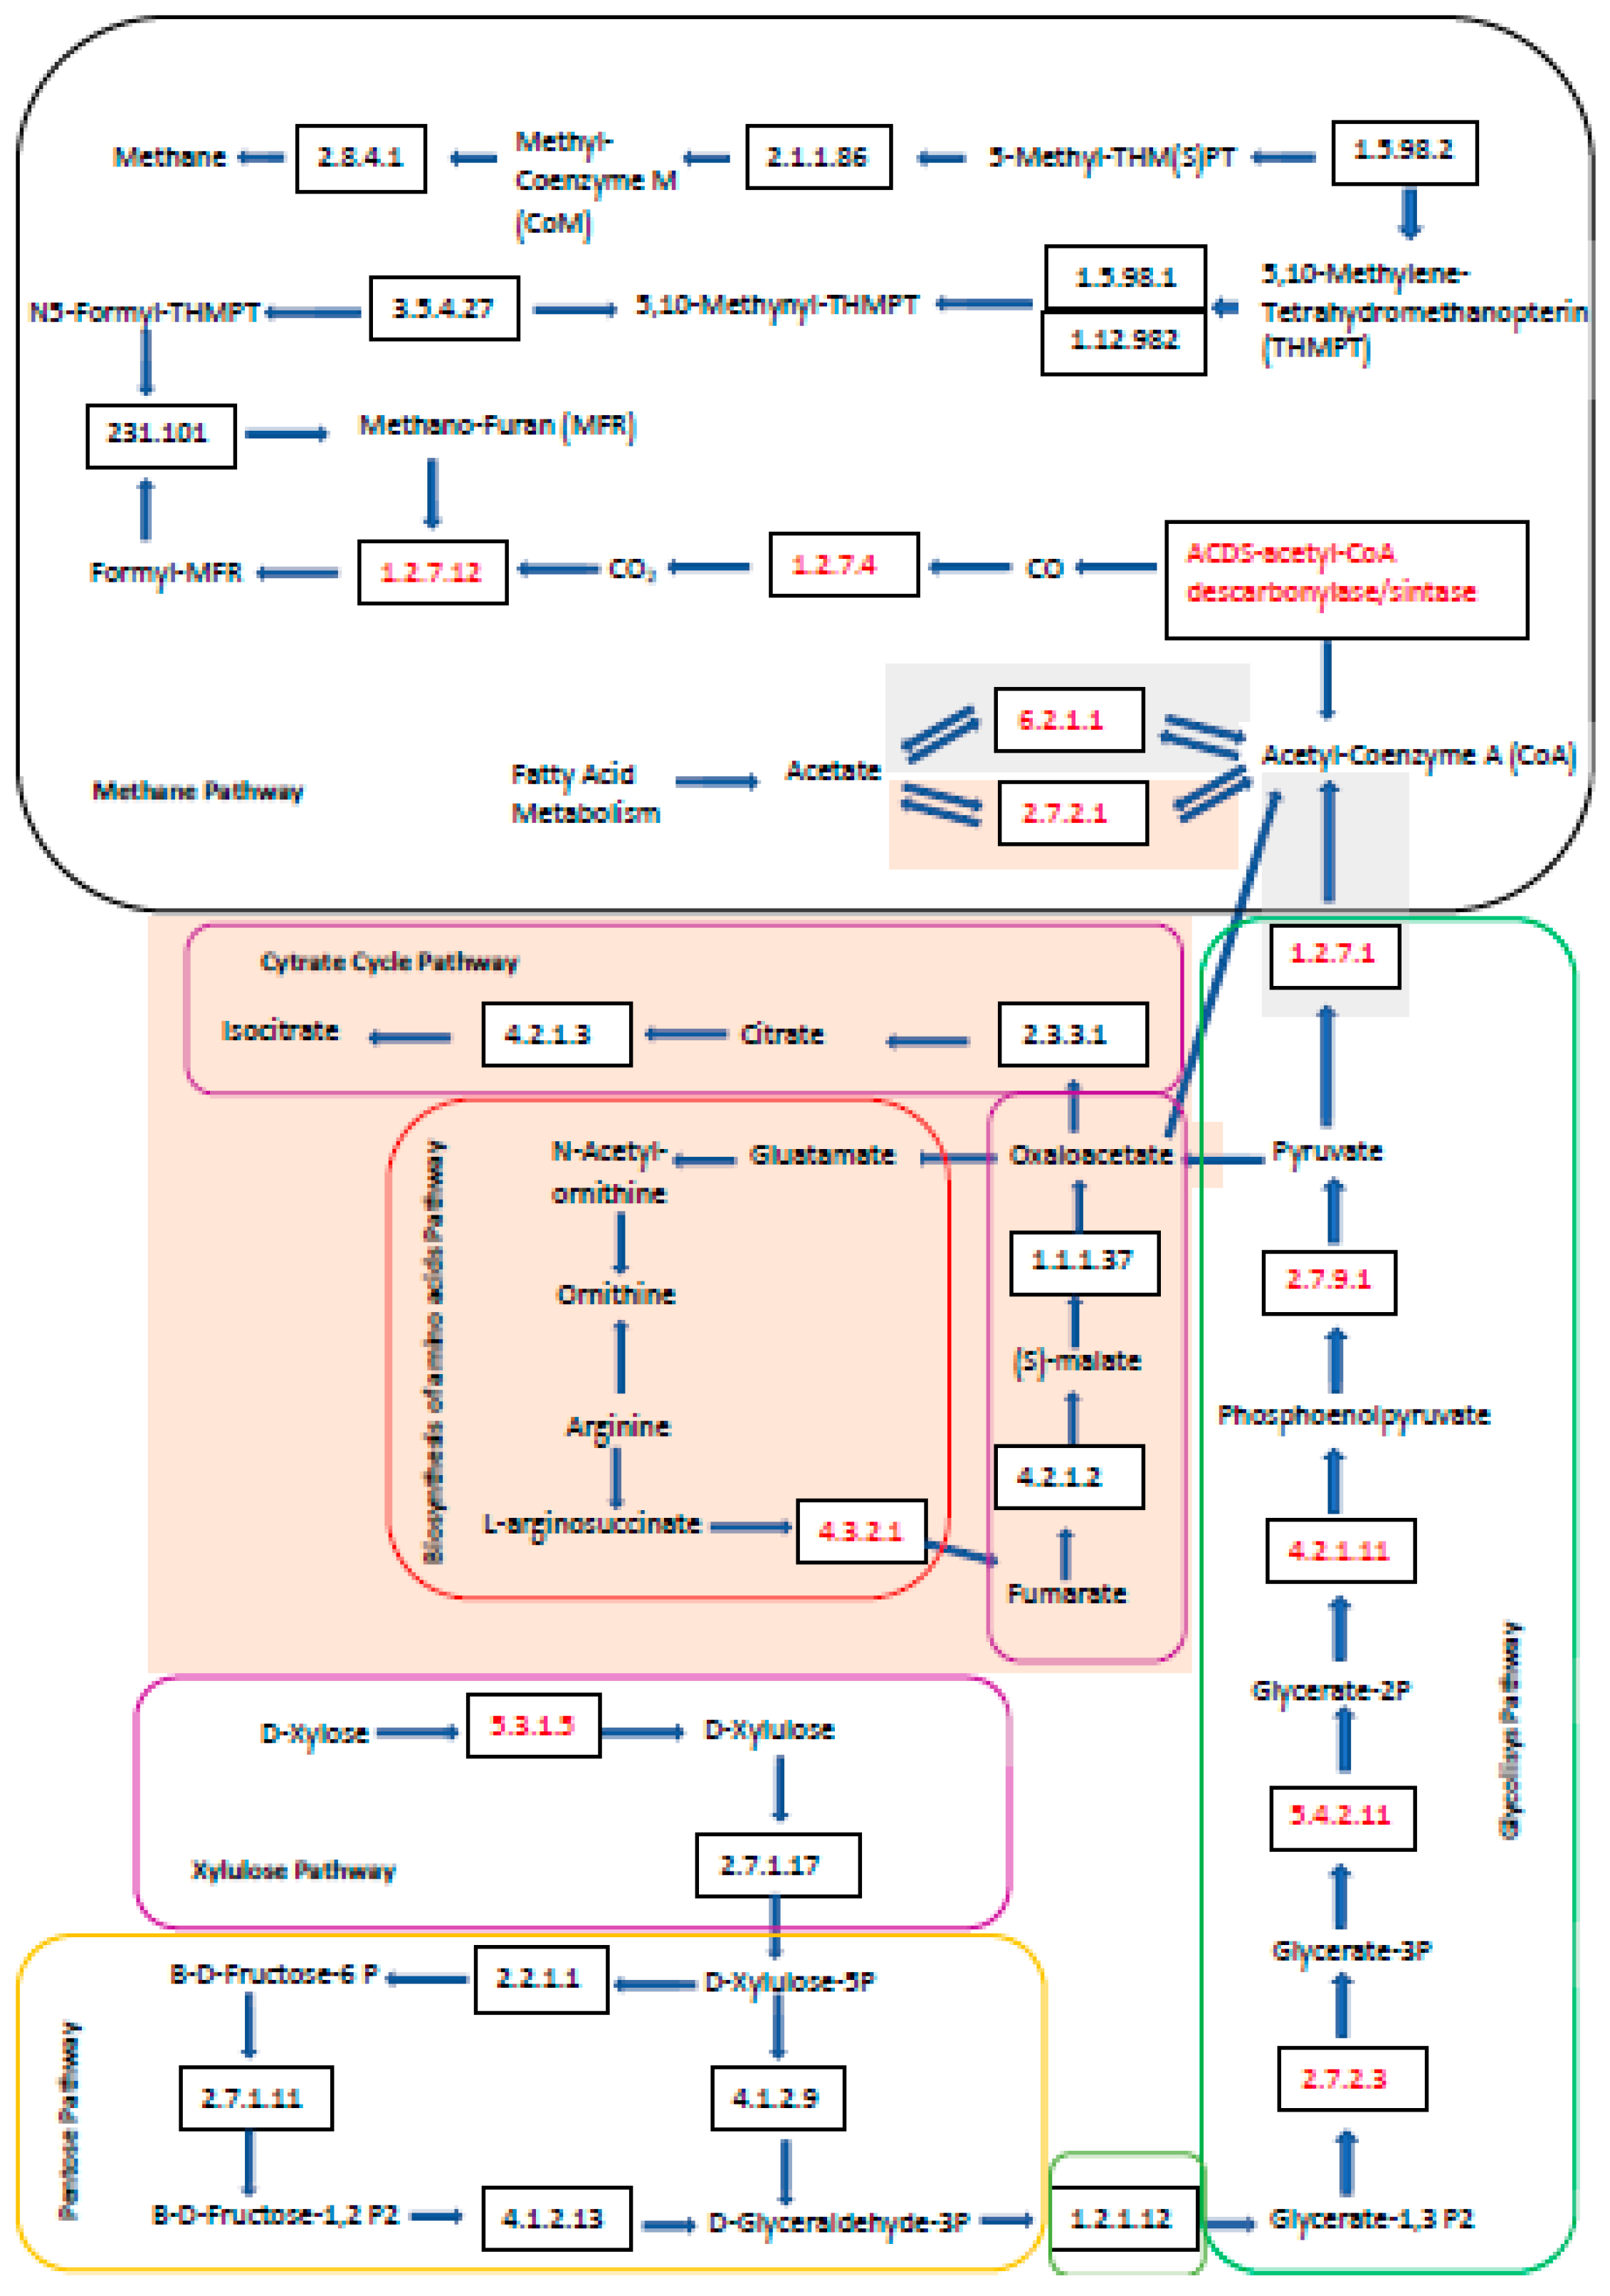
Figure 5 shows the metabolic route that was proposed for the three samples together, according to the identification of proteins. To propose this route, KEGG’s specific metabolic routes (http://www.kegg.jp/kegg/1) accessed on 25 July 2021 were followed.

4. Discussion

4.1. Identified Proteins

The samples R-NP and R-CoAD were the ones with the highest numbers of differentially abundant proteins, as these samples were collected from different reactors. However, this does not mean that they have followed different metabolic routes for CH4 production, but that the addition of Fe3O4 NP in the reactor may have influenced a higher or lower abundance of a certain protein, as NP acts as an archaea growth stimulant and acts as a protein cofactor [24,25] improving the AD process.
It can be observed that sample SI has a greater diversification of proteins than the other samples, as was identified in Figure 2. This could be due to the fact that this sample came from an external reactor—Iracemapólis plant (as described in the methodology)—and not from the reactors that were operated for the present study, presenting greater operational variability and being able to generate greater diversity of proteins, compared to samples R-CoAD and R-NP. However, it is worth pointing out that this inoculum (SI sample) was introduced in the start operation reactors, where the R-CoAD and R-NP samples came from. This could lead to differences in the abundance of the proteins, once there were changes in the initial metabolic routes, until the given moment of sampling. The same observation was seem by Volpi et al. [9] on the identification of the microbial community in the samples of SI and R-CoAD. The sample from the reactor operation showed a greater diversification of microorganisms, in relation to the seed inoculum sample, indicating that the substrates and conditions of the reactor directed to the co-digestion process selected new bacteria from the microbial community in a way that some members of the community increased their relative abundance, while others decreased.
The main proteins found in sample R-CoAD were classified in the following functional classes: (~10%) 60 kDa chaperonin, (~24%) enolase, (~0.72%) xylose isomerase, (~4%) argininosuccinate lyase, (~38%) ornithine carbamoyltransferase. For sample, R-NP, the main proteins identified, belonged to the functional classes: (~22%) chaperone protein DnaK, (~30%) enolase, (~13%) xylose Isomerase, and (~3.4%) pyruvate phosphate dikinase.
In both samples, the presence of the enolase enzyme was highly represented, and carbohydrate appeared to be the main initial carbon source. This enzyme was associated with glucose metabolism, and as the reactors were treating substrates with a high cellulose content, this may explain their high relative abundance. When degraded, cellulose can follow both the glycolysis metabolic pathway and the pentose phosphate pathway [16]. The pyruvate phosphate dikinase enzyme could work at the end of the glycolytic pathway, metabolizing phosphoenolpyruvate into pyruvate [16]. In addition to enolase, another enzyme associated with cellulose metabolism is xylose isomerase, indicating that the metabolic route of xylulose can also be involved in the cellulose catabolism that takes place under AD. The enzyme xylose isomerase appeared in greater abundance in the R-NP sample than in the R-CoAD sample (13% vs. 0.7%). The presence of Fe3O4 NPs may have stimulated acidogenic and fermentative bacteria [26], causing them to express greater amounts of enzymes responsible for breaking down carbohydrates, such as xylose isomerase.
The presence of proteins such as chaperones and chaperonins are usually related to stress responses, due to environmental conditions and survival challenges in extreme or changing conditions, and are not directly related to the metabolic pathways involved in the AD of polysaccharides and biogas production. However, these proteins may be common in anaerobic reactor sample analyses, as reported by Lam et al. [27], and may be important to ensure the proper cellular response and protein folding under AD [28]. The samples from reactors present different types of chaperones, the main ones being 60 kDa chaperonine and DnaK chaperones. As they have practically the same function, it is possible to indicate that the microorganisms were experiencing some level of stress within the bioreactors at the time of sampling, as it is a complex process, with different microorganisms and different metabolites being generated and consumed. However, the literature shows that GroEL chaperonins can be overexpressed in the presence of acetic acid [28], and an abundance of this protein could be interpreted as a response to environmental stress exposure [29]. The presence of different fermentative products in the R-CoAD sample, such as VFA (acetic acid, latic acid, propionic acid), may have led to a greater presence of this type of chaperonin, concerning the R-NP sample (10% vs. 2%). This expression of different types of chaperones is likely to be related to the different VFA found in the samples.
Among the main proteins related to the metabolic process of CH4 production within anaerobic digestion, methyl coenzyme-M reductase is a key enzyme at the end of CH4 production [16]. This enzyme was found in the three samples, (~0.5% in sample SI, ~1.6% in sample R-NP, and 0.2% in sample R-CoAD), indicating that the CH4 production route was probably active in the sludge.
The acetate kinase enzyme was also found (~1.5%) in sample R-NP and (~0.5%) in sample R-CoAD. This enzyme is responsible for converting acetyl phosphate into acetate (and vice versa) within the metabolic pathway to produce CH4. The acetate is the main precursor of CH4 production [30] and the presence of this protein, which is widespread in bacteria fermentation consortiums, suggesting that complex organic matter is degraded to acetate, as well in these AD conditions, to produce CH4.
Acetyl-coenzyme A synthetase, acyl-CoA dehydrogenase, as related to the acetoclastic pathway in CH4 production, were also identified in the three samples. The SI sample showed the highest number of these proteins (e.g., ~7% acetyl-CoA decarbonylase/synthase) in the presence of archaea Methanosarcina and Methanothrix, possibly indicating that the acetoclastic route was predominant in the inoculum before being inserted into the reactor. The fact that these enzymes were not found in greater amounts in the R-CoAD and R-NP samples did not indicate that the acetoclastic route was not present inside the reactor, but perhaps that, as the CH4 production was already stable, only proteins related to the final steps of methanogenesis, as was the case with methyl-CoM reductase, were detected.

4.2. Relationship of Proteins and the Microbial Community

Our proteomics results revealed a high number of proteins identified and annotated to the microorganisms of the Thermotoga genus, which is characteristic of thermophilic processes [9]. The abundance of these proteins was higher in the samples from the two reactors, which operated at 55 °C, than in the SI sample that comes from a mesophilic reactor.
These same samples showed proteins that are abundant in the acetogenic and hydrolysis phases of the organisms from genus Clostridium and Thermoanaerobacter, which are part of the first stages of AD and are important for driving the entire metabolic process [31]. Proteins from the bacteria of the genus Bacteroidetes were also detected in the samples, which are characteristic of the hydrolysis and acidogenesis phases of anaerobic digestion, mainly in reactors with the presence of straw and Fe3O4 NP, as was the case of the R-NP sample [32]. Microorganisms of the genus Lactobacillus for example, whose proteins were identified in samples R-NP and R-CoAD, are responsible for converting pyruvate into lactic acid, which can then be converted to acetate [27]. Species of the genus Clostridium are involved in the degradation of pyruvate to butyrate [27], and this butyrate was possibly converted to acetate. All these microorganisms from the early stages of AD are important for preparing substrates that will be reduced to CH4, such as acetate and CO, which will be used by the methanogenic archaea species.
Another factor that draws attention is that most of the proteins synthesized by methanogenic archaea (Figure 3) had a greater abundance in the SI sample, indicating that this sample, even being from the inoculum at the beginning of the studied process, already had activity in the methanogenic pathway. This inoculum, coming from a reactor for treating vinasse and producing biogas and having been in operation for some years, suggests that its methanogenesis was better stabilized than the reactors that operated in this study. However, the difference in the substrate and operating conditions confirm the possibility of changes in metabolic pathways in SI sample to R-CoAD and R-NP sample.
It is noteworthy that all samples have proteins from methanogenic archaea annotated in the acetoclastic pathway, such as Methanosarcin, as well as from the hydrogenotrophic pathway, such as Methanoculleus. We previously identified the main archaea genus found in the samples of AD as Methanoculleus in the co-digestion of vinasse, filter cake, and deacetylation liquor, indicating that the probable metabolic route with these substrates would be a syntrophic acetate oxidation (SAO) process coupled with hydrogenotrophic methanogenesis [9]. The fact that the two reactors under AD have the presence of enzymes from both the acetoclastic metanogenesis route (e.g., ~0.5% and ~1% of acetate kinase, for R-CoAD and R-NP, respectively) and the hydrogenotrophic methanogenesis route (e.g., ~0.16% and ~0.94% of acetyl CoA descarbonylase/synthase for R-CoAD and R-NP, respectively) confirms the possibility that SAO was coupled to the hydrogenotrophic route and may be the most likely within the waste co-digestion of the ethanol production industry.

4.3. Protein Functional Analysis

In the first cluster on Figure 4, it can be seen, in general, that the R-CoAD samples and the R-NP sample have similar patterns of protein abundance, while in the second cluster, most proteins that were present in the SI sample were not in the other two samples. To assess the biological function of the set of proteins of the two clusters identified, we performed an analysis using Blastkoala, which is shown in Figure 4B.
Cluster 1, which has the proteins from the R-CoAD and R-NP samples with high abundance (Figure 4B), had an intense carbohydrate metabolism activity, in addition to amino acid metabolism. Cluster 2 had the highest abundance of proteins in the SI sample, and the greatest functions of the detected proteins were the metabolism of other amino acids, the energy metabolism, and the cellular process. In general, these protein functions, even though none are directly related to the CH4 route, were already shown to have different metabolic pathways, and the R-CoAD and R-NP samples were classified under the same functions. It is worth remembering that these samples come from the anaerobic co-digestion operation of the same residues, with stabilized CH4 production.
According to the functions represented in the BlastKOALA (Figure 4B), there was a higher abundance of proteins that act in the first AD phases, which are the hydrolysis and acidogenic phases, for all samples. Even samples R-NP and R-CoAD were removed from the reactor in the methanogenesis phase. This can be confirmed in Figure 4C, which shows the frequency of each of the enzymes identified in the samples, according to the analysis of the gene ontology (GO) of UniProtKB, in relation to the molecular function of these proteins. In all samples, the active carbohydrate and protein metabolism enzymes that were detected, such as hydrolase, lyase, peptidase, and some other auxiliary enzymes [33], were part of the hydrolysis steps. Moreover, these enzymes are more frequent in SI samples than in the other two from methanogenesis. These enzymes are important in the fatty acid biosynthesis process, which is an essential step for biogas production [34]. What probably occurred is that smaller amounts of proteins related to methanogenesis were identified, which were not detected in the analysis carried out in the blastkoala because of low quantification. Even with this difficulty, proteins related to the CH4 metabolic route could be detected, as described in section above.

4.4. Metabolic Pathway

According to Figure 5, the main differences between the three samples occurred in the early stages of AD, such as hydrolysis and acetogenesis, which is a process where macromolecules, such as cellulose, lignin, and xylose, are degraded into volatile fatty acids by different types of microorganisms. These acids enter the acetogenesis and methanogenesis phase.
It is likely that methanogenesis was not different for the three samples, because the same residues were used as substrates, with the same compositional characteristics [7].
At the beginning of the metabolic route, the xylose, pentose, and glycolysis pathways probably occurred in the three samples as the presence of the Xylose isomerase enzyme (EC: 5.3.1.5) was detected. Then, the proteins phosphoglycerate kinase (EC: 2.7.2.3) enolase (EC: 4.2.1.11) and pyruvate phosphate dikinase (EC: 2.7.9.1) were detected, which were all involved in the glycolysis pathway, probably for the pyruvate synthesis.
Based on this, there were some differences in the SI sample routes with the R-CoAD and R-NP samples. The R-CoAD and R-NP samples showed several proteins related to the metabolism of amino acids, such as arginine succinate lyase and ornithine carbometyltransferase. The presence of these proteins allowed the route of the biosynthesis of amino acids, arginine biosynthesis, and citrate cycle (shown in pink in the map in Figure 5) to be explored. However, these routes are not extremely important for producing CH4, as they are part of the initial stages of the process.
In the SI sample, acetyl-CoA may have followed an acetoclastic methanogenic metabolic route, as the acetyl-coenzyme A synthase protein (EC: 6.2.1.1) was detected. In the R-CoA and R-NP sample, the acetoclastic pathway can also be identified as the acetate kinase protein (EC: 2.7.2.1) was detected in greater proportions in both samples. In general, all samples followed this route of acetyl-CoA generation, from metabolites such as the acetate, glucose, citrate cycle, and fatty acid metabolism pathways.
In the end, it is likely that acetate could be converted to CO, and later to CO2, by the protein acetyl-CoA decarbonylase/synthase complex subunit alpha (EC: 1.2.7.4) inside of the acetyl-CoA pathway (M00422-methane metabolic route-KEGG) [27]. This protein is part of the ACDS complex that catalyzes the reversible cleavage of acetyl-CoA, allowing for autotrophic growth from CO2. This CO2 could then be used by the hydrogenotrophic methanogens, as reported by Lametal [27], following the degradation processes until the formation of CH4 as the methyl-CoM enzyme was detected.
In this study, proteins that are part of the metabolic pathway of the acetoclastic methanogenic (M00357 methane metabolic route KEGG) and proteins that participate in the hydrogenotrophic pathway (M00567 methane metabolic route KEGG) were identified in all samples. This is a common situation for bioreactors that are fed with glucose, as reported by Lam et al. [27]. CH4 production from both CO2 and acetate correlated with the observation of a temporally increasing ratio (2.1–3.3 times) of hydrogenotrophic to acetoclastic methanogenic activity.
The initial proposal of previous studies carried out by our research group (9) reported that the predominant metabolic route in the process would be the SAO coupled to hydrogenotrophic methanogenesis (SAO-HM), since, by the identified proteins, the acetate can be oxidized and converted into CO2, and this, together with the hydrogen, would form CH4 (Figure 5). As this reaction generates H2 and is thermodynamically unfavorable (reaction 1), the hydrogenotrophic methanogenic archeae consumed the present H2 and generated CH4 (reaction 2) [30]. Therefore, as proteins from the two methanogenic routes and microorganisms classified as participants in the SAO-HM were identified [9], the two reactions may be coupled, and it was probably the predominant one in co-digestion with residues from ethanol production 1G2G.
Syntrophic acetate oxidizing reaction
CH3COOH + 2H2O → 2CO2 + 4H2 ΔG° = +104.6 KJ        (Reaction 1)
Hydrogenotrophic methanogenesis
4H2 + CO2 → CH4 + 2H2O ΔG° = −135.0 KJ        (Reaction 2)

5. Conclusions

In conclusion, a change in the metabolic route within the anaerobic co-digestion reactor with residues from the production of 1G2G ethanol was observed, compared to the metabolic route of the microbial community before being inserted into the reactor. The predominant metabolic route for co-AD from residues of ethanol production was the syntrophic acetate oxidation (SAO) process coupled with hydrogenotrophic methanogenesis, with the production of CH4 occurring preferentially via CO2 reduction. These results show the characterization of the proteins present in the process, evidencing that the use of NP can promote an increase in the abundance of proteins, as was the case of xylose isomerase and improved CH4 production. This work highlights group metabolism and how this approach is important for understanding metabolic pathways within anaerobic digestion, but for future studies, is still necessary to apply of different techniques and analyses to deepen the knowledge. In addition, this study shows how basic science is an important step for supporting an efficient large-scale operation and providing information for a sugarcane plant or other industries develop a more selected inoculum with specific bacteria that are able to produce those necessary proteins, thus saving time and increasing productivity.

Supplementary Materials

The following supporting information can be downloaded at: https://www.mdpi.com/article/10.3390/biomass2040024/s1, Figure S1. Heatmap with Pearson correlation coefficients among SI, R-CoAD and RN samples. All positive correlations are shown in red and negative correlations are shown in blue. The numbers inside the square represent the correlation values. Figure S2. Hierarchical clustering analysis of the abundance profiles of the identified 139 proteins with ID of protein. Table S1. Proteins that were differentially abundant between samples SI and R-NP. Table S2. Proteins that were differentially abundant between samples SI and R-CoAD. Table S3. Proteins that were differentially abundant between samples R-NP and R-CoAD. Table S4. Relative abundance of identified proteins assigned to Bacterial and Archaea genera in each sample.

Author Contributions

M.P.C.V.: conceptualization, investigation, methodology, data curation, and writing—original draft preparation. L.O.M.: methodology, resources, data curation, and writing—original draft preparation. F.V.W.: writing—review and editing, supervision, and funding acquisition. M.T.V.L.: methodology, data curation, formal analysis, writing—review and editing. B.S.M.: conceptualization, formal analysis, writing—review and editing, supervision, and funding acquisition. All authors have read and agreed to the published version of the manuscript.

Funding

This research was funded São Paulo Research Foundation (FAPESP), grant numbers 2018/09893-1 to M.P.C.V., 2016/16438-3 to B.S.M., and 2016/06601-4 to F.V.W.

Institutional Review Board Statement

Not applicable.

Informed Consent Statement

Not applicable.

Acknowledgments

The authors gratefully acknowledge the support of the Environment and Sanitation Laboratory (LMAS) at the School of Agricultural Engineering (FEAGRI/UNICAMP), the National Laboratory of Biorenewables (LNBR/CNPEM), and the Interdisciplinary Center of Energy Planning (NIPE/UNICAMP). The authors would also like to acknowledge the Max Feffer Laboratory of Plant Genetics, Department of Genetics, University of São Paulo, (ESALQ/USP), especially Carlos Labate for all the support in the proteomic analysis.

Conflicts of Interest

The authors declare no conflict of interest.

References

  1. Longati, A.A.; Lino, A.R.A.; Giordano, R.C.; Furlan, F.F.; Cruz, A.J.G. Biogas Production from Anaerobic Digestion of Vinasse in Sugarcane Biorefinery: A Techno-economic and Environmental Analysis. Waste Biomass Valorization 2020, 11, 4573–4591. [Google Scholar] [CrossRef]
  2. Meyer, A.K.P.; Ehimen, E.A.; Holm-Nielsen, J.B. Future European biogas: Animal manure, straw and grass potentials for a sustainable European biogas production. Biomass Bioenergy 2018, 111, 154–164. [Google Scholar] [CrossRef]
  3. Parralejo, A.I.; Royano, L.; González, J.; González, J.F. Small scale biogas production with animal excrement and agricultural residues. Ind. Crops Prod. 2019, 131, 307–314. [Google Scholar] [CrossRef]
  4. Pramanik, S.K.; Suja, F.B.; Zain, S.M.; Pramanik, B.K. The anaerobic digestion process of biogas production from food waste: Prospects and constraints. Bioresour. Technol. Rep. 2019, 8, 100310. [Google Scholar] [CrossRef]
  5. Moraes, B.S.; Zaiat, M.; Bonomi, A. Anaerobic digestion of vinasse from sugarcane ethanol production in Brazil: Challenges and perspectives. Renew. Sustain. Energy Rev. 2015, 44, 888–903. [Google Scholar] [CrossRef]
  6. Fuess, L.T.; Ferraz, A.D.N.; Machado, C.B.; Zaiat, M. Temporal dynamics and metabolic correlation between lactate-producing and hydrogen-producing bacteria in sugarcane vinasse dark fermentation: The key role of lactate. Bioresour. Technol. 2018, 247, 426–433. [Google Scholar] [CrossRef]
  7. Volpi, M.P.C.; Brenelli, L.B.; Mockaitis, G.; Rabelo, S.C.; Franco, T.T.; Moraes, B.S. Use of lignocellulosic residue from second-generation ethanol production to enhance methane production through co-digestion. Bioenergy Res. 2021, 15, 602–616. [Google Scholar] [CrossRef]
  8. Brenelli, L.B.; Figueiredo, F.L.; Damasio, A.T.; Franco, T.; Rabelo, S.C. An integrated approach to obtain xylo-oligosaccharides from sugarcane straw: From lab to pilot scale. Bioresour. Technol. 2020, 313, 123637. [Google Scholar] [CrossRef]
  9. Volpi, M.P.C.; Junior, A.D.N.F.; Franco, T.T.; Moraes, B.S. Operational and biochemical aspects of co-digestion (co-AD) from sugarcane vinasse, filter cake, and deacetylation liquor. Appl. Microbiol. Biotechnol. 2021, 105, 8969–8987. [Google Scholar] [CrossRef]
  10. Volpi, M.P.C.; Fuess, L.T.; Moraes, B.S. Anaerobic co-digestion of residues in 1G2G sugarcane biorefineries for enhanced electricity and biomethane production. Bioresour. Technol. 2021, 330, 124999. [Google Scholar] [CrossRef]
  11. Leite, A.F.; Janke, L.; Harms, H.; Zang, J.W.; Fonseca-Zang, W.A.; Stinner, W.; Nikolausz, M. Assessment of the Variations in Characteristics and Methane Potential of Major Waste Products from the Brazilian Bioethanol Industry along an Operating Season. Energy Fuels. 2015, 29, 4022–4029. [Google Scholar] [CrossRef]
  12. Abdelsalam, E.; Samer, M.; Attia, Y.A.; Abdel-Hadi, M.A.; Hassan, H.E.; Badr, Y. Influence of zero valent iron nanoparticles and magnetic iron oxide nanoparticles on biogas and methane production from anaerobic digestion of manure. Energy 2017, 120, 842–853. [Google Scholar] [CrossRef]
  13. Abdelsalam, E.; Samer, M.; Attia, Y.A.; Abdel-Hadi, M.A.; Hassan, H.E.; Badr, Y. Comparison of nanoparticles effects on biogas and methane production from anaerobic digestion of cattle dung slurry. Renew. Energy 2016, 87, 592–598. [Google Scholar] [CrossRef]
  14. Ali, A.; Mahar, R.B.; Soomro, R.A.; Sherazi, S.T.H. Fe3O4 nanoparticles facilitated anaerobic digestion of organic fraction of municipal solid waste for enhancement of methane production. Energy Sources Part A Recover. Util. Environ. Eff. 2017, 39, 1815–1822. [Google Scholar] [CrossRef]
  15. Volpi, M.P.C.; Mockaitis, G.; Bruant, G.; Tremblay, J.; Moraes, B.S. Use of Fe3O4 nanoparticles in reactor co-digestion of residues from 1G2G ethanol biorefinery: Microbiological routes and operational aspects. BioRxiv 2022. [Google Scholar] [CrossRef]
  16. Abram, F.; Enright, A.M.; O’Reilly, J.; Botting, C.H.; Collins, G.; O’Flaherty, V.A. metaproteomic approach gives functional insights into anaerobic digestion. J. Appl. Microbiol. 2011, 110, 1550–1560. [Google Scholar] [CrossRef]
  17. Wu, J.H.; Wu, F.Y.; Chuang, H.P.; Chen, W.Y.; Huang, H.J.; Chen, S.H.; Liu, W.T. Community and proteomic analysis of methanogenic consortia degrading terephthalate. Appl. Environ. Microbiol. 2013, 79, 105–112. [Google Scholar] [CrossRef] [Green Version]
  18. Hurkman, W.J.; Tanaka, C.K. Solubilization of Plant Membrane Proteins for Analysis by Two-Dimensional Gel Electrophoresis. Plant Physiol. 1986, 81, 802–806. [Google Scholar] [CrossRef] [Green Version]
  19. Bradford, M.M. A Rapid and Sensitive Method for the Quantitation of Microgram Quantities of Protein Utilizing the Principle of Protein-Dye Binding. Anal. Biochem. 1976, 72, 248–254. [Google Scholar] [CrossRef]
  20. Laemmli, U.K. Cleavage of Structural Proteins during the Assembly of the Head of Bacteriophage T4. Nature 1970, 227, 680–685. [Google Scholar] [CrossRef]
  21. Boaretto, L.F.; Labate, M.T.V.; Franceschini, L.M.; Cataldi, T.R.; Budzinski, I.G.F.; Moraes, F.E.; Labate, C.A. Proteomics Reveals an Increase in the Abundance of Glycolytic and Ethanolic Fermentation Enzymes in Developing Sugarcane Culms During Sucrose Accumulation. Front. Plant Sci. 2021, 12, 1–17. [Google Scholar] [CrossRef] [PubMed]
  22. Meier, F.; Beck, S.; Grassl, N.; Lubeck, M.M.; Park, A.; Raether, O.; Mann, M. Parallel accumulation-serial fragmentation (PASEF): Multiplying sequencing speed and sensitivity by synchronized scans in a trapped ion mobility device. J. Proteome Res. 2015, 14, 5378–5387. [Google Scholar] [CrossRef] [PubMed] [Green Version]
  23. Kanehisa, M.; Sato, Y.; Morishima, K. BlastKOALA and GhostKOALA: KEGG Tools for Functional Characterization of Genome and Metagenome Sequences. J. Mol. Biol. 2016, 428, 726–731. [Google Scholar] [CrossRef] [PubMed] [Green Version]
  24. Abdelsalam, E.; Samer, M.; Attia, Y.A.; Abdel-Hadi, M.A.; Hassan, H.E.; Badr, Y. Effects of Co and Ni nanoparticles on biogas and methane production from anaerobic digestion of slurry. Energy Convers. Manag. 2017, 141, 108–119. [Google Scholar] [CrossRef]
  25. Hassanein, A.; Lansing, S.; Tikekar, R. Bioresource Technology Impact of metal nanoparticles on biogas production from poultry litter. Bioresour. Technol. 2019, 275, 200–206. [Google Scholar] [CrossRef] [PubMed]
  26. Faisal, S.; Salama, E.S.; Malik, K.; hun Lee, S.; Li, X. Anaerobic digestion of cabbage and cauliflower biowaste: Impact of iron oxide nanoparticles (IONPs) on biomethane and microbial communities alteration. Bioresour. Technol. Rep. 2020, 12, 100567. [Google Scholar] [CrossRef]
  27. Lam, T.K.; Yang, J.T.; Lai, S.J.; Liang, S.Y.; Wu, S.H. Meta-proteomics analysis of microbial ecosystem during the anaerobic digestion of chicken manure in biogas production farm. Bioresour. Technol. Rep. 2021, 13, 100643. [Google Scholar] [CrossRef]
  28. Andrés-Barrao, C.; Saad, M.M.; Chappuis, M.L.; Boffa, M.; Perret, X.; Ortega Pérez, R.; Barja, F. Proteome analysis of Acetobacter pasteurianus during acetic acid fermentation. J. Proteom. 2012, 75, 1701–1717. [Google Scholar] [CrossRef]
  29. Géron, A.; Werner, J.; Wattiez, R.; Lebaron, P.; Matallana-Surget, S. Deciphering the functioning of microbial communities: Shedding light on the critical steps in metaproteomics. Front. Microbiol. 2019, 10, 1–12. [Google Scholar] [CrossRef] [Green Version]
  30. Pan, X.; Angelidaki, I.; Alvarado-Morales, M.; Liu, H.; Liu, Y.; Huang, X.; Zhu, G. Methane production from formate, acetate and H2/CO2; focusing on kinetics and microbial characterization. Bioresour. Technol. 2016, 218, 796–806. [Google Scholar] [CrossRef]
  31. Merlin Christy, P.; Gopinath, L.R.; Divya, D. A review on anaerobic decomposition and enhancement of biogas production through enzymes and microorganisms. Renew. Sustain. Energy Rev. 2014, 34, 167–173. [Google Scholar] [CrossRef]
  32. Huang, J.; Ma, K.; Xia, X.; Gao, K.; Lu, Y. Biochar and magnetite promote methanogenesis during anaerobic decomposition of rice straw. Soil Biol. Biochem. 2020, 143, 107740. [Google Scholar] [CrossRef]
  33. Bertucci, M.; Calusinska, M.; Goux, X.; Rouland-lefèvre, C.; Untereiner, B.; Ferrer, P. Carbohydrate Hydrolytic Potential and Redundancy of an Anaerobic Digestion Microbiome Exposed to Acidosis, as Uncovered by Metagenomics. Appl. Environ. Micro. 2019, 85, 16. [Google Scholar] [CrossRef] [PubMed] [Green Version]
  34. Ping, Q.; Zheng, M.; Dai, X.; Li, Y. Metagenomic characterization of the enhanced performance of anaerobic fermentation of waste activated sludge with CaO2 addition at ambient temperature: Fatty acid biosynthesis metabolic pathway and CAZymes. Water Res. 2020, 170, 115309. [Google Scholar] [CrossRef] [PubMed]
Figure 1. s-CSTR operation scheme and obtaining samples for proteomics analysis.
Biomass 02 00024 g001
Figure 2. Relative abundance of proteins found in each sample. Average of triplicates. SI: seed inoculum, R-NP: Nanoparticle’s reactor, R-CoAD: Co-digestion reactor.
Biomass 02 00024 g002
Figure 3. Relative abundance and distribution of identified proteins assigned to bacterial and archaea in each sample. Average of triplicates. SI: seed inoculum, R-NP: Nanoparticle’s reactor, R-CoAD: Co-digestion reactor.
Biomass 02 00024 g003
Figure 4. (A) Hierarchical clustering analysis of the abundance profiles of the identified 139 proteins. The nine columns represent triplicates of different treatments (SI, R-CoAD and R-NP). The rows represent individual proteins. The more and less abundant proteins are, respectively, shown in orange and blue. The intensity of color increases with increased abundance differences, as shown in the bar. (B) Functional categories of clusters originated in (A). The two different clusters were analyzed using BlastKOALA and are comparatively shown as a bar chart. (C) Molecular functions of samples, according to UniProtKB ontology (GO) gene classification.
Biomass 02 00024 g004aBiomass 02 00024 g004b
Figure 5. General proposed map of the metabolic pathways for 3 samples. SI: seed inoculum, R-NP: Nanoparticle’s reactor, R-CoAD: Co-digestion reactor. The red enzymes were detected in process. The white background is the metabolic maps for all samples, the light orange background maps are found for the sample R-NP and R-CoAD, and the map with a gray background is found in sample SI.
Biomass 02 00024 g005
Table 1. Main characteristics of the substrates used in the two reactor operations.
Characterization aVinasse bDeacetylation Liquor bFilter Cake b
COD (g L−1)17.02 ± 0.4510.44 ± 0.01-
Volatile Solids (g mL−1)0.09 ± 0.000.00 ± 0.000.21 ± 0.00
Total Solids (g mL−1)0.01± 0.000.01 ± 0.000.31 ± 0.00
Total Carbon (mg L−1)126,588± 0.0216,652 ± 0.33-
Nitrogen (mg L−1)302.50 ± 0.15121.20 ± 0.28-
Acetate (g mL−1)0 1063-
Glucose (g mL−1)738.30726.50-
-: not carried out. a: Results were taken from Volpi et al. [9] and b Mean of three replicates.
Table 2. Summary of operating results of the two reactors used for sample removal for proteomics analysis.
R-CoAD ReactorR-NP Reactor
Organic Matter Removal (%)8371
CH4 production (NmLCH4 gVS−1)2342800
Organic Load Rate (gVS L−1 day−1)4.165.23
Predominant Archaea Methanogenic Methanoculleus.Methanoculleus.
Publisher’s Note: MDPI stays neutral with regard to jurisdictional claims in published maps and institutional affiliations.

