1. Introduction
Wheat straw is the second most plentiful agricultural residue in the world after rice straw [
1]. While leaving some straw on the field as mulch can enhance soil carbon and provide other soil health benefits [
2], this abundant byproduct of agriculture also has potential to be utilized as a feedstock for biofuel production. To supply a large-scale biorefinery industry year-round, most feedstock will need to be transported tens to hundreds of kilometers from the field to the biorefineries and be stored for many months between harvest seasons [
3]. As a feedstock for biofuel production, raw biomass often has suboptimum characteristics for transportation, storage, and handling, including low bulk density, high moisture content and a hydrophilic nature. Because of these characteristics, higher costs for handling and transportation are incurred [
4]. Torrefaction can be used to minimize these problems and improve the properties of biomass for logistics operations [
5,
6].
Torrefaction is a thermal pretreatment generally carried out in the temperature range of 200–300 °C under an oxygen-deprived inert atmosphere, with volatilization of biomass constituents associated with losses of 5% to 25% of the original biomass energy content [
7]. Thermal deconstruction is greater for hemicellulose than for cellulose and lignin and increases with torrefaction temperature, as does the fraction of biomass constituents converted to liquid tars and water [
8]. The properties such as hydrophobicity, energy density, and grindability of biomass improve abruptly after a certain critical temperature [
9]. For instance, for wheat straw, there was no big improvement of grindability when torrefaction temperature was lower than 200 °C and increases sharply when torrefaction temperature goes from 230 °C to 300 °C [
10]. The critical temperature is different for various feedstocks, indicating that careful optimization is required for different types of biomass to maximize the benefits of torrefaction while still retaining much of the energy yield.
Research on torrefaction has often focused on supply chain benefits and downstream use in thermochemical applications such as combustion or gasification [
11,
12]. Relatively few studies have considered downstream biochemical conversion of torrefied biomass. Biochemical conversion of lignocellulose normally uses some combination of mechanical, thermal, chemical, and/or biological pretreatment prior to enzymatic hydrolysis, forming sugar intermediates such as glucose and xylose that microbes can convert into chemicals and fuels [
13,
14]. Sheikh et al. [
15,
16] reported that glucose yield improved with mild torrefaction treatment, with the highest increases of 61% for rice straw pretreated at 220 °C for 40 min and 45% for waste money bills pretreated at 180 °C for 40 min. In contrast, Chiaramonti et al. [
17] and Normark et al. [
18] found that even mild torrefaction conditions decreased the glucose yield of Olive prunings and Norway spruce, respectively, although in the case of Norway spruce a subsequent ionic liquid pretreatment was able to overcome the increased recalcitrance associated with torrefaction. Memis [
19] also reported that torrefaction has a negative impact on glucose yield of wheat straw. However, alkaline pretreatment of the torrefied biomass improved glucose yields relative to torrefied samples that were not alkaline treated. For instance, glucose yield from wheat straw torrefied at 180 °C for 75 min was 51.6 mg/g of treated biomass which increases to 579.9 mg/g of treated biomass with 1% NaOH pretreatment which is only 6.7% lower than the glucose yield of raw wheat straw at 1% NaOH pretreatment, which was 621.6 mg/g of treated biomass (Memis 2018). If the torrefied wheat straw at these conditions can accrue logistical benefits that can compensate for the 6.7% yield reduction, there seem to be potential for torrefied biomass to be used by bioethanol industry after coupling it with alkaline pretreatment. However, it should be noted that, in addition to compensating for reduced yield, logistical benefits should be high enough to compensate for cost of torrefaction and mass loss caused by torrefaction. The heat integration and optimal use of torgas to achieve autothermal operation can cut down the cost of torrefaction [
20].
Torrefaction may hinder hydrolysis either by modifying the biomass structure to reduce enzyme access or change the nature of biomass constituents, making the biomass itself more recalcitrant, or by creating inhibitory components from the constituents of biomass that inactivate the enzymes by binding or other mechanisms. Sheikh et al. [
15] speculated that chemical inhibitors created by torrefaction were the reason for the lower glucose yield from torrefied rice straw. Normark et al. [
18] found that the Klason-lignin value increased after torrefaction, which they interpreted as the formation of pseudo-lignin, a lignin like material derived from carbohydrates. The chemical structure of this hypothesized compound remains uncertain, but several authors have reported that pseudo-lignin has a negative impact on glucose yield caused by unproductive binding of cellulase enzyme to this long chain carbohydrate with altered surface chemistry [
21,
22,
23]. Chen et al. [
8] observed that xylan began decomposing at lower torrefaction temperatures (210–240 °C) while cellulose and lignin started decomposing mainly above 270 °C, and that acetic acid, formic acid, furans and ketones were detected in the tar of xylan. These acids, furans and ketones have also been shown to inhibit enzymatic hydrolysis [
24,
25,
26,
27]. Jing et al. [
24] found that the formic acid (25 mg/mL), furfural (3 mg/mL), and 5-Hydroxy Methyl Furfural (3 mg/mL) caused the reduction in glucose yield by 25%, 5%, and 10% respectively. Thus, inhibitory compounds formed during torrefaction could include these tar condensation products as well as pseudolignin. If torrefaction temperatures are in the range where xylan degrades and these tar condensation inhibitors form, then an increase in torrefaction intensity should increase the acid content of torrefied samples. The resulting drop in pH may therefore serve as an indicator of the chemical changes caused by torrefaction.
Since hemicellulose and lignin are solubilized and removed from the lignocellulosic matrix by alkaline pretreatment [
28,
29], if the biomass is washed after pretreatment less inhibitor is likely to be formed during subsequent torrefaction. If the improvements due to alkaline pretreatment after torrefaction reported by Memis [
19] are due to solubilization of inhibitory compounds, the precursors for these inhibitory components (mostly hemicellulose) could possibly be removed by alkaline treatment and washing prior to torrefaction.
The objectives of this study were to (1) measure the pH of the sample suspension (dependent variable) to see if it shows a decreasing trend with increasing torrefaction severity (independent variable), and (2) assess the impact of the order of alkaline pretreatment relative to torrefaction on the glucose yield of wheat straw. Comparison of the performance of alkaline pretreatment pre- and post-torrefaction has not been done before. This study would provide insight into how the order of alkaline pretreatment affects the glucose yield of torrefied biomass. The findings will be very helpful in designing a bioethanol system from torrefied biomass. Another novelty of this research is that this study aims to correlate the torrefaction severity to the pH of the corresponding torrefied biomass. If there exists a correlation, measuring the pH of the biomass suspension can serve as an inexpensive screening tool for determining the extent of change in the glucose yield that can be caused by torrefaction. This observational study does not directly measure the underlying contributors impacting the hydrolysis of torrefied samples but can provide insights as to the possible mechanisms involved.
2. Materials and Methods
Post-grain-harvested and field-dried wheat straw was obtained from The Penn State Agronomy Research Farm to use as feedstock. The wheat straw was stored indoors in a bale at room temperature prior to the experiments. Samples of wheat straw were then alkaline treated using NaOH, torrefied, and subjected to enzymatic hydrolysis to assess the effects of torrefaction on the glucose yield. To assess the impact of order of alkaline pretreatment (AP), T-AP data were retrieved from Memis [
19]. The methodology of Memis [
19] was closely followed in this study for the AP-T data with some exceptions as shown in
Table 1.
2.1. Alkaline Pretreatment (AP)
Batches of about 40 g of wheat straw (~35 cm in length) were submerged in 1000 mL of 1% (
w/v) NaOH solution. The jars were then heat-treated in a laboratory scale Beta Star Autoclave (RV Industries, Honey Brook, PA, USA) set at a constant temperature of 121 °C and pressure of 15 psi for 1 h [
30], followed by a 30-min cool-down period to room temperature. The wheat straw was then removed from the treatment solution using a strainer and was washed several times with deionized (DI) water until the wash water had a neutral pH. The pretreated and washed wheat straw was then placed inside a drying oven set at 105 °C for 15 h to dry. For alkaline pretreatment before torrefaction (AP-T) (new data from this study) the sample was then weighed and placed on a tray for torrefaction. For the reverse order, torrefaction before alkaline pretreatment (T-AP) [
19], the input to this alkaline pretreatment procedure was 4 g of already ground and torrefied wheat straw, with the torrefaction conditions summarized in
Table 1 and the procedure as described below.
For T-AP order by Memis [
19], the wheat straw was first ground using a knife mill (Munson SCC-10S, Utica, NY, USA) and the ground wheat straw (1.5 mm screen size) was torrefied using a Lindeberg/Blue Lab oven (Model BF51828C-1, Asheville, NC, USA). For alkaline pretreatment, raw and torrefied wheat straw samples were immersed in dilute sodium hydroxide (NaOH) solution at concentrations of 0.75%, 1%, and 2% (weight, g/volume, mL) and a biomass solid loading of 10% (4 g biomass in 40 mL solution). The samples were then heated in an autoclave to 121 °C (15 psi) and kept at that temperature for one hour. Samples were then washed with DI water until the wash water showed a pH of 7.0. Alkaline pretreated and washed samples were then stored in a plastic bag at 4 °C until enzymatic hydrolysis.
Some differences in methodology were used for T-AP vs. AP-T samples. T-AP and AP-T experiments were carried out at different ranges of temperature and residence time. Hence, for comparison purposes, temperature and time were used to calculate a combined torrefaction severity metric as explained in
Section 2.2.1. In AP-T, wheat straw was in an uncomminuted state during alkaline pretreatment because comminution in an industrial setting would be done only after torrefaction as torrefaction improves grindability of biomass. Because of the low bulk density of uncomminuted wheat straw, solid loading had to be decreased in AP-T to ensure the adequate submersion of wheat straw in the alkaline solution. The impact of these methodological differences between T-AP [
19] and AP-T (this study) as shown in
Table 1 is expected to be minor, and differences in measured performance can be attributed primarily to the order of the process. As evidence for this, it is notable that experiments using both orders (T-AP and AP-T) have a common control sample (i.e., raw wheat straw), and glucose yield values for the control sample in both of these orders showed no significant statistical difference).
2.2. Torrefaction
Both alkaline pretreated and non-pretreated wheat straw were torrefied separately. Batches of about 36 g of “as received/non-pretreated” wheat straw and “alkaline pretreated” material were placed in a tray and torrefied using a fixed-bed lab oven (Model BF51828C-1, Lindberg, Asheville, NC, USA) which had a chamber dimension of 30.5 cm H × 30.5 cm W × 45.7 cm D. Torrefaction was conducted under an inert nitrogen gas stream with a constant feed rate of 4 L/min. Three different torrefaction temperatures (200, 220, 240 °C) and three torrefaction process residence times (20, 40, 60 min) were selected as the torrefaction treatment conditions for the present study (torrefaction after alkaline pretreatment). Residence time was measured starting at the point when the oven temperature reached the setpoint. The mass of the samples after torrefaction was recorded and mass loss percentage was calculated on a dry mass basis. Raw and torrefied straw in all forms (alkaline pretreated as well as non-alkaline pretreated) were then ground using a blender (Model LBC15 SS, Waring, McConnellsburg, PA, USA) and the ground samples were sieved to select particles of <250 μm. Samples with particles <250 μm were then stored in sealed containers at room temperature until further use.
2.2.1. Calculation of Combined Torrefaction Severity (TS)
Combining temperature and time into a single parameter permit comparison of results from different treatment ranges. Torrefaction severity is a function of temperature and residence time. Temperature is reported to have a more pronounced effect on torrefaction than the residence time [
31,
32]. During torrefaction, the rate of decomposition follows a first order Arrhenius-type dependence on temperature [
33,
34,
35]. Therefore, torrefaction severity can be calculated based on the Arrhenius equation to arrive at an expression (Equation (1)) that relates the change in residual mass fraction (RMF) of biomass after torrefaction to the duration and temperature of the process as well as feedstock-based reaction coefficients.
where,
A = Pre-exponential factor (s−1)
Ea = Activation energy (J/mol)
R = Universal gas constant (8.314 J mol−1 K−1)
T = Torrefaction temperature (K)
t = time (s)
If we integrate the equation and set torrefaction severity (TS) equal to ∆RMF, then:
where ∆t is residence time. Equation (2) as an expression of torrefaction severity is only valid at temperature ranges common to the torrefaction process. For instance, the expression does not yield meaningful results if the process temperature is only at 100 °C. Torrefaction severity was calculated per Equation (2) using values of A = 4.34 × 10
3 s
−1, and Ea = 76,566 Joules/mole for wheat straw [
34].
2.3. Enzymatic Hydrolysis
Raw and pretreated samples (torrefied, alkaline pretreated, alkaline pretreated and torrefied) were hydrolyzed using the enzyme Cellic CTec2 (Novozyme Corporation, distributed by Sigma-Aldrich, St. Louis, MO, USA). The method outlined in the Laboratory Analytical Procedure (LAP) of National Renewable Energy Laboratory (NREL) for “Enzymatic Saccharification of Lignocellulosic Biomass” [
36] was closely followed for solid loading, pH of the buffer, quantity of antimicrobial agents, incubator temperature for hydrolysis. The NREL LAP report specifies the addition of cellulase, β-glucosidase, and hemicellulase for the complete hydrolysis process. Hence, the cocktail enzyme Cellic CTec2 by Novozyme Corporation was used as it is a blend of all the mentioned enzymes.
The 200 mL of 1M sodium citrate buffer with pH 4.8 was prepared. First, 31.33 g of sodium citrate dihydrate (mw: 294.10 g/mol) and 17.96 g of citric acid (mw: 192.12 g/mol) were added and allowed to dissolve in 160 mL of deionized water. The pH of the final solution was adjusted to final desired pH of 4.8 using HCl or NaOH. Deionized water was then added until the volume is 200 mL. Enzymatic hydrolysis was carried out in 15 mL centrifuge tubes containing 0.15 g of biomass (not including 2–8% moisture content of the samples) and a total of 10 mL of suspension solution, which consisted of 500 μL 1 M sodium citrate buffer (pH 4.8), 40 μL tetracycline solution and 30 μL cycloheximide as antimicrobial agents to prevent microbial growth, and 110 μL of enzyme solution (66 FPU/g dry biomass). DI water was then added to the suspension to adjust the solid loading to 1.5%. Solid loading of 1.5% could be a low solid loading from industrial aspect but is in accordance with NREL’s LAP [
36]. Enzymatic hydrolysis was performed in an incubator (Model #1545-2, Sheldon Manufacturing Inc, Cornelius, OR, USA) with a rotary shaker at 50 °C for 72 h [
36]. The suspension was then transferred to a hot-water bath (~100 °C) for 10 min to deactivate the enzyme. The suspensions were then allowed to cool down at room temperature. The hydrolysate was then filtered using 0.42 µm PTFE filter (Catalog #28145-497, Avantor, Inc., Radnor, PA, USA). Glucose concentration (g/L) of the hydrolysate was measured using a biochemical analyzer (YSI 2700, Yellow Springs, OH, USA) fitted with a glucose membrane. The glucose concentration was then converted into units of grams glucose/grams of dry biomass. Hydrolysis was carried out in triplicate. The glucose yield from alkaline pretreated then torrefied wheat straw (AP-T) was compared with the results of Memis [
19] in which the wheat straw was torrefied first and then alkaline pretreated (T-AP). The pH of the suspension was measured pre- and post- hydrolysis.
To evaluate the effects of torrefaction severity on pH and ultimately on glucose yield from enzymatic hydrolysis, the above steps were repeated for another set of experiments except that 500 μL of pure deionized water was added instead of 500 μL 1M sodium citrate buffer (pH 4.8). The buffer was omitted because the buffer might mask the effect of differences in pH of the different samples on enzymatic hydrolysis.
2.4. pH Measurement
The pH of each sample was measured using a pH meter (FiveEasy Plus FE20, Mettler Toledo, Columbus, OH, USA). This was carried out both prior to hydrolysis, and after the 72-h hydrolysis period.
2.5. Glucose Yield Calculation
Glucose yields (mg/g) are calculated using glucose concentration values obtained from YSI analyzer by using Equations (3) and (4). Equation (3) calculates glucose yield per gram of raw/original sample, whereas Equation (4) calculates glucose yield per gram of pretreated sample.
where,
mg glucose/mL is from YSI analysis
10 mL = total volume of assay
YGR = Glucose yield per gram of raw sample
YGP = Glucose yield per gram of pretreated sample
MR = Initial raw biomass added
MP = Initial pretreated biomass added
For comparison purpose, the percentage changes of the yields are discussed at various place which were calculated as the percentage ratio of ‘difference in yields’ to the ‘initial yield’.
2.6. Statistical Analysis
Data were analyzed using ANOVA to test for differences in means of glucose yield and pH in the alkaline treated vs. non alkaline treated samples. Tukey’s HSD test was used post hoc to elucidate further detail on the nature of any differences detected. The equations that describe the relationship between glucose yield and torrefaction severity were developed using Microsoft Excel software. Regression analysis was used to test for a linear relationship between torrefaction severity and pH of the suspension.
3. Results and Discussion
3.1. Mass Loss after Torrefaction
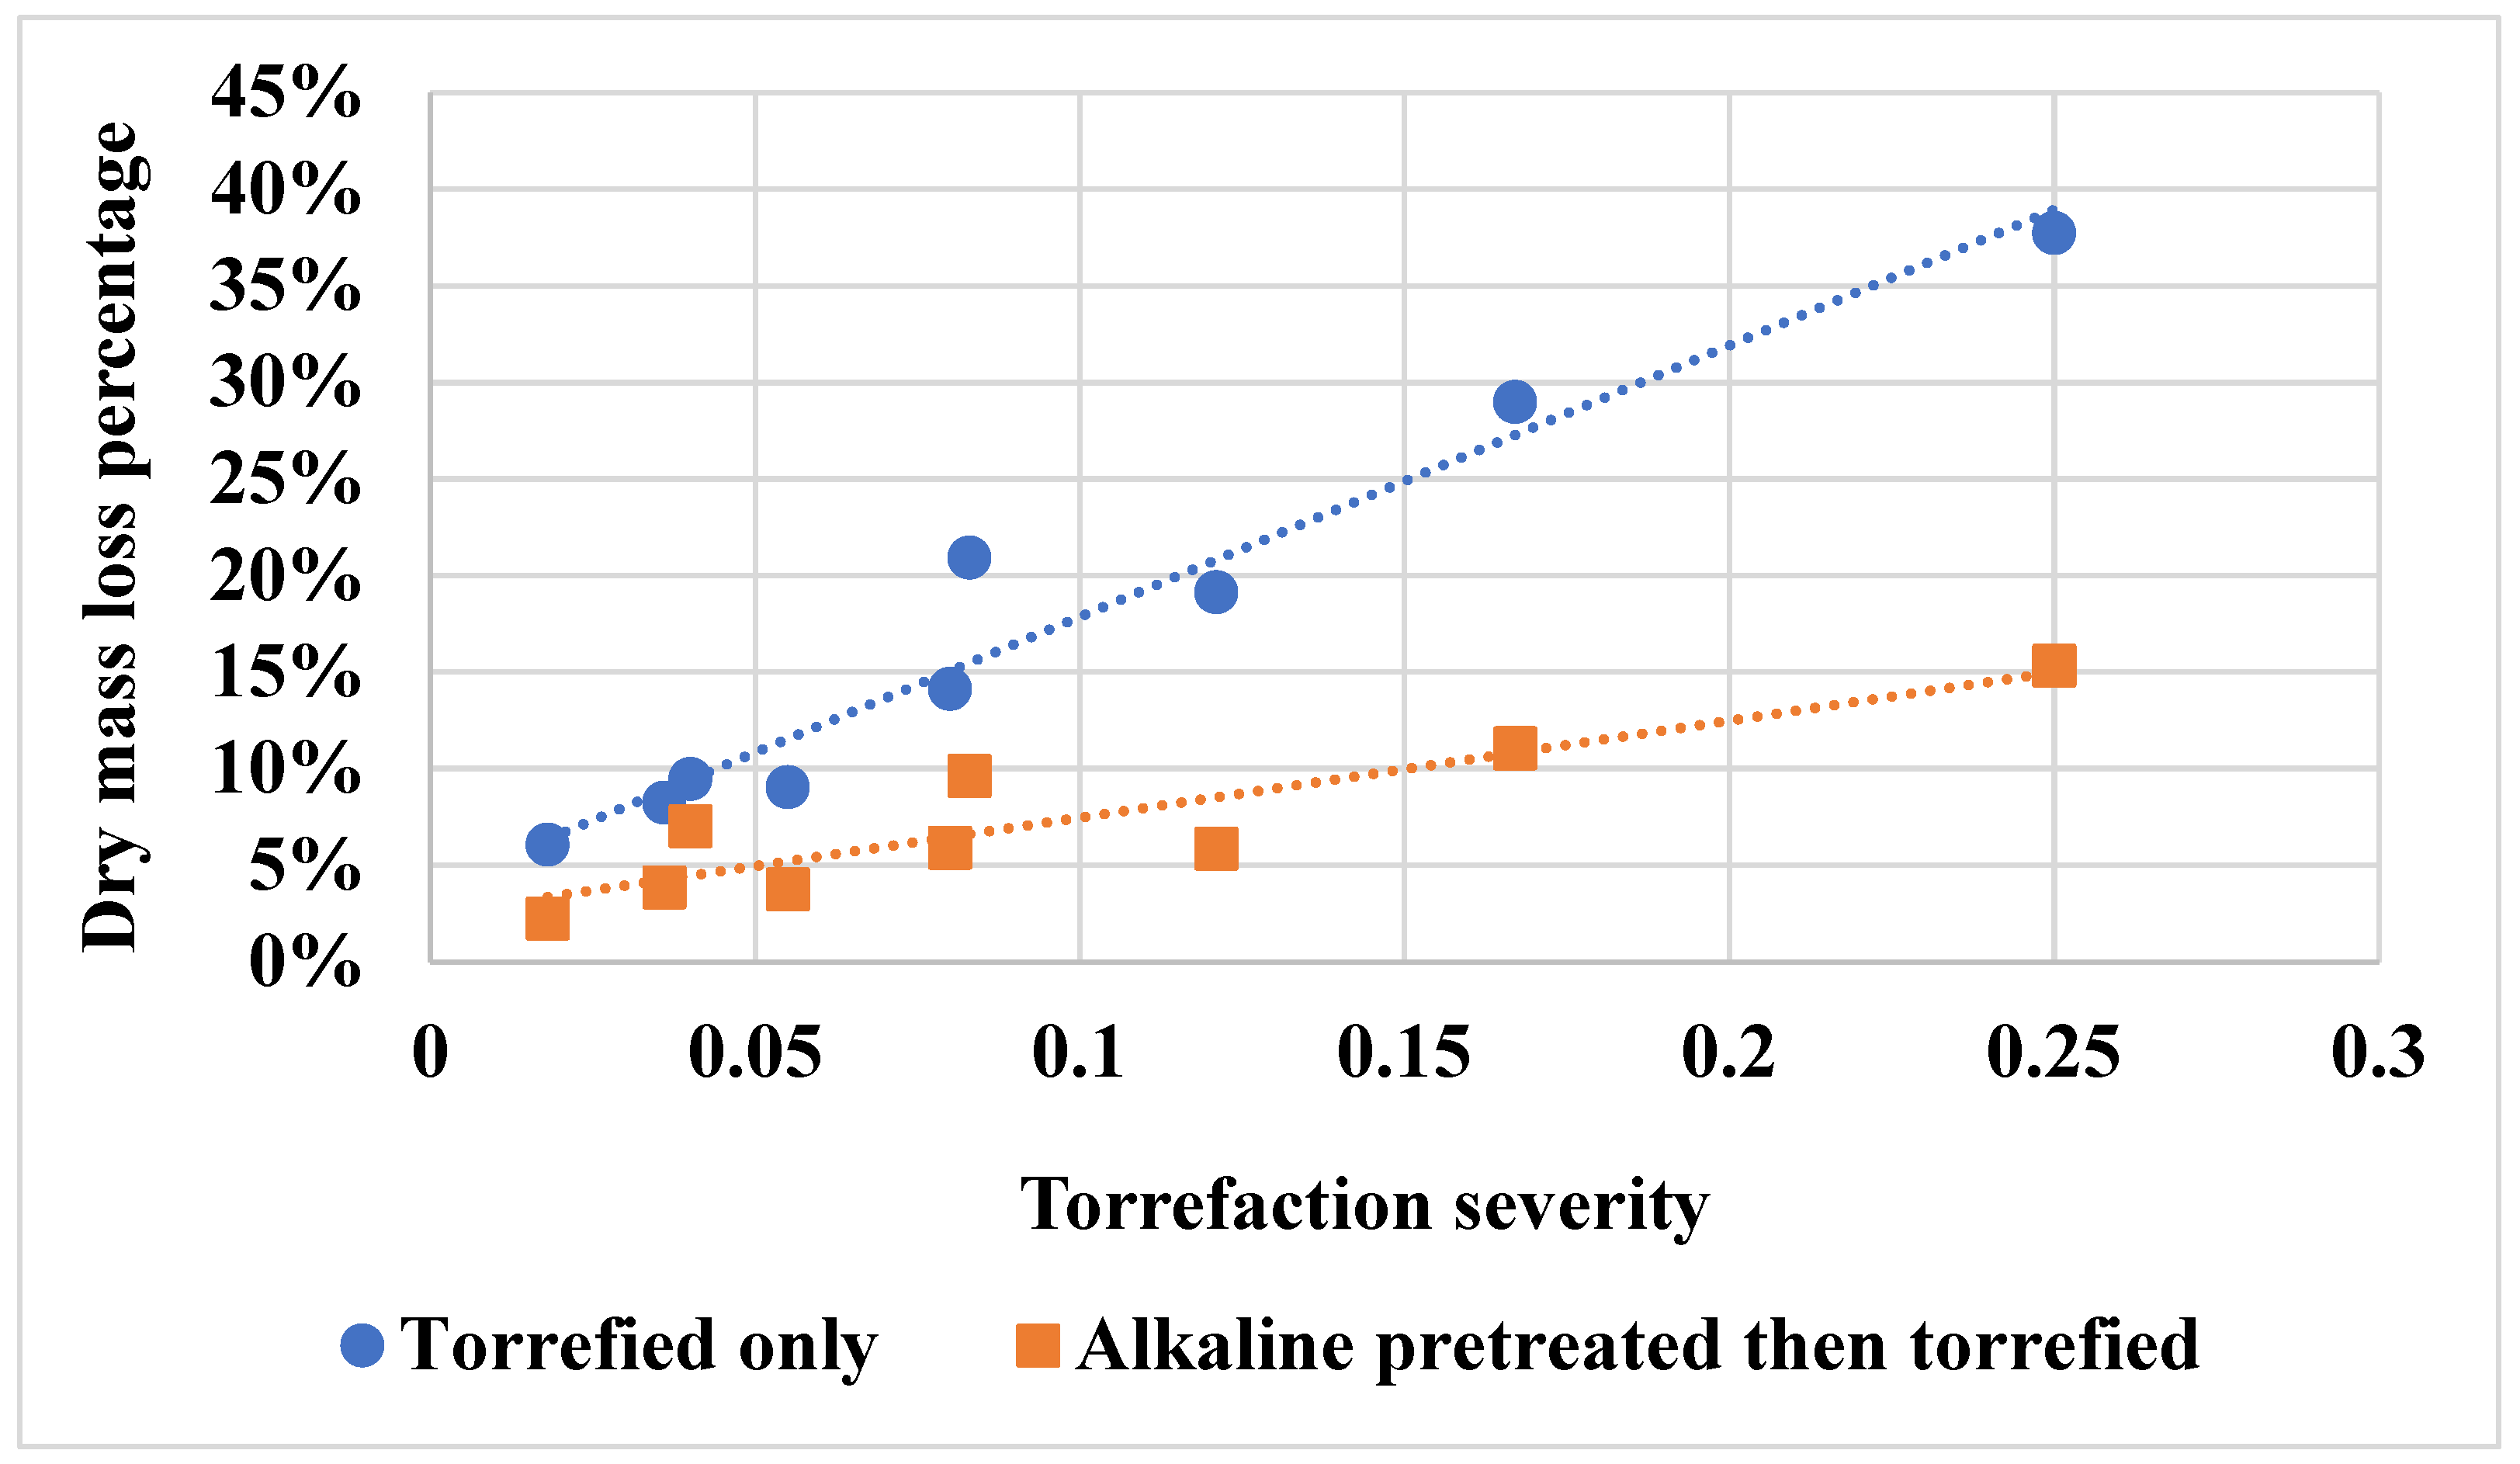
After torrefaction, the torrefied wheat straw appeared darker, and more brittle compared to the raw wheat straw. Alkaline pretreatment of the raw biomass resulted in an average dry mass loss of 48% (standard deviation = 4%). The raw wheat straw torrefied at 200 °C, 220 °C, 240 °C for 40 min showed 8%, 14%, and 29% dry mass loss compared with the non-torrefied sample. The alkaline treated raw wheat straw torrefied at 200 °C, 220 °C, 240 °C for 40 min showed 4%, 6%, and 11% dry mass loss compared with the non-torrefied alkaline treated sample. The measured dry mass loss due to torrefaction shows a linear relationship with torrefaction severity for each treatment as shown in
Figure 1.
During the torrefaction process wheat straw has less mass loss when alkaline pretreated than does non-alkaline pretreated (torrefied only) wheat straw (paired sample
t-test
p-value < 0.05). This reduction of ~60% could be in part because alkaline treatment solubilizes compounds (such as hemicelluloses) that would have otherwise been volatilized during torrefaction, so some of this mass loss has already occurred. The linear fit of mass loss to the calculated severity indicate that the Arrhenius-based torrefaction severity parameters Shang et al. [
34] developed for wheat straw remain useful predictors with or without alkaline pretreatment.
3.2. Glucose Yield
Torrefaction temperature and residence time have a significant effect on glucose yield of both non-alkaline pretreated (ANOVA p-value < 0.05) and alkaline pretreated (ANOVA p-value < 0.05) samples. Torrefaction has a negative impact on glucose yield. Compared to raw biomass, the glucose yield decreased by 86% and 96%, when torrefaction was carried out for one hour at 200 and 240 °C respectively. Conversely, alkaline pretreatment has a positive impact on glucose yield. Compared to torrefied only biomass, the glucose yield increased by 915%, and 136% for alkaline pretreated and torrefied biomass, when torrefaction was subsequently carried out for one hour at 200 and 240 °C respectively.
The highest yield was for alkaline treated raw biomass (652 mg g
−1). McIntosh and Vancov [
30] reports the glucose yield of about 480 mg/g of pretreated biomass for wheat straw pretreated by 1% NaOH and autoclaved at 121 °C for 1 h. This value of glucose from alkaline pretreated raw wheat straw is lower than the value reported in this study which can ascribed mainly to the much lower dosage of enzyme ((2.5 FPU cellulase, 2.5 CBU β-glucosidase and 1.5 FXU xylanase per gram of pretreated solids) used in McIntosh and Vancov [
30]. Lower yields were observed for samples torrefied at higher temperatures and longer residence times. Glucose yield (mg of glucose/g of treated biomass) from samples is shown in
Figure 2. Tukey’s HSD post hoc test groupings are given in
Table 2, as well as the combined torrefaction severity values which correspond to respective torrefaction temperatures and residence times.
When glucose yield is expressed on the basis of “per unit mass of raw biomass”, glucose yield values are lower than when the same results are reported “per unit of treated biomass”. This is expected because torrefaction and alkaline pretreatment both reduce sample dry mass. Glucose yield of alkaline treated raw biomass is still higher than for non-alkaline treated raw biomass, even for samples in which alkaline pretreatment reduces sample mass by as much as 50%. Thus, just as torrefaction tends to increase energy density, alkaline pretreatment tends to increase the “available glucose density” of the feedstock. Mass loss by torrefaction after alkaline pretreatment is much less pronounced (about 60% less) than when torrefaction occurs prior to alkaline pretreatment. This indicates that much of the energy densification function of torrefaction (i.e., solubilization of low energy hemicelluloses and other compounds) has already been done by alkaline pretreatment. This suggests that alkaline pretreatment, by itself, could be considered as an energy-densification process. However, the cost of drying after alkaline pretreatment must be taken into account, and other benefits of torrefaction such as hydrophobicity and better grindability are not features of alkaline pretreatment. The substantial dry matter loss associated with alkaline pretreatment and resource consumption for subsequent washing is also a concern. While this loss may be necessary to remove dissolved lignin and hemicellulose, and thus avoid hypothesized pseudo-lignin or inhibitor formation during torrefaction, it represents a loss of energy from the raw biomass. While the energy density and available glucose density are increased per unit of treated biomass, much smaller quantities of treated biomass remain. In addition to representing a loss of the original energy value of the biomass, these soluble compounds in the wastewater would require some sort of recovery, recycling or treatment.
Glucose yield for alkaline pretreated and torrefied biomass is always higher than for corresponding samples of non-alkaline pretreated torrefied samples. However, all of the alkaline pretreated and torrefied samples have a lower glucose yield than that of alkaline pretreated raw biomass. This implies that torrefaction will only be commercially attractive if supply chain benefits of torrefaction such as transportation and storage costs reduction are sufficiently large to compensate for the reduced yield. Future studies in the form of Techno-Economic Analysis (TEA) will be needed to assess tradeoffs between glucose yield and supply chain cost, and to identify optimum conditions for biochemical conversion of torrefied biomass.
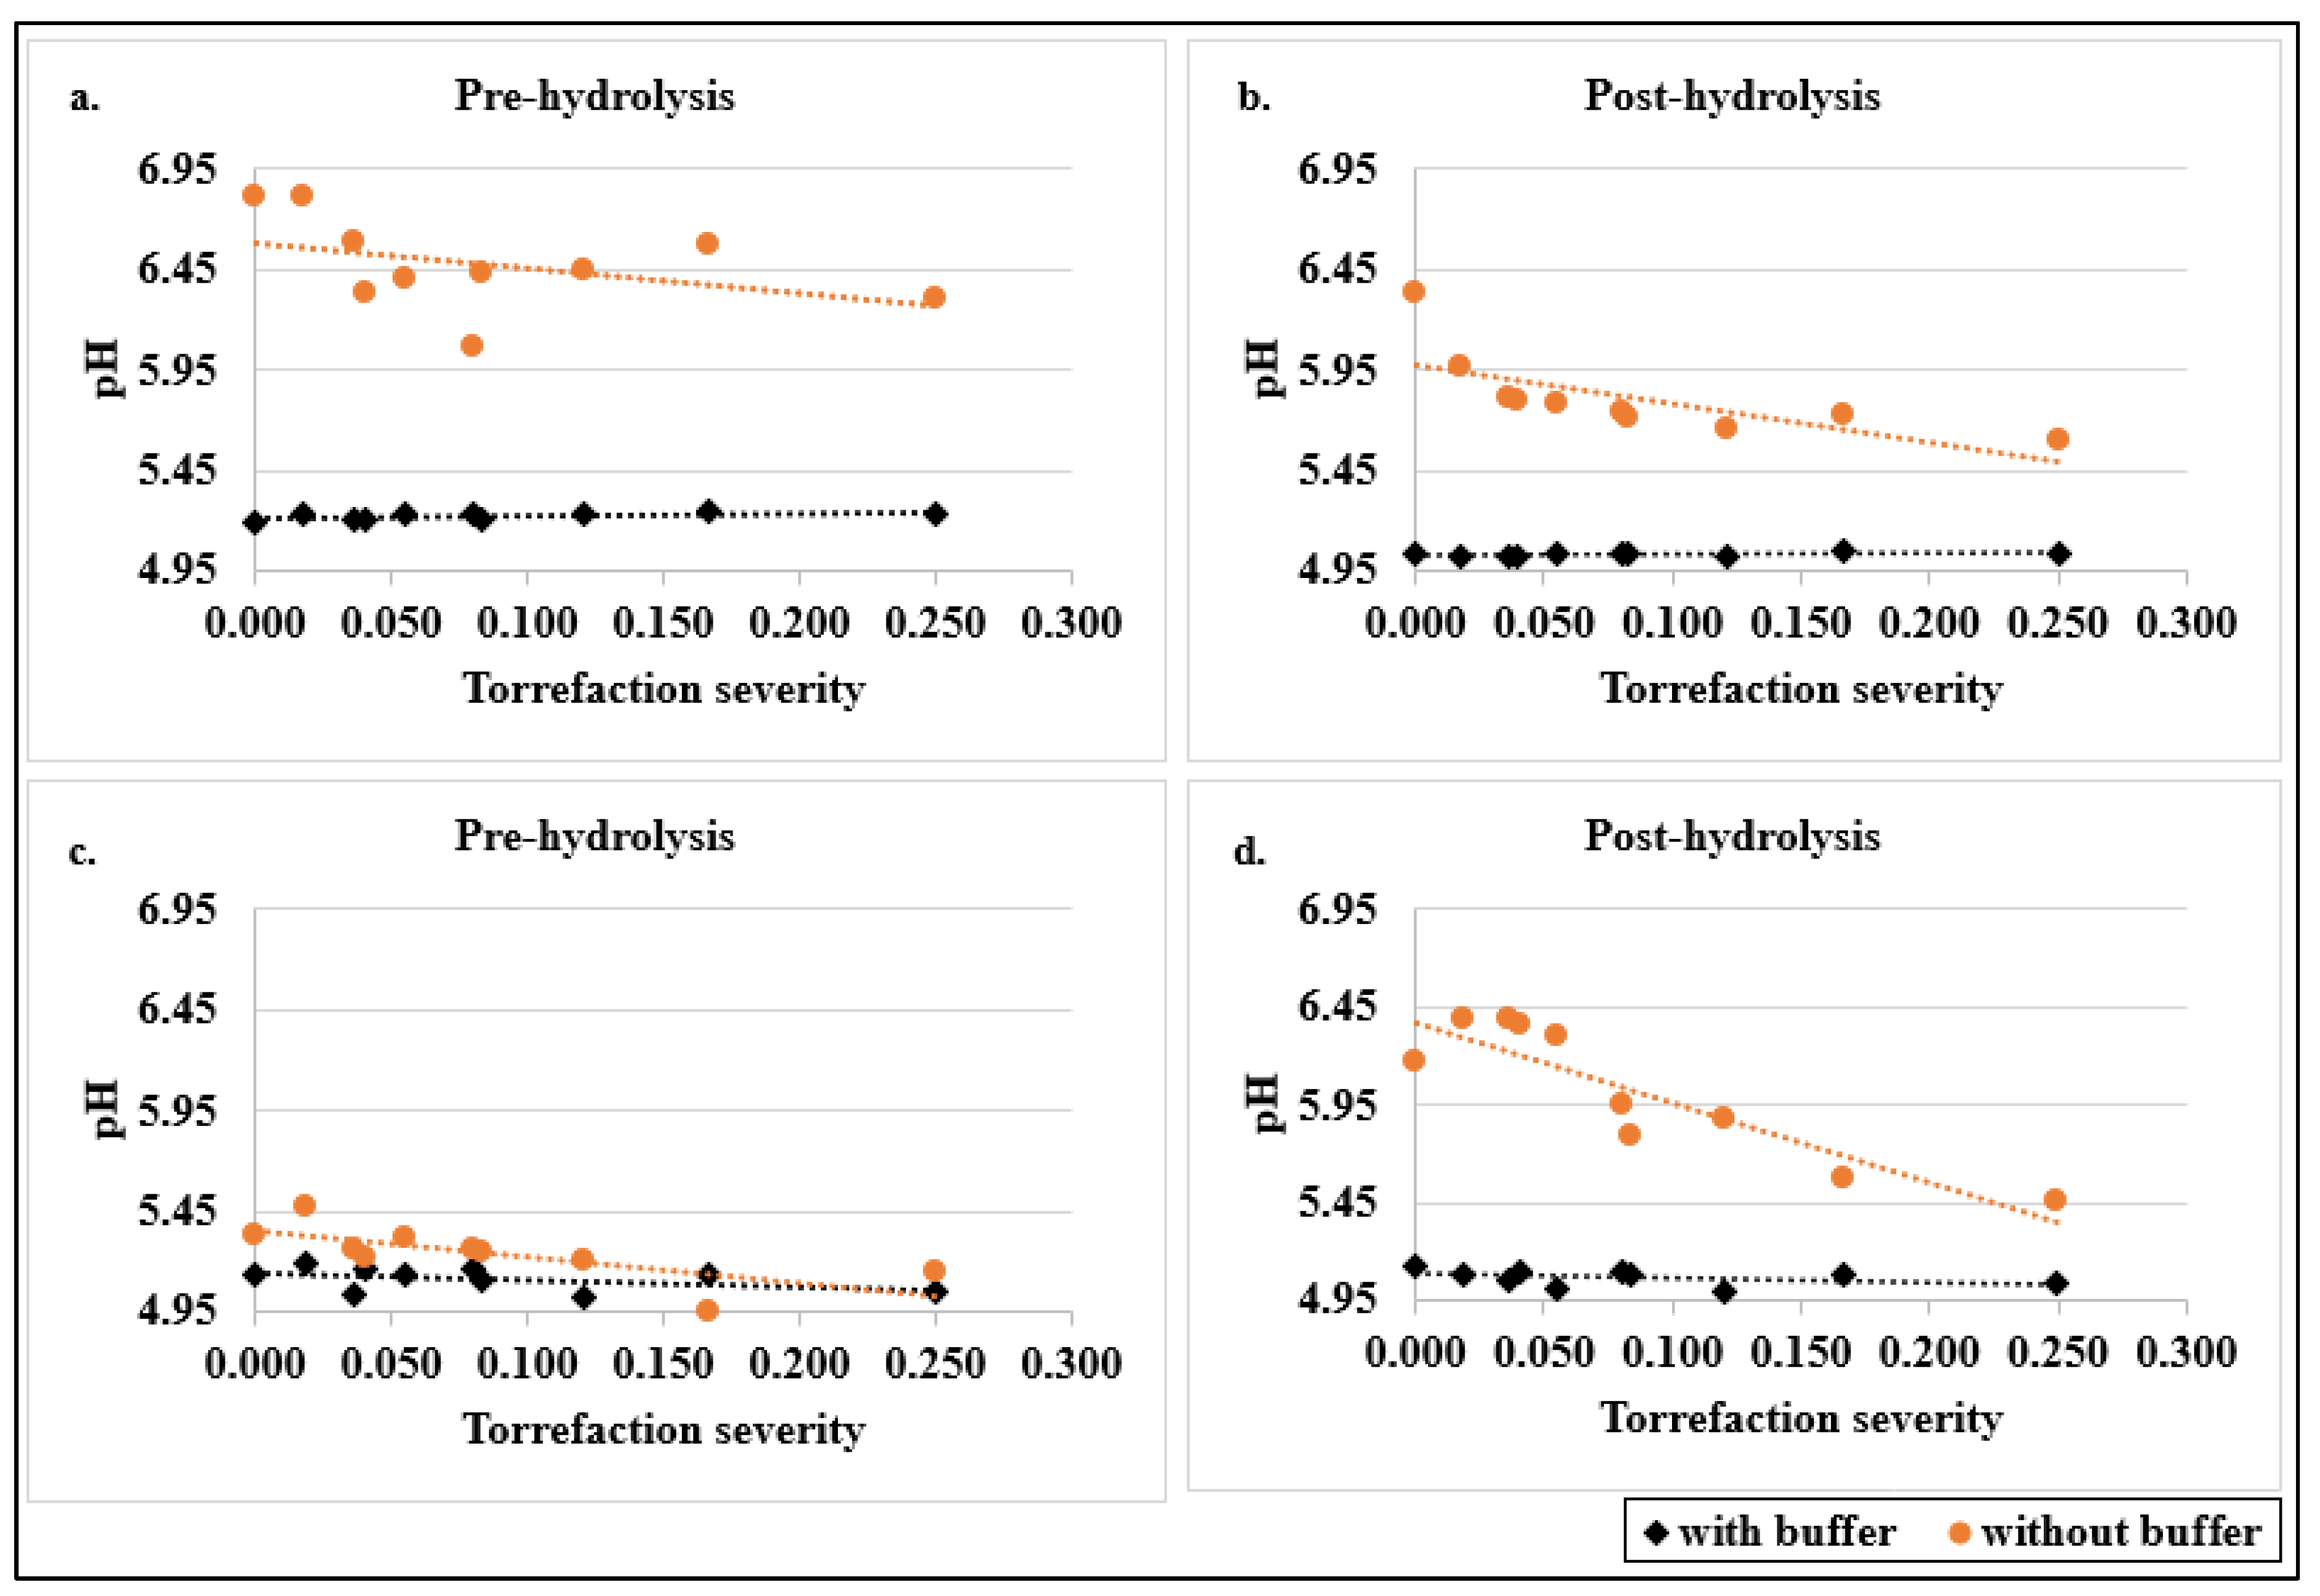
3.3. Effect of Buffer & Correlation between Torrefaction Severities and pH of the Suspension
The torrefaction severity vs. pH of unbuffered suspensions pre- and post-hydrolysis are shown in
Figure 3, visually demonstrating the impact of torrefaction severity on pH.
In case of suspensions with buffer, the slope values are not statistically significant at an α = 0.05 level implying that there is no change in the pH when there is a unit change in torrefaction severity. This makes sense as the buffer would function to stabilize the pH as intended. This suggests that any impact of torrefaction severity on glucose yield is not solely a function of pH, since the buffer, when used, effectively controlled pH for those torrefied samples that nonetheless exhibited reduced glucose yield.
When buffer is omitted, the slopes of pH versus torrefaction severity have a consistent downward direction and are statistically significant for 3 of the 4 sample groups, with higher torrefaction severities associated with lower pH values. The reason for the downward trend in pH in unbuffered samples could be due to the presence of residual carboxylic acid deposited on the sample after torrefaction. Acetic acid and water are the major products of torrefaction and can be ascribed mainly to the decomposition of hemicellulose [
37,
38] while decomposition of cellulose can also occur at higher torrefaction severities.
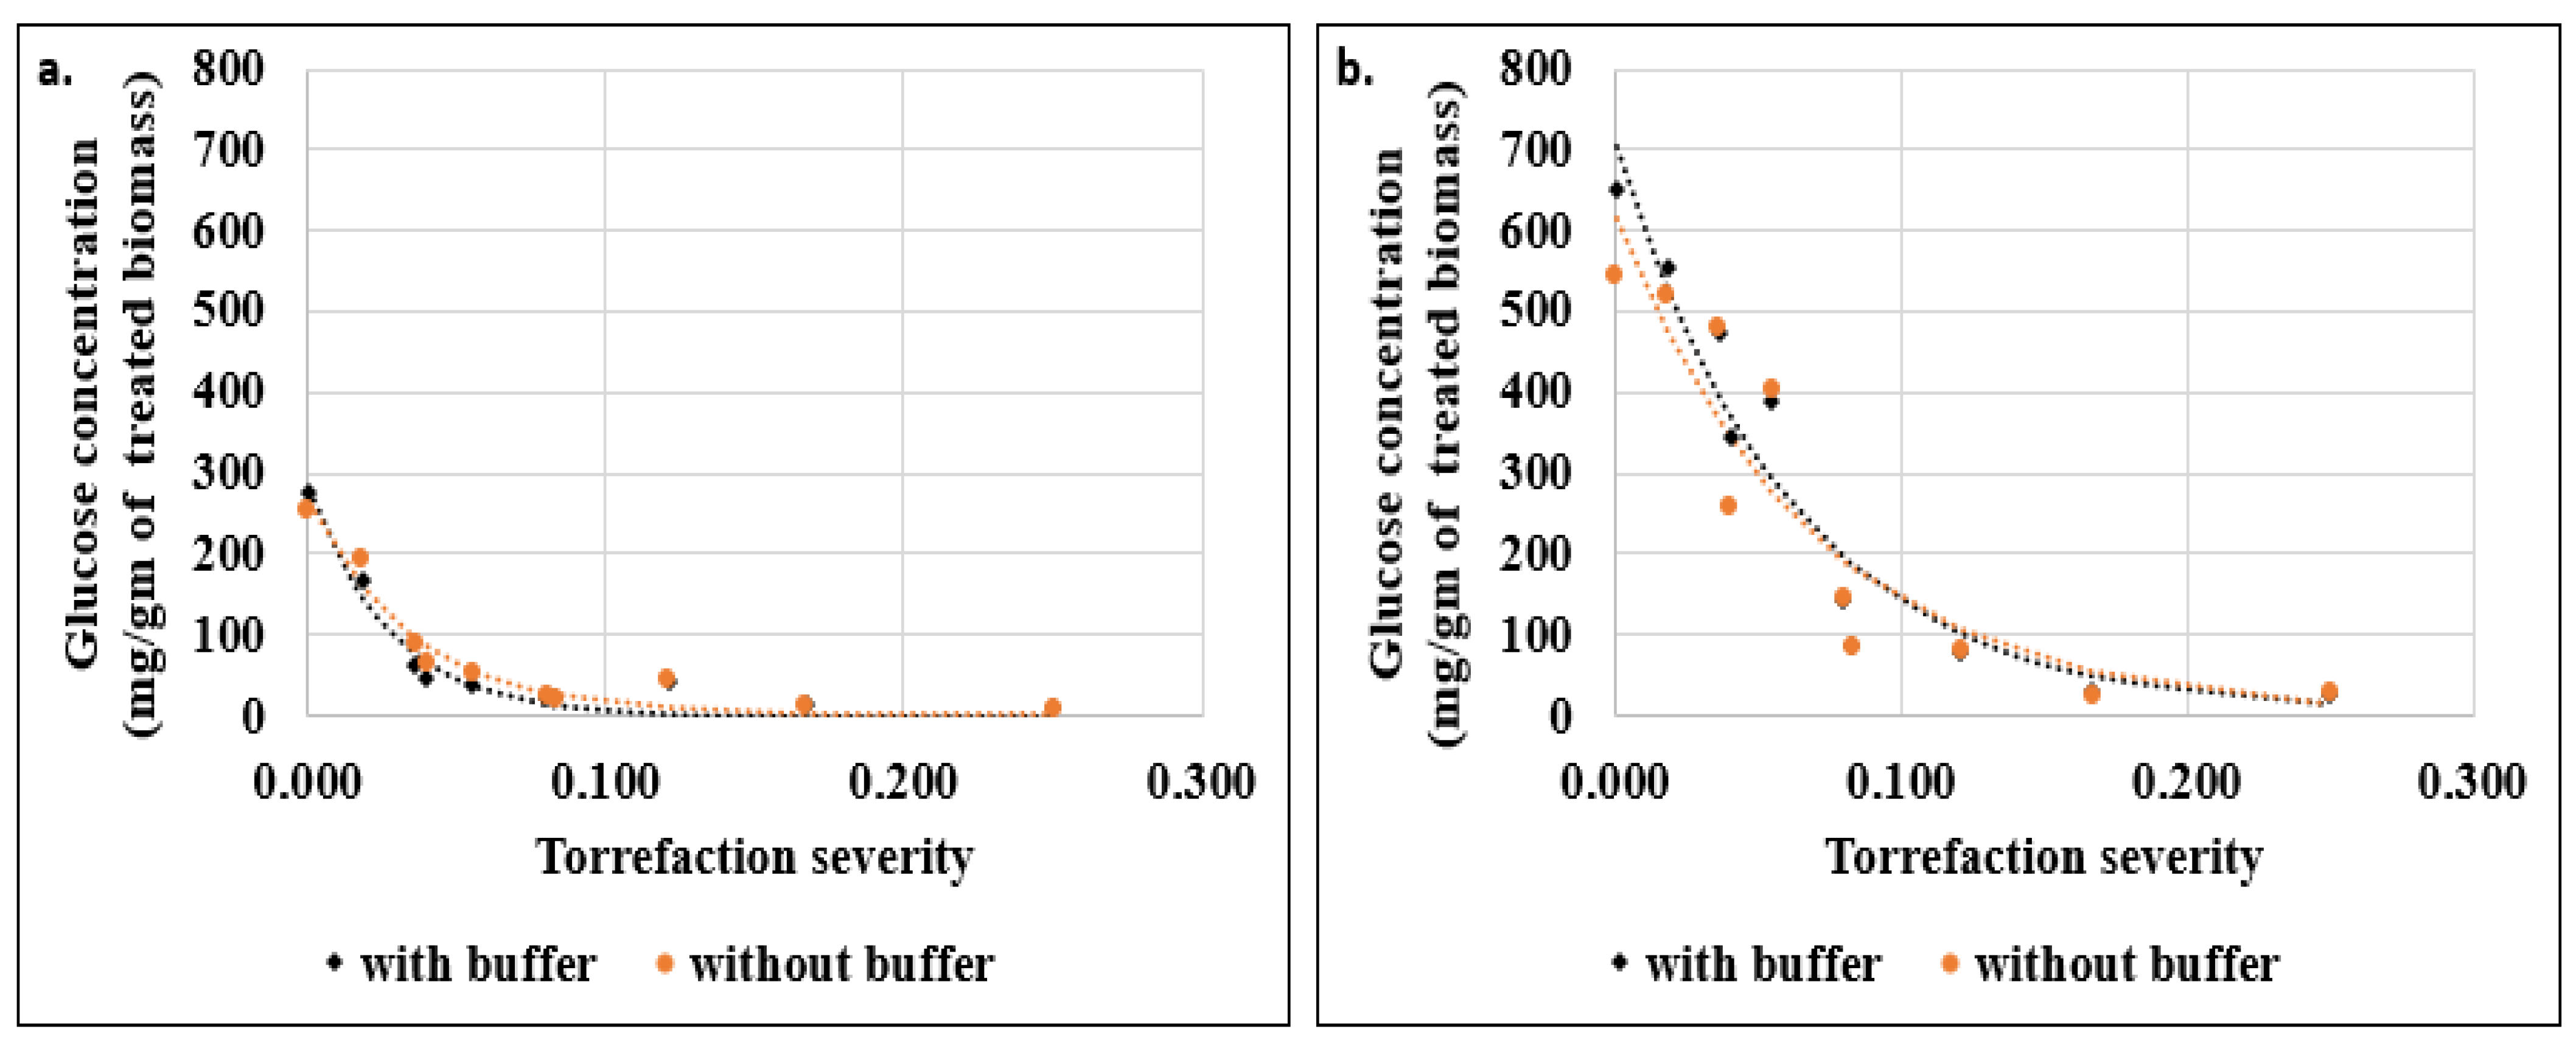
3.4. Effect of Buffer Addition on Glucose Yield
Values of glucose yield for suspensions with buffer and without buffer are plotted together in
Figure 4 for comparison.
The p-values from paired t-tests were, respectively, 0.32 and 0.16 for samples torrefied at various levels without alkaline pretreatment versus with alkaline pretreatment before torrefaction. The p-values greater than 0.05 suggest that buffered pH and non-buffered pH do not have a measurably different effect on glucose yield for these raw and torrefied samples.
The untreated raw wheat straw with buffer had a pre-hydrolysis pH of 5.2 while the non-buffered pH was 6.8. Abdulsattar et al. [
39] has reported that for raw wheat straw, the optimum pH for Cellic CTec2 is 6.0 with glucose yields decreasing steadily as pH increases or decreases from that optimum point, and with similar slopes for the first unit of pH difference. Because the buffered and unbuffered pH values of raw wheat straw measured in this study have similar differences from the reported optimum pH value, hydrolysis at these suboptimal pH values may have had a similar effect on enzyme performance. For the alkaline-treated raw wheat straw, pre-hydrolysis unbuffered pH was 5.33, which is very close to the pre-hydrolysis buffered pH of 5.14, and it is possible that this difference in pH values is not great enough to induce changes in enzyme performance.
Addition of buffer equalized the pH for all the torrefaction severities (slope
p-value > 0.05), but there was still a downward trend in glucose yield with increasing torrefaction severity, which implies that the effect of torrefaction on pH is not the direct causative factor for torrefaction’s reduction of glucose yield. While pH directly is not the reason for the decrease in glucose yield when biomass is torrefied then hydrolyzed, the factor causing the decrease in pH to un-buffered hydrolysate might be associated with some other inhibiting factor(s). Acetic acid is released during torrefaction [
37,
38] and acetic acid can act both as a cellulase inhibitor itself [
27], and has been associated with the formation of the inhibitor pseudo-lignin [
40]. Lignin derived phenolic compounds have also been shown to be inhibitory to cellulases [
41]. The volatilization and subsequent condensation of lignin and cell wall compounds during severe torrefaction may increase physical barriers to enzyme access. So, it would be worthwhile to perform torrefaction and hydrolysis tests on pure cellulose to investigate if and when the negative impact of torrefaction is associated with effects on hemicellulose and lignin.
It is worthwhile to note that, while the range of pH values caused by torrefaction in this study may not impact hydrolysis and glucose yield, the pH range observed here is relatively small, and higher or lower pH values could impact the effectiveness of the enzymatic hydrolysis process.
Table 3 provides the fitted parameters for the exponential decay curves illustrated in
Figure 4. High R
2 values suggest that glucose yield follows an exponential decay function as torrefaction severity increases.
3.5. Effect of Order of Alkaline Pretreatment on Glucose Yield
Glucose yield data are compared to those of Memis [
19], in which alkaline pretreatment was carried out after torrefaction (rather than before, as in this study). There is no statistical difference (
p-value = 0.29) in glucose yield per unit raw biomass between this study and that reported by Memis [
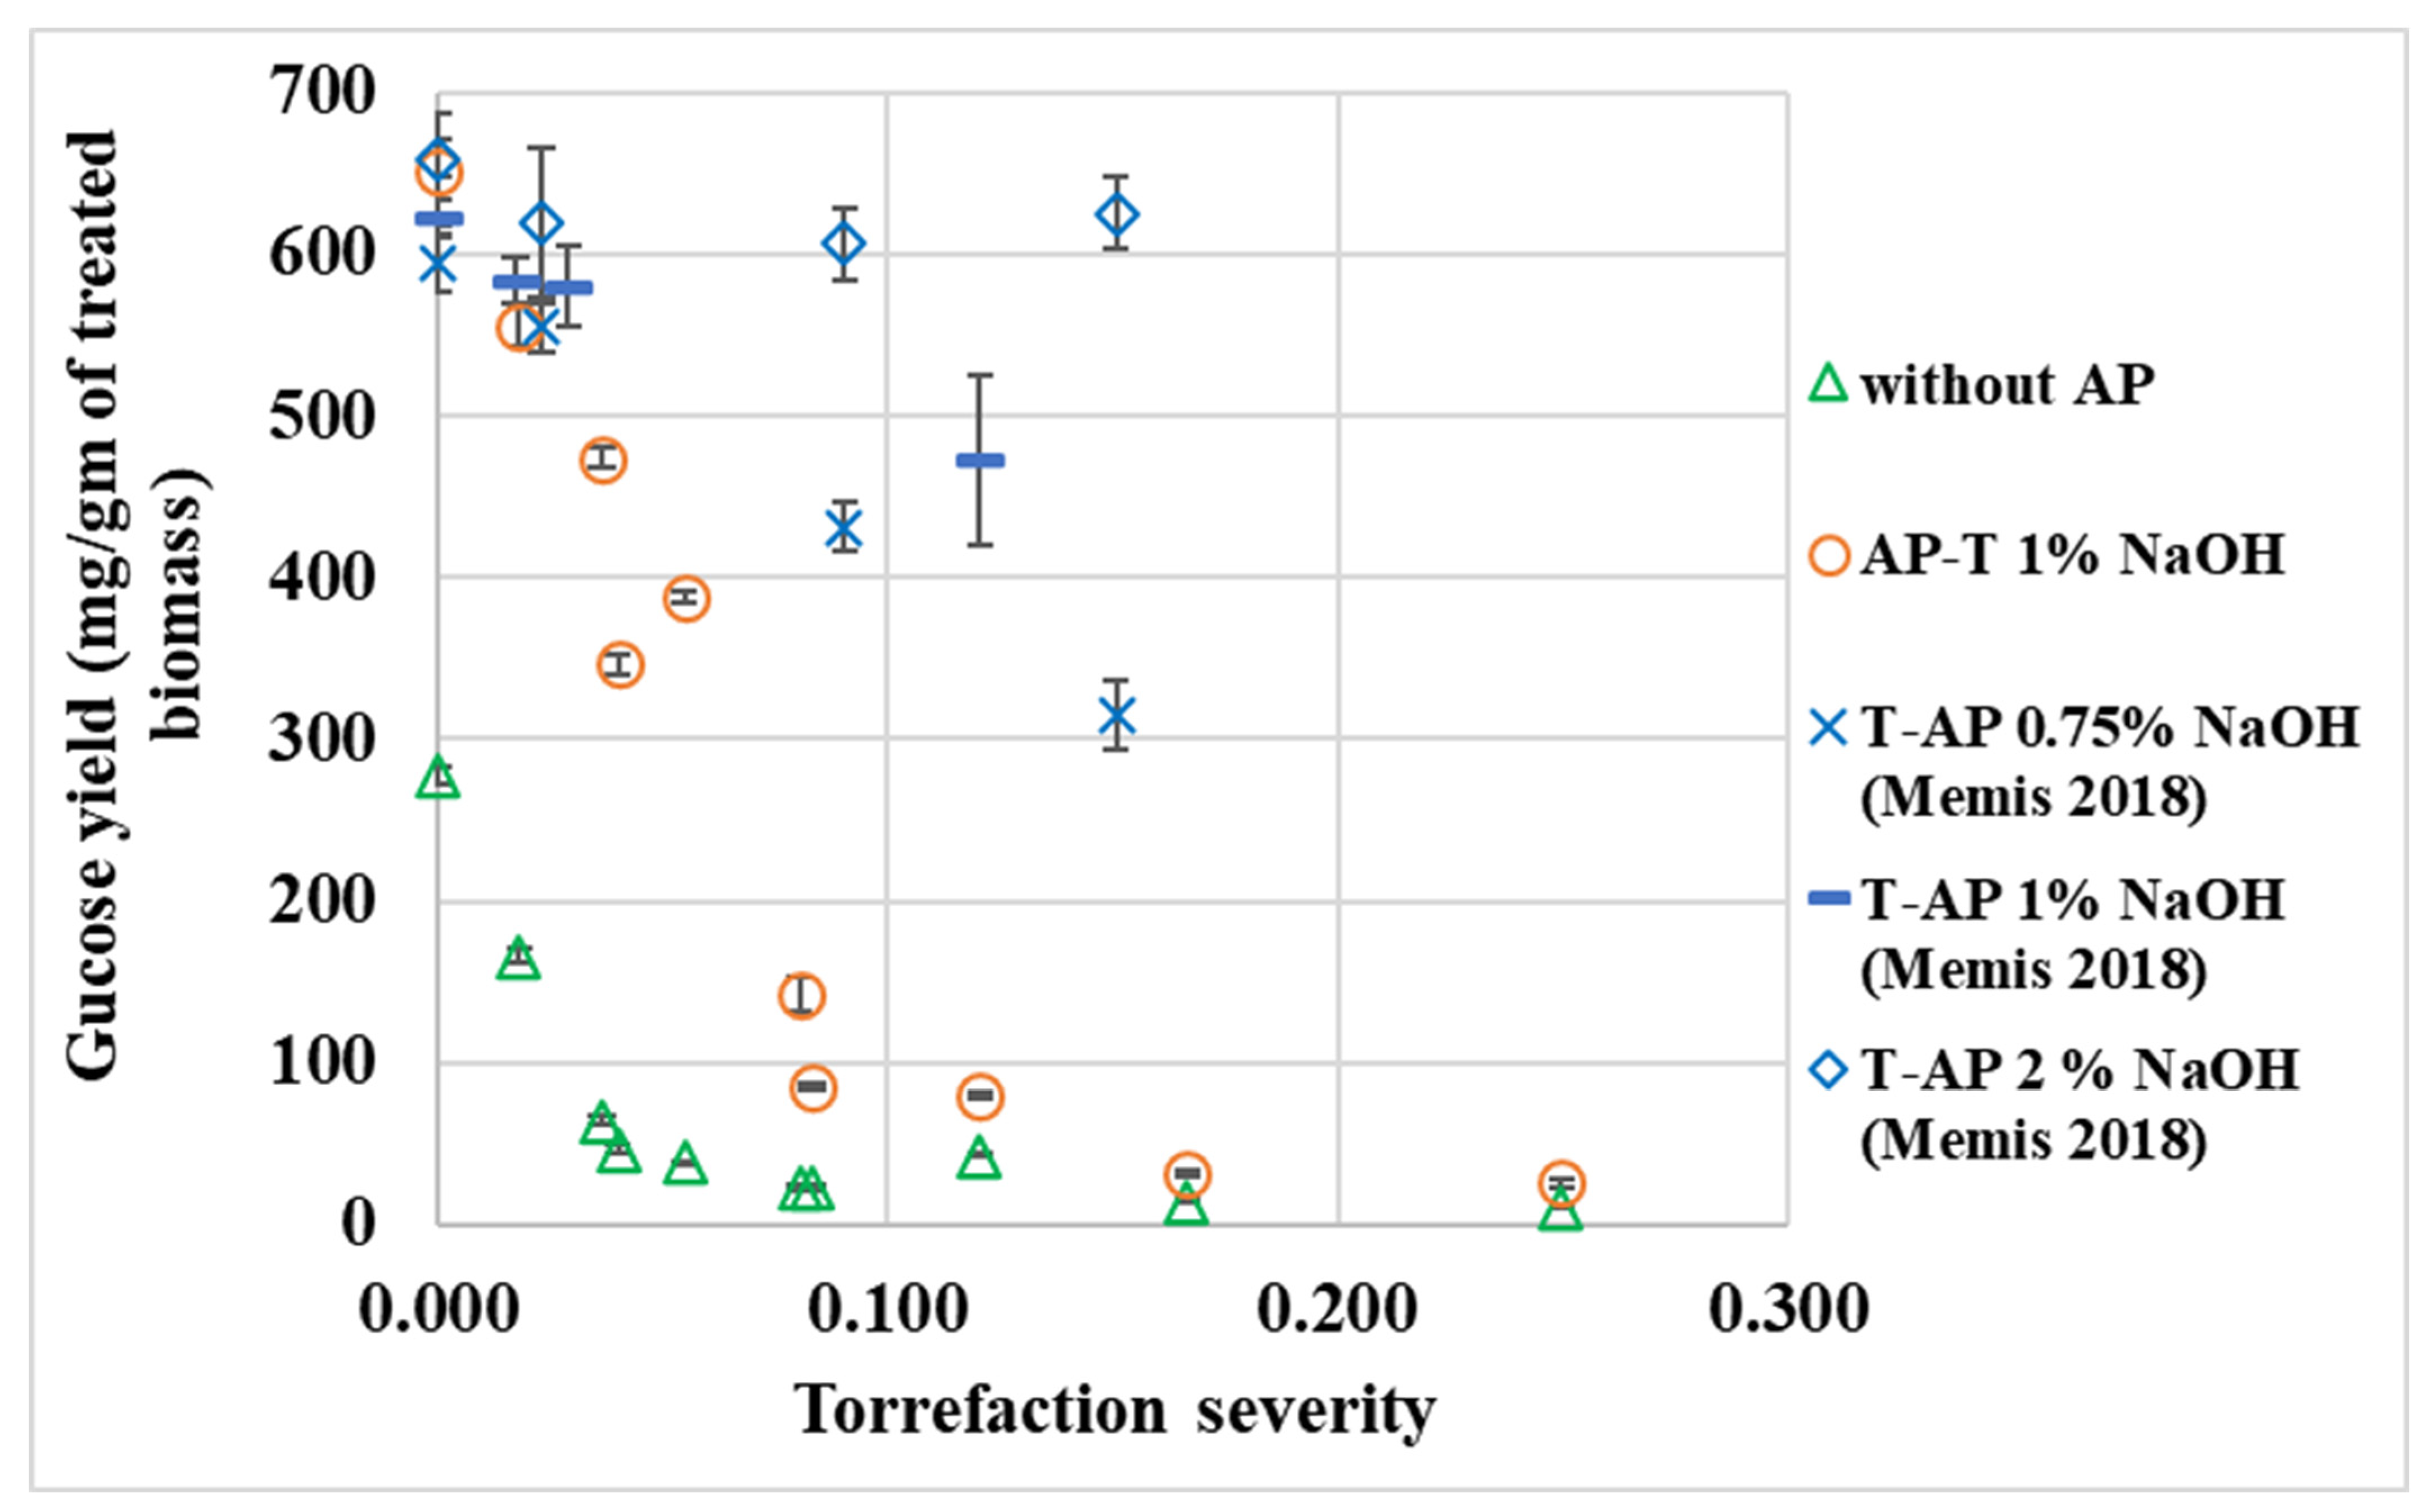
19] for the alkaline pretreated raw biomass. This indicates that the methods followed in these two studies, despite some minor changes, are comparable because of a common reference point. The glucose yield of samples that were not alkaline pretreated, those that were alkaline pretreated before torrefaction, and those that were alkaline pretreated after torrefaction are shown in
Figure 5.
There is a decrease in available glucose concentrations with increasing torrefaction severity for both raw and alkaline pretreated wheat straw. Glucose yields are higher for samples that are alkaline pretreated before torrefaction, relative to those that are only torrefied (but not alkaline pretreated). It is possible that alkaline pretreatment before torrefaction could be solubilizing precursors to inhibitory compounds such as pseudo-lignin, increasing accessibility of cellulose microfibrils, or having some other beneficial impact. Since hemicelluloses and lignin are solubilized by alkaline pretreatment [
28], it would be worthwhile to perform torrefaction and hydrolysis tests on pure cellulose to investigate if and when the negative impact of torrefaction is associated with effects on hemicellulose and lignin.
Memis [
19] found that increasing the base concentration used for alkaline pretreatment has a positive impact on glucose yield. Glucose yield from wheat straw treated at 0.75%, 1%, and 2% alkaline concentration followed the trend of 0.75% < 1% < 2% for both raw and torrefied biomass (
Figure 5).
Alkaline pretreatment has a positive impact on glucose yield whether pre- (AP-T) or post-torrefaction (T-AP), but the extent of this impact varies. When torrefaction severity is less than 0.03, the glucose yield for AP-T is indistinguishable from that of T-AP. When torrefaction severity is 0.03 or higher, glucose yield for T-AP is higher than for AP-T. As seen in
Figure 5, when the torrefaction severity is greater than 0.03, the glucose yield from T-AP biomass treated at 0.75% surpasses glucose yield from AP-T biomass even when the T-AP is treated at a low (0.75%) alkaline concentration. Torrefaction severities ranging from 0.090 to 0.151 is the region where the order of alkaline pretreatment relative to torrefaction (T-AP and AP-T) has the greatest yield advantage for positioning torrefaction first in a coupled pretreatment strategy.
Because the negative impact of torrefaction severity on glucose yield is less severe for T-AP than for AP-T, from a process design point of view, it is likely better to perform torrefaction first, then alkaline pretreatment. However, there may be some supply chain scenarios where there is an advantage to starting with alkaline pretreatment. Because additional mass reduction of the feedstock, could have additional benefits for the supply chain if carried out prior to transport as explained in
Section 3.2. A full TEA is required to answer if there is potential for combining torrefaction and alkaline pretreatment as a viable strategy for biorefining operations.
4. Conclusions
The glucose yield is highest for alkaline pretreated raw wheat straw. This implies that, if supply chain costs were negligible, torrefaction would present no potential benefit to the overall process. Alkaline pretreated wheat straw is cellulose-dense and loses less mass after torrefaction compared to non-alkaline treated wheat straw. Alkaline pretreatment after torrefaction (T-AP) resulted in higher glucose yield than alkaline pretreatment before torrefaction (AP-T) or torrefaction alone, but in all cases increasing torrefaction severity reduced glucose yield. It suggests that we can garner the benefits of torrefaction in the supply chain and then increase its glucose yield in the processing facility via alkaline pretreatment as alkaline pretreatment seems to restore the glucose-extractability of torrefied wheat straw to some extent.
Standard methods for enzymatic hydrolysis include a citric acid buffer, and trials without buffer found that increasing torrefaction severity reduced the solution pH as well as glucose yield. In other words, pH of the unbuffered suspension, which is the dependent variable in this study, is lowest for highest torrefaction severity and for the sample with lowest glucose yield. However, glucose yields as a function of torrefaction severity were very similar regardless of the presence of buffer and across a wide range of pH, implying that affected pH is not directly the reason for the decrease in glucose yield for torrefied samples but the chemical changes causing the decrease in pH might be associated with the reduction in yield. This suggests, measuring the pH of the unbuffered biomass suspension can serve as an inexpensive screening tool for determining the extent of reduction of glucose yield cause by torrefaction which is one of the novel findings of this work.
Further studies are needed to reveal the mechanism(s) that reduce glucose hydrolysis from torrefied samples, such as confirmation of formation of inhibitors like carboxylic acids or pseudo-lignin, or physical changes that reduce the accessibility of enzymes to the structural carbohydrates of the plant cell wall. Torrefaction has long been shown to have potential to reduce biomass logistic costs and increase feedstock energy density. Coupling torrefaction with alkaline pretreatment may allow biochemical conversion processes to realize these and other benefits that have previously only been available for thermochemical conversion.


