
SDN-Based Routing Framework for Elephant and Mice Flows Using Unsupervised Machine Learning
by
 ,
,
Muna Al-Saadi
1,2,*,
Asiya Khan
1,
Vasilios Kelefouras
1,
David J. Walker
1 and
Bushra Al-Saadi
2 1
Autonomous Marine Systems Research Group, School of Engineering, Computing and Mathematics, University of Plymouth, Plymouth PL4 8AA, UK
2
Department of Missions and Cultural Relations, University of Information Technology and Communications (UoITC), Baghdad 00964, Iraq
*
Author to whom correspondence should be addressed.
Network 2023, 3(1), 218-238; https://doi.org/10.3390/network3010011
Submission received: 9 December 2022
/
Revised: 20 January 2023
/
Accepted: 22 February 2023
/
Published: 2 March 2023
Abstract
:Software-defined networks (SDNs) have the capabilities of controlling the efficient movement of data flows through a network to fulfill sufficient flow management and effective usage of network resources. Currently, most data center networks (DCNs) suffer from the exploitation of network resources by large packets (elephant flow) that enter the network at any time, which affects a particular flow (mice flow). Therefore, it is crucial to find a solution for identifying and finding an appropriate routing path in order to improve the network management system. This work proposes a SDN application to find the best path based on the type of flow using network performance metrics. These metrics are used to characterize and identify flows as elephant and mice by utilizing unsupervised machine learning (ML) and the thresholding method. A developed routing algorithm was proposed to select the path based on the type of flow. A validation test was performed by testing the proposed framework using different topologies of the DCN and comparing the performance of a SDN-Ryu controller with that of the proposed framework based on three factors: throughput, bandwidth, and data transfer rate. The results show that 70% of the time, the proposed framework has higher performance for different types of flows.
1. Introduction
In traditional networks, control management and data forwarding are tightly coupled, where distributed devices control the whole network, and it is hard to improve the flexibility and extensibility of the network. Therefore, congestion and unbalanced loads are real problems in networking. One of the main causes of these problems is the unfair use of network resources by specific flows [1,2]. Subsequently, the need to develop a network architecture and corresponding traffic engineering (TE) technology becomes imperative to solve these problems [3].
To address this problem, the idea of software-defined networking (SDN) is introduced. Compared to traditional networks, a SDN has several advantages to support TE because of its distinguished characteristics, such as the separation between the forwarding and control plane, control centralization, and capability for network behavior programmability [4,5]. In addition, a SDN has the capability of controlling the efficient movement of data flows through the network to fulfill sufficient flow management and effective usage of network resources. A SDN enables the development of more innovative programmable network control and routing solutions based on a global view of network status and fine-grained control of network traffic and network resources [6]. The essential portion, which has a real effect on network performance, is flow routing. The main purpose of flow routing in a network is to access the required data as fast as possible, which is an obvious advantage that can be provided to the performance of a network by the routing process [7,8]. In multipath routing, the calculation of the optimal path and the substitution of link failure is the responsibility of the SDN controller. However, recent studies have shown that the time spent to select the optimal path by the SDN controller is high [9].
A data center is a network of computing and storage resources. It provides the delivery of applications and shared data. Recently, data centers have developed quickly, with their infrastructure having changed from the traditional structure of physical servers to virtual networks, which supports applications. In a DCN, most of the network traffic is mice flows with a small volume, and they hold less than 10% of the overall transmitted bytes. In contrast, elephant flows represent only 10% of the flows, but they hold 90% of the overall transmitted bytes. In general, mice flows induce transient congestion, while elephant flows cause constant congestion. Network congestion is one of the main reasons for poor performance, as not all of the flows use the network resources equally.
To address the above problem, ML approaches are introduced, such as in [10,11,12,13,14,15,16]. All these studies have proposed techniques for optimizing network performance and providing high quality of service (QoS) by prioritizing mice flows or scheduling re-routing elephant flows. Recently, some studies [17,18] have integrated ML techniques in a SDN to enhance the security system of the network, improve network flow management, and strengthen the development of network design. ML has the potential of solving a wide range of networking problems, including design, implementation, performance, and verification [19].
In this paper, unsupervised ML algorithms are utilized to characterize network traffic and identify them into mice and elephant flows based on predefined features. To minimize the dimensionality of the data while keeping their distinctive features, principal component analysis (PCA) is used. K-means is implemented for grouping the flows that have similar metrics of network performance to aid the flow routing of elephants and mice based on their features. The main contributions of this paper are to develop a SDN-based application using unsupervised ML and achieve four specific aims:
- (i)
- To develop a new SDN-based routing framework using the concept of flow identification. The framework includes two parts that cooperate with the controller, namely, traffic analysis and external application.
- (ii)
- To provide an identification mechanism to distinguish flows as mice and elephants based on K-means clustering after a phase of dimensionality reduction using principal component analysis.
- (iii)
- To develop a flow routing algorithm that selects the shortest paths for mice and the widest paths for elephants. Hence, a more balanced network results and a higher throughput is obtained.
- (iv)
- To enable more efficient calculation of route cost and provide consistency with real-time constraint. Route update is accomplished based on a recursive process.
2. Literature Review
The centralization concept of SDNs is to transfer the control of routing from individual elements of a network to a central point of control. In addition, the synchronization and control ability in a SDN provides all the required information about the interconnection between the hosts and the capability to make fast decisions of switching. Therefore, SDNs can guarantee a high level of performance.
The essential reasons for network performance degradation are network congestion and imbalance in network load, which may be caused by inefficient routing of elephant and mice flows. In [20], a SDN-based detection and scheduling algorithm was proposed for the detection and scheduling of elephant and mice flows based on flow-completion time (FCT), leading to the mitigation of mice flows and the throughput maintenance of elephant flows in the data center network. Similarly, the authors in [21] introduced an ESCA framework. The aim of the proposed framework is to achieve an effective load-balanced routing for scheduling mice and elephant flows. This framework is implemented based on the proposed efficient sampling and classification methods. In [22], a SDN-based load balancing approach in a data center network is suggested. This approach starts with classifying flows as elephants and mice and ends with enforcing distinct schemes of routing for specified flow types to enable a high-capacity usage of the network. The proposed solution works initially by determining two zones for elephant and mice flows with several idle paths, which are pre-decided for elephant flows, and minimum weighted paths, which are confined to the mice zone for mice flows. In [23], a load balancing mechanism was proposed using multipath routing of elephant flows in the SDN to improve the utilization of the network.
The application of SDNs have attracted a lot of interest to solve the problem of network management in recent years. In [24], the authors applied a dynamic routing mechanism in a SDN to solve the problem of inconsistent distribution of network traffic that causes congestion in the network links. The authors in [25] introduced a system that enables the operator of the network to define templates. These templates can reroute elephant flows for a specific objective in order to address the high impact of elephant flows on the overall network traffic.
To improve network performance, elephant detection and routing techniques were proposed in [26]. The proposed techniques scan the network to find all the paths available between the source and the destination and calculate the link bandwidth of different available paths. In [27], the rerouting of elephant flows using an ant colony optimization-based technique is presented. This technique, which is called DPLBAnt, utilizes a shortest-path problem in the SDN to alleviate the high controller-switch load. In [28], the authors proposed a routing strategy that is based on deep Q-learning (DQL) to autonomously generate optimal routing paths for SDN-based data center networks. The proposed framework trains deep Q networks to meet the different demands of mice and elephant flows in the data center networks by achieving a low latency and a low packet loss rate for mice flows and a high throughput and a low packet loss rate for elephant flows. The researchers in [29] presented a model-free reinforcement learning method, which converts the path computational problem into a learning problem. In order to improve the network’s average path utilization, the DeepRoute model learns strategies to manage arriving elephant and mice flows from the network environment. Similarly, [30] proposed an NNIRSS, which is a neural network (NN)-based intelligent routing scheme for SDNs. It utilizes NN to create patterns for data flow transmission and replaces the flow table with well-trained NN in the form of an NN packet. Furthermore, the authors developed a mechanism of intelligent routing based on the radial basis function of neural networks.
Overall, it is found that none of the existing approaches for flow routing in SDNs have proposed an application for identifying mice and elephant flows, enabling flow type and topology-aware routing. The objective of this paper is to propose a framework that can accomplish this by using two blocks, namely, external application and traffic analysis. Furthermore, this work proposes a mechanism for routing by using the short routes for mice flows and the widest routes for elephant flows. The cost of routing is computed recursively, which provides more efficiency and enables consistency with real-time constraints.
3. Proposed Methodology
In this section, the SDN-based flow routing application is presented. Figure 1 illustrates the stages of the proposed methodology. These stages are detailed hereinafter.
The proposed method starts by capturing the OpenFlow traffic statistics from the SDN switch and saving them as raw data. Then, the proposed application takes over the pre-processing of the input data to prepare them for the next step, which uses unsupervised ML.
The aim of utilizing unsupervised ML techniques is to characterize the flows based on network performance metrics. This step includes applying PCA and K-means. The PCA technique is applied to reduce dimensionality. PCA is a technique that uses a linear transformation concept. The technique starts with arranging the data based on their variance and representing the arranged data as coordinates. In the end, the coordinates with the highest variance values will be kept, while those with the lowest values will be ignored. Consequently, the dimension of the dataset will be reduced. K-means has attracted wide attention due to its simplicity and effectiveness in building robust cluster labeling. It is considered one of the efficient and fast techniques that contributes to solving practical clustering problems [31]. K-means as an unsupervised clustering method can create clusters of flow without the need for predefining the classes. After that, to identify flows as mice or elephants, the thresholds for the flow features are pre-defined.
After that, the flows are identified as mice and elephants for each cluster that results from the clustering process. The thresholds for predefined flow features are determined to achieve an automated identification process that can optimize the forwarding of these flows in the network [32].
Finally, two topologies of data center networks (DCN) are used for the SDN deployment. The main objective of this work is to select the best path for each of the elephant and mice flows. The selection of the best path for a flow is performed depending on the requirements of the flow, such as low latency for mice flows and high bandwidth for elephant flows. Therefore, the links that fulfill the conditions are determined, and the paths that contain the appropriate bandwidth and latency will be selected. To find the best path for mice and elephant flows, a developed algorithm was proposed that leverages the inverse relationship between the bandwidth and latency to calculate the cost of the link.
The rest of this section is organized as follows: In Section 3.1 the architecture of the proposed SDN-application is presented. Afterward, the implemination of the architecture is provided in Section 3.2.
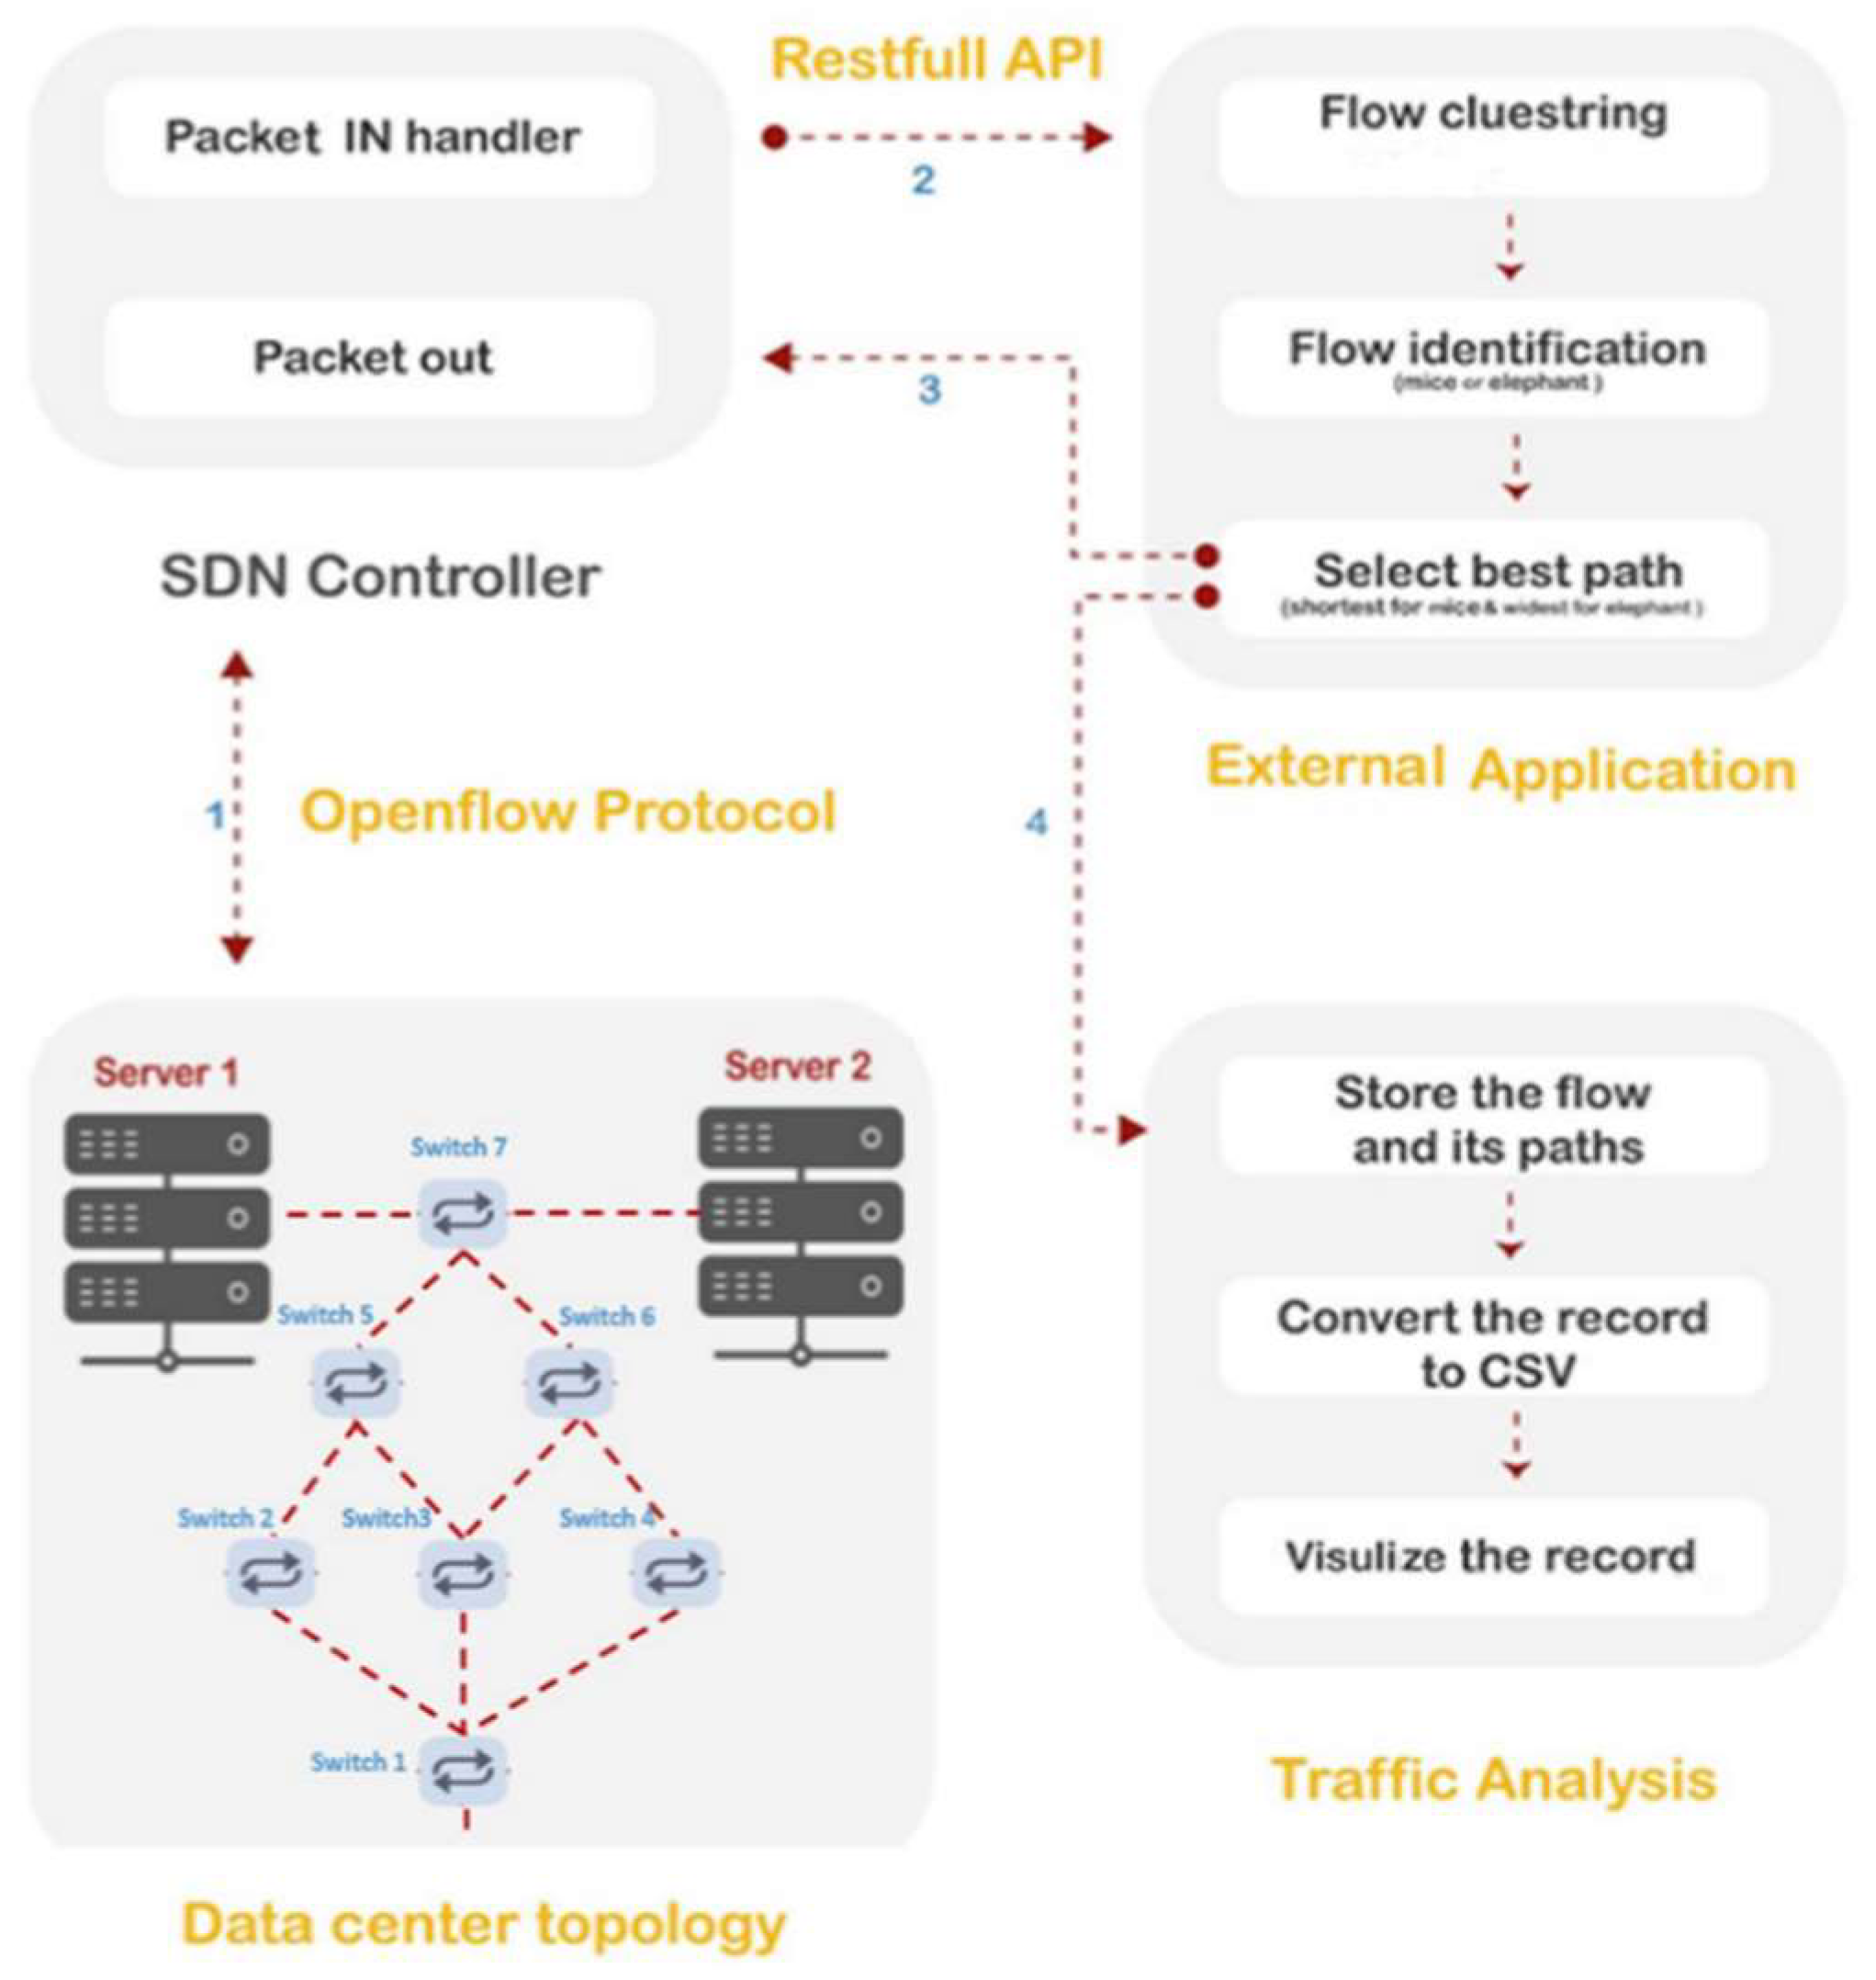
3.1. SDN-Based Application Architecture
The conceptual graph shown in Figure 2 displays the proposed framework for elephant and mice flow identification and selection of the best paths to route them. The processes of the framework are based on specifying the appropriate parameters and integrating the unsupervised ML and the SDN environment. The proposed framework contains four blocks, which are clarified into four categories: (i) the data center network (DCN) topology, which is responsible for the deployment of the proposed DCN topologies; (ii) the SDN controller, which is the block that facilitates the communication between the blocks (i) and (iii) by using an OpenFlow protocol as a southbound interface and RESTfull API as a northbound interface; (iii) the external application, which is the block that implements the proposed flow routing mechanism; and (iv) traffic analysis, which is responsible for storing flows and their paths and visualizing the record.
In this study, the Mininet emulator [33,34] was used to implement the proposed method. The SDN was deployed utilizing the SDN-Ryu controller [35]. The SDN application was designed for flow routing optimization that depends on a statistical analysis of network performance. The characterization of the flows based on the network performance metrics was achieved by employing unsupervised ML.
Principal component analysis (PCA) is a linear technique that was used in the proposed framework to reduce the dimensionality of the dataset employed. By converting correlated features to uncorrelated features, the dataset is reduced from a high-dimensional space to a low-dimensional space. To cluster the flows based on their own features of network performance, K-means was used as a second unsupervised ML technique. Afterward, flow identification is executed as a second stage of the proposed application. This stage consists of the process that is responsible for determining the type of flows (elephant or mice) based on the thresholds of the pre-defined parameters (flow duration, packet count, and average packet size) and a sampling operation to obtain representative flows for each cluster. The procedure is applied to each cluster that has resulted from the clustering operation.
The final stage includes selection of the best path for each type of flow. By using a developed routing algorithm, the best path selection is achieved for each representative flow. The developed algorithm was built based on two algorithms, which are the shortest-path Dijkstra algorithm [36] and the widest-path Dijkstra algorithm [37]. They were chosen to find the links that fulfill the conditions related to the types of flow previously identified.
The developed Dijkstra algorithms were employed to find the paths with appropriate bandwidth and latency. The last part of the proposed design is the traffic analysis. In this part, the flows with their paths are stored and visualized.
The next section covers the implementation of the proposed framework by running a group of proposed algorithms.
3.2. Architecture Implementation
The details of the algorithm for routing a flow are illustrated in Algorithm 1. This algorithm seeks to identify the best path in order to route each flow, which is the major procedure of the proposed framework. The procedure starts with extracting all the information of each input packet, such as source IP, destinationIP, inport, and outport. For each packet of the input flow, the existence of the source in the macTable is checked. Then, it is added to the macTable if it is not there. Thereafter, the destination is checked if it is in the macTable or not. In the case that a destination does not exist in the macTable, a broadcast message will be sent. Otherwise, a topology discovery will be executed using a Link Layer Discovery Protocol (LLDP). Next, Algorithm 2 FAS (Find all Available paths between two Switches) will be implicitly called by Algorithm 3 FAPBS (Find all Available Paths Between each pair of Switches) to find all available paths between each pair of switches.
| Algorithm 1 Algorithm for routing a flow |
|
| Algorithm 2 Find all Available paths between two Switches (FAS) |
|
| Algorithm 3 Find all Available Paths Between each pair of Switches (FAPBS) |
|
The aim of the K-means clustering and identification processes is to obtain representative flows for each mice and elephant type. Each representative flow is characterized by their network performance metrics. The flow identification process starts with extracting three parameters for each flow in each cluster. These parameters are flow duration, packet count, and average packet size. In the case of having a packet count higher than 15, a flow duration higher than 5 s, and an average packet size higher or equal to 10 KB, the flow is predicted as an elephant. Otherwise, the predicted flow is mice. This process is implemented by calling Algorithm 4. At the end of this process, three variables are obtained. clusterID represents the ID of the predicted cluster, flowType is a string indicating a mice or elephant flow, and the acceptable delay of the flow is represented as a float number called acceptableLatency.
| Algorithm 4 Flow Identification |
|
After the flow identification process has ended, selecting the best path for each representative flow, installing the determined path, and updating the cost of the path recursively are the main steps of the routing process, which will be executed by calling Algorithms 5 and 6.
| Algorithm 5 Select best paths |
|
| Algorithm 6 updateCost |
|
The first step of the routing process is checking the type of flow. If it is a mice flow, the available paths, which have been found by calling the FAPBS and FAS algorithms, are sorted with respect to length, and the shortest path will be selected as the best. Otherwise, it is an elephant flow, and the best N paths will be chosen based on the 1/bandwidth, as shown in Section 4.1.6. As a result, for each type of flow, we have the best path based on acceptable delay and available bandwidth for a particular source and destination. Then, the best path is installed for each of the elephant and mice flows (Algorithm 5). This is performed by sending a message containing the information of the selected path to the SDN controller in order to determine the required switches. Finally, an updated version of the input paths contains each path associated with the cost of the path. The process of updating is based on the paths, which is the output of the FAPBS algorithm and available bandwidth as a 2D array containing available bandwidth between every two switches. This is summarized in Algorithm 6.
4. Results and Analysis of Experiment
This section provides the experimental design and results. The experimental design is provided in Section 4.1, and the experimental results are provided in Section 4.2.
4.1. Experimental Design
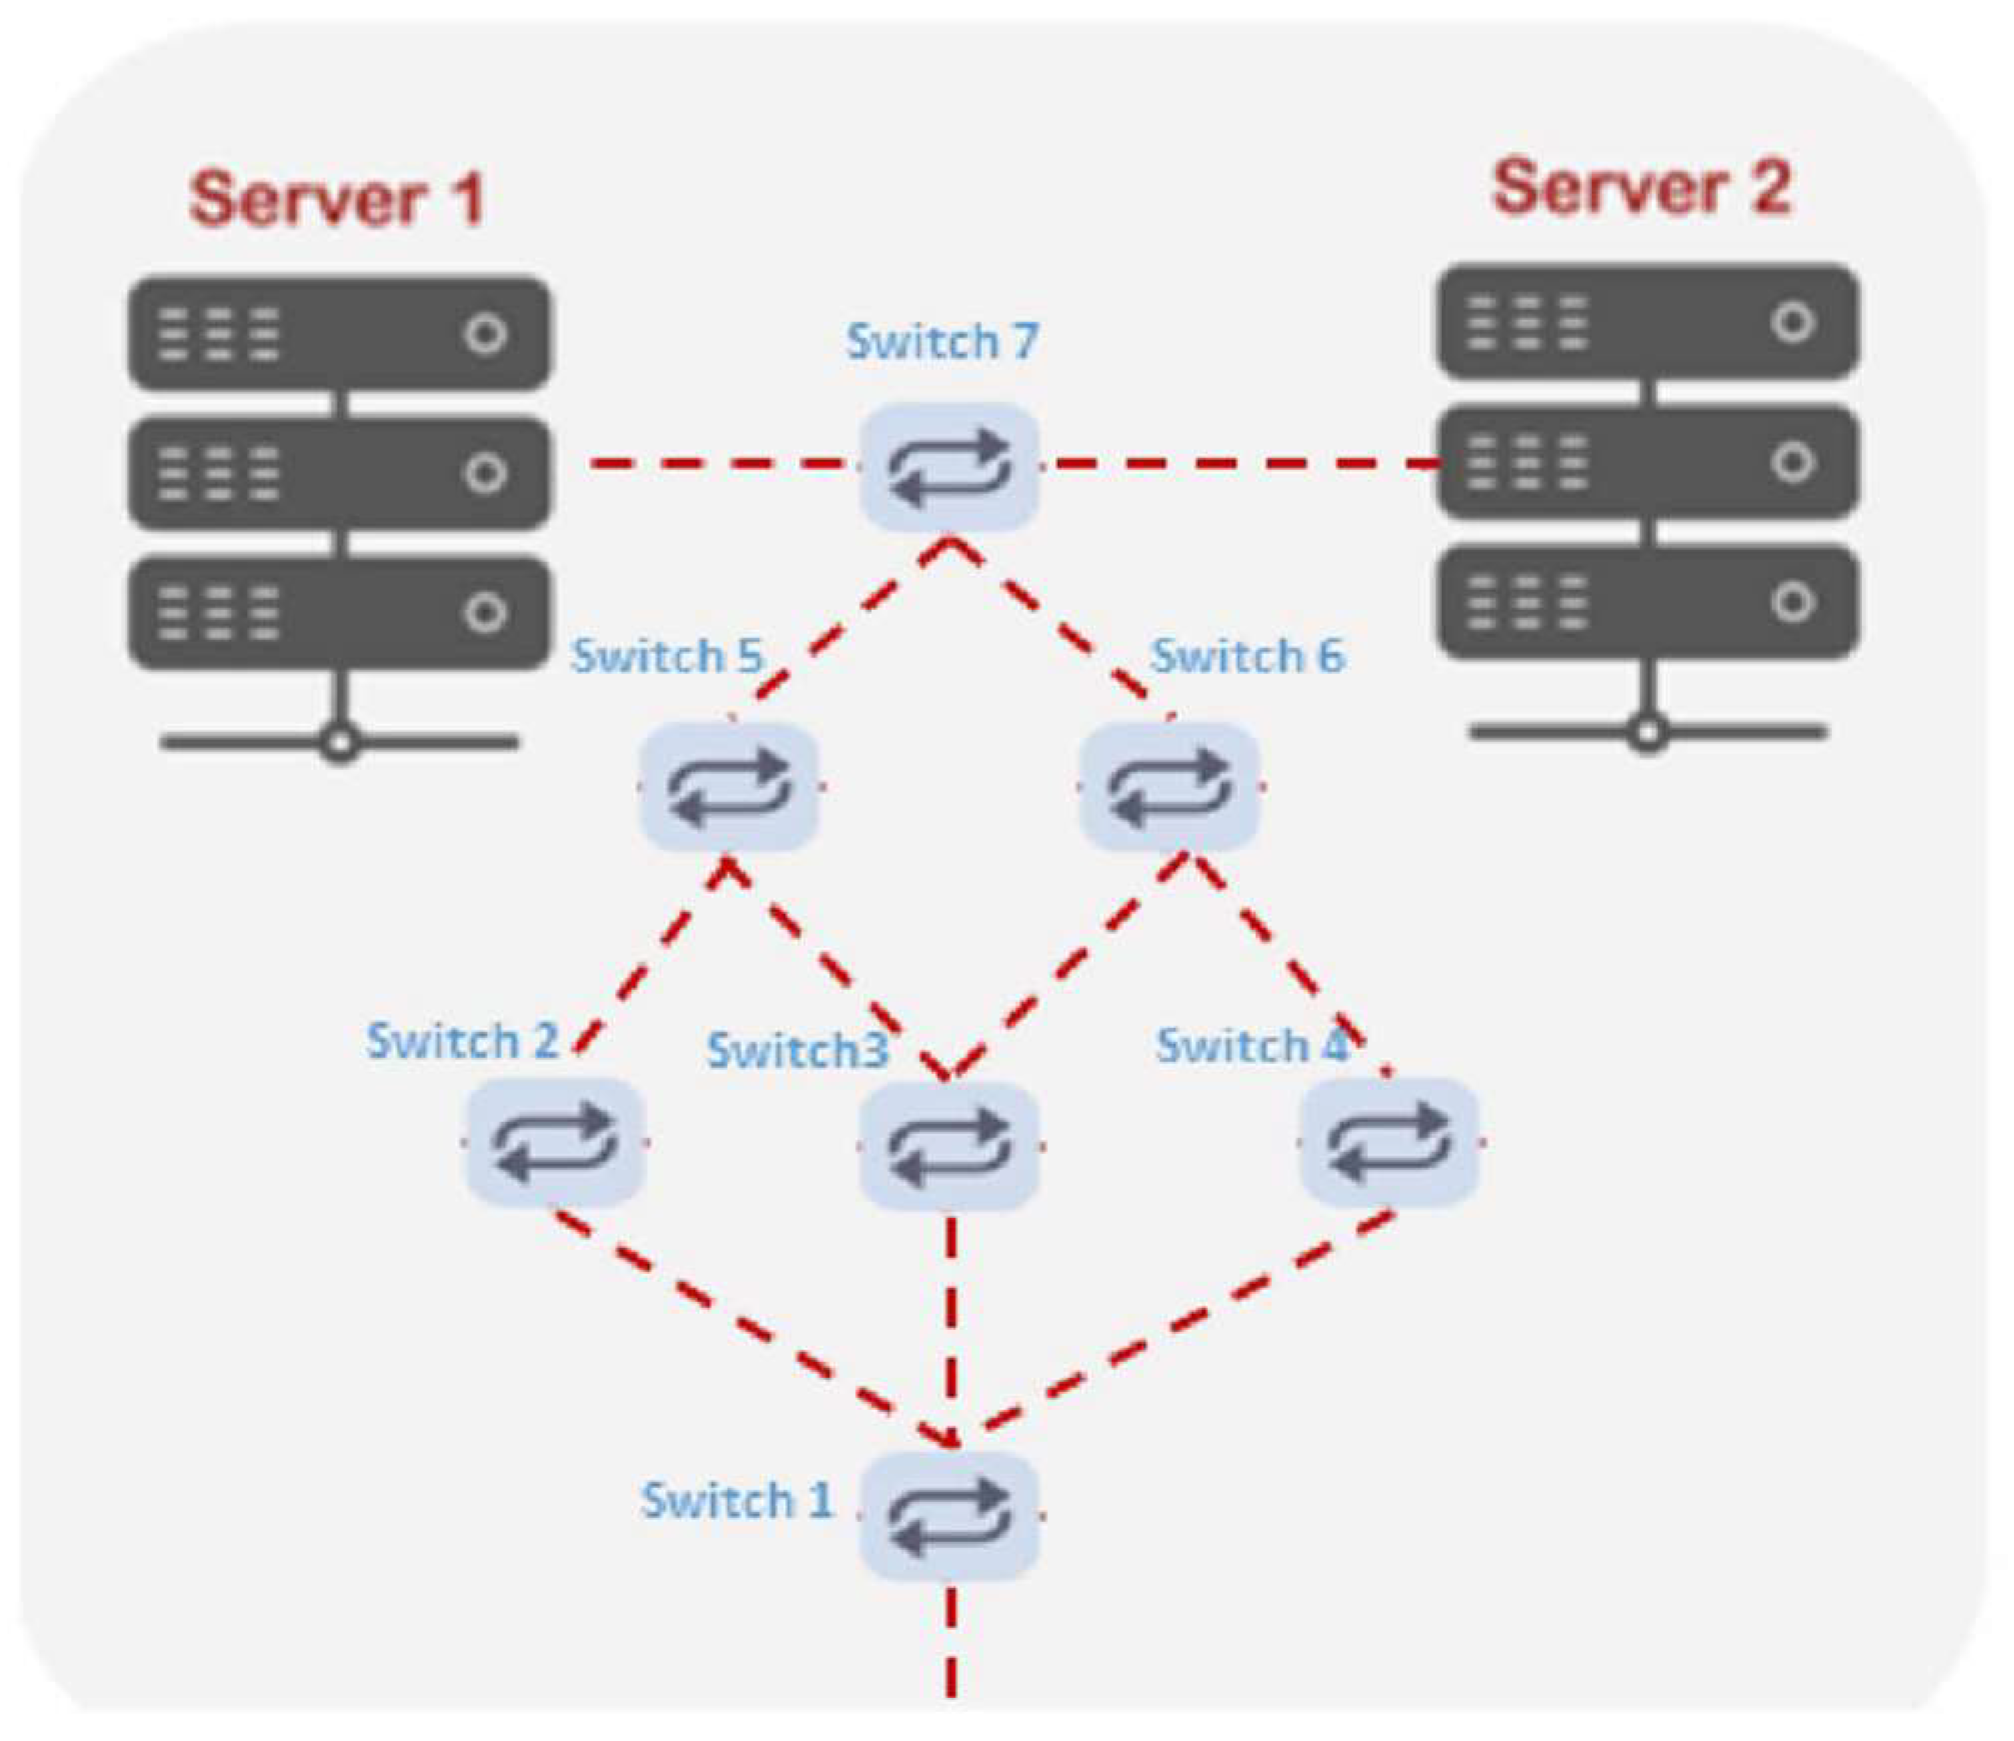
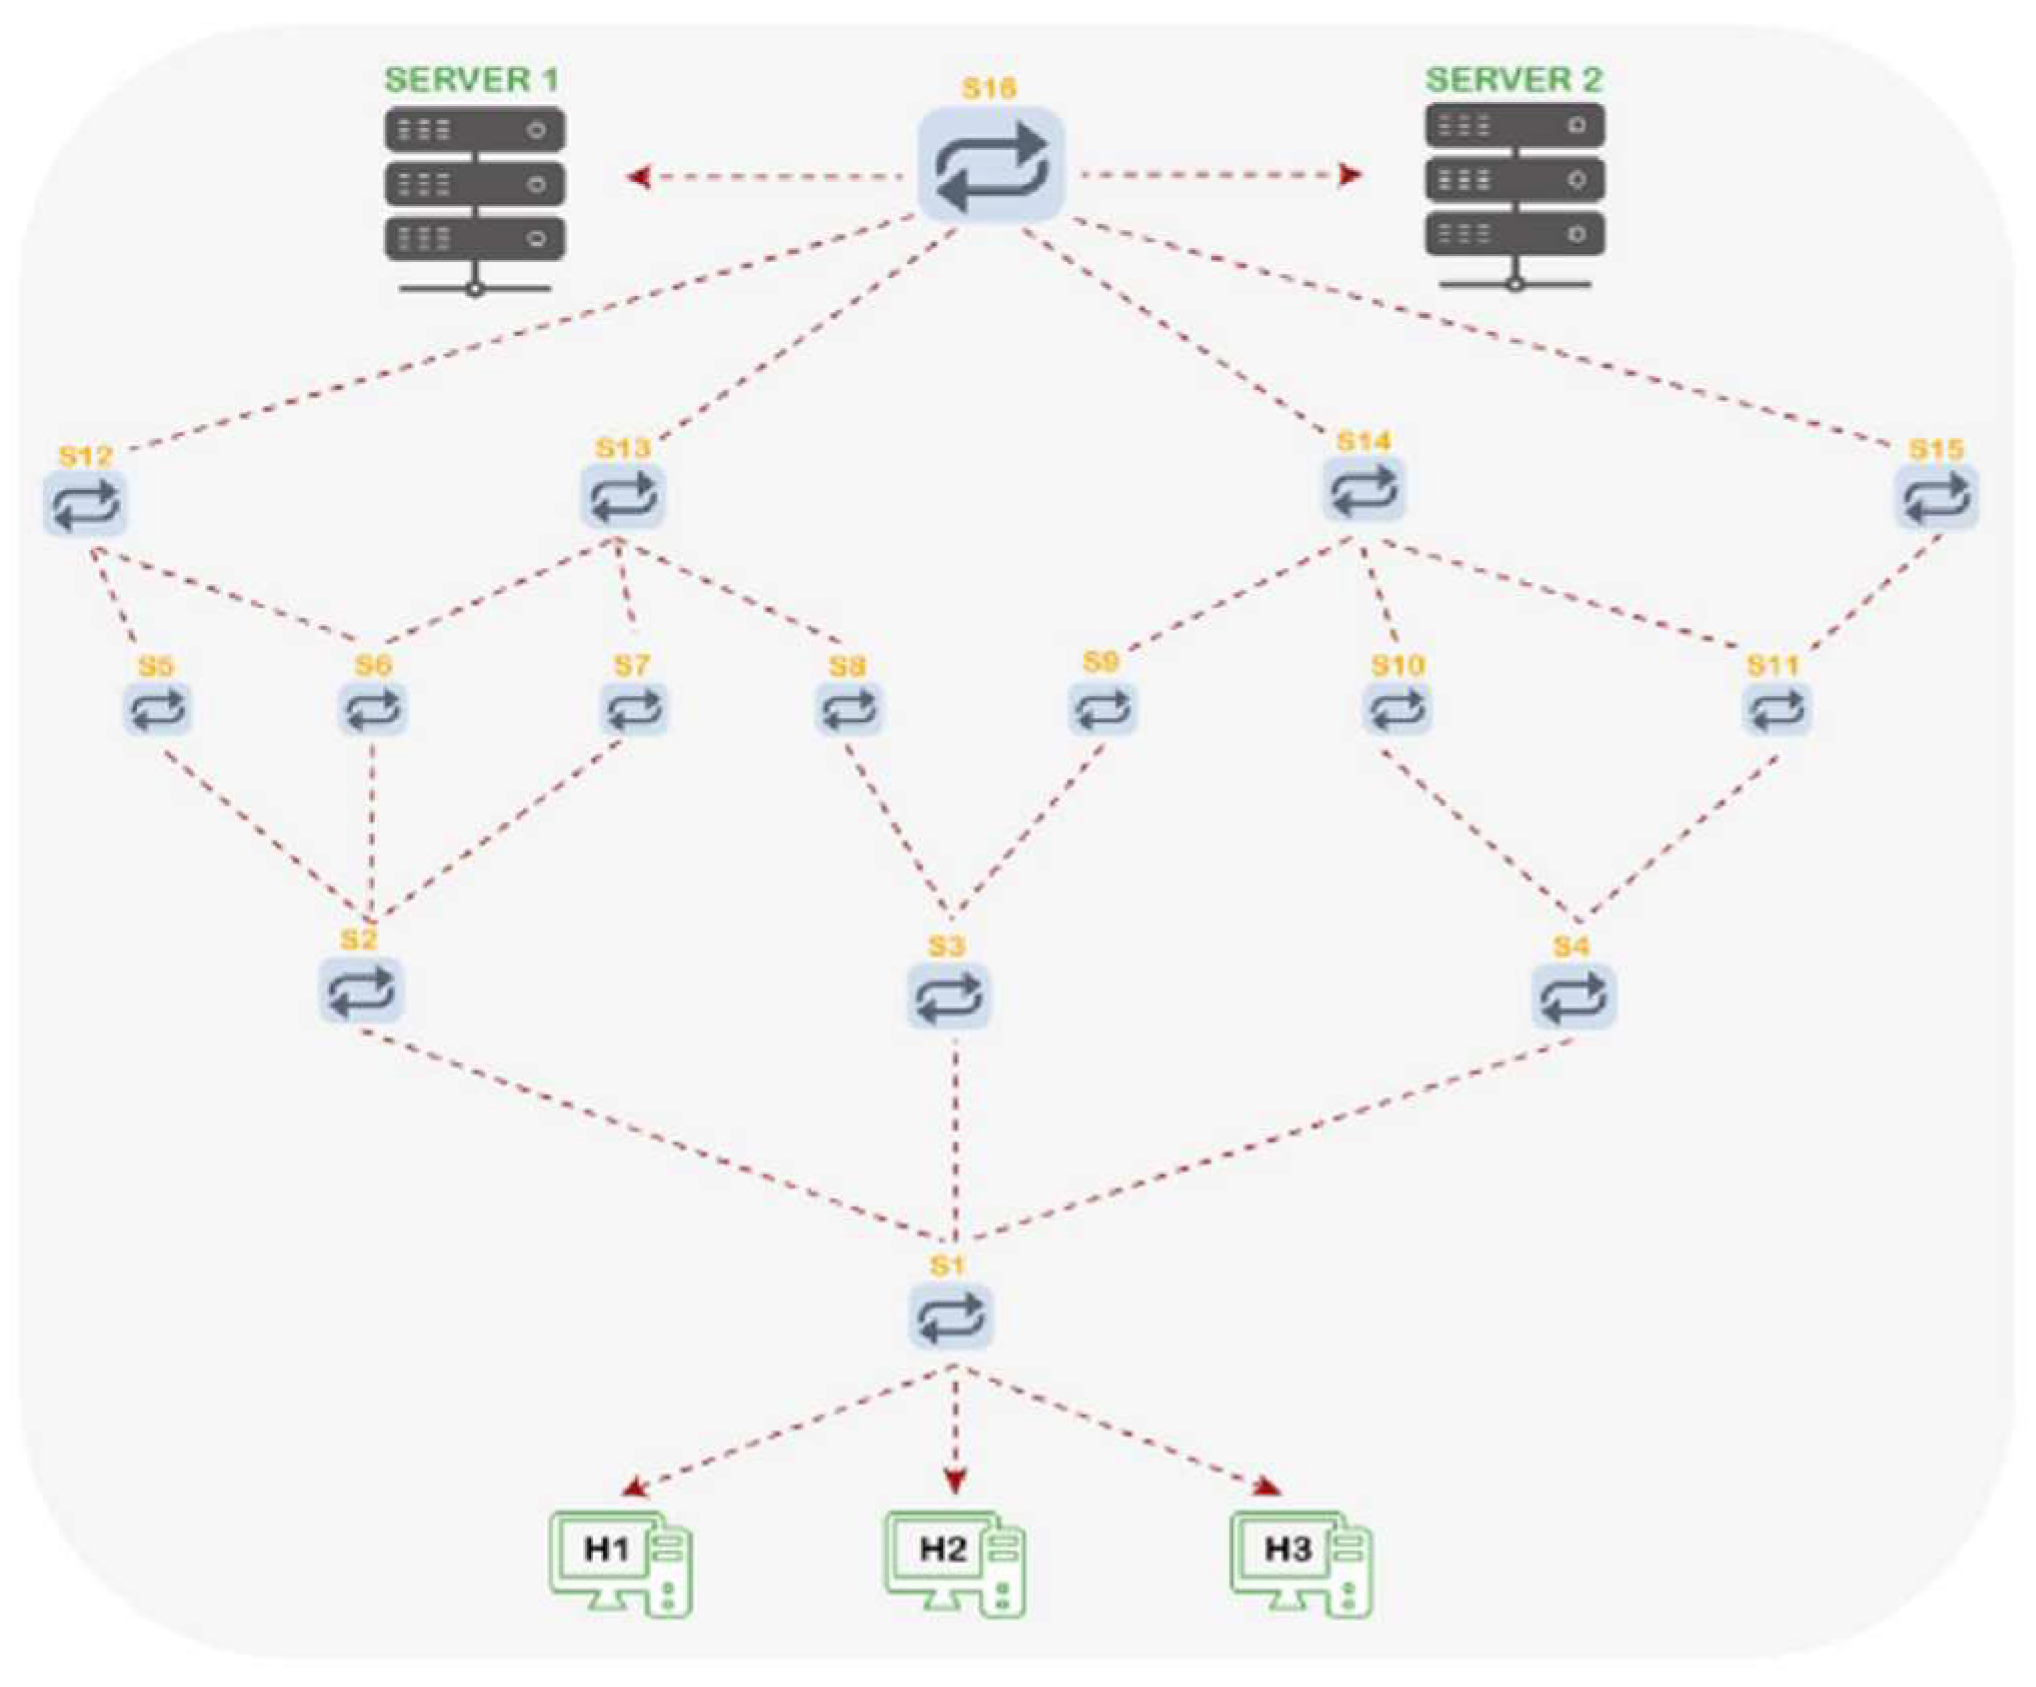
Two DCN topologies were used to test the proposed framework. Figure 3 illustrates the first topology (No. 1), which consists of two servers, seven switches, and six hosts. The second topology (No. 2) includes two servers, sixteen switches, which are distributed on five layers, and three hosts, as shown in Figure 4.
The experiment was carried out by a group of steps as described below.
4.1.1. Monitoring and Gathering Data
Traffic monitoring is vital for improving the comprehensive performance of a network and traffic flow optimization, which is the aim of this study. The SDN technology introduces an innovative concept by making the network infrastructure scalable, usable, programmable, and centralized controllable. Furthermore, the SDN presents a dynamic monitoring scheme for network traffic. The Mininet emulation paradigm was used for setting up and installing a SDN environment in this study. The emulation environment includes a Ryu controller, OpenFlow switches, and hosts. Two scenarios for the DCN topologies were emulated, as presented in Figure 3 and Figure 4, for implementing the proposed method. The used topologies are configured for handling the TCP and UDP packets. These flows are generated using a virtual machine created by the VMware workstation in a Linux environment. The OpenFlow Wireshark and tcpdump tools are used with the Mininet emulator to understand the behavior of the proposed DCN topologies for analyzing the performance of the network.
In order to perform a flow background load on the network, the experiment started with generating UDP packets with different sizes and rates during 300 s of simulation, as shown in Table 1.
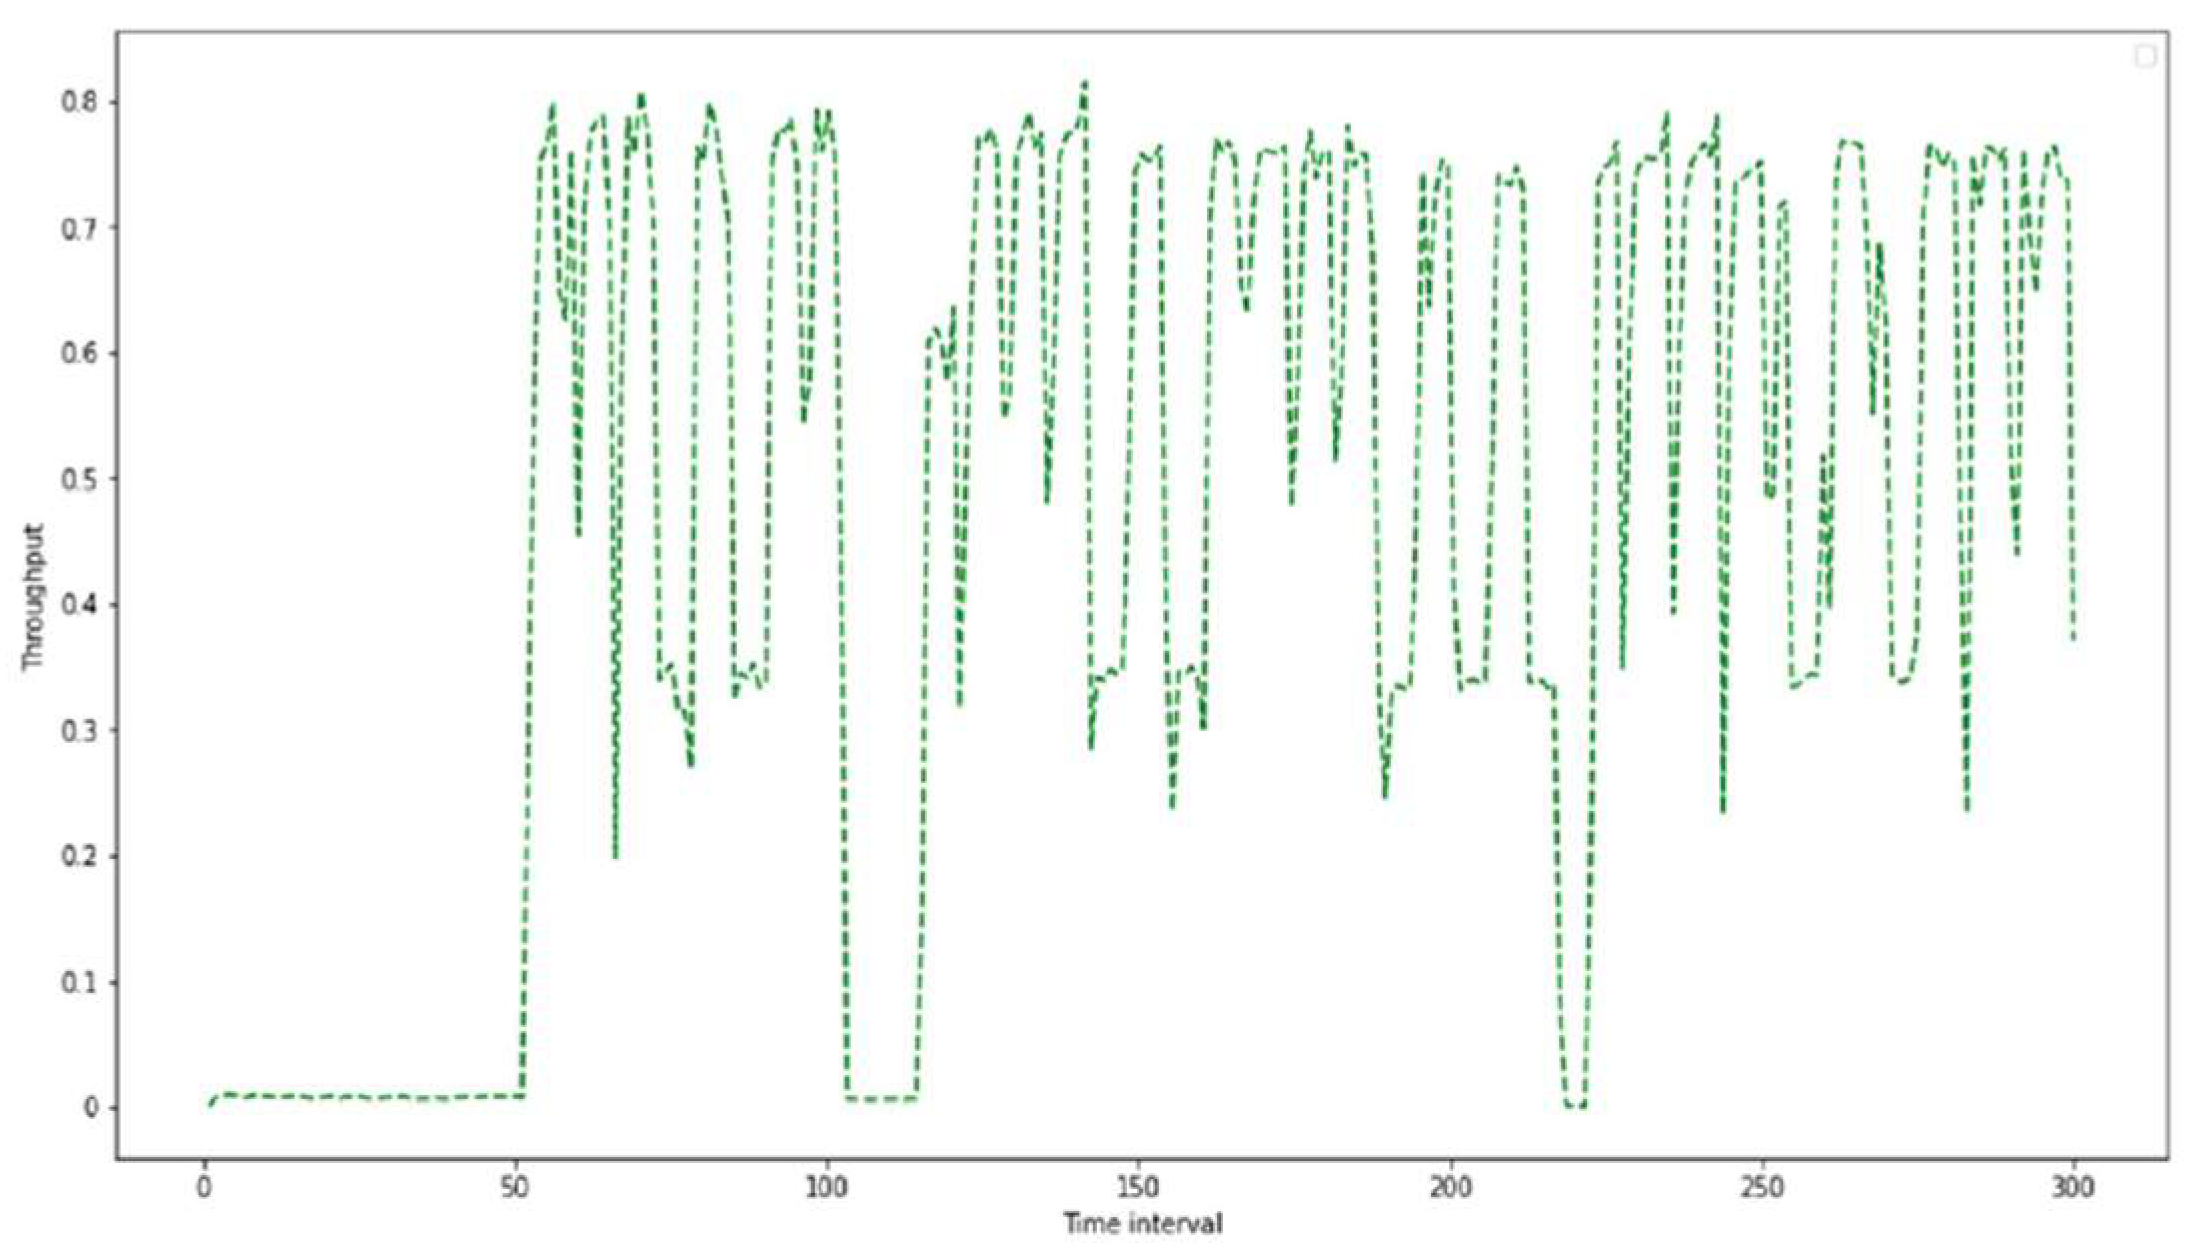
Following that, many TCP connections were initialized with different time flow between two hosts. The behavior of the first DCN topology using the throughput parameter is demonstrated in Figure 5.
Wireshark was run in the background to capture the OpenFlow packets, which are a TCP packet type. Then, the tcpdump tool was utilized for the loopback interface. The collected data were stored as pcap files for the two proposed DCN topologies. To undertake a comprehensive analysis, the tcptrace tool was employed to produce all complete flows characterized based on the performance parameters and to store them in a CSV files.
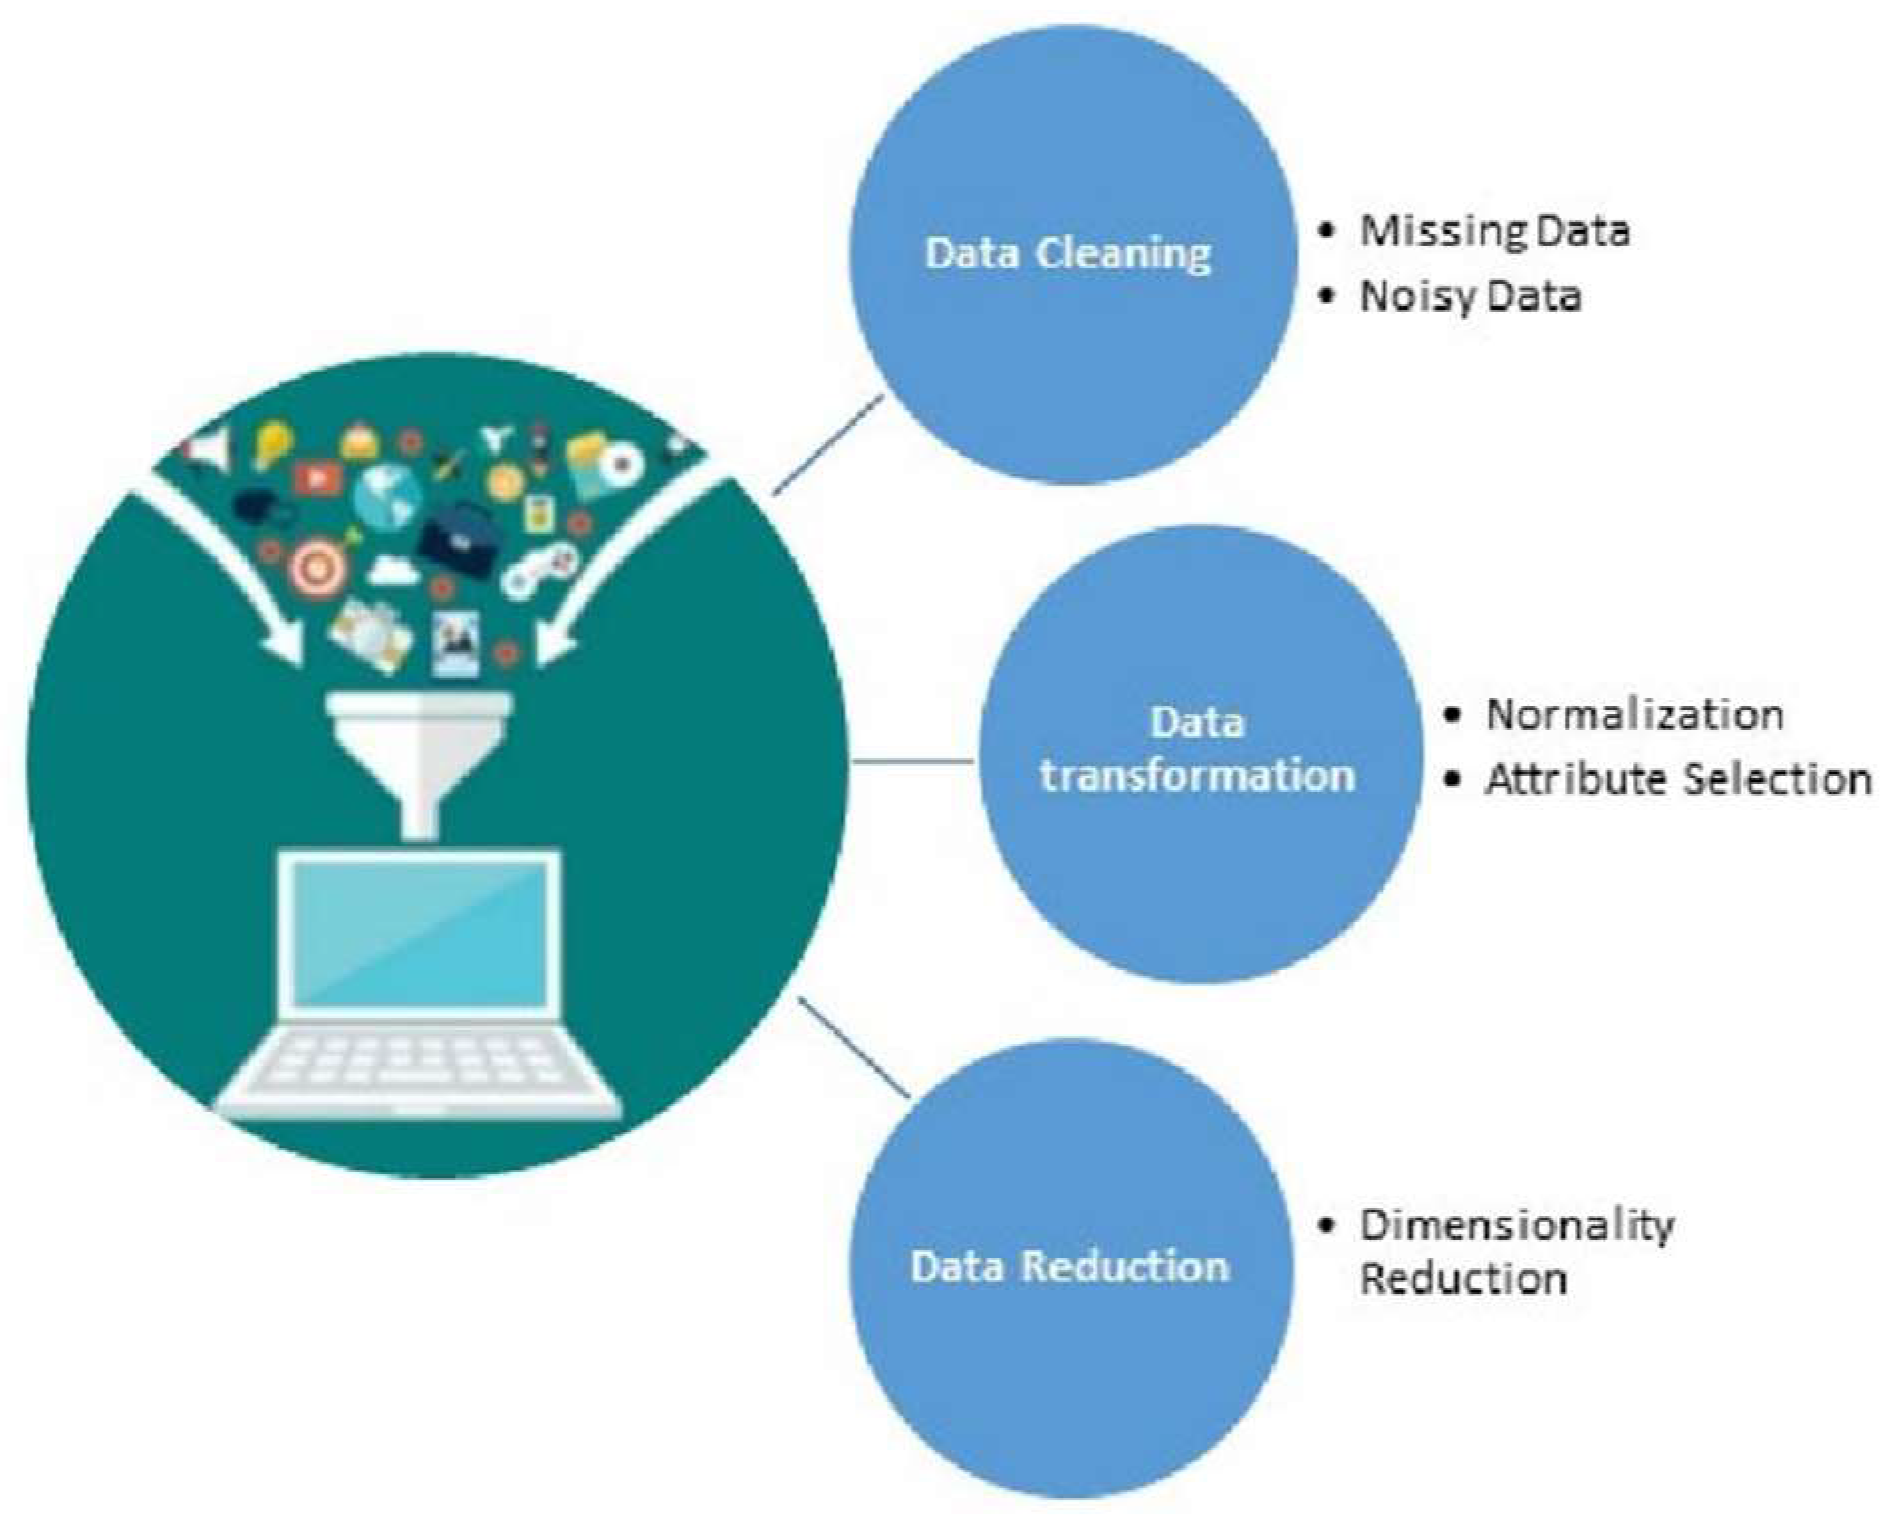
4.1.2. Pre-Processing
This step is essential to obtain consistent, integrated, and processable data using the machine learning techniques. The preprocessing starts with data cleaning and data transformation, and it ends with data reduction [38], as illustrated in Figure 6. The data cleaning process is used to clean the dataset by eliminating irrelevant and useless records and parameters. Afterward, data transformation is performed to convert all features. The step ends with data reduction, where PCA is utilized with 13 components. The results prove the validity of the findings of the preprocessing in [38] by achieving a balance between completeness and simplicity and an accuracy of the clustering process.
4.1.3. Flow Characterization and Cluster Analysis
The first aim of this project is to develop a flow characterizing mechanism based on the metrics of network performance. Unsupervised machine learning techniques were proposed to achieve this goal. K-means as unsupervised clustering can create clusters of flow without the need for predefining the classes. This algorithm isutilized to understand the differentiation of flows with respect to their network performance features. It is applied to construct three clusters, where the minimum number of clusters was investigated in this experiment. The quality of clustering is measured by using the accuracy metric. This metric is determined by two factors: inter-cluster distance and intra-cluster distance [38]. As a result, unique samples of flow are recognized for each cluster.
4.1.4. Identifying Flow
One of the serious problems that affects the quality of service for mice flows is a slow-down transfer caused by elephant flows through a network, which leads to a degradation of network performance. The identification mechanism was proposed to distinguish the flows as elephants and mice by leveraging some of the parameters clarified in Section 4.1.3. Each elephant or mice flow is defined based on the threshold values marked on pre-decided features using the thresholding method [32]. The final step in this phase includes representative flow extraction for the elephant and mice flows in each cluster that has resulted from the clustering process. It is interesting in this step that, in some clusters, one or two representative flows can be extracted for elephant or mice flows.
4.1.5. Best Path Selection
Normally, a large number of servers and switches are included in DCNs. In a wide DCN, each node has multiple flows. Therefore, accessing the data with reliability and in a simple way is extremely hard in this type of network. To solve this problem, different topologies are used to improve the utilization of bandwidth and reduce network congestion. In this part of the work, two types of DCNs based on the SDN are deployed, as explained in Figure 3 and Figure 4. In the DCN, the performance of the network is a critical aspect; hence, high throughput and sensitivity to packet loss are required. Elephant and mice flows are known as the main types of traffic in a DCN. Therefore, the need to manage the traffic of these types of flow still exists as discussed in the literature review section.
Many algorithms can provide routing for elephants and/or mice flows. For example, equal-cost multipath routing (ECMP) [39] can be utilized for routing mice but not elephant flows [40]. In this project, the primary aim is to select the best path for each elephant and mice flow. The best path for a flow is the path that achieves the requirements of the flow, such as low latency for mice flows and high bandwidth for elephant flows. A developed Dijkstra algorithm was proposed to find the route based on the type of flow (elephant or mice flows) by employing Algorithms 2, 3, and 5, as shown in Section 3.2. Using a developed Dijkstra algorithm, the links that fulfill the conditions are determined, and the paths that contain the appropriate bandwidth and latency are selected.
The Dijkstra algorithm was applied to find the shortest path for mice flows, whereas for elephant flows, the Widest- Dijkstra algorithm was used to find multiple paths to route them and record all the available shortest paths. Because it has an appropriate complexity for real-time problems and it gives deterministic results, the Dijkstra algorithm was chosen in this part of the work.
4.1.6. Updating Cost of Link
Determining a route for a particular flow through a SDN efficiently is still challenging. The SDN controller must obtain a lot of information in order to accomplish this. The information includes getting a comprehensive vision of the network (i.e., network topology discovery and getting link state information), computing the optimum paths for the flows considering the information of the flows and the network, and reconfiguring the routing table based on the new forwarding rules in the infrastructure plane. Common routing algorithms depend on three concepts to compute the cost of a link. These concepts are static link cost (Hop-to-Hop count, distance, and link capacity), dynamic link cost (available link capacity, and link utilization), and dynamic link cost while minimizing the interference (available link capacity, link utilization, and flow count on a link) [41]. The approach presented in this part explains the computing and updating of the cost of a link in the SDN framework. The cost of a link is calculated based on the inverse relationship between the bandwidth and the latency of the link, where latency is equal to the reciprocal value of bandwidth. The cost of the link is updated recursively. The cost of the link is calculated based on the updateCost algorithm in Section 3.2. An example and figures are explained for this aspect below.
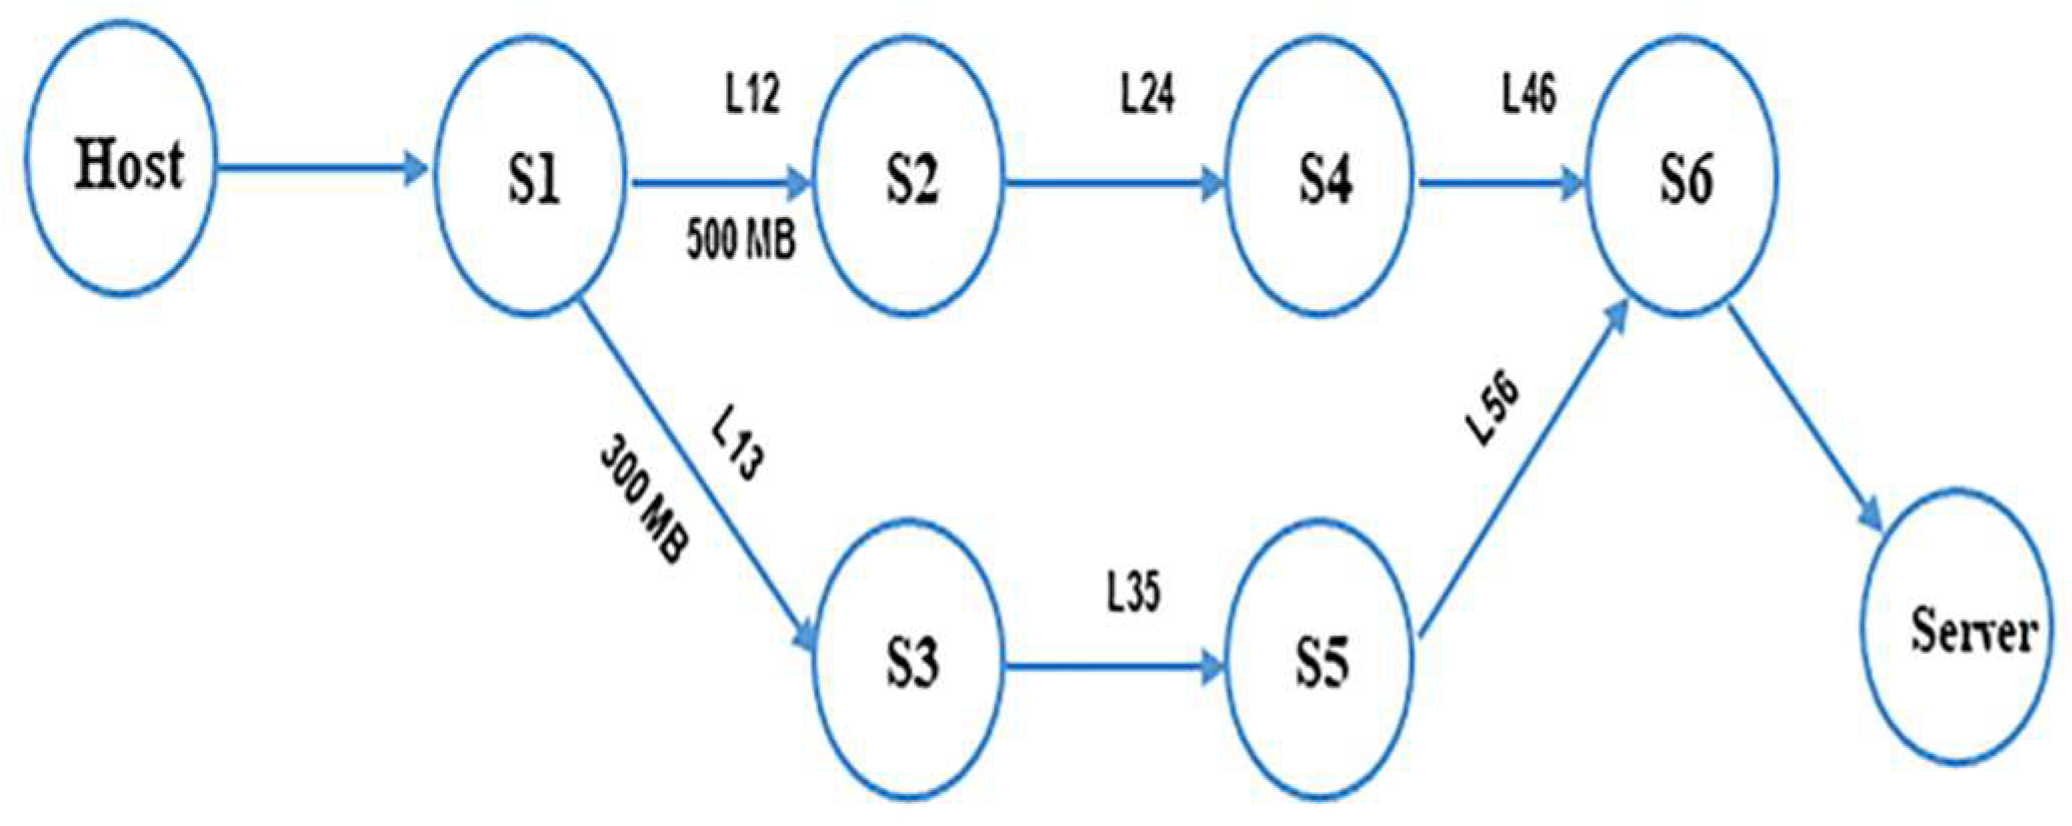
Suppose that a host (Host) wants to send a set of packets to a server (Server) and there are two different routes between the Host and the Server, as shown in Figure 7, the steps below will be followed to calculate the link cost of both routes:
- 1st route R1 goes through switches S1- > S2- > S4- > S6- > Server
- 2nd route R2 goes through switches: S1- > S3- > -S5- > S6- > Server
- The getAvailablePaths (Host, Server) algorithm will find these two paths (R1, R2) between Host and Server
- For each link in R1,R2
- B1 = Available bandwidth of P1 = availableBW(L12) + availableBW(L24) + availableBW(L46)
- B2 = Available bandwidth of P2 = availableBW(L13) + availableBW(L35) + availableBW(L56)
- Latency of P1 = D1 = 1/B1; Latency of P2 = D2 = 1/B2.
- If D1–acceptableLatency > D2–acceptableLatency then bestCost = D2
- else bestCost = D1
- Then we get the nearest value to the acceptable Latency
- If bestCost = D1 then best path is R1 else best path is R2.
4.2. Results and Evaluation
This experiment was implemented with a CSV file for each DCN topology. Each file contains 1 million flows and 129 features regarding network performance metrics. These features can be found in Appendix A. The 129 features were chosen based on their efficiency in the clustering model [42]. For each TCP flow, we have all the network performance parameters, such as packet loss, round trip time (RTT), and throughput. To reduce the dimensions of the dataset, the PCA technique was applied. A total of 13 PCA components were input into the clustering process. It is the best number of components to achieve a balance between completeness and simplicity [38]. The outputs of the clustering and identification steps are three clusters. Each cluster consists of a group of elephants and mice flows, which have distinct characteristics. In each cluster, the representative flow are selected for each type of flow. To find the best path for each elephant and mice flow, a developed Dijkstra algorithm was utilized. The flow types and description for the experiments are provided in Table 2.
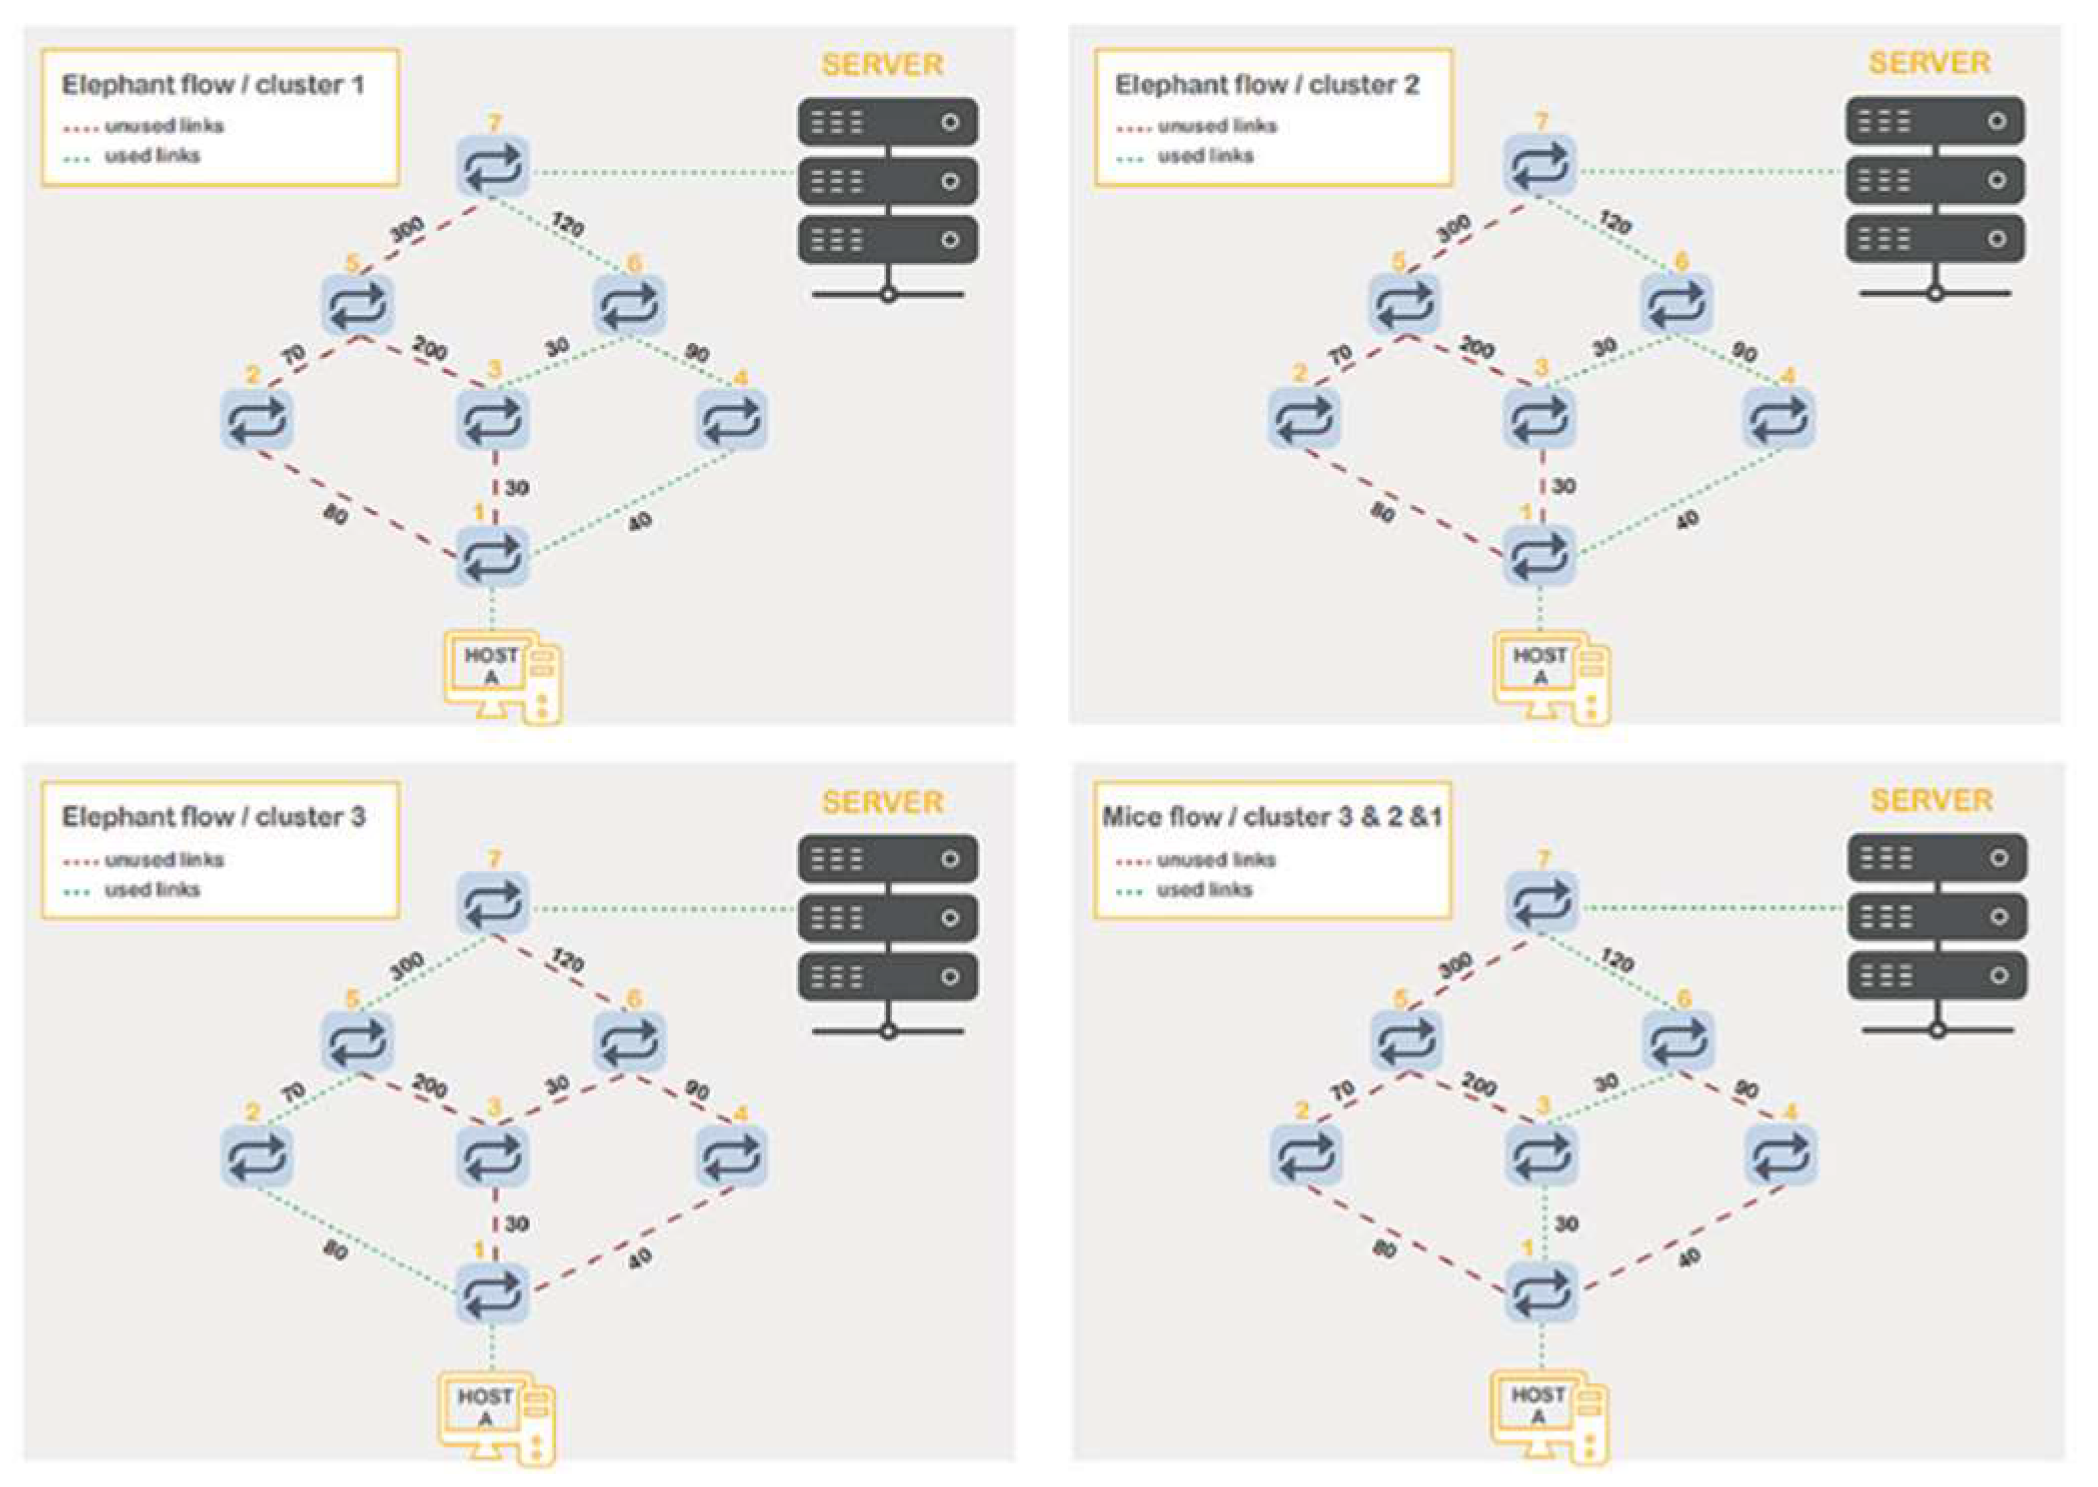
Figure 8 depicts the routing process of each type of flow (elephant or mice) for all three clusters. To accomplish a high efficiency and obtain a higher throughput, a flow of the elephant type is sent by more than one path. At the same time, some available paths are kept to serve higher-priority flows, such as real-time traffic. The top left corner of the figure presents the best path that has been selected by the proposed algorithm (Widest- Dijkstra algorithm) for all elephant flows in cluster 1. Using the same technique, the best path for the elephant flows in clusters 2 and 3 are chosen. On the other hand, the bottom right corner of the figure shows the best path for the mice flows in the three clusters. This path has been selected based on Algorithm 5 and the Dijkstra algorithm. The figures clarify the used links with a green dotted line, whereas an unused link is represented by a red dashed line.
The evaluation results show the effectiveness of the proposed flow routing optimization method against the SDN-Ryu controller. Employing a developed Dijkstra algorithm to optimize flow routing results in improved network performance in relation to data center network resources. Furthermore, the evaluation aims to present the benefit of routing-based traffic management over network performance, regardless of the routing of a particular type of flow that is being optimized by the developed routing algorithm, using the SDN framework.
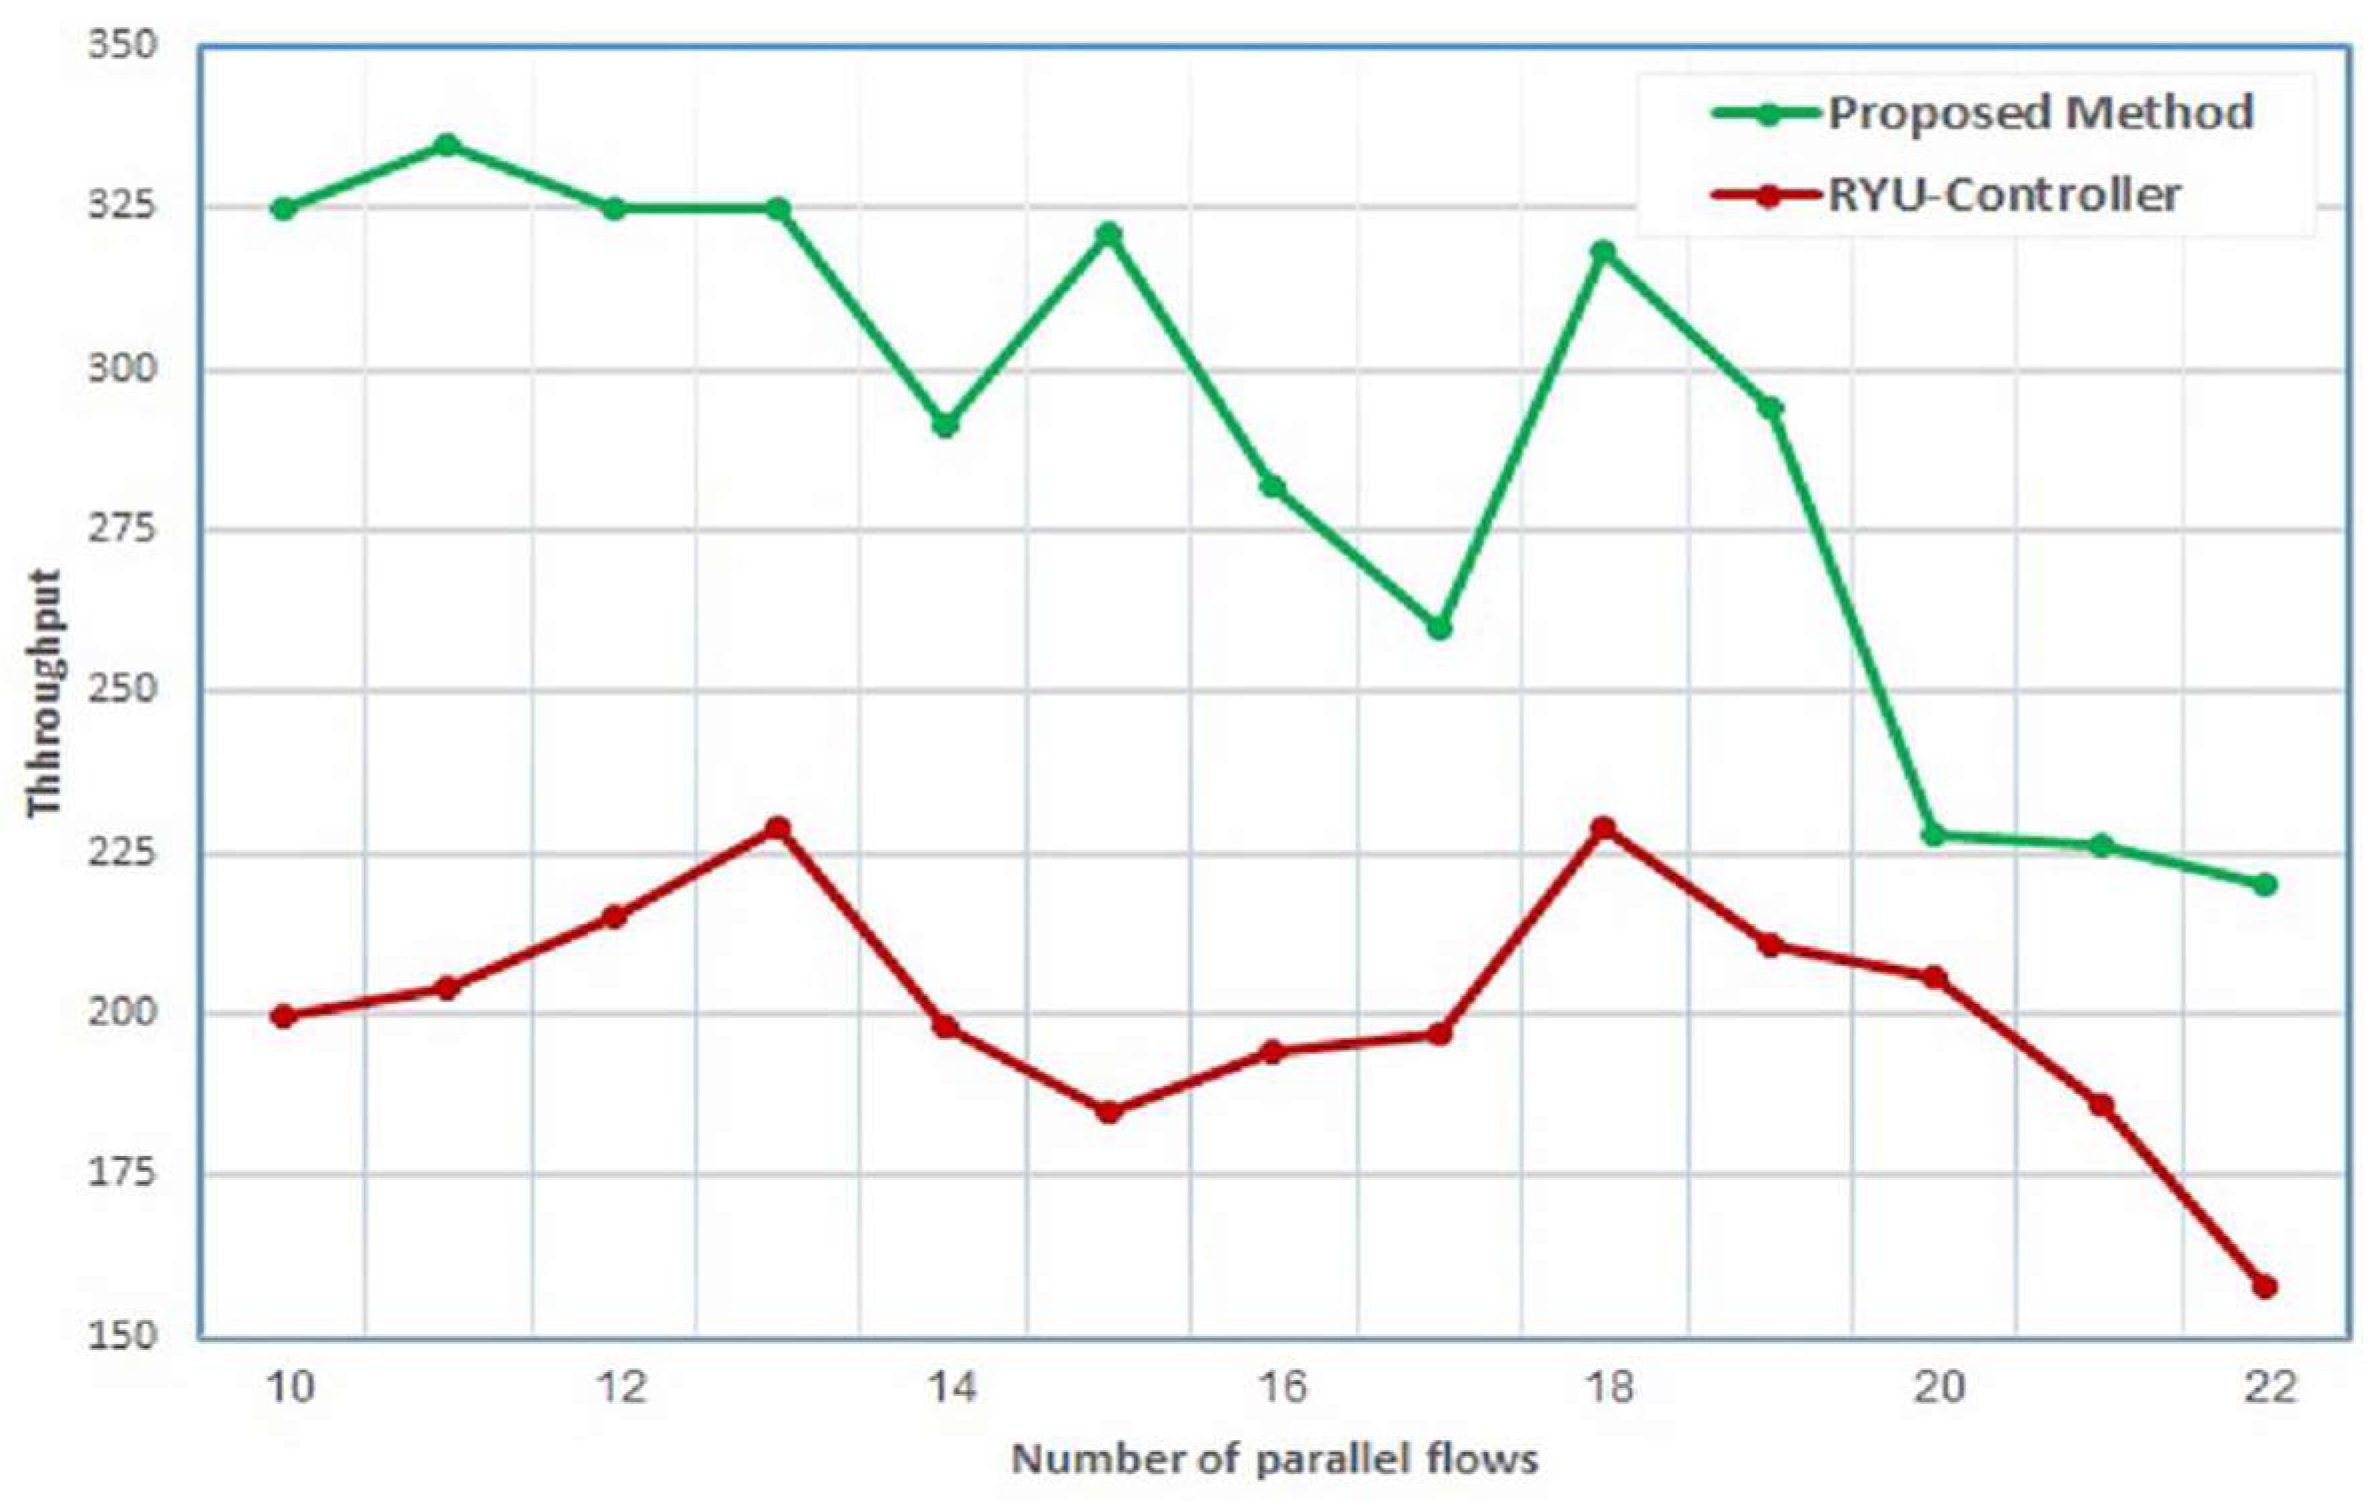
The evaluation of the proposed system conducted for both topologies is provided in Figure 3 and Figure 4. The first test includes a comparison between the SDN-Ryu controller and the proposed system based on their performance using the DCN topology in Figure 3. The comparison is accomplished based on the throughput and bandwidth parameters. As shown below in Figure 9, the proposed application provides a higher throughput than the Ryu controller. This is achieved for all flows. For example, at flow number 10, the throughput of the proposed application improves by a ratio of 61.5% compared to the throughput of the Ryu controller.
In addition, it is observed that a higher number of parallel flows leads to a decline in the throughput for both the proposed application and the Ryu controller. However, the performance of the proposed method is still better than the Ryu controller. The comparison of throughput was performed for the two types of flows.
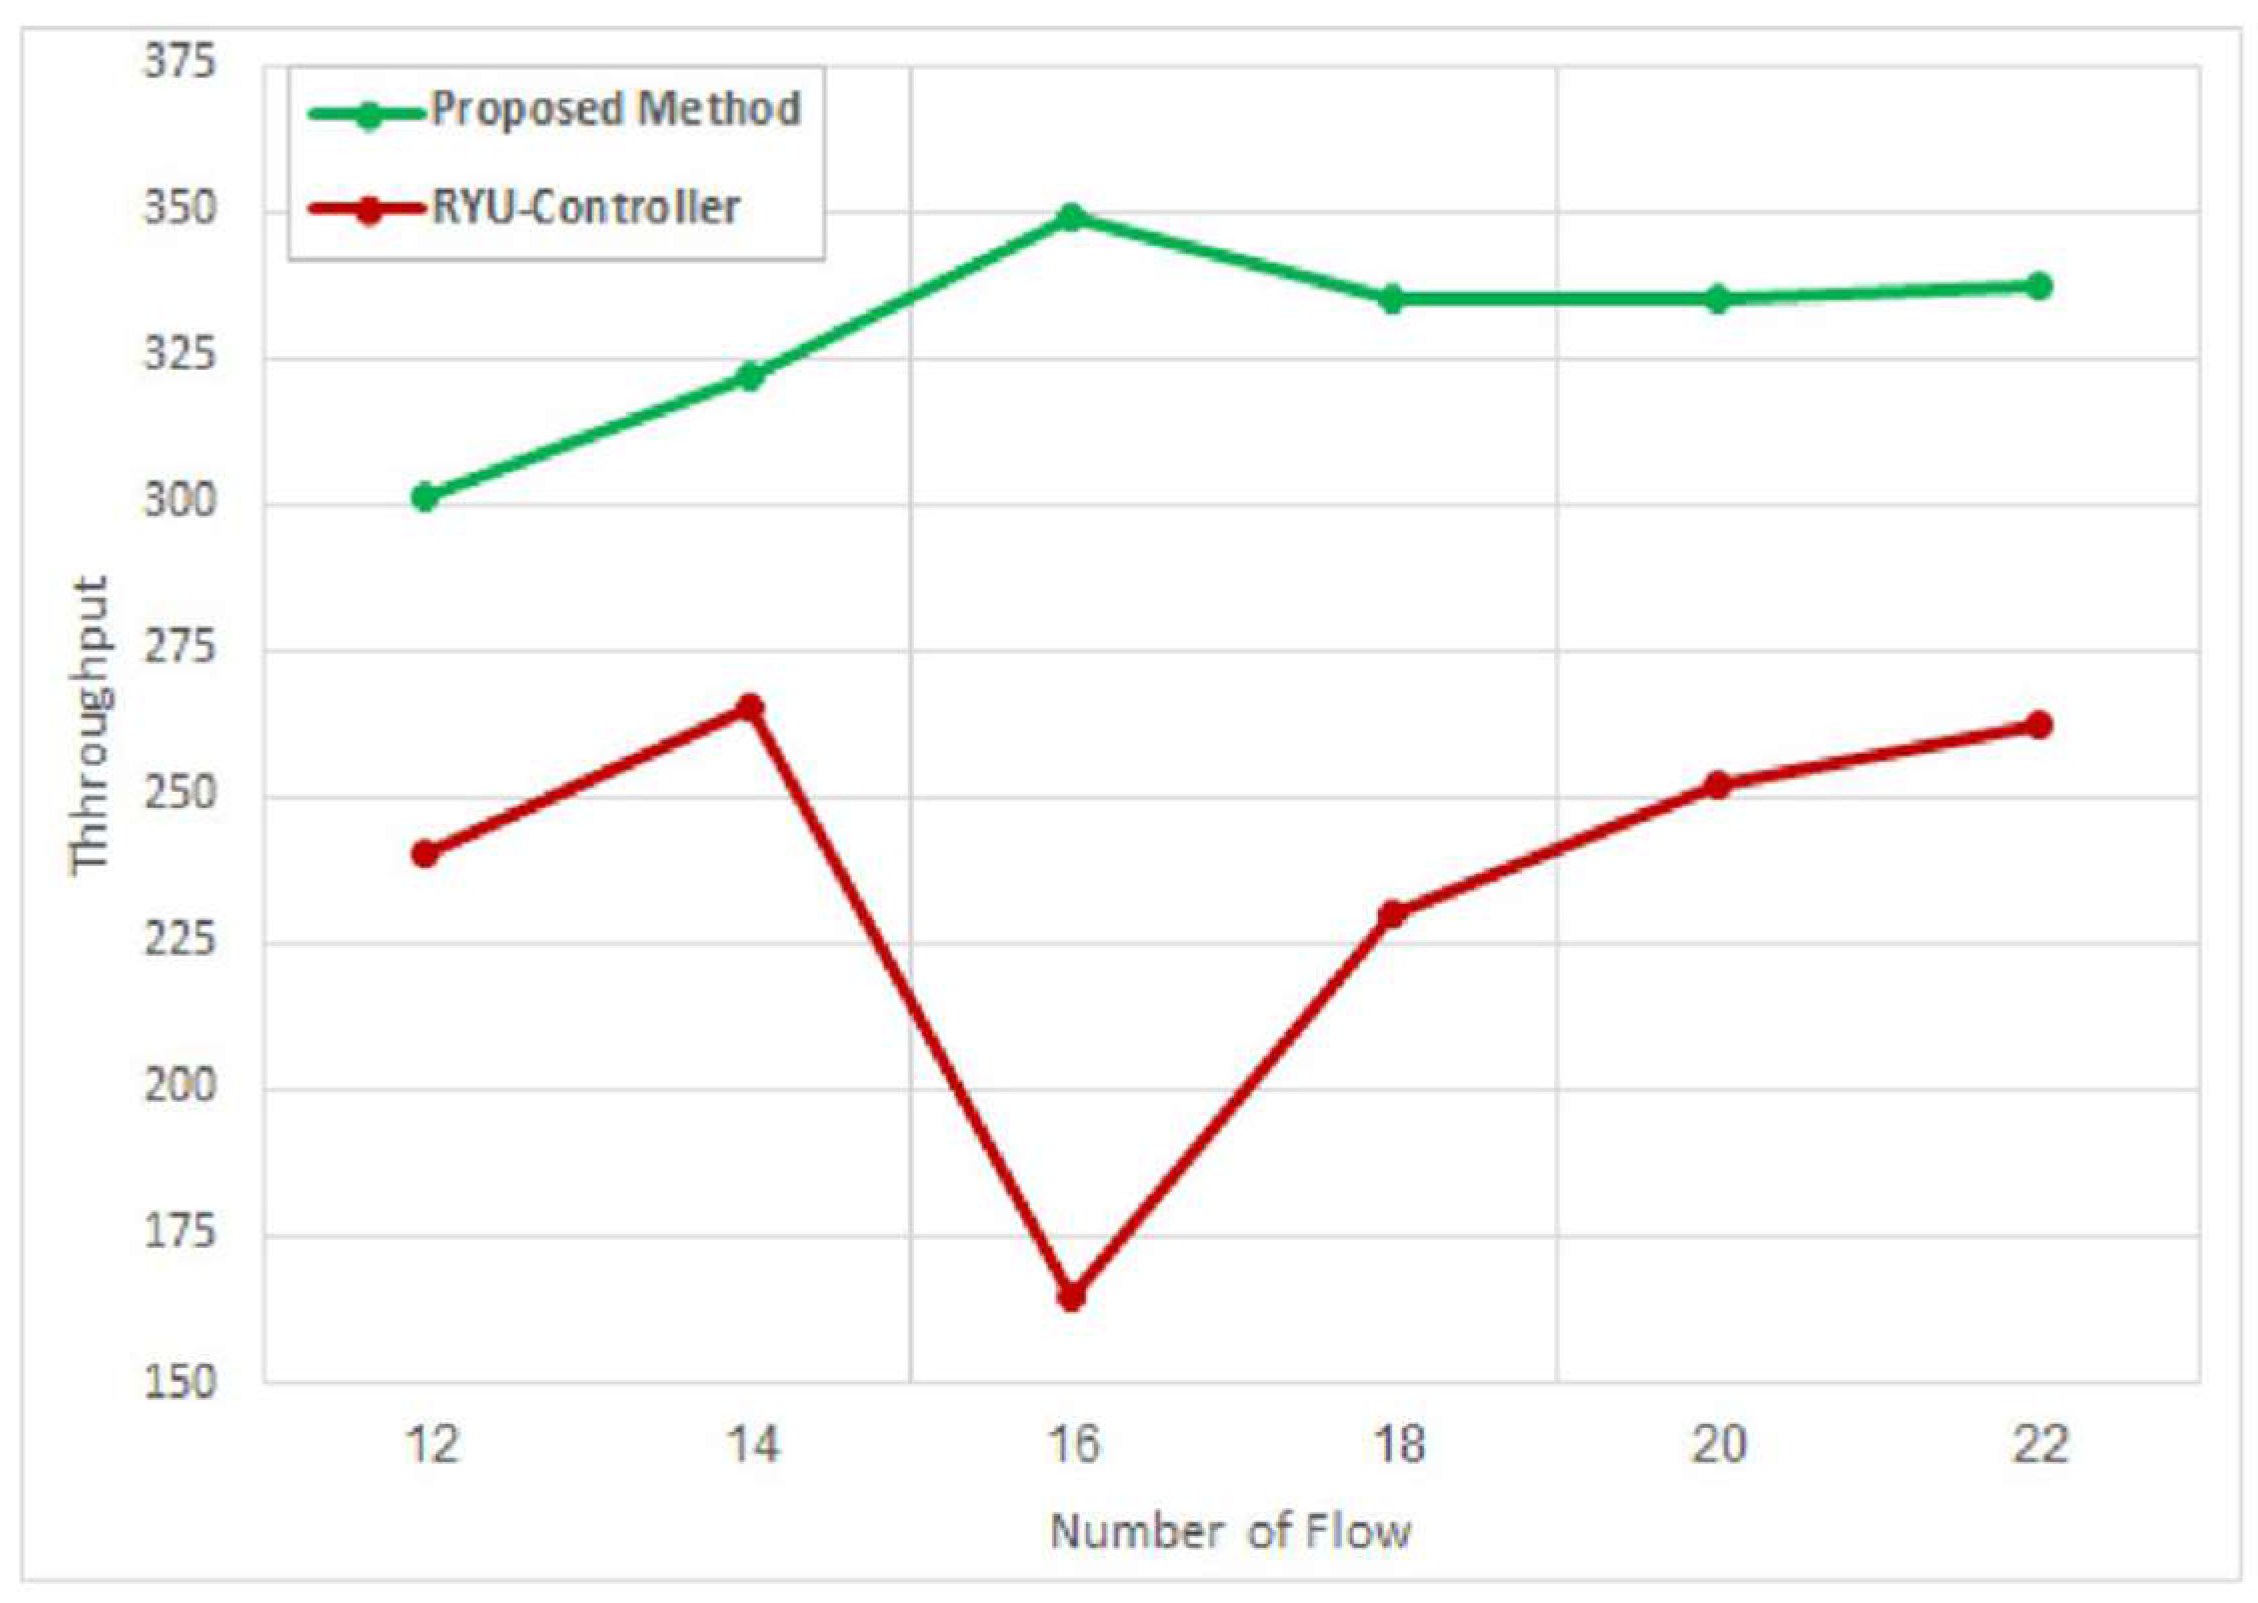
Figure 10 presents the throughput for elephant flows for the proposed approach and the Ryu controller. The findings show that the throughput provided by the proposed application outperforms that of the Ryu controller. For instance, for flow number 16, the result changes because the routing process is based on the type of flow and the ID of the cluster. Therefore, the type of representative flow for each cluster is determined precisely, which is not applied in the Ryu controller. Consequently, the route for the representative flow is selected in a particular cluster and then applied to all the elephant flows in that cluster. For flow number 22, the throughput of our application is about 88.2% superior to that of the Ryu controller for elephant flows, when the throughput measurement is executed for intervals of 0–40 s and has a bandwidth of 100 MB.
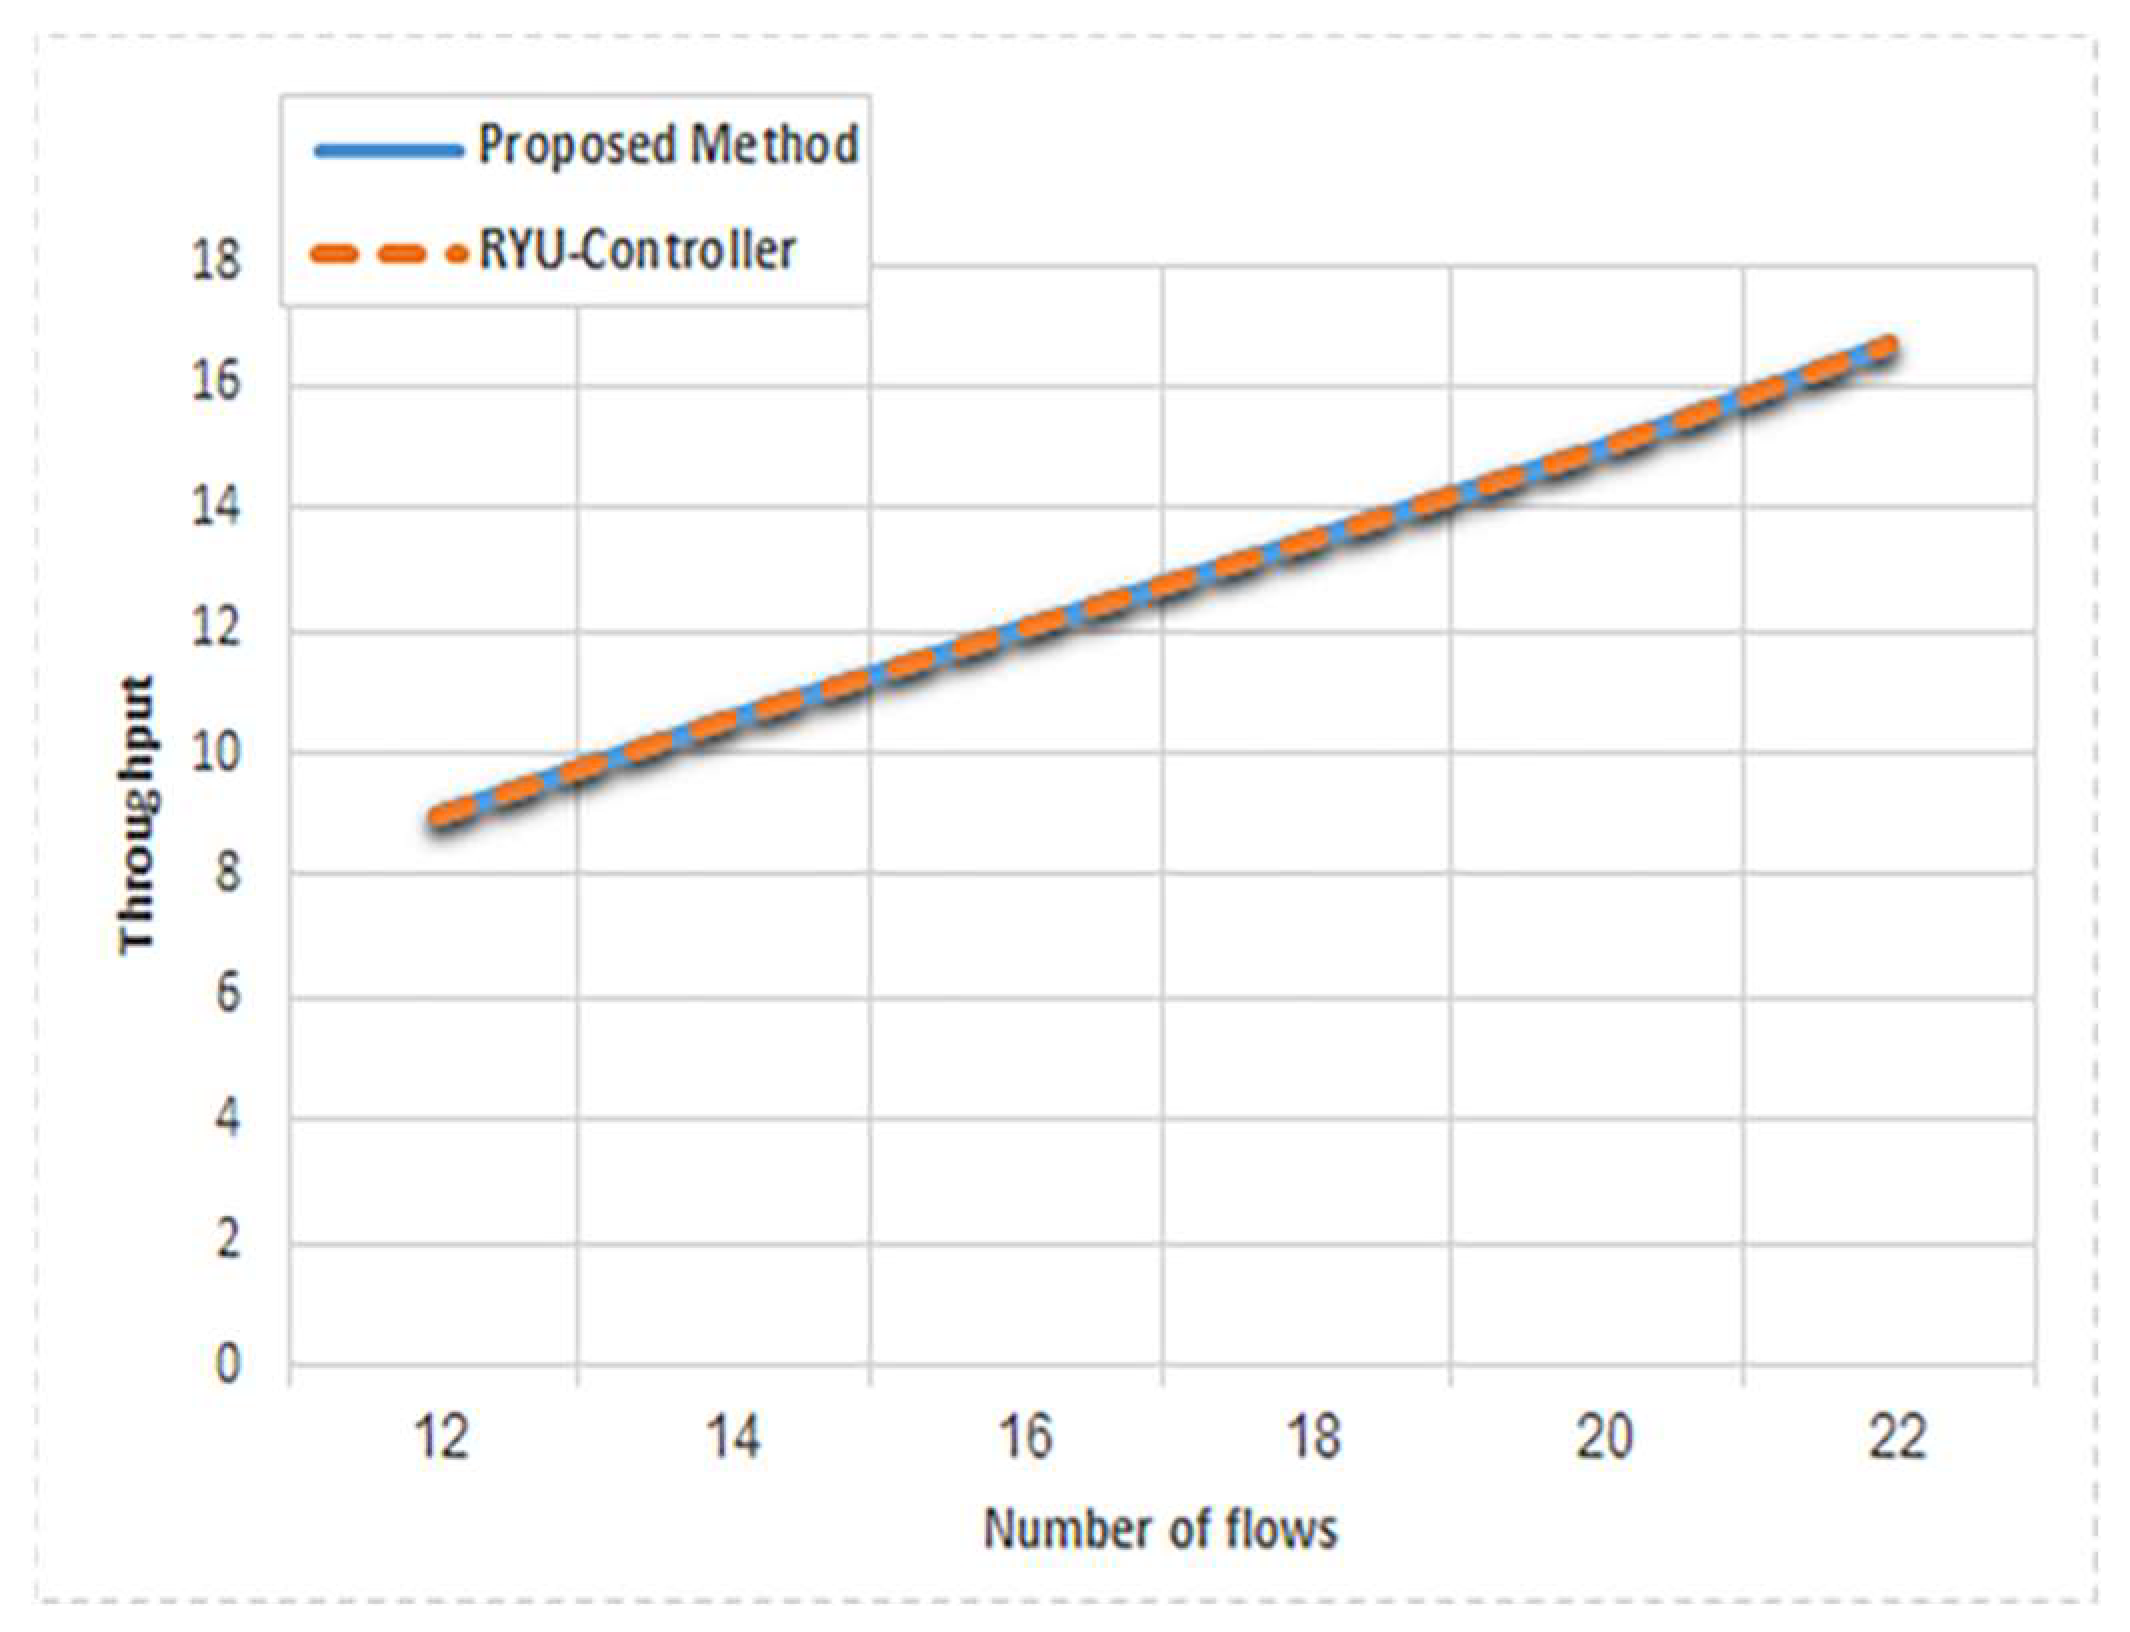
On the other side, the throughput of mice flows is presented in Figure 11. It shows that both the proposed application and the Ryu controller provide the same throughput. It is interpreted by the fact that both of these methods use the shortest path for routing the mice flows. The measurement of mice throughput is run for interval 0–60 s with a bandwidth 100 KB.
For the second parameter, which is bandwidth usage, Figure 12 shows that the performance of the proposed application is higher in most of the flows compared to the Ryu controller. The reasons behind that are (i) the use of a clustering process and (ii) the use of a developed Dijkstra algorithm. The low performance of the proposed method in flows 14 and 22 is because of the need to serve higher-priority flows.
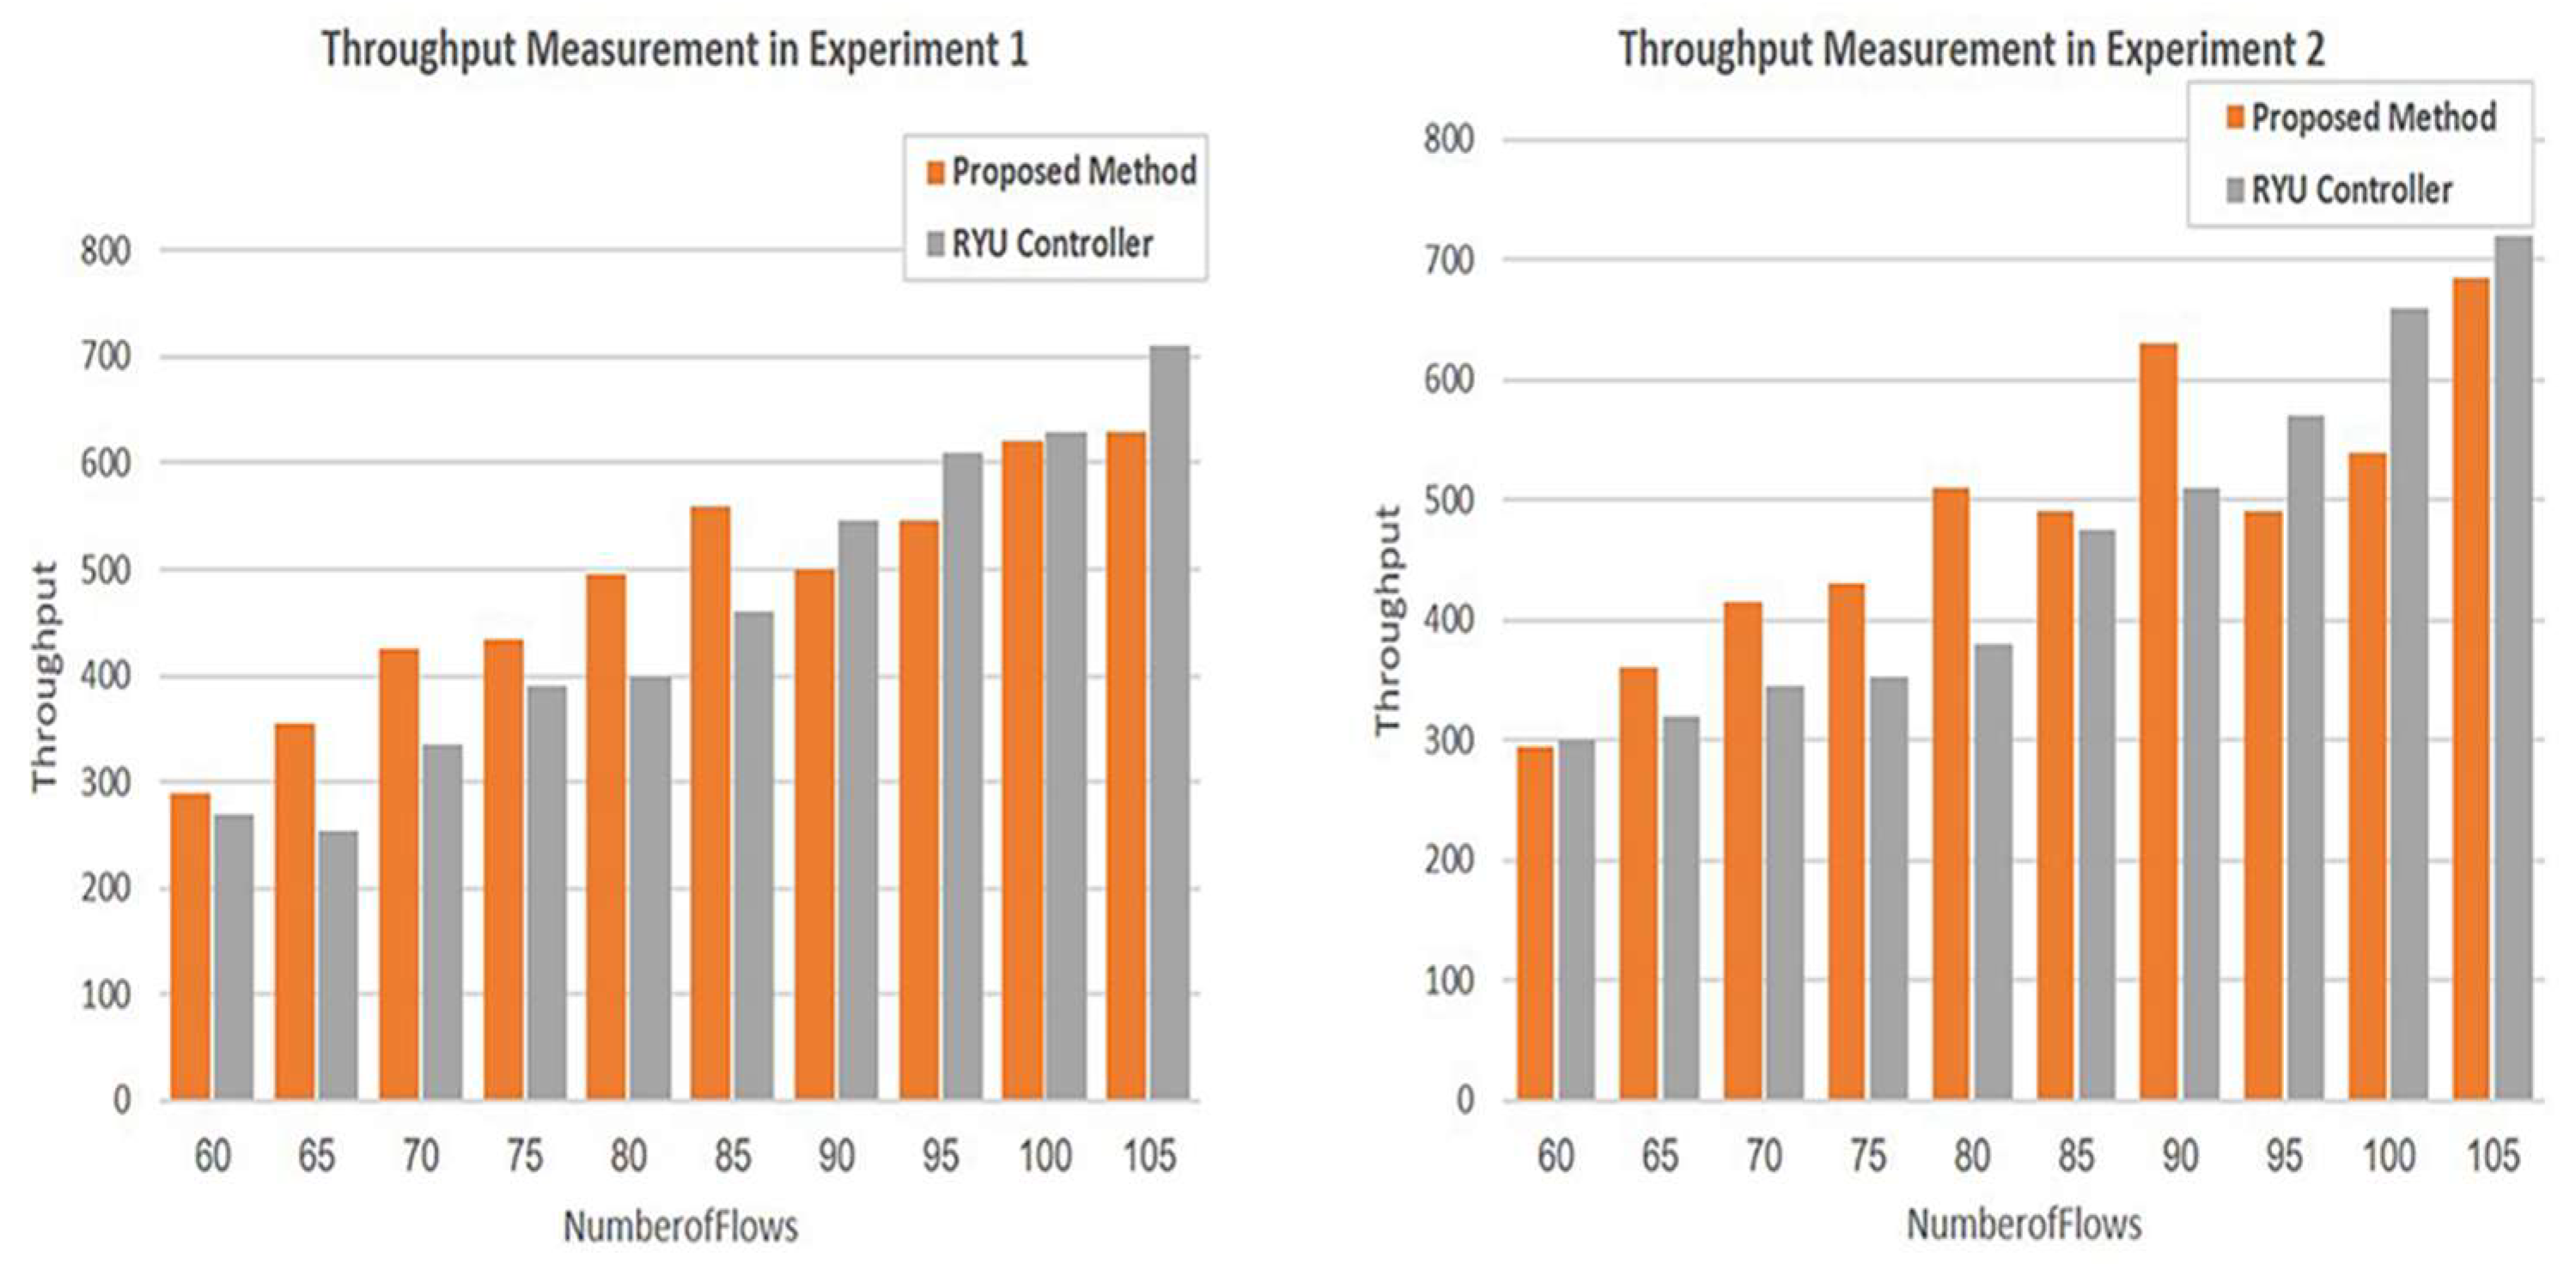
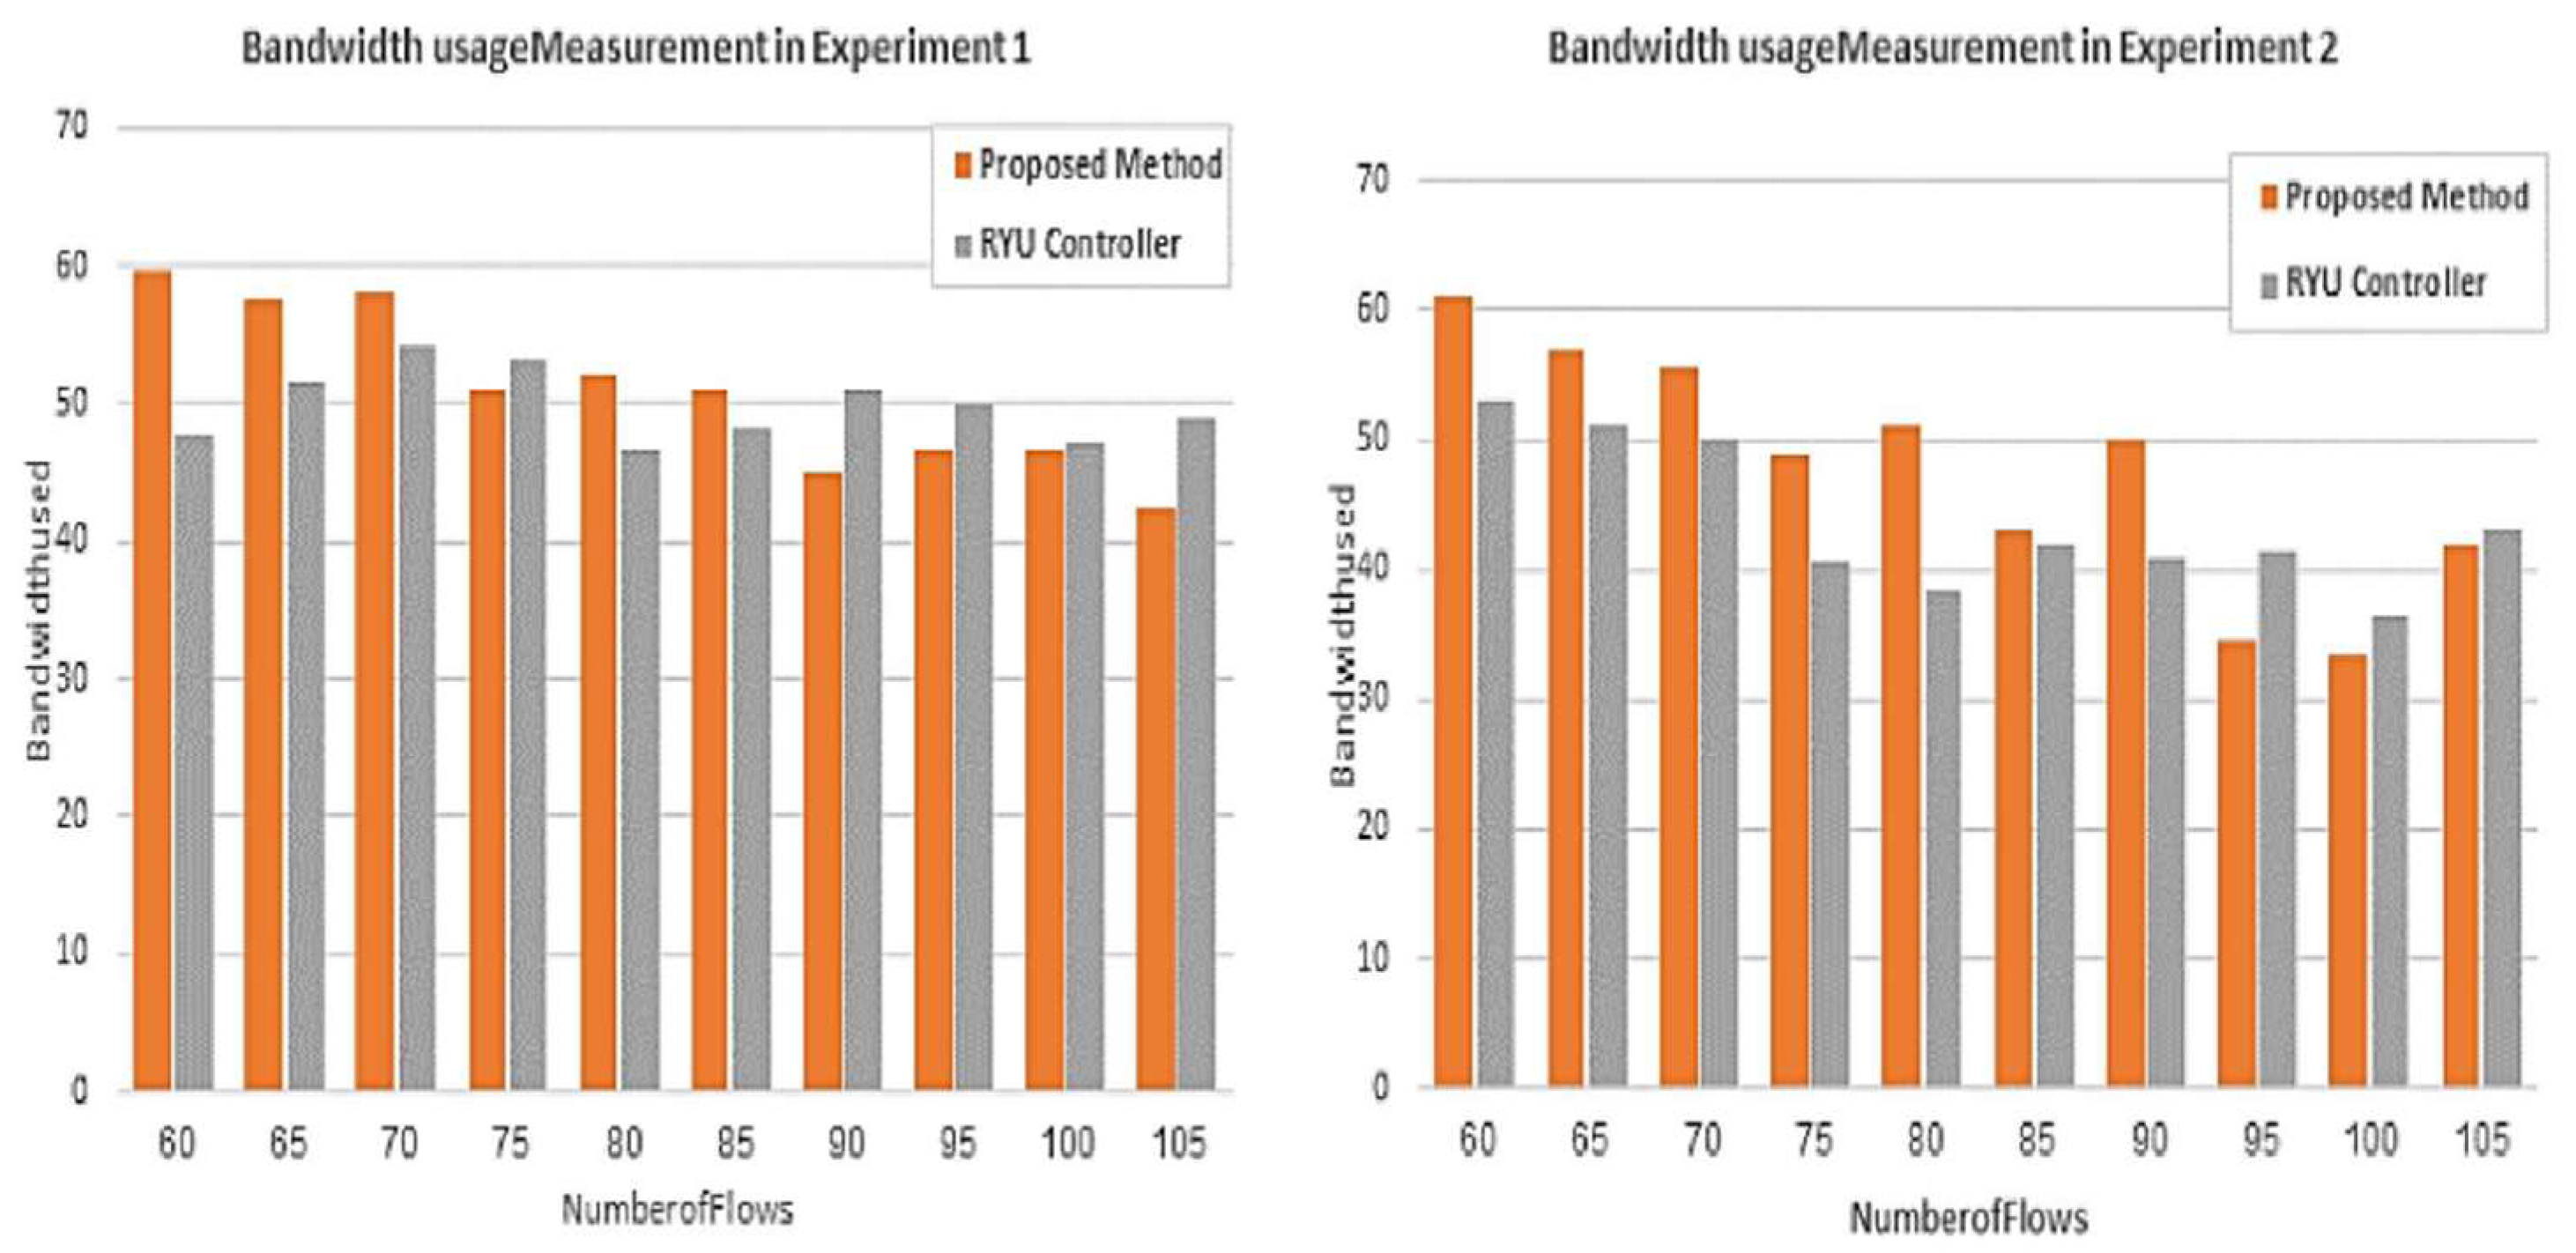
The evaluation of the proposed mechanism for the second topology was accomplished by running two experiments to compare the performance of the Ryu controller and our proposed method. The comparison was based on the same parameters for the first topology. Figure 13 and Figure 14 depict the throughput and bandwidth usage measurement provided by the proposed mechanism and the Ryu controller in the two experiments. It is clear from the charts of experiment 1 that the performance of the proposed method is better than that of the Ryu controller for the majority of flows for both parameters. However, as the number of flows increases, the performance of the proposed method is equal to or slightly less than that of the controller. In experiment 2, as shown in the charts of the aforementioned figures, the throughput and bandwidth provided by the proposed mechanism are improved compared to those by the Ryu controller. Consequently, the performance of the proposed mechanism is enhanced for 70% of the flows. Nevertheless, compared to the performance of the Ryu controller, the performance of the proposed application declines for the remaining 30% of the flows. The reason behind this reduction in performance is the need to serve higher-priority flows.
In general, it is observed that the performance of the two methods improves as the number of flows increases in both experiments.
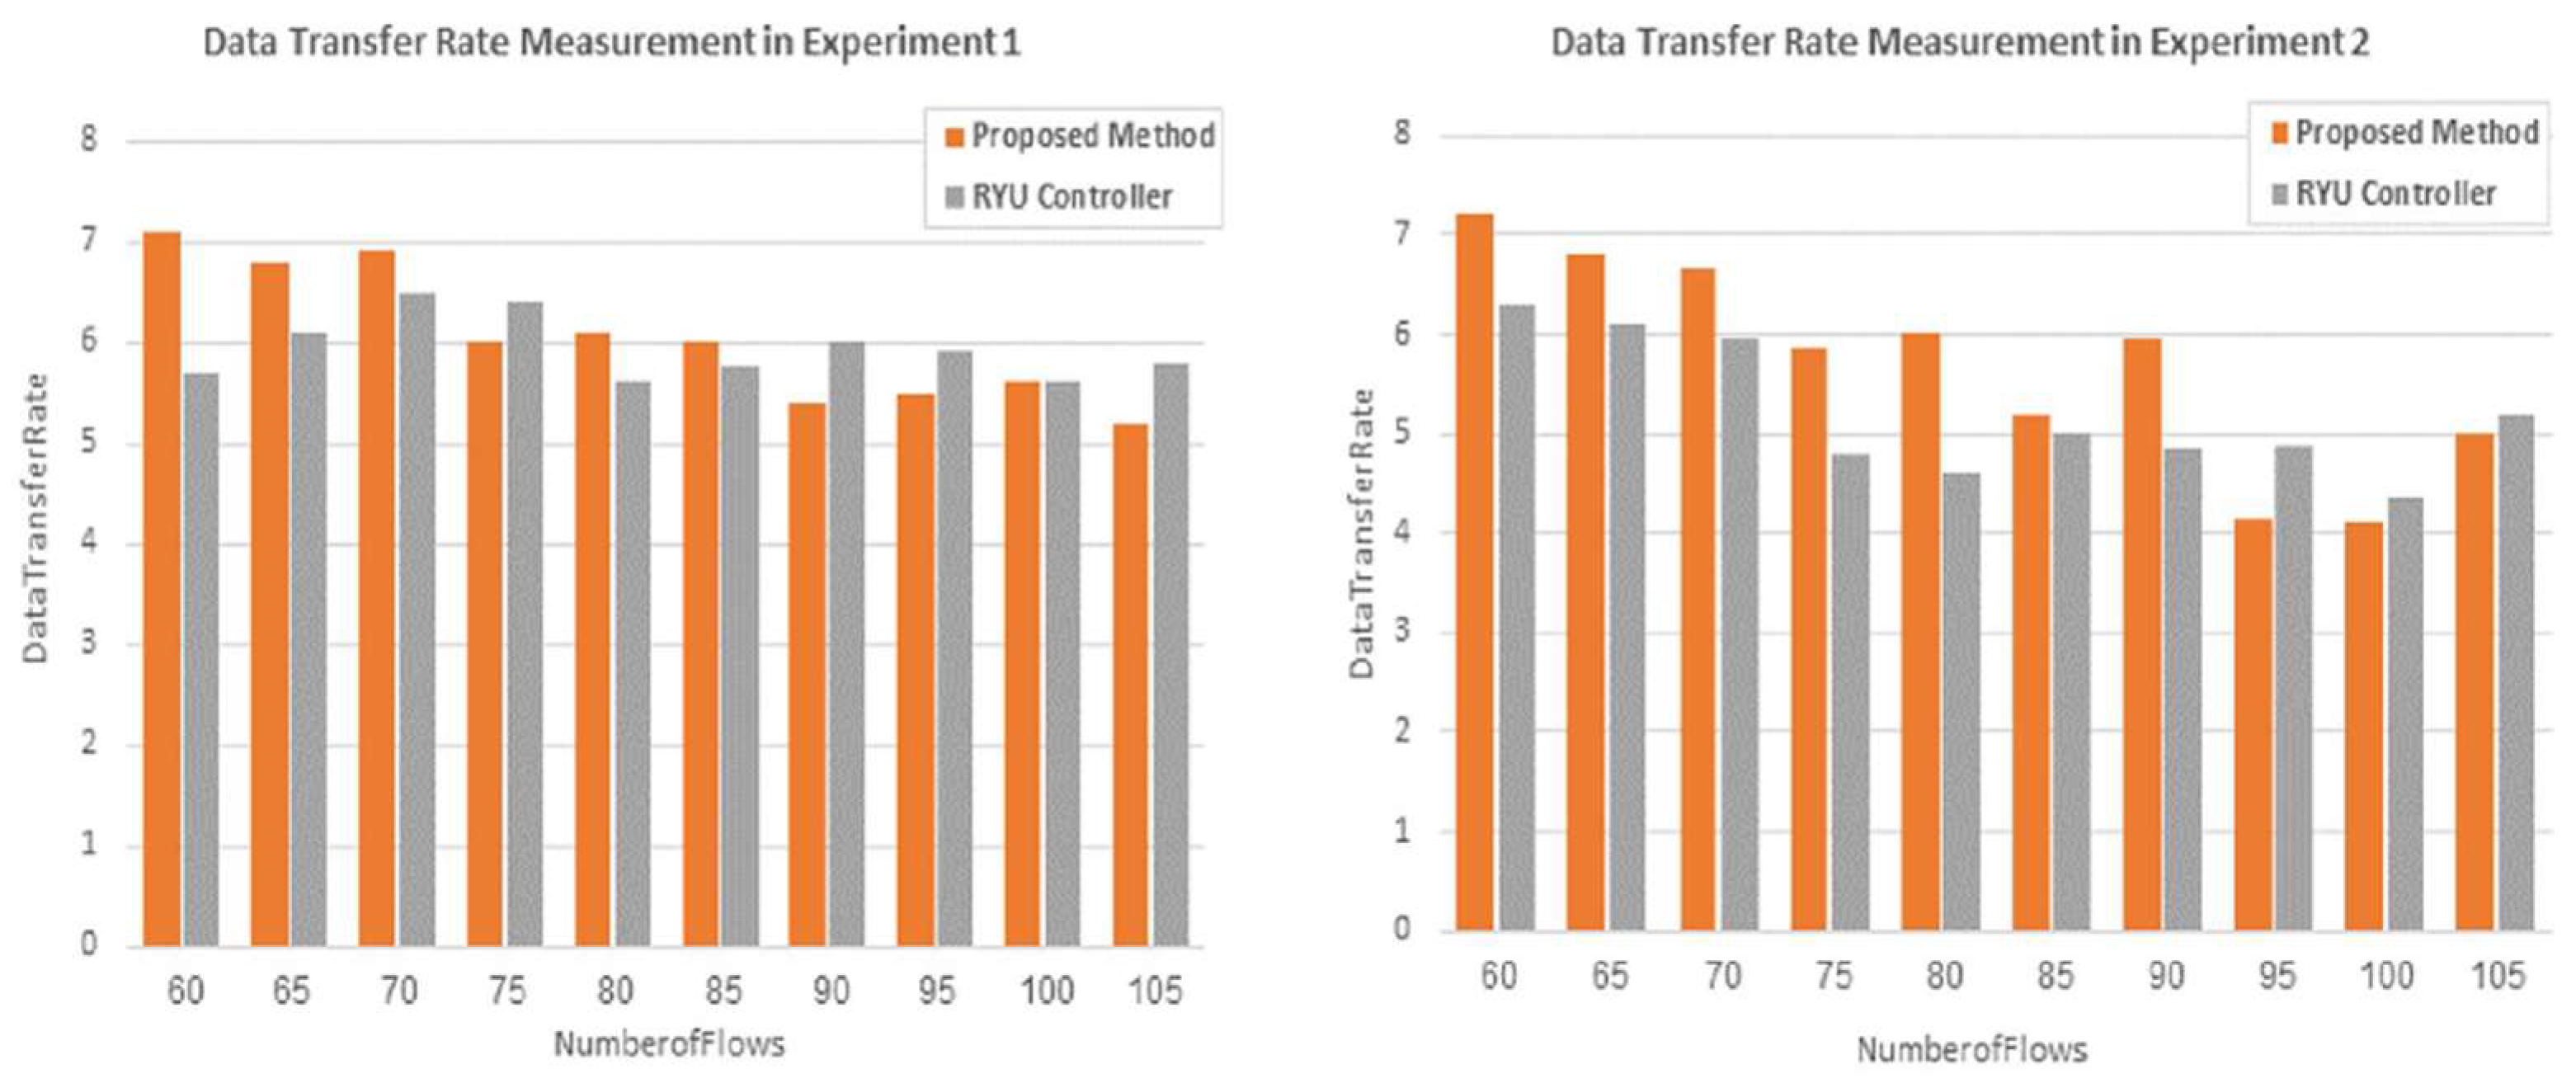
The third parameter that was used to compare the performance of the proposed approach and the RYU controller is the data transfer rate. This parameter was added to support the evaluation of the proposed method. Figure 15 shows that the proposed method is more effective in transferring data than the Ryu controller for most of the flows in both experiments. Based on the measurement of the rate of data transfer, the proposed method in the second experiment has the same behavior as the previous parameters for the majority of flows, where the performance becomes better than it is in the first experiment, although it may be slightly less than the performance of the controller sometimes.
As a result, the proposed approach is more efficient than the Ryu controller and proves its ability to find the best route according to the flow type.
5. Conclusions and Future Works
This article presents an SDN-based routing framework based on the concepts of flow characterization and flow identification. We found that the network traffic, which is described by their performance metrics, can be routed based on their type according to these metrics. As a result, each flow is routed in terms of its type and the ID of its cluster. Therefore, routing a clustered traffic as elephants and mice can help improve the network management system and contribute to solving the problem of unfair use of network resources by particular flows. The unified proposed architectural solution provides an efficient calculation of route cost and consistency with real-time constraints in the SDN environment. The results show that 70% of the flows can be routed precisely. Therefore, the dynamic provisions of network resources among different flow types are achieved. For future works, the proposed application sets the ground for designing an automated SDN application, which can be employed for all kinds of flows and network topologies to improve bandwidth utilization and reduce congestion across networks.
Author Contributions
Conceptualization, M.A.-S.; Methodology, M.A.-S.; Software, M.A.-S. and B.A.-S.; Validation, M.A.-S.; Formal analysis, M.A.-S.; Investigation, M.A.-S.; Writing, M.A.-S.; Reviewing, A.K., V.K., D.J.W. and B.A.-S. All authors have read and agreed to the published version of the manuscript.
Funding
This research received no external funding.
Data Availability Statement
Data sharing not applicable.
Conflicts of Interest
The authors declare no conflict of interest.
Appendix A

Table A1.
Table of Features [42].
Table A1.
Table of Features [42].
|
|
|
|
|
|
|
|
|
|
|
|
|
|
|
|
|
|
|
|
|
|
|
|
|
|
|
|
|
|
|
|
|
|
|
|
|
|
|
|
|
|
|
|
|
|
|
|
|
|
|
|
|
|
|
|
|
|
|
|
|
|
|
|
|
|
|
|
|
|
|
|
|
|
|
|
|
|
|
|
|
|
|
|
|
|
|
|
|
|
|
|
|
|
|
|
|
|
|
|
|
|
|
|
|
|
|
|
|
|
|
|
|
|
|
|
|
|
|
|
|
|
|
|
|
|
|
|
|
References
- Liu, J.; Li, J.; Shou, G.; Hu, Y.; Guo, Z.; Dai, W. SDN based load balancing mechanism for elephant flow in data center networks. In Proceedings of the International Symposium on Wireless Personal Multimedia Communications, WPMC, Sydney, Australia, 7–10 September 2014; Volume 2015, pp. 486–490. [Google Scholar] [CrossRef]
- Kaiwa, T.; Kitsuwan, N. Imbalance state resolving considering flow types. IEICE Commun. Express 2020, 9, 66–71. [Google Scholar] [CrossRef] [Green Version]
- Kumar, S.; Bansal, G.; Shekhawat, V.S. A Machine Learning Approach for Traffic Flow Provisioning in Software Defined Networks. In Proceedings of the International Conference on Information Networking, Barcelona, Spain, 7–10 January 2020; Volume 2020, pp. 602–607. [Google Scholar] [CrossRef]
- Awad, M.K.; Ahmed, M.H.H.; Almutairi, A.F.; Ahmad, I. Machine learning-based multipath routing for software defined networks. J. Netw. Syst. Manag. 2021, 29, 18. [Google Scholar] [CrossRef]
- Zhao, Y.; Li, Y.; Zhang, X.; Geng, G.; Zhang, W.; Sun, Y. A survey of networking applications applying the software defined networking concept based on machine learning. IEEE Access 2019, 7, 95397–95417. [Google Scholar] [CrossRef]
- Keshari, S.K.; Kansal, V.; Kumar, S. A systematic review of quality of services (QoS) in software defined networking (SDN). Wirel. Pers. Commun. 2021, 116, 2593–2614. [Google Scholar] [CrossRef]
- Wang, N.; Ho, K.H.; Pavlou, G.; Howarth, M. An overview of routing optimization for internet traffic engineering. IEEE Commun. Surv. Tutor. 2008, 10, 36–56. [Google Scholar] [CrossRef] [Green Version]
- Mendiola, A.; Astorga, J.; Jacob, E.; Higuero, M. A Survey on the Contributions of Software-Defined Networking to Traffic Engineering. IEEE Commun. Surv. Tutor. 2016, 19, 918–953. [Google Scholar] [CrossRef] [Green Version]
- Kakahama, H.K.; Taha, M. Adaptive Software-defined Network Controller for Multipath Routing based on Reduction of Time. UHD J. Sci. Technol. 2020, 4, 107–116. [Google Scholar] [CrossRef]
- Apostolaki, M.; Vanbever, L.; Ghobadi, M. Fab: Toward flow-aware buffer sharing on programmable switches. In Proceedings of the 2019 Workshop on Buffer Sizing, Palo Alto, CA, USA, 2–3 December 2019; pp. 1–6. [Google Scholar]
- Wang, L.; Wang, X.; Tornatore, M.; Kim, K.J.; Kim, S.M.; Kim, D.-U.; Han, K.-E.; Mukherjee, B. Scheduling with machine-learning-based flow detection for packet-switched optical data center networks. J. Opt. Commun. Netw. 2018, 10, 365–375. [Google Scholar] [CrossRef]
- Alghadhban, A.; Shihada, B. FLight: A fast and lightweight elephant-flow detection mechanism. In Proceedings of the International Conference on Distributed Computing Systems, Vienna, Austria, 2–6 July 2018; Volume 2018, pp. 1537–1538. [Google Scholar] [CrossRef] [Green Version]
- Hong, E.T.B.; Wey, C.Y. An optimized flow management mechanism in OpenFlow network. In Proceedings of the International Conference on Information Networking, Da Nang, Vietnam, 11–13 January 2017; pp. 143–147. [Google Scholar] [CrossRef]
- Wu, X.; Yang, X. DARD: Distributed adaptive routing for datacenter networks. In Proceedings of the International Conference on Distributed Computing Systems, Macau, China, 18–21 June 2012; pp. 32–41. [Google Scholar] [CrossRef]
- Wang, W.; Sun, Y.; Zheng, K.; Kaafar, M.A.; Li, D.; Li, Z. Freeway: Adaptively Isolating the Elephant and Mice Flows on Different Transmission Paths. In Proceedings of the 2014 IEEE 22nd International Conference on Network Protocols, Raleigh, NC, USA, 21–24 October 2014. [Google Scholar] [CrossRef]
- Cui, W.; Yu, Y.; Qian, C. DiFS: Distributed Flow Scheduling for adaptive switching in FatTree data center networks. Comput. Networks 2016, 105, 166–179. [Google Scholar] [CrossRef]
- Liu, W.X. Intelligent Routing based on Deep Reinforcement Learning in Software-Defined Data-Center Networks. In Proceedings of the IEEE Symposium on Computers and Communications, Barcelona, Spain, 29 June–3 July 2019; Volume 2019. [Google Scholar] [CrossRef]
- Yahyaoui, H.; Aidi, S.; Zhani, M.F. On Using Flow Classification to Optimize Traffic Routing in SDN Networks. In Proceedings of the 2020 IEEE 17th Annual Consumer Communications & Networking Conference (CCNC), Las Vegas, NV, USA, 10–13 January 2020. [Google Scholar] [CrossRef]
- Amin, R.; Rojas, E.; Aqdus, A.; Ramzan, S.; Casillas-Perez, D.; Arco, J.M. A survey on machine learning techniques for routing optimization in SDN. IEEE Access 2021, 9, 104582–104611. [Google Scholar] [CrossRef]
- Zaher, S.M.M.; Alawadi, A.H. Sieve: A flow scheduling framework in SDN based data center networks. Comput. Commun. 2021, 171, 99–111. [Google Scholar] [CrossRef]
- Tang, F.; Zhang, H.; Yang, L.T.; Chen, L. Elephant Flow Detection and Load-Balanced Routing with Efficient Sampling and Classification. IEEE Trans. Cloud Comput. 2021, 9, 1022–1036. [Google Scholar] [CrossRef]
- Shi, X.; Li, Y.; Xie, H.; Yang, T.; Zhang, L.; Liu, P.; Zhang, H.; Liang, Z. An OpenFlow-Based Load Balancing Strategy in SDN. Comput. Mater. Contin. 2020, 62, 385–398. [Google Scholar] [CrossRef]
- Isyaku, B.; Mohd Zahid, M.S.; Bte Kamat, M.; Abu Bakar, K.; Ghaleb, F.A. Software Defined Networking Flow Table Management of OpenFlow Switches Performance and Security Challenges: A Survey. Future Internet 2020, 12, 147. [Google Scholar] [CrossRef]
- Xie, J.; Yu, F.R.; Huang, T.; Xie, R.; Liu, J.; Wang, C.; Liu, Y. A survey of machine learning techniques applied to software defined networking (SDN): Research issues and challenges. IEEE Commun. Surv. Tutor. 2018, 21, 393–430. Available online: https://ieeexplore.ieee.org/abstract/document/8444669/ (accessed on 9 June 2022). [CrossRef]
- Glick, M.; Rastegarfar, H. Scheduling and control in hybrid data centers. In Proceedings of the Summer Topicals Meeting Series, SUM 2017, San Juan, PR, USA, 10–12 July 2017; pp. 115–116. [Google Scholar] [CrossRef]
- Xiao, P.; Qu, W.; Qi, H.; Xu, Y.; Li, Z. An efficient elephant flow detection with cost-sensitive in SDN. In Proceedings of the 2015 1st International Conference on Industrial Networks and Intelligent Systems, INISCom 2015, Tokyo, Japan, 2–4 March 2015; pp. 24–28. [Google Scholar] [CrossRef] [Green Version]
- Hamdan, M.; Khan, S.; Abdelaziz, A.; Sadiah, S.; Shaikh-Husin, N.; Al Otaibi, S.; Maple, C.; Marsono, M. DPLBAnt: Improved load balancing technique based on detection and rerouting of elephant flows in software-defined networks. Comput. Commun. 2021, 180, 315–327. [Google Scholar] [CrossRef]
- Fu, Q.; Sun, E.; Sun, E.; Meng, K.; Li, M.; Zhang, Y. Deep Q-Learning for Routing Schemes in SDN-Based Data Center Networks. IEEE Access 2020, 8, 103491–103499. [Google Scholar] [CrossRef]
- Kiran, M.; Mohammed, B.; Krishnaswamy, N. DeepRoute: Herding Elephant and Mice Flows with Reinforcement Learning. In Lecture Notes in Computer Science (Including Subseries Lecture Notes in Artificial Intelligence and Lecture Notes in Bioinformatics); LNCS; Springer: Cham, Switzerland, 2020; Volume 12081, pp. 296–314. [Google Scholar] [CrossRef]
- Zhang, C.; Wang, X.; Li, F.; Huang, M. NNIRSS: Neural network-based intelligent routing scheme for SDN. Neural Comput. Appl. 2018, 31, 6189–6205. [Google Scholar] [CrossRef]
- Wu, X.; Kumar, V.; Quinlan, J.R.; Ghosh, J.; Yang, Q.; Motoda, H.; McLachlan, G.J.; Ng, A.; Liu, B.; Yu, P.S.; et al. Top 10 algorithms in data mining. Knowl. Inf. Syst. 2008, 14, 1–37. [Google Scholar] [CrossRef] [Green Version]
- Slattery, T. A Story of Mice and Elephants: Dynamic Packet Prioritization|No Jitter. 2017. Available online: https://www.nojitter.com/story-mice-and-elephants-dynamic-packet-prioritization (accessed on 27 August 2020).
- Mininet. Available online: http://mininet.org/ (accessed on 25 June 2022).
- De Oliveira, R.L.S.; Schweitzer, C.M.; Shinoda, A.A.; Prete, L.R. Using mininet for emulation and prototyping software-defined networks. In Proceedings of the 2014 IEEE Colombian Conference on Communications and Computing (COLCOM), Bogota, Colombia, 4–6 June 2014. [Google Scholar] [CrossRef]
- Bavier, A.; Feamster, N.; Huang, M.; Peterson, L.; Rexford, J. In VINI veritas: Realistic and controlled network experimentation. Comput. Commun. Rev. 2006, 36, 3–14. [Google Scholar] [CrossRef]
- Iqbal, M.; Zhang, K.; Iqbal, S.; Tariq, I. A fast and reliable Dijkstra algorithm for online shortest path. Int. J. Comput. Sci. Eng. 2018, 5, 24–27. Available online: https://pdfs.semanticscholar.org/b745/15006908078bc2efc27844f85a351740b148.pdf (accessed on 25 June 2022). [CrossRef]
- Yi, J.; Parrein, B. Multipath Extension for the Optimized Link State Routing Protocol Version 2 (OLSRv2). Available online: http://www.rfc-editor.org/info/rfc8218 (accessed on 19 June 2022).
- Al-Saadi, M.; Khan, A.; Kelefouras, V.; Walker, D.J.; Al-Saadi, B. Unsupervised Machine Learning-Based Elephant and Mice Flow Identification. Lect. Notes Netw. Syst. 2021, 284, 357–370. [Google Scholar] [CrossRef]
- Chiesa, M.; Kindler, G.; Schapira, M. Traffic engineering with equal-cost-multipath: An algorithmic perspective. IEEE/ACM Trans. Netw. 2016, 25, 779–792. Available online: https://ieeexplore.ieee.org/abstract/document/7588075/ (accessed on 25 June 2022). [CrossRef]
- Thamilselvan, R.; Selvi, K.T.; Rajalaxmi, R.R.; Gothai, E. Multipath Routing of Elephant Flows in Data Centers Based on Software Defined Networking. Int. J. Eng. Adv. Technol. 2019, 9, 2714–2717. [Google Scholar] [CrossRef]
- Akin, E.; Korkmaz, T. Comparison of Routing Algorithms with Static and Dynamic Link Cost in Software Defined Networking (SDN). IEEE Access 2019, 7, 148629–148644. [Google Scholar] [CrossRef]
- Al-Saadi, M.; Ghita, B.V.; Shiaeles, S.; Sarigiannidis, P. A novel approach for performance-based clustering and anagement of network traffic flows. In Proceedings of the 2019 15th International Wireless Communications & Mobile Computing Conference (IWCMC), Tangier, Morocco, 24–28 June 2019. [Google Scholar] [CrossRef]
Figure 1.
Proposed Methodology.

Figure 2.
SDN-Based Application Framework.

Figure 3.
Topology No. 1 of Network.

Figure 4.
Topology No. 2 of Network.

Figure 5.
Throughput of the Network During 300 s of Simulation.

Figure 6.
Steps of Preprocessing.

Figure 7.
Updating Link Cost.

Figure 8.
Flow Paths in the Network Using the Proposed Method.

Figure 9.
Comparison Between the Proposed Method and the Ryu Controller With Respect to Throughput for the Two Types of Flows.
Figure 9.
Comparison Between the Proposed Method and the Ryu Controller With Respect to Throughput for the Two Types of Flows.

Figure 10.
Comparison Between the Proposed Method and the Ryu Controller With Respect to Throughput for Elephant Flows.
Figure 10.
Comparison Between the Proposed Method and the Ryu Controller With Respect to Throughput for Elephant Flows.

Figure 11.
Comparison Between the Proposed Method and the Ryu Controller With Respect to Throughput for Mice Flows.
Figure 11.
Comparison Between the Proposed Method and the Ryu Controller With Respect to Throughput for Mice Flows.

Figure 12.
Comparison Between the Bandwidth Used in the Proposed Method and the Ryu Controller for the Two Types of Flows.
Figure 12.
Comparison Between the Bandwidth Used in the Proposed Method and the Ryu Controller for the Two Types of Flows.

Figure 13.
Comparison of Throughput Between the Proposed Method and the Ryu Controller for the Two Types of Flows in Two Experiments.
Figure 13.
Comparison of Throughput Between the Proposed Method and the Ryu Controller for the Two Types of Flows in Two Experiments.

Figure 14.
Comparison of Bandwidth Usage Between the Proposed Method and the Ryu Controller for the Two Types of Flows in Two Experiments.
Figure 14.
Comparison of Bandwidth Usage Between the Proposed Method and the Ryu Controller for the Two Types of Flows in Two Experiments.

Figure 15.
Comparison of Data Transfer Rate Between the Proposed Method and the Ryu Controller for the Two Types of Flows in Two Experiments.
Figure 15.
Comparison of Data Transfer Rate Between the Proposed Method and the Ryu Controller for the Two Types of Flows in Two Experiments.

Table 1.
UDP Packets Generated During 300 s of Simulation.
| Duration | Packet Rate | Byte Rate |
|---|---|---|
| 0–30 s | 250 p | 1024B |
| 30–60 s | 500 p | 2097152B |
| 60–120 s | 1000 p | 12582912 |
| 120–200 s | 1000 p | 14582912 |
| 200–260 s | 1000 p | 20971520 |
| 260–300 s | 1500 p | 20971520 |
Table 2.
Routing Traffic Based on Flow Types.
| Flow Type | Port Number | Protocol Service | Packet Rate | Method to Apply |
|---|---|---|---|---|
| Elephant | 88 | HTTP | 1 M | Multipath |
| Elephant | 443 | HTTPS | 300 K | Multipath |
| Elephant | 20 | FTP | 22 K | Multipath |
| Elephant | 25 | SMTP | 12 K | Multipath |
| Mice | 514 | Syslog | 632 K | Singlepath |
| Mice | 88 | Kerberos | 220 K | Singlepath |
| Mice | 119 | NNTP | 125 K | Singlepath |
Disclaimer/Publisher’s Note: The statements, opinions and data contained in all publications are solely those of the individual author(s) and contributor(s) and not of MDPI and/or the editor(s). MDPI and/or the editor(s) disclaim responsibility for any injury to people or property resulting from any ideas, methods, instructions or products referred to in the content. |
© 2023 by the authors. Licensee MDPI, Basel, Switzerland. This article is an open access article distributed under the terms and conditions of the Creative Commons Attribution (CC BY) license (https://creativecommons.org/licenses/by/4.0/).
Share and Cite
MDPI and ACS Style
Al-Saadi, M.; Khan, A.; Kelefouras, V.; Walker, D.J.; Al-Saadi, B. SDN-Based Routing Framework for Elephant and Mice Flows Using Unsupervised Machine Learning. Network 2023, 3, 218-238. https://doi.org/10.3390/network3010011
AMA Style
Al-Saadi M, Khan A, Kelefouras V, Walker DJ, Al-Saadi B. SDN-Based Routing Framework for Elephant and Mice Flows Using Unsupervised Machine Learning. Network. 2023; 3(1):218-238. https://doi.org/10.3390/network3010011
Chicago/Turabian StyleAl-Saadi, Muna, Asiya Khan, Vasilios Kelefouras, David J. Walker, and Bushra Al-Saadi. 2023. "SDN-Based Routing Framework for Elephant and Mice Flows Using Unsupervised Machine Learning" Network 3, no. 1: 218-238. https://doi.org/10.3390/network3010011