

Coexistence of Railway and Road Services by Sharing Telecommunication Infrastructure Using SDN-Based Slicing: A Tutorial

Abstract
:1. Introduction
- Emulation: How can emulation of trains and cars (mobility and handover scenarios) be performed in telecommunication infrastructure with the selected SDN-based tools for railway and road coexistence scenarios?
- Differentiation of Data Traffic: How are the data traffic from railways and roads differentiated, or how is the SDN application designed and developed to perform SDN-based slicing to differentiate between data packets from railways and roads?
- Traffic Generation Tools: Which tools are selected to generate different data traffic that can mimic the real-life data transmission scenario, and how can these tools be used to generate the intended data traffic?
- Assessment of Developed SDN Application and Tools: Will the considered tools and technology have the potential to emulate the coexistence scenario of railways and roads?
2. Related Work
3. Selecting and Defining the Scenarios
3.1. Essential Parameters to Define the Scenario
- (A)
- Telecommunication Network Elements: To define the railway and road coexistence scenario, telecommunication network parameters such as radio access network (RAN), backhaul, and core are considered as one vital parameter. Railway and road access networks can be shared or dedicated for both domains. Similarly, backhaul and core can be dedicated or shared [7].Nomenclature used to represent the telecommunication infrastructure is given below:
- T1 R1C1: single-serving technology is used in the access network and each domain has its own dedicated RAN and its own dedicated core network.
- T2 R1C2: single-serving technology is used in the access network, each domain has its own dedicated RAN, and the core network is shared by both domains.
- T3 R2C1: single-serving technology is used in the access network and the RAN is shared by both domains, but both domains have their own dedicated core network.
- T4 R2C2: single-serving technology is used in the access network and each domain shares the access network and the core network.
- T5 R3C1: different-serving technology is used in the access network and each domain has its own dedicated RAN and its own dedicated core network.
- T6 R3C2: different-serving technology is used in the access network, each domain has its own dedicated RAN, and the core network is shared by both domains.
- T7 R4C1: different-serving technology is used in the access network and the RAN is shared by both domains, but both domains have their own dedicated core network.
- T8 R4C2: different-serving technology is used in the access network and each domain shares the access network and the core network.
- (B)
- Mobility Parameters: The speed of the vehicles and the operating region of vehicles are also considered as shaping parameters to define the scenarios, e.g., train versus high-speed train versus urban train versus regional train versus highway versus road [7].Nomenclature used to represent the telecommunication infrastructure is given below:
- M1: mobility of highway and tram;
- M2: mobility of highway and urban train;
- M3: mobility of highway and regional train;
- M4: mobility of highway and high-speed train;
- M5: mobility of road and tram;
- M6: mobility of road and urban train;
- M7: mobility of road and regional train;
- M8: mobility of road and high-speed train.
- (C)
- Topological Elements in Civil Engineering Infrastructure: That deployed railway track components are parallel or perpendicular to roads is also an essential factor to define railway and road coexistence scenarios. This also includes transport infrastructure such as open places versus tunnels versus bridges [7].Nomenclature used to represent the telecommunication infrastructure is given below:
- P1: railway tracks parallel to the road, open-air/bridge, the same plane;
- P2: railway tracks parallel to the road, open-air/bridge, different planes;
- P3: railway tracks parallel to the road, tunnel, same plane;
- P4: railway tracks perpendicular to the road, open-air/bridge, same plane (level crossing);
- P5: railway tracks perpendicular to the road, open-air/bridge, different planes;
- P6: railway tracks perpendicular to the road, tunnel, different planes.
- (D)
- Services: Services and applications defined for railways and roads play an important role in defining the scenario. For instance, speed-limit-monitoring applications, traffic rule violation monitoring applications for vehicles, applications to monitor the railway tracks to locate cracks, etc.

| Dedicated RAN | Shared RAN | ||
|---|---|---|---|
| Radio Access Network | Single Technology | R1 | R2 |
| Multiple Technology | R3 | R4 | |
| Core Network | C1 | C2 | |
3.2. Selected Scenario
- S1(5/6)1: Different Access Network and Different Core, Single Serving Technology, Track Parallel to Road: This scenario is considered the baseline scenario to investigate the coexistence of railway and road scenario telecommunication services infrastructure. In this scenario, both domains, i.e., railways and roads, have their own dedicated radio access network (RAN) and dedicated core. Considered access points and cores work on a single technology/radio frequency. Along with this, railway tracks are kept parallel to roads [7].
- S1(5/6)4: Different Access Network and Different Core, Single Serving Technology, Track Perpendicular to Road: In this considered scenario, the network parameters are similar to scenario S1(5/6)1, i.e., railways and roads have dedicated radio access networks with dedicated cores, but in this scenario, railway tracks are perpendicular to roads [7].
- S2(5/6)1: Different Access Network and Shared Core, Single Serving Technology, Track Parallel to Road: In this scenario, railway and road domains have different radio access networks, and both domains share backhaul and core network infrastructure. In this considered scenario, railway tracks are perpendicular to roads [7].
- S4(5/6)1: Shared Access Network and Shared Core, Single Serving Technology, Track Parallel to Road: In this scenario, railway and road domains share the radio access network along with backhaul and core network infrastructure. Railway tracks are parallel to roads [7].
- S4(5/6)4: Shared Access Network and Shared Core, Single Serving Technology, Track Perpendicular to Road: In this considered scenario, the network deployment infrastructures are similar to those of scenario S4(5/6)1, but in this case, railway tracks are kept perpendicular to roads [7].
4. Selected Tools
- The selected tools should have the capability to define the end nodes in such a way that the user can configure the mobility of the host in a selected direction with an assigned moving speed. The selected tool should also be able to define the quantity and frequency of the end points.
- Using the selected tools, users should have the possibility to define multiple wireless network interfaces for end nodes.
- Using the selected tools, there should be the possibility to generate different kinds of data traffic from the end nodes, compliant with different types of services: for example, messaging, critical data communication using messaging services or video streaming, and voice communication for operational purposes.
- Radio channel characteristics can be defined to mimic real characteristics of radio links such as packet loss, network jitter, and delays.
- The defined end nodes should have the capability to connect to an available WiFi-based network.
- The selected tools should have the ability to define different network topologies for wireless access points as well as for fixed network entities and provide SDN-based OpenFlow interfaces. In addition, from a software-defined network perspective, a defined network component’s behavior can be controlled and managed by a network controller.
- To differentiate the data traffic from different network end nodes, selected tools should have the ability to support virtual local area network (VLAN)-based tagging/un-tagging, and they should support tag-based forwarding.
- The selected tools have the ability to emulate cellular-based network connectivity, principally 5G.
- It would be nice to have a tool that can graphically represent the network emulation for the different selected scenarios.
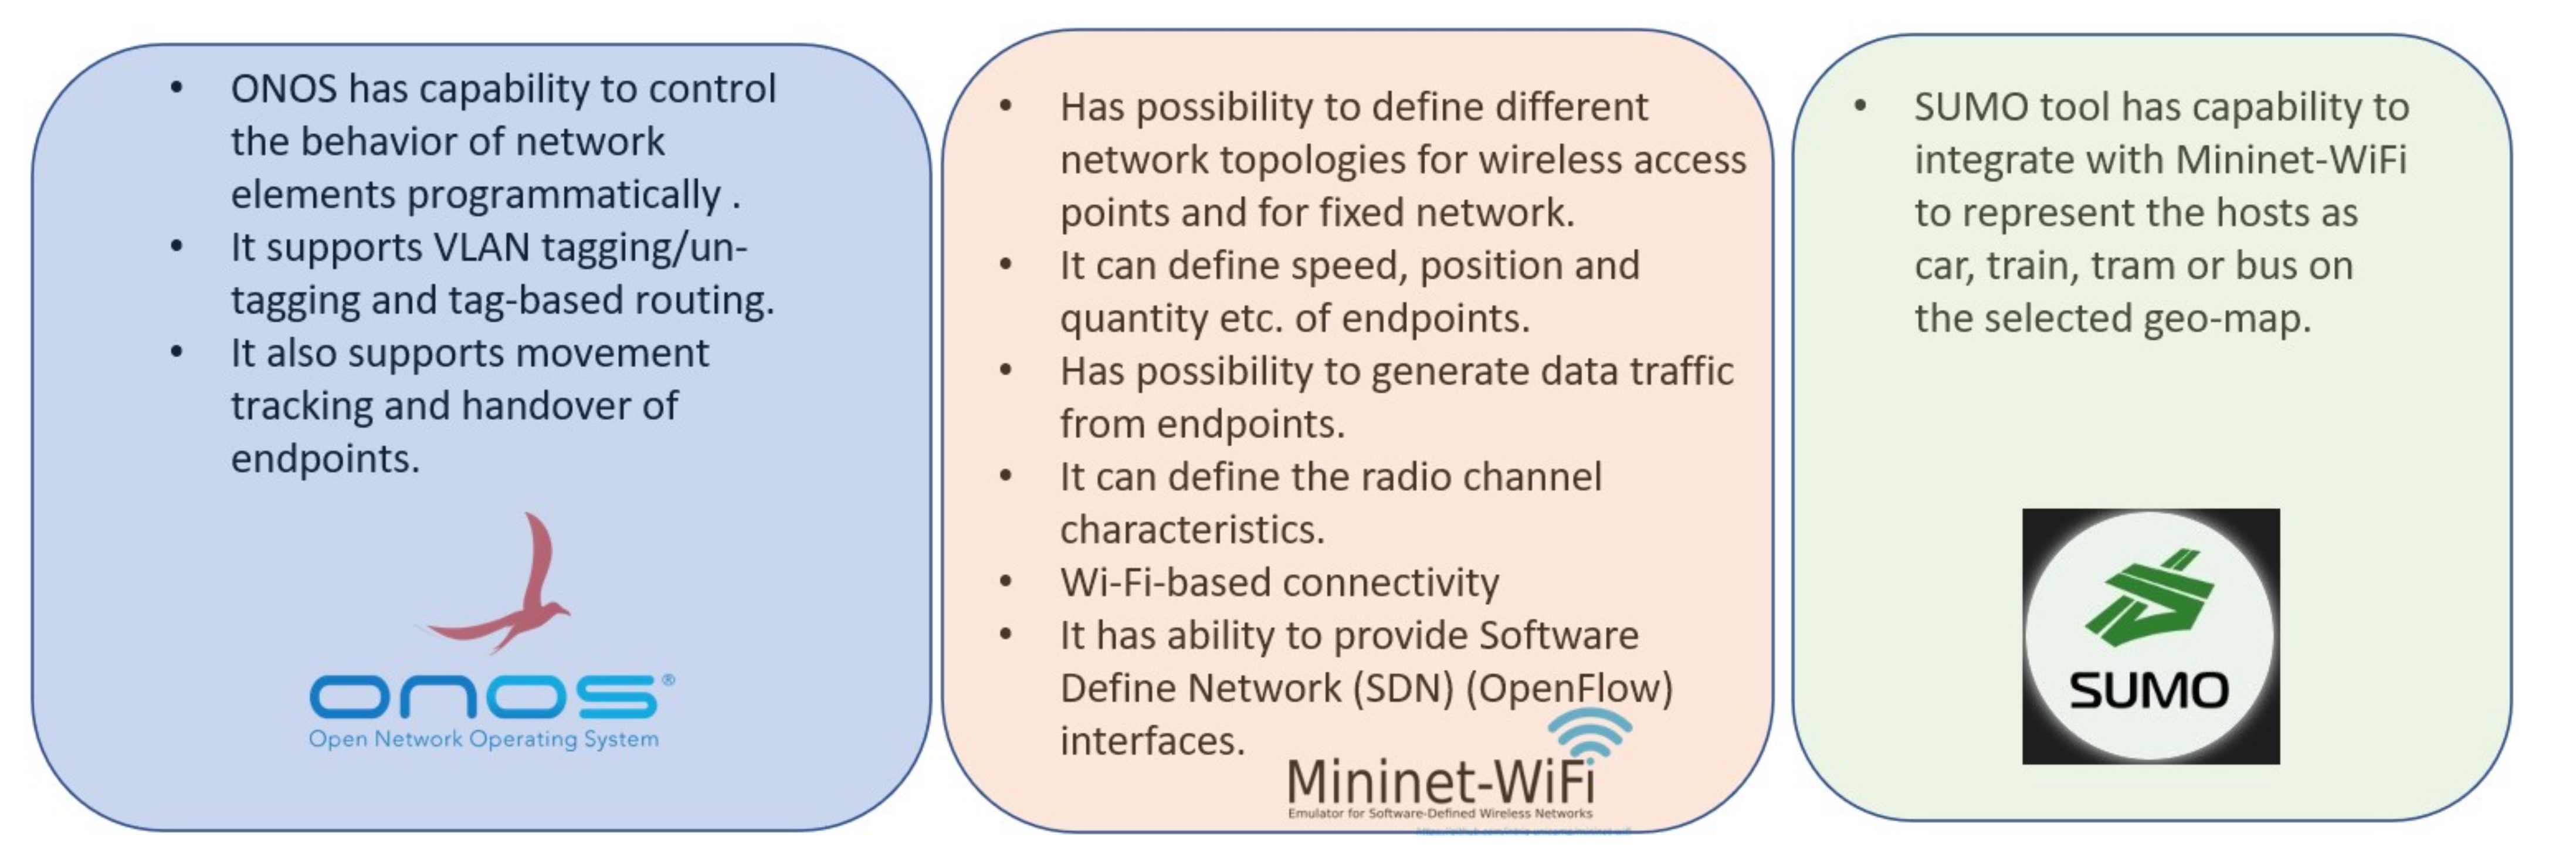
4.1. ONOS SDN Controller
4.2. Mininet–WiFi
4.3. SUMO
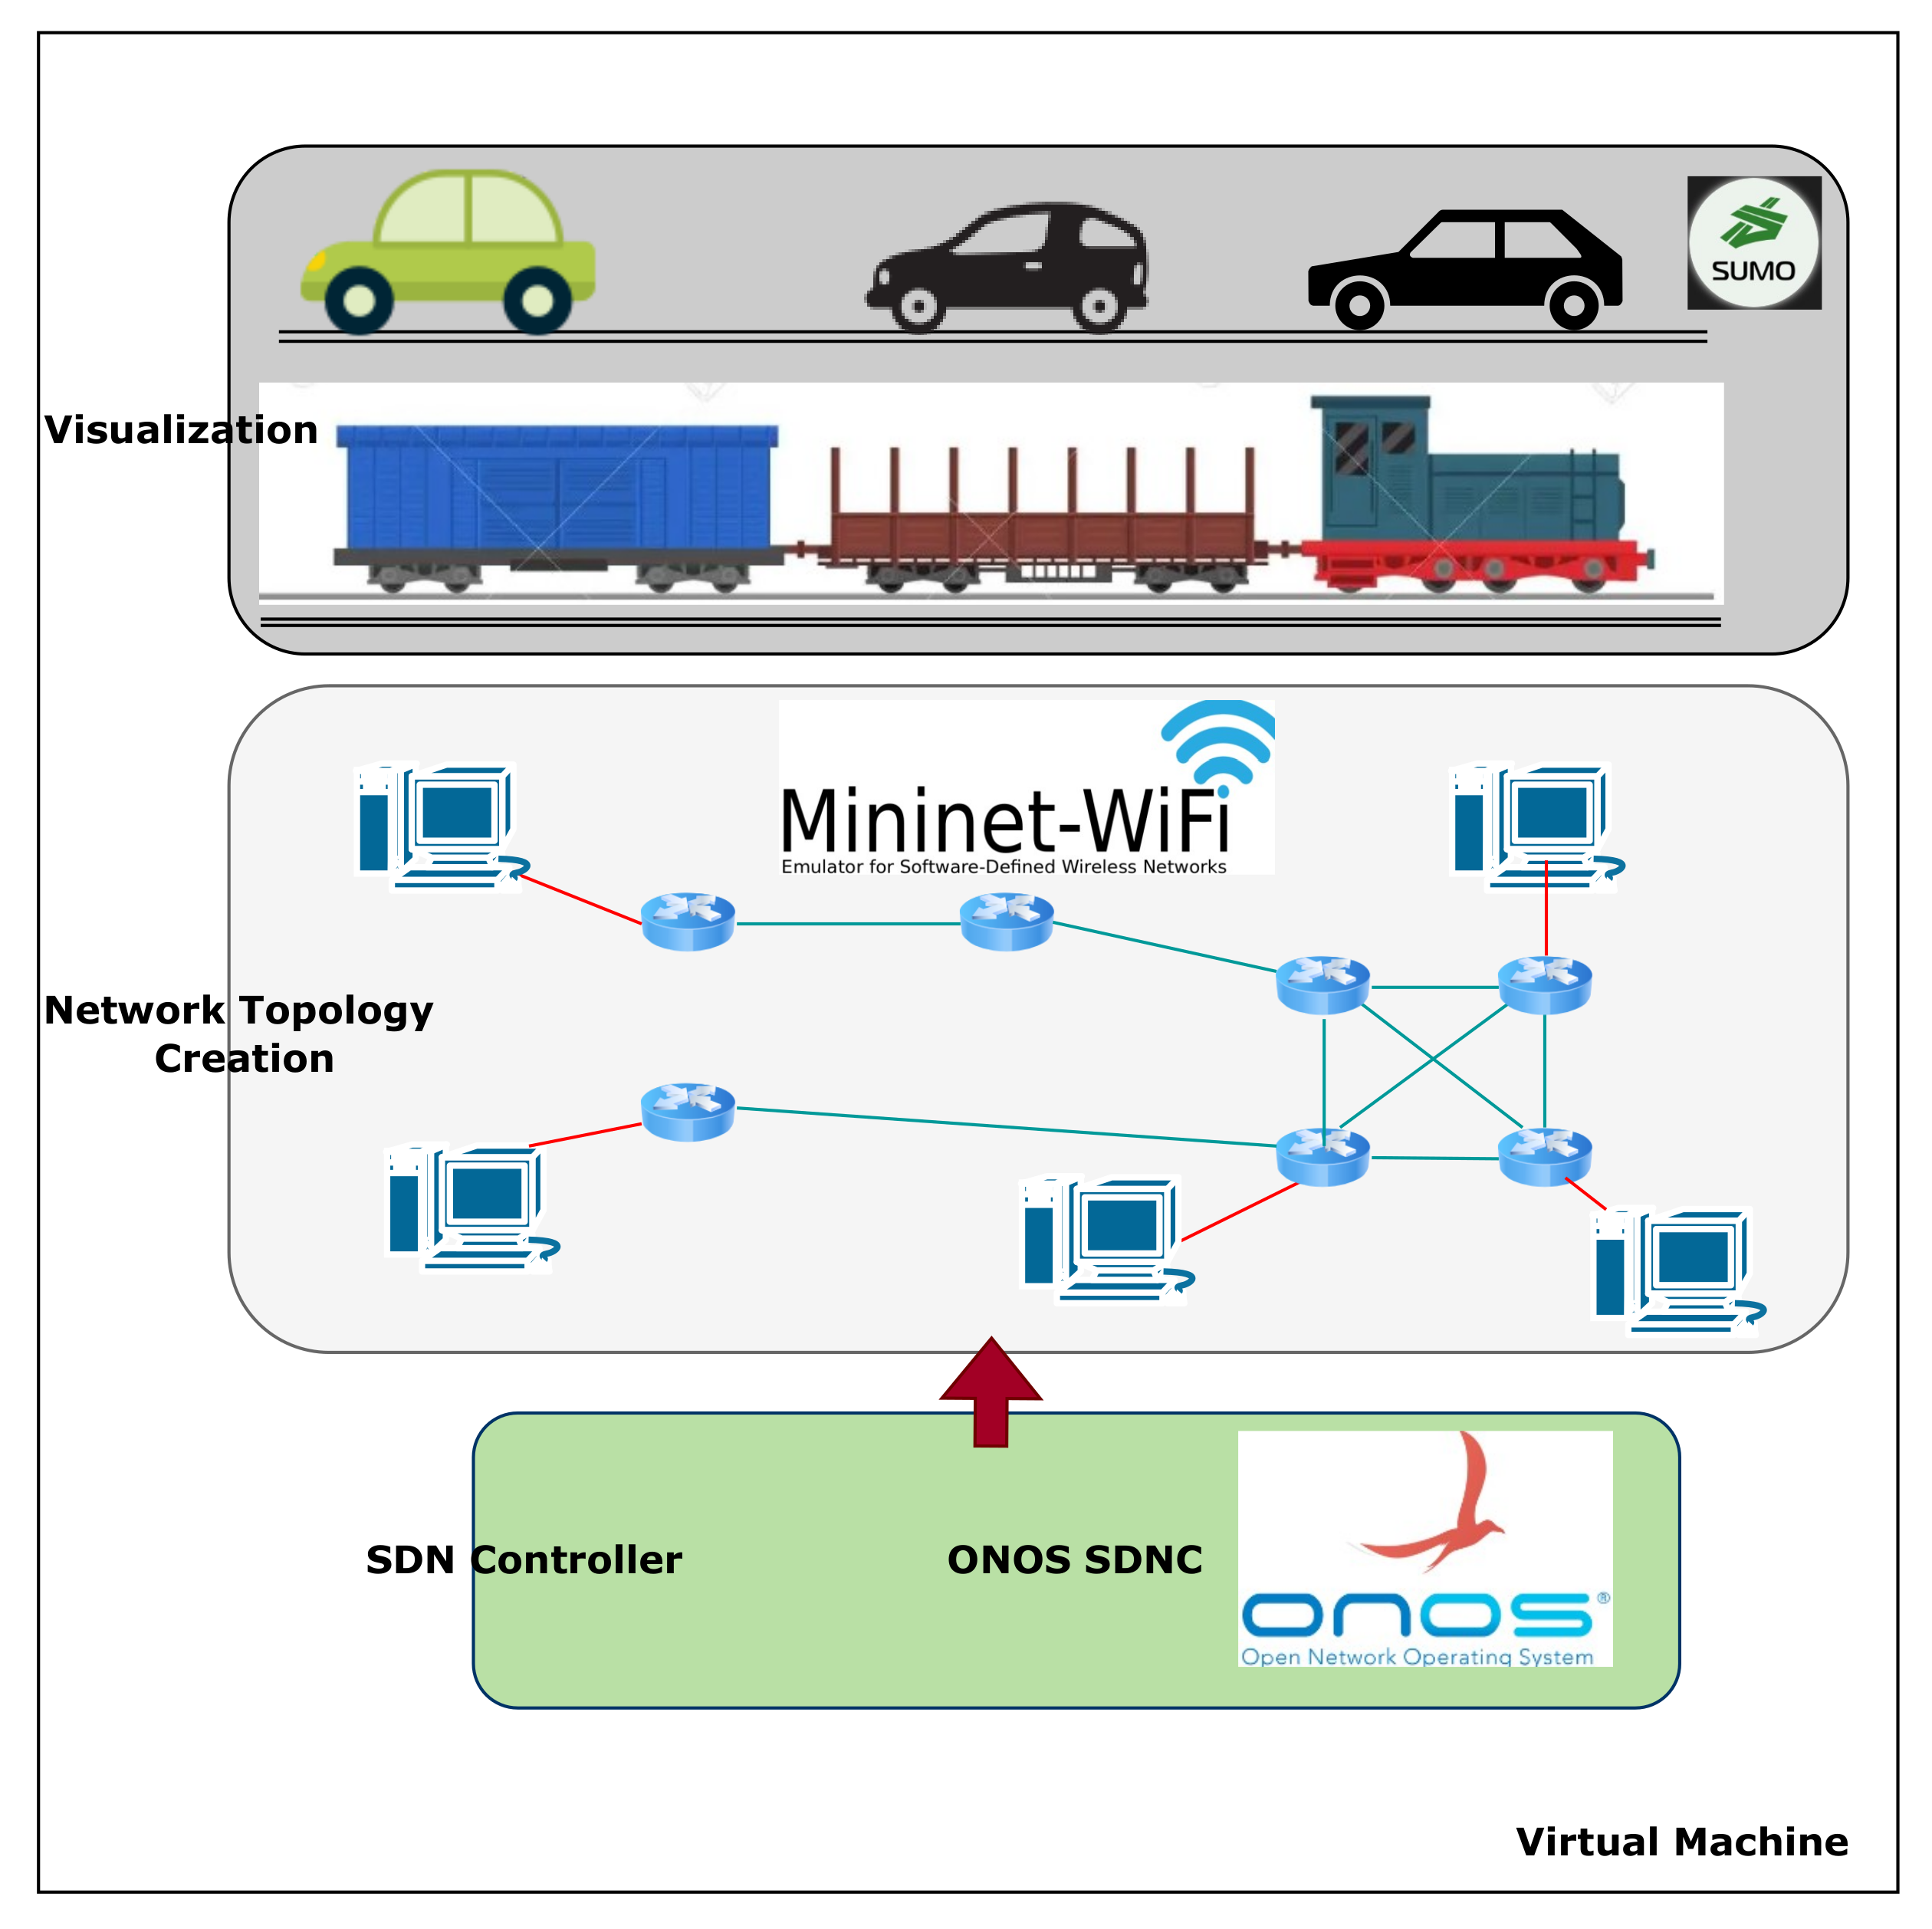
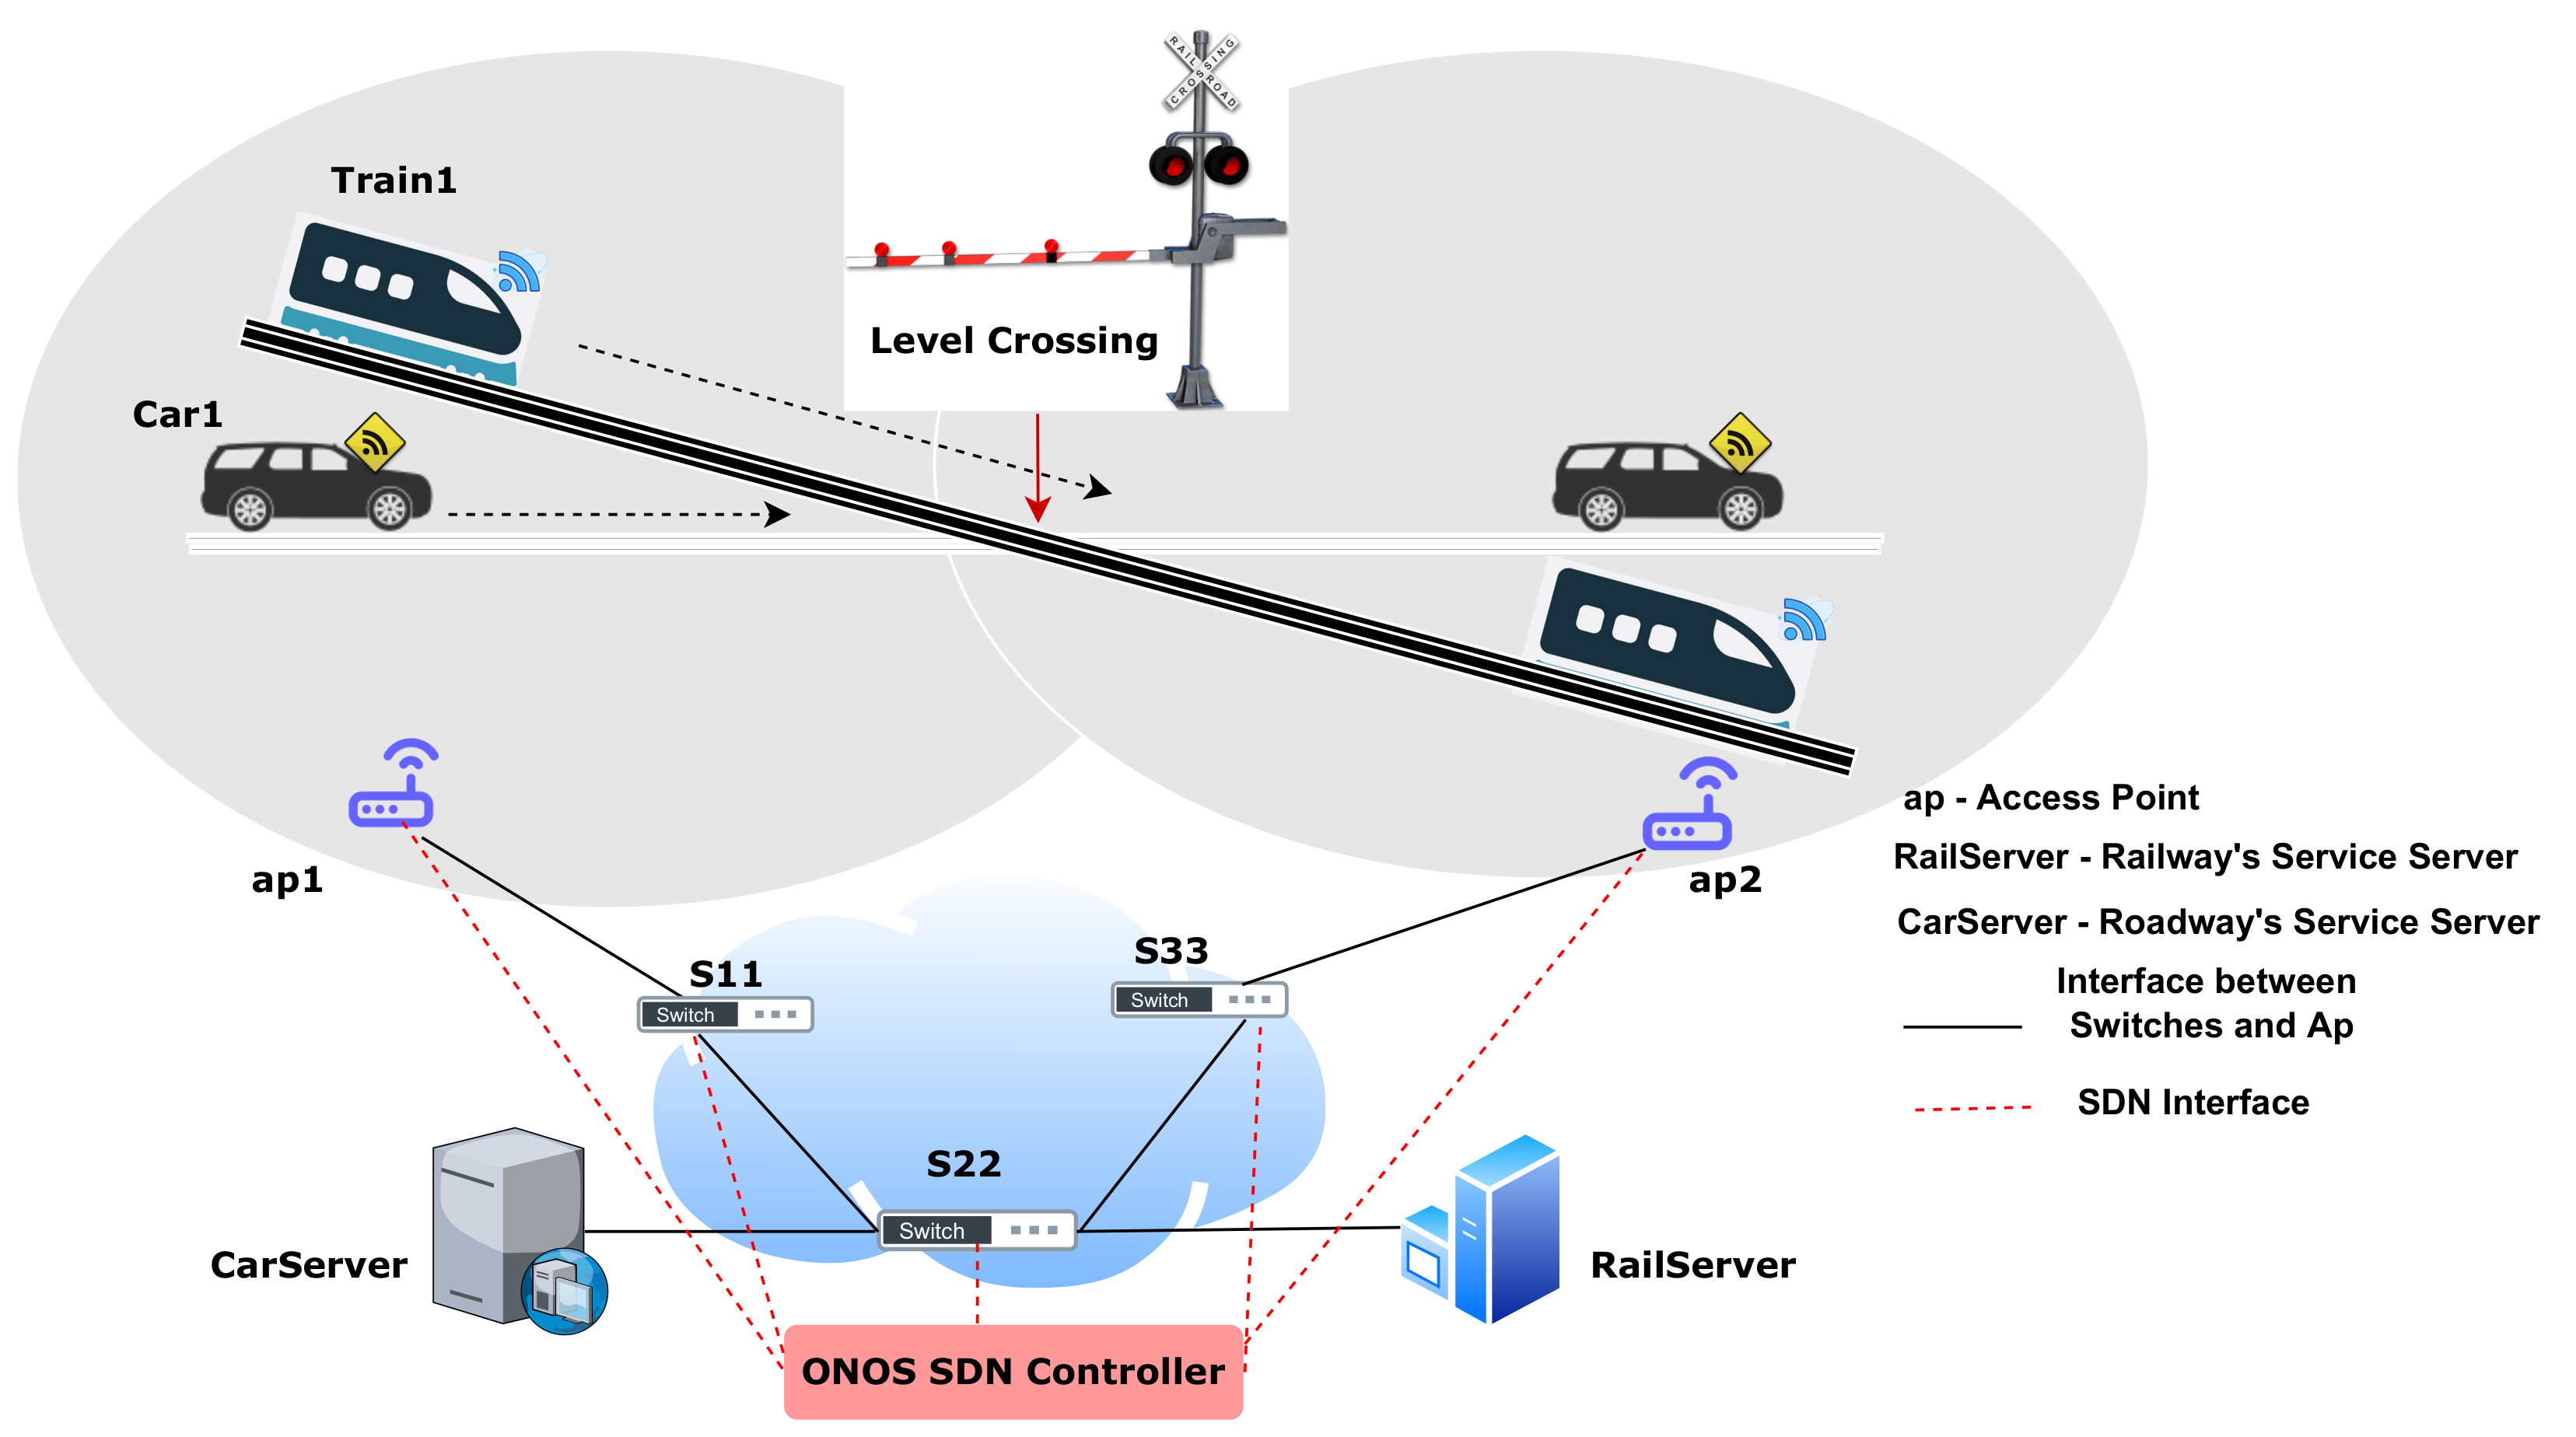
5. Setup Description
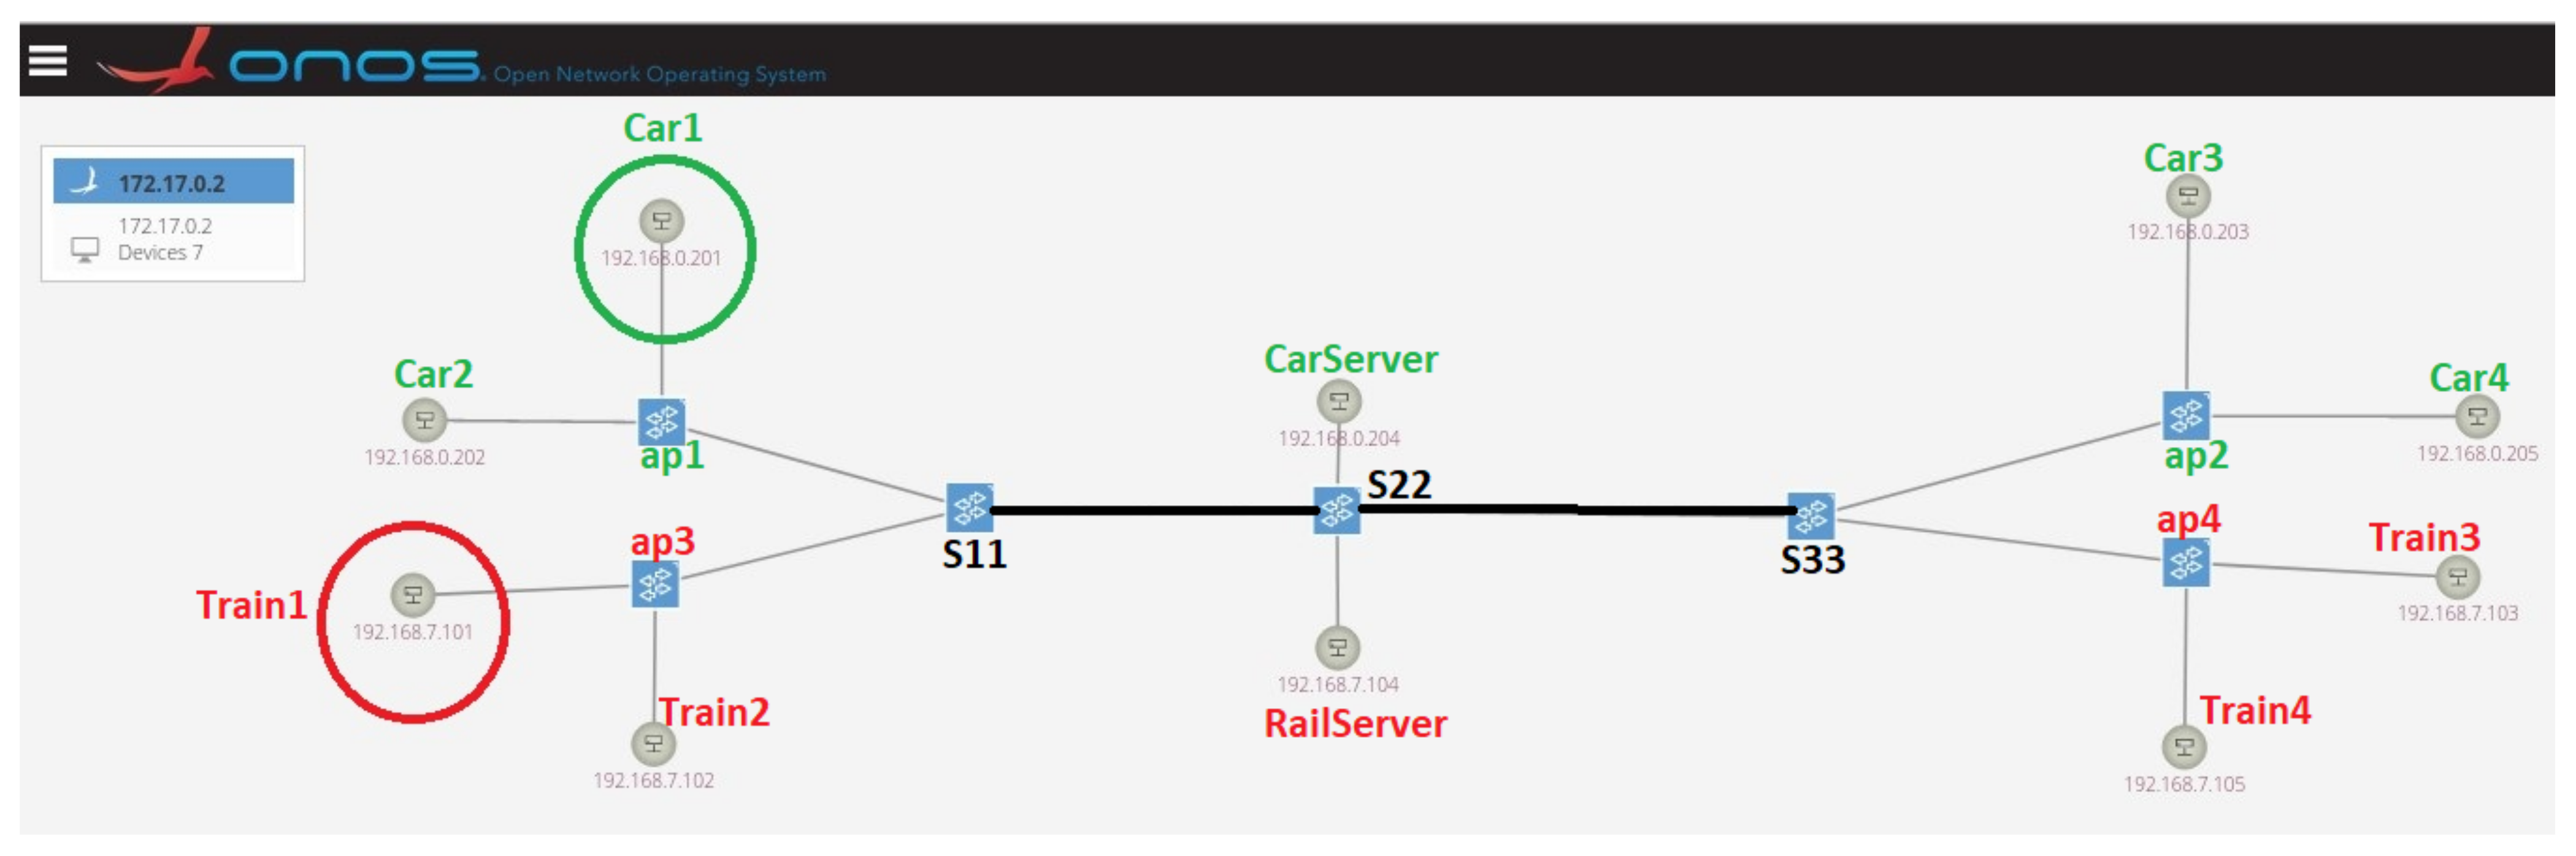
6. Network Topology Creation Using Mininet–WiFi
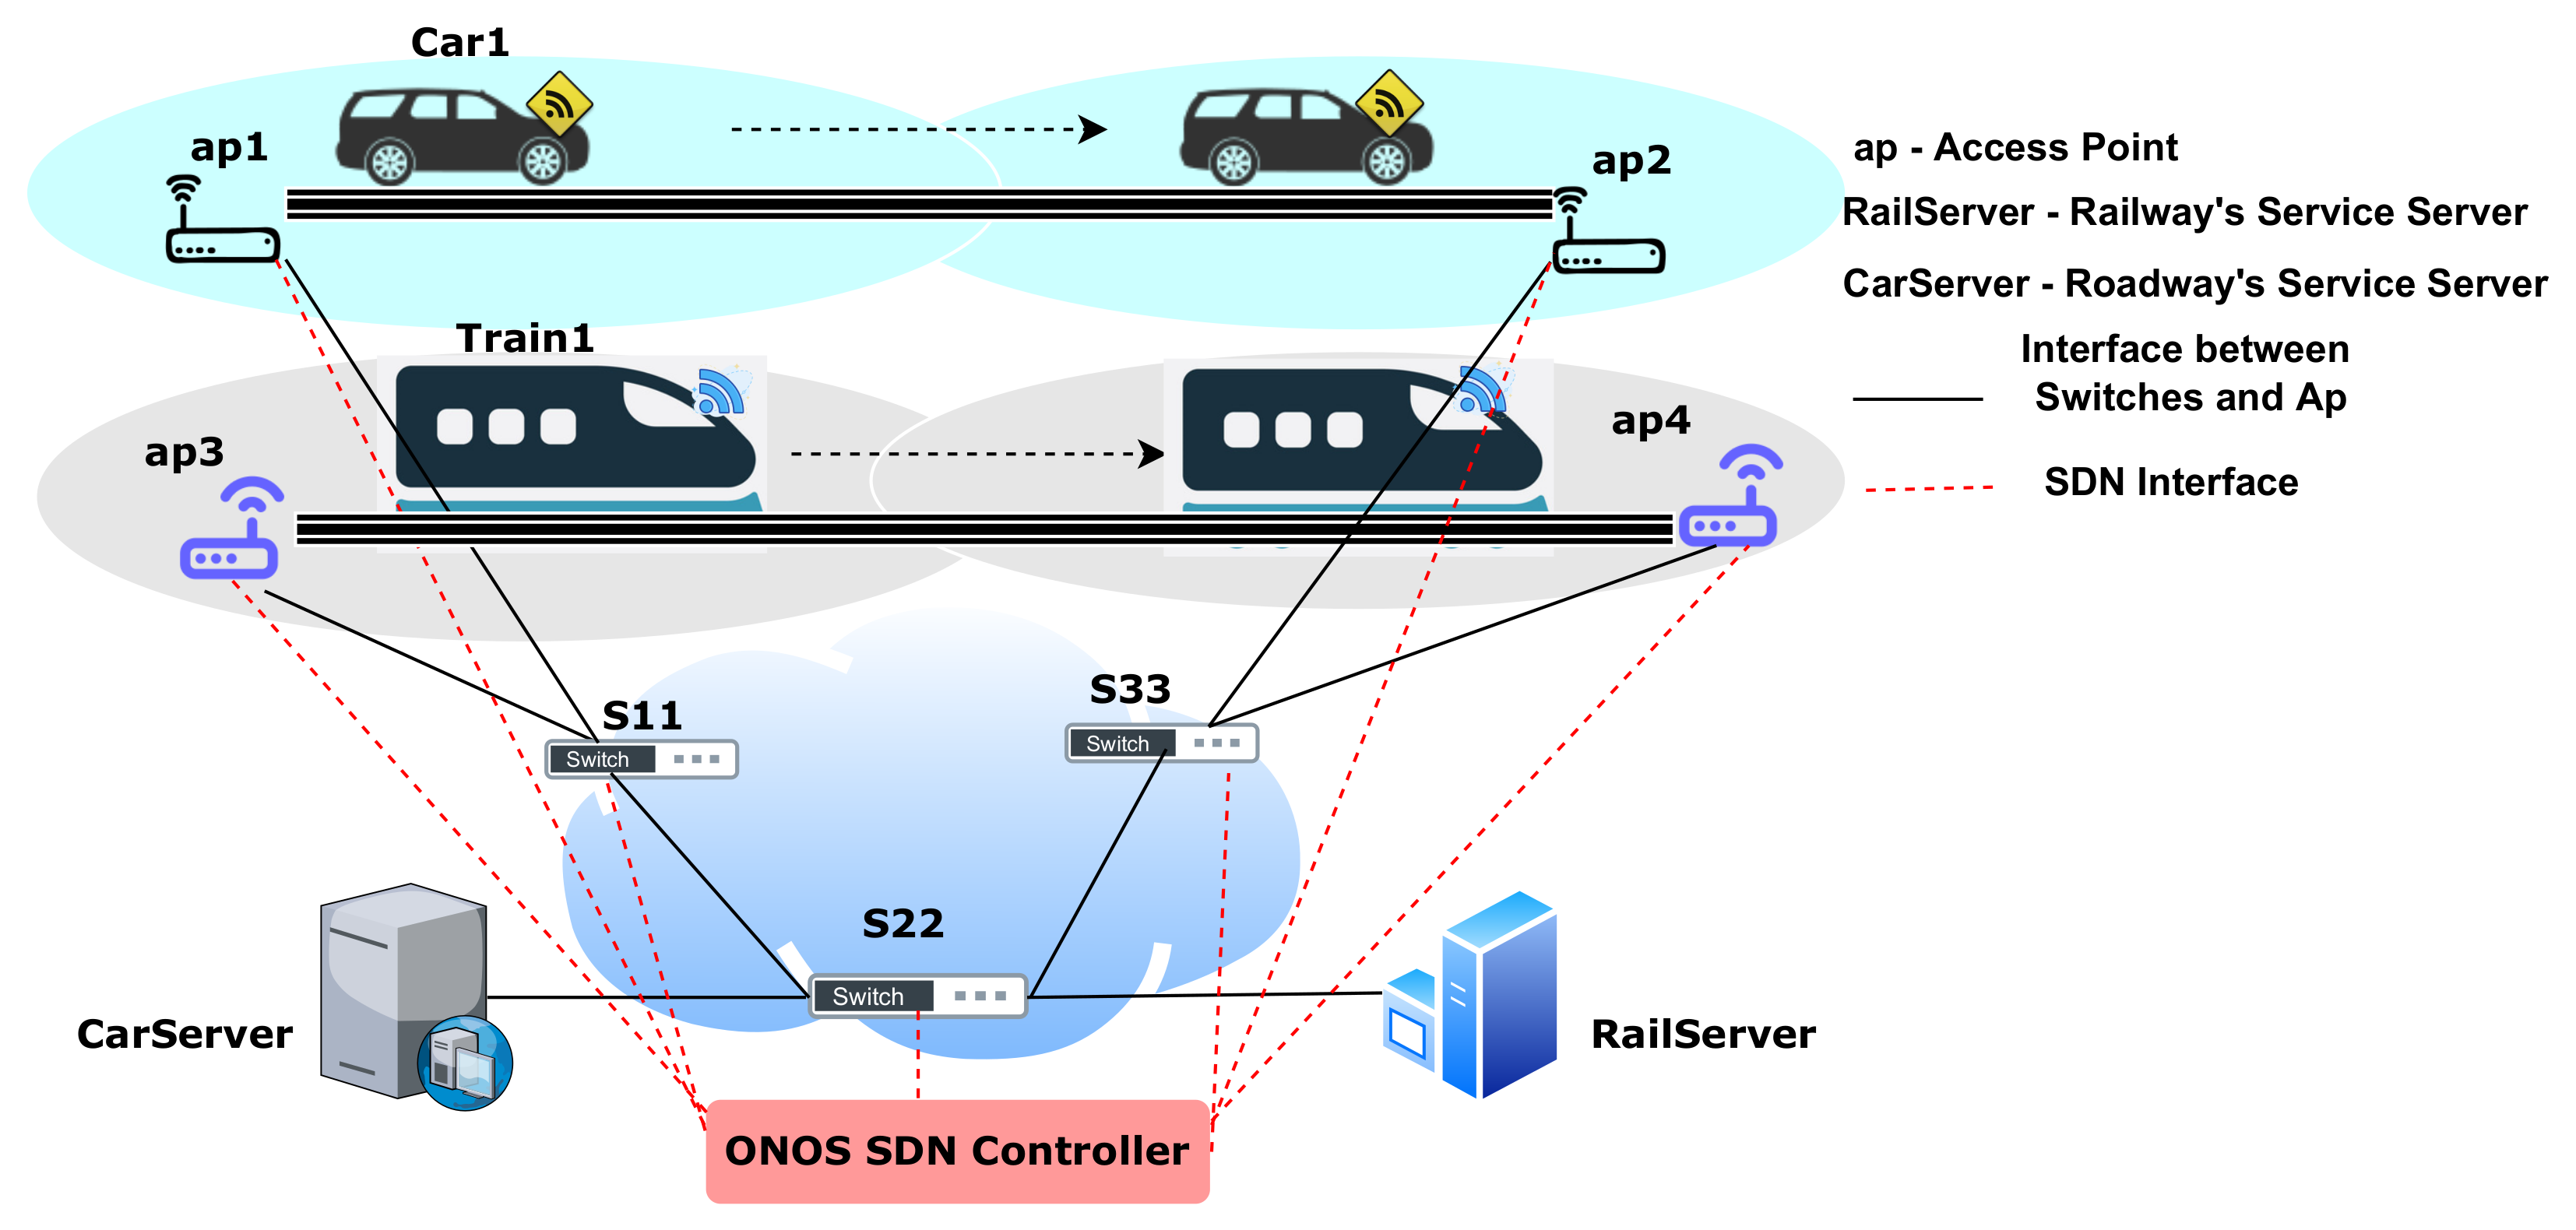
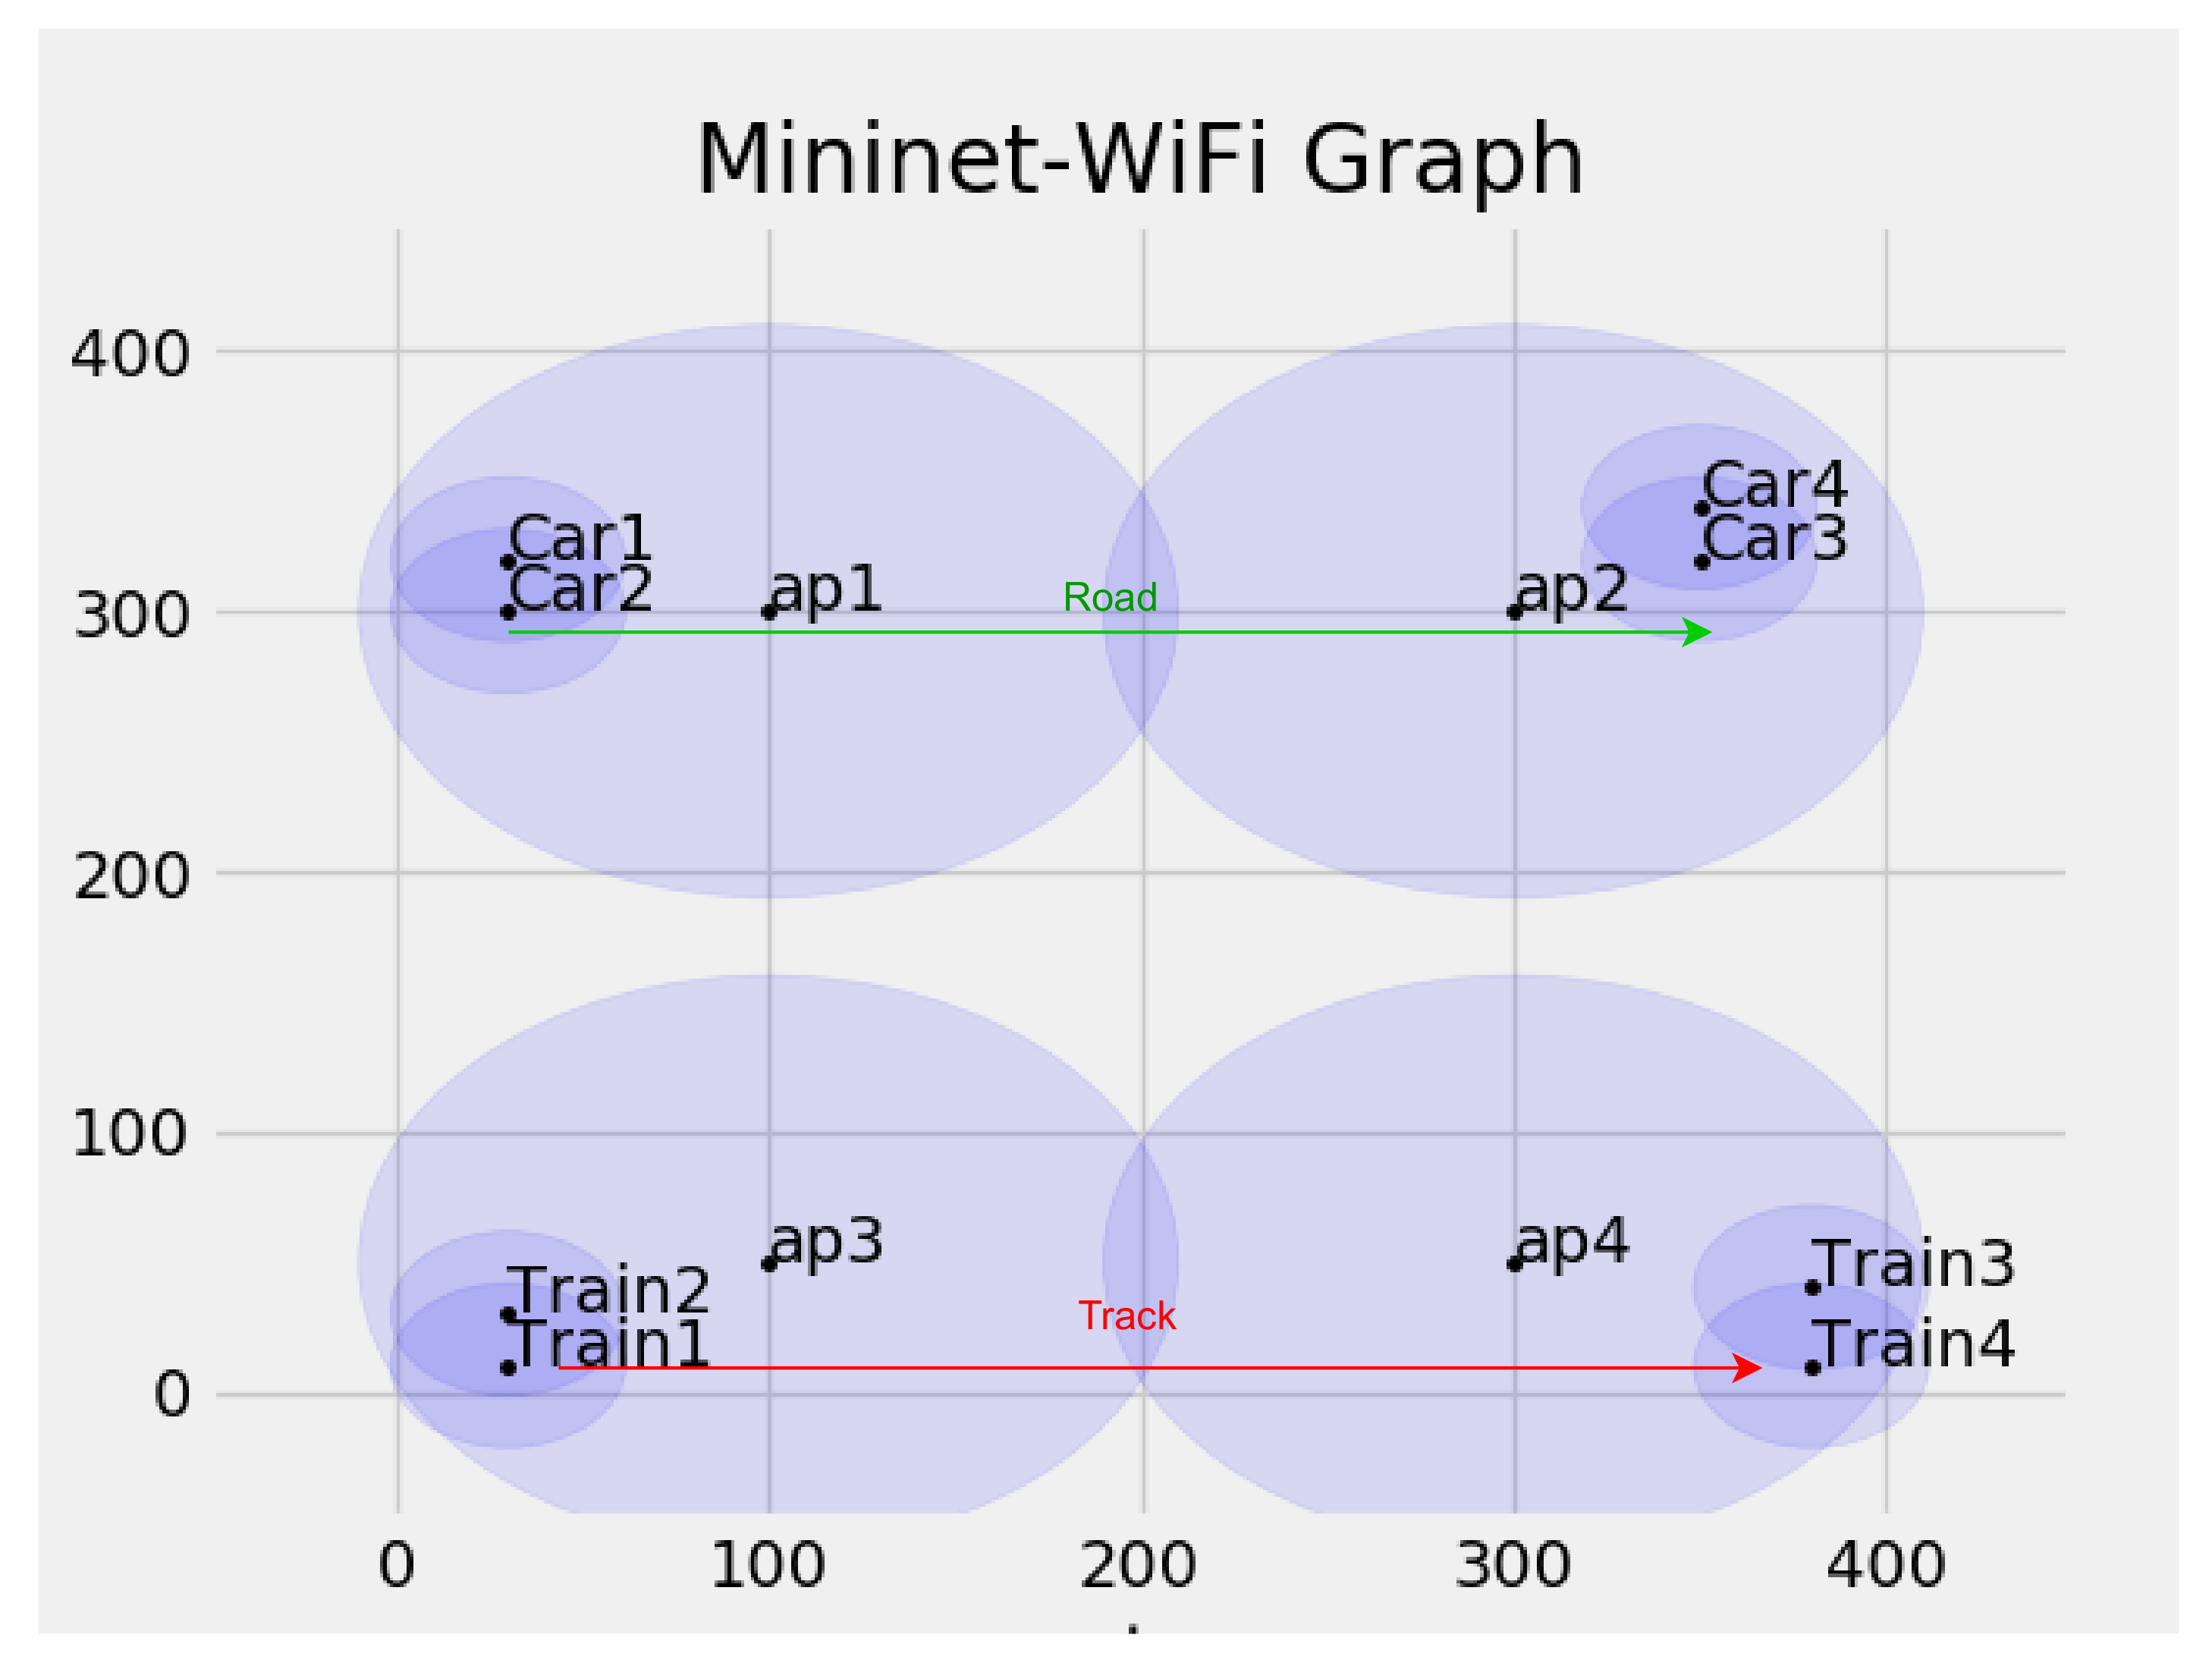
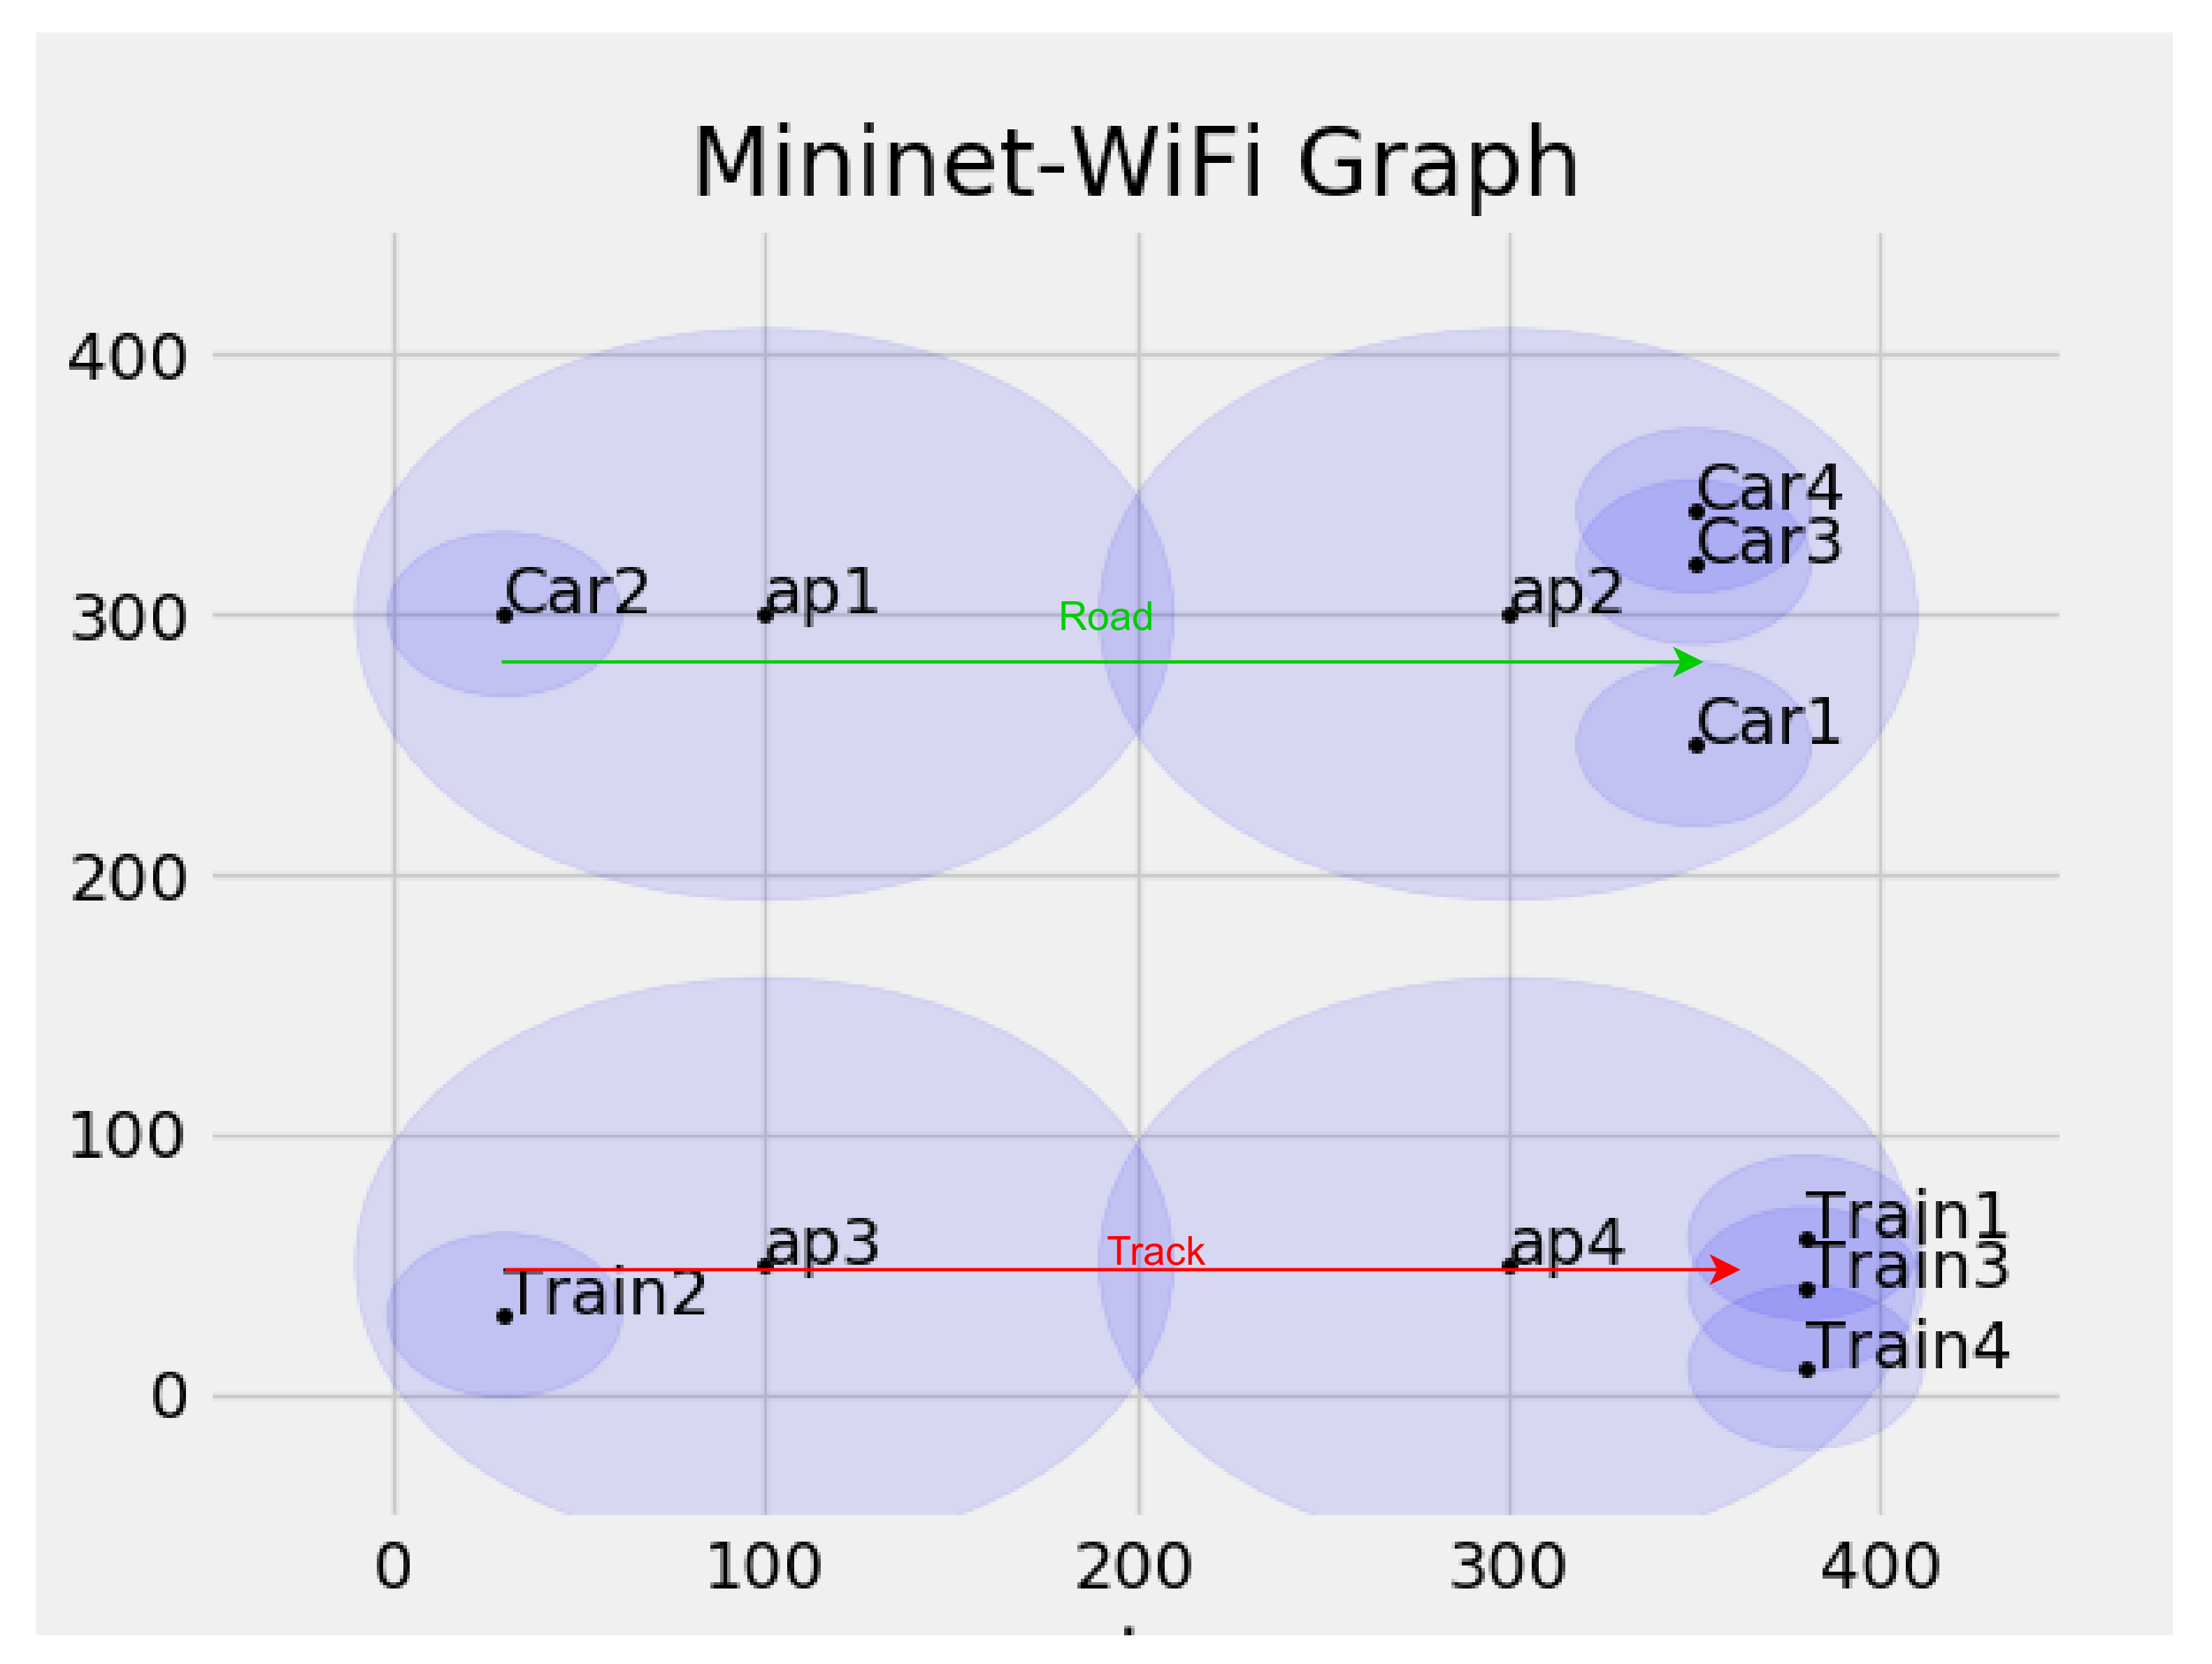
6.1. Network Topology S2(5/6)1—Different Access Network and Shared Core, Railway Track Parallel to Road
| Listing 1. Adding Remote Controller ONOS. |
| ‘ ‘Create_a_network.’ ’ |
| net = Mininet_wifi( topo=None, |
| build=False, |
| ipBase=’192.168.0.0/24’ ) |
| info( ’∗∗∗Adding_Remote_controller\n’ ) |
| c1=net.addController ( name=’c1’, |
| controller=RemoteController, |
| ip=’127.0.0.1’,protocol=’tcp’,port=6653 ) |
| Listing 2. Defining the Moving Host and Server Host. |
| info( ’∗∗∗Add_switches\n’) |
| s11 = net.addSwitch(’s11’,cls=OVSKernelSwitch,protocols=“OpenFlow13”) |
| info(‘ ‘∗∗∗Creating nodes\n’ ’) |
| Train1_args, Car1_args = dict(), dict() |
| if ’−s’ in args: |
| Train1_args[’position’] , Car1_args[’position’] |
| = ’30,10,0’, ’30,320,0’ |
| Train1 = net.addStation(’Train1’ , mac= ’ 0 0 : 0 0 : 0 0 : 0 0 : 0 0 : 0 1 ’ , |
| ip=’192.168.7.101/24’, position=’30,10,0’, ∗∗Train1_args) |
| Car1 = net.addStation(’Car1’ , mac= ’ 0 0 : 0 0 : 0 0 : 0 0 : 0 0 : 0 2 ’ , |
| ip=’192.168.0.201/24’, position=’30,320,0’,∗∗Car1_args) |
| info( ’∗∗∗Add_hosts_for_Service_Server\n’) |
| CarServer = net.addHost(’CarServer’ , c l s =Host , |
| ip=’192.168.0.204/24’, mac=’00:00:00:00:00:08’) |
| RailServer = net.addHost(’RailServer’ , c l s =Host , |
| ip=’192.168.7.104/24’, mac=’00:00:00:00:00:07’) |
| Listing 3. Defining the Access Point. |
| ap1 = net.addAccessPoint(’ap1’, ssid=’ssid−ap1’, mode=’a’, |
| channel=’36’ , position= ’ 100 ,300 ,0 ’ , |
| ’protocols’:’OpenFlow13’, |
| ’txpower’:’49dBm’,’range’: 110 ) |
| net.setPropagationModel(model=“logDistance”, exp=5) |
| info ( ‘ ‘ ∗ ∗ ∗ Configur ing_wi f i_nodes\n ’ ’ ) |
| net.configureWifiNodes() |
| Listing 4. Defining the connectivity. |
| info(‘ ‘∗∗∗Creating_links\n’ ’) |
| s11s22 = { ’bw’:1000} |
| net.addLink (s11, s22, cls=TCLink , ∗∗s11s22) |
| s22s33 = { ’bw’:1000} |
| net.addLink (s22, s33, cls=TCLink , ∗∗s22s33) |
| CarServers22 ={ ’bw’:500} |
| net.addLink (CarServer, s22, cls=TCLink , ∗∗CarServers22) |
| RailServers22 = { ’bw’:500} |
| net.addLink (RailServer, s22, cls=TCLink , ∗∗RailServers22) |
| s11ap1 = { ’bw’:500} |
| net.addLink (s11, ap1, cls=TCLink , ∗∗s11ap1) |
| s11ap3 = { ’bw’:500} |
| net.addLink (s11, ap3, cls=TCLink , ∗∗s11ap3) |
| s33ap2 = { ’bw’:500} |
| net.addLink (s33, ap2, cls=TCLink , ∗∗s33ap2) |
| s33ap4 = { ’bw’:500} |
| net.addLink (s33, ap4, cls=TCLink , ∗∗s33ap4) |
| Listing 5. Defining the Plot Limits of Graph and Start the Access Points and Switches. |
| if ’−p’ not in args:{ |
| net.plotGraph (max_x=450, min_x=−50, min_y=−50, max_y=450)} |
| info(‘ ‘∗∗∗Starting_the_network\n’ ’) |
| net.build() |
| info( ’∗∗∗Starting_the_controllers\n’) |
| for controller in net.controllers: |
| controller.start() |
| ap1.start([c1]) |
| ap2.start([c1]) |
| ap3.start([c1]) |
| ap4.start([c1]) |
| net.get(’s11’).start([c1]) |
| net.get(’s22’).start([c1]) |
| net.get(’s33’).start([c1]) |
| info(‘ ‘∗∗∗Starting_CLI\n’ ’) |
| CLI(net) |
| info(‘ ‘∗∗∗Stopping_network\n’ ’) |
| net.stop() |
| if __name__ == ’__main__’: |
| setLogLevel(’info’) |
| topology(sys.argv) |
6.2. S4(5/6)4: Shared Access Network and Shared Core, Track Perpendicular to Road
7. Selected Tools to Generate Data Traffic to Validate the Scenarios
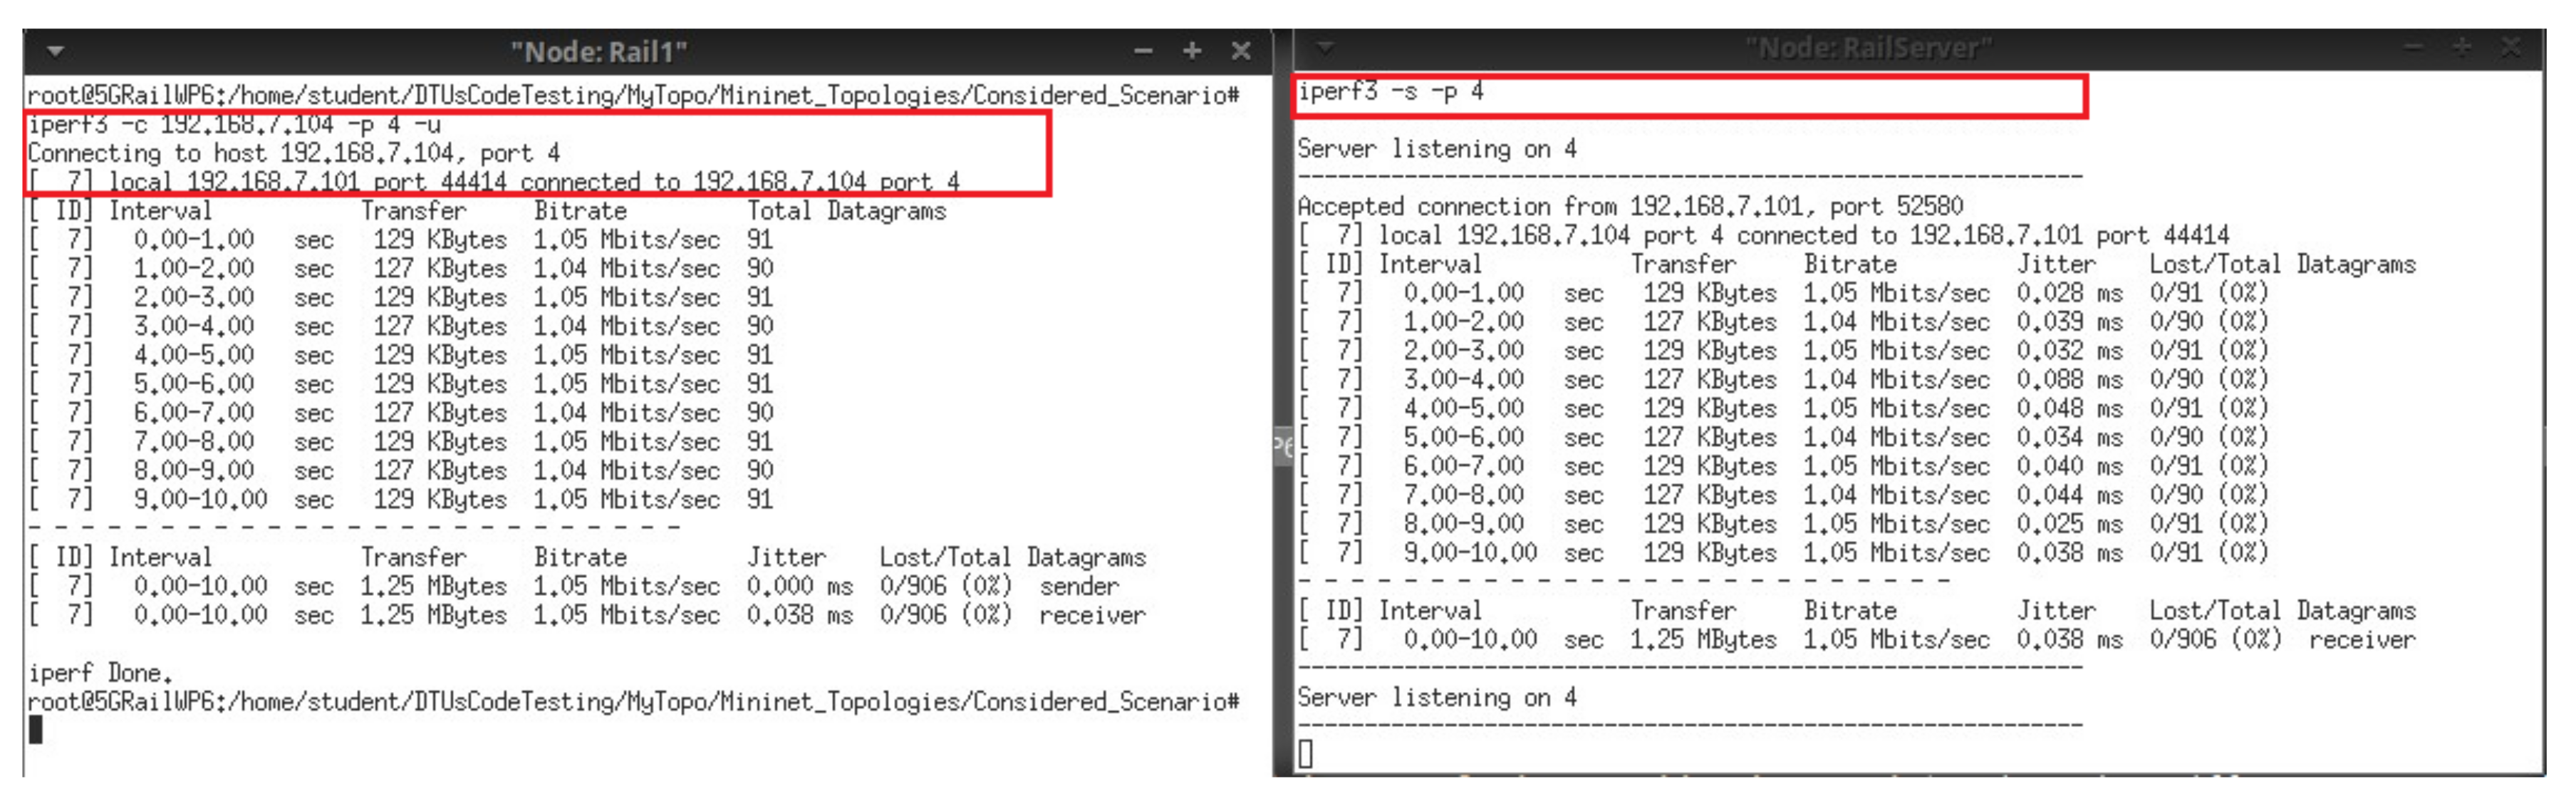
- iperf3: Iperf3 is a network performance measurement tool. It is able to execute on Linux, Unix, Android, macOS, and Windows platforms. It works in client and server mode functionality. It has the ability to generate user datagram protocol (UDP) and transmission control protocol (TCP) packets from one host/client and send them to another host/server. It generates a packet data stream to measure the throughput, bandwidth, and packet loss between two hosts [28,29].The installation file and documentation to use ipef3 are given in the link [29]. The iperf3 tool is used to send and receive UDP and TCP data packet streams to demonstrate voice communication and standard data communication for operational purposes between car-to-car and assigned car service servers or train-to-train and assigned rail service servers. Table 3 shows the commands used to generate the UDP/TCP data traffic from the client host to the server host.
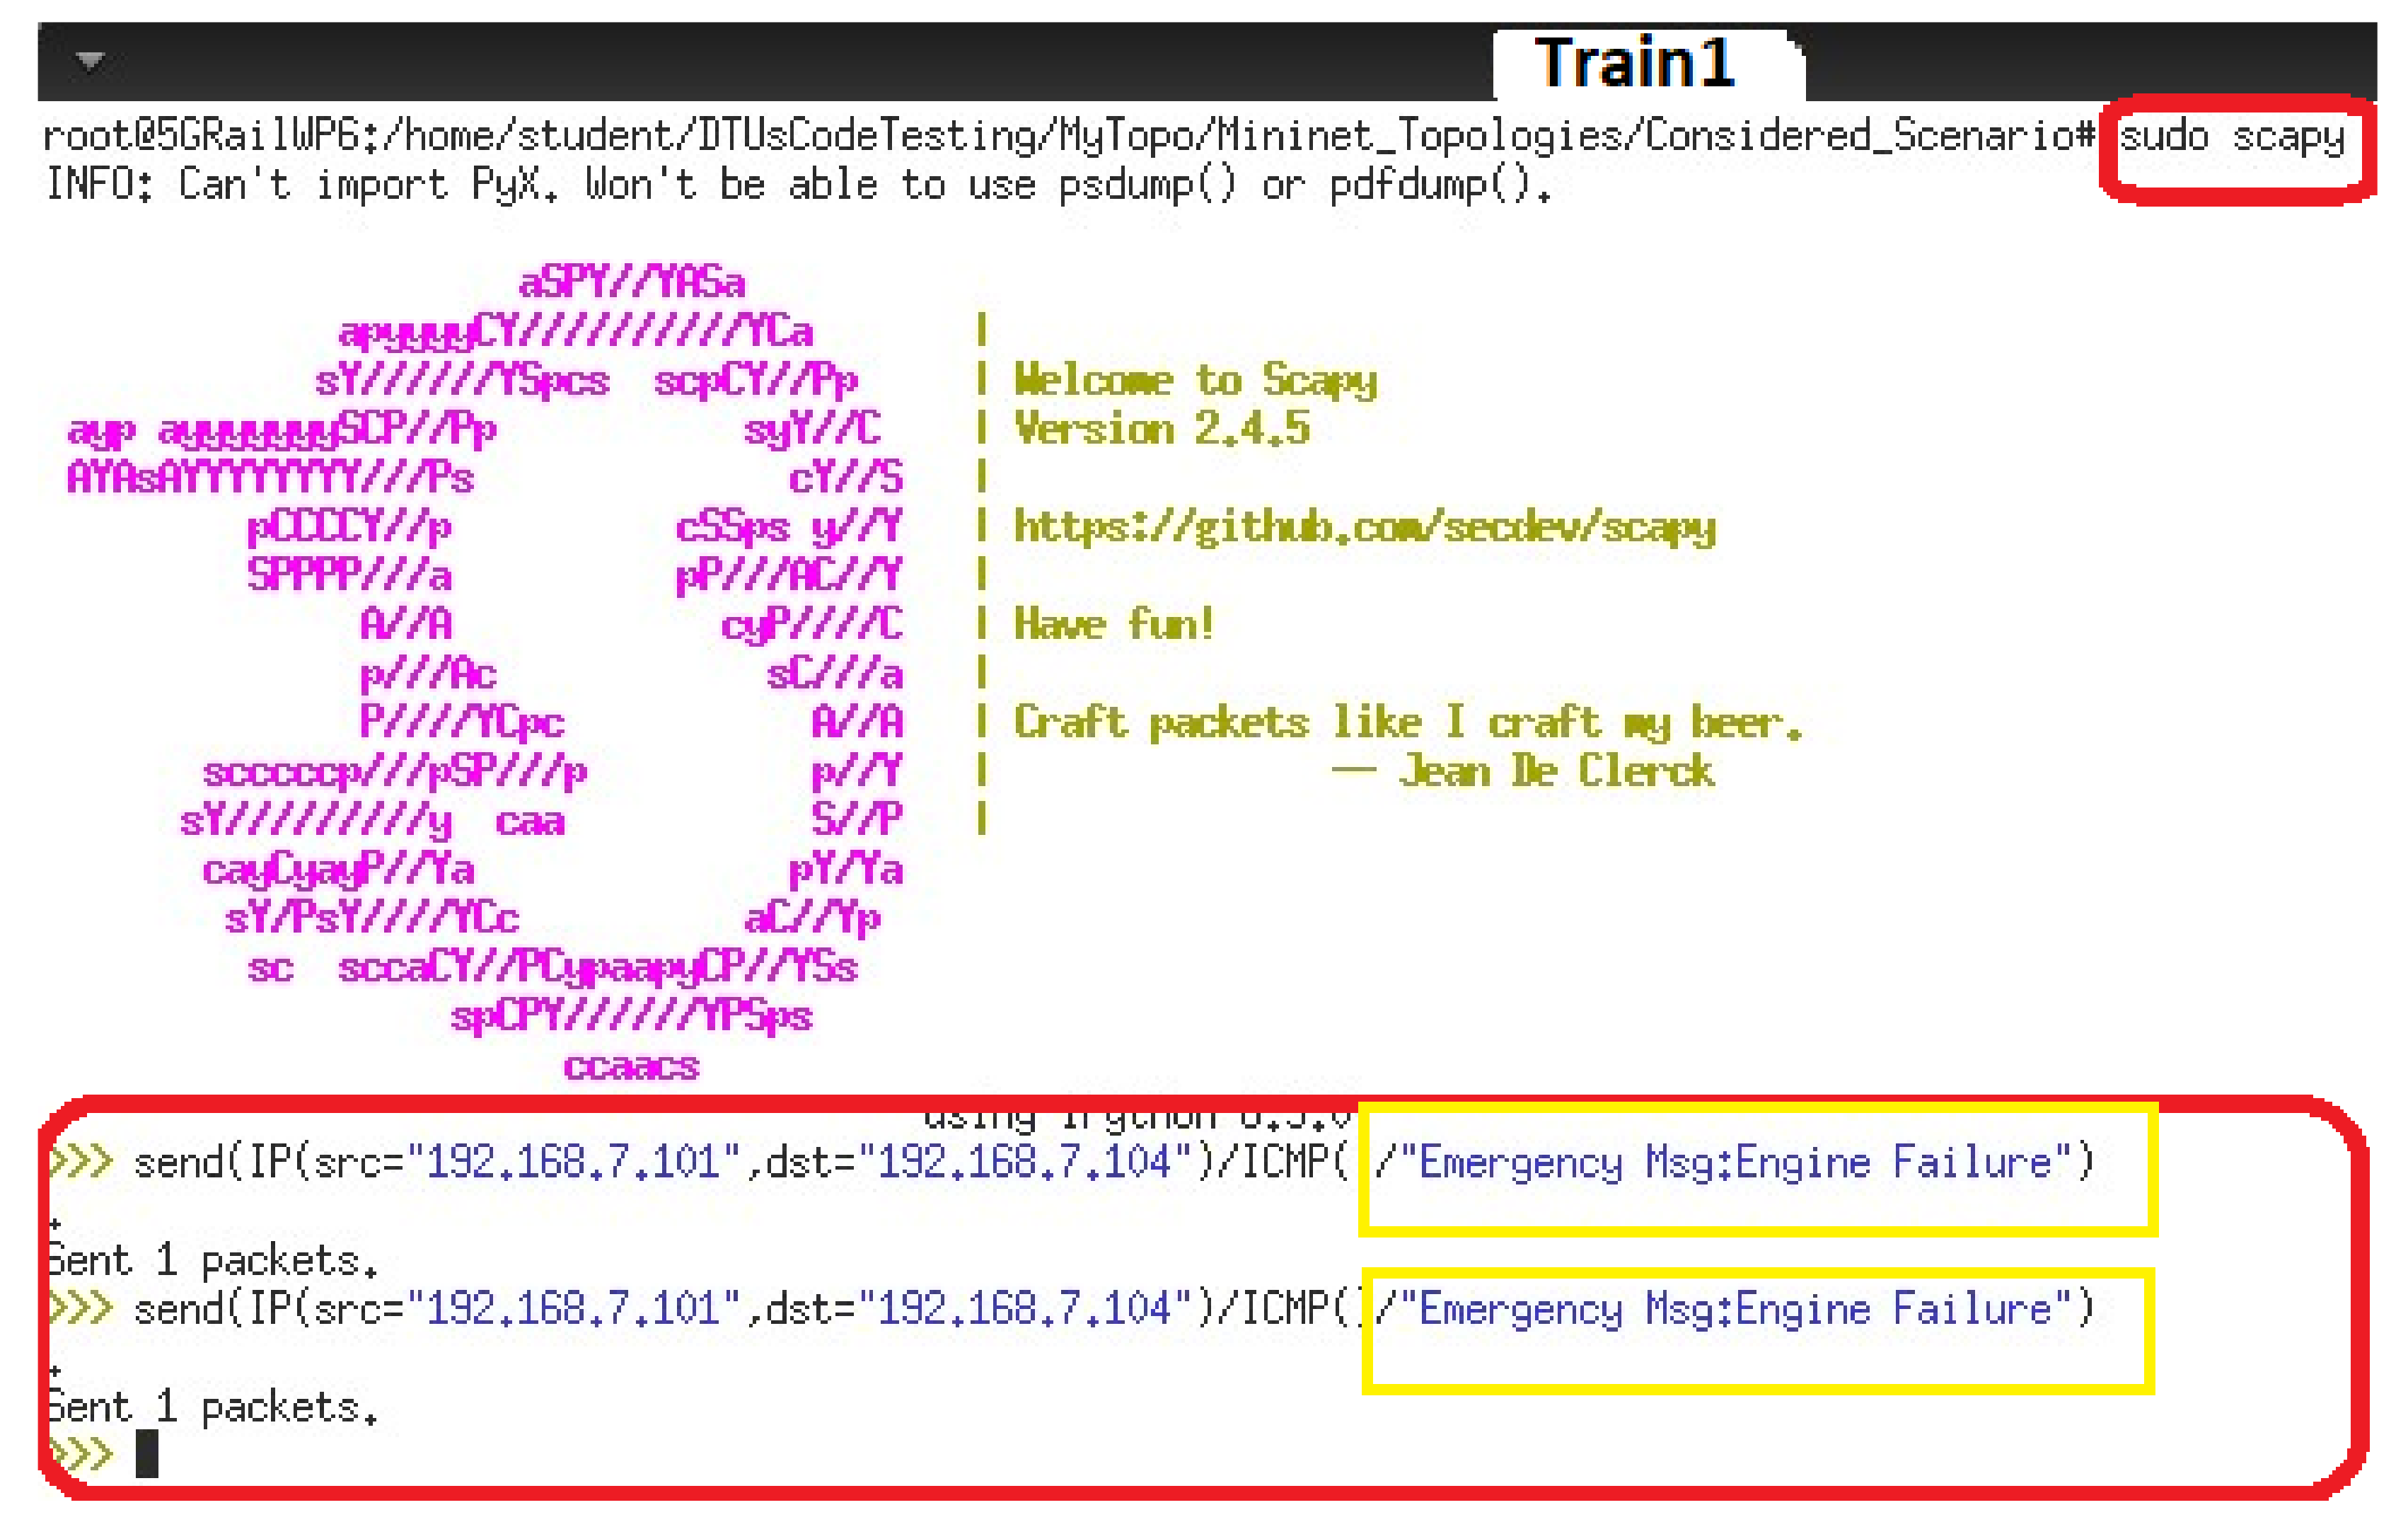
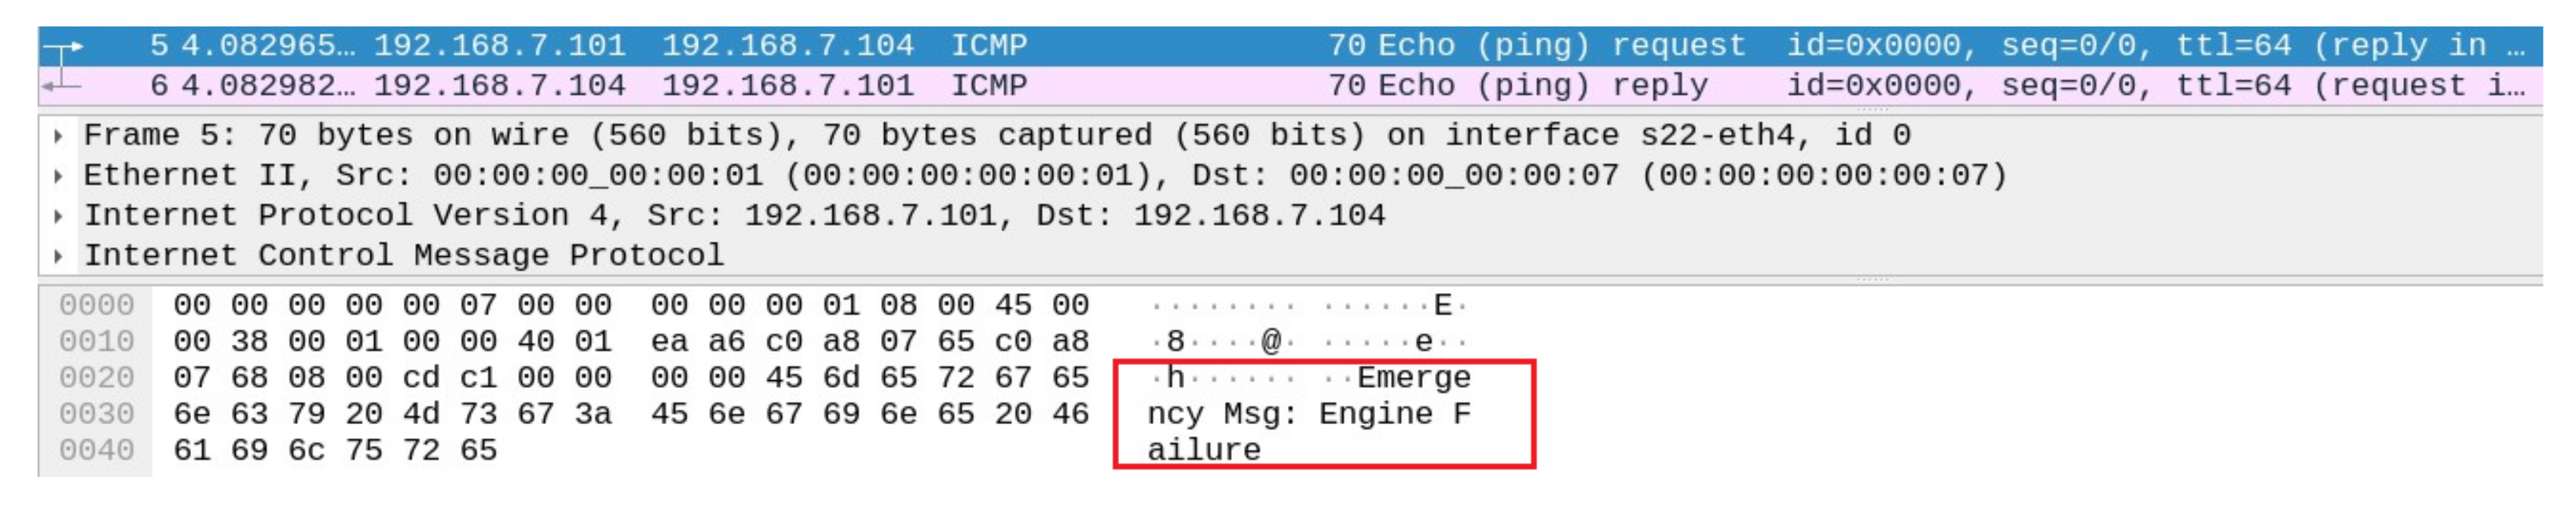
- Scapy: Scapy is an interactive packet manipulation tool with a CLI, and its API is implemented using Python. Therefore, this tool can be used through CLI or by importing it to Python scripts. Using this tool, users can create, forge, or decode packets from a wide range of protocols and send them to the network. It can also capture data packets, match criteria, and reply to requests [30]. Along with these functions, most classical tasks can be handled easily, including scanning, probing, and detecting networks. Scapy has the ability to run on Linux, macOS, and Windows systems. The principal advantage of Scapy is that it offers a technique to modify and create network packages at a low level by leveraging available network protocols and configuring them based on the user’s needs [31]. Therefore, Scapy is used in this practical work to create a data packet to indicate critical data communication. In addition, it is also used to create special messages associated with emergencies or to convey any kind of information to the rail service server or car service server.Scapy is installed in a Linux environment using the specific instances shown in the Table 4. A demonstration of using Scapy to generate data packets associated with critical data communication or messages is presented in Section 9.7 of this paper.
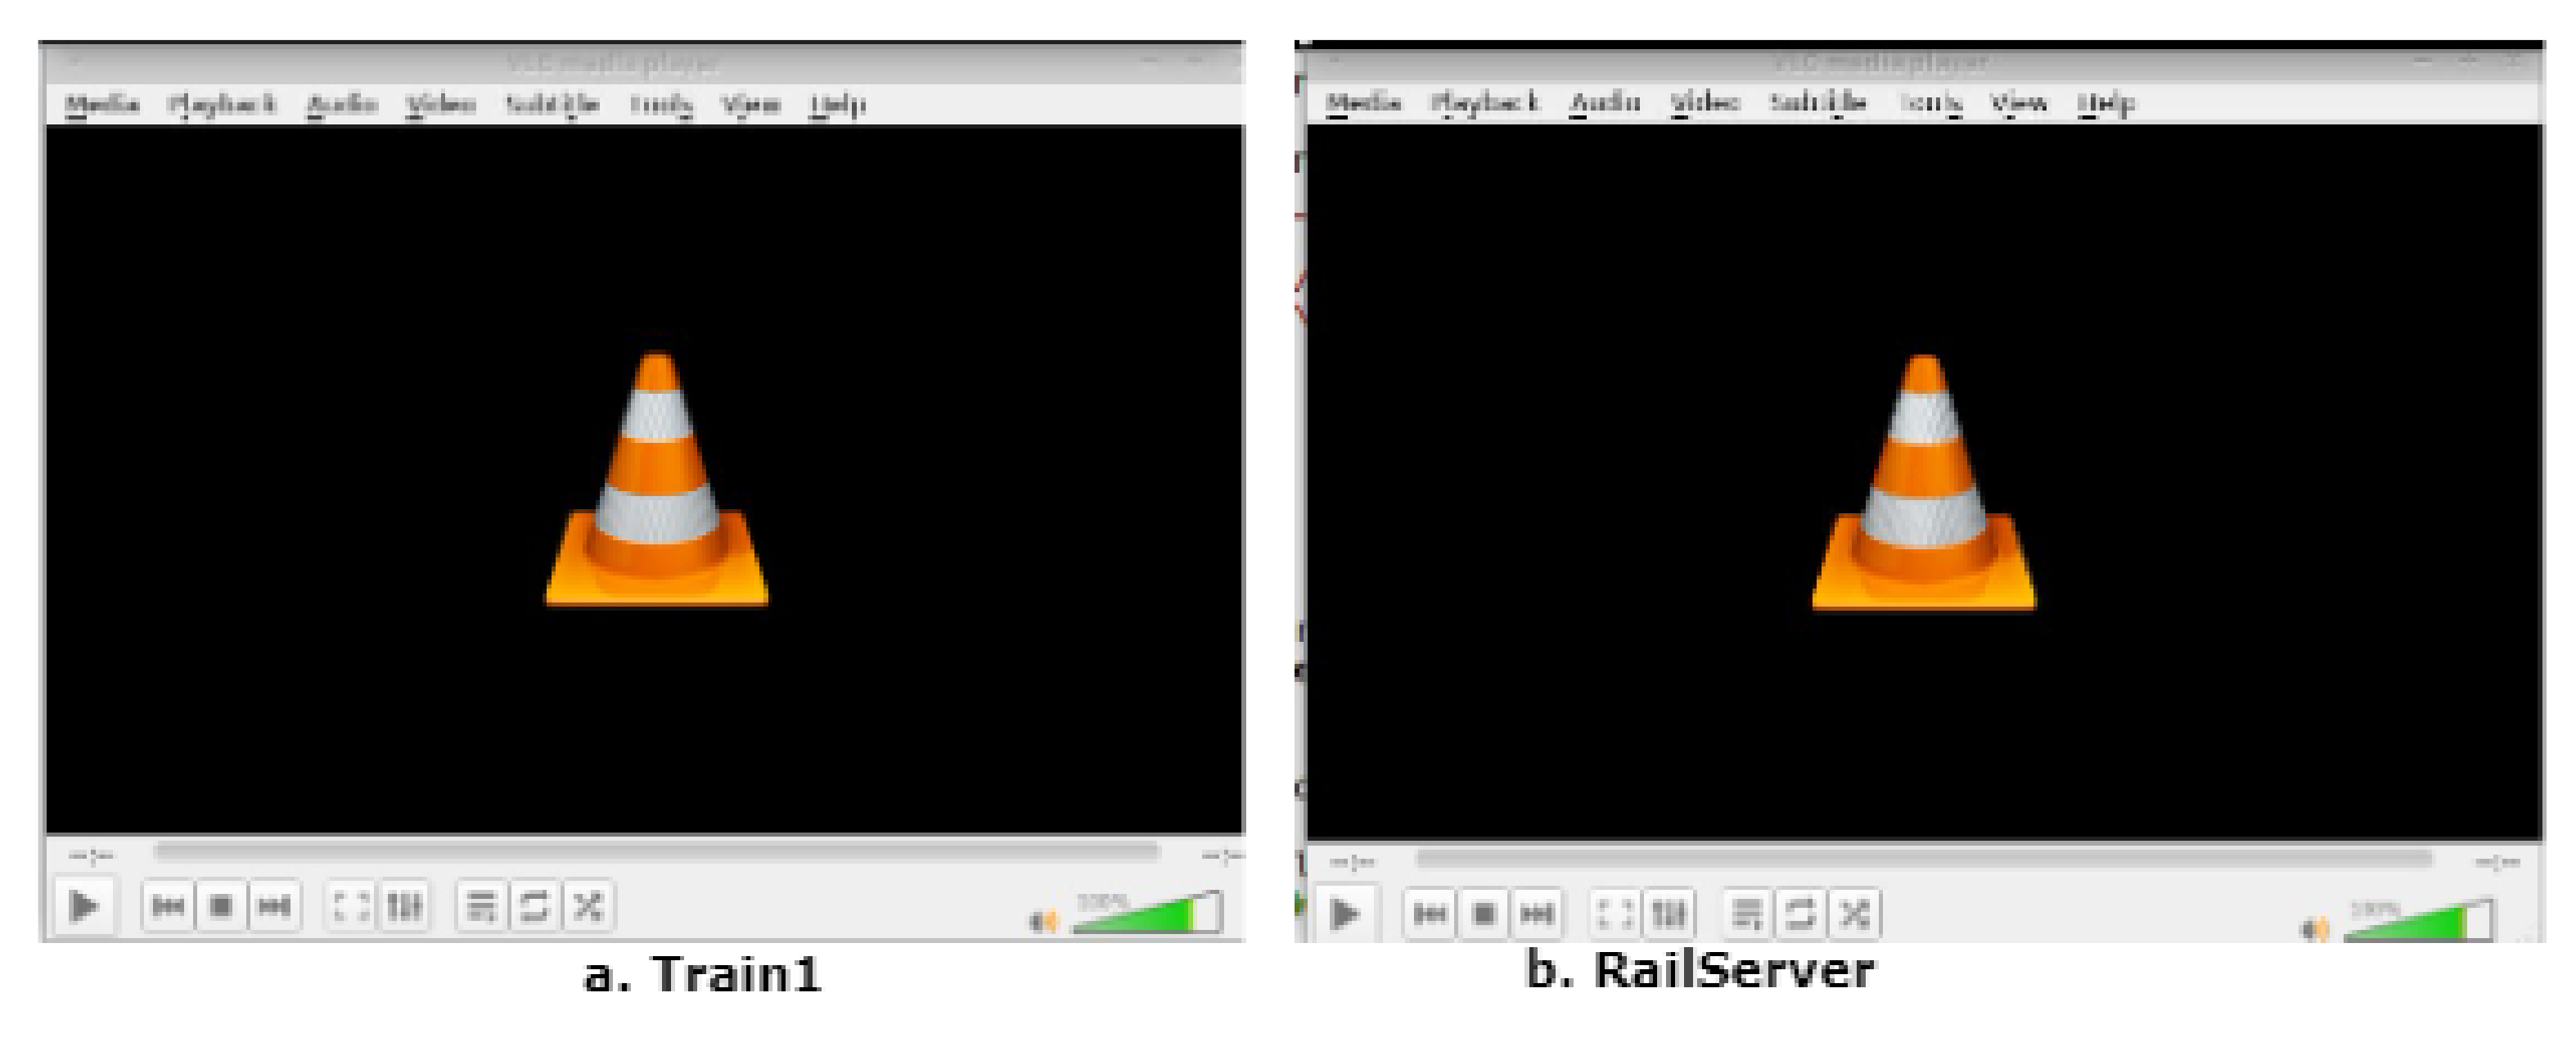
- VLC Player: VideoLAN Client, generally known as VLC, is open-source, compact media player software developed by the VideoLAN project. VLC is capable of streaming and receiving media files (video/audio). In addition to DVD video and video CD formats, VLC supports a wide variety of audio and video compression methods and media streaming protocols. It can be installed and used on any desktop system as well as on smartphones [33,34].To demonstrate video or critical video communication in railway and road coexistence scenarios, VLC Player is used to transmit video from a train to the RailServer and from a car to the CarServer. A detailed process for streaming a video from one host to another or to a local system is presented in Section 9.8 of this paper.
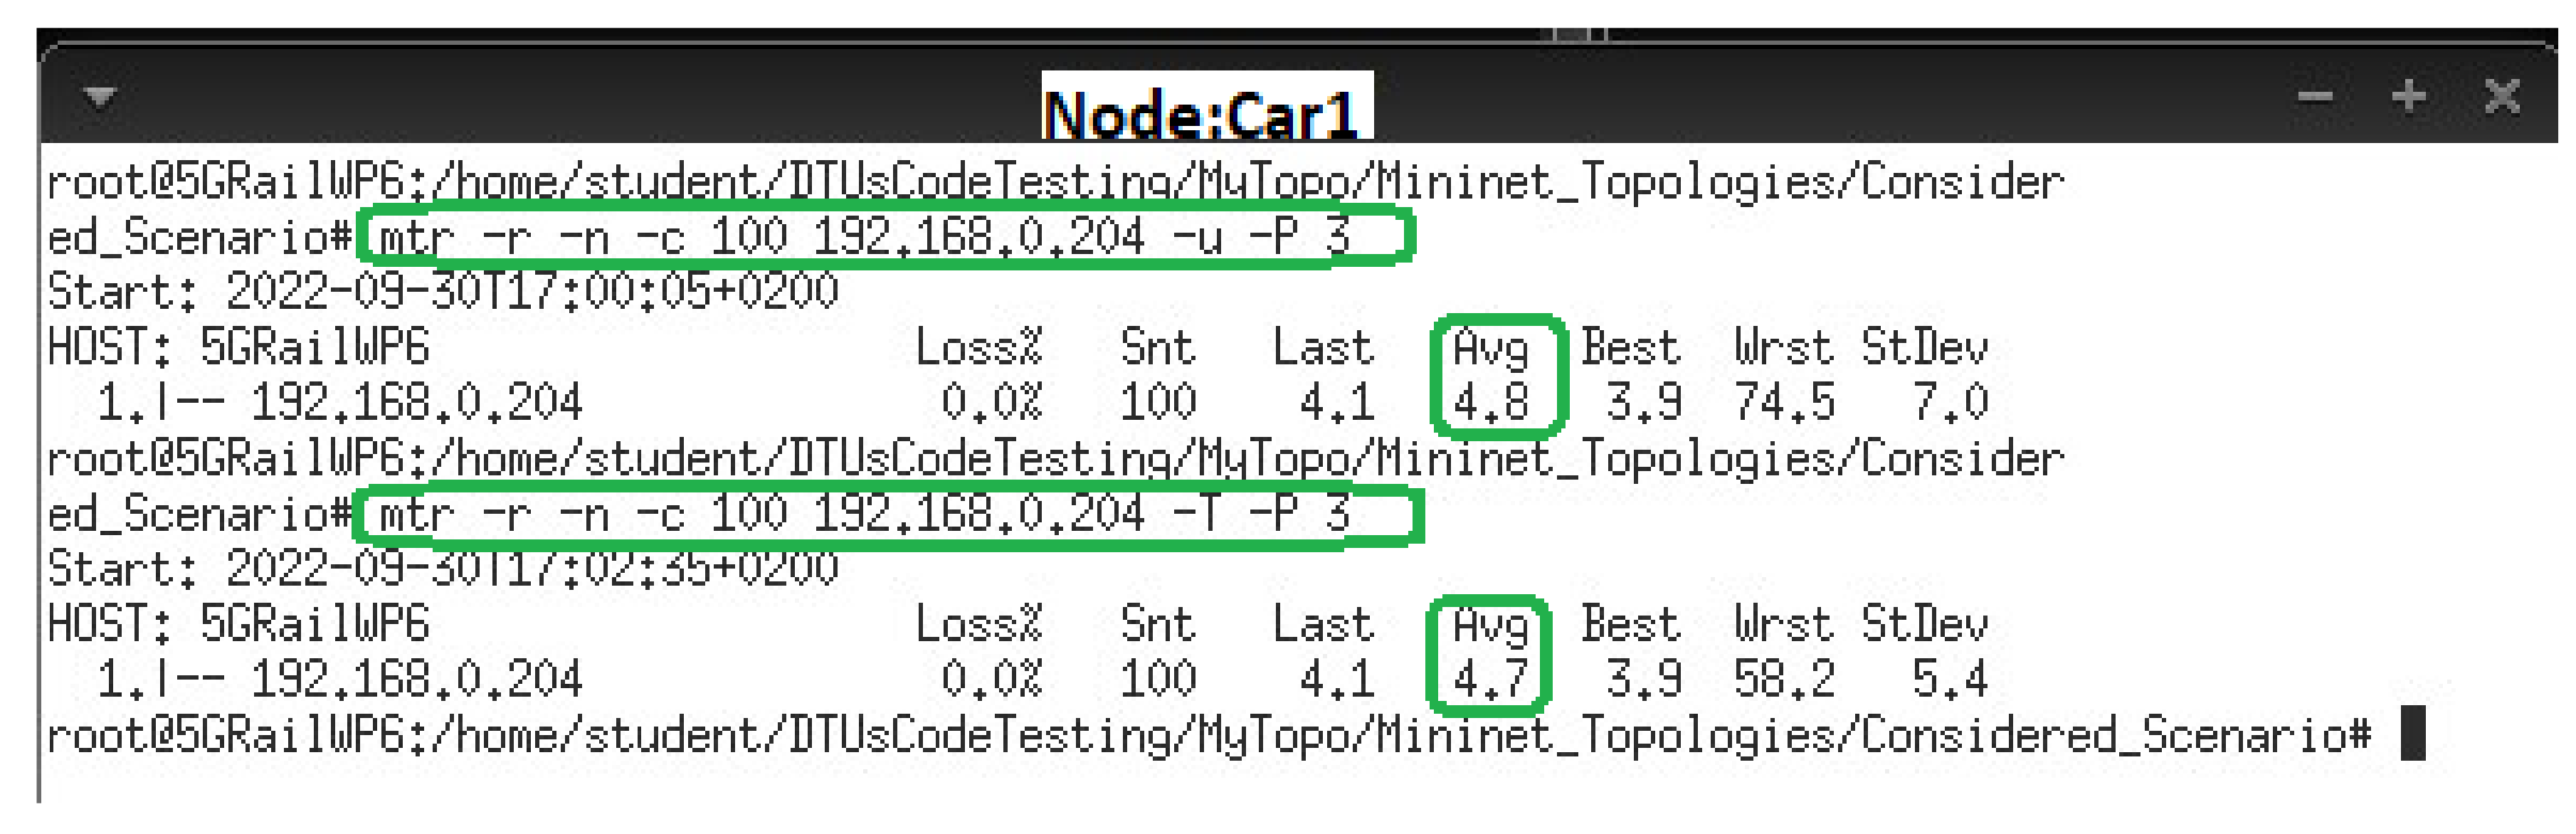
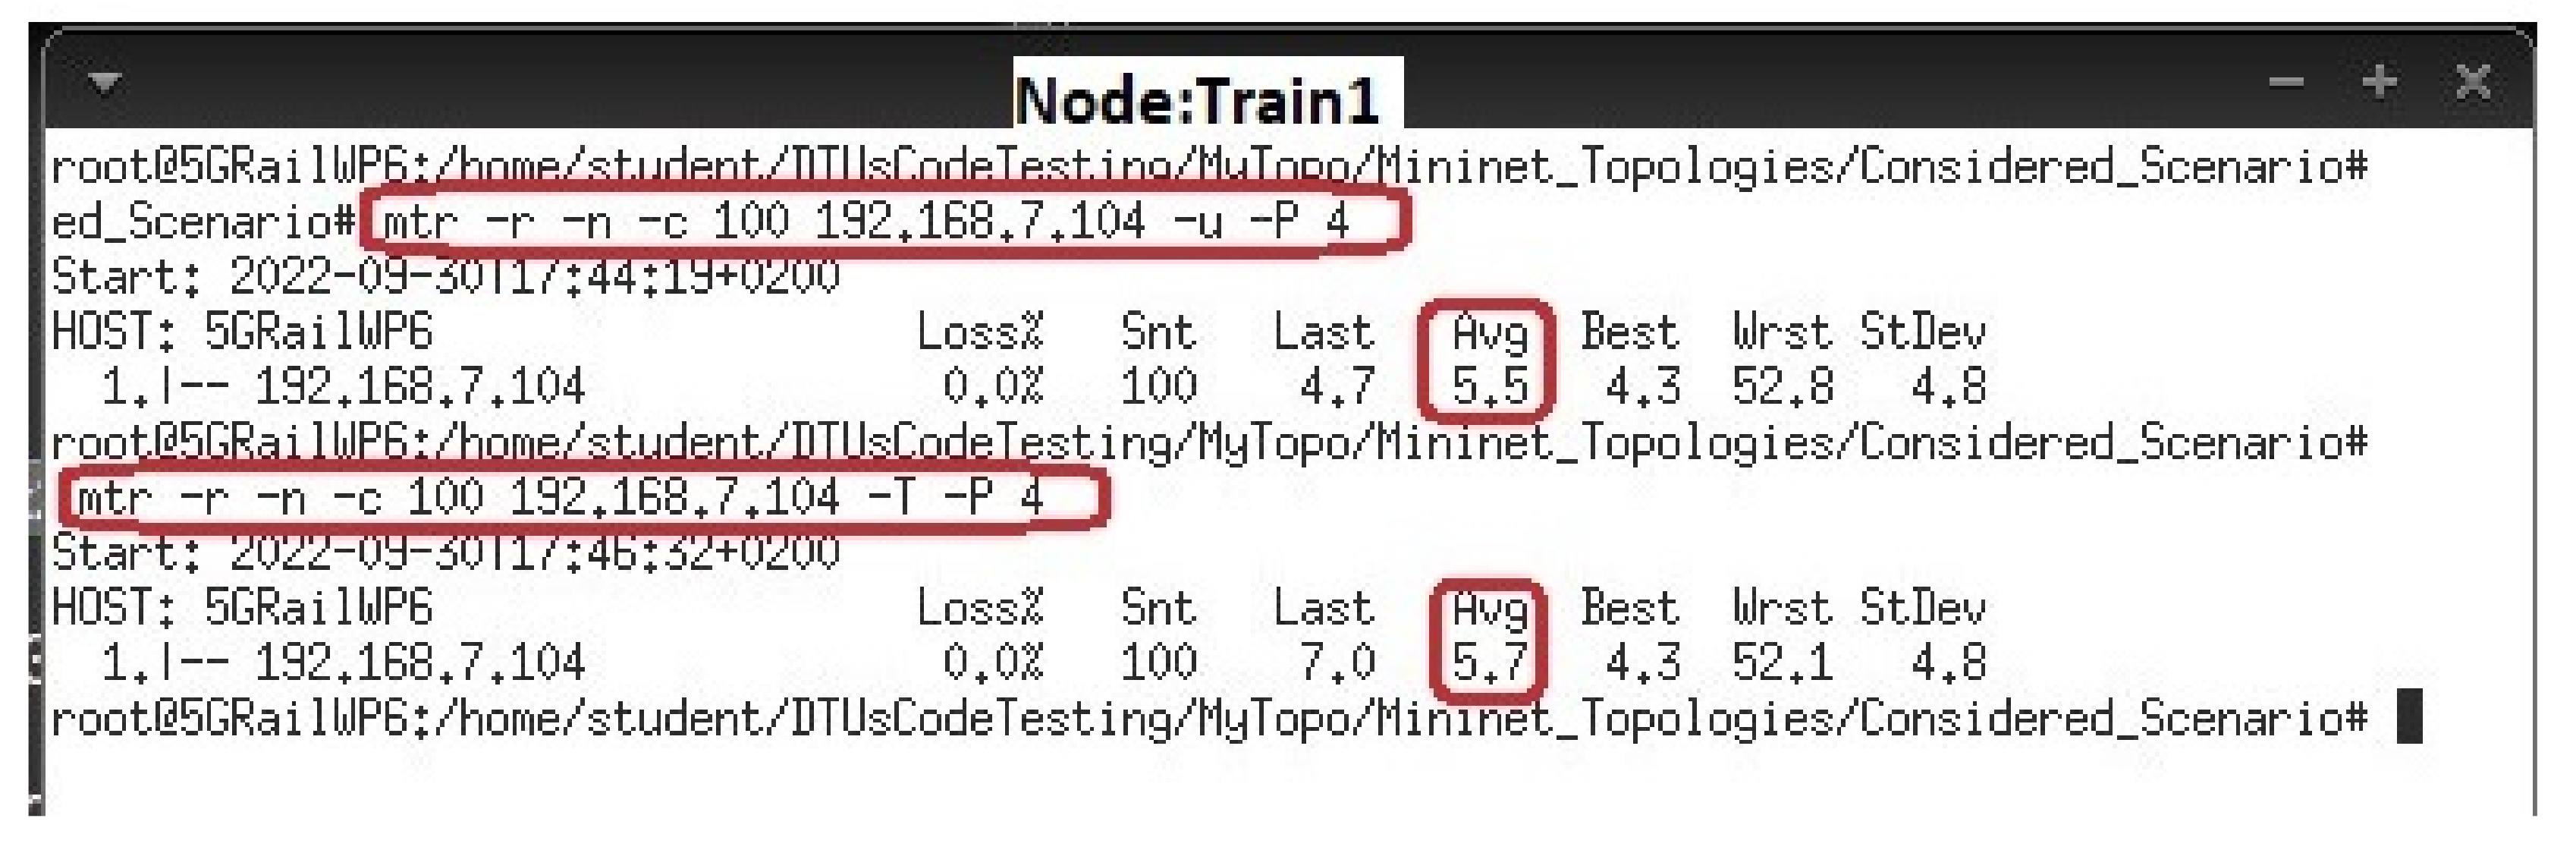
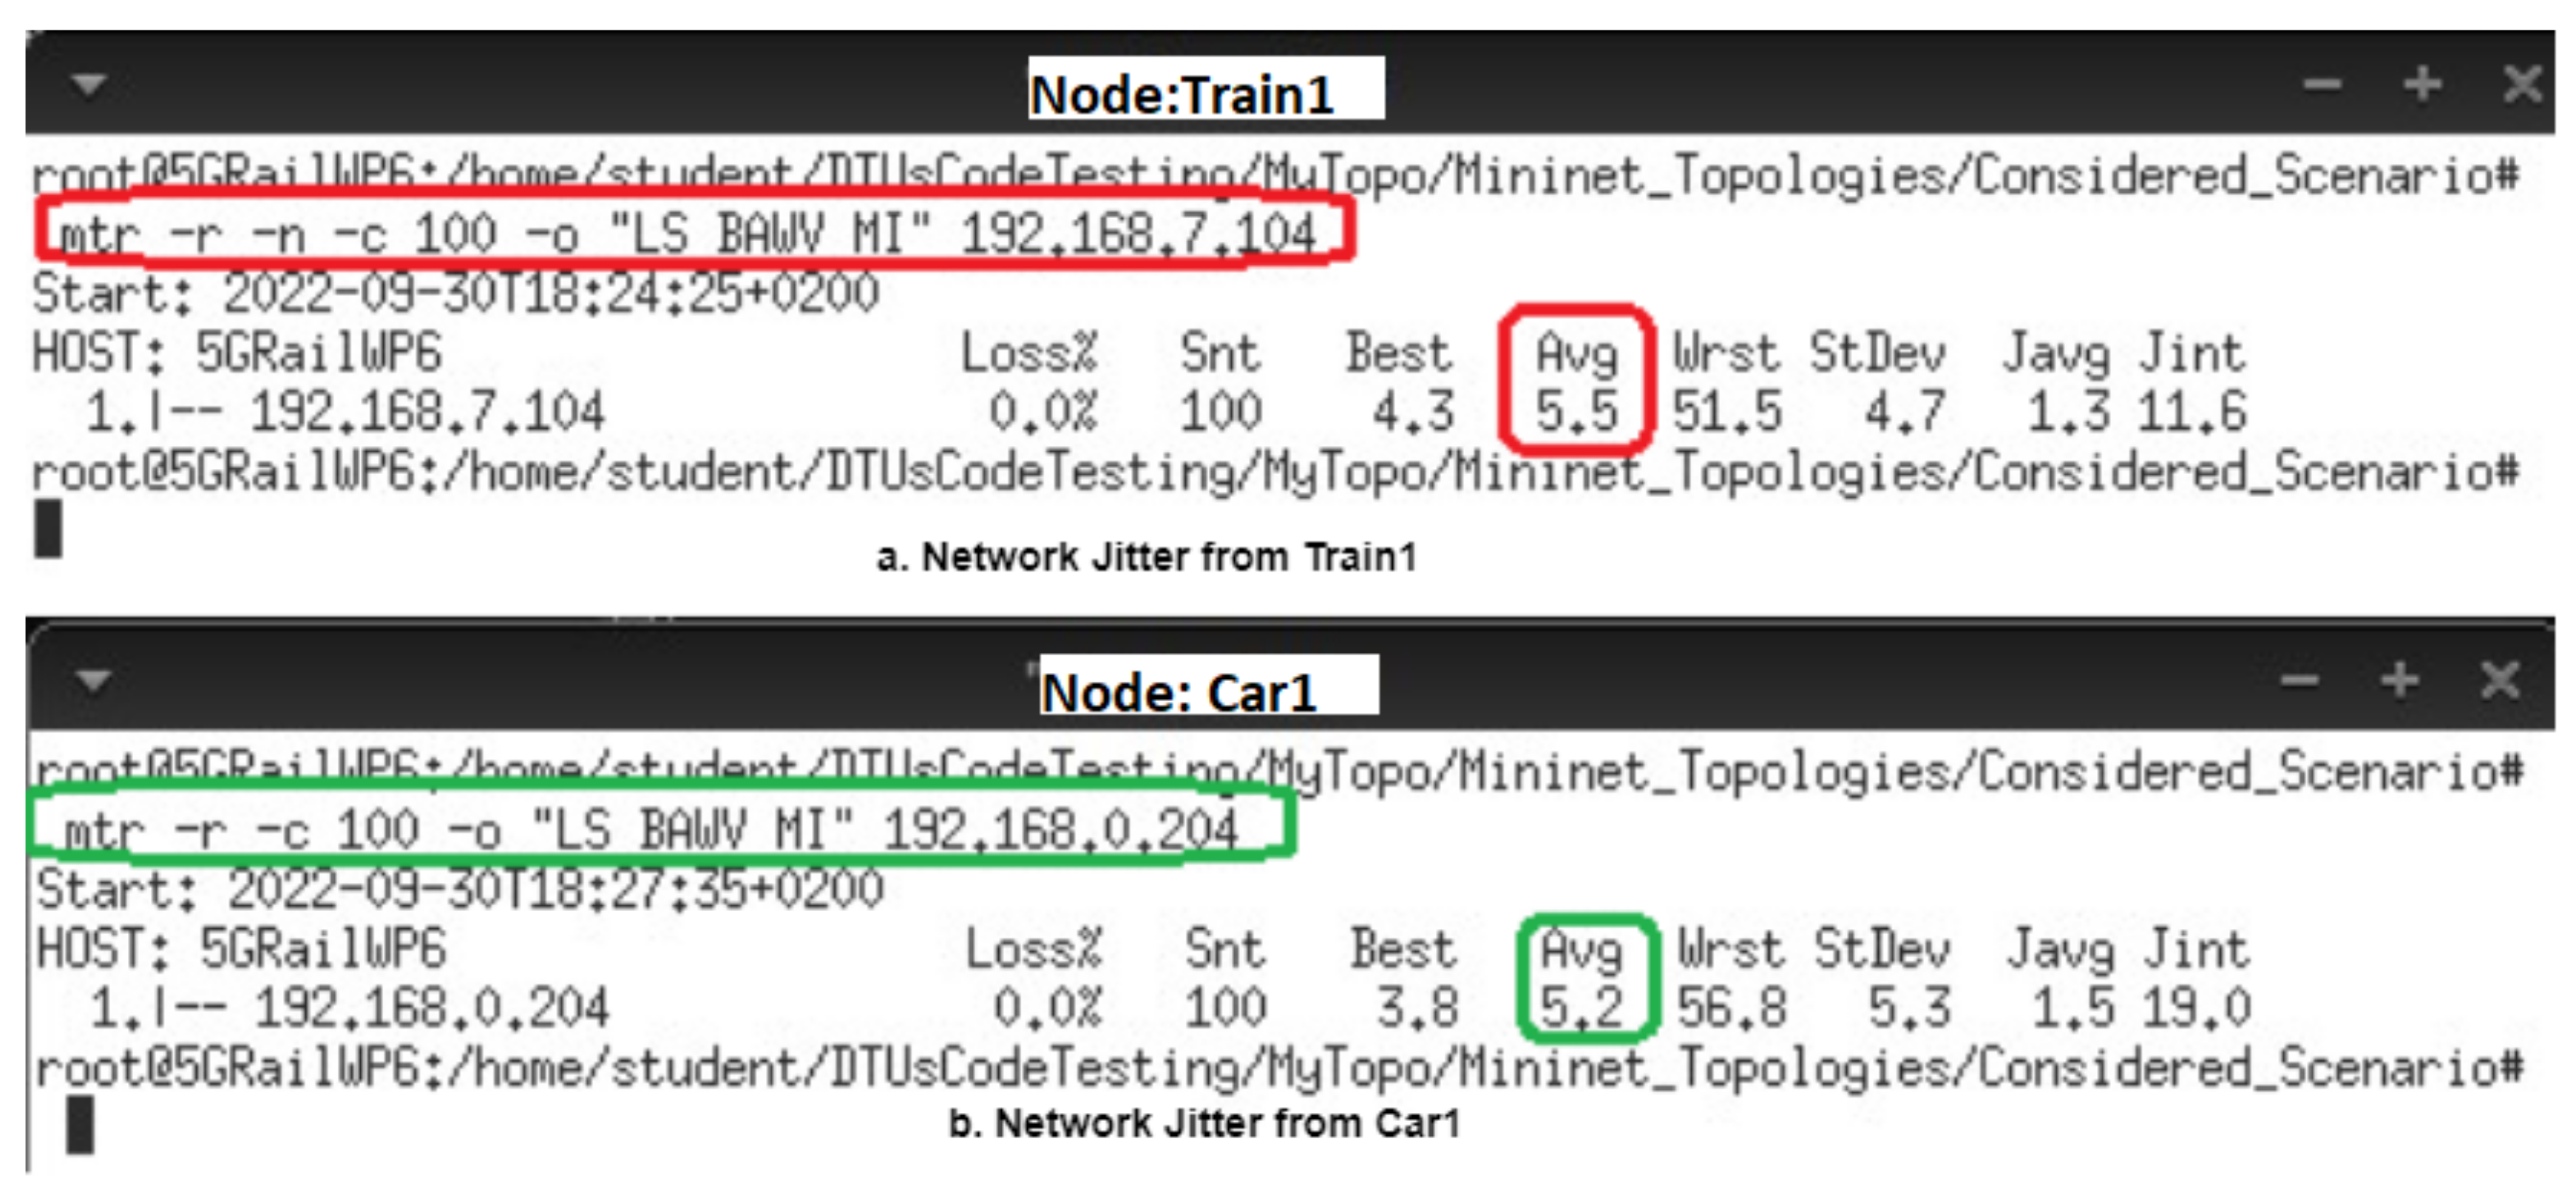
- MTR: Matt’s Traceroute (MTR) is a network performance monitoring tool. Ping is one of the most widely used network diagnostics tools to figure out network reachability from one host/network entity to another. Using ping, a user sends ICMP packets from one system/host to another, and after getting the ICMP packets, the destination host/system sends an echo reply. This echo reply informs about the availability of the destination host, end-to-end delay, and packet loss, whereas the traceroute provides information about the path between the sender and receiver host. MTR utilizes both ping and traceroute functionality [35,36].The significant reason to use the MTR tool is that it allows measurement of the data packet loss and jitter of the network. Therefore, we can say that MTR measures the quality of the network path. For installing the MTR in the Ubuntu environment, use the following command: sudo apt-get -y install mtr. Table 5 shows the commands and options to measure the loss and jitter of the network. There are more options available to measure packet data losses and jitter with the mentioned commands, which can be found in [35].
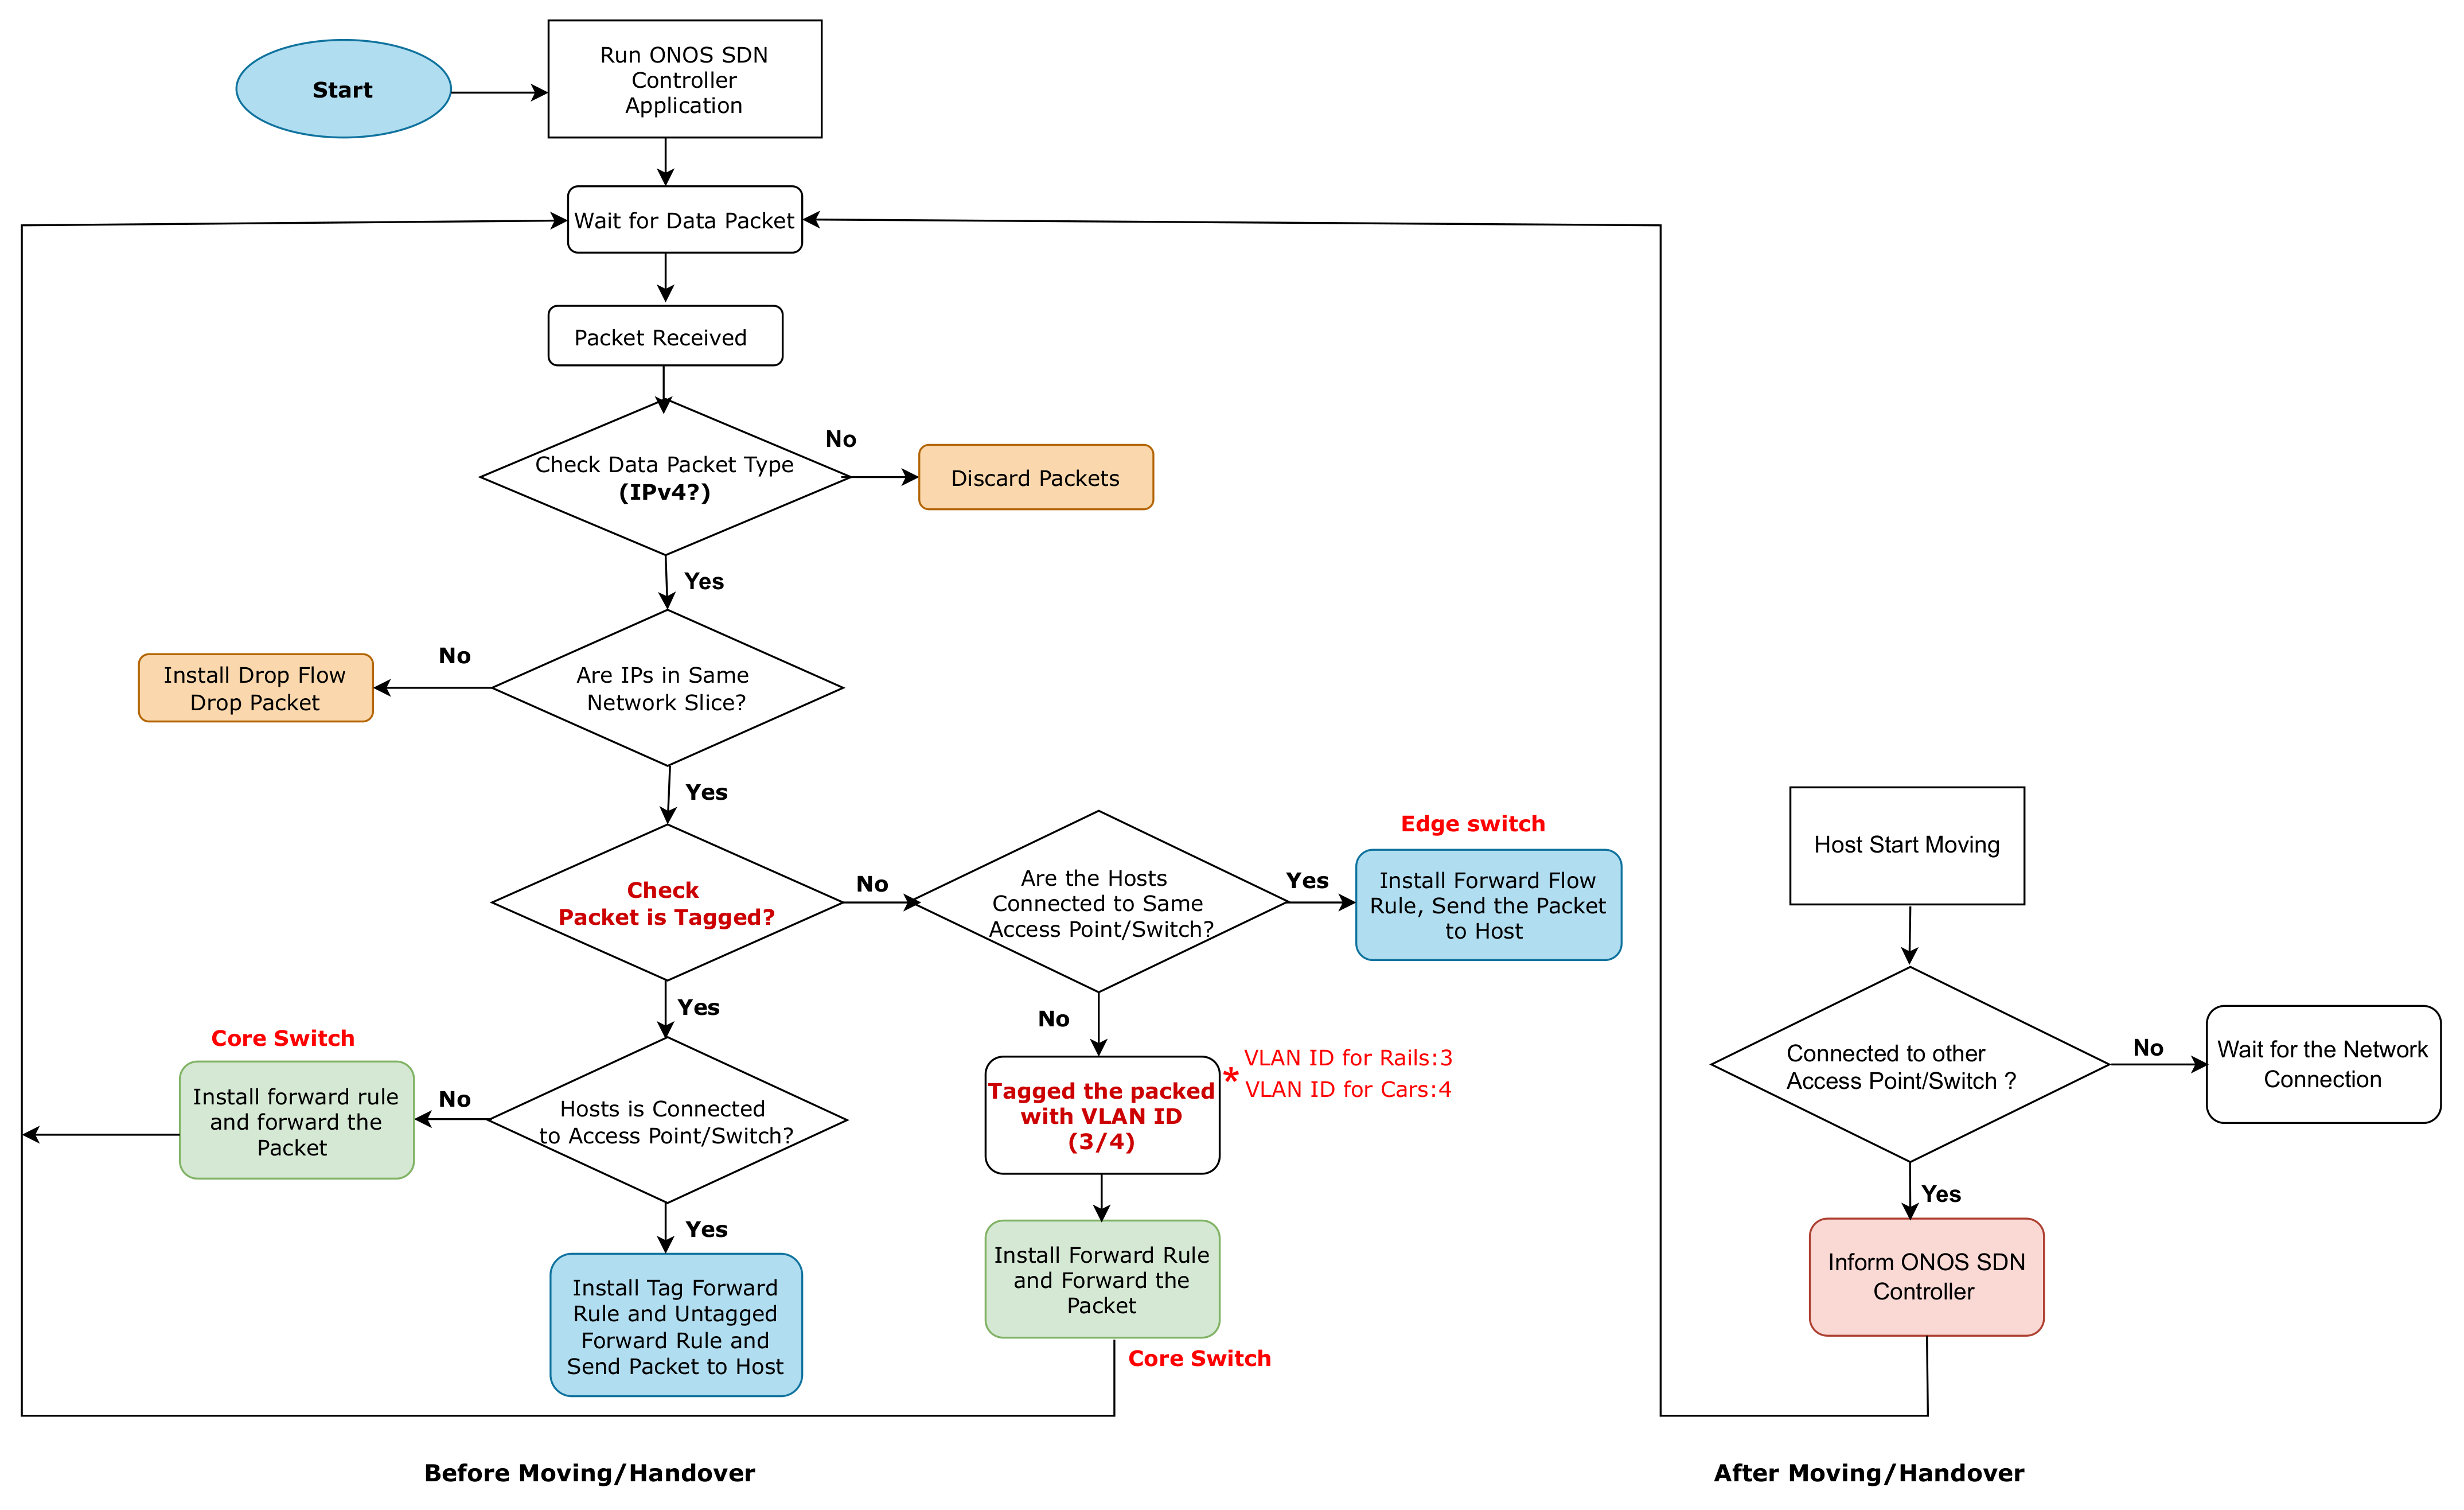
8. ONOS SDN Application for Data Traffic Slicing
- Supports handover/moving capability of nodes/hosts;
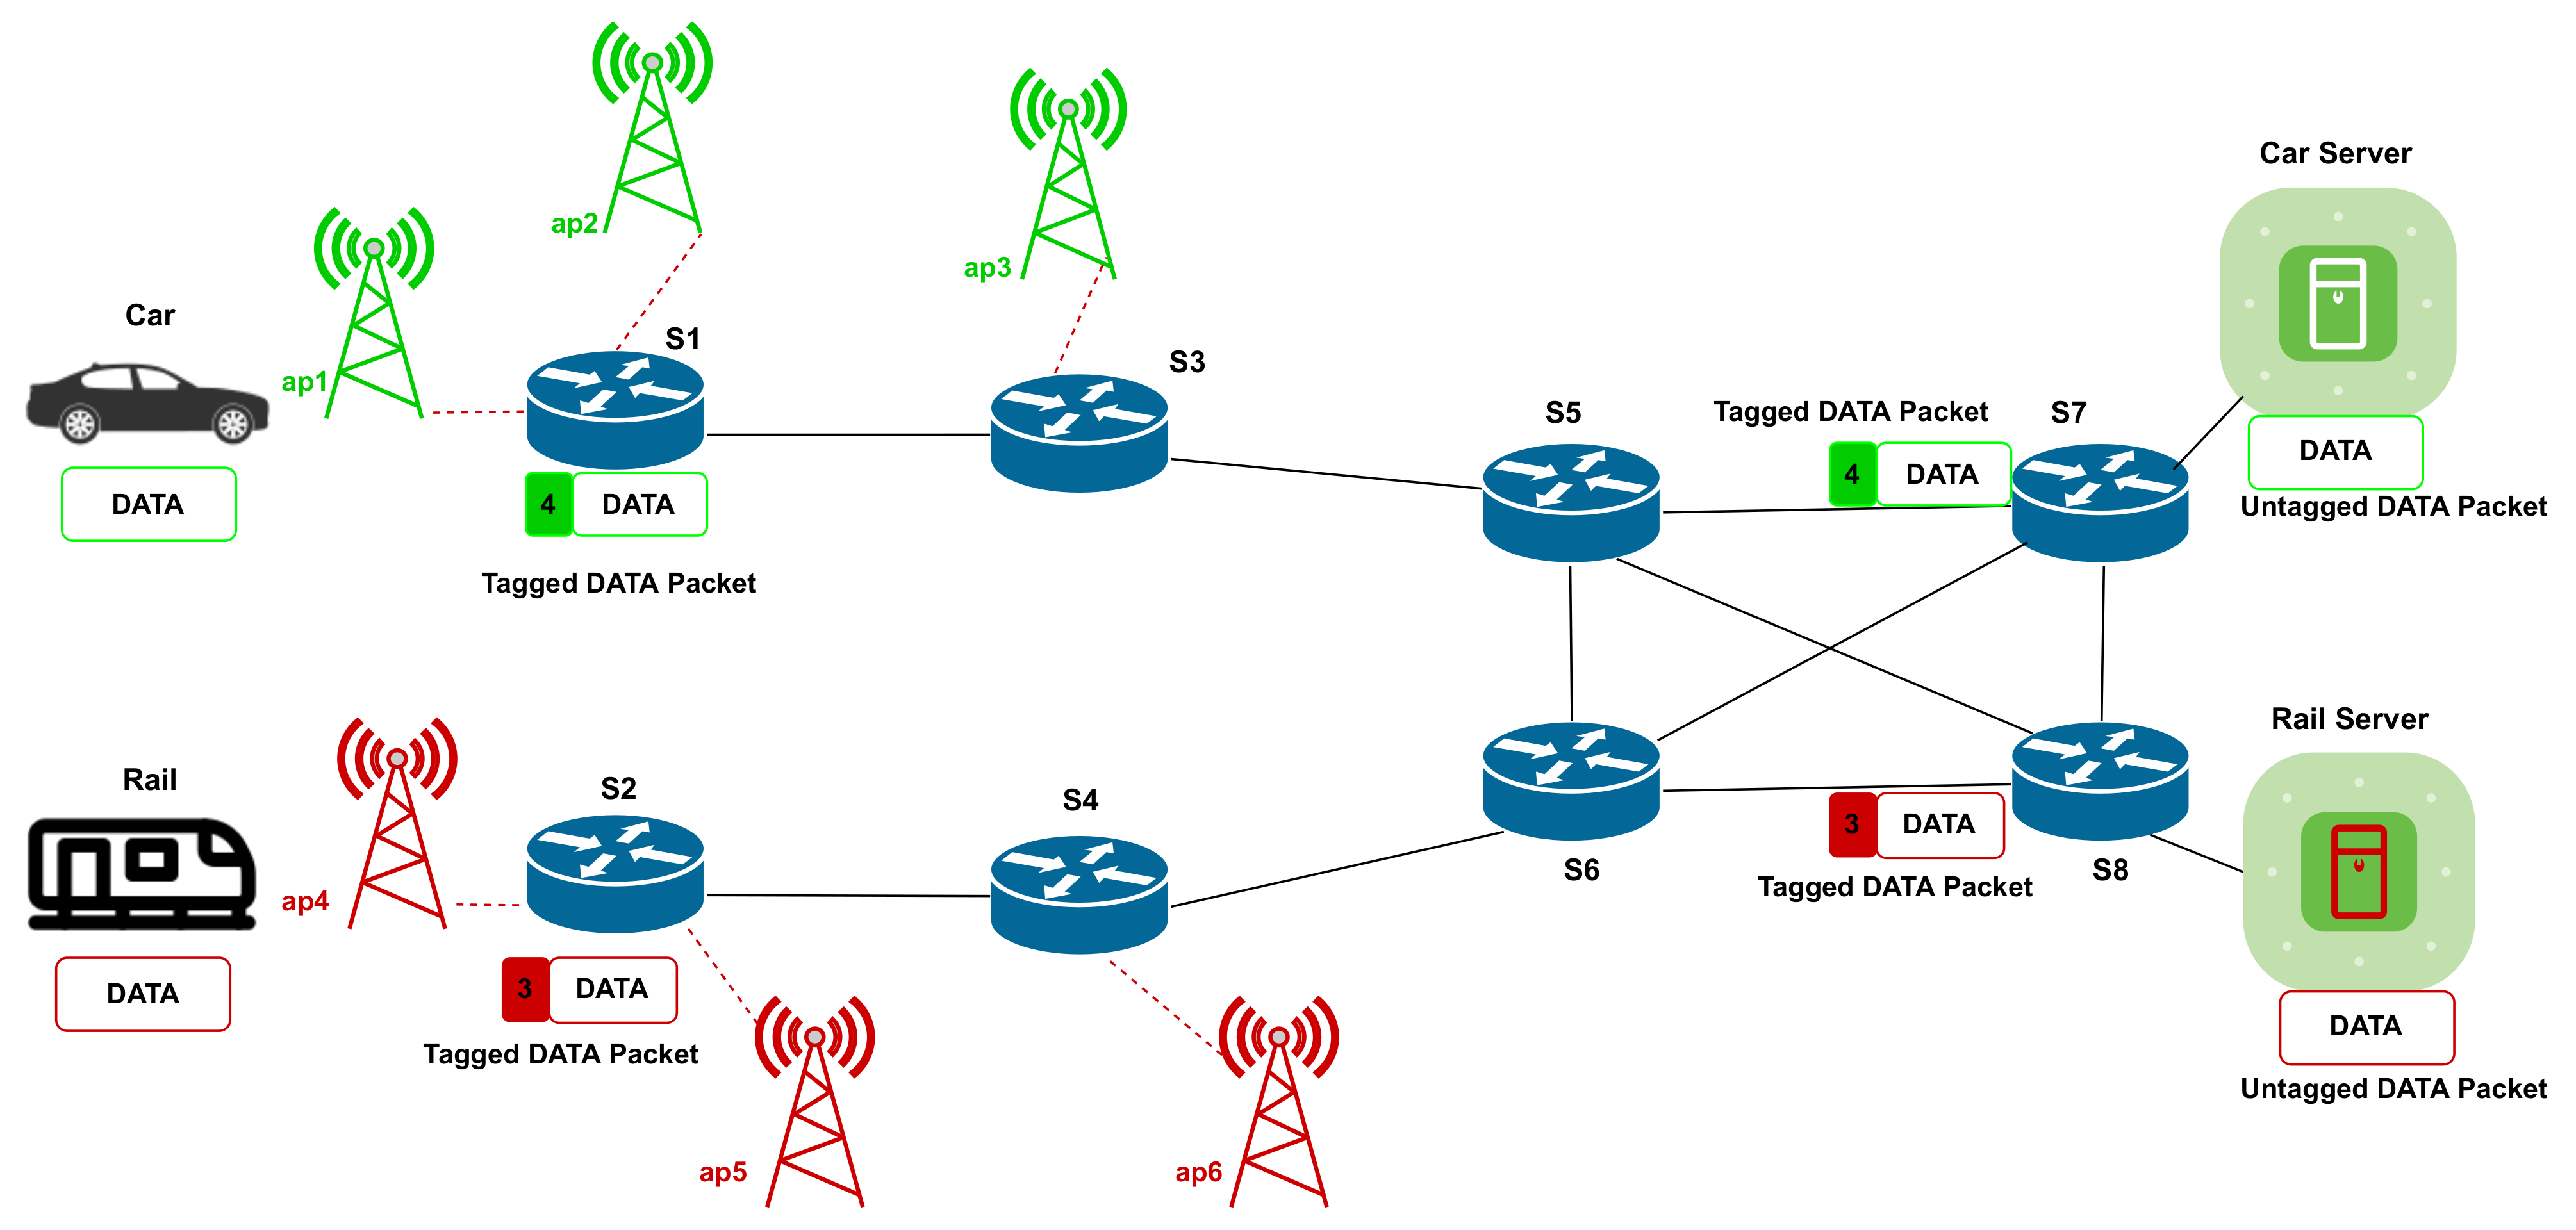
- Differentiates the data traffic based on VLAN tagging/slicing;
- Is scalable to support any kind of network topology.
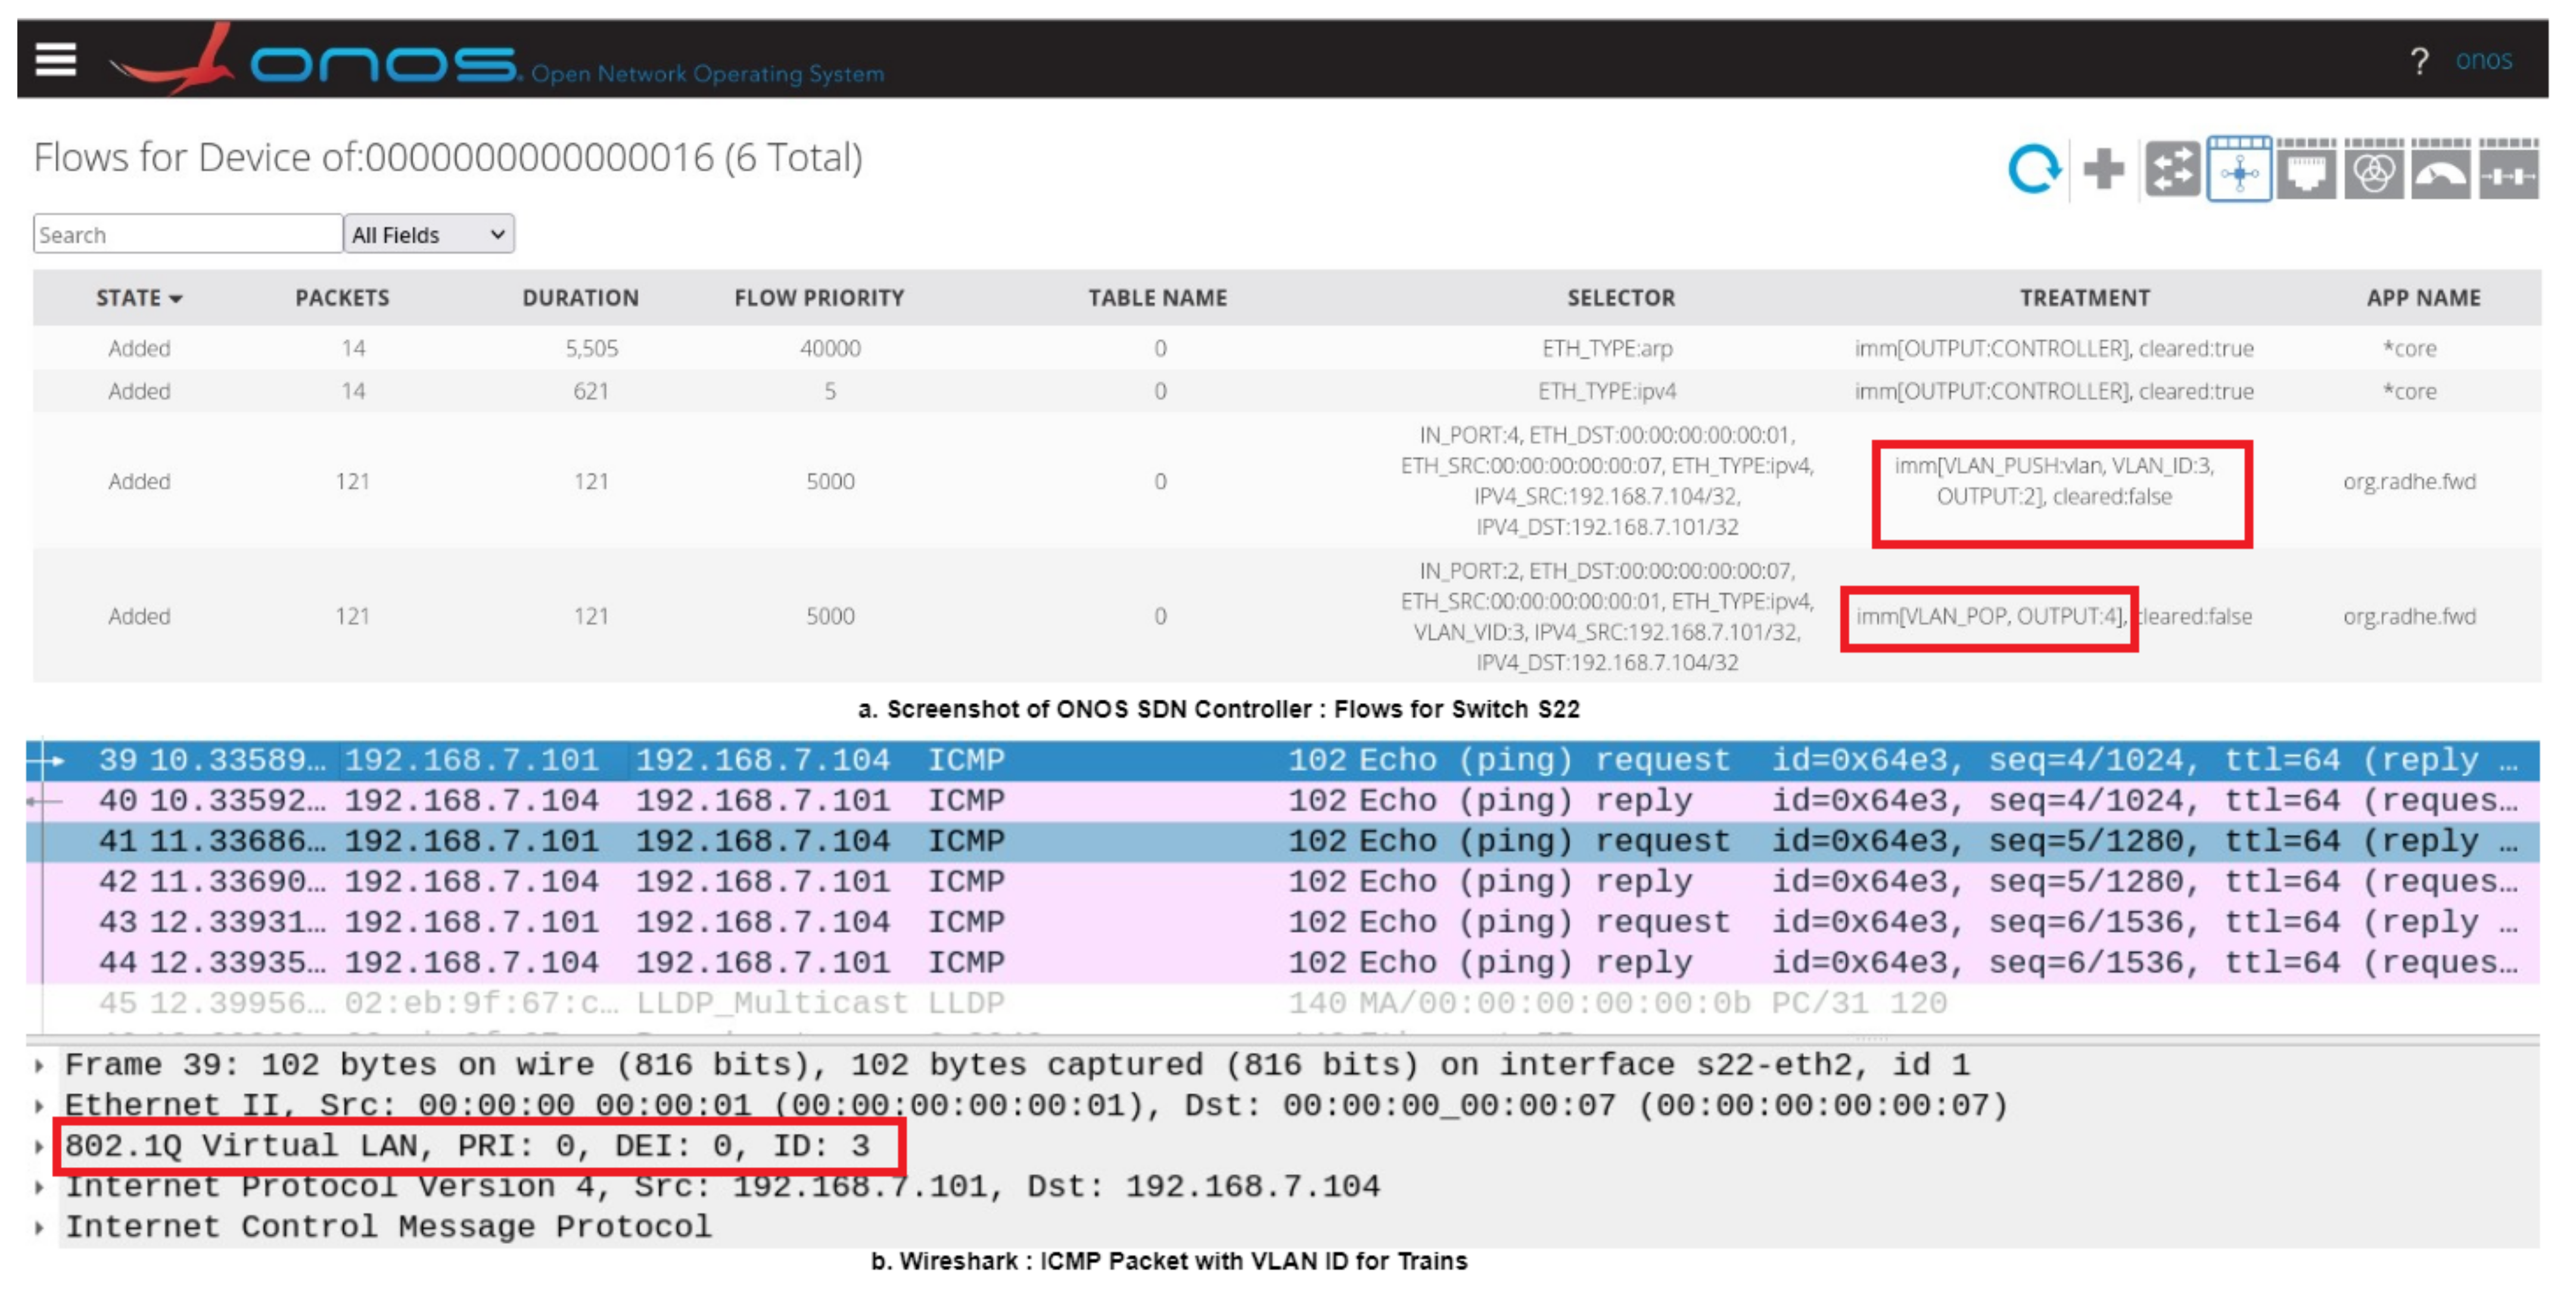
VLAN Tagging
9. Validation of Developed SDN Application and Selected Tools
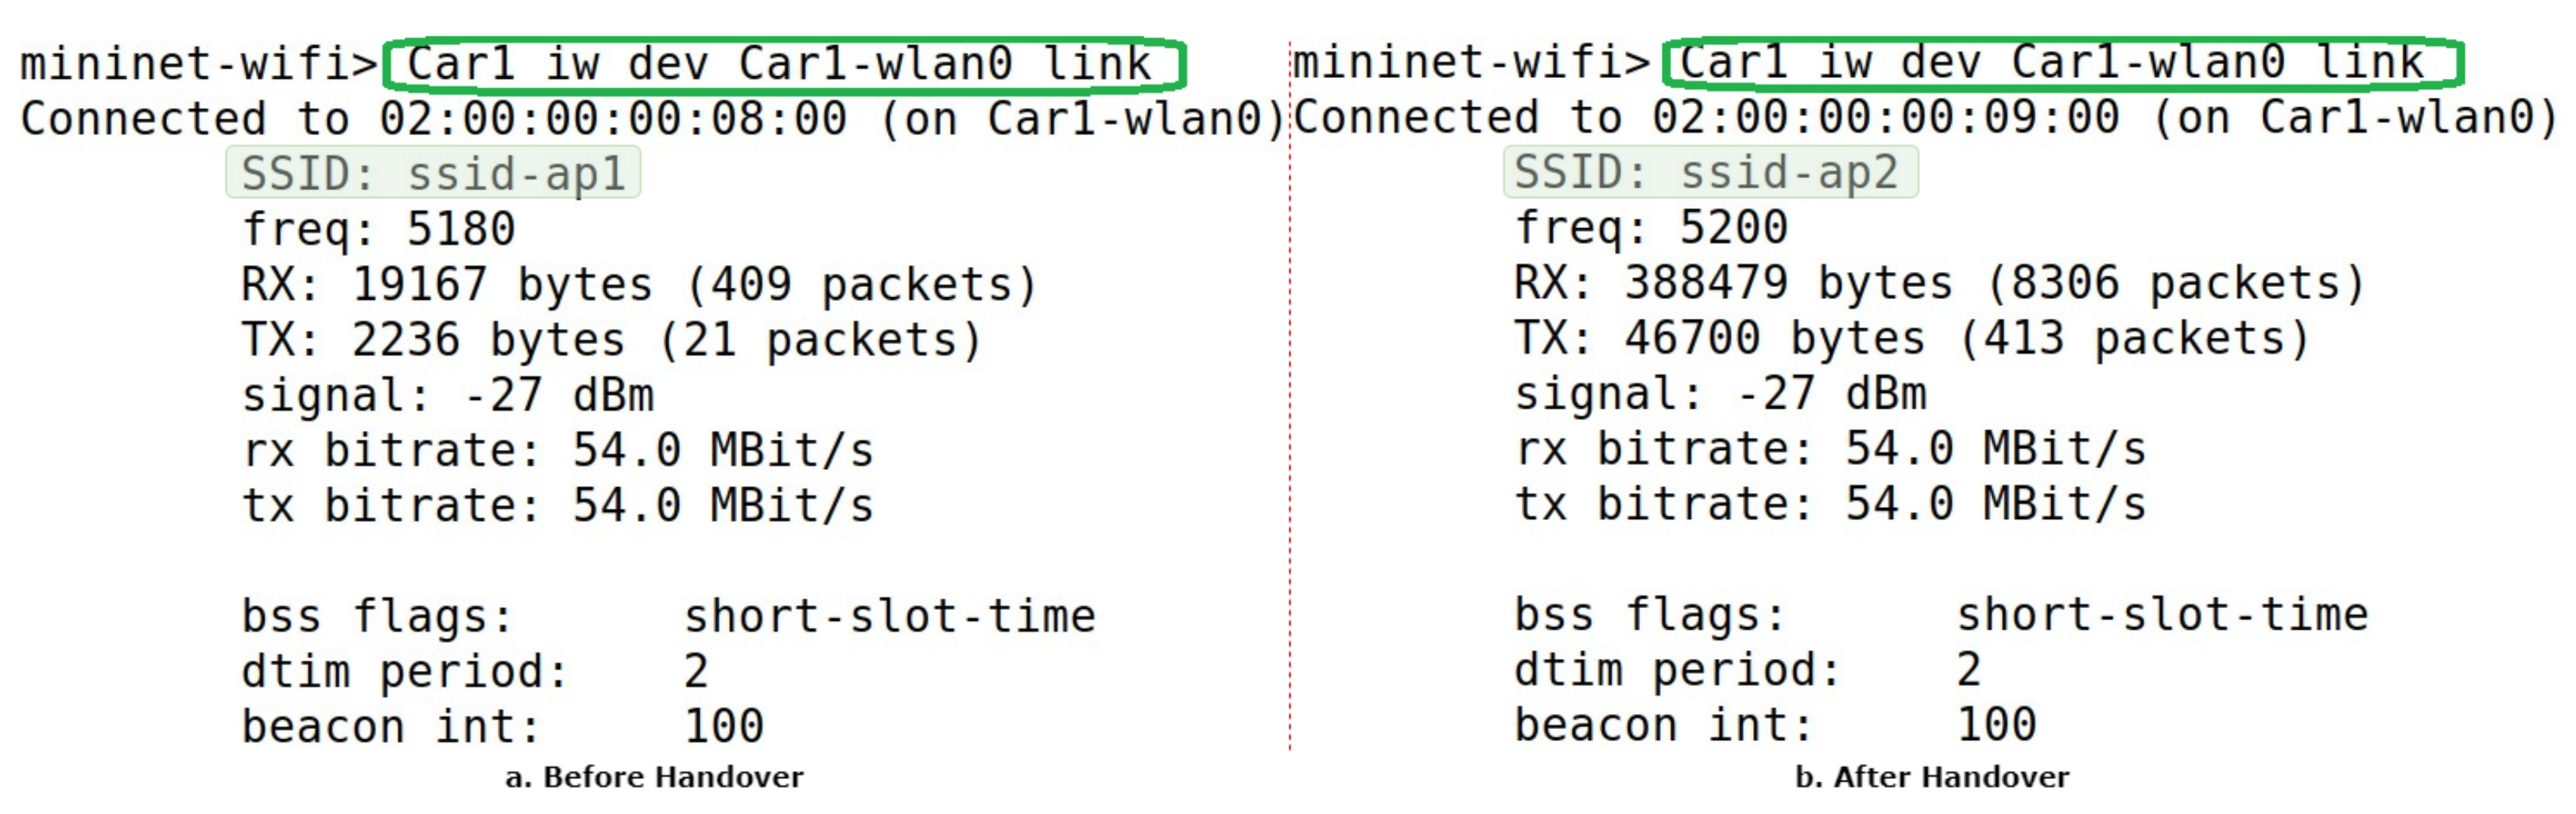
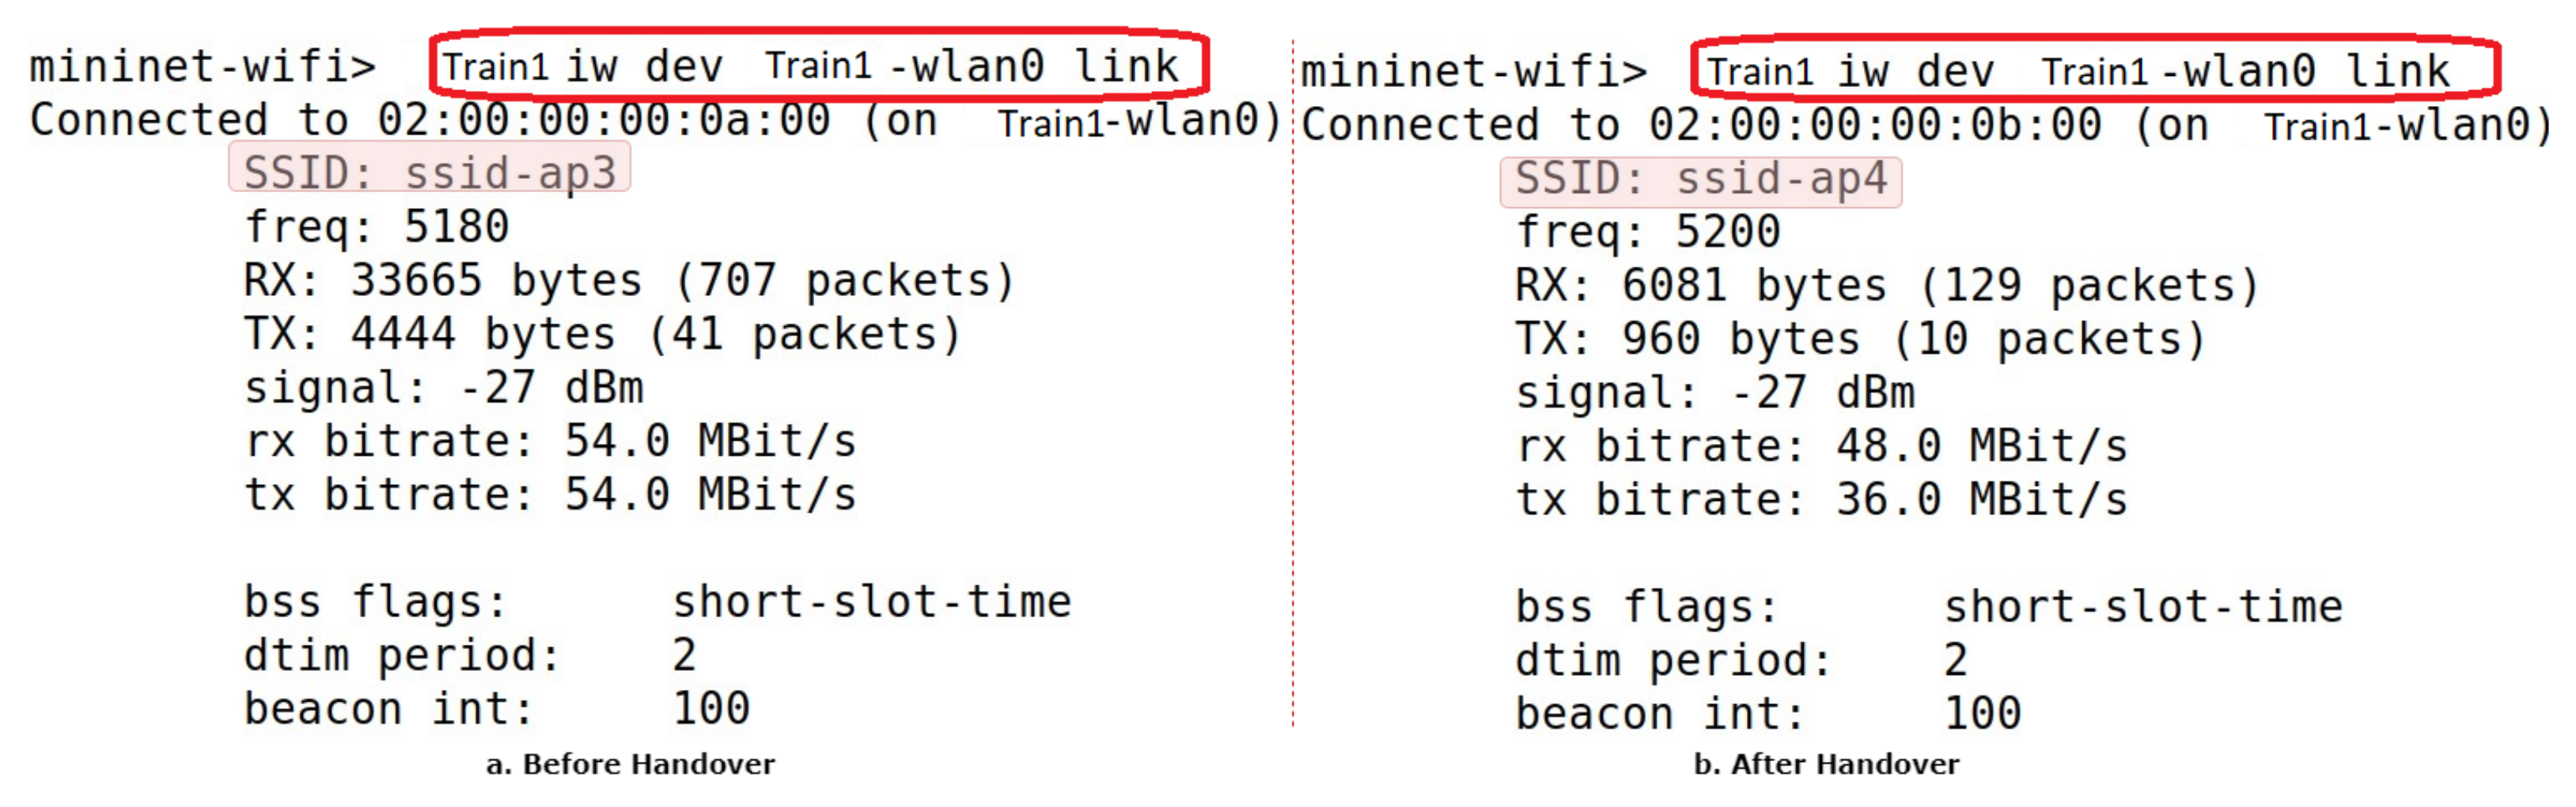
9.1. Handover/Mobility (Speed/Direction/Providing Coordinates)
| Listing 6. Defining the Host With Their Moving Speeds. |
| Train1 = net.addStation(’Train1’, |
| mac=’00:00:00:00:00:01’, ip=’192.168.7.101/24’, speed=3) |
| Car1 = net.addStation(’Car1’, |
| mac=’00:00:00:00:00:02’, ip=’192.168.0.201/24’, speed=3) |
| Listing 7. Defining Moving Functionality of Hosts. |
| if ’−s’ not in args: |
| net.startMobility(time=0) |
| net.mobility(Train1, ’start’, time=60, position=’30,10,0’) |
| net.mobility(Car1, ’start’, time=60, position=’30,320,0’) |
| net.mobility(Train1, ’stop’, time=70, position=’380,60,0’) |
| net.mobility(Car1, ’stop’, time=70, position=’350,250,0’) |
| net.stopMobility(time=75) |
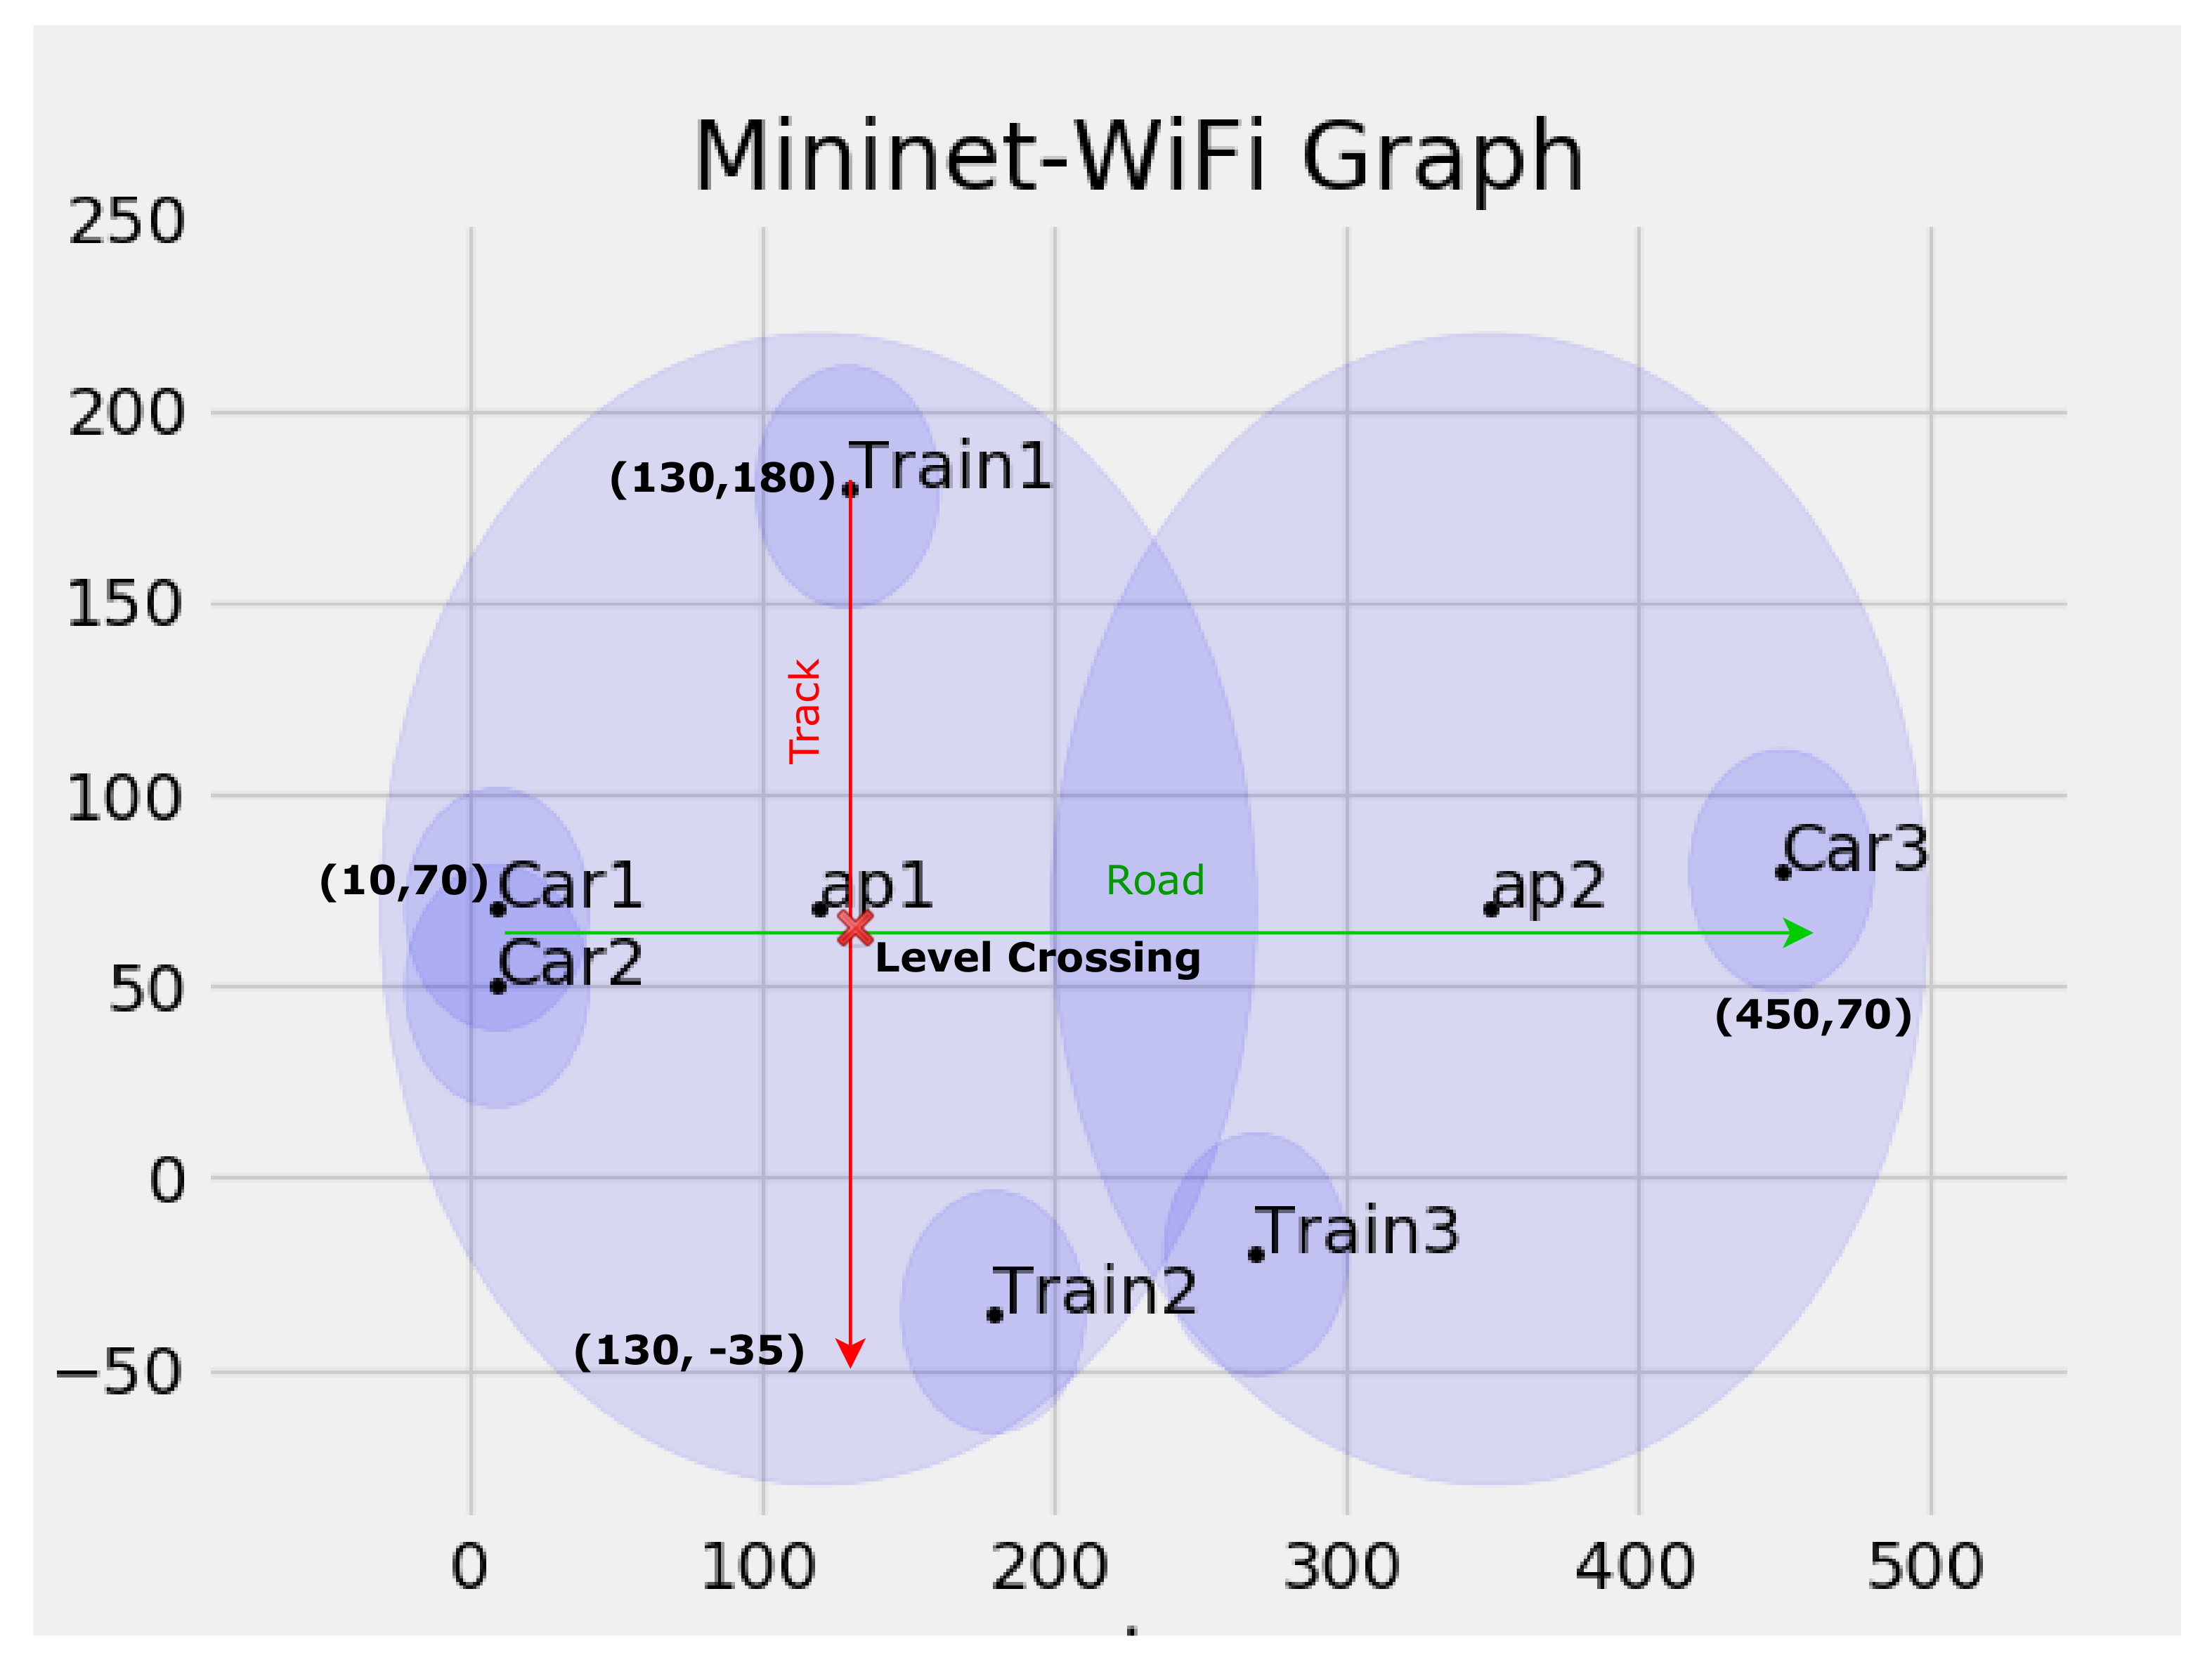
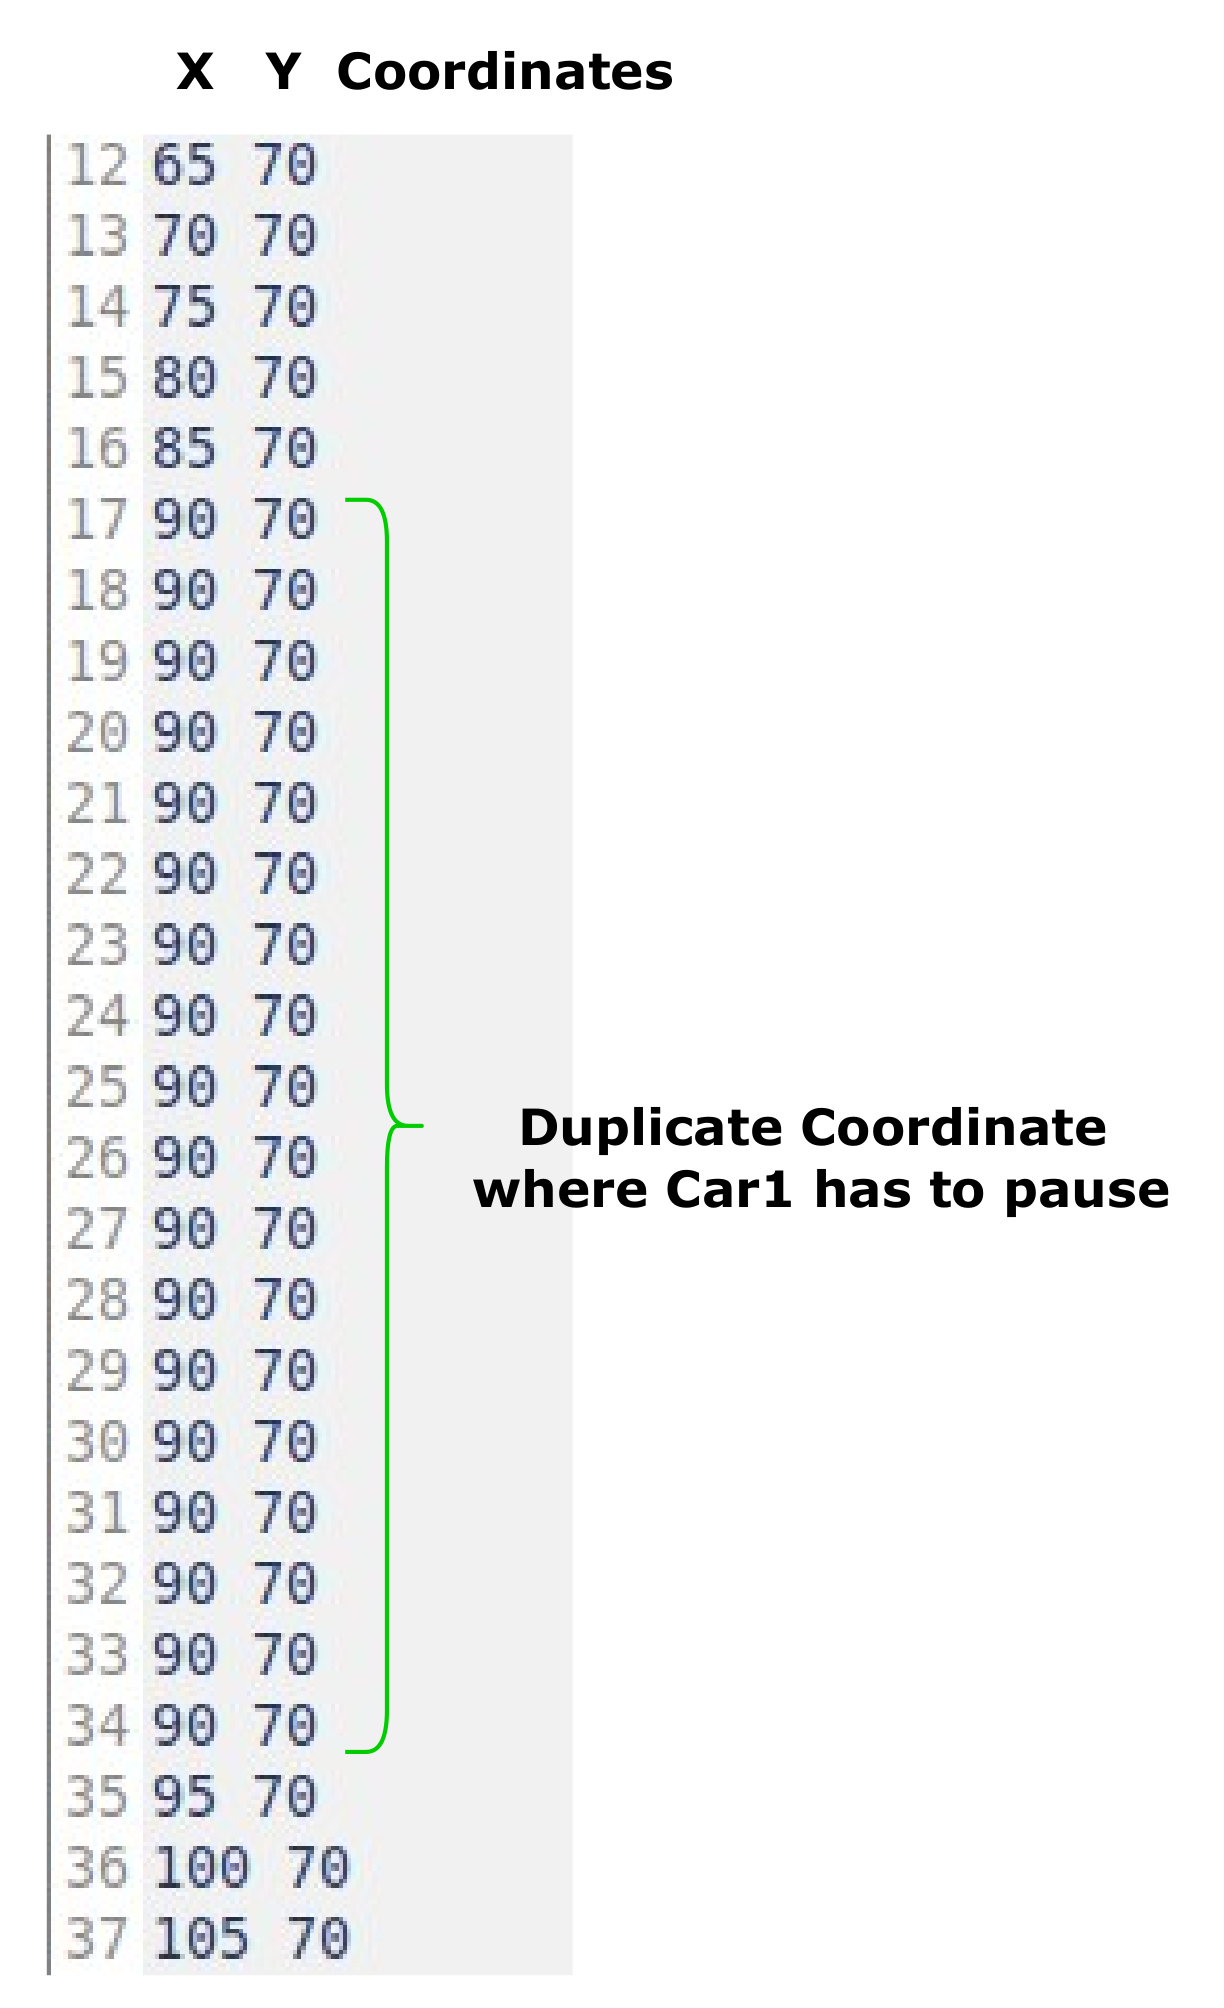
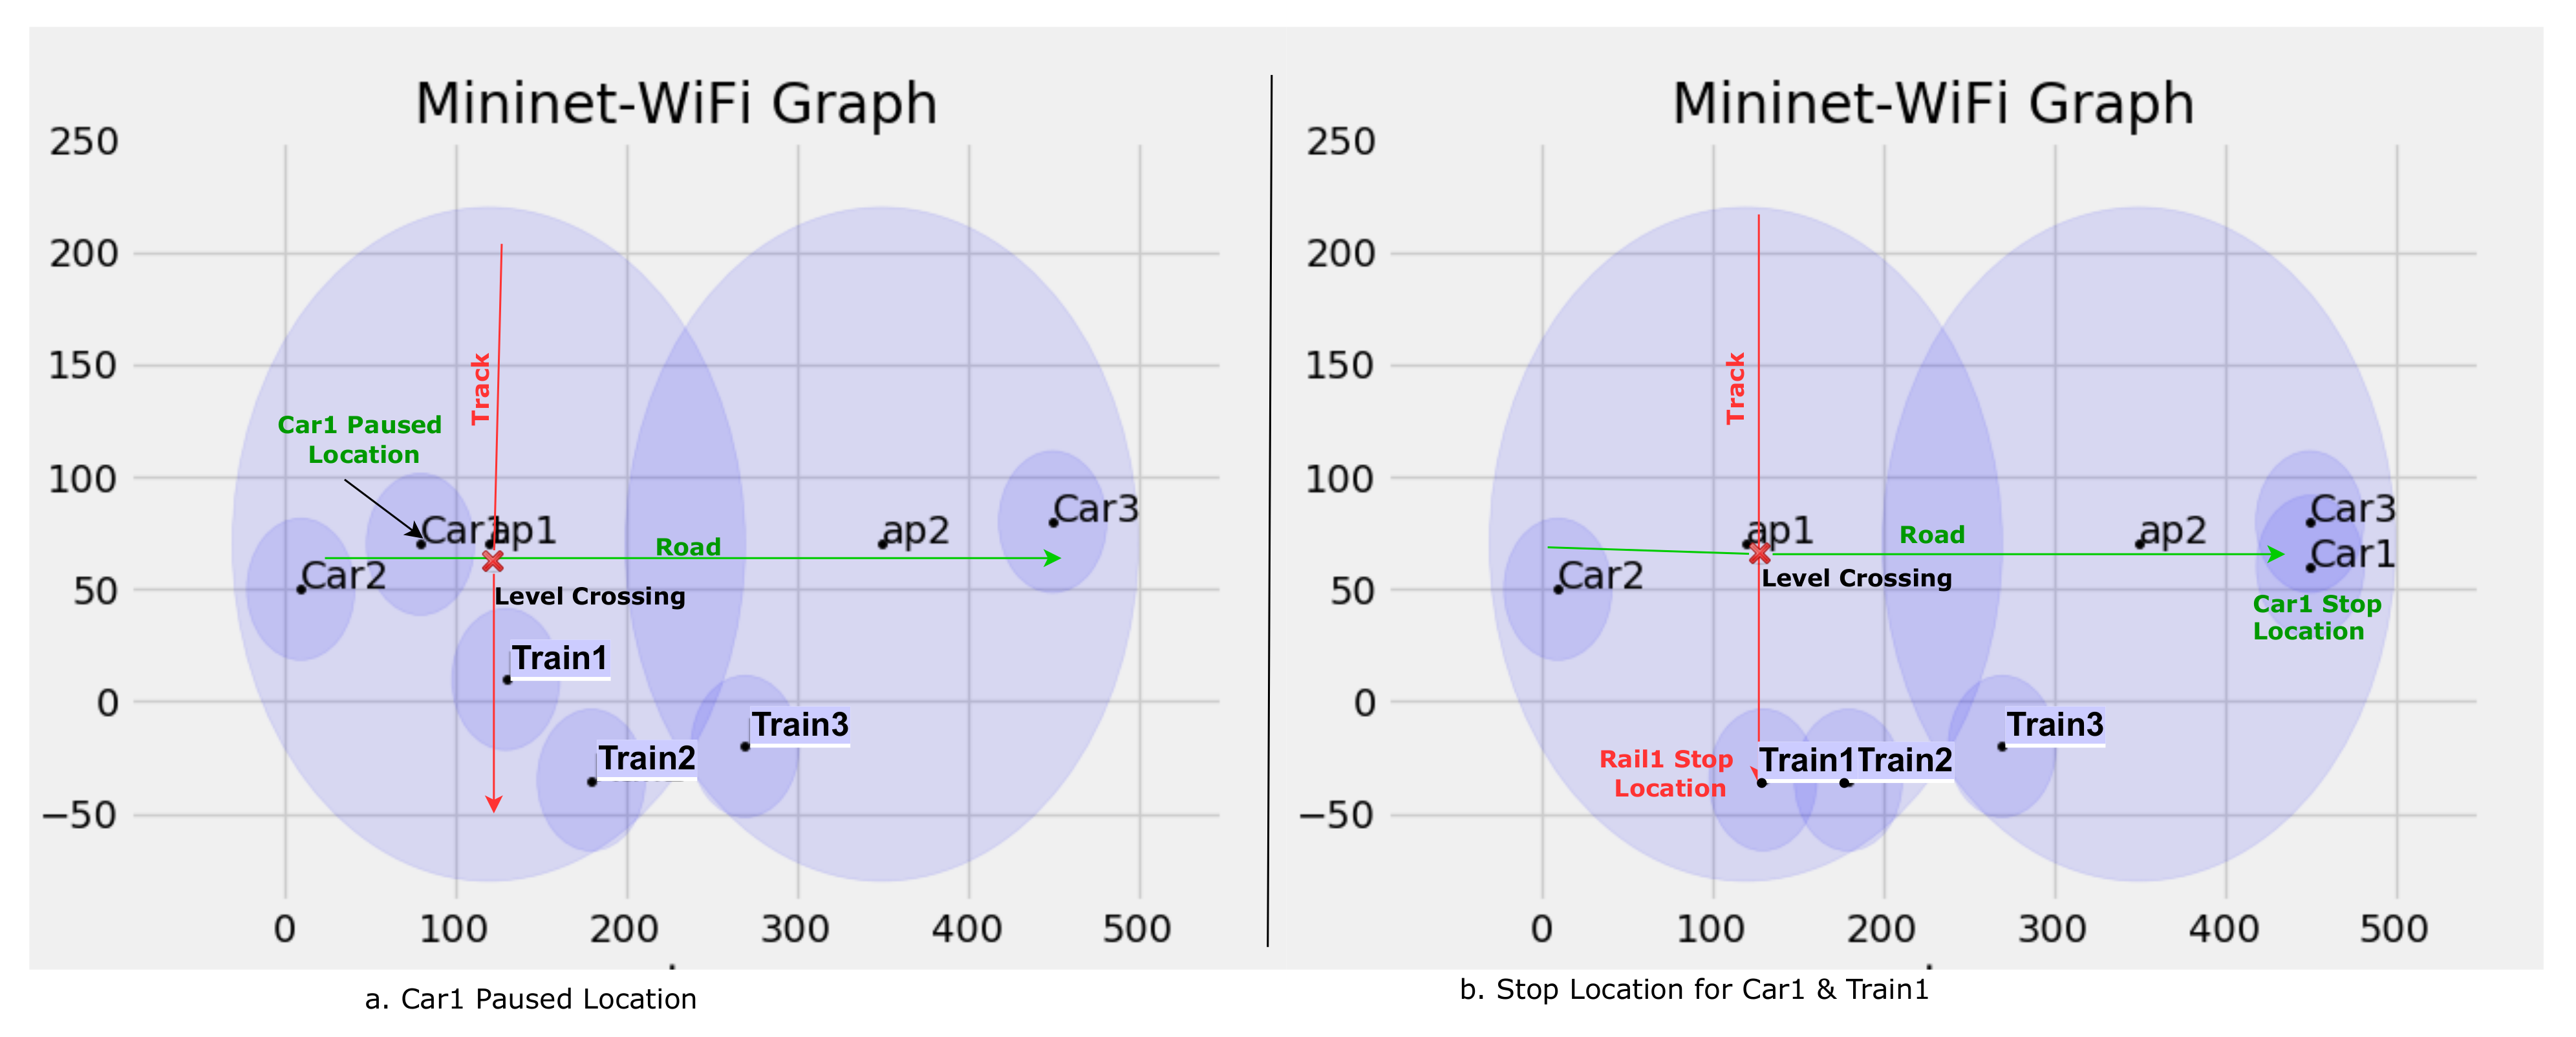
9.2. Level Crossing
| Listing 8. Defining Moving Functionality of Hosts. |
| net.isReplaying = True |
| path = os.path.dirname(os.path.abspath(_ _file_ _)) |
| + ’/replayingMobility/’ |
| get_trace(Car1, ’{} node1.dat’.format(path)) |
| get_trace(Car2, ’{} node2.dat’.format(path)) |
| get_trace(Car3, ’{} node3.dat’.format(path)) |
| get_trace(Train1, ’{}node4.dat’.format(path)) |
| get_trace(Train2, ’{}node5.dat’.format(path)) |
| get_trace(Train3, ’{}node6.dat’.format(path)) |
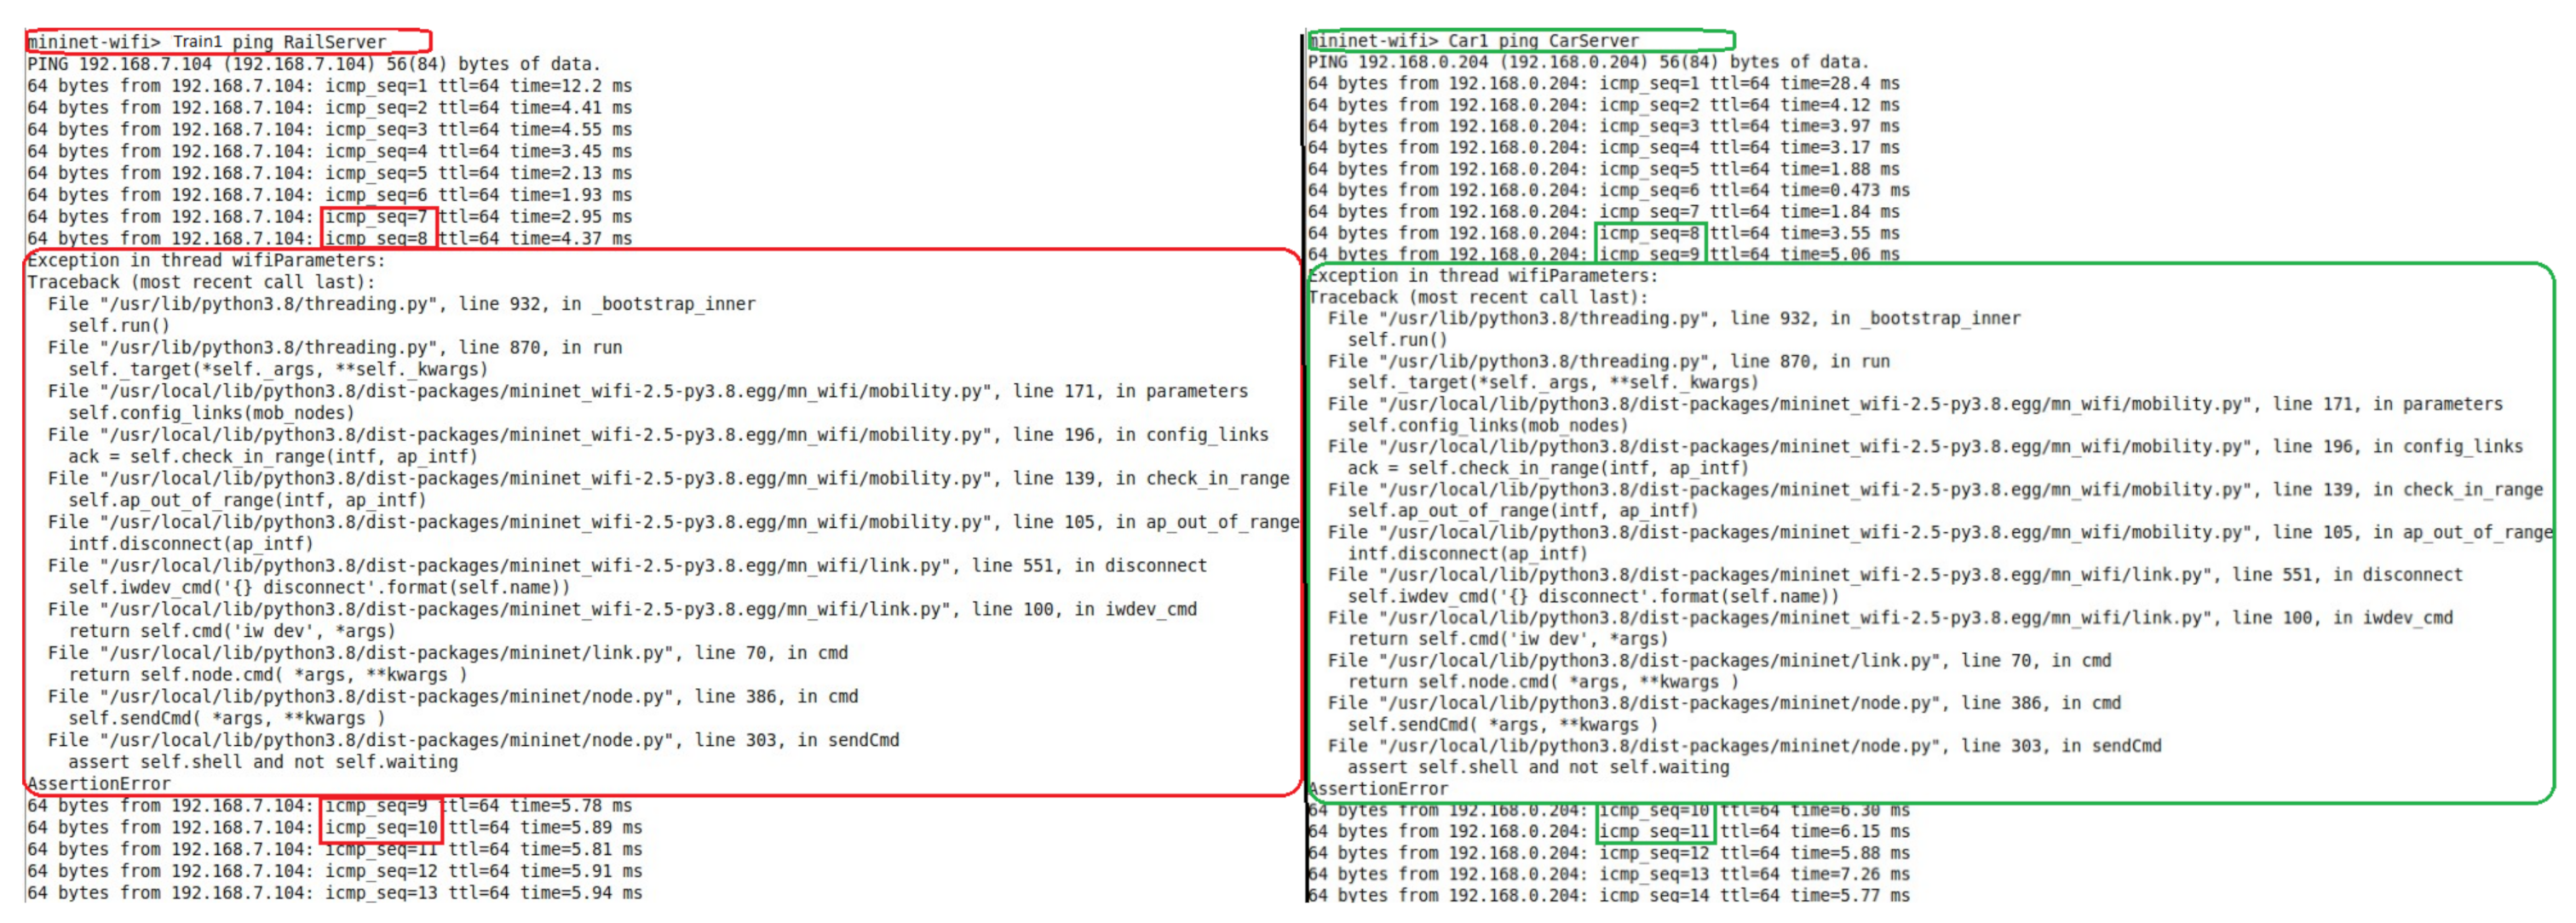
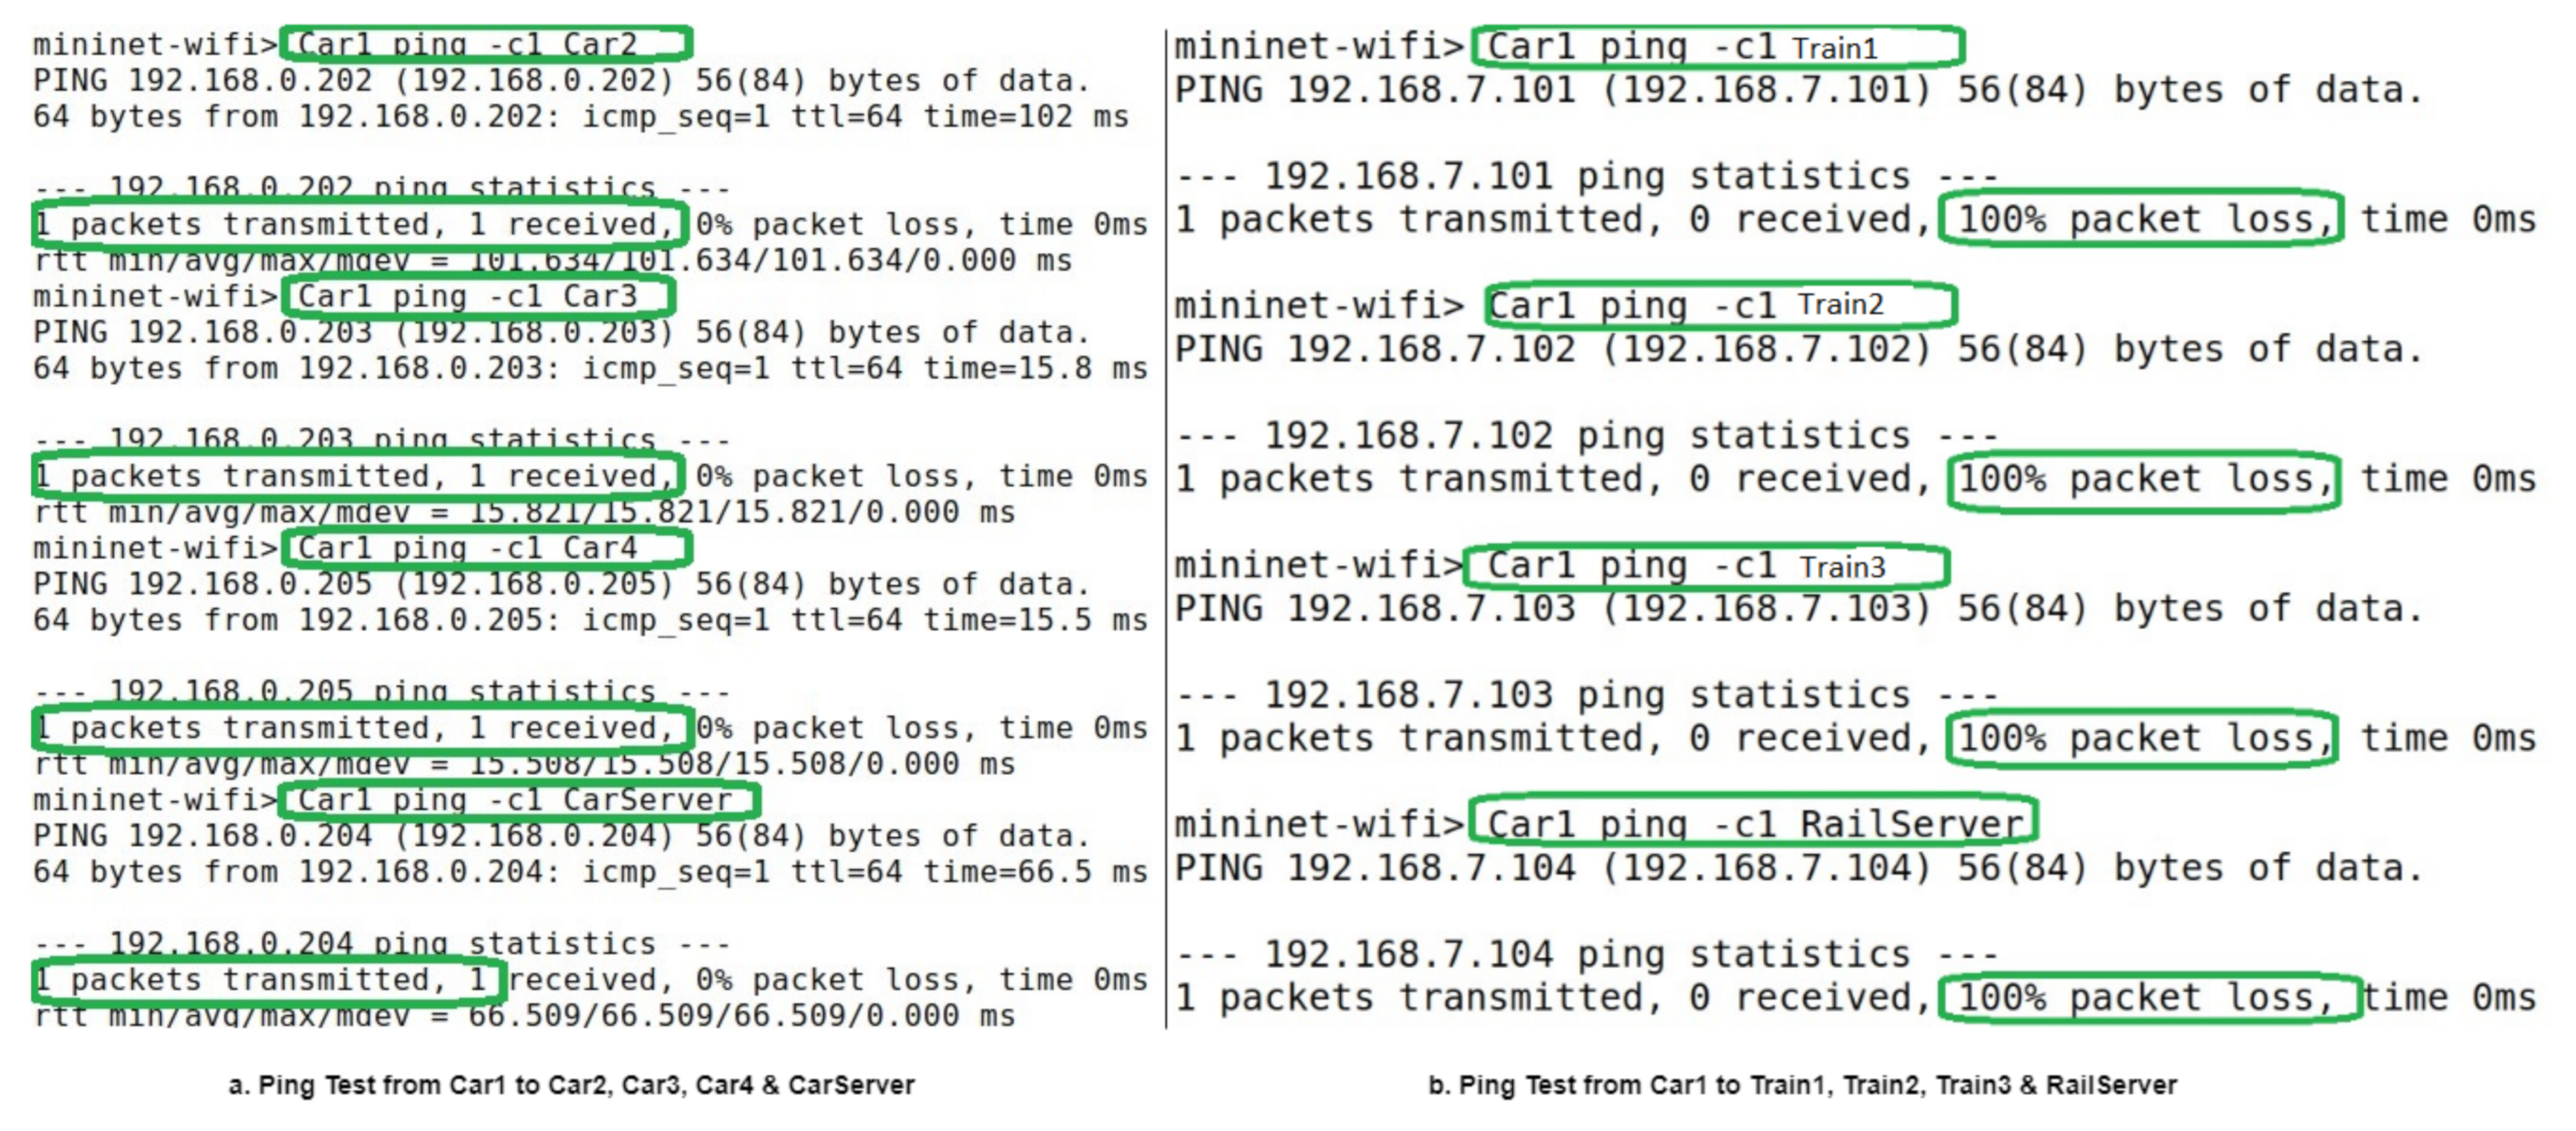
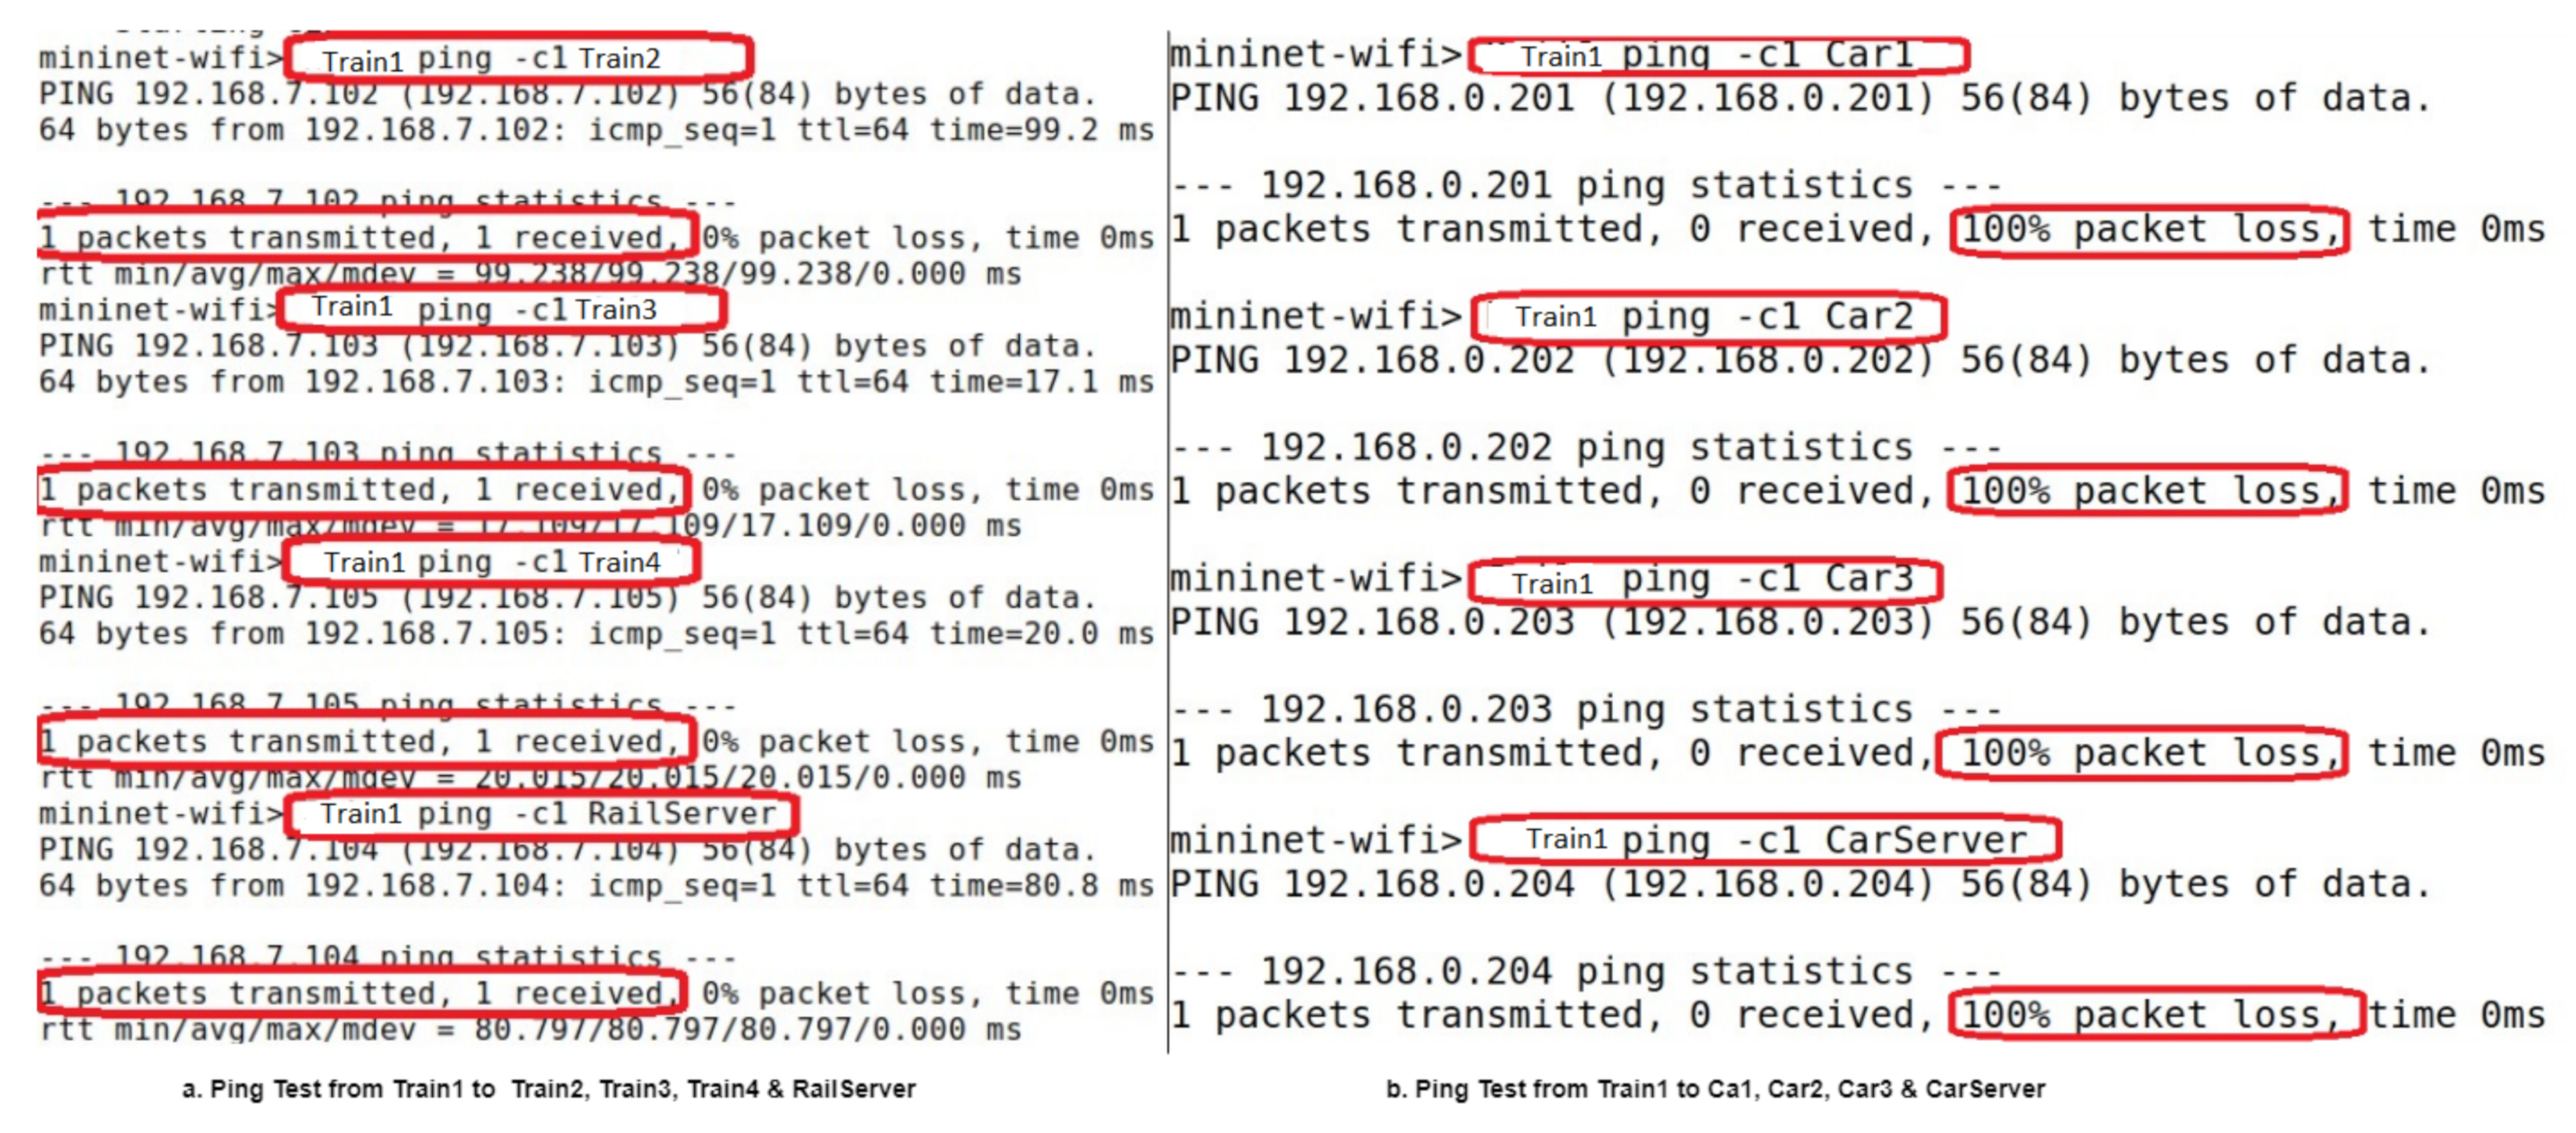
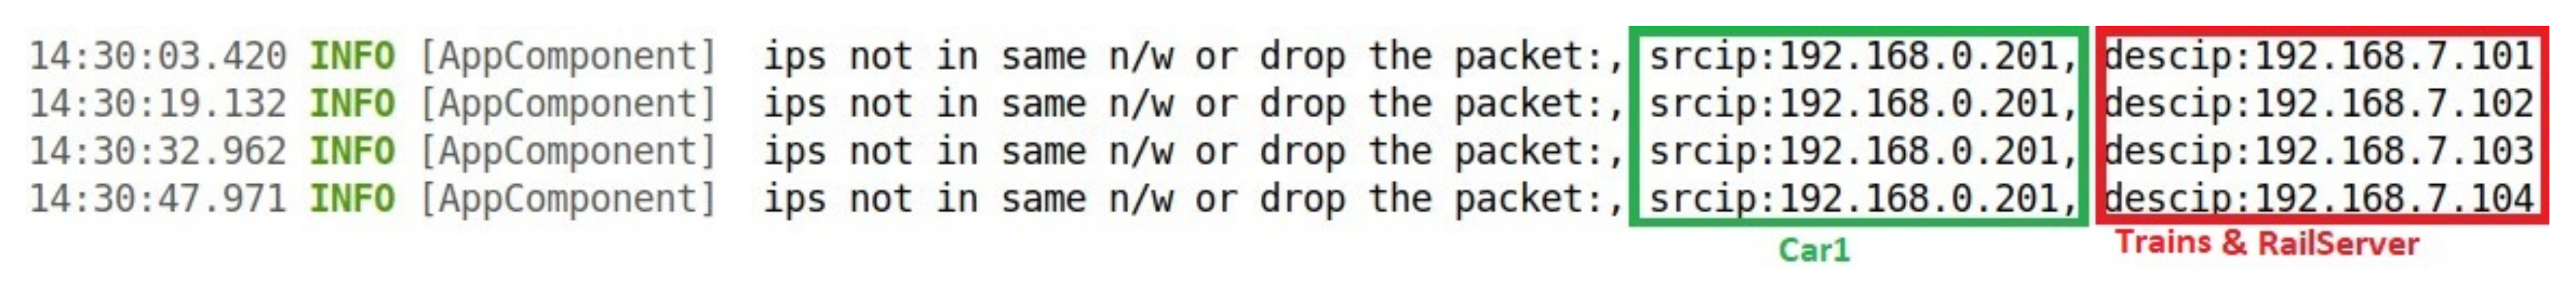
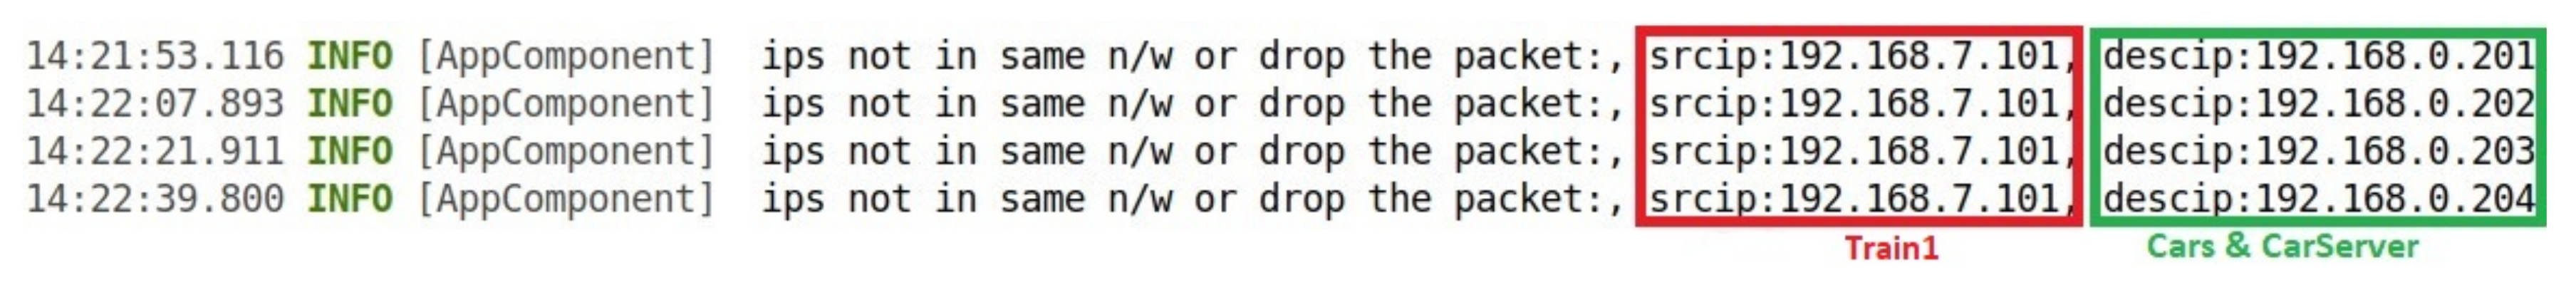
9.3. Reachability Test and Data Traffic Differentiation
9.4. TCP and UDP Data Transmission
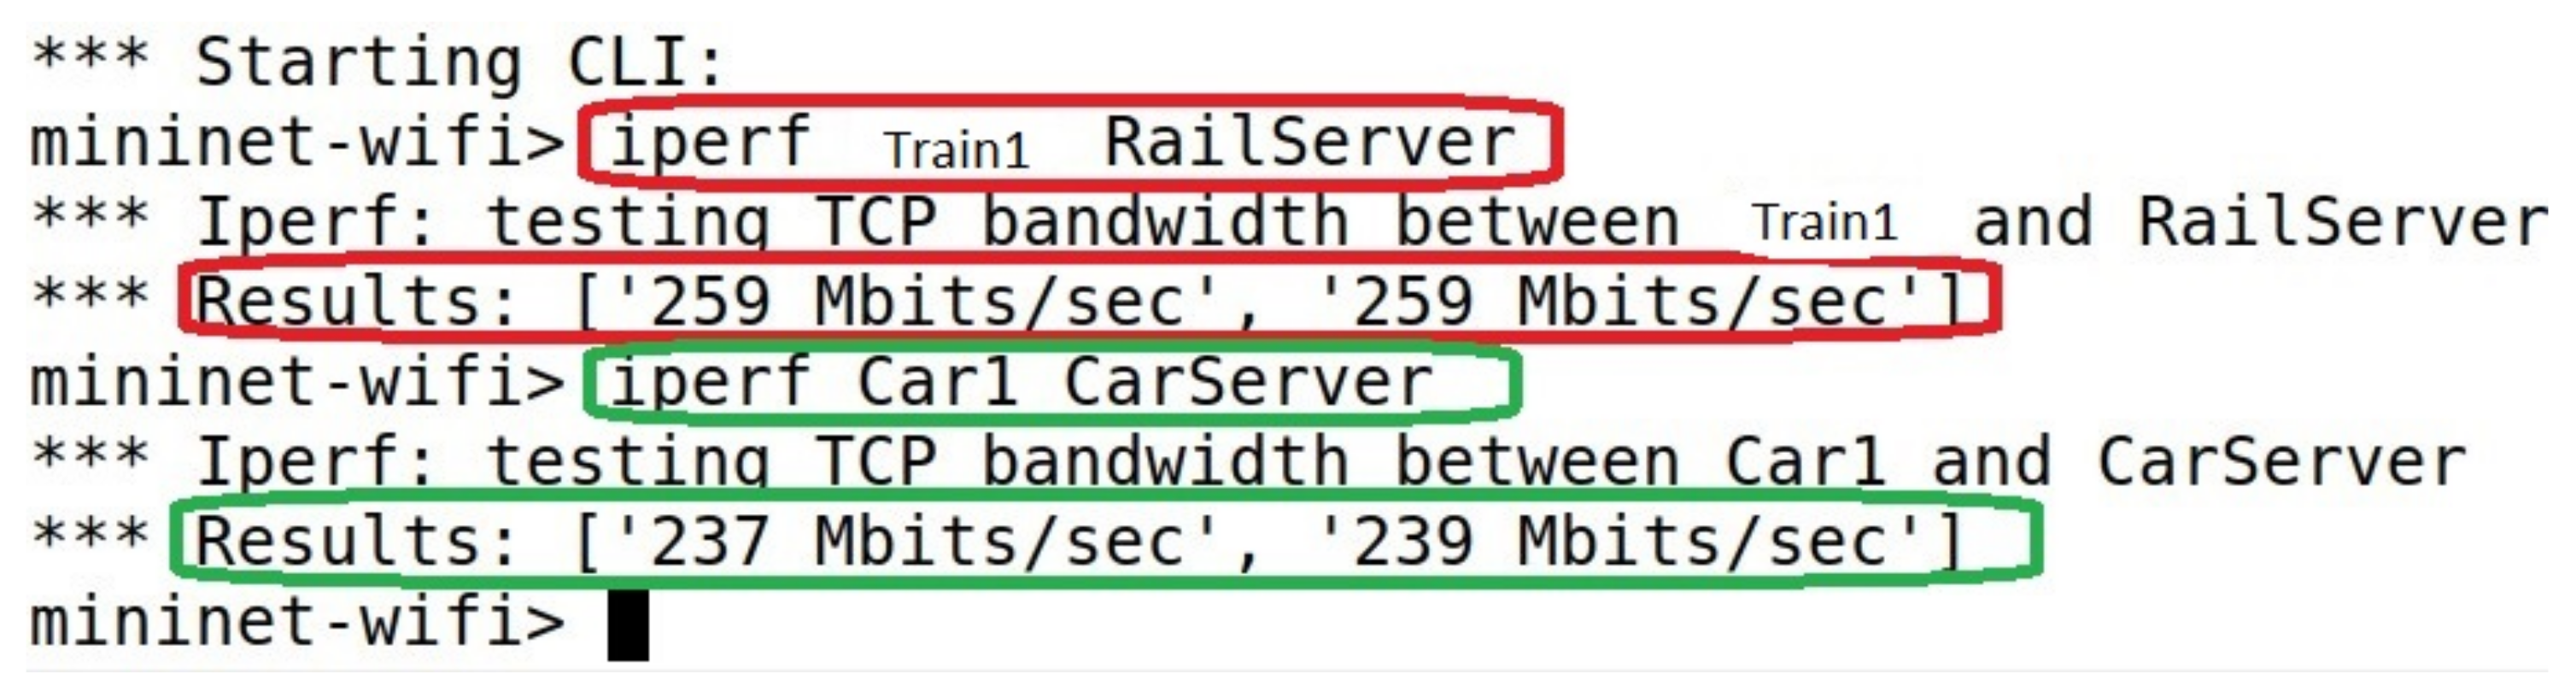
9.5. Link Capacity Test
9.6. Latency Test and Network Jitter Test
9.7. Sending a Critical Message to the Assigned Server
| Listing 9. Sending a Critical Message Using Scapy with Python. |
| #! /usr/bin/env python |
| # The following line will import all Scapy modules |
| from scapy.all import ∗ |
| i = 1 |
| while i < 50: |
| send(IP(src=‘ ‘192.168.7.101’ ’ ,dst=‘ ‘192.168.7.104’ ’)/ICMP() |
| /‘ ‘Emergency_Msg:Engine_Failure’ ’) |
| i += 1 |
| print(‘ ‘Train1_is_sending_msg_to_RailServer’ ’) |
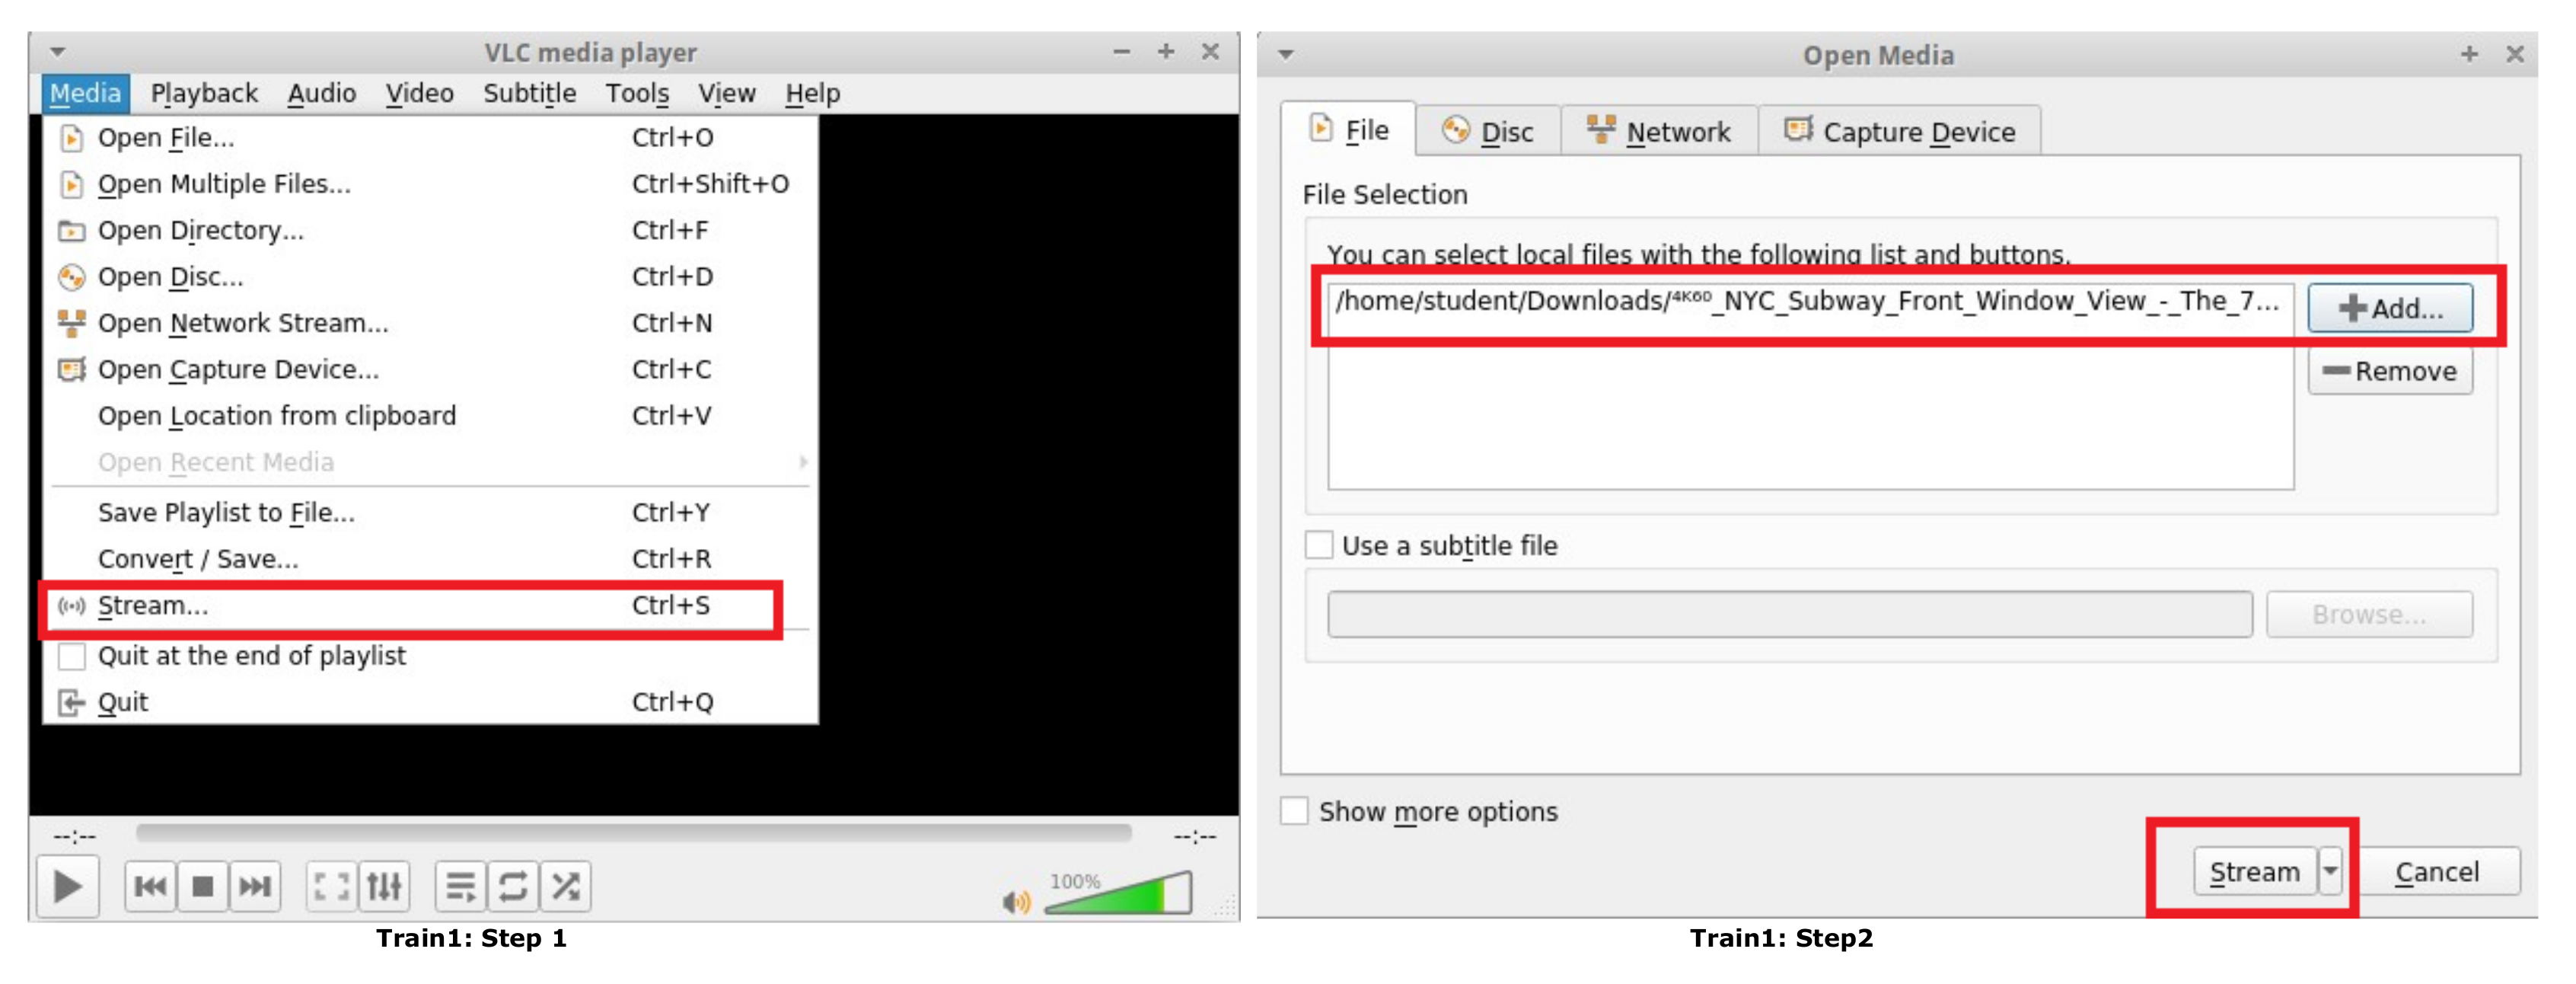
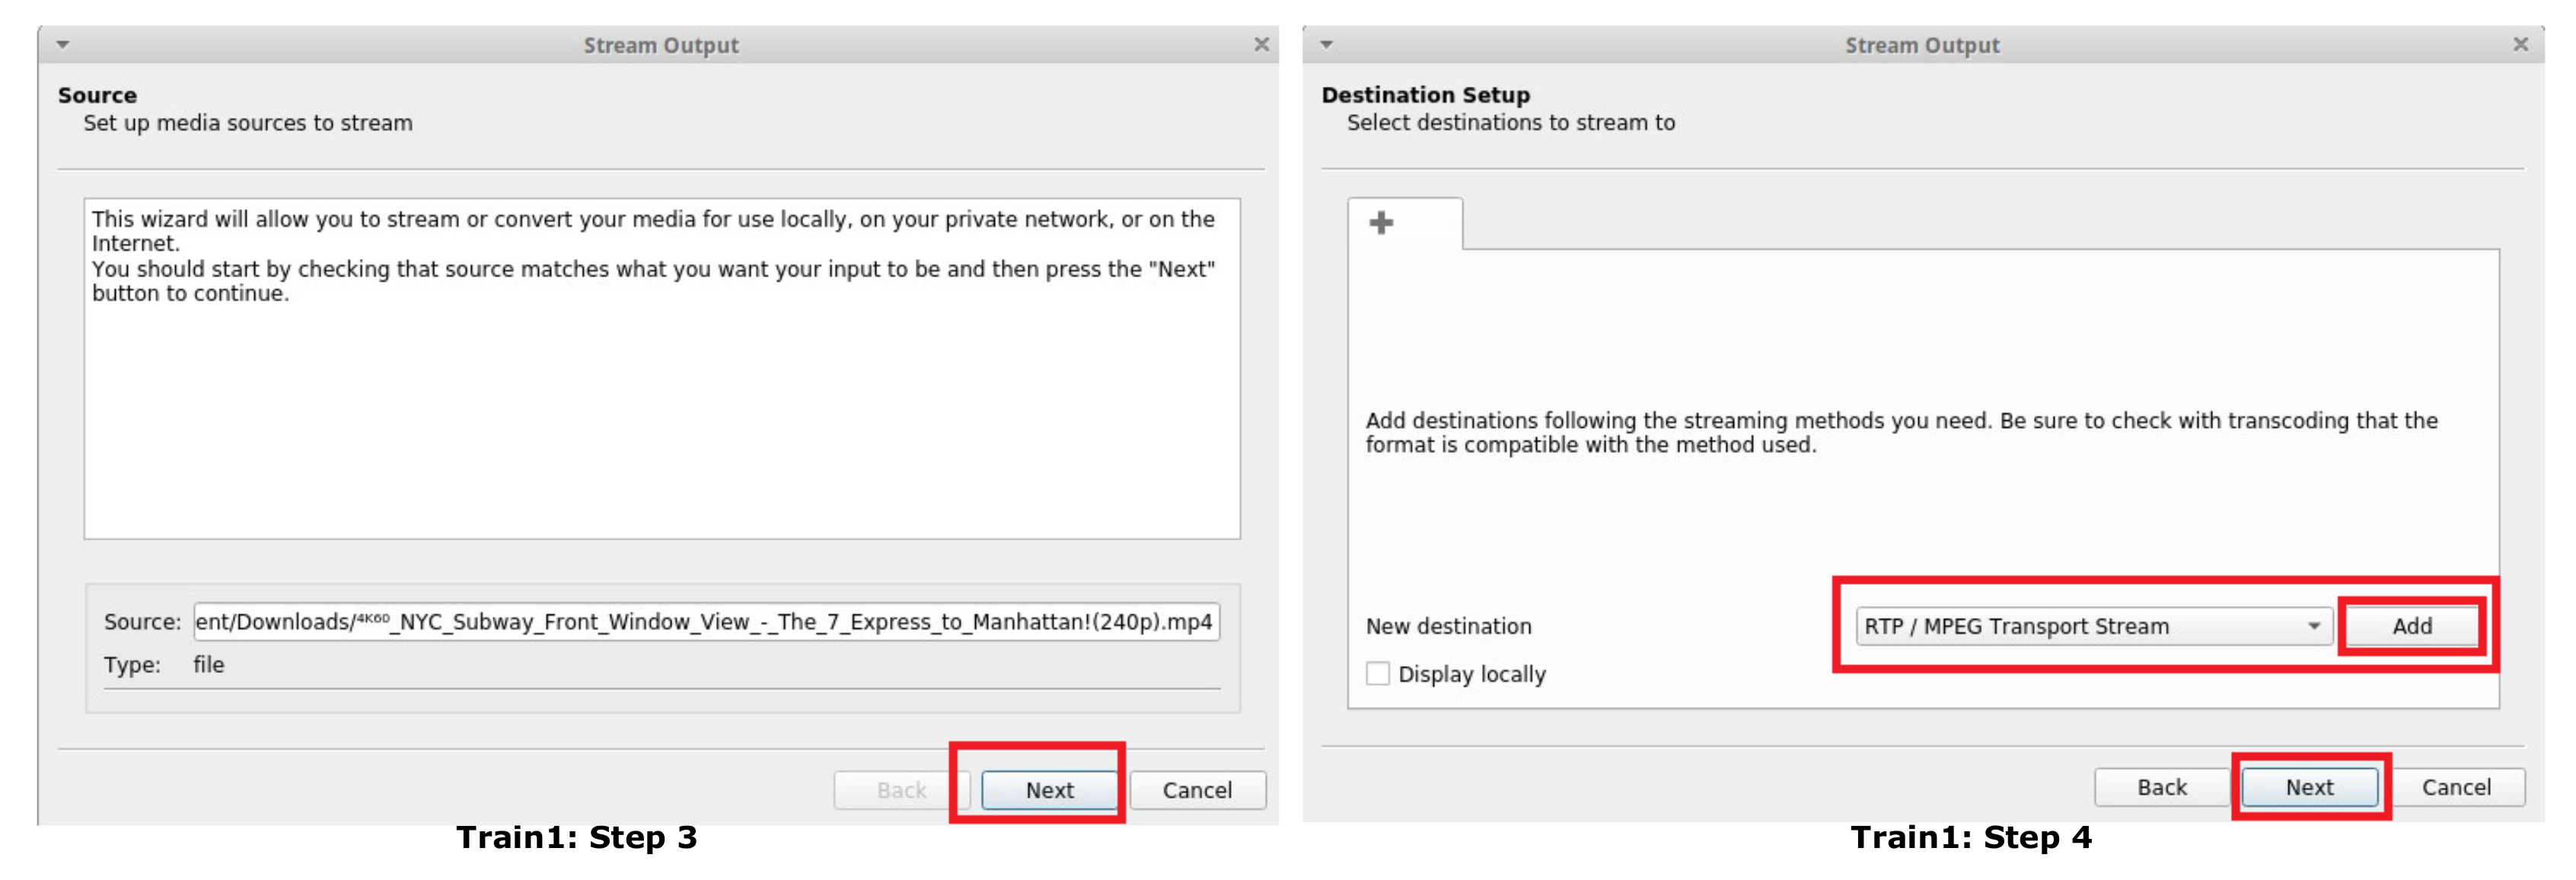
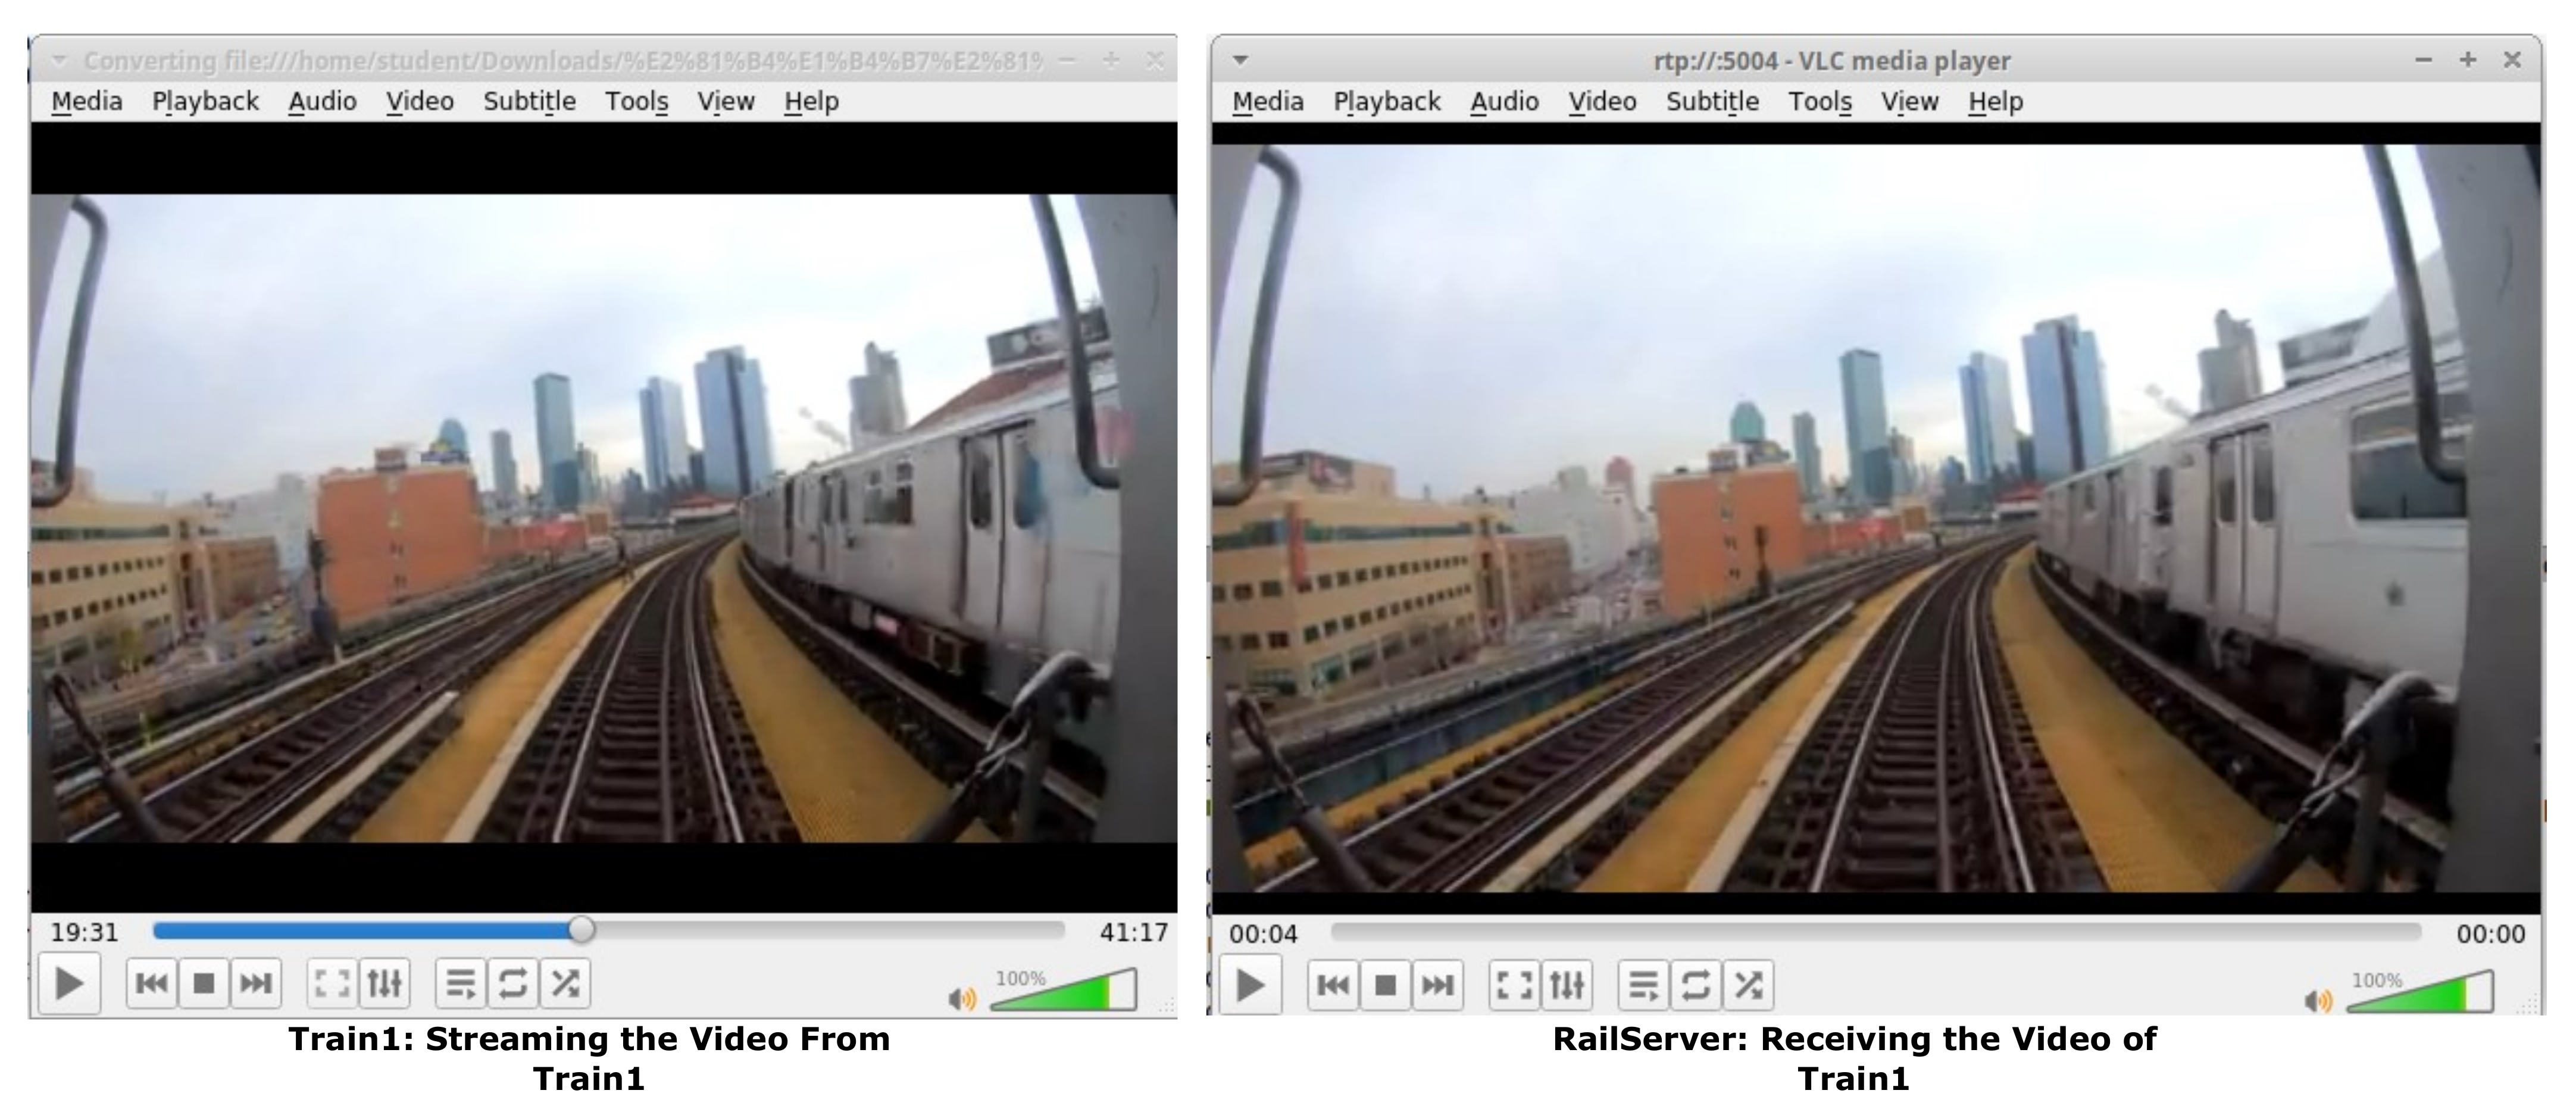
9.8. Video Transmission Test
- VLC player configuration at Train1: Train1 is acting as the video transmitter. Click on the option “Media”, select the option “Stream”, and add the video file as shown in Figure 33. After selecting the option “Stream”, a new window will pop up that provides the information about the selected video file; select the streaming method as “RTP/MPEP Transport Stream”, as shown in Figure 34.Add the destination host’s IP address. Here, the destination IP address is 192.168.7.104, which belongs to RailServer. In the next window, as shown in Figure 35, select the transcoding option “video-H.256 + MP3(MP4)”; other options can be selected based on the user’s transmission video format.Now, select the option “Stream”, as shown in Figure 36 and start streaming the video from Train1 to RailServer.
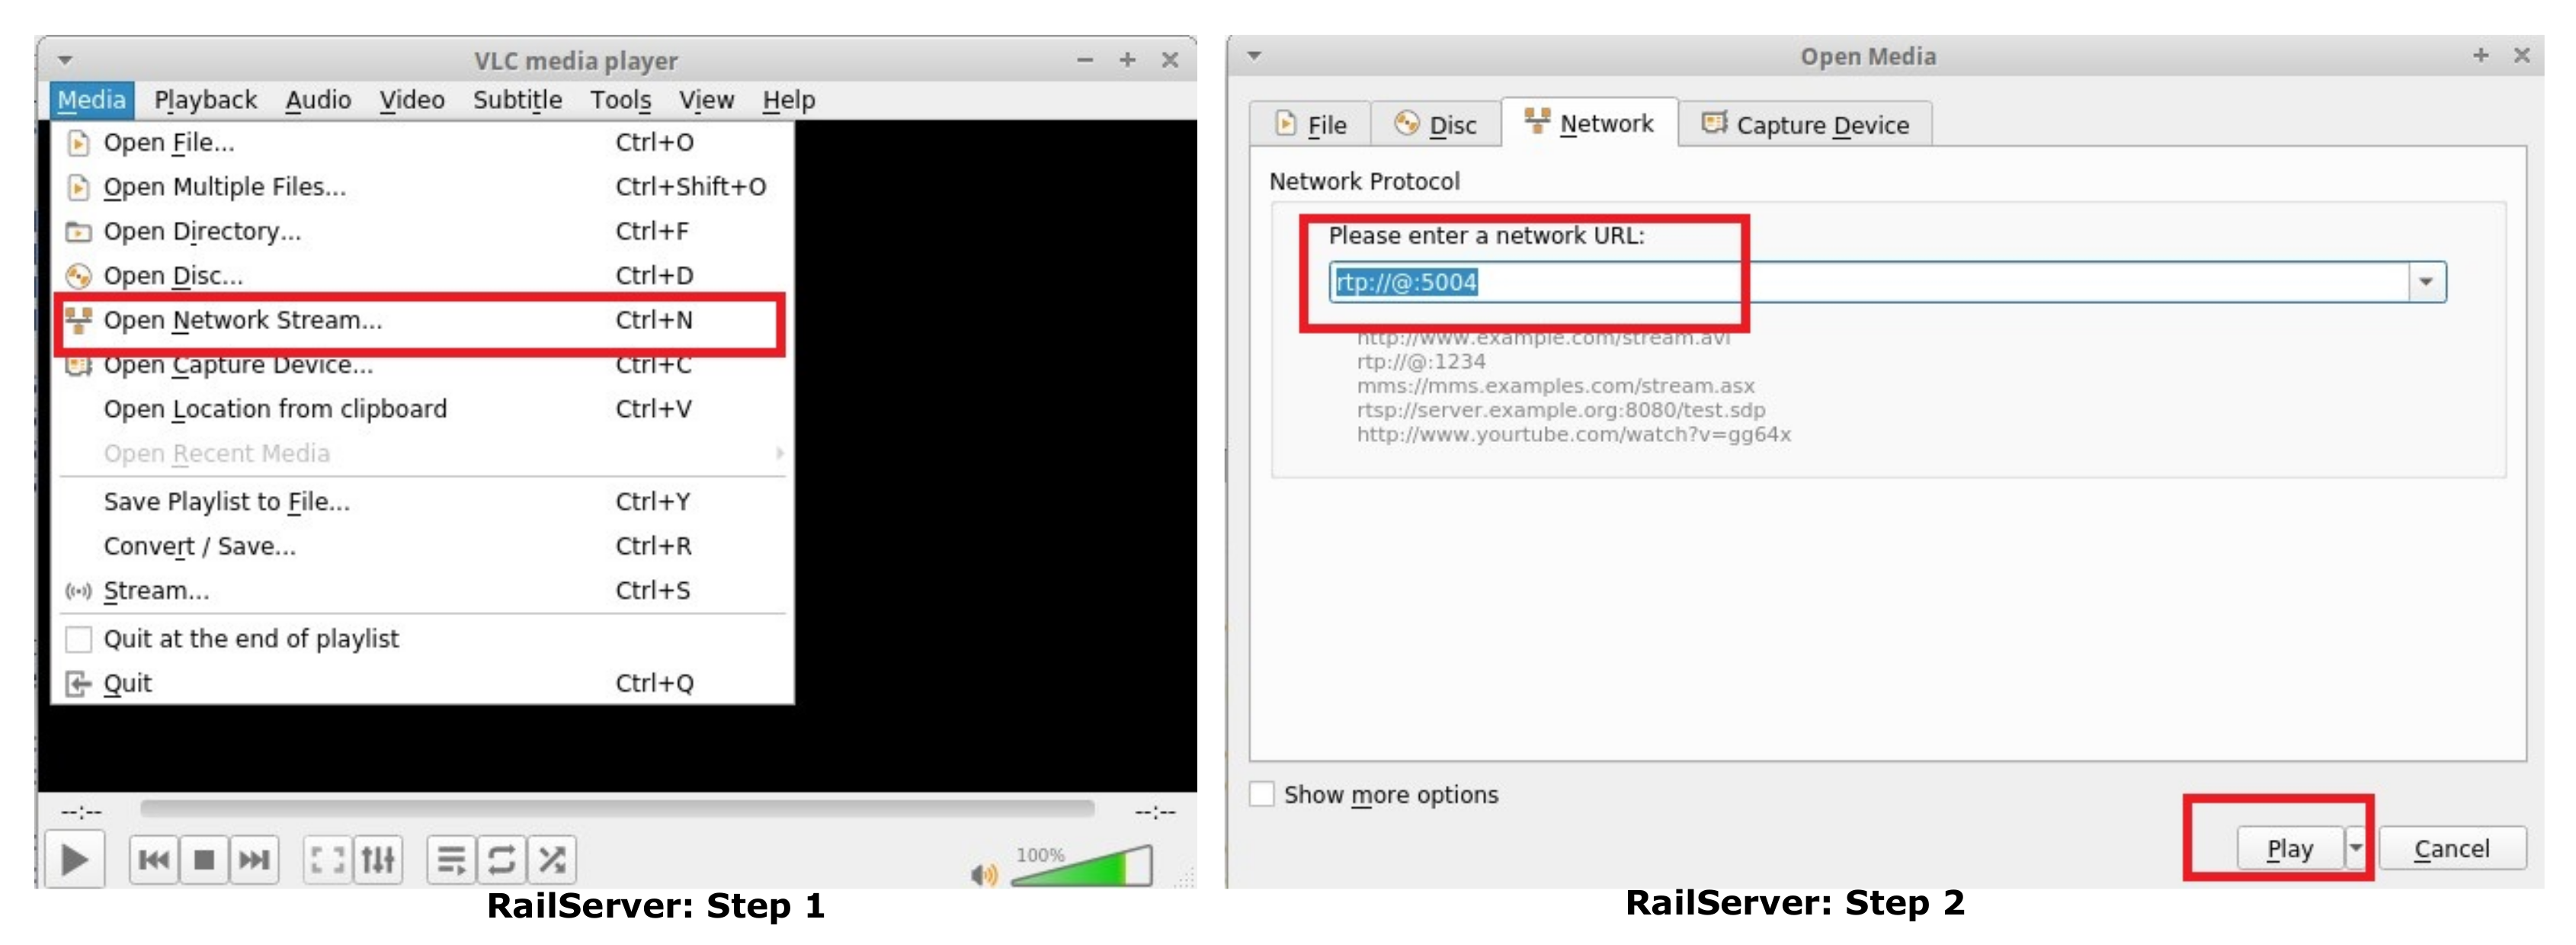
- VLC player configuration at RailServer: From “Media”, select option “Open Network Stream”, and a new window will pop up; add the network URL as “rtp://@:5004”, as shown in Figure 37.


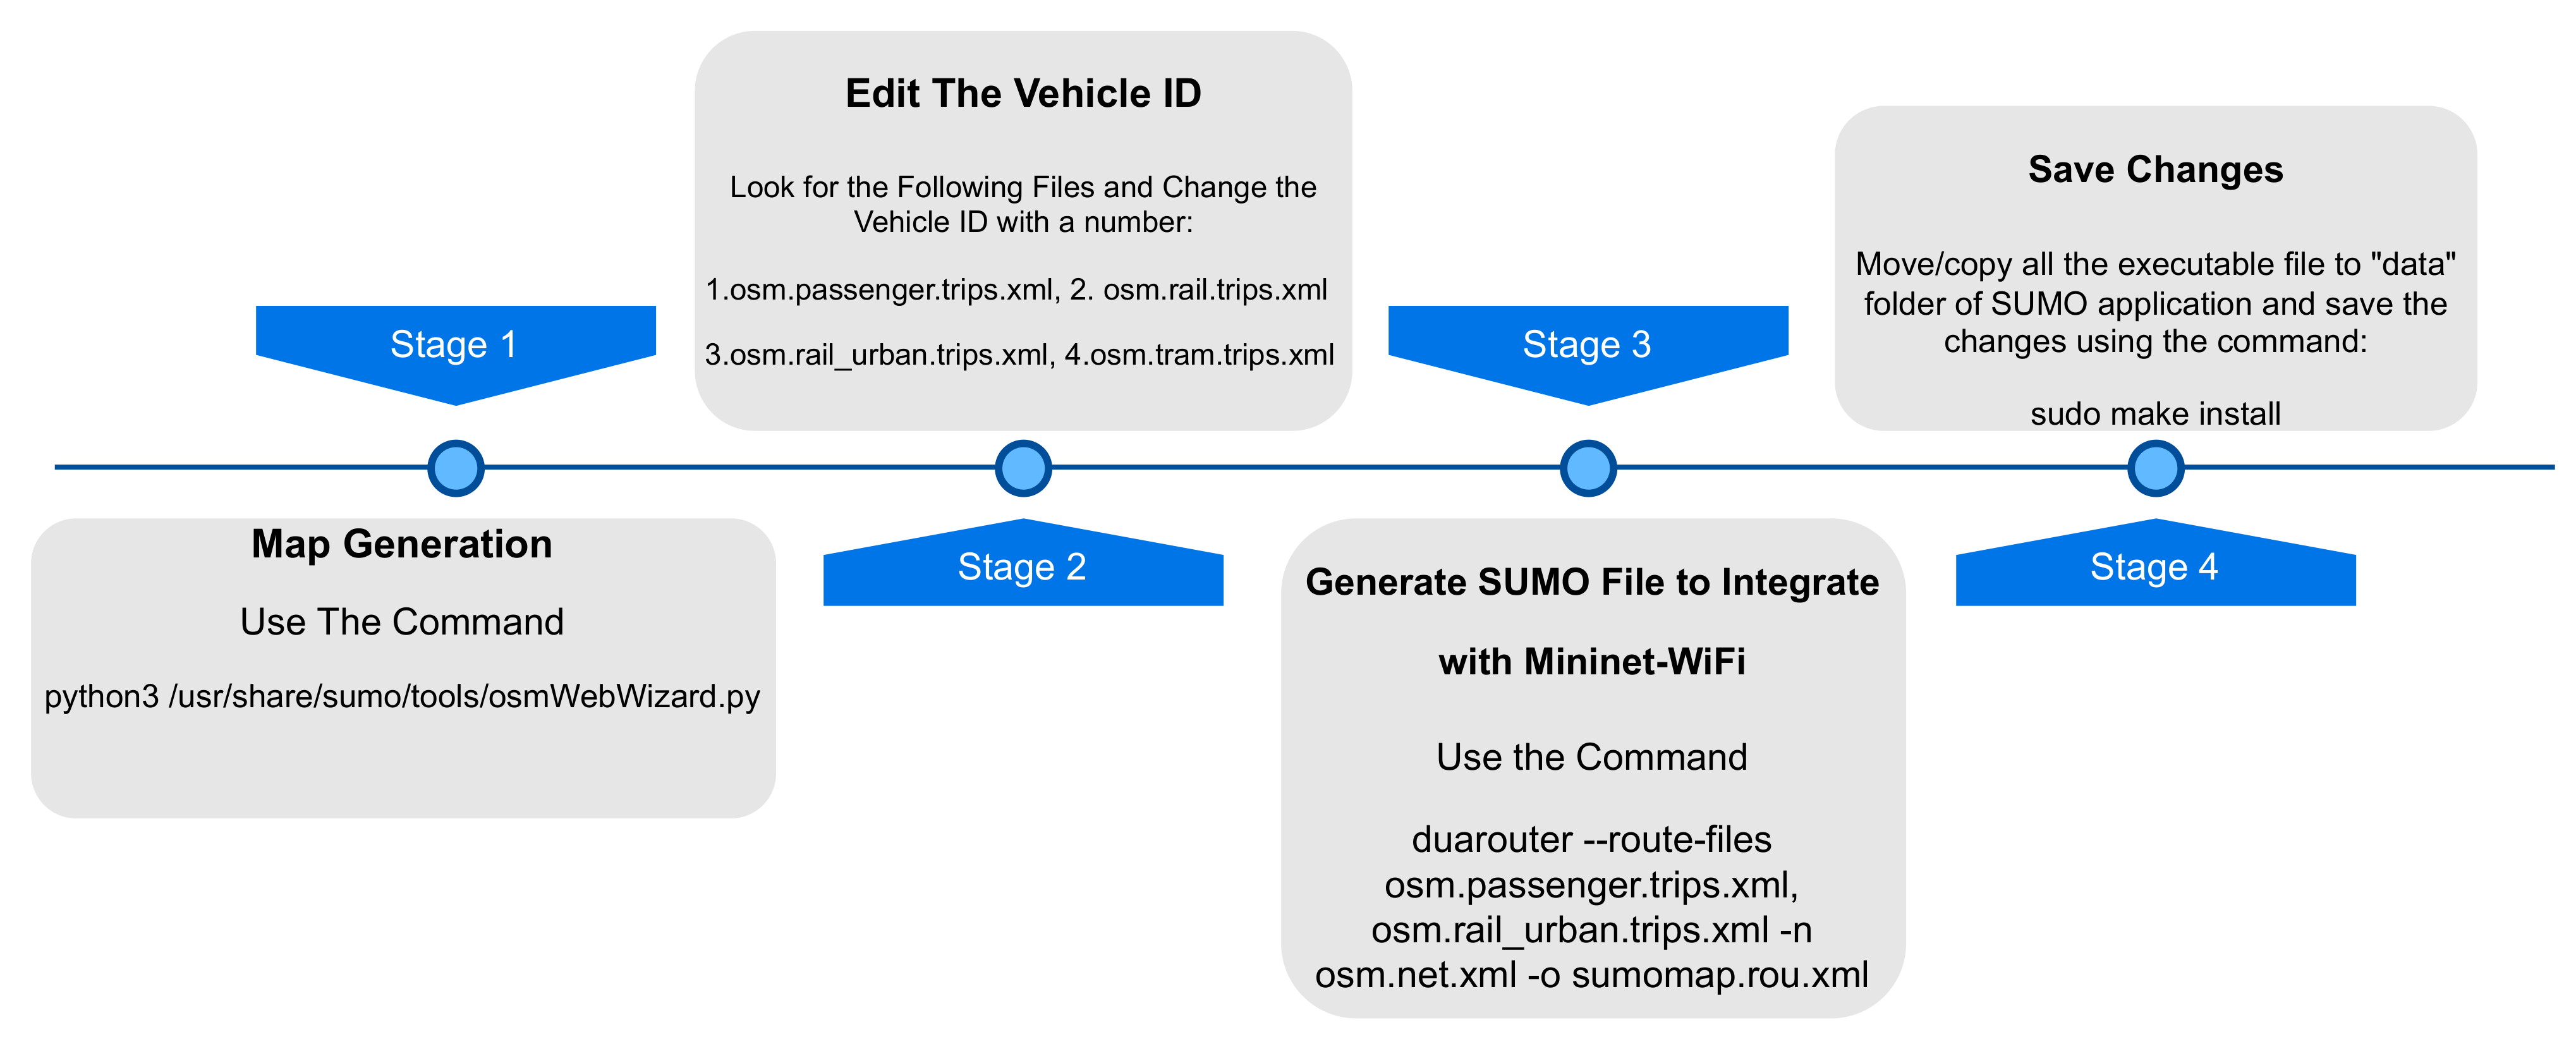
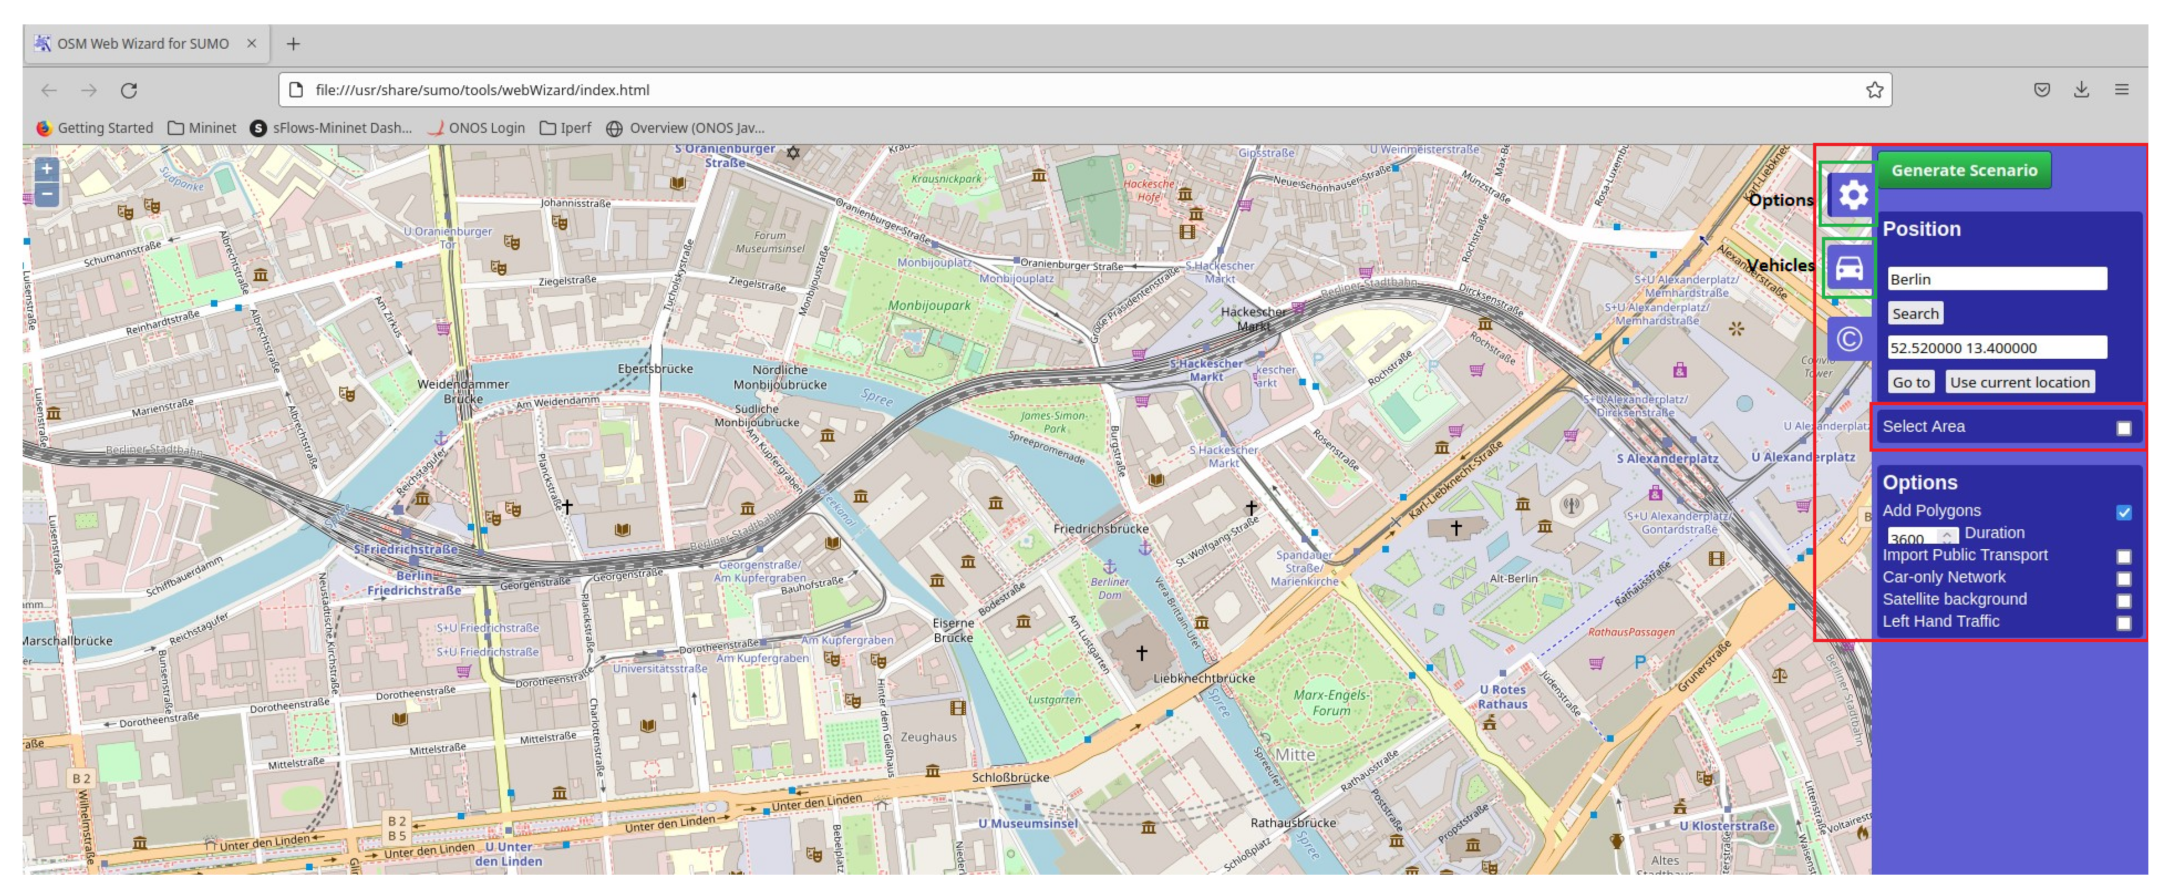
10. SUMO Integration
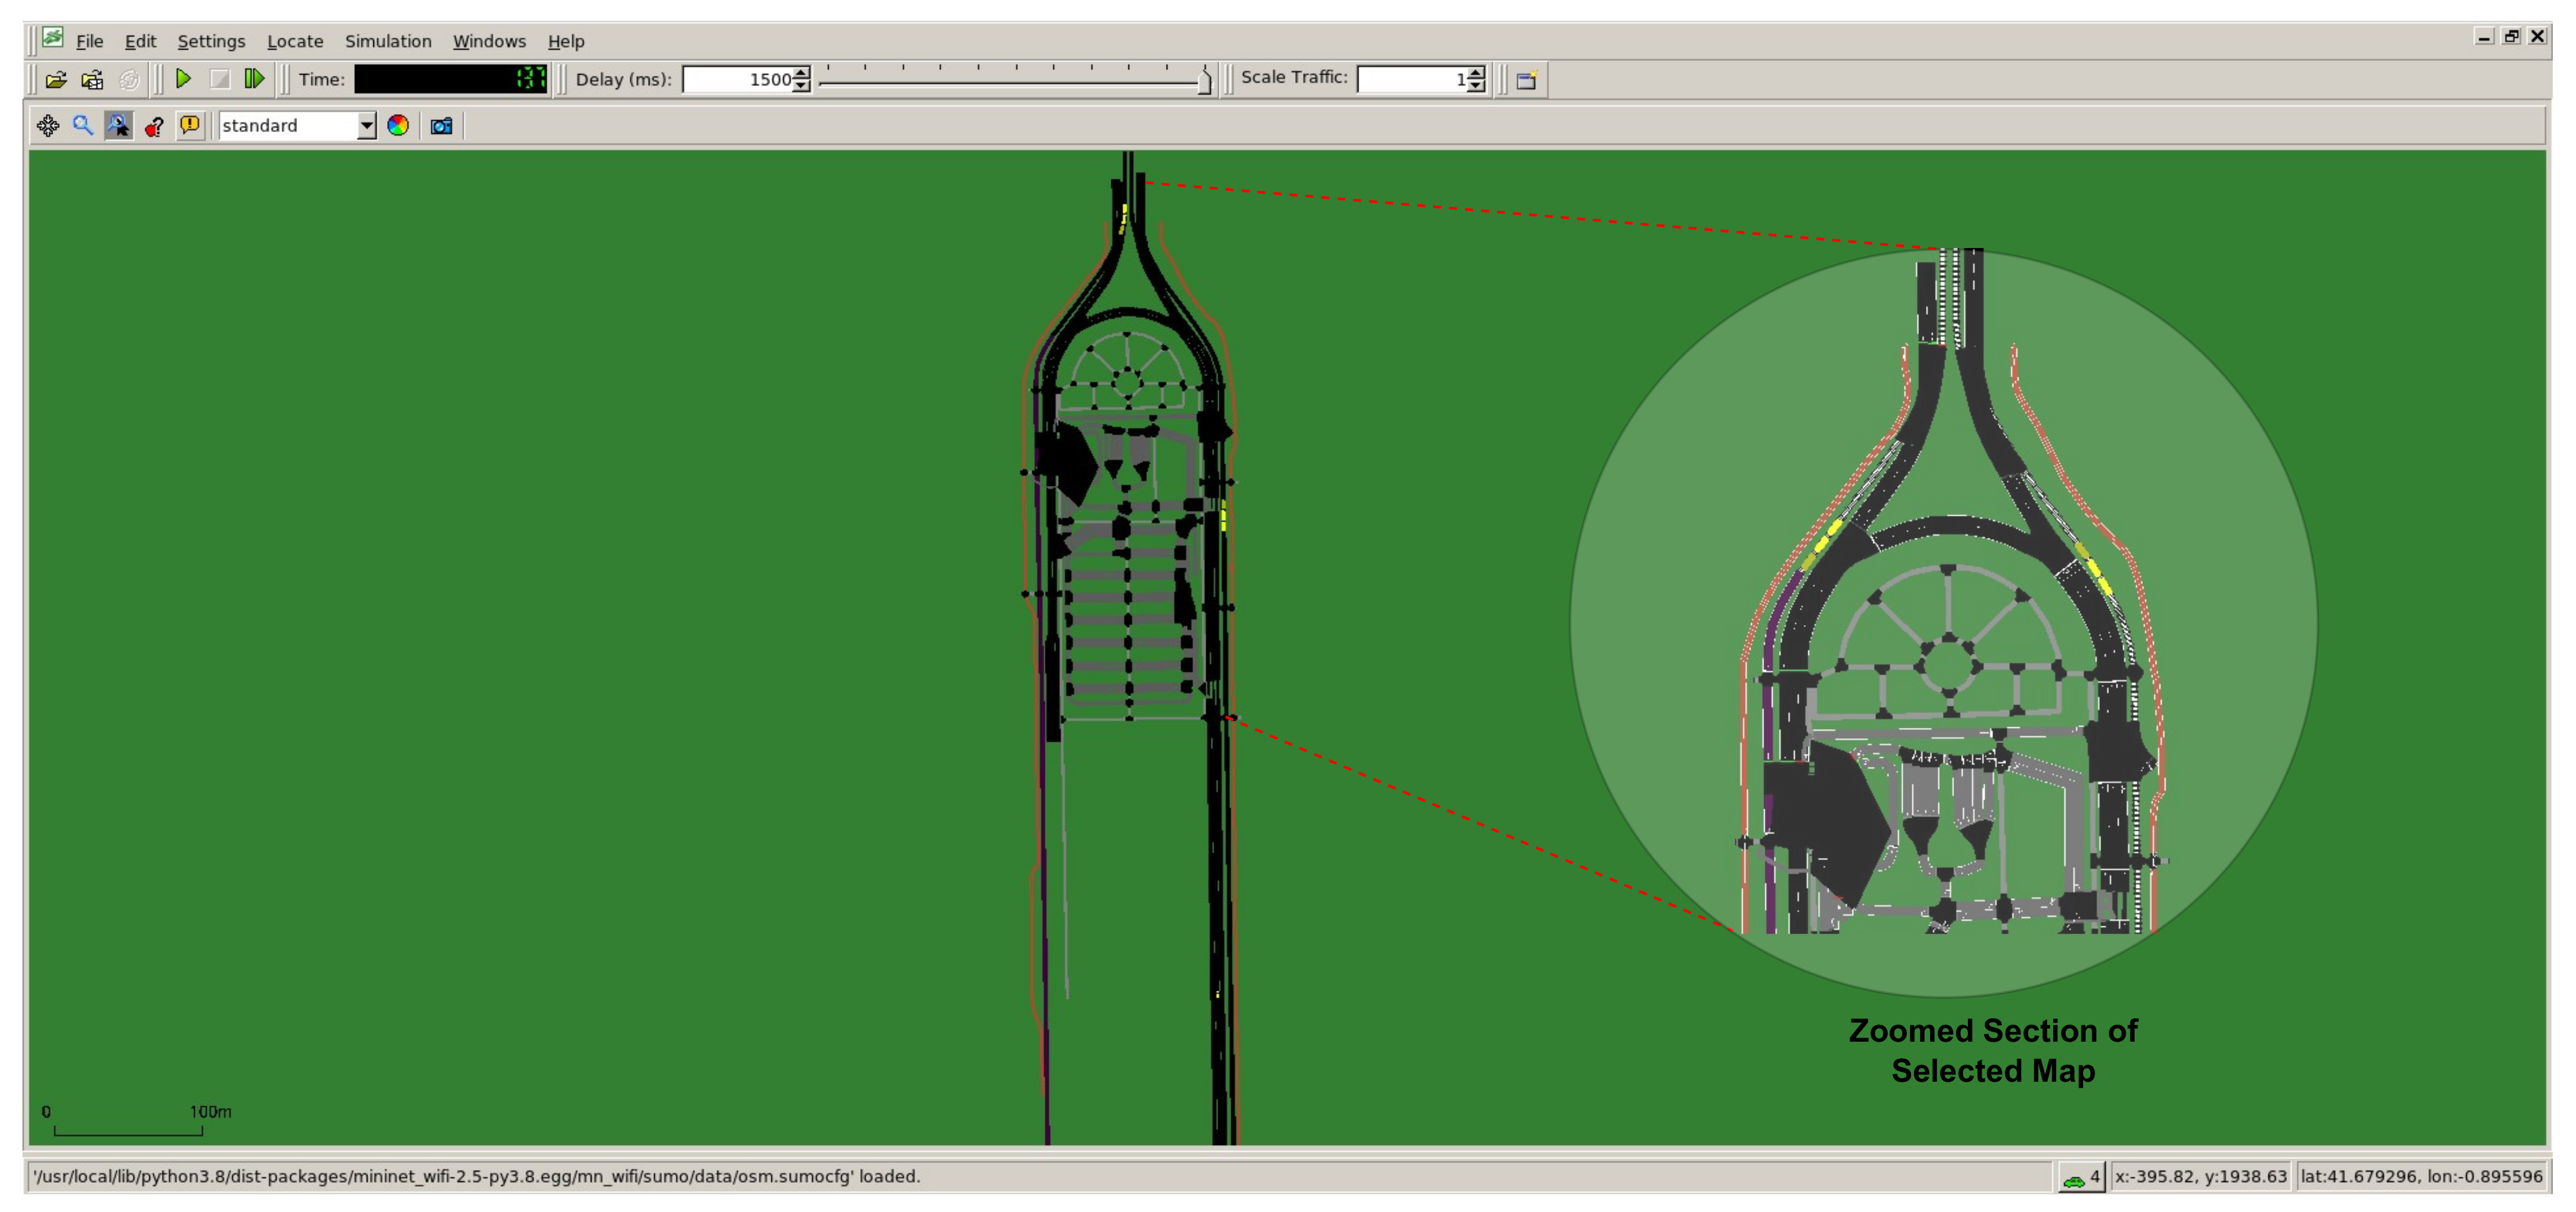
- Map Generation: To show the coexistence scenario of railways and roads in a pictorial form, user can design the desired map. A detailed tutorial is presented in [40]. For this practical work, we download the desired Google map file. To generate the desired emulation map on Google street map, run the command python3 /usr/share/sumo/tools/osmWebWizard.py from the folder where you want to download the map files. After running the command, the “OSM Web Wizard for SUMO” page will open. Go to the “Generate Scenario” option given on the right side of the page and select the map location by providing the city or place name or by providing the GPS coordinates of the region. Figure 40 shows the OSM Web Wizard home page. To demonstrate SUMO integration, we select the place “Puente De Santiago” since it has tracks parallel to roads. The map area is selected using the option “Select Area”. Figure 41 shows the selected map area and selected parameters to generate the vehicle traffic. Using the parameter “Through Traffic Factor”, the user can define the number of vehicles that depart and arrive at the selected simulation boundary area.After selecting the required parameters, by clicking on the “Generate Scenario” option, all the map files will be downloaded to the selected folder. After completion of map file generation, the user will get the messages shown in Figure 42. If all the steps are correct and the intended map files are downloaded, a new window will pop up and start running the simulation, as shown in Figure 43.Figure 40. OSM Web Wizard home page.
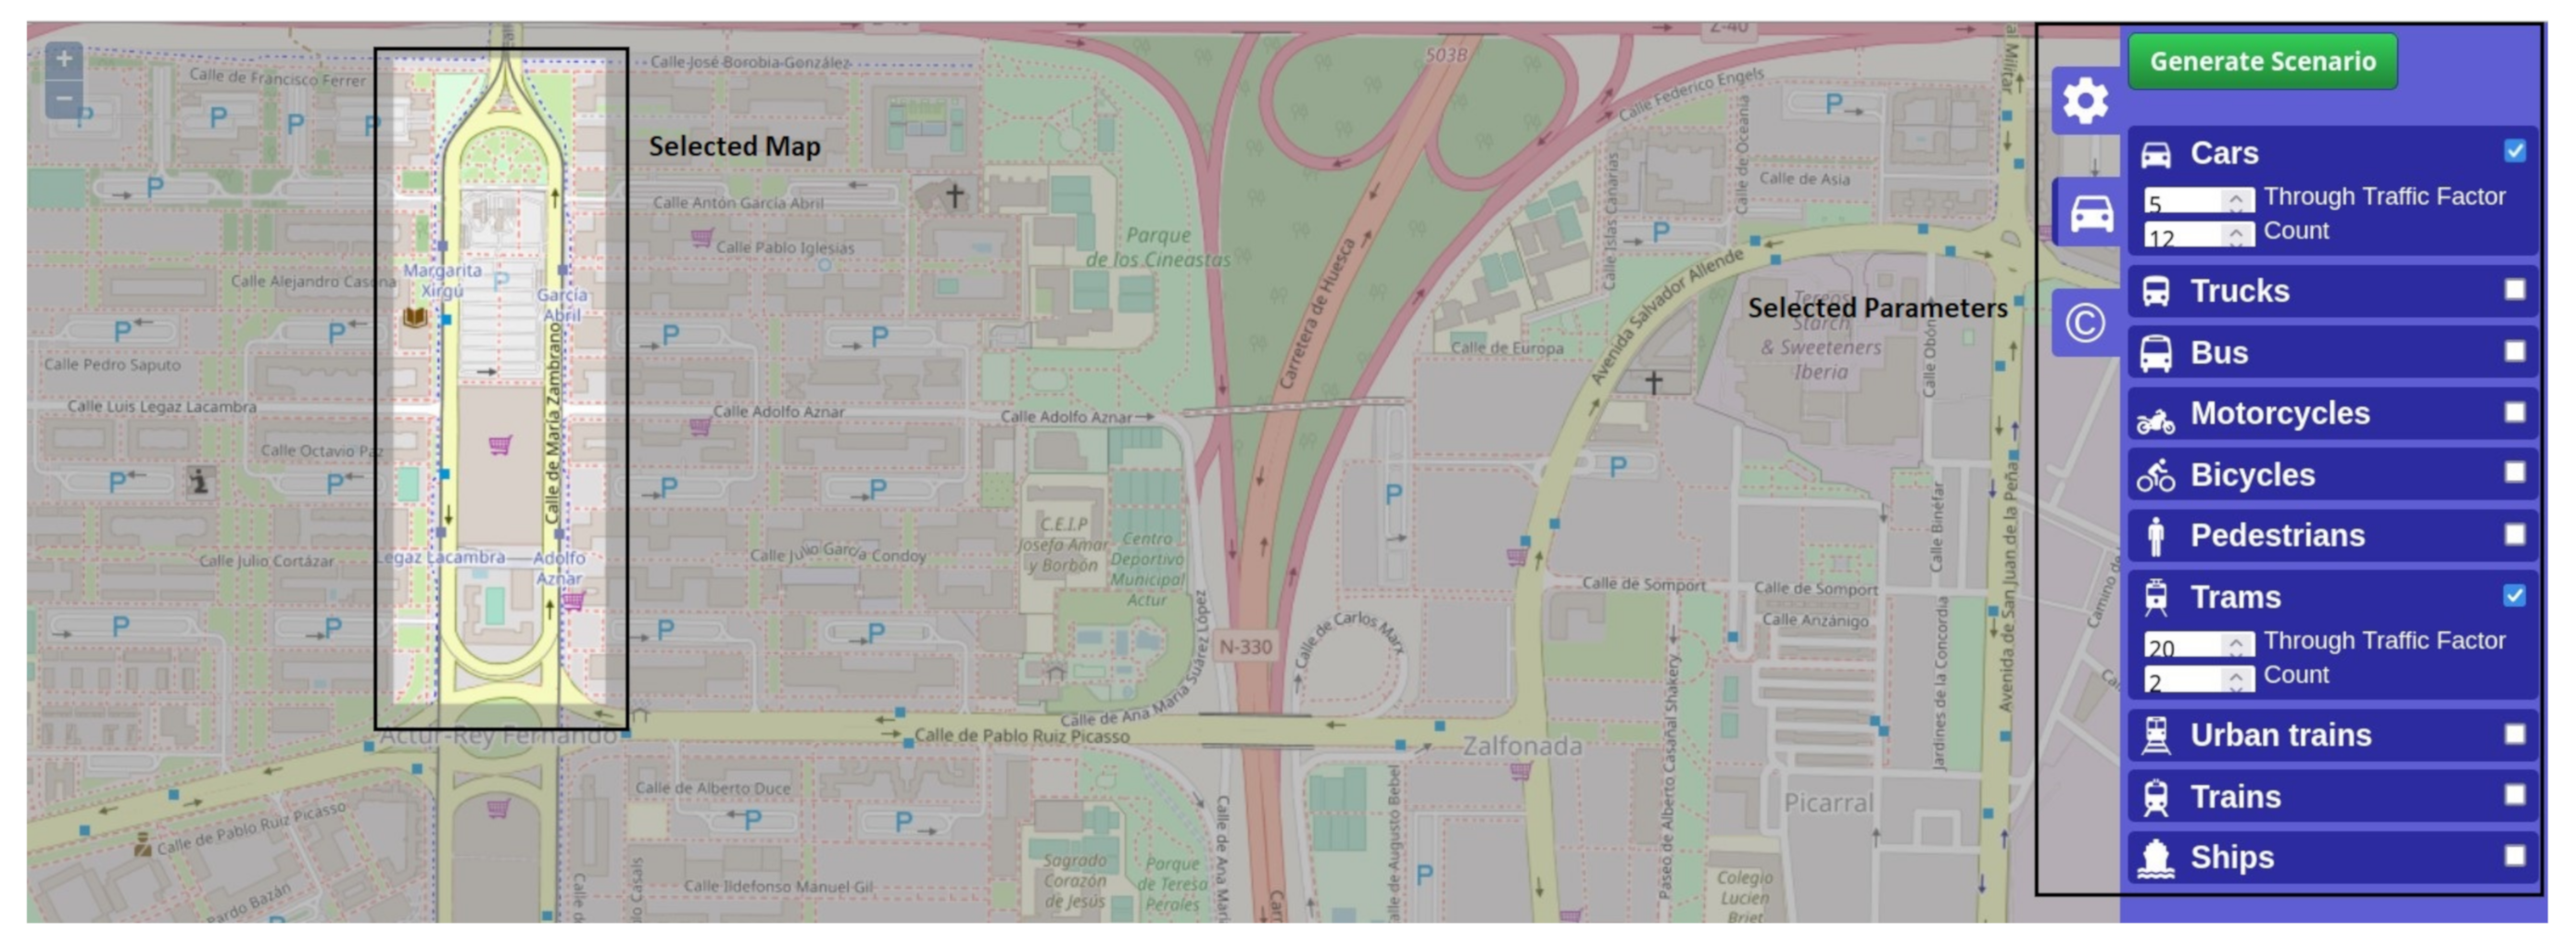
![Network 02 00038 g040]() Figure 41. Selected map: Puente de Santiago.
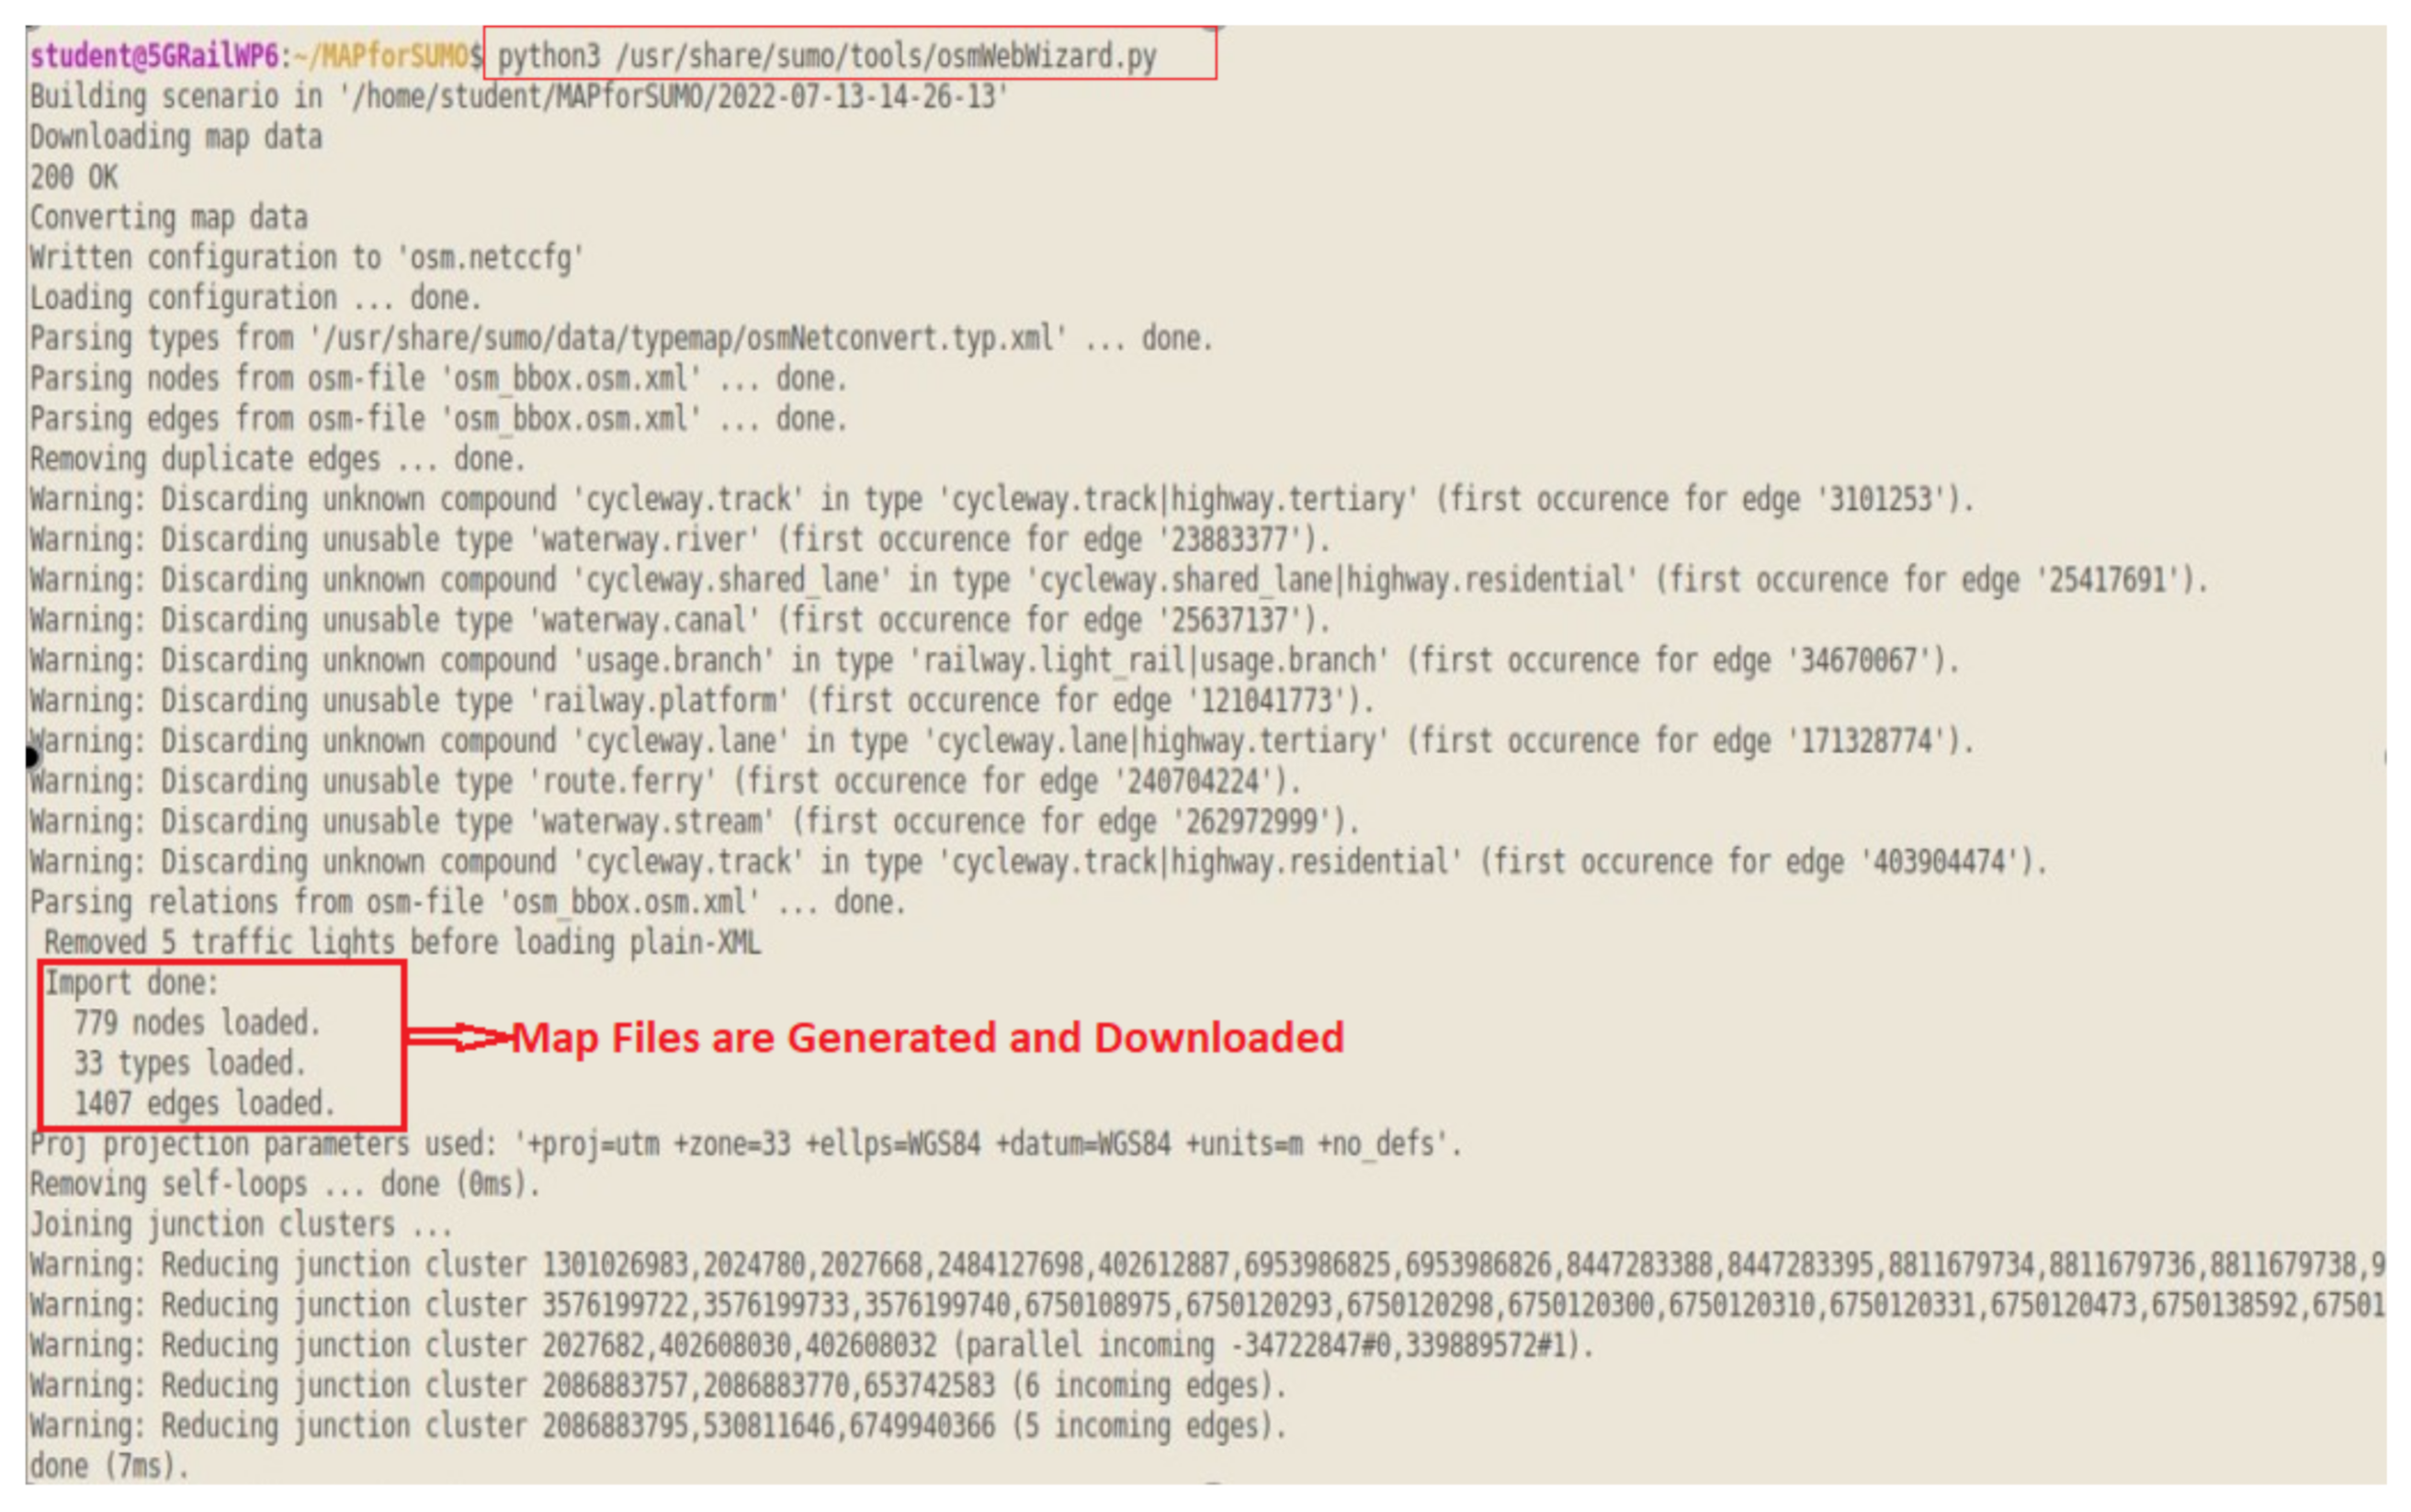
Figure 41. Selected map: Puente de Santiago.![Network 02 00038 g041]() Figure 42. Map generation.
Figure 42. Map generation.![Network 02 00038 g042]() Figure 43. Simulation: Puente de Santiago.
Figure 43. Simulation: Puente de Santiago.![Network 02 00038 g043]()
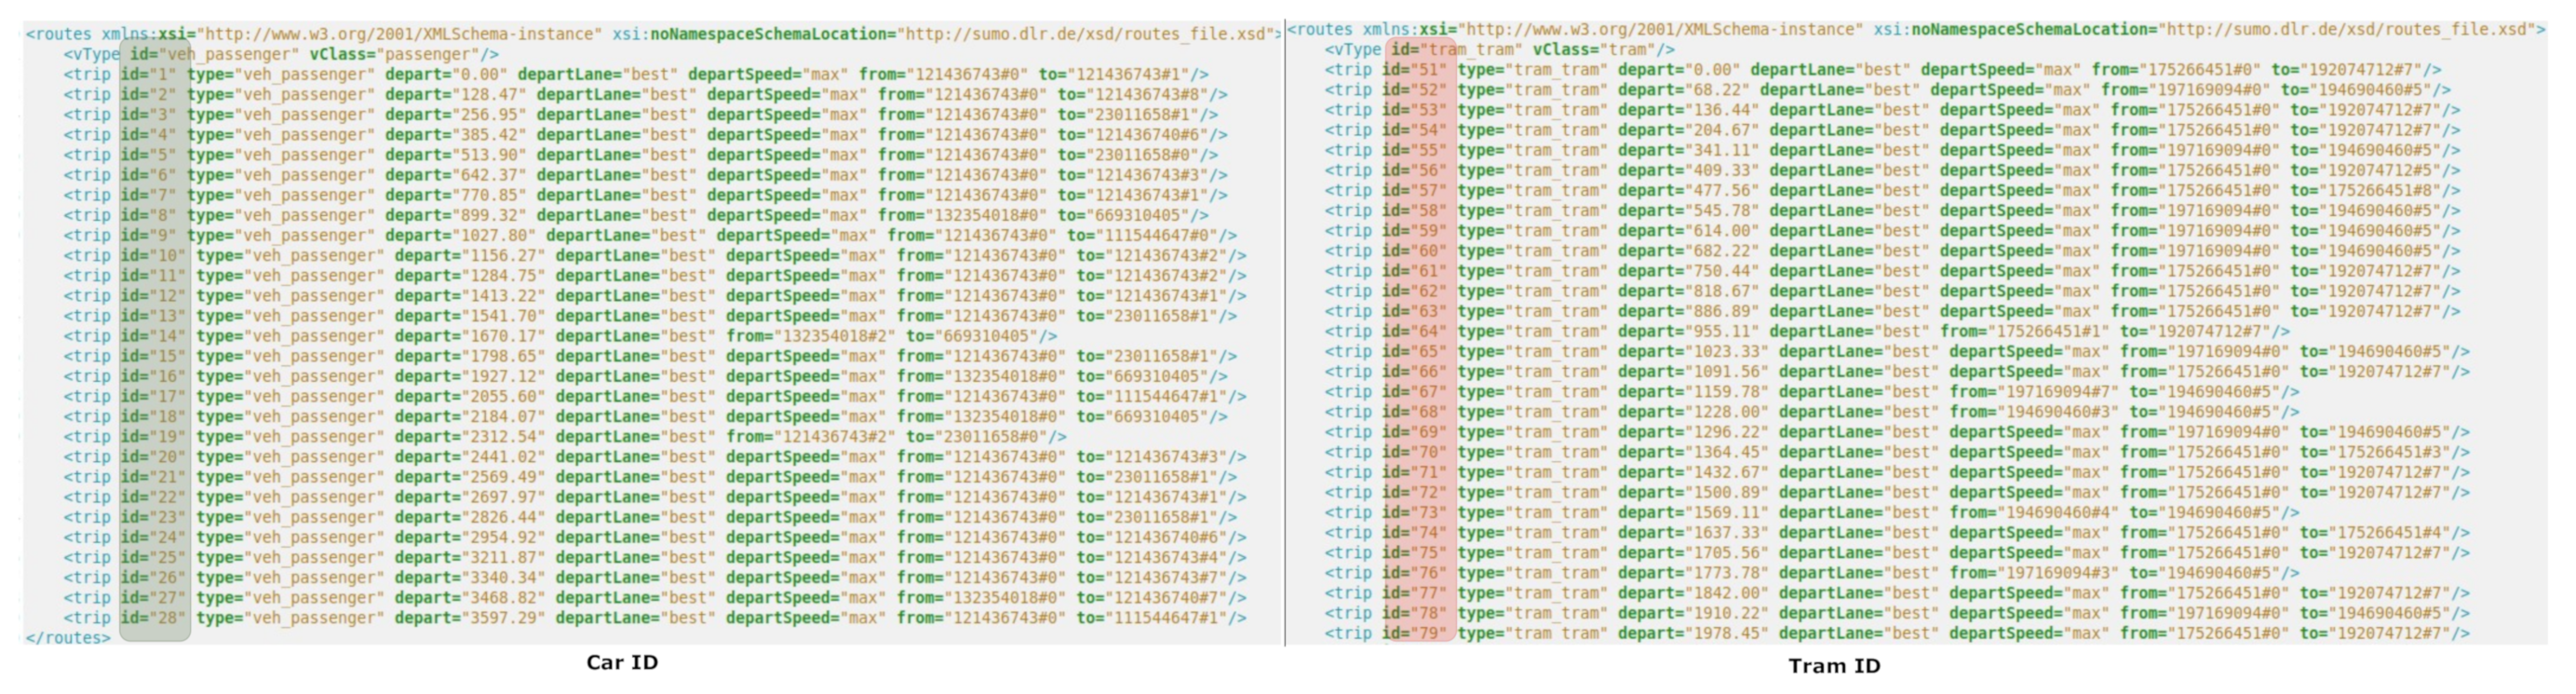
- Edit the Vehicle Id, i.e., Car ID and Train/Tram ID: To show the vehicles in SUMO and to interface with Mininet–WiFi, the selected vehicles/nodes should have different IDs. Go to the folder where map files are generated and look for the files that have the car and the tram. Look for the following emulation files:
- osm.passenger.trips.xml: contains the car ID;
- osm.rail.trips.xml: contains train ID (long route trains);
- osm.rail_urban.trips.xml: contains urban train ID;
- osm.tram.trips.xml: contains tram ID.


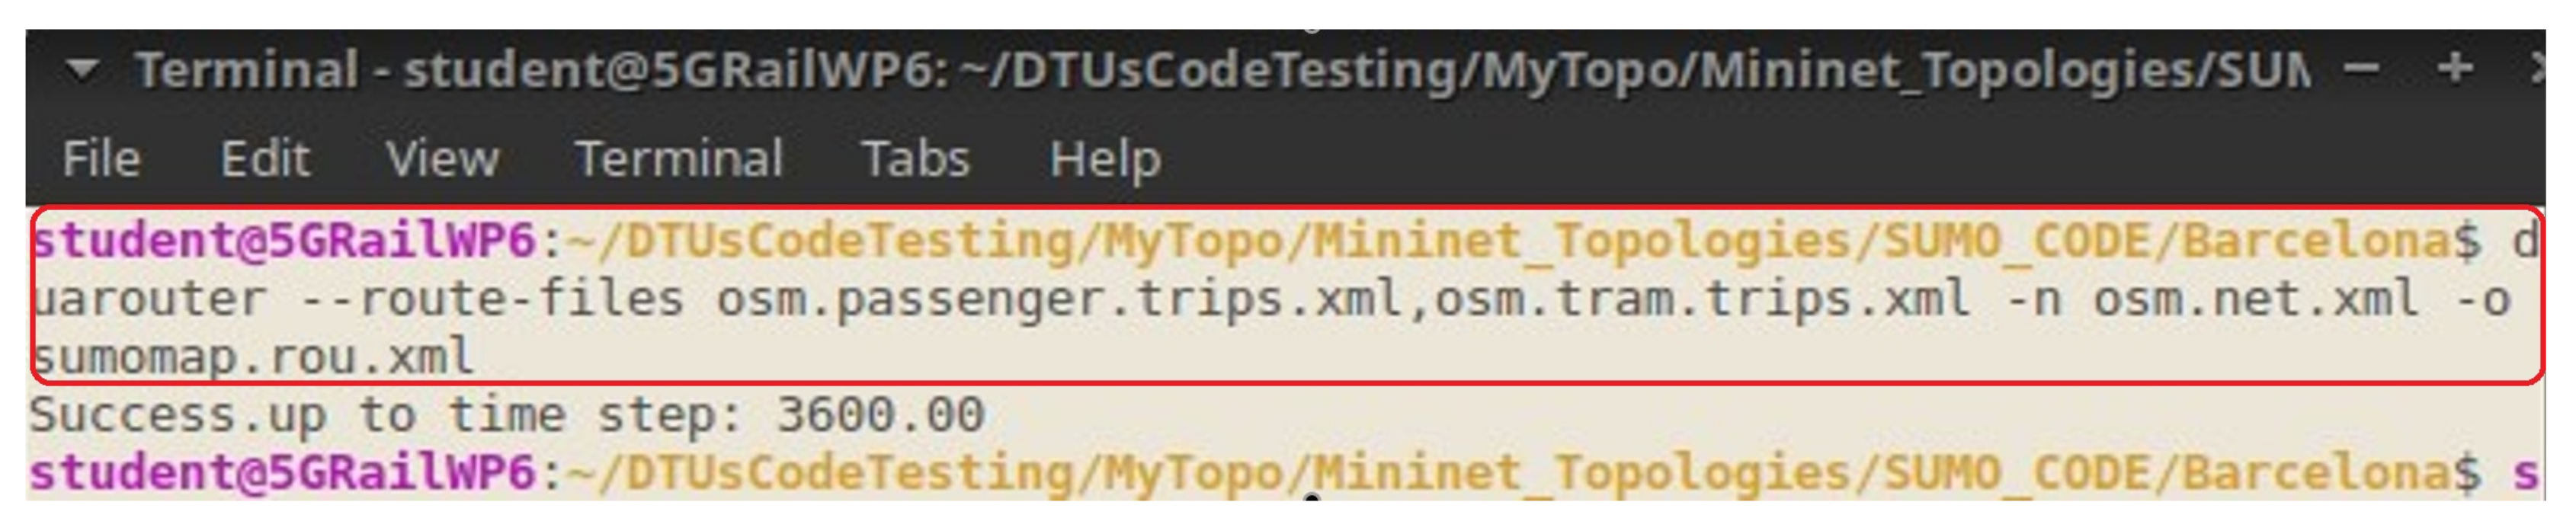
duarouter - -route-files osm.passenger.trips.xml, osm.rail_urban.trips.xml -n osm.net.xml -o sumomap.rou.xml

- Edit the Fileosm.sumocfg: After generating the map file sumomap.rou.xml, open the file osm.sumocfg and change the following information:
<route-files value=“sumomap.rou.xml”/>
- Move or Copy the Map Files: By default, Mininet–WiFi accesses the SUMO files from the “data” folder of the SUMO application. Therefore, after completing all the steps mentioned above, move or copy the map files in the /home/student/mininet-wifi/mn_wifi/ sumo/data folder.
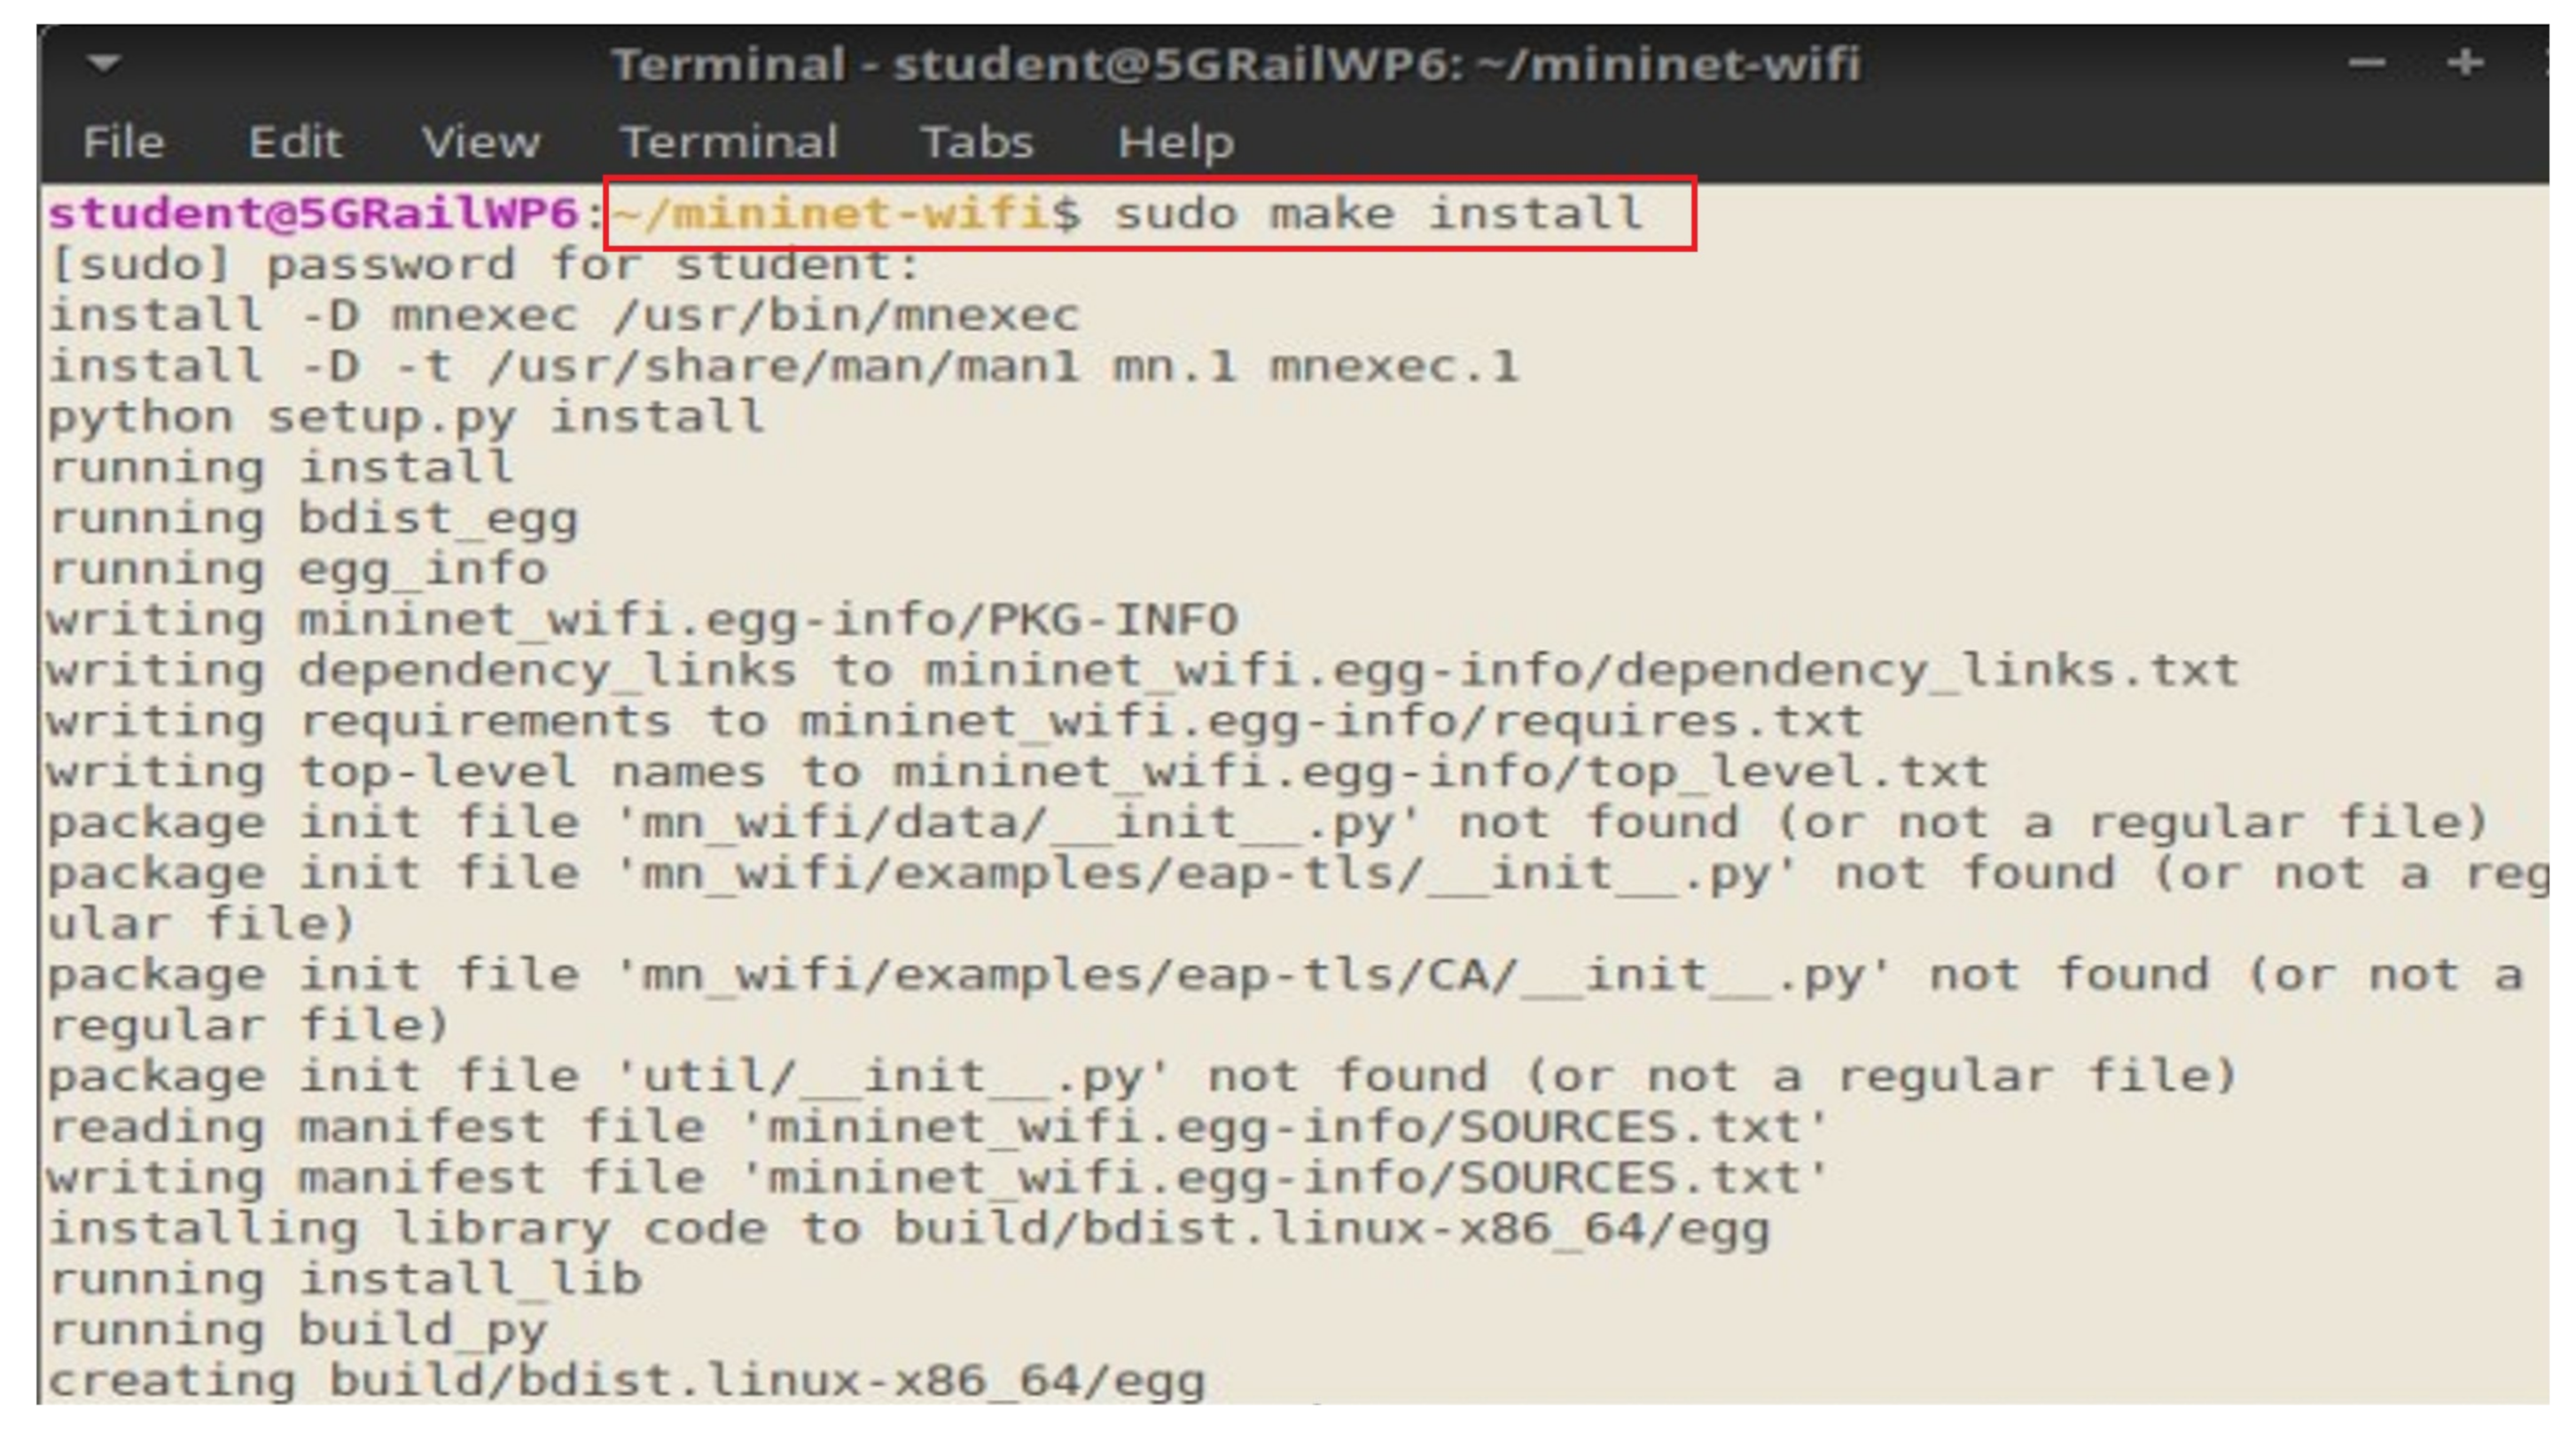
- Save all Changes: Now, go to the folder for Mininet–WiFi, open a terminal, and run the following command sudo make install to save all the changes done with SUMO files, as shown in Figure 46.Figure 46. Save all the changes.
![Network 02 00038 g046]()
- SUMO Map Integration with Selected Network Topology: To generate the network topology integrated with SUMO maps, a Python script is used utilizing all the methods and functions described in Section 6.1. The user has to add the following line of code mentioned in List 10 to the network topology Python script. The command net.useExternalProgram is used to integrate the SUMO application with Mininet–WiFi. The entire Python script (SUMO_Aug17.py) for network topology creation with SUMO map integration is available at [26].
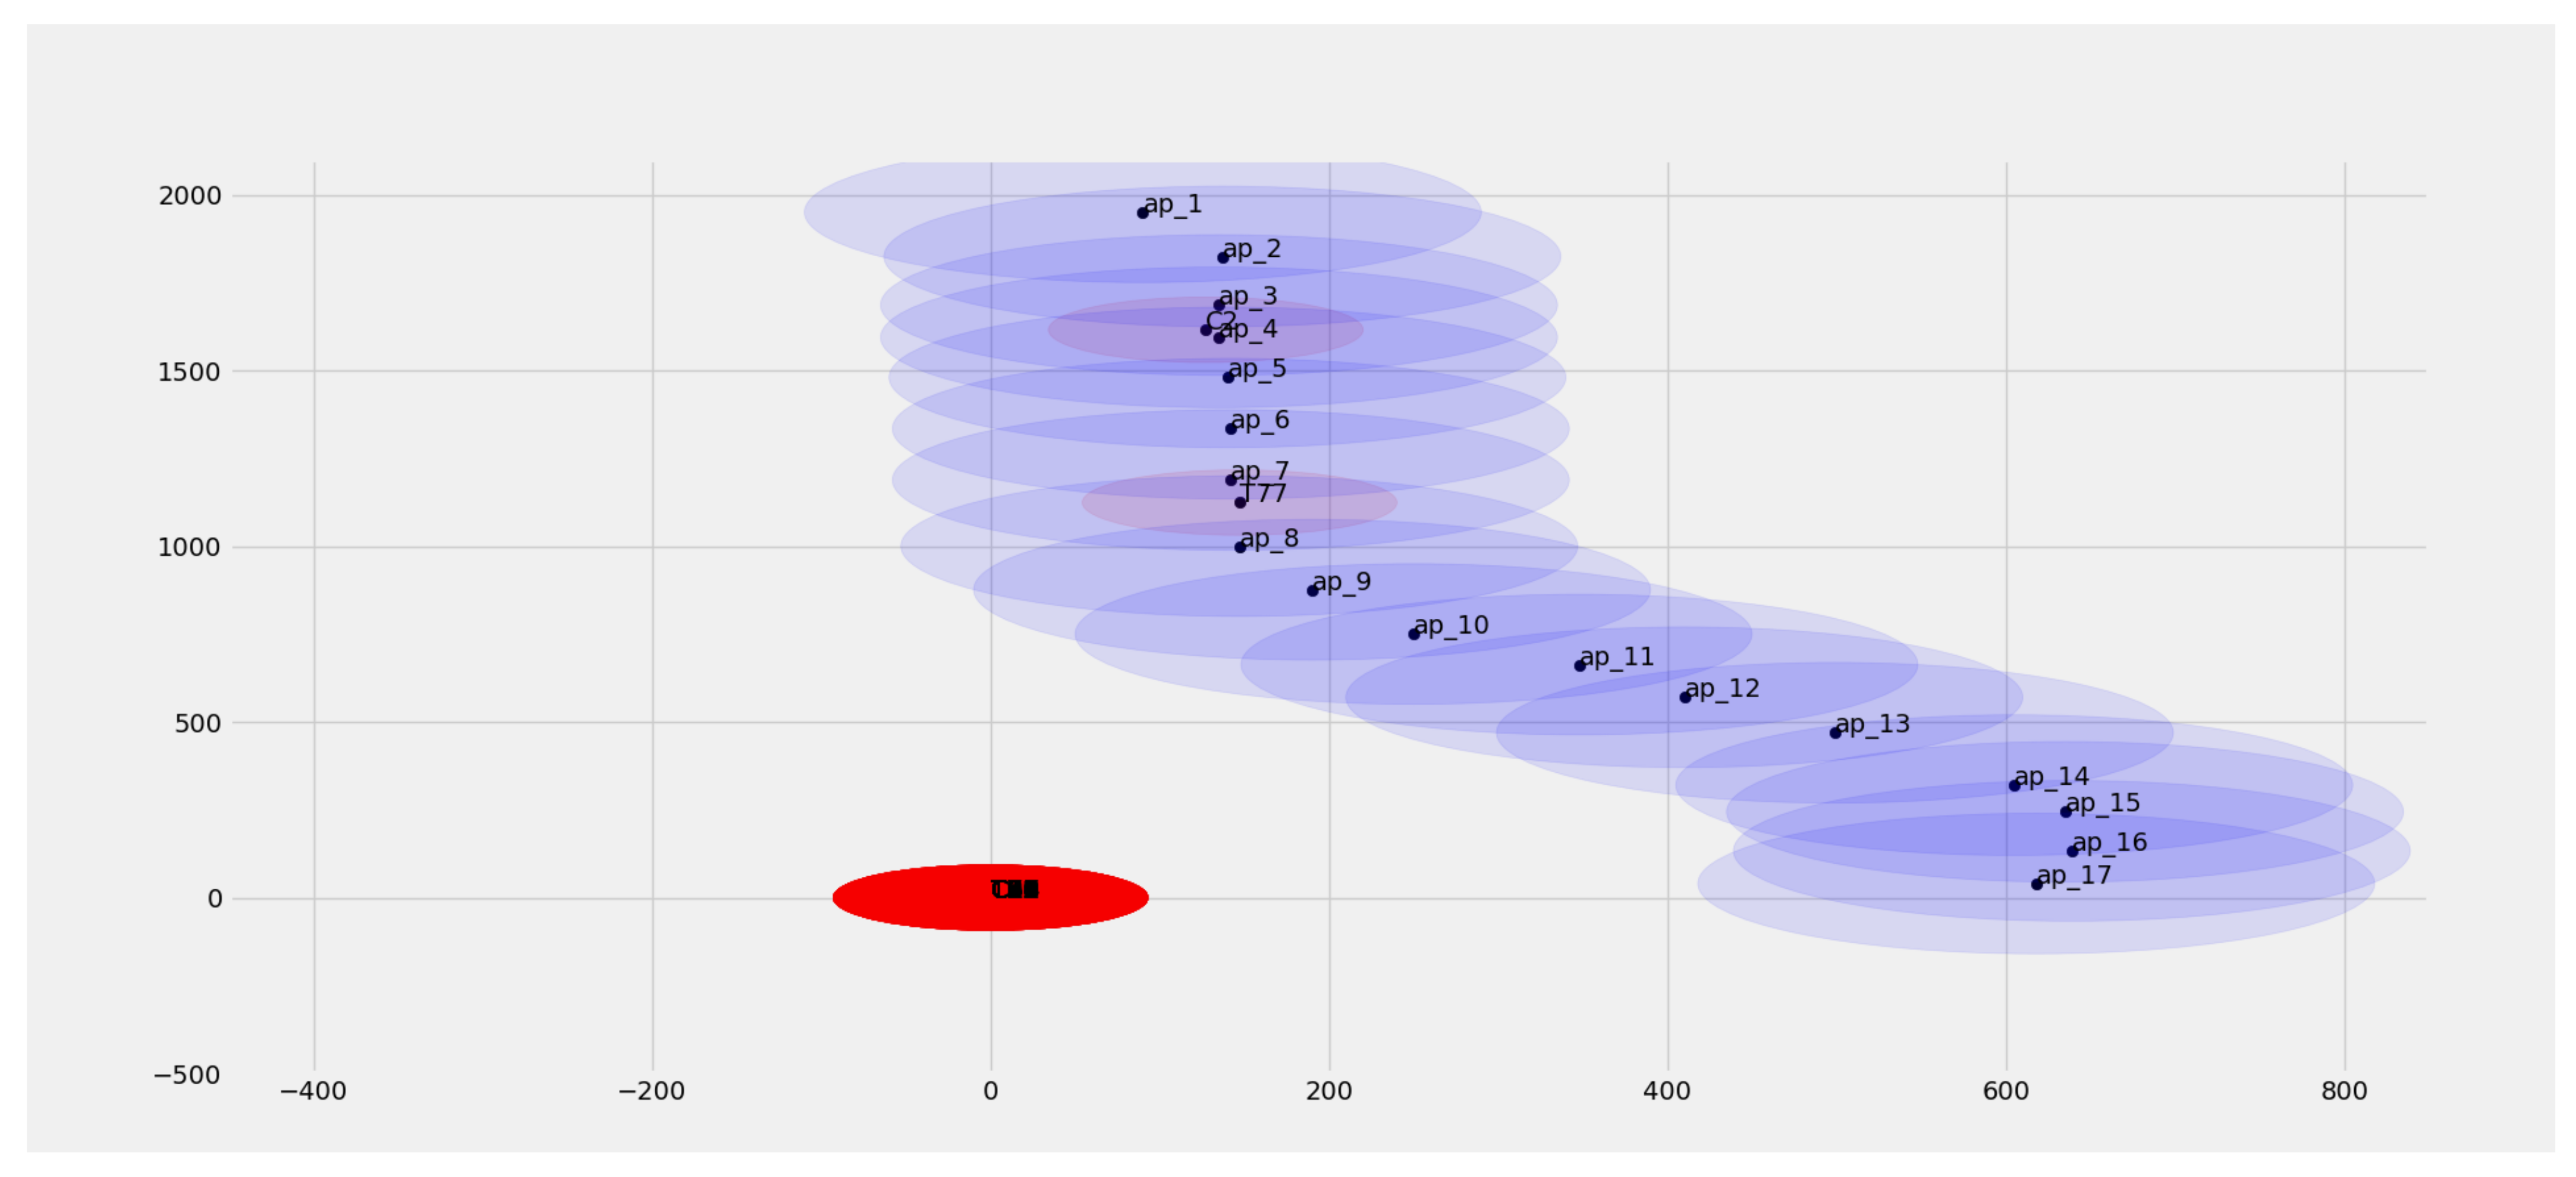
Listing 10. SUMO Integration with Mininet–WiFi. info(‘ ‘∗∗∗∗Starting_network_and_connecting_to_traci’ ’) info(’Connecting_to_traci_sumo’) net.useExternalProgram (program=sumo, port=8813, config_file=’osm.sumocfg’, extra_params=[‘ ‘--start --delay 1500’ ’]) After running the script SUMO_Aug17.py, network emulation with the SUMO map as shown in Figure 43 will be generated. Figure 47 shows the location of the assigned access points and the movement of cars and trams, where assigned access points are ap1 to ap17, C2 represents Car2, and T77 represents Tram77. When a car/tram moves from the coverage range of one access point to another, we sometimes observe that there is no automatic connection to the nearest access point. In that case, the connection can be established using the command <node name> iw dev <node name>-wlan0 connect <SSID name>.


11. Conclusions
Author Contributions
Funding
Institutional Review Board Statement
Informed Consent Statement
Data Availability Statement
Conflicts of Interest
References
- Sylla, T.; Mendiboure, L.; Maaloul, S.; Aniss, H.; Chalouf, M.A.; Delbruel, S. Multi-Connectivity for 5G Networks and Beyond: A Survey. Sensors 2022, 22, 7591. [Google Scholar] [CrossRef] [PubMed]
- ETSI TR 103 333—System Reference Document (SRDoc); GSM-R Networks Evolution. February 2017. Available online: https://www.etsi.org/deliver/etsi_tr/103300_103399/103333/01.01.01_60/tr_103333v010101p.pdf (accessed on 5 October 2022).
- UIC FU-7100—FRCMS User Requirements Specification. February 2020. Available online: https://uic.org/IMG/pdf/frmcs_user_requirements_specification-fu_7100-v5.0.0.pdf (accessed on 5 October 2022).
- UIC- MG-7900—FRCMS Use Cases. February 2020. Available online: https://uic.org/IMG/pdf/frmcs_use_cases-mg_7900-v2.0.0.pdf (accessed on 5 October 2022).
- Mandoc, D. FRMCS Definition, Specification and Standardization Activities ERA CCRCC 2019, Slide 3. Available online: https://www.era.europa.eu/sites/default/files/events-news/docs/ccrcc_2019/4-3_dan_mandoc_era_uic_frmcs_definition_16102019_en.pdf (accessed on 12 November 2021).
- 5GRail Info on 5G PPP. Available online: https://5g-ppp.eu/5grail/ (accessed on 1 October 2022).
- 5GRail Deliverable D6.1. Scenarios for Rail and Road Communication System Coexistence. Available online: https://5grail.eu/wp-content/uploads/2021/07/5GRAIL_202107023_R_PU_D6.1_RV1_UNI_EIFFEL_Scenarios_Rail_and_road.pdf (accessed on 10 September 2022).
- Fontes, R.R.; Afzal, S.; Brito, S.H.B.; Santos, M.A.S.; Rothenberg, C.E. Mininet-WiFi: Emulating software-defined wireless networks. In Proceedings of the 2015 11th International Conference on Network and Service Management (CNSM), Barcelona, Spain, 9–13 November 2015; pp. 384–389. [Google Scholar] [CrossRef]
- Zang, M.; Dittmann, L.; Yan, Y. A Performance Study of Flow-Based Monitoring in Internet of Vehicles. In Proceedings of the 2021 12th International Conference on Network of the Future (NoF), Coimbra, Portugal, 6–8 October 2021; pp. 1–5. [Google Scholar] [CrossRef]
- Smida, K.; Tounsi, H.; Frikha, M.; Song, Y.-Q. Efficient SDN Controller for Safety Applications in SDN-Based Vehicular Networks: POX, Floodlight, ONOS or OpenDaylight? In Proceedings of the 2020 IEEE Eighth International Conference on Communications and Networking (ComNet), Hammamet, Tunisia, 27–30 October 2020; pp. 1–6. [Google Scholar] [CrossRef]
- Fontes, R.D.R.; Campolo, C.; Rothenberg, C.E.; Molinaro, A. From Theory to Experimental Evaluation: Resource Management in Software-Defined Vehicular Networks. IEEE Access 2017, 5, 3069–3076. [Google Scholar] [CrossRef]
- Acharya, S.; Devanahalli, S.S.S.; Rawat, A.; Kuruvilla, V.P.; Sharma, P.; Amrutur, B.; Joglekar, A.; Krishnapuram, R.; Simmhan, Y.; Tyagi, H. Network Emulation For Tele-driving Application Development. In Proceedings of the 2021 International Conference on COMmunication Systems & NETworkS (COMSNETS), Bangalore, India, 5–9 January 2021; pp. 109–110. [Google Scholar] [CrossRef]
- Abdelkader, G.; Elgazzar, K.; Khamis, A. Connected Vehicles: Technology Review, State of the Art, Challenges and Opportunities. Sensors 2021, 21, 7712. [Google Scholar] [CrossRef] [PubMed]
- Monir, N.; Toraya, M.M.; Vladyko, A.; Muthanna, A.; Torad, M.A.; El-Samie, F.E.A.; Ateya, A.A. Seamless Handover Scheme for MEC/SDN-Based Vehicular Networks. J. Sens. Actuator Netw. 2022, 11, 9. [Google Scholar] [CrossRef]
- Ali, H.D.; Abdulqader, A.H. Using Software Defined Network (SDN) Controllers to Enhance Communication between Two Vehicles in Vehicular AD HOC Network (VANET). In Proceedings of the 2021 7th International Conference on Contemporary Information Technology and Mathematics (ICCITM), Mosul, Iraq, 25–26 August 2021; pp. 106–111. [Google Scholar] [CrossRef]
- Sylla, T.; Mendiboure, L.; Berbineau, M.; Singh, R.; Soler, J.; Berger, M.S. Emu5GNet: An Open-Source Emulator for 5G Software-Defined Networks. In Proceedings of the 18th International Conference on Wireless and Mobile Computing, Networking and Communications WiMob 2022, Thessaloniki, Greece, 10–12 October 2022. [Google Scholar]
- Open Network Operating System (ONOS®). Available online: https://opennetworking.org/onos/ (accessed on 10 October 2022).
- Mininet-WiFi Emulator for Software Defined Network. Available online: https://mininet-wifi.github.io/ (accessed on 10 September 2022).
- Behrisch, M.; Bieker, L.; Erdmann, J.; Krajzewicz, D. SUMO—Simulation of urban mobility: An overview. In Proceedings of the SIMUL 2011, The Third International Conference on Advances in System Simulation, ThinkMind, Barcelona, Spain, 23–29 October 2011. [Google Scholar]
- Mininet An Instant Virtual Network on Your Laptop (or other PC). Available online: http://mininet.org/ (accessed on 15 October 2022).
- mac80211_hwsim. Available online: https://wireless.wiki.kernel.org/en/users/drivers/mac80211_hwsim (accessed on 15 October 2022).
- The User Manual. Available online: https://usermanual.wiki/Pdf/mininetwifidraftmanual.297704656.pdf (accessed on 11 September 2022).
- OSMWebWizard. Available online: https://sumo.dlr.de/docs/Tutorials/OSMWebWizard.html#getting_started (accessed on 25 October 2022).
- Kendziorra, A.; Weber, M. Public transport, logistics and rail traffic extensions in sumo. In Simulating Urban Traffic Scenarios; Springer: Cham, Switzerland, 2019; pp. 83–95. [Google Scholar]
- Lopez, P.A.; Behrisch, M.; Bieker-Walz, L.; Erdmann, J.; Flötteröd, Y.P.; Hilbrich, R.; Wießner, E. Microscopic traffic simulation using sumo. In Proceedings of the 2018 21st International Conference on Intelligent Transportation Systems (ITSC), Maui, HI, USA, 4–7 November 2018; pp. 2575–2582. [Google Scholar]
- DTU5GRail /5GRail_WP6. Available online: https://github.com/DTU5GRail/5GRail_WP6/tree/main/DTU_Code/Considerd_Scenario/ (accessed on 18 September 2022).
- Wireless B, vs. G vs N vs AC | What is The Difference? Available online: https://homenetworkadmin.com/wireless-b-vs-g-vs-n-vs-ac-difference/ (accessed on 20 October 2022).
- Iperf. Available online: https://en.wikipedia.org/wiki/Iperf (accessed on 19 September 2022).
- What is iPerf/iPerf3? Available online: https://iperf.fr/ (accessed on 19 September 2022).
- Introduction to Scapy? Available online: https://santandergto.com/en/guide-using-scapy-with-python/ (accessed on 21 September 2022).
- Scapy Packet Crafting for Python2 and Python3. Available online: https://scapy.net/ (accessed on 21 September 2022).
- Download and Installation. Available online: https://scapy.readthedocs.io/en/latest/installation.html (accessed on 21 September 2022).
- How to do Video Streaming Using VLC Player. Available online: https://headendinfo.com/video-streaming-using-vlc-player/ (accessed on 25 September 2022).
- VLC Features. Available online: https://www.videolan.org/vlc/features.html (accessed on 25 September 2022).
- What is MTR & How to Use to Troubleshoot & Test your Connections. Available online: https://www.pcwdld.com/what-is-mtr-and-howto-troubleshoot-connections#wbounce-modal (accessed on 8 September 2022).
- What is MTR and Why is it Useful? Available online: https://www.comparitech.com/net-admin/what-is-mtr/ (accessed on 8 September 2022).
- ONOS Java API (2.5.0). Available online: https://api.onosproject.org/2.5.0/apidocs/ (accessed on 5 September 2022).
- What Does VLAN Tagging Mean? Available online: https://www.techopedia.com/definition/32105/vlan-tagging (accessed on 7 September 2022).
- NYC Subway Front Window View—The 7 Express to Manhattan! Available online: https://www.youtube.com/watch?v=ukOHqdPbYYg&list=WL&index=1&t=180s&ab_channel=DJHammersTrains (accessed on 12 October 2022).
- Tutorials. Available online: https://sumo.dlr.de/docs/Tutorials/index.html (accessed on 5 October 2022).


| Scenario | Considered Tool to Demonstrate the Scenario | Tool Information |
|---|---|---|
| Voice Communication for Operational Purposes | iperf3 | Iperf3 can send UDP and TCP packets from one host to another. |
| Standard Data Communication | ||
| Critical Data Communication | ||
| Very Critical Data Communication | Scapy | Using Scapy, we can define our data packets and send them to the network. Using Scapy, messaging and critical data communication is demonstrated. |
| Messaging | ||
| Critical Video Communication for Observation Purpose | VLC Player | To demonstrate video transmission from train or car to the assigned server, VLC player is used. |
| Very Critical Video Communication Associated with Train Safety | ||
| Measure Network Quality of Services (QoS) | MTR | MTR tool has the capability to measure the latency, packet loss, and jitter of the network. |
| Command | Explanation |
|---|---|
| 1. iperf3 [-s|-c] [ options ] | |
| 2. iperf3 –s –p <port number> | Where -s represents host as server, -c represents host as client, –u represents UDP packets, -b is used to set the bitrate, -i option allows setting the reporting interval time in seconds; e.g., iperf3 -c 10.0.0.7 -i 2 |
| 3. iperf3 –c <server IP/host IP> -u –p <port number> -b <bitrate> |
| Options | Linux Command |
|---|---|
| 1. Install default Scapy | pip install scapy |
| 2. Install Scapy with Python | pip install - -pre scapy[basic] |
| 3. Install Scapy with dependencies | pip install - -pre scapy[complete] |
| Command | Available Options | Use |
|---|---|---|
| 1. mtr –r –n –c <number of data packets> -T –P <port number> <server IP/Host IP> | Where r reports print; c defines the number of Packets; n disables the DNS or no DNS option; T shows TCP data; u shows UDP data; | Calculate the loss in percentage |
| 2. mtr –r –n –o ‘’L BAWV MI’’ <server IP/Host IP> | Where L shows loss ratio; B shows min/best RTT (ms); A shows avg RTT (ms); W shows Mmx/worst RTT (ms); V shows standard deviation; M shows jitter mean/avg; I shows interarrival jitter | Calculate the jitter in ms |
| Src/Dst | Car1 | Car2 | Car3 | Car4 | CarServer | Train1 | Train2 | Train3 | Train4 | RailServer |
|---|---|---|---|---|---|---|---|---|---|---|
| Car1 | ✓ | ✓ | ✓ | ✓ | ✓ | X | X | X | X | X |
| Car2 | ✓ | ✓ | ✓ | ✓ | ✓ | X | X | X | X | X |
| Car3 | ✓ | ✓ | ✓ | ✓ | ✓ | X | X | X | X | X |
| Car4 | ✓ | ✓ | ✓ | ✓ | ✓ | X | X | X | X | X |
| CarServer | ✓ | ✓ | ✓ | ✓ | ✓ | X | X | X | X | X |
| Train1 | X | X | X | X | X | ✓ | ✓ | ✓ | ✓ | ✓ |
| Train2 | X | X | X | X | X | ✓ | ✓ | ✓ | ✓ | ✓ |
| Train3 | X | X | X | X | X | ✓ | ✓ | ✓ | ✓ | ✓ |
| Train4 | X | X | X | X | X | ✓ | ✓ | ✓ | ✓ | ✓ |
| RailServer | X | X | X | X | X | ✓ | ✓ | ✓ | ✓ | ✓ |
Publisher’s Note: MDPI stays neutral with regard to jurisdictional claims in published maps and institutional affiliations. |
© 2022 by the authors. Licensee MDPI, Basel, Switzerland. This article is an open access article distributed under the terms and conditions of the Creative Commons Attribution (CC BY) license (https://creativecommons.org/licenses/by/4.0/).
Share and Cite
Singh, R.; Soler, J.; Sylla, T.; Mendiboure, L.; Berbineau, M. Coexistence of Railway and Road Services by Sharing Telecommunication Infrastructure Using SDN-Based Slicing: A Tutorial. Network 2022, 2, 670-706. https://doi.org/10.3390/network2040038
Singh R, Soler J, Sylla T, Mendiboure L, Berbineau M. Coexistence of Railway and Road Services by Sharing Telecommunication Infrastructure Using SDN-Based Slicing: A Tutorial. Network. 2022; 2(4):670-706. https://doi.org/10.3390/network2040038
Chicago/Turabian StyleSingh, Radheshyam, José Soler, Tidiane Sylla, Leo Mendiboure, and Marion Berbineau. 2022. "Coexistence of Railway and Road Services by Sharing Telecommunication Infrastructure Using SDN-Based Slicing: A Tutorial" Network 2, no. 4: 670-706. https://doi.org/10.3390/network2040038