1. Introduction
In the recent decades, the reliable operation of the power grid has become a growing concern. Modern power grids are undergoing a rapid transformation due to the increasing demand for value-for-money from electricity consumers. This demand has recently compelled utility companies and governments to undertake an aggressive overhaul of the electricity sector [
1]. An integration of automation, control, and metering applications has become an inevitable approach. Consequently, the safe operation of such a system must ensure electromagnetic compatibility (EMC) in the presence of various threats. Electromagnetic interference (EMI) refers to the disruption that negatively impacts the functioning of various devices, caused by conducted and/or radiated electromagnetic radiation generated from either internal or external sources [
2,
3,
4]. The main causes of electromagnetic interference include excessive geomagnetic disturbances (GMDs), high altitude electromagnetic pulse (HEMP), intentional electromagnetic interference (IEMI), and others. The industry knows better how to deal with more common EMC threats [
5,
6,
7,
8], whereas bringing GMDs as another threat into the picture highlights new facets of reliable power grid operation.
The changes in the magnetosphere-ionosphere current system that lead to geomagnetic disturbances (GMDs) are caused by the corotating interaction regions (CIRs) and coronal mass ejections (CMEs). CMEs are enormous clouds of charged plasma, low to medium energy particles, and magnetic fields that are ejected into interplanetary space from the sun [
9]. These phenomena have been demonstrated to impact the Earth’s magnetosphere. CIRs occur when the fast solar wind from coronal holes overtakes the slow solar wind already present in interplanetary space, causing a pressure jump and an interplanetary shock ahead of it [
10]. The geomagnetic field short-lasting spikes temporal variations (
), measured on the ground, can affect mid-latitude regions. During the short-time substorms the long-lasting GMDs are dominant in high-latitude regions [
11]. The following countries are more concerned with these type of disturbances: Canada, US, Norway, Finland, Sweden, i.e., countries located in high-latitude regions.
The risks of GMD to modern society are associated with power grid degradation. The geomagnetic field change causes, in its turn, the electric field to change due to Faraday’s law which induces the geomagnetically induced currents (GICs) [
12]. The change in geomagnetic field causes, in its turn, the change in the electric field—the direct proxy of which is the current flowing over neutral measured at the grounding points. GICs are distributed over any conductor system with grounding points, and as an ultra-low frequency electromagnetic noise, they may cause power grid instability or equipment overheating [
13,
14]. The flow duration is the principal distinction between the short-circuit current and the GIC. The GIC amplitude is not constant as the observation results of GIC in deadly-grounded transformer neutrals and varies within the time period. Moderate GICs normally flow in the period from minutes to several days and have the amplitude of several amperes. High-amplitude GIC peaks last for several minutes. Power grid vulnerability is a multi-criteria problem [
15]. The same power system equipment can be vulnerable in multiple ways depending on the GMD type. GICs negatively impact power transformers, which is the primary cause of blackouts resulting from GMDs. The severity of the impact depends on the parameters of the installed power transformers and can lead to a multiplication of electromagnetic, mechanical, and thermal impacts [
16,
17].
GMD’s strength and duration together with the corresponding impact are subject to uncertainty. There exists a wealth of documented evidence that showcases the detrimental impact of GMDs on power grid operation. These pieces of evidence serve as the foundation for knowledge-based investigations aimed at understanding the vulnerability and risk associated with power grids. This is the most straight-forward method for developing appropriate catastrophe scenarios with the given probabilities. The record of severe and extreme events has been compiled using magnetic field data collected from the Colaba and Alibag observatories [
18]. The Hydro-Québec event in 1989 was the most extreme geomagnetic storm occurring during the space era (since 1957) based on the Dst index [
19]. The Dst index is a measure of solar storm disturbance that is calculated using data collected from a network of near-equatorial geomagnetic observatories. Negative values of the Dst index, measured in nano Tesla (nT), indicate the strength of a GMD. Even though the Halloween event in 2003 is defined as an extreme GMD, the Dst value was not low enough [
20], since it had an intensity of Dst
nT. The GMD is treated to be super-intense if Dst
nT. It is important to notice that interplanetary data is not available for the Hydro-Québec event contrary to the Halloween event in 2003. The modern comprehension of GMD physics and their causes is applied to analyze historical magnetograms of past events. The application of this approach has proven successful in reconstructing the Carrington event of 1859, which is regarded as a realistic worst-case scenario. For instance, the 3-D magneto-hydrodynamics model of the Carrington event is presented in [
21]. However, society is more concerned about a modern day repeat of extreme events and their impacts. The possibility of a recurrence of a solar storm event similar to the Carrington event in the next decade falls somewhere between being highly unlikely and unexpectedly possible [
22]. Several comprehensive works were published that provide the evaluation of measurable impact on our modern economy [
23,
24,
25].
The motivation and purpose of this paper lie on the need to develop an enhanced method for GIC registration in real-time for a power grid. The GIC amplitude is treated as a uniform measure of danger that can be processed by various stakeholders. CIGRE working group C4.32 has recently published a technical brochure entitled, “Understanding of Geomagnetic Storm Environment for High Voltage Power Grids”, which stresses that the most effective way to understand the impact of GIC in the grid is to measure the GIC itself in the transformers neutrals and the total harmonic distortion (THD) in the grid [
26]. A novel method for increasing GIC measuring accuracy is introduced in this paper. The feature of low signal-entropy is used. The definition “entropic” is employed to denote the amount of information per state. The structure of the paper is as follows. First in
Section 2, we introduce a novel approach for improving GICs measurement accuracy. Then in
Section 3, we discuss the problem of GMD modelling and describe uncertainty sources across the process. Finally, the paths towards minimizing their impacts are described in
Section 4.
2. Improving the Geomagnetically Induced Currents Measurement Accuracy
The era of GICs measurement started in late 1970s with the recording of the trans-Alaska pipeline [
27], Bavarian pipeline [
28], and Finnish power grid [
29]. The long GIC monitoring record allowed for the validation of the GIC modelling procedures. The increasing attention on the evaluation of GICs has led to the establishment of the first NASA’s International Living With a Star (ILWS) working group in 2014, dedicated to addressing the GIC issue [
30]. Among all, the objective of the groups was to identify, advance, and address the open scientific and engineering questions related to GICs.
However, accurate GIC measurement requires a fundamentally new approach due to the following features:
The process under study has an extremely low entropy, meaning that it generates very limited information. The information content per unit of time extracted from a registered GIC is minimal.
Prevalence of other processes that completely overlap the GIC spectrum such as thermal noise.
The approach for overcoming those issues is given below. The GIC is a case of a random process. The mathematical apparatus of the standard probability theory can be used for the analysis. It can be well predicted with a time resolution of several seconds or more. The process itself can be regarded quasi-determined as the deterministic component prevails. A random component carries information conformed to the mathematical theory of information. Nonetheless, its share is trifling. Two scenario for overcoming this problem exist:
The ample growth of the allocated time for the parametrization of GMD—in contrast, this limits the efficiency of emergency response.
Reducing the accuracy of GMD signal parameterization may result in an increase in economic losses.
The amount of information obtained from the measured GIC is determined by important factors such as the signal-to-noise ratio in the measuring channel and the wavelength of the recorded signal. These factors are considered in Equation (
1)—formula for coefficient of variation. The recorded signal and GIC maximum mutual entropy is represented by Equation (
1). This refers to the highest possible amount of information that can be obtained from a GIC in order to parametrize a GMD.
where
is the signal-to-noise ratio in the measuring wavelength.
Equation (
1) is accurate, though the computational difficulties are provoked by the improper integral calculation. The Equation (
2) represents the approximation of Equation (
1). The drawback is absent for the proposed approximation. The approximation error is small in case
and can be neglected.
where
is the discrete Fourier transform of the recorded signal samples;
is the GIC frequency band; and
N is the window size for discrete Fourier transform of the recorded signal.
Normally, the noise level is weaker than the signal. Furthermore, the frequency range for the GIC and the modern measurement equipment thermal noise is the same. The merit for any is small. Consequently, it leads to the small values of coefficient of variation. The registered signal can be considered as low-entropic. The definition “entropic” is used to denote the amount of information per state. The task of GMD parametrization is complicated by the well-known problem of determining the constant component. Currently, there is no adequate solution to this problem because of the sharp increase in thermal noise spectral density at frequencies approaching zero.
The GICs present a unique challenge for signal analysis due to their low entropy and limited information content. Separating GICs from other signals with similar spectral characteristics requires new methods, as current techniques are not sufficient. The difficulty in accurately determining the constant component of GICs exacerbates this issue. Two potential solutions are proposed: optimizing mitigation actions and economic losses, and improving measurement equipment by considering the low-entropy features of GICs.
The current noise cancellation procedures are not very effective and can be costly. Instead, compensation methods are preferred. It is important to note that the GIC and recorded signal have different time dependencies, and the noise in the GIC is added during the recording process. Therefore, it can be compensated for. Additionally, since GIC has low entropy, it can be predicted with high accuracy at small intervals, similar to thermal noise.
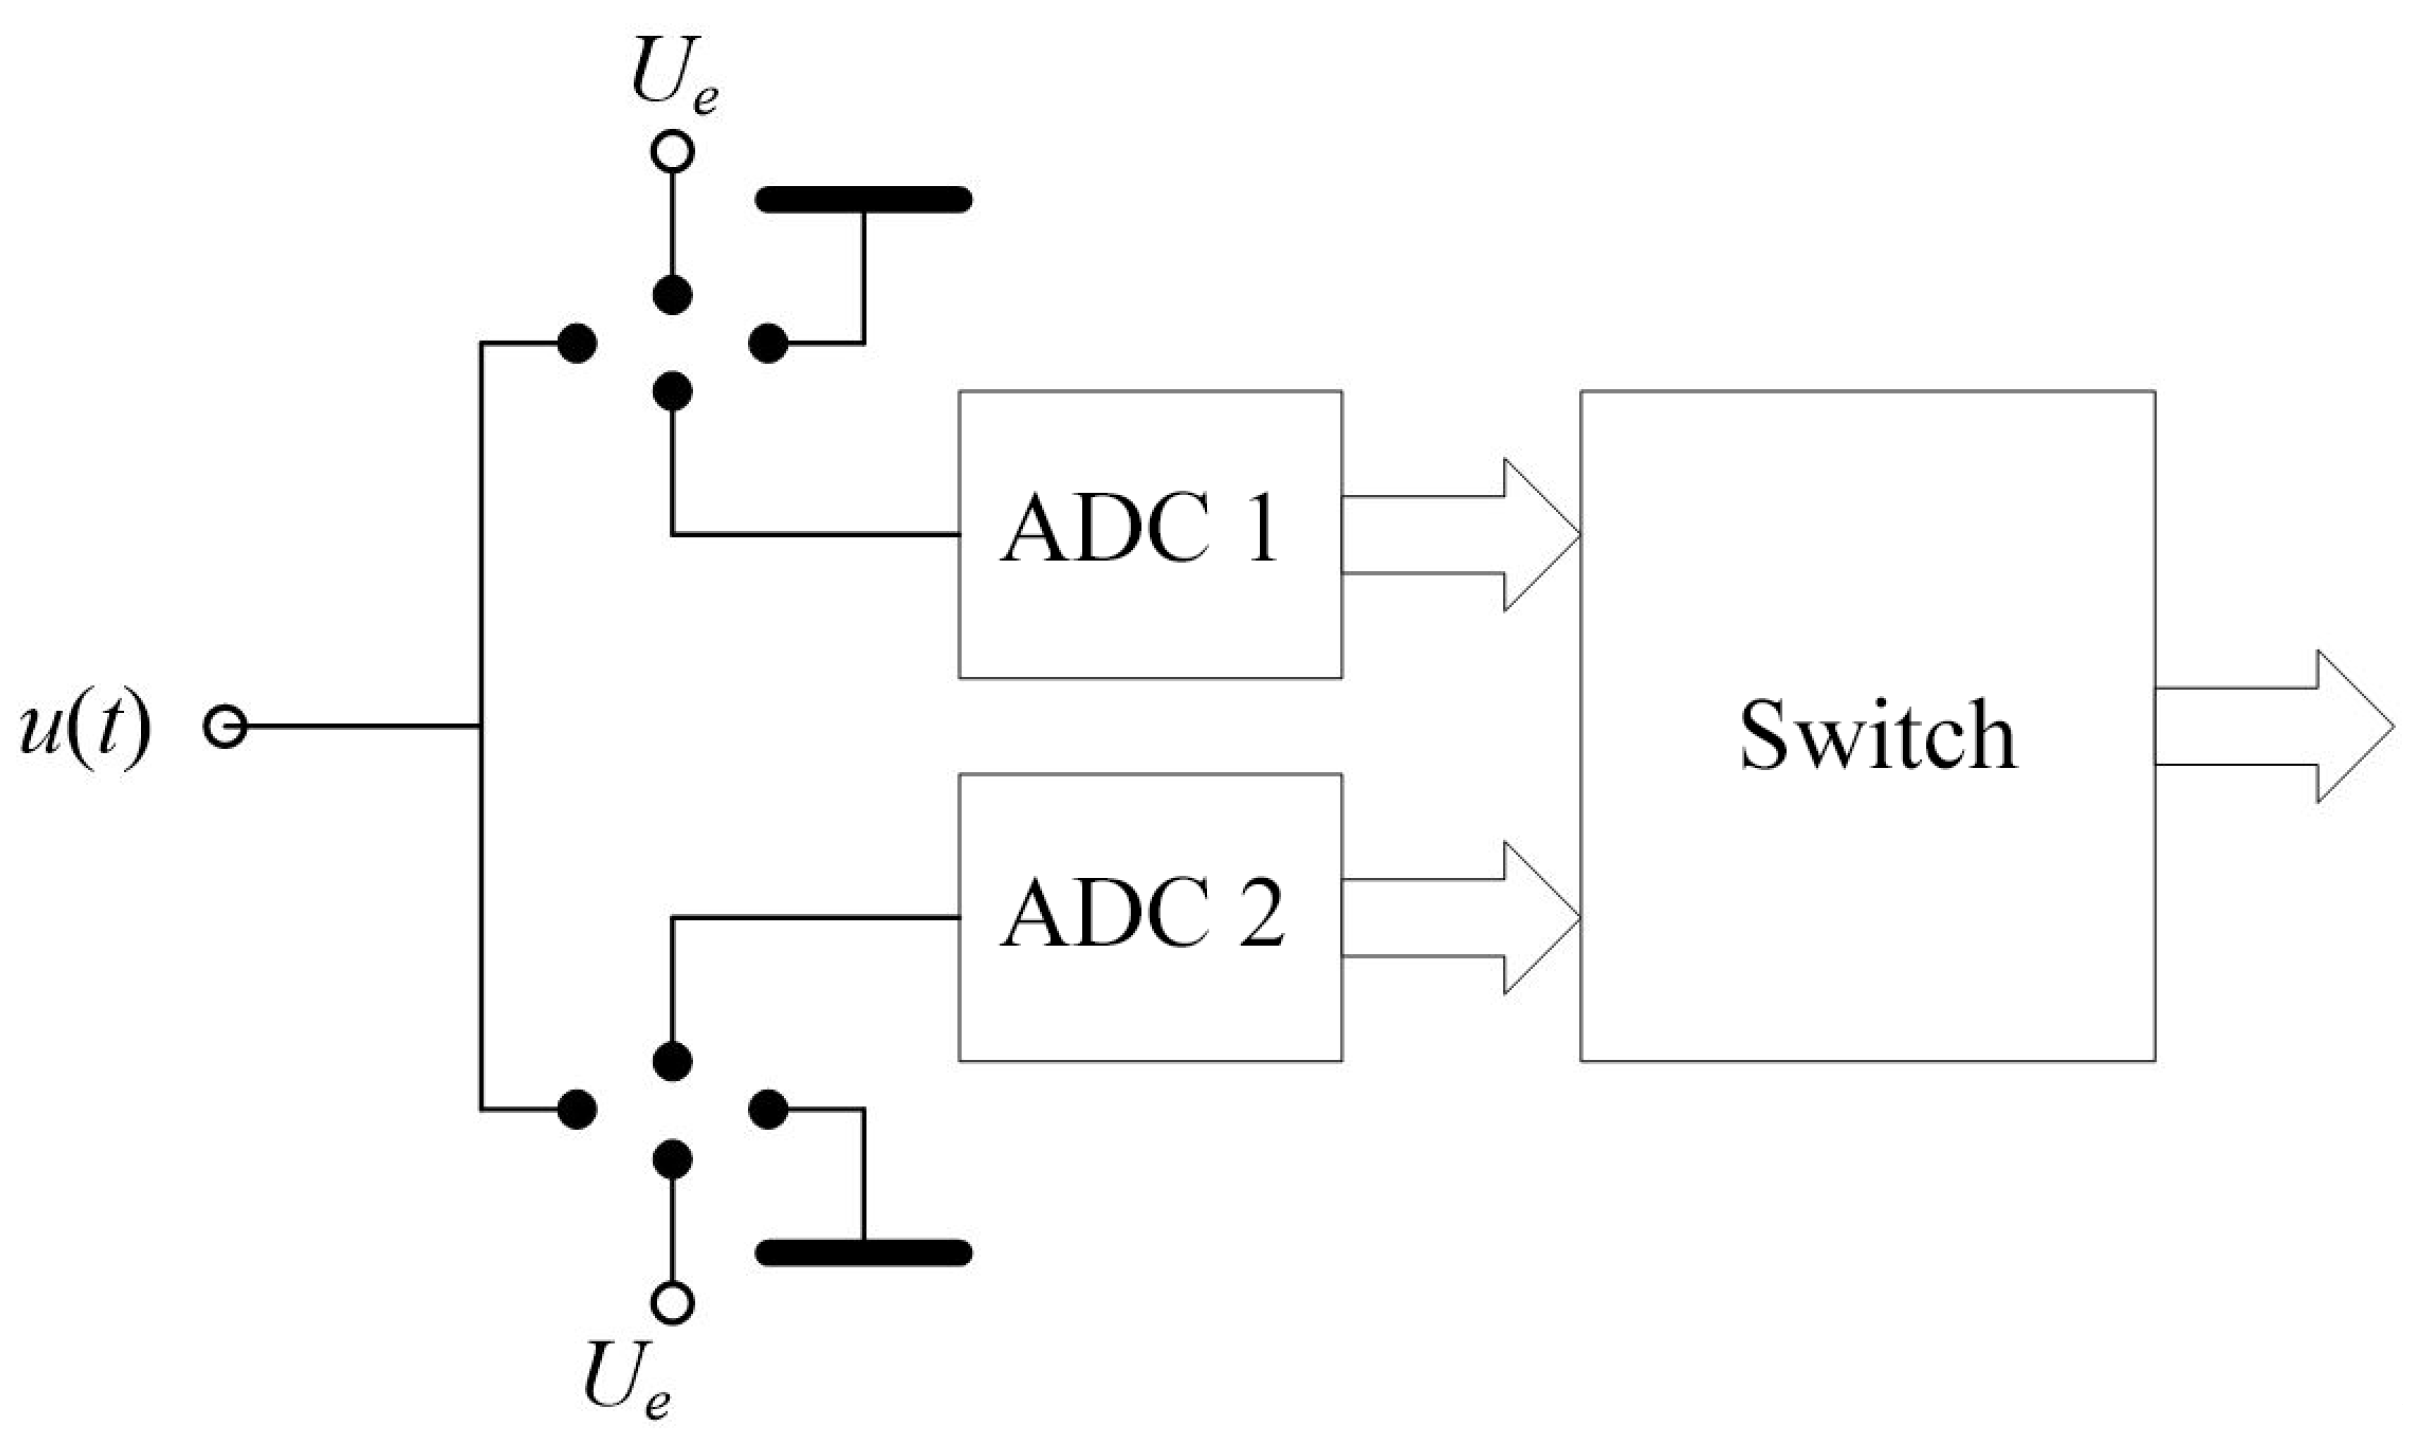
The proposed compensation device scheme is shown in
Figure 1. The GIC signal is fed to an analogue-to-digital converter (ADC), which alternately uses two channels (ADC 1 and ADC 2) to sample and quantize the signal. ADC is susceptible to internal (ageing) and external (temperature) impacts as any other measurement device. This impacts the zero-level accuracy and gain signal. The impact of other parameters can be neglected. Despite the narrow spectrum (≪1 Hz) of the registered processes, a high sampling frequency (e.g., 1 kHz) is chosen to ensure accuracy. The inputs betwixt ADC1 and ADC2 can be switched every few minutes due to the signal’s low-entropy. In this case, one ADC digitalizes the signal and the other one performs its calibration. During calibration, the ADC is switched to the ground, serving as the zero level standard
, and to the reference voltage
. This activates the compensation algorithm, which is executed when the signal is fed to the calibrated ADC. This process enables the spurious DC component to be distinguished from the measured GIC signal, specifically neutralizing the temperature gain coefficient
k.
The signal after ADC can be mathematically expressed as:
where
is the distorted signal due to temperature drift; and
is the true GIC signal.
In case ADC is grounded, it measures the signal
. The signal is described as
, whenever ADC is switched to the
reference voltage:
The values of the spurious constant component and the current gain signal are as follows:
Furthermore, the true GIC signal
can be found as:
The proposed method can be improved by using various algorithms for edge distortions averaging and compensation or by digital filtering. It is viable to create a scheme with one ADC, whilst the omitted signal is recreated using interpolation methods. Growing societal awareness of the phenomenon extends the list of sites, where the measurements are performed. The database of measured GICs amplitudes is worthwhile data verification basis used for power grid EMC assessment in the presence of GIC. It is advisable to collaborate closely with industry partners to establish a repository for collecting data from multiple stations with broad geographical coverage during significant geomagnetic events [
31]. Registered data is also used for training extreme-value models. The uncertainty in occurrence loss for 1-in-100 years scenario ranges from
% to
% [
32]. The North American Reliability Corporation (NERC) started collecting data in 1984 and compelled in 2007. US Department of Energy was established in the late 1970s (initiative EIA-417). Nevertheless, the data completeness and quality should be validated and approved.
3. The Task of Geomagnetic Disturbances Ground Effects Assessment
The task of GMD impact assessment to power grids stays beyond the problem of EMC ensuring in the presence of the threat. GMD can have large geographic footprints that may encircle large portions of the grid. They can cause multiple correlated failures on the power grid which may rapidly end the security of the network [
33]. The consequences of such an event are near infinite and the probability is unknown, the risk calculated appear as “zero times infinity”. Therefore, the task of GMD risk assessment should be redone through the scope of the reliable operation of the whole system that encompasses the power grid with the interlinked industries.
Risk includes a concept of uncertainty, since risk of an event is subjective. Risk is described as a combination of given scenario, the consequences, and its probability, where a scenario is determined as an identifiable outcome [
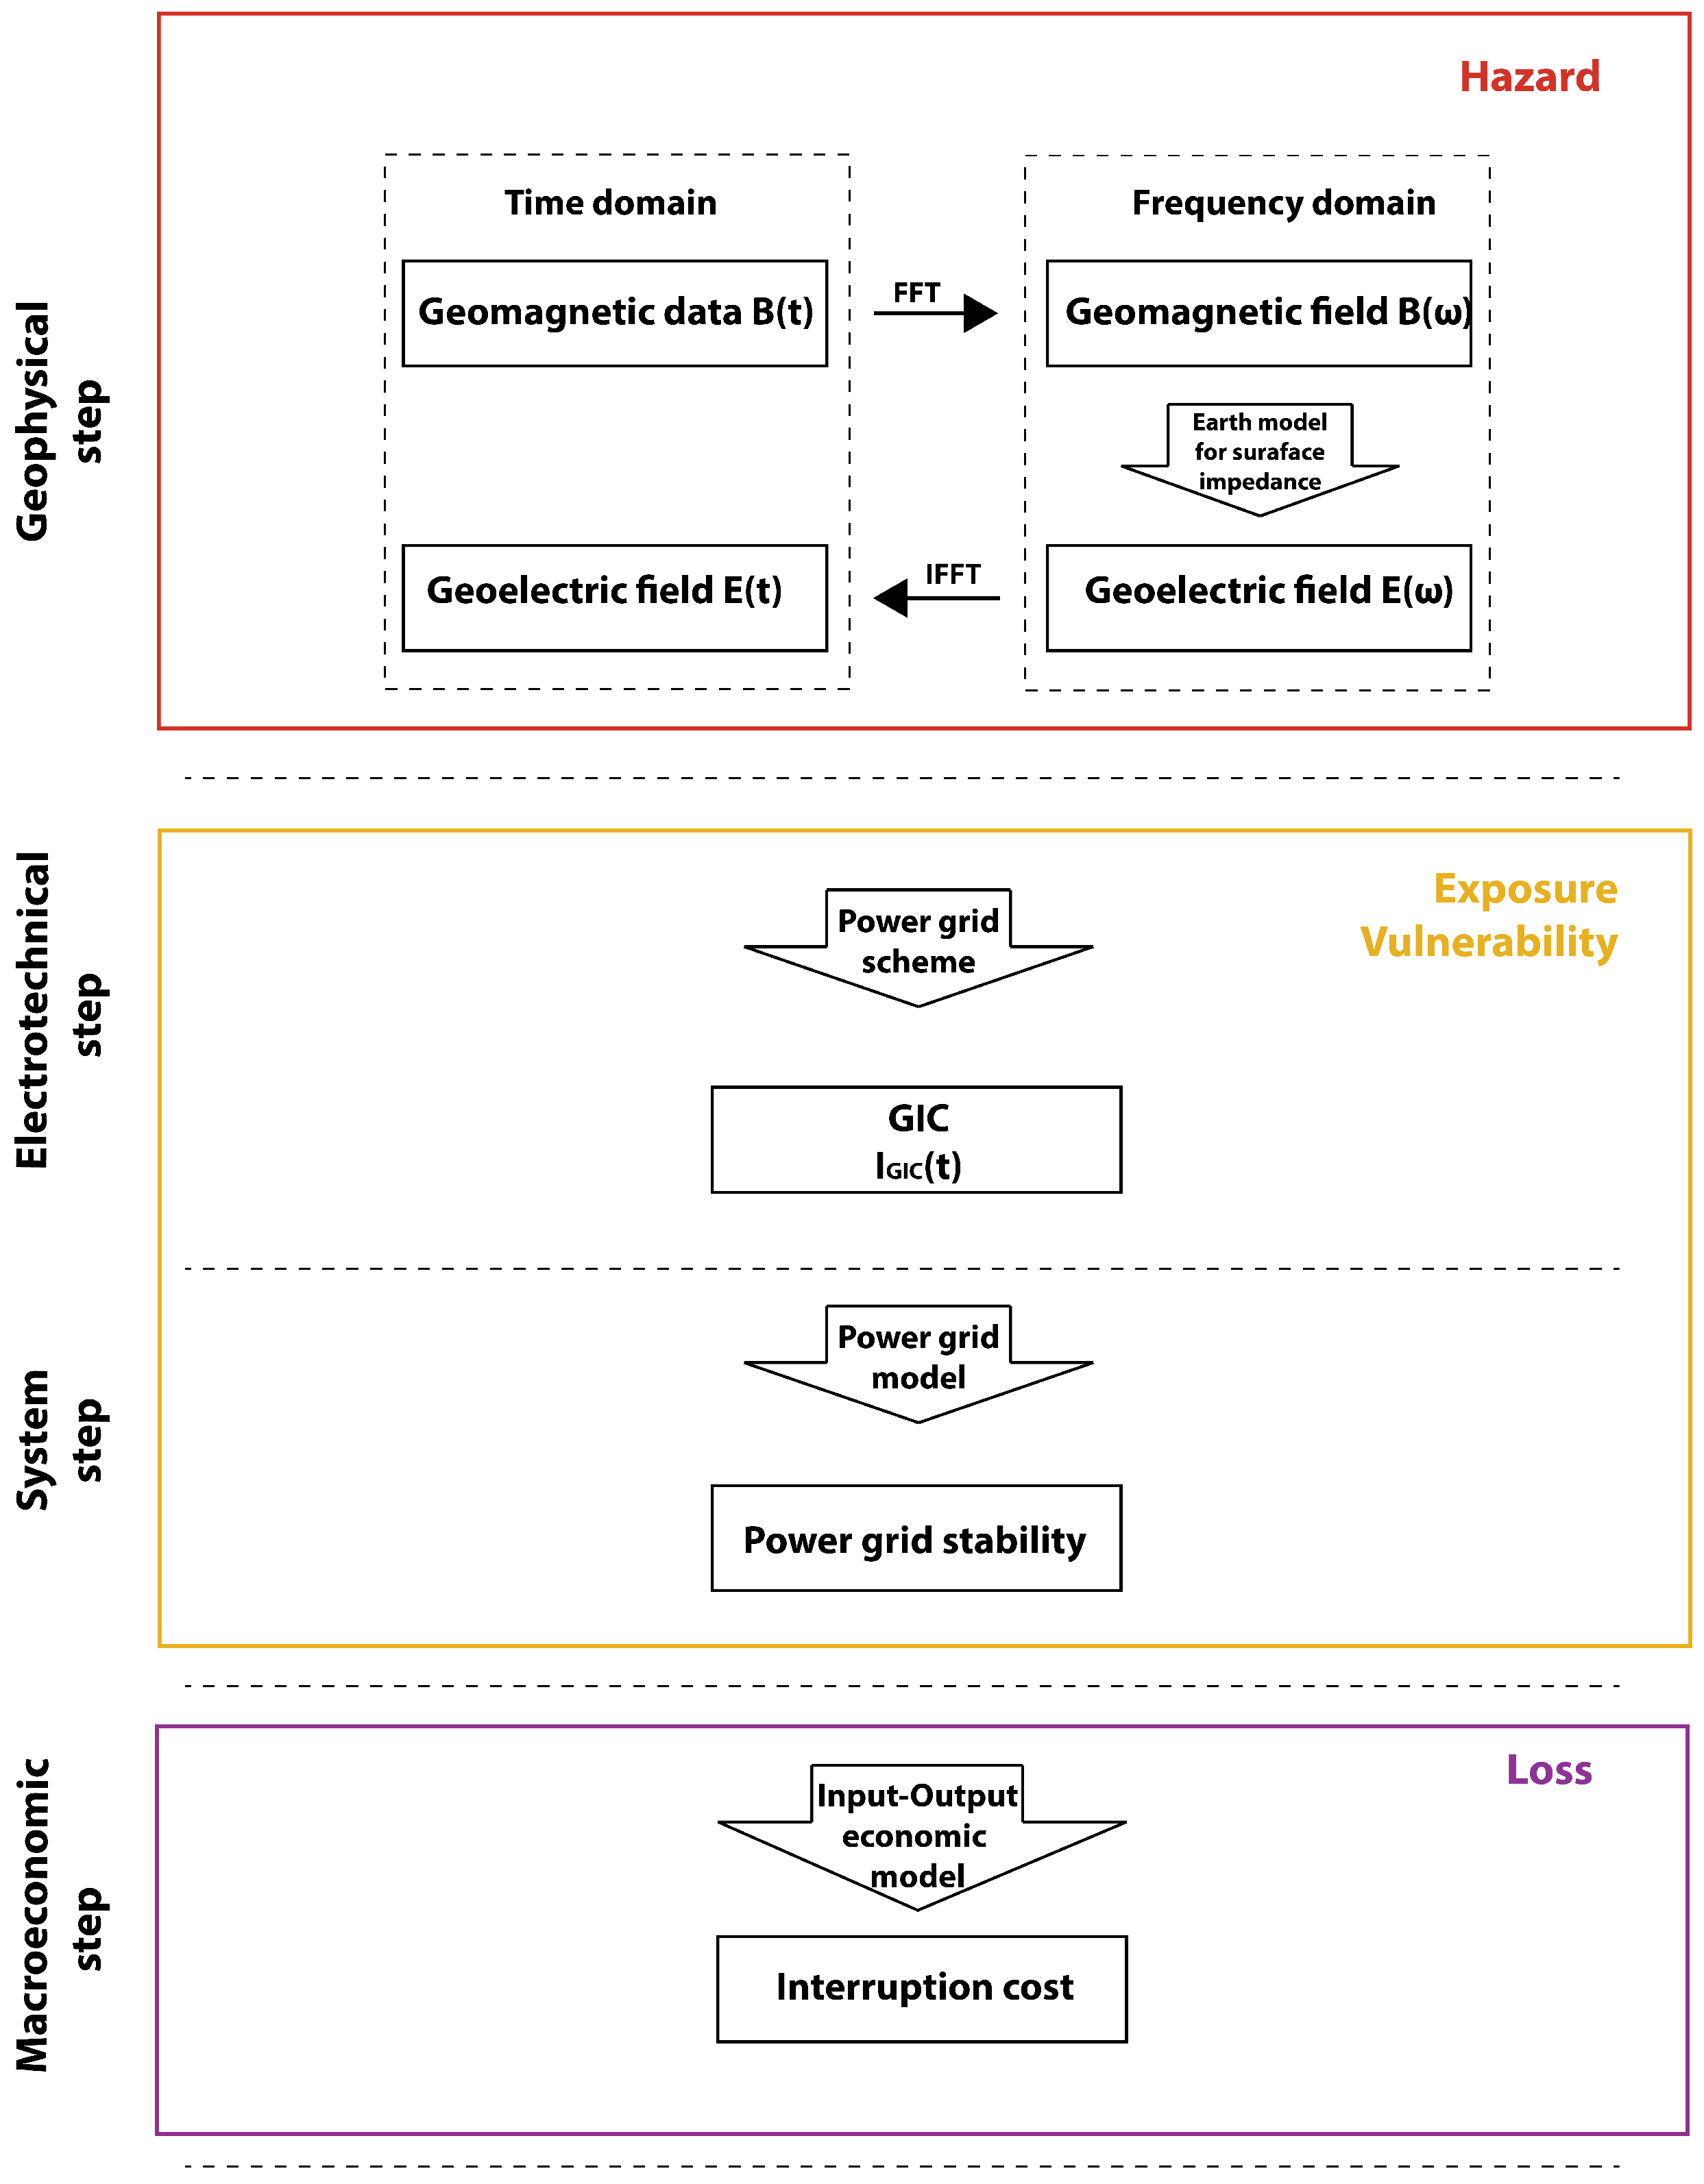
34]. The task of the GMD influence on modern economy can be represented as a four step approach as depicted in
Figure 2. Initially, the geophysical step is performed, which includes the calculation of geo-electric field using the data from the closest geomagnetic observatory and the data of surface impedance. The electrotechnical step involves determining the GICs present in the power grid based on its specific characteristics.The first two steps of the algorithm are described in [
35]. System step is devoted to the estimation of negative GIC effects on power grid. Indirect GIC impact is assessed while analysing the change in electromagnetic and thermal conditions of power system equipment, and the effects of its abnormal operation conditions on power grid stability [
36]. Therefore, the
M’ set of power grid states is compared to the
M set of nominative states. Economic loss analysis and mitigation strategies planning are conducted at the end.
Among others, the most critical and important challenge of modern geophysics is the quantitative dependences determination between electro-physical characteristics of the Earth’s crust structural elements and GIC. The geophysical step is independent of network parameters and configurations, as it is determined by the magnetosphere-ionosphere current system, which is influenced by space weather conditions and electromagnetic induction that is dictated by the Earth’s geology. The input for geo-electric field modelling is the data derived from ground-based geomagnetic field measurements. Measured geomagnetic data is used as an input for GMD models for reproducing observed characteristics in the signal of interest. Inaccurate model estimates and misleading errors may lead to poor and costly decisions by the end-users. The
value is employed for validation based on the premise that the time derivative of the ground magnetic field serves as an indicator for the magnitude of the geomagnetically induced electric field or geo-electric field present on the Earth’s surface [
37]. Modelling the Earth conductivity structure is at least as complicated as the CMEs magnetic structure, adding another set of uncertainties to this already thorny problem. The Earth’s conductivity differs in all directions, but the most notable variance occurs as the depth within the Earth increases. The resistivity in the core and mantle decreases as the temperature and pressure increase with depth. This change in the electro-magnetic structure of the Earth’s surface requires the adoption of modelling techniques. The simplicity of one-dimensional (1-D) model compared to others made it the most used method for routine GIC modelling, though limitations in data affect the calculation accuracy. Therefore, the 1-D models should be considered only as effective approximations that allows representing geophysics conditions satisfactorily. If more sophisticated conductivity models are not readily available, a piecewise approach can be adopted to offer a rough approximation of accounting for lateral variations in the conductivity structure [
38]. The GIC distribution in the power grid modelling requires the knowledge of the power transformers parameters, grounding and transmission lines resistances. Specified resistances are utilized as a basis for constructing a network model which is used with the electric fields as inputs to determine the GIC in each branch of the network [
39]. Unlike transmission line parameters, the exact grounding resistance values are seldom precisely known. The grounding resistance is determined by the chosen construction, which is in turn reliant on local soil properties. Typically, this information is extracted from the limited results of magnetotelluric surveys published in geophysical papers.
The GIC amplitudes in the given grid, which is the output of the electrotechnical step, are treated as a uniform measure of a danger that can be processed by various stakeholders. Therefore, particular attention is paid to the determination of critical GIC amplitudes, since they may perform as a solid base for the legal norm development. Together with the power grid architecture and parameters, it determines the risk level to GMD effects. The flow of GICs over grid components has the potential to cause harmful impacts on the stability of the grid. It may lead to a power transformer half-cycle saturation and, consequently, to unit heating, reactive power deficit, and harmonic distortion. The pathways to blackout are described in [
40]. The GMD does not always lead to a failure of the power grid. Its impact can be rather moderate. For instance, the incidence of constrained transformers and transmission losses in PJM’s 500 kV transmission system were statistically related to the GIC proxy [
41]. The rigorous GIC amplitude modelling is needed in order to develop optimal mitigation measures. A cost-risk approach can be used to determine the appropriate level of hardening for a technological system. It is important to note that each technological system is susceptible to a specific range of GIC amplitudes, meaning that there is no universal threshold for destructive GIC levels. The risk of overestimating GIC amplitudes can result in significant economic expenses, while underestimating them can lead to even greater economic losses. Therefore, in addition to preparing for worst-case scenarios, continuous GMD modeling is essential for situational awareness and early detection of potential risks. By continually monitoring GIC levels and their potential impact on the power grid, scientists can help mitigate the negative consequences of GMD events. The required inputs for each of the steps are as follows:
Geophysical step
GMD scenario
Ground conductivity
Electrotechnical step
Outputs of the first step
Power grid architecture
Transmission line resistivity
Power system equipment parameters
Grounding parameters
System step
Outputs of the second step
Power system equipment parameters
Nominative power grid parameters
Stability limits
Operation state
Macroeconomic step
The definition of hazardous parameters can differ depending on technological advancements and societal development. Even an event of relatively low magnitude can result in unfavorable outcomes in the operation of critical infrastructure in modern times. Despite the development of technological systems vulnerable to GMD effects, exposure accumulation that comes with economic growth and urbanization are the main factors. The economic development driven factors impact the full spectrum of uncertainties in the electrotechnical, system and macro-economical steps. The wide ranging impacts cause the accumulation of uncertainties [
42].
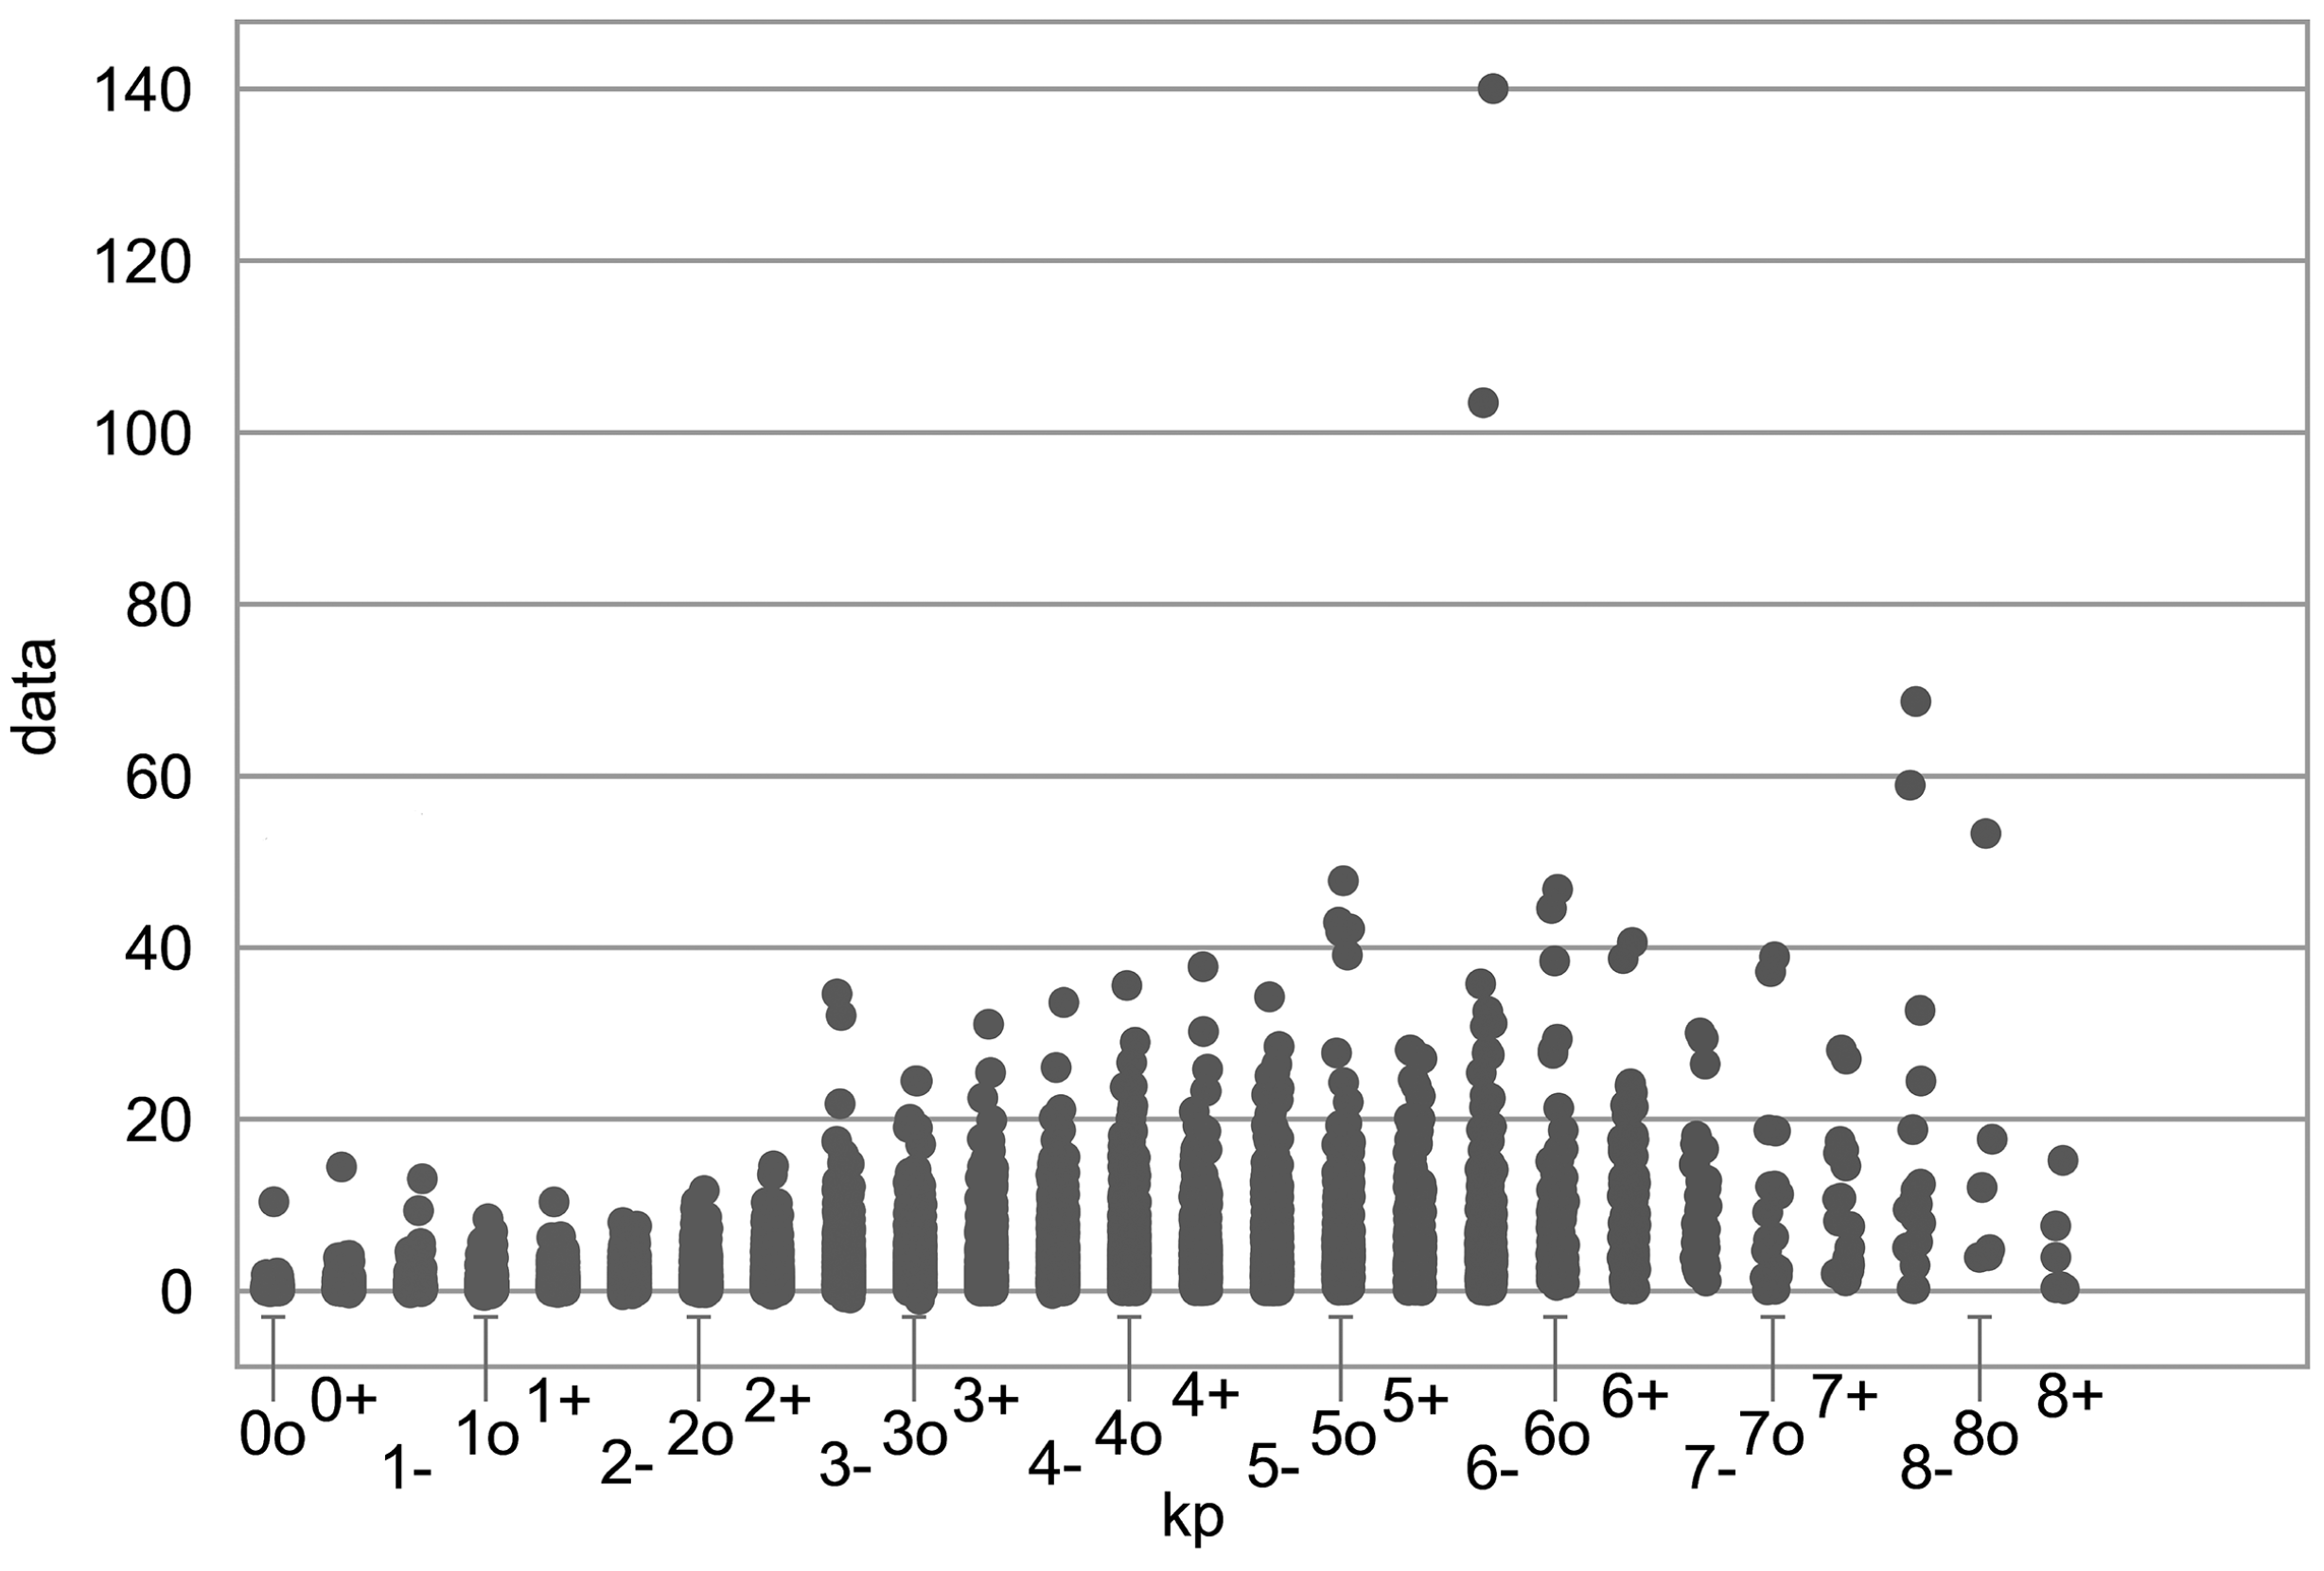
The correlation between the GMD severity represented as
index and the generated GIC measured at Vykhodnoy substation in north-western part of the Unified Power System of Russia is represented in
Figure 3. The
index (Kennziffer-Planetarisch) is one of the most used in space weather investigations. Similar to the Richter scale for earthquakes, it is a quasi-logarithmic parameter, from 0 (quiet) to 9 (extreme), given on a 3-hour basis measured on the basis of observations from 13 geomagnetic stations (eleven in the northern and two in the southern hemisphere). It describes the overall geomagnetic activity.
As it is seen from
Figure 3, high GIC amplitudes, which are of interest to the general public, do not always correspond to the strong geomagnetic activity. The sudden GIC amplitude jumps in
Figure 3 correspond to power grid scheme changes. In particular, these amplitude increases are related to the disconnection of one of the parallel power transformers installed on the 330 kV Vykhodnoy substation. It is a widely acknowledged fact that during severe geomagnetic storms (also known as super-storms), GICs can cause disruptions in power grids, transformers, and relay systems, with the potential to affect a significant geographic area [
13]. The time derivative of the ground horizontal magnetic field (
) gives a meaningful measure of the induced electric field or GIC activity [
37]. Several other types of GMD can lead to notable GIC excitations apart from the active storm phase specified by strong magnetic field depression. These types are sudden impulse (SI), sudden commencement (SC), low frequency irregular pulsations, and substorm onset or intensifications [
43]. SI or SC prior to the main phase of the storm can result in power system failures [
44,
45]. More information on the causes of extreme GICs is given in [
46,
47,
48].
4. Discussion
The huge increase in the number of power electronics installations substantially raises the susceptibility of electrical and electronic devices to high and low frequency interferences. This has brought EMC and power quality into the focus. The level of preparedness is a critical factor in responding effectively to severe events. Currently, the GMD risk is not well understood. Although both scientific and engineering communities have progressed, the forecast is not mature enough to the point where likelihood, magnitude, vulnerabilities, and consequences can be predicted with the same level of confidence as for the terrestrial hazards. Catastrophe modelling is an essential tool for providing insights for regions with no historical exposure. It remains as the only available approach even, if uncertainty is high.
Forming a view on risk is not a one-off process. Ongoing research is focused on analyzing power grid stability under GIC in high-risk regions. Mitigation standards have been developed through modelling the effects of GMD on power systems, emphasizing the importance of such research [
49]. One of the largest U.S. electric utilities, American Electric Power company, analyzed network’s stability to certain GMD scenarios [
50]. The GMD scenarios were analyzed to calculate GICs and incorporate the resulting reactive power losses into the power flow model for power grid stability analysis. However, the potential impact of high harmonics distortion was not considered. Subsequently, the power transformers that were at risk were identified based on the distribution of high GIC values. It was concluded that an electric field of 13 V/km may cause a voltage collapse. In contrast, a field of 2 V/km is enough to provoke a voltage avalanche in Hydro-Québec grid [
51]. There is a need for 660 MVAr reactive power capacity in the Finnish grid to support the 1200 A annual flow via the transformer neutrals to and from the ground. From the system point of view, this implies that a voltage collapse and blackout could potentially occur once every 20 years, assuming an extreme event takes place [
52]. The power transformers at risk were simulated for AltaLink network, Canada [
53].
The difference in results is not only driven by the variety of considered geophysical conditions, but also in the transparency of exposure representation. Exposure modelling involves quantifying the geographical distribution of affected infrastructures for the given hazard severity. The general information on power grid architecture can be found in the open-source, though precise information on nodes geocoding is rarely available. If no detailed information is found, the transmission lines are presumed to be straight, though the topology of the region defines the transmission line path. Consequently, the real GICs are smaller than the calculated ones. Due to their nature, the geographic coordinates of the power plants can be determined with a sufficient accuracy. In contrast, the geocoding of substations is more challenging. The geographical coordinates of a substation are usually tied to the location of the settlement in which it is located.
Calculating GIC in power systems requires not only knowledge of geophysical conditions but also detailed information about power grid parameters. Both can result in a calculation error. Unlike a typical AC power flow analysis, GIC analysis necessitates additional data. The absence of information on transformer configuration and substation grounding is concluded to be crucial by the US Department of Energy. The design review documentation can be helpful for extracting missing information on power transformer’s design for the units younger than 20 years. The outline drawings and test reports can also be used. Moreover, the missing data can be purchased from the manufacturer. In general, power transformers can be divided in four groups as a function of the geographical-technical susceptibility to GMD as proposed by [
54]. The average absolute error, as a function of storm’s magnitude, grows with the amplitude increases from 0.004 pu for 1 V/km to 0.03 pu for 9 V/km. The geo-electric field direction is another calculation error source as the transmission line vulnerability depends on the mutual orientation of the field and transmission line. Therefore, the absolute error for a constant field amplitude periodically changes with a varying storm direction.
The task of hazard modelling can be defined as a problem of correlating the impact severity in different geographic areas. In this case, the primary correlation is expressed through the correlation of the hazard intensity values. If a GMD of a given intensity is observed at point A and a GMD of the same intensity is recorded at a point B, the commensurability of damage levels can be assumed. In case the damage values significantly differ, the second uncertainty associated with the estimation of loss should be calibrated. The exposure deviation should be assessed not as a change in the GDP, but as a fixed capital value change, since critical infrastructure degradation is not expressed in the GDP change.
Overall, three power system states can be distinguished: normal, pre-emergency and emergency, and the information about them is constantly transferred to the dispatching centres. The probability of receiving an information about a normal state is 0.999, for pre-emergency state is 0.0009, and for the emergency state is 0.0001. From Shannon’s information theory point of view, the first message practically contains no information, as it was anticipated by the dispatcher. The second message is unlikely, and the consecutive action is needed. Therefore, the second message contains more information than the first one. The smallest probability corresponds to the third message, hence it requires the maximum amount of actions taken by the dispatcher. In other words, this message contains more information than the previous two. It means that the lower the probability of receiving a message, the higher the amount of data it contains. Accordingly, it stresses the importance of an accurate measurement in the presence of the threat.
5. Conclusions
The inevitable need to integrate various automation, control and metering applications in the power grid poses new requirements for EMC assurance. Bringing GMDs as another electromagnetic interference source into the picture highlights new facets of power grid reliable operation. The GIC amplitude is considered to be a uniform measure for GMD risk assessment that is understood by the broad society. The concept of treating measured GIC amplitude as a modifier of the power grid risk assessment to GMD—from the EMC ensuring, in particular, and reliable system operation as a whole—is introduced in this paper. The feature of the low-entropic nature of the GIC signal is used for increasing measuring accuracy. The relevant method is proposed in the paper.
Merely knowing the amplitude of the GIC is insufficient for determining the impact it may have on a power system (‘pass’ or ‘suffer’). A comprehensive analysis of power system performance under GMD conditions reveals that it is a complex, multi-dimensional issue. The accurate estimation of input data for hazard modelling results not only in the correct calculation of GIC amplitudes, but also it defines the accuracy of the system risk understanding. Variations in modifiers and the strength of interdependencies between them may have a large impact on system level analysis results. Accurately calculating the distribution of GICs is a silver bullet for obtaining an adequate catastrophe scenario for past, present, and future GMD events that may pose a threat to society’s well-being. While the up-to-date-modelling demonstrates good correlation between measured and simulated GICs, some significant differences in predicted GIC magnitudes are still to be resolved. One should be aware that the true uncertainty is unquantifiable and likely much larger than it is thought to be. However, the paths for improving measurement and modelling accuracy are presented in the paper.


