1. Introduction
Obesity is a world health problem that is a global epidemic and is often caused by multifactorial disease [
1]. In addition to genetic factors, obesity is also influenced by environmental factors such as a high intake of calories compared to output. The Global Burden of Disease (GBD) tool states that an increase in body mass index (BMI) values to ≥30 kg/m
2 is defined as obesity [
2,
3]. Obesity can increase the morbidity and mortality of cardiovascular disease (CVD) directly and indirectly [
4].
One of the most dangerous CVDs is coronary heart disease (CHD). Dyslipidemia is one of the early signs of CHD, which is also associated with an increase in total cholesterol (TC) from its normal amount. Dyslipidemia is a condition of abnormalities in blood fats, such as increased low-density lipoprotein (LDL), triglycerides, and decreased high-density lipoprotein (HDL) [
5]. Increased LDL levels in blood circulation can be reduced by LDL degradation stimulated by low-density lipoprotein receptors (LDLRs), which are present on the cell surface. When there is a decrease in cholesterol in the cell, it activates sterol-regulatory element-binding protein (SREBP)-2 to form a complex with SCAP as a transcription factor for the LDLR gene to absorb LDL [
6,
7,
8].
Static magnetic fields (SMFs) are electromagnetic and are more applied in therapy because only simple magnetic disks are used to generate them both in vitro and in vivo [
8]. Based on its intensity, SMFs are classified into several types, namely, weak (>1 mT), moderate (≥1 mT–1 T), strong (1–20 T), and very strong (>20 T). The intensity is often used in many kinds of research for its potential for biological and therapeutic effects and is widely developed in the moderate intensity range [
9,
10]. Molecular mechanisms of the effect of static magnetic fields on cellular processes are still the target of research. So far, the effect of SMF exposure in cellular processes is by influencing ion transport across the membrane by activating ion channels so that it can influence the movement of ions across the plasma membrane, which causes changes in ion concentrations in the cell environment [
11]. This exposure influences the membrane to modulate the amount of intracellular Ca
2+ through the calmodulin pathway.
Continuous increases in LDL levels in the blood will cause an accumulation of LDL and will form atherosclerotic plaques in the coronary arteries, which can increase the risk of CHD. The effect of SMF exposure on CHD risk has not been carried out, but in previous studies, exposure to SMFs with an intensity of Bmax = 2 mT and a duration of 1 h per day in obese mice reduced the weight of the mice [
12]. Therefore, this study wants to observe the effect of exposure to SMFs of Bmax = 2 mT; we expect to see an increase in LDLR gene expression and SREBP-2 protein levels, which can prevent atherosclerosis as a cause of a reduced risk of CHD.
2. Method
2.1. Study Approval
The Ethical Committee of Universitas Indonesia approved the animal welfare and experimental procedures (number KET-374/UN2.F1/ETIK/PPM.00.02/2022).
2.2. High-Fat Diet Induction
Thirty male mice of the C57BL/6J strain, aged six weeks, were used in this study. Mice were formed into two groups of feed: normal feed and a high-fat diet (HFD). Feeding was carried out for more than 12 weeks. Then, the mice were divided into six groups. The first group was the control group, which was given normal food. Then, the HFD group, which will be called the obesity group, was divided based on the length of time of exposure, namely, Obes0, Obes2, Obes7, Obes14, and Obes21. Confirmation of obese mice was done by calculating the Lee index using the formula for the mice’s body weight (g) divided by the length of the mice. If the result was >0.31, then the mouse could be said to be obese.
2.3. SMF Exposure
SMF exposure was carried out for 1 h per day with an intensity of Bmax = 2 mT. Mice were exposed according to group: Obes0 was not exposed, Obes2 was exposed for two days, Obes7 for seven days, Obes14 for 14 days, and Obes21 for 21 days. Every group of mice to be exposed was placed in a closed cage with an area of 30 × 20 × 15 cm, with five mice per cage. The cage was placed in the middle of the two coils of the Helmholtz coil for exposure.
2.4. Measurement of Cholesterol and LDL Levels
Measurement of total cholesterol levels in mice was carried out before and after exposure. Measuring total cholesterol levels in mice was carried out using the colorimetric enzymatic method using the Glory diagnostics kit. This measurement is carried out by taking blood plasma samples before exposure to blood plasma, which is taken in the orbital sinus section. Then, the absorbance was measured using a UV–vis spectrophotometer at a wavelength of 500 nm.
2.5. Expression of SREBP-2 Protein Using Immunohistochemistry
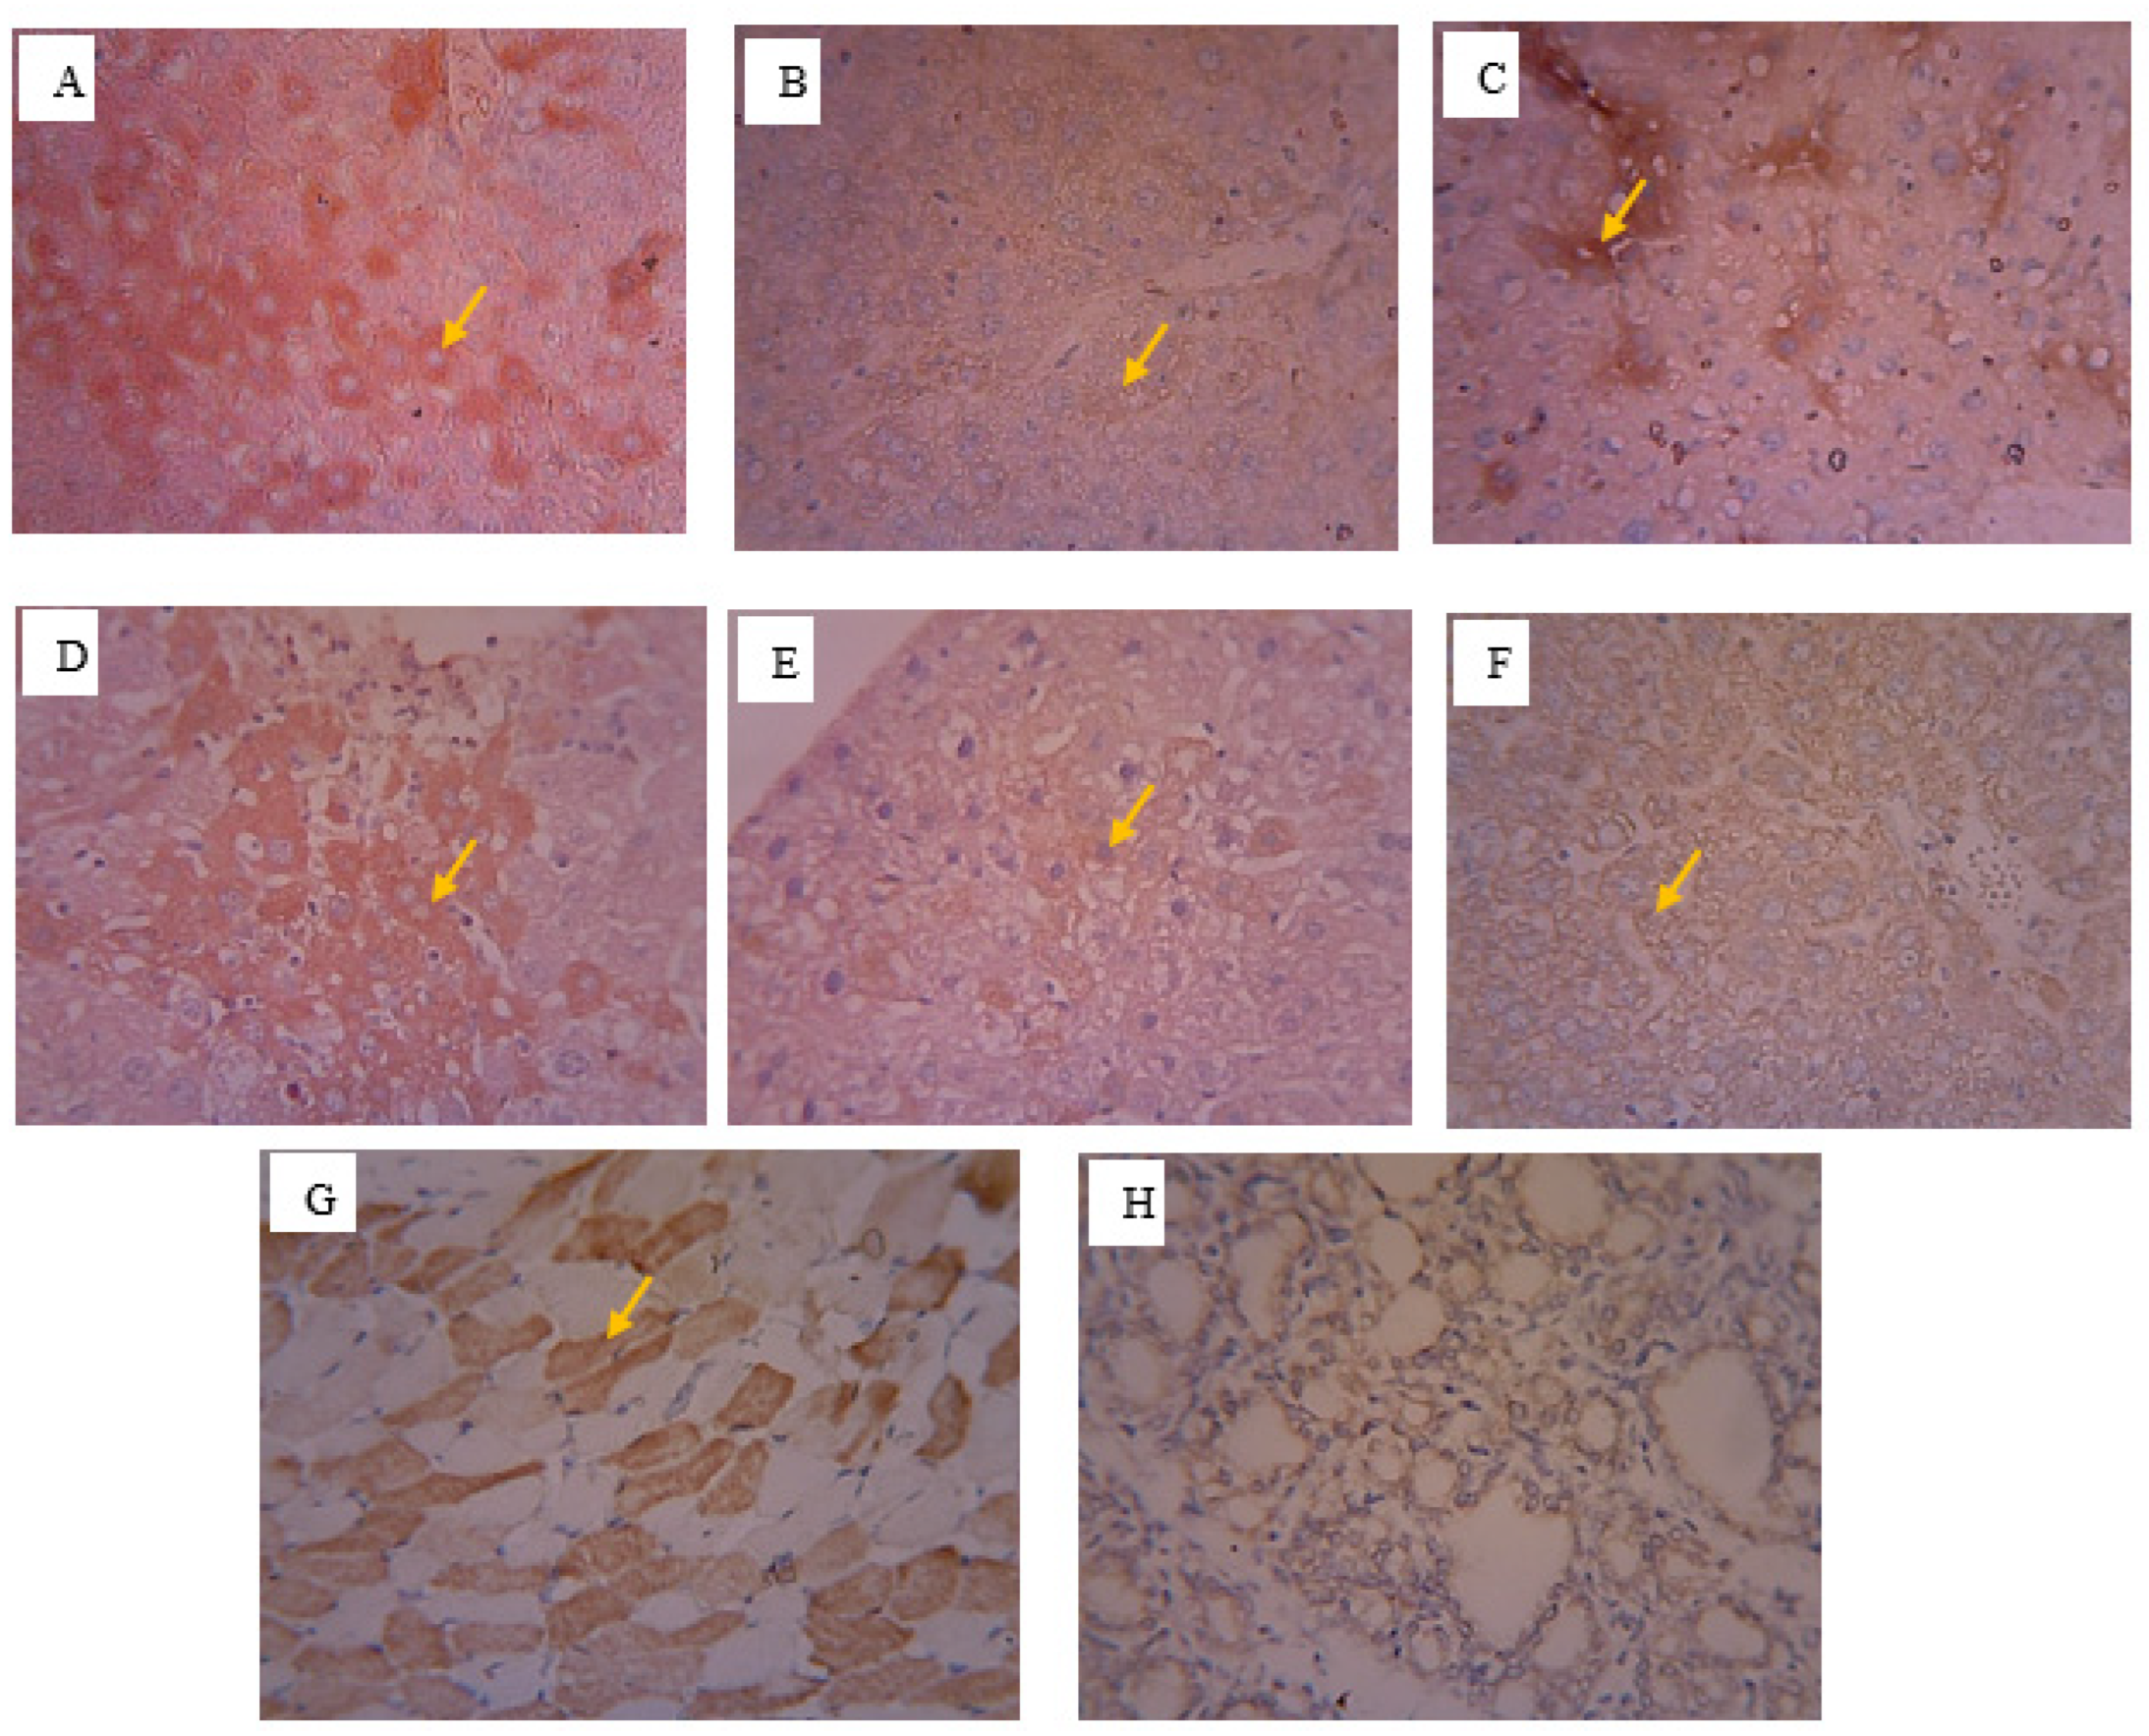
The liver was fixed using a 4% formaldehyde solution for 24 h at room temperature. Samples were dehydrated, embedded in paraffin, and cut into 5 μm thicknesses. Endogenous peroxidase was blocked using 0.3% H2O2 in methanol for 20 min at room temperature. Samples were washed with PBS and given a blocking solution for 10 min at room temperature. After washing with PBS, the sample pieces were incubated with rat antiSREBP-2 antibody at 4 °C overnight. The sample pieces were then washed with PBS and incubated with biotinylated rabbit anti-rat secondary antibody for 10 min at room temperature. The sample pieces were then washed with PBS and incubated with peroxidase-conjugated streptavidin for 5 min at room temperature. The DAB substrate was applied to the sample pieces for 2 min at room temperature, followed by counterstaining with hematoxylin. The slides were observed in 5 fields of view and photographed under a binocular light microscope with 400× magnification. Images were processed using the IHC profiler in the Image J program.
2.6. LDLR Gene Expression
To see the expression of the LDLR gene using the liver, liver organs were isolated, as much as 2 g, and then stored in RNA later; as much as 200 microliters of RNA isolation was carried out. Isolation was carried out using the spin column method using the Zymo research kit, Orange, California. The liver sample was put into RNALater and placed on a microtube, and 300 µL of DNA Shield was added to the sample. Then, it was homogenized using a homogenizer until it was completely smooth. The samples were subject to centrifugation using RNA prep buffer, alcohol, and RNA wash buffer. Then, the results of RNA isolation were confirmed using a nanodrop at a wavelength of 260/280 with a concentration close to 2.00. After confirming the purity of the RNA, cDNA was prepared to proceed to the RT-PCR process. The expression results were analyzed using the Livak formula [
13].
2.7. Observation of the Arteries
Heart samples were isolated, fixed in 4% formaldehyde for three days at room temperature, and then dehydrated using 70%, 96% (2×), and 100% (2×) alcohol for 1 h each. After that, a clearing process was carried out using xylol I, II, and III for 1 h each. The sample was then embedded in paraffin and cut with a thickness of 5 μm using a microtome. Then, the preparations were deparaffinized, rehydrated, and then given hematoxylin and eosin. After that, observations were made under a microscope. The observations focused on the arterial blood vessels.
2.8. Statistic Analysis
Statistical analysis was performed using SPSS 25 for Windows. Variable gene expression and protein content were tested for normality and homogeneity, respectively. The criteria for normally distributed data and the criteria for homogeneous data are p > 0.05. Test pairs of cholesterol and LDL, before and after exposure, were analyzed using the paired sample t-test. Statistical analysis on SREBP-2 gene expression and LDLR gene expression was carried out by a parametric one-way ANOVA test, followed by a post hoc test. The correlation test between SREBP-2 protein expression and gene expression was carried out using the Pearson correlation test. Statistical analysis of calcium levels and the area of the aortic lumen of normal and obese mice used the parametric single t-test.
4. Discussion
The effect of exposure can affect the amount of calcium, protein expression, and gene expression. The group exposed to SMFs tended to experience an increase compared to the obese groups, which were obese mice with no exposure. This study used the C57BL/6J strain of mice. This strain is widely used in research related to obesity and is more resistant to HFD induction than other strains [
14]. The process of forming obese mice is carried out by feeding HFD in each obese group. The high-fat diet contains 55% more calories than the normal feed. Hence, based on the results obtained for 12 weeks, given a high-fat diet, there was a significant increase, with a Lee index of >0.310 [
15].
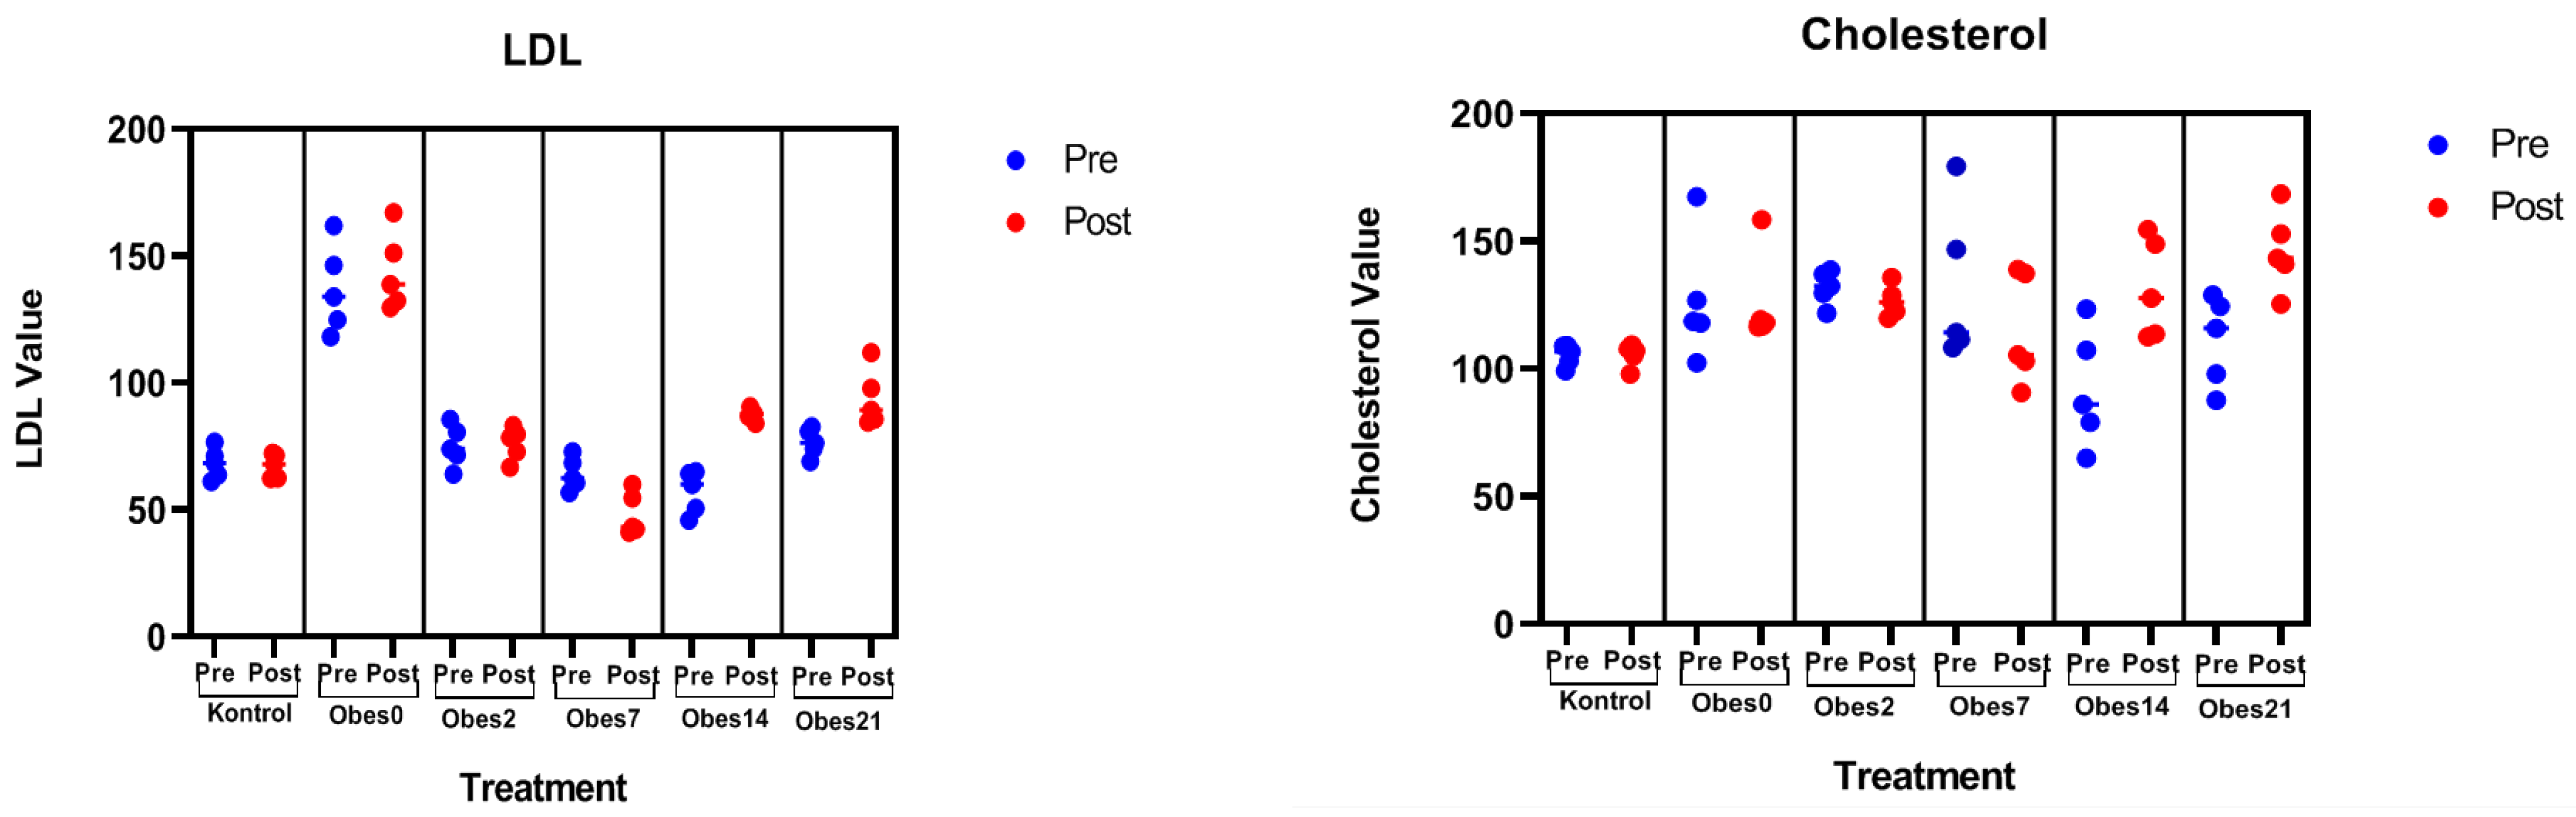
Increasing the Lee index in mice in the obese group was expected to increase cholesterol levels compared to the control group. Examining cholesterol levels was carried out before and after exposure to determine the effect of exposure on cholesterol and LDL levels in the blood of mice as early markers of CHD. Based on the results obtained in the control group, there was no difference between before and after. There was an increase in cholesterol in the Obes0, Obes14, and Obes21 groups. Meanwhile, Obes2 and Obes7 experienced a decrease in cholesterol. The decrease in cholesterol and LDL in the blood was generally caused by an increase in LDLR regulation found in the cell membranes of the liver and extrahepatic tissues so that total cholesterol levels would decrease, followed by a decrease in LDL in the blood circulation [
16]. This is presumably due to the influence of the right length of exposure to affect reducing cholesterol, namely 2 and 7 days, whereas if the length of exposure is increased (14 and 21 days), it will have a negative effect, namely an increase in total cholesterol and LDL-C levels. This study showed that the effect of calcium influx could reduce total cholesterol and LDL-C within 2 and 7 days of exposure. However, increased exposure time (14 and 21 days) showed a negative effect with an increase in total cholesterol and LDL-C. It is suspected that there is a negative feedback mechanism from the amount of intra-cell calcium on total cholesterol and LDL-C
The LDLR gene is located on the surface of liver cells. The LDL receptor will regulate the process of degrading LDL into cells. LDL cholesterol that is in the blood circulation will bind to LDLR, which will be degraded into cells using the process of endocytosis, which will then be stored or excreted in the body. After cholesterol is released, the LDLR recycling process will occur in the cells [
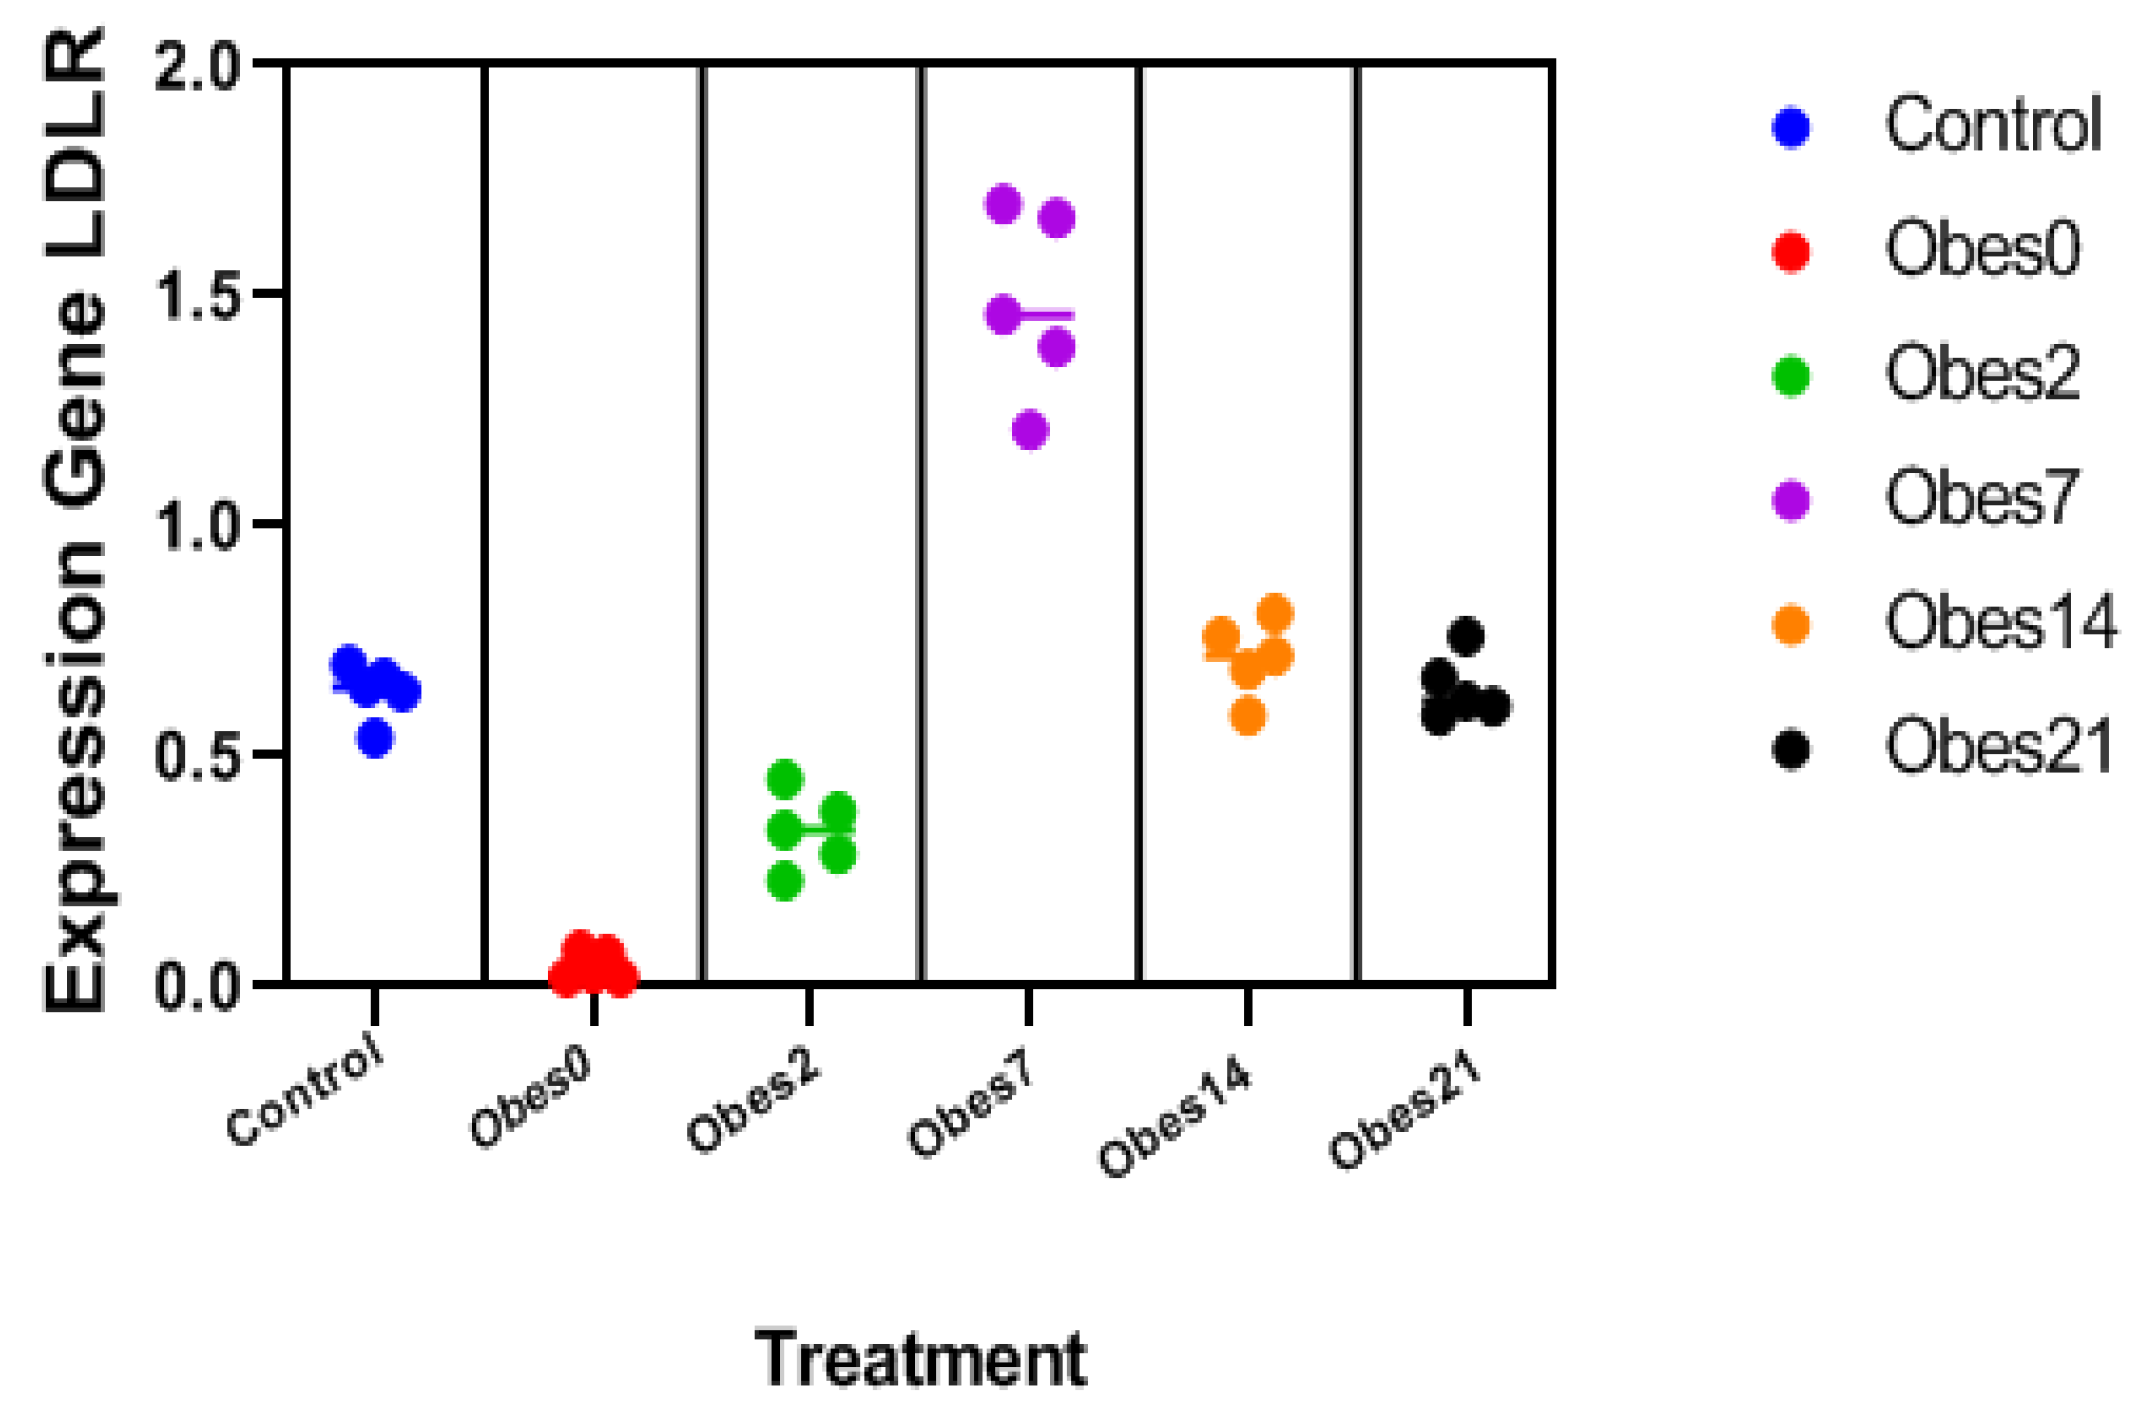
17]. Hence, it is necessary to increase LDLR gene expression to reduce LDL in blood circulation. The effect of exposure on LDLR gene expression could be seen when there was an increase in gene expression after the exposure of Obes7 compared to controls. Meanwhile, there tended to be a decrease in expression in Obes14 and Obes21.
The SREBP-2 protein supporting cholesterol activates the LDL receptor gene and various genes required for cholesterol synthesis [
18,
19]. Used liver tissue to look at the expression of the SREBP-2 protein. SREBP-2 has a long transcriptional activation domain but precisely activates cholesterol synthesis and predominates in the liver and most other intact tissues [
20]. Based on results obtained after exposure to the SREBP-2 protein, there was an increase from Obes2 to Obes7 and a decrease from Obes14 and Obes21.
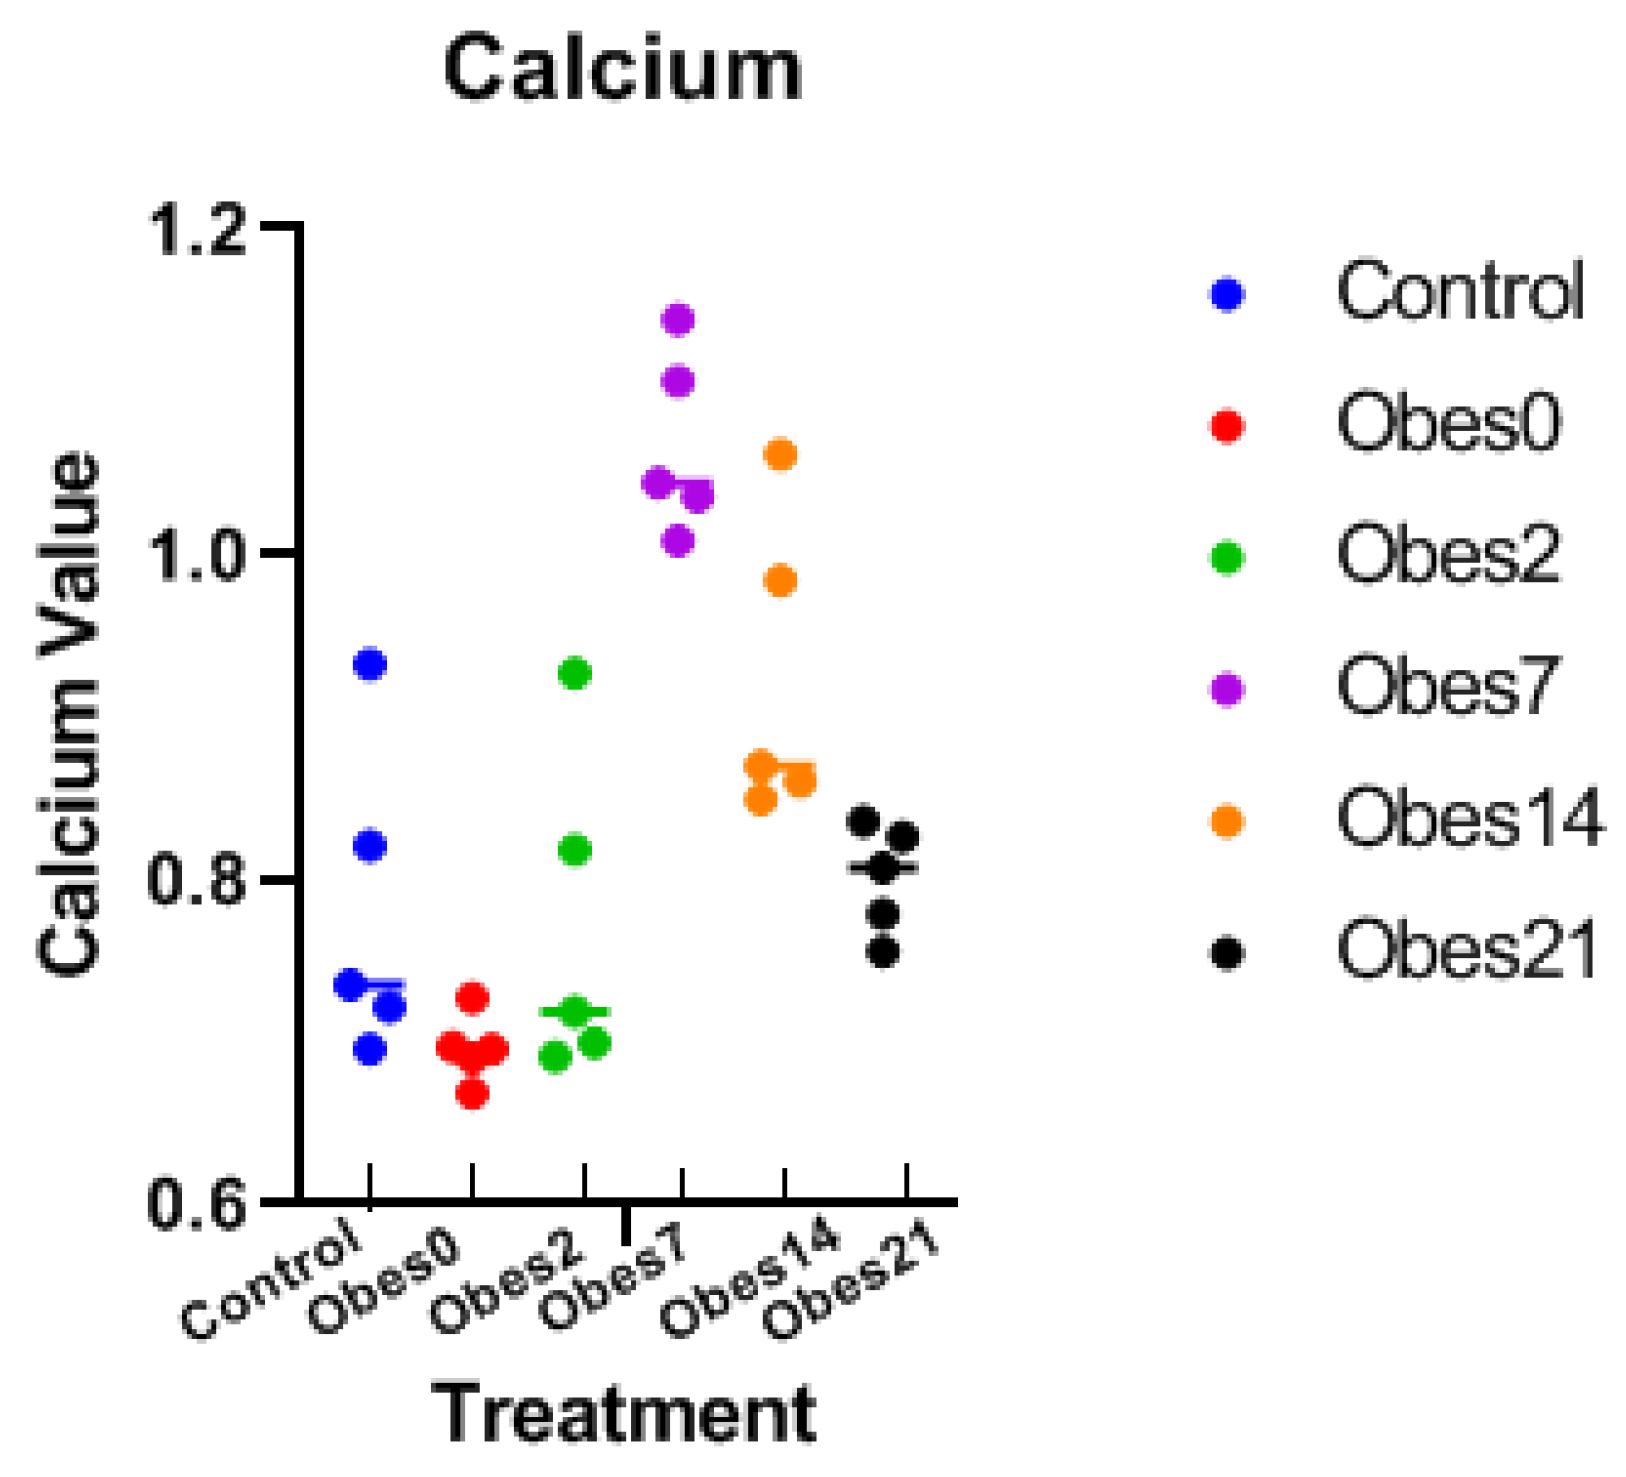
The increase in the decreased expression of the LDLR gene and SREBP-2 protein was probably influenced by the presence of calcium levels in the liver after exposure to SMFs. This research is to check the level of calcium in the liver. Based on the results obtained, the exposed group had higher calcium levels compared to the control and obese groups without exposure. This might happen because of SMF exposure, which affects Ca
2+ ions in the tissue. Although the effect of SMFs on cells is not well understood, activated ion channels facilitate the movement of ions across the membrane. The increased cytosolic Ca
2+ ion concentration will affect cell proliferation and differentiation [
21]; hence, it might affect the amount of calcium in the liver.
The highest calcium ion levels are in Obes7 and tend to decrease in Obes14 and Obes21. These results have the same trend as LDLR gene expression, and SREBP-2 protein expression increased up to Obes7 and then decreased in Obes14 and Obes21 Several studies reported an increase in intracellular calcium ions in various cell types after SMF exposure [
22]. However, the effect of SMF exposure on Obes14 and Obes21, with long exposure times, resulted in a decrease in LDLR gene expression and SREBP-2 protein expression. Although an increase in calcium ions can increase the expression of these genes and proteins, it is reported that too much calcium ions will also inhibit the activation of the SREBP-2 protein as a transcription factor of the LDLR gene to uptake cholesterol [
23]. The results of the SREBP-2 protein expression and LDLR gene examination showed an increase in exposure for 2 and 7 days. Whereas at 14 and 21 days of exposure there was a decrease in expression. This is in accordance with the results of examining total cholesterol and LDL-C that there was a decrease on days 2 and 7 and an increase on days 14 and 21. This phenomenon is thought to be influenced by the effectiveness of the duration of exposure to the right calcium influx on days 2 and 7, while exposure on days 14 and 21 decreased. These results are consistent with a study conducted by Lebau Paul et al., (2022) Increase in ER Ca2+ in the liver to block the activation of SREBP-2 protein transcription, which is responsible for PCSK9 regulation, thereby increasing LDLR expression and reducing LDL-C levels in the blood circulation [
24]. This effect may occur because of the same intensity, Bmax = 2 mT, but the duration of the day is longer, which will affect the activation of the SREBP-2 protein. Hence, SMF exposure at an intensity of 2 mT has an optimal time of 2 and 7 days, and the effect decreases at 14 and 21 days of exposure. Although there is an increase in cholesterol levels, LDL tends to decrease the expression of the LDLR gene protein in Obes14 and Obes21.
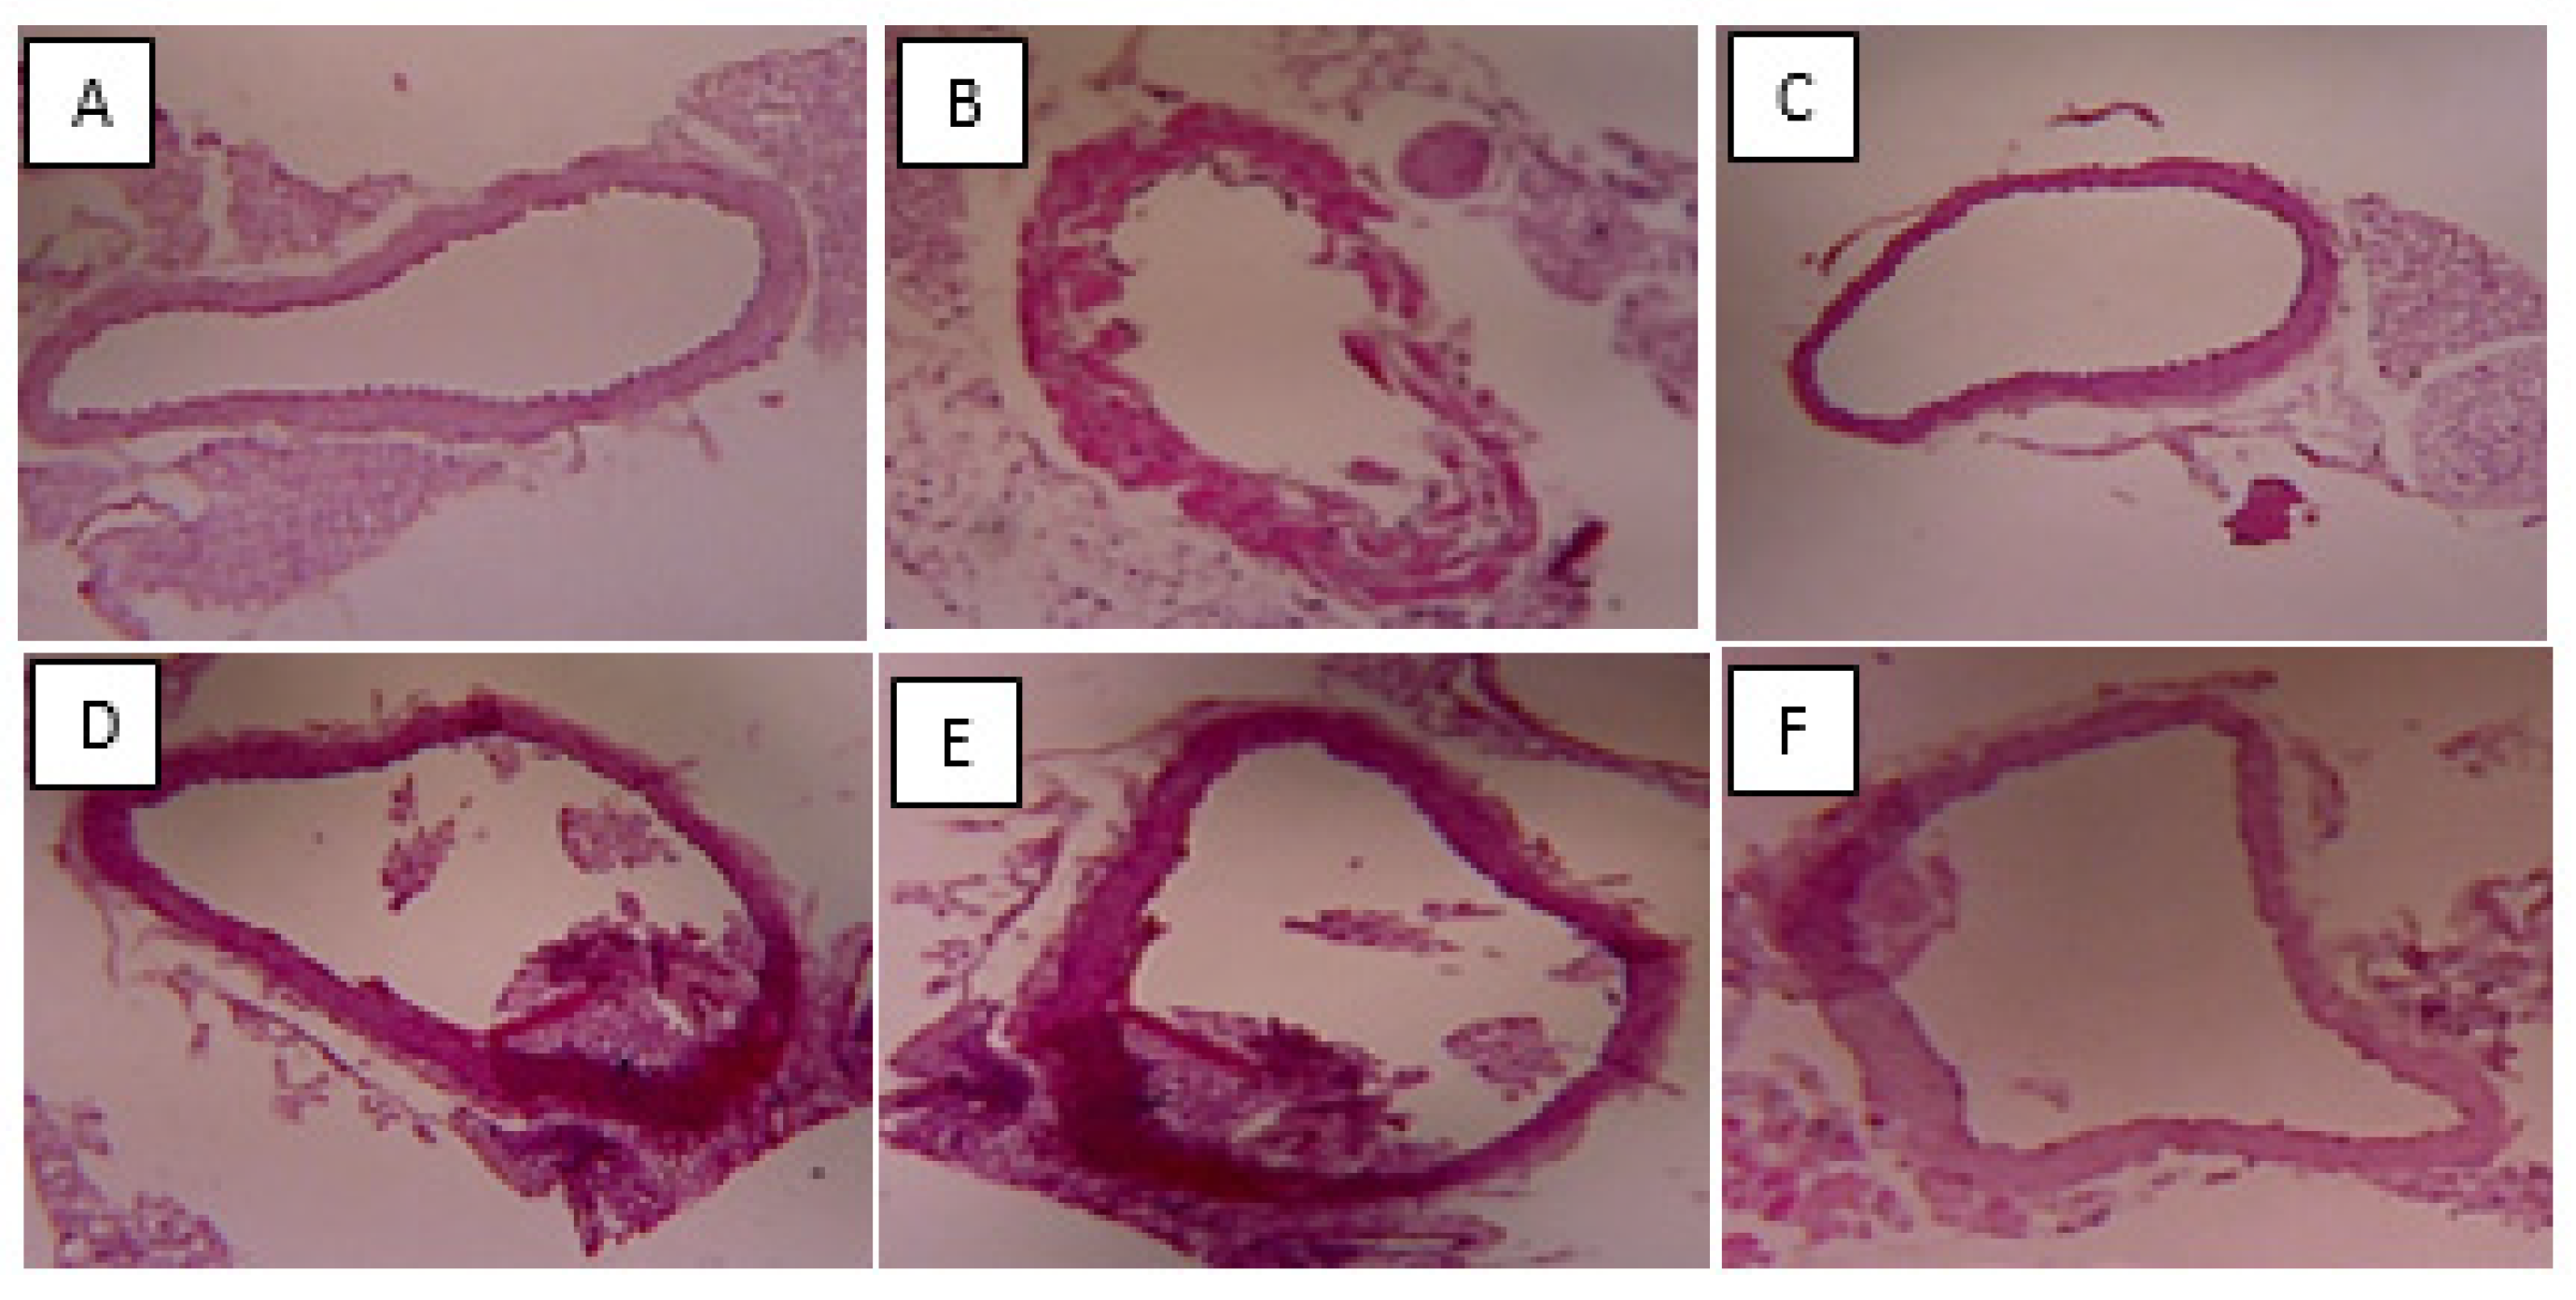
No significant differences were found based on coronary artery morphology. Although there was no significant difference, the area of the arteries in the non-obese control group tended to be wider than the obese group, namely the obese group without exposure. The effect of SMF exposure in each obese group showed that the arterial area tended to be larger than that of the Obese and approached the lumen area in the control group. Research on the effect of SMF exposure on arterial area has not been carried out. The wider the arteries after exposure to SMF, indicating that in this study the effect of SMF can affect the width of the arteries. The results prove that obesity and also the effects of SMF exposure can affect the lumen area of the arteries. Based on the author’s knowledge, research that supports this discussion does not yet exist or has been carried out a lot. Hence, in this study, there was no atherosclerotic process in mice. This may happen because even though HFD has been given and obesity mice are formed, these mice are not yet in a chronic state which causes atherosclerosis to form. Formation of an animal model of atherosclerosis is optimal when cholesterol is more than 2000 mg/dl [
25].
5. Conclusions
SMF exposure can affect the decrease and increase in cholesterol and LDL cholesterol levels. After the exposure of the Obes7 group, it decreased, but there was an increase in the Obes14 and Obes21 groups. SREBP-2 protein expression, LDLR gene expression, and calcium ions after exposure increased more compared to the obese group. Because one of the causes of CHD is an increase in LDL cholesterol, which can cause atherosclerotic plaques, the effect of exposure to the intensity of Bmax = 2 mT for 1 h can affect LDL cholesterol levels, protein expression, and gene expression. The decrease in expression from Obes7 to Obes14 and Obes21 indicates that the effect of SMF exposure is also affected by the length of the exposure. Further research is needed regarding the effects of SMF exposure on other organs so that it can be used as an alternative method for reducing the risk of CHD in the future.


