Article

Characterization of Microarchitectures, Stiffness and Strength of Human Trabecular Bone Using Micro-Computed Tomography (Micro-CT) Scans

by
Ahmed Sherif El-Gizawy
1,2,*,
Xuewei Ma
1,
Ferris Pfeiffer
3,
James D. Schiffbauer
4 and
Tara Selly
4,5
1
Mechanical & Aerospace Engineering, University of Missouri, Columbia, MO 65211, USA
2
Industrial Technology Development and Management (ITECH D&M), LLC, Columbia, MO 65203, USA
3
Biomedical and Biological Engineering, University of Missouri, Columbia, MO 65211, USA
4
Geological Sciences, University of Missouri, Columbia, MO 65211, USA
5
X-ray Microanalysis Laboratory, University of Missouri, Columbia, MO 65211, USA
*
Author to whom correspondence should be addressed.
BioMed 2023, 3(1), 89-100; https://doi.org/10.3390/biomed3010007
Submission received: 5 September 2022 / Revised: 14 December 2022 / Accepted: 28 December 2022 / Published: 19 January 2023

Abstract

:
The present work presents evaluation and experimental verification of the use of X-ray computed tomographic microscopy (micro-CT) for accurate characterization of geometry, microarchitecture, and stiffness properties of bones. These properties are crucial for designing and building optimized implants for joint and dental reconstruction applications. High-resolution micro-CT scans would provide more detailed and accurate information about the microarchitecture and density distribution across patient bones. Nevertheless, micro-CT applications on live patients require invasive procedures involving small bone biopsy specimens. Alternatively, micro-CT could be used on samples collected from selected cadavers of different age, gender, and race groups to establish a database that could be used for providing useful microarchitecture information. The micro-CT scans of investigated bone samples reveal that the trabecular bone is anisotropic and heterogeneous. The results also showed considerable degree of parametric variability and uncertainty on microarchitecture and stiffness properties of patient’s trabecular bone.

1. Introduction

Characterization of microarchitectures, stiffness, and strength properties of human trabecular bone have become necessary for recent efforts to design and build optimized orthopedic implants with structures and texture tailored to closely mimic the anisotropic properties of patients’ bones and that can incorporate an engineered biological press-fit fixation technique [1,2,3,4,5,6,7]. Trabecular bone is considered very complex composite with significant heterogeneity of tissue material properties and microarchitectures [8,9]. This is critical for accurate design and effective fabrication of medical implants for joint reconstruction and dental restoration processes. Most Computer-aided Design and Manufacturing (CAD/CAM) models do not incorporate the heterogeneity of tissue material properties in analysis, design and optimization of medical devices. This could lead to significant inaccuracy of the developed designs which would contribute to risk of bone fracture and aseptic loosening phenomenon of the developed devices. The success of our efforts to design and build optimized orthopedic and dental implants is based on exploring the magnitude of the inter-specimen differences of mechanical properties both on the macroscale (within samples collected from same cadaver), and microscale (properties variations from point to point within same sample). Our ability to take available clinical computed tomography (CT) and micro-computed tomography (micro-CT) scans of bone to produce accurate 3D models of the patient’s anatomy is crucial to our efforts. Micro-CT is a common tool used with bone biology research and is recognized as an effective technique for revealing important details of bone microarchitecture [6,7]. Most recently, several investigations [10,11,12], have been conducted using micro-CT scans to perform analysis of subchondral trabecular bone in patients with Osteoarthritis (OA) disease. OA is a disease that results in destruction of cartilage of patient joints. The conducted investigations were planned to explore microarchitecture features in OA patients, and to investigate relationships between bone microarchitecture changes with different stages of progression of the disease.
The micro-CT derived images from reconstructed data accurately represent bone microstructural parameters for quantitative assessments [13]. Analysis of micro-CT scans would include the following useful parameters: bone volume/tissue volume (BV/TV; %), trabecular number (Tb.N; mm−1), trabecular thickness (Tb.Th; mm), and trabecular separation (Tb.Sp; mm). In addition, there are other parameters that can also be used to represent bone microarchitecture complexity, such as fractal dimension (FD), trabecular bone pattern factor (Tb.Pf; 1/mm), degree of anisotropy (DA), and connectivity density (Conn.Dn; 1/mm3) [13]. Segmentation of micro-CT scans also provides bone properties based on the gray value distribution. Clinical and micro-CT images are pixel maps of the linear X-ray attenuation coefficient of tissue that reflects the level of density [1,2]. A Hounsfield scale is applied to the linear X-ray attenuation coefficient. The Hounsfield scaled numbers are called HU value, CT number or gray value. Different tissues express different X-ray attenuation effects because of their different density and therefore have various gray values, for example, fat is about −110, muscle is around 40, and trabecular bone is in the range of 100–300. Azin Parsa et al. [14] analyzed the correlation between bone volume fraction (BV/TV) and calibrated radiographic bone density Hounsfield units (HU) in human jaws for dental implant applications. Their measurements were derived from micro-CT and multi-slice computed tomography (MSCT), respectively. This study indicates strong relation between bone volume fraction and bone density as assessed on micro-CT images. The results further indicated the high potential of micro-CT measurements to provide an accurate assessment of the bone quality at implant site [14]. Published results of investigations conducted using X-ray computed tomographic microscopy (micro-CT), indicated the potentials of using micro-CT for exploring the relationships between bone microarchitecture changes with different stages of progression of patient’s bone damage. These damages could be caused by diseases, bone resorption due to stress shielding phenomenon, and/or trauma caused by accidents. Particularly, these results reveal the possibilities of using micro-CT scans for diagnosing the nature and magnitude of damage occurred on patient bone. Unfortunately, most of these investigations did not use the full capabilities of quantitative micro-CT analysis for more detailed characterization of damage effects on microarchitectures of patient bones. The present work aims to assess and experimentally verify the use of micro-CT for accurate characterization of geometry, microarchitecture, and stiffness properties of bones to validate its use for designing and building optimized implants for joint and dental reconstruction applications.

2. Investigation Approach

The present investigation approach involves, preparing cadavers bone samples, experimental characterization of bone sample stiffness and strength properties, and micro-CT image analysis of bone samples.

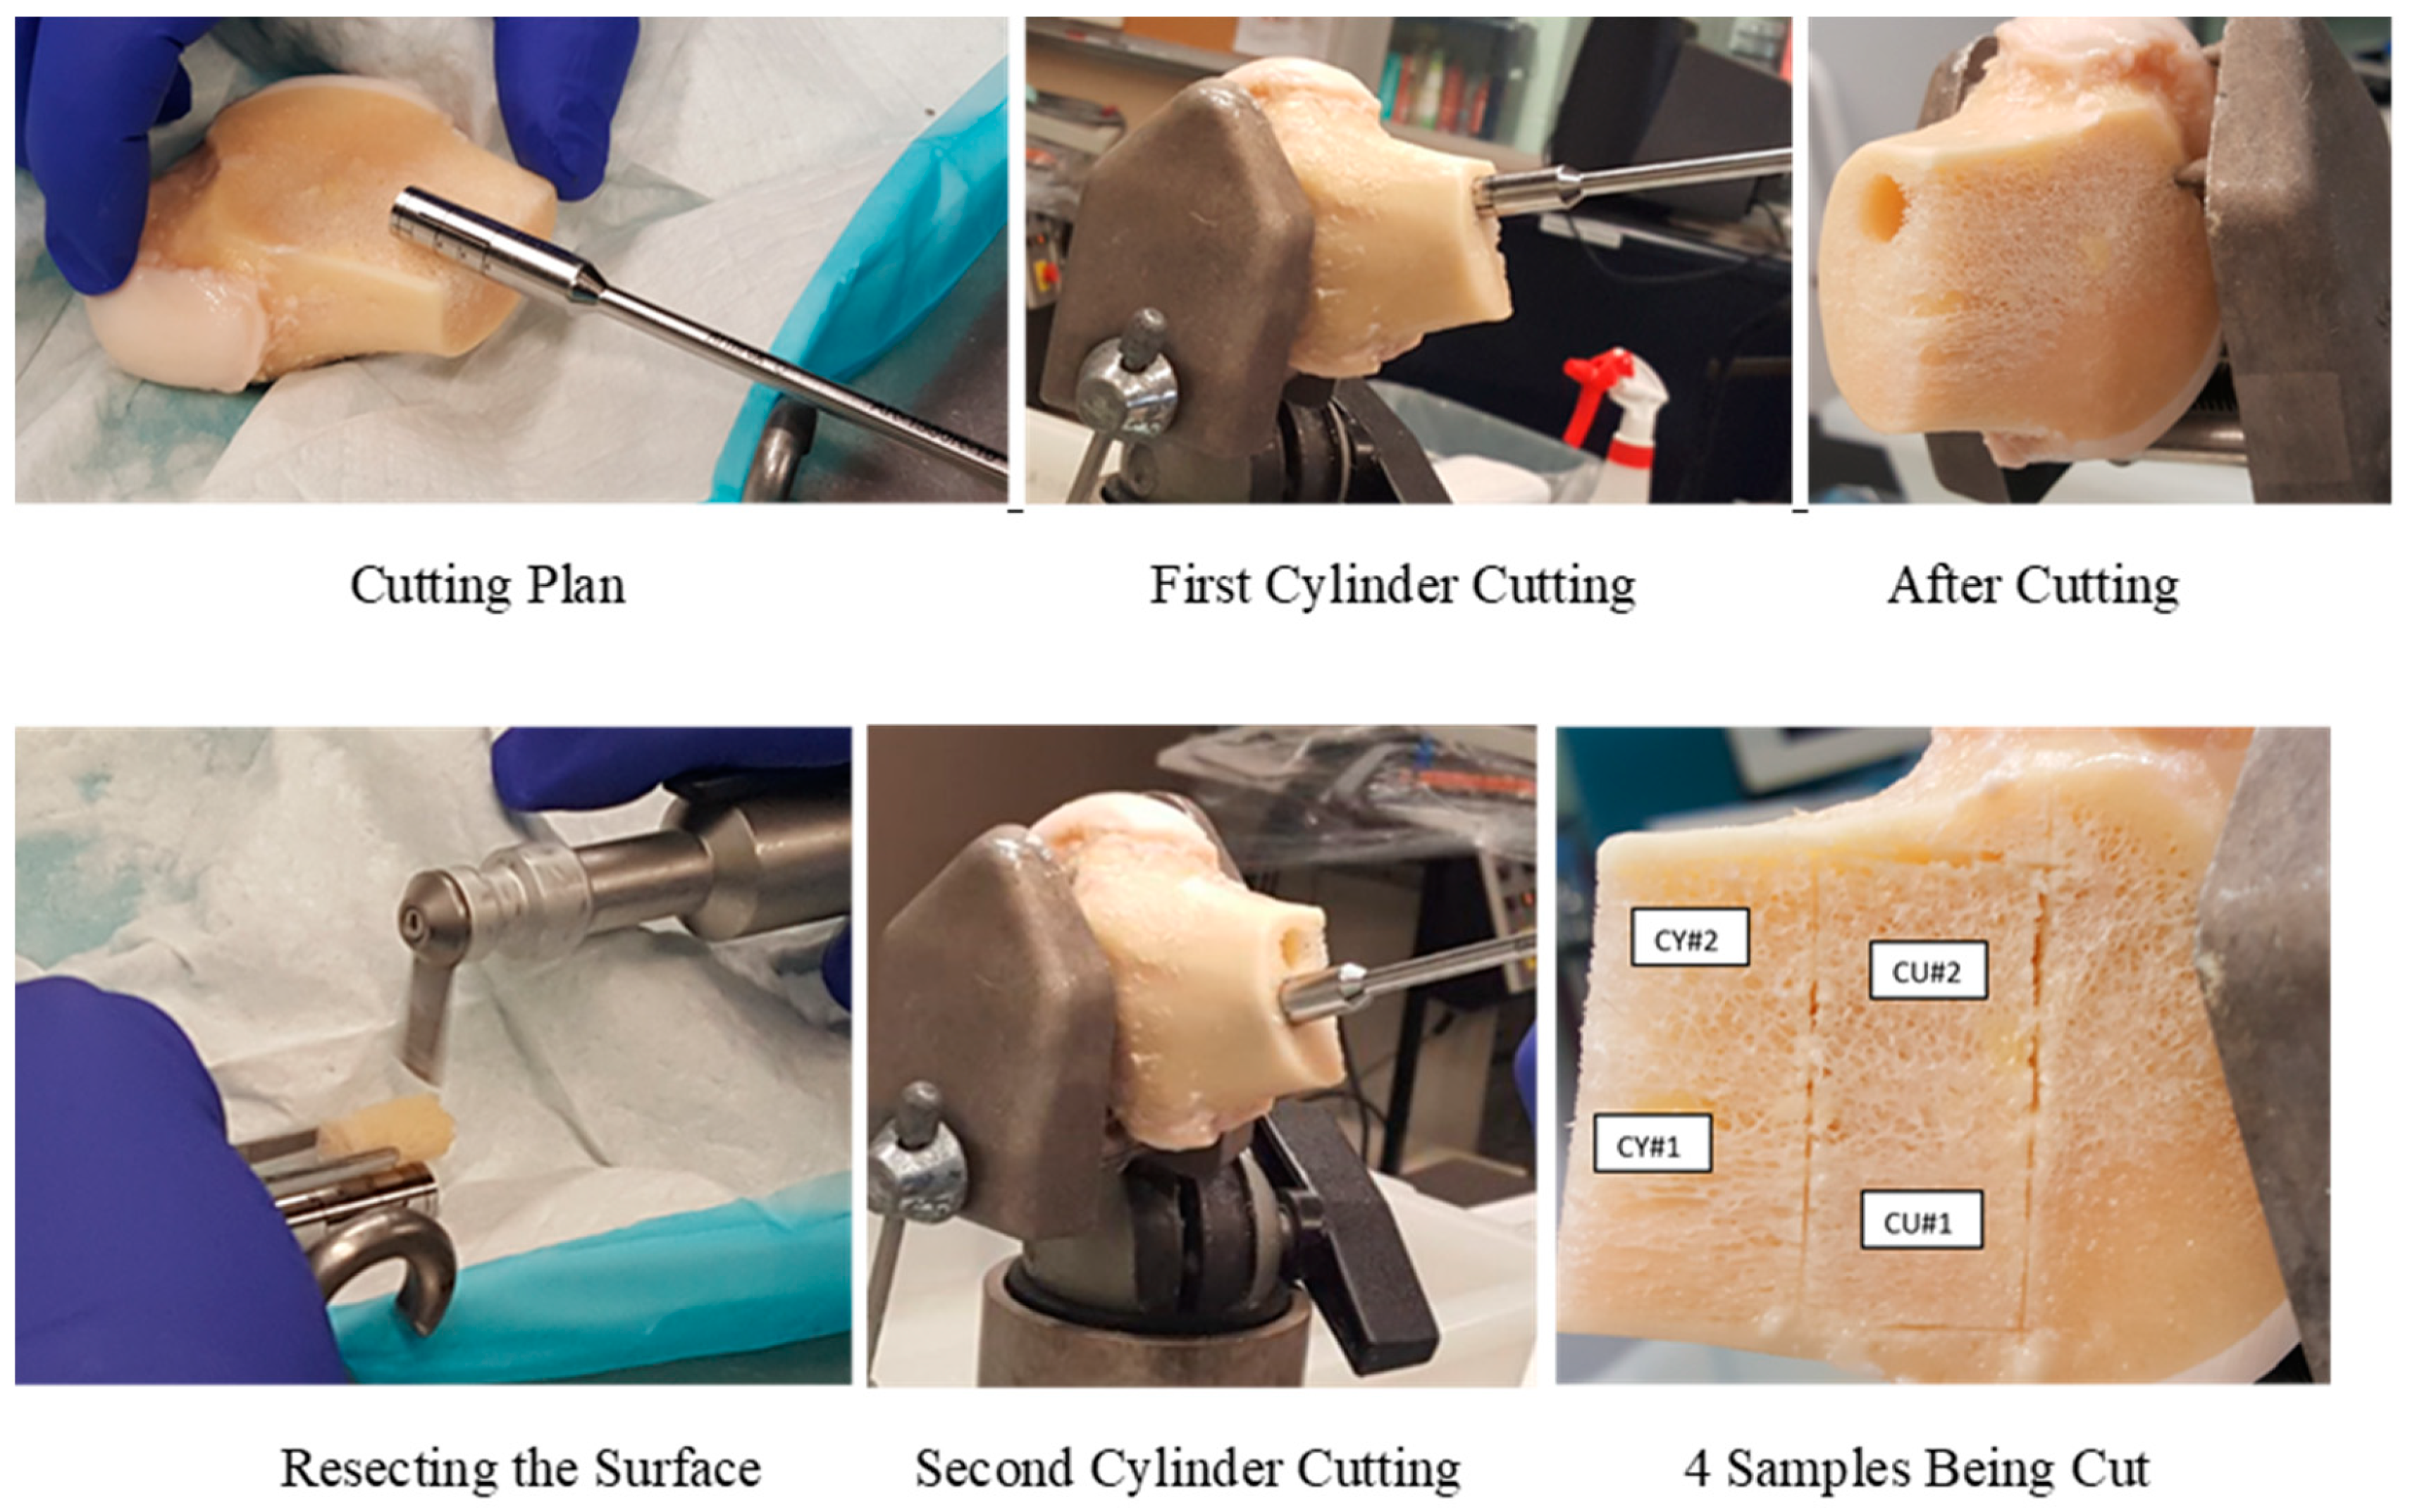
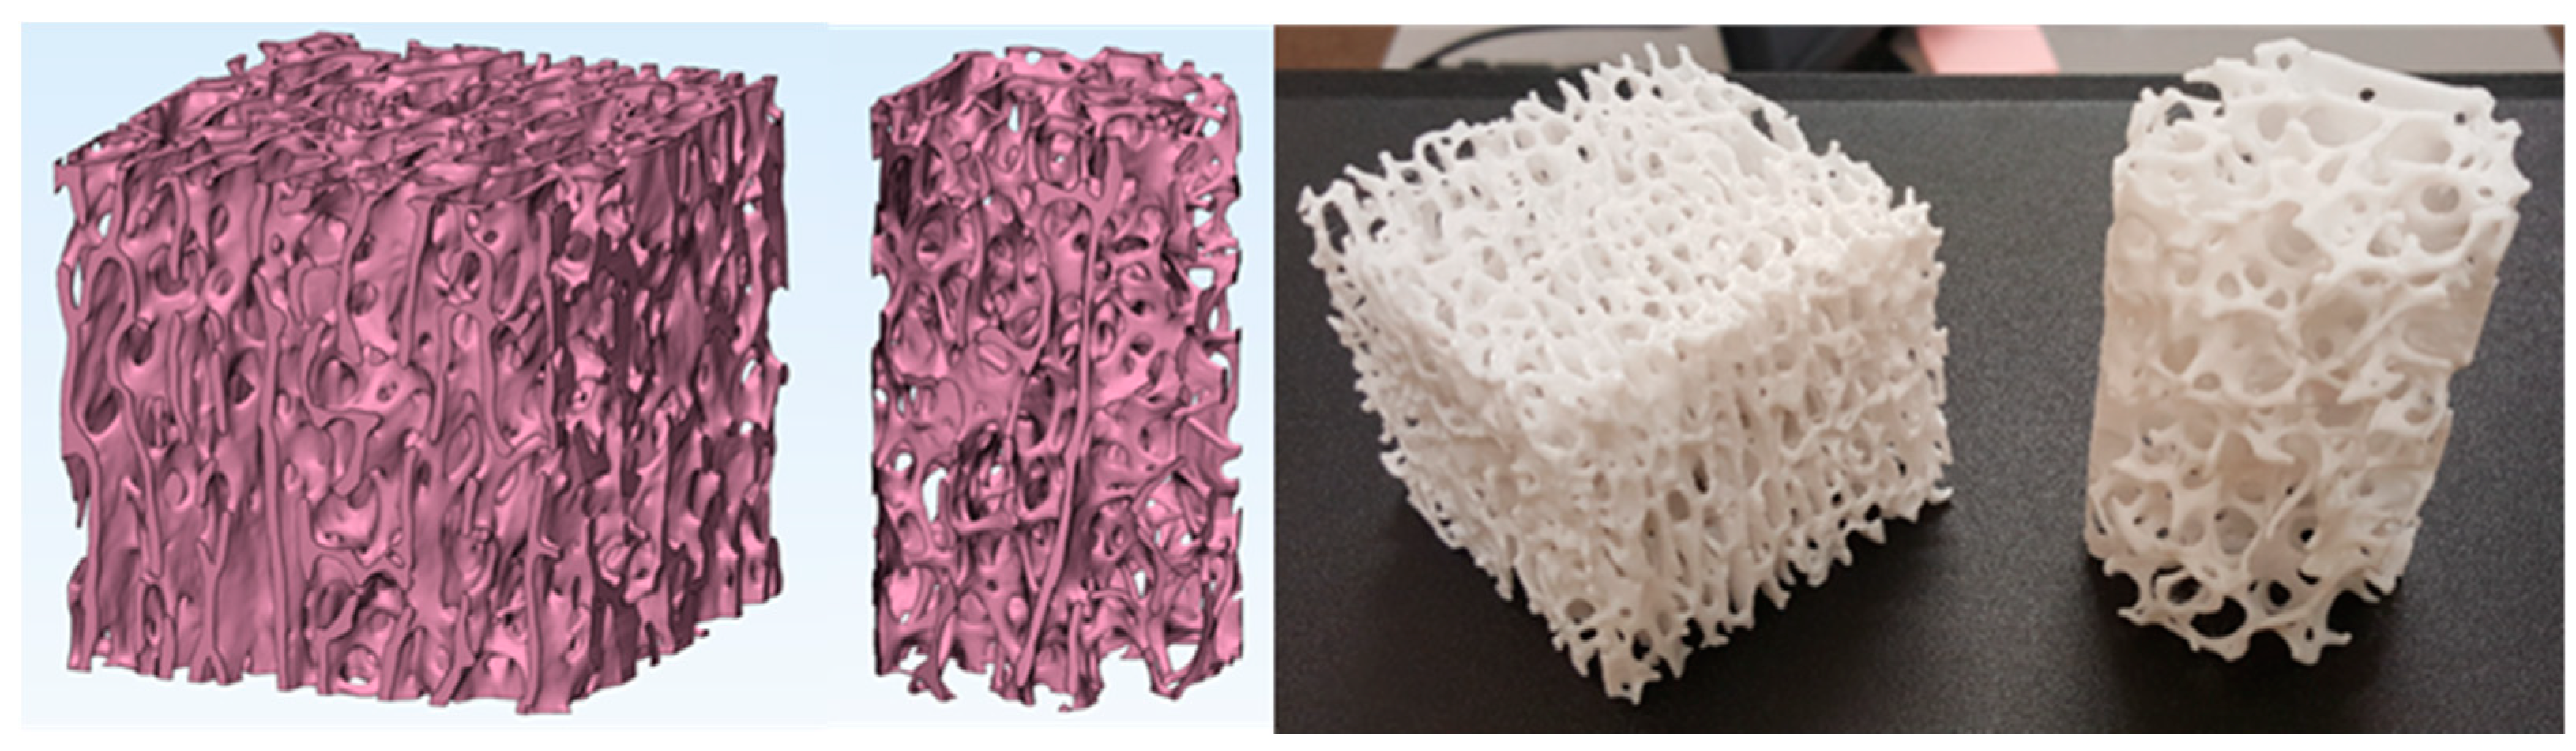
2.1. Cadaver Bone Sample Preparation

One distal femoral condyle from the Musculoskeletal Transplant Foundation (MTF) was acquired for this research. The donor is a 21-year-old male (21M) without any recorded bone diseases. Trabecular bone samples (n = 4) were prepared with a band saw (Stryker Command 2 Oscillating Saw) for the cubic samples and a circular saw (Arthrex OATS Osteochondral Auto-graft Transfer System, 10 mm Dia) for the cylinder samples. Four samples have been prepared, with two cubes (15 mm × 15 mm × 15 mm, “CU 1” and “CU2”) and two cylinders (10 mm diameter, 15 mm length, “CY 1” and “CY2”). Figure 1 shows the preparation of the trabecular bone samples. For confirming the pattern of variation of stiffness and strength properties of trabecular bone, a secondary set of cadaver bone samples (n = 22) were acquired from the tibia of a 73-year-old male (73 M) donor, obtained from Science Care in Phoenix, AZ. These samples were prepared using the same methods described here. All cadaver bone specimens were preserved in sterilized containers with a 0.9% sterilized saline solution and stored under refrigeration.

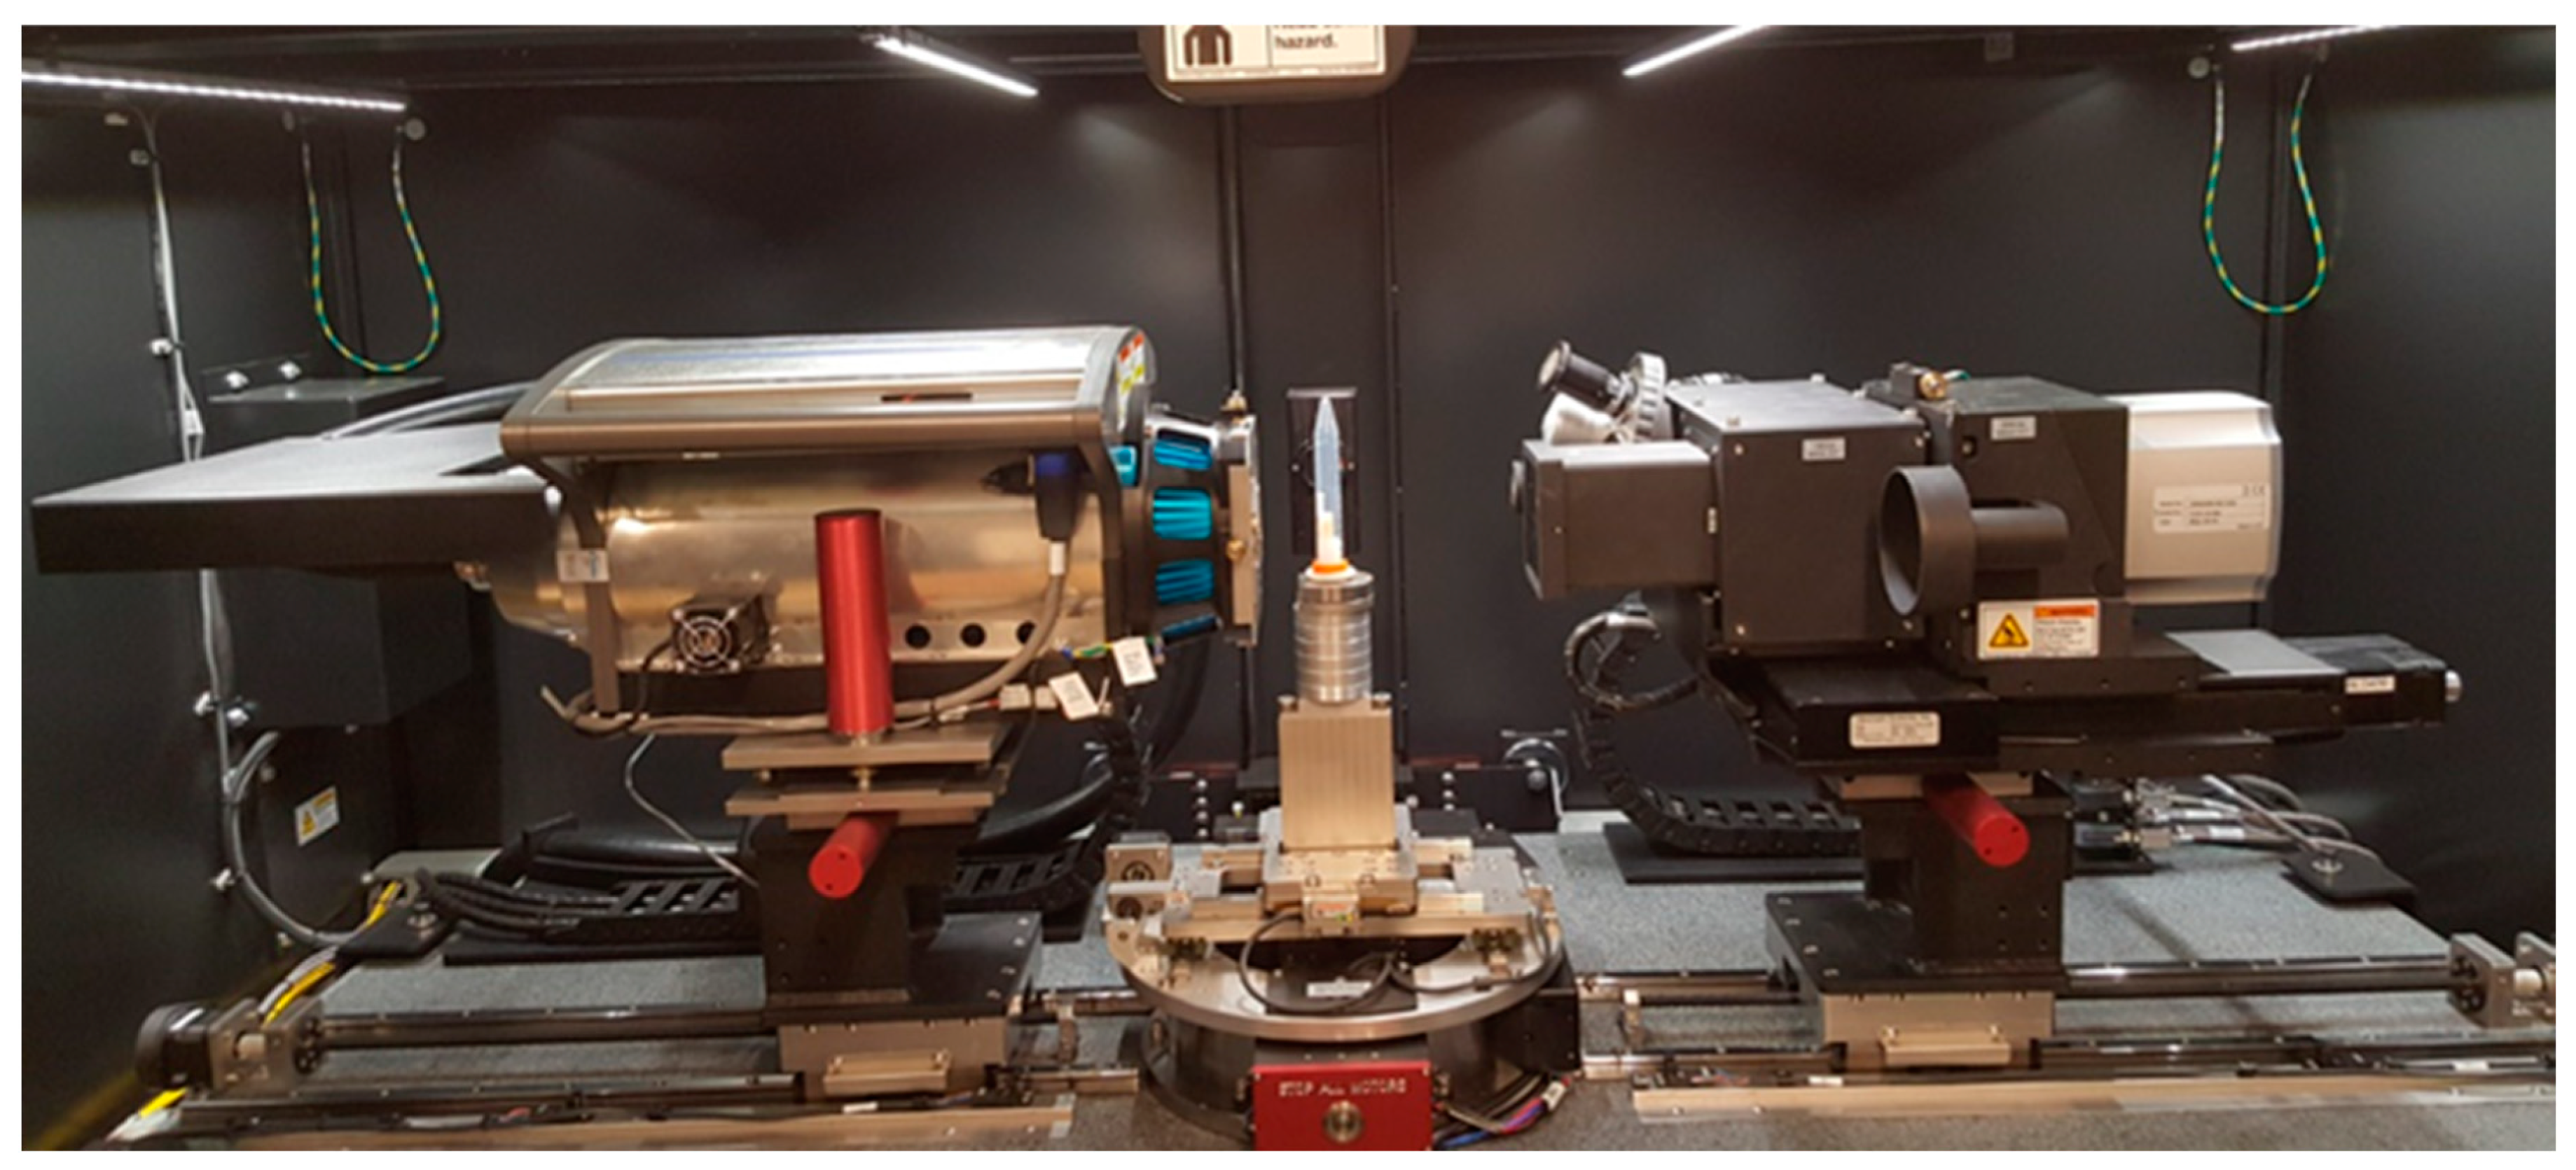
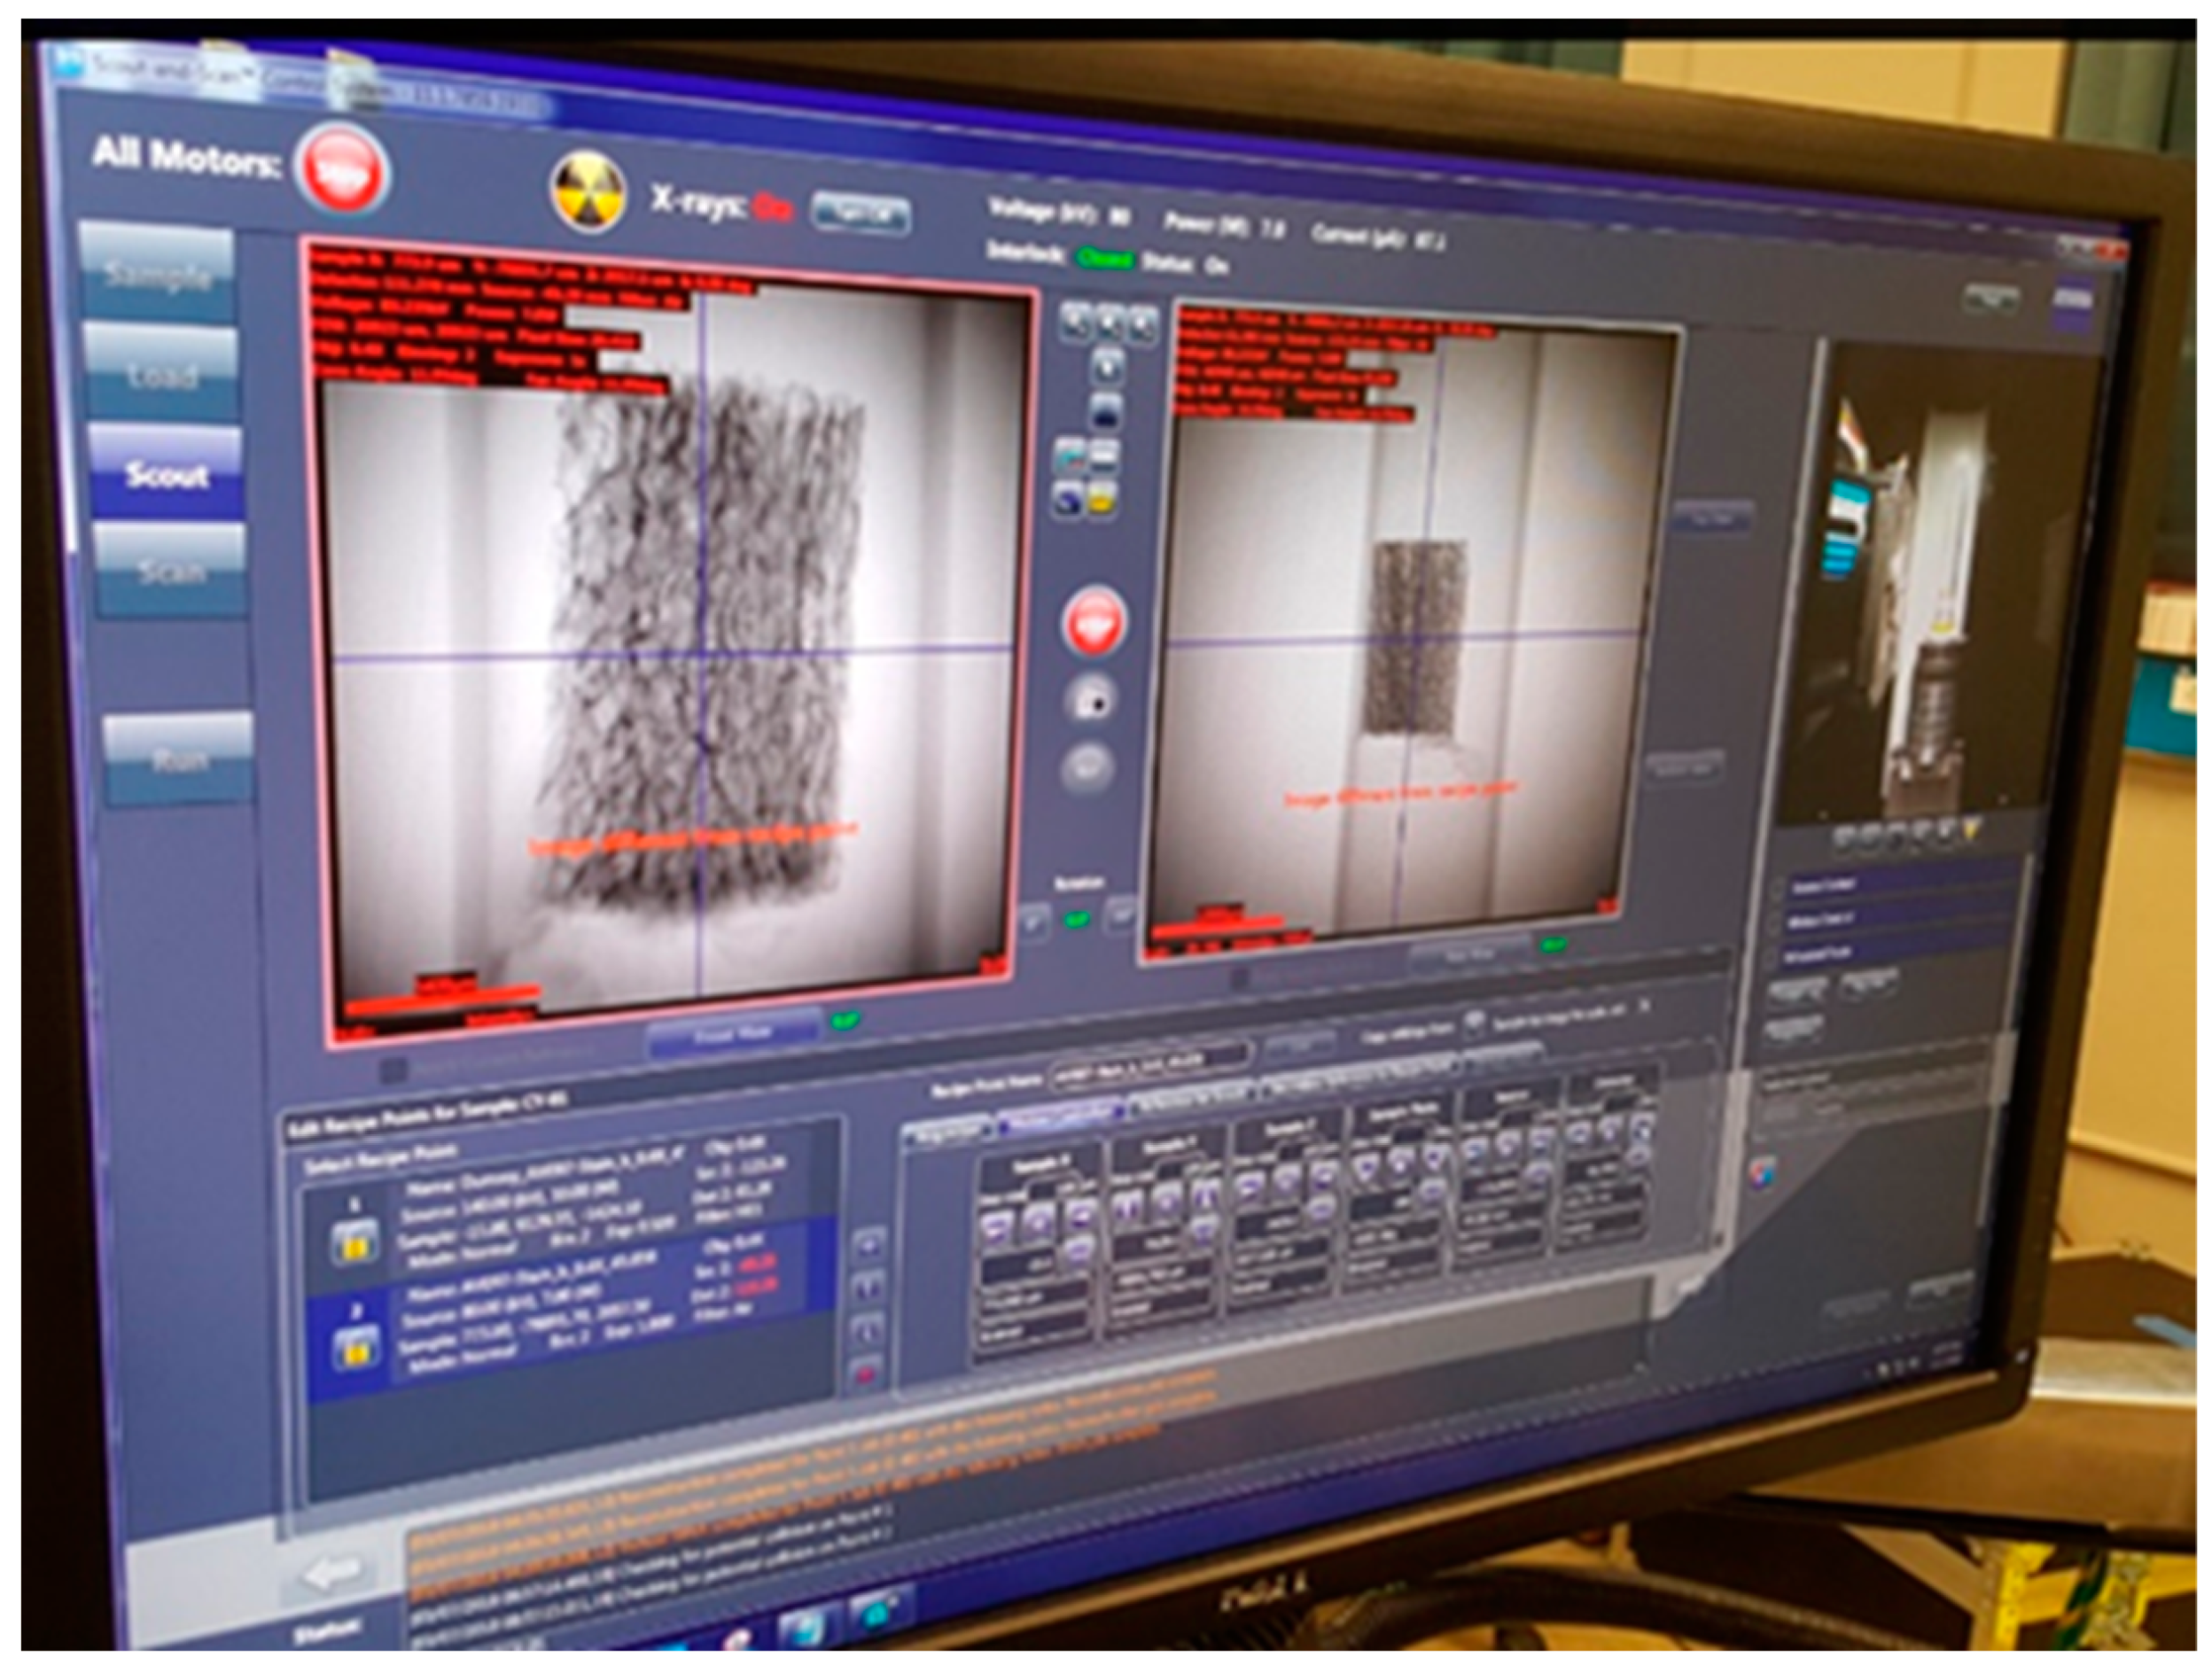
2.2. Micro-CT Imaging

Micro-CT was conducted at the University of Missouri’s X-ray Microanalysis Laboratory using a Zeiss Xradia 510 Versa X-ray tomographic microscope. The cylindrical samples have a uniform penetration dimension (the cylindrical diameter) while the sample is rotating on the platform, which ensures ease of instrumental settings. Cubic samples have a variable cross sectional area during data collection, and thus resolution is therefore limited by the greatest diagonal width of the cube. While higher resolution is possible, to view the full sample in the field-of-view, the resolution of the scan is limited to the greatest width of the sample parallel to the X-ray beam direction. Table 1 reports the detailed scan parameters for the bone samples analyzed here. The maximum resolvable voxel size was 27.3 µm for the cubic samples and 18 µm for cylindrical samples, owing to the differences in maximum dimension.
Samples are placed in a plastic container, aligned along the vertical axis of the rotational stage in the scanner, and affixed to a stage mount to prevent sample movement during the duration of the scan. There is no scanning medium, with only air being around the sample. For our studied samples, 50 kV X-ray energy was adequate for appropriate X-ray transmission. A low energy X-ray filter was placed in the X-ray path to narrow the energy spectrum and reduce beam-hardening effects. A total of 1201 rotational projections were collected in each scan. Figure 2. shows the sample setup in the micro-CT scanner and Figure 3. displays the tuning of the scanning parameters.

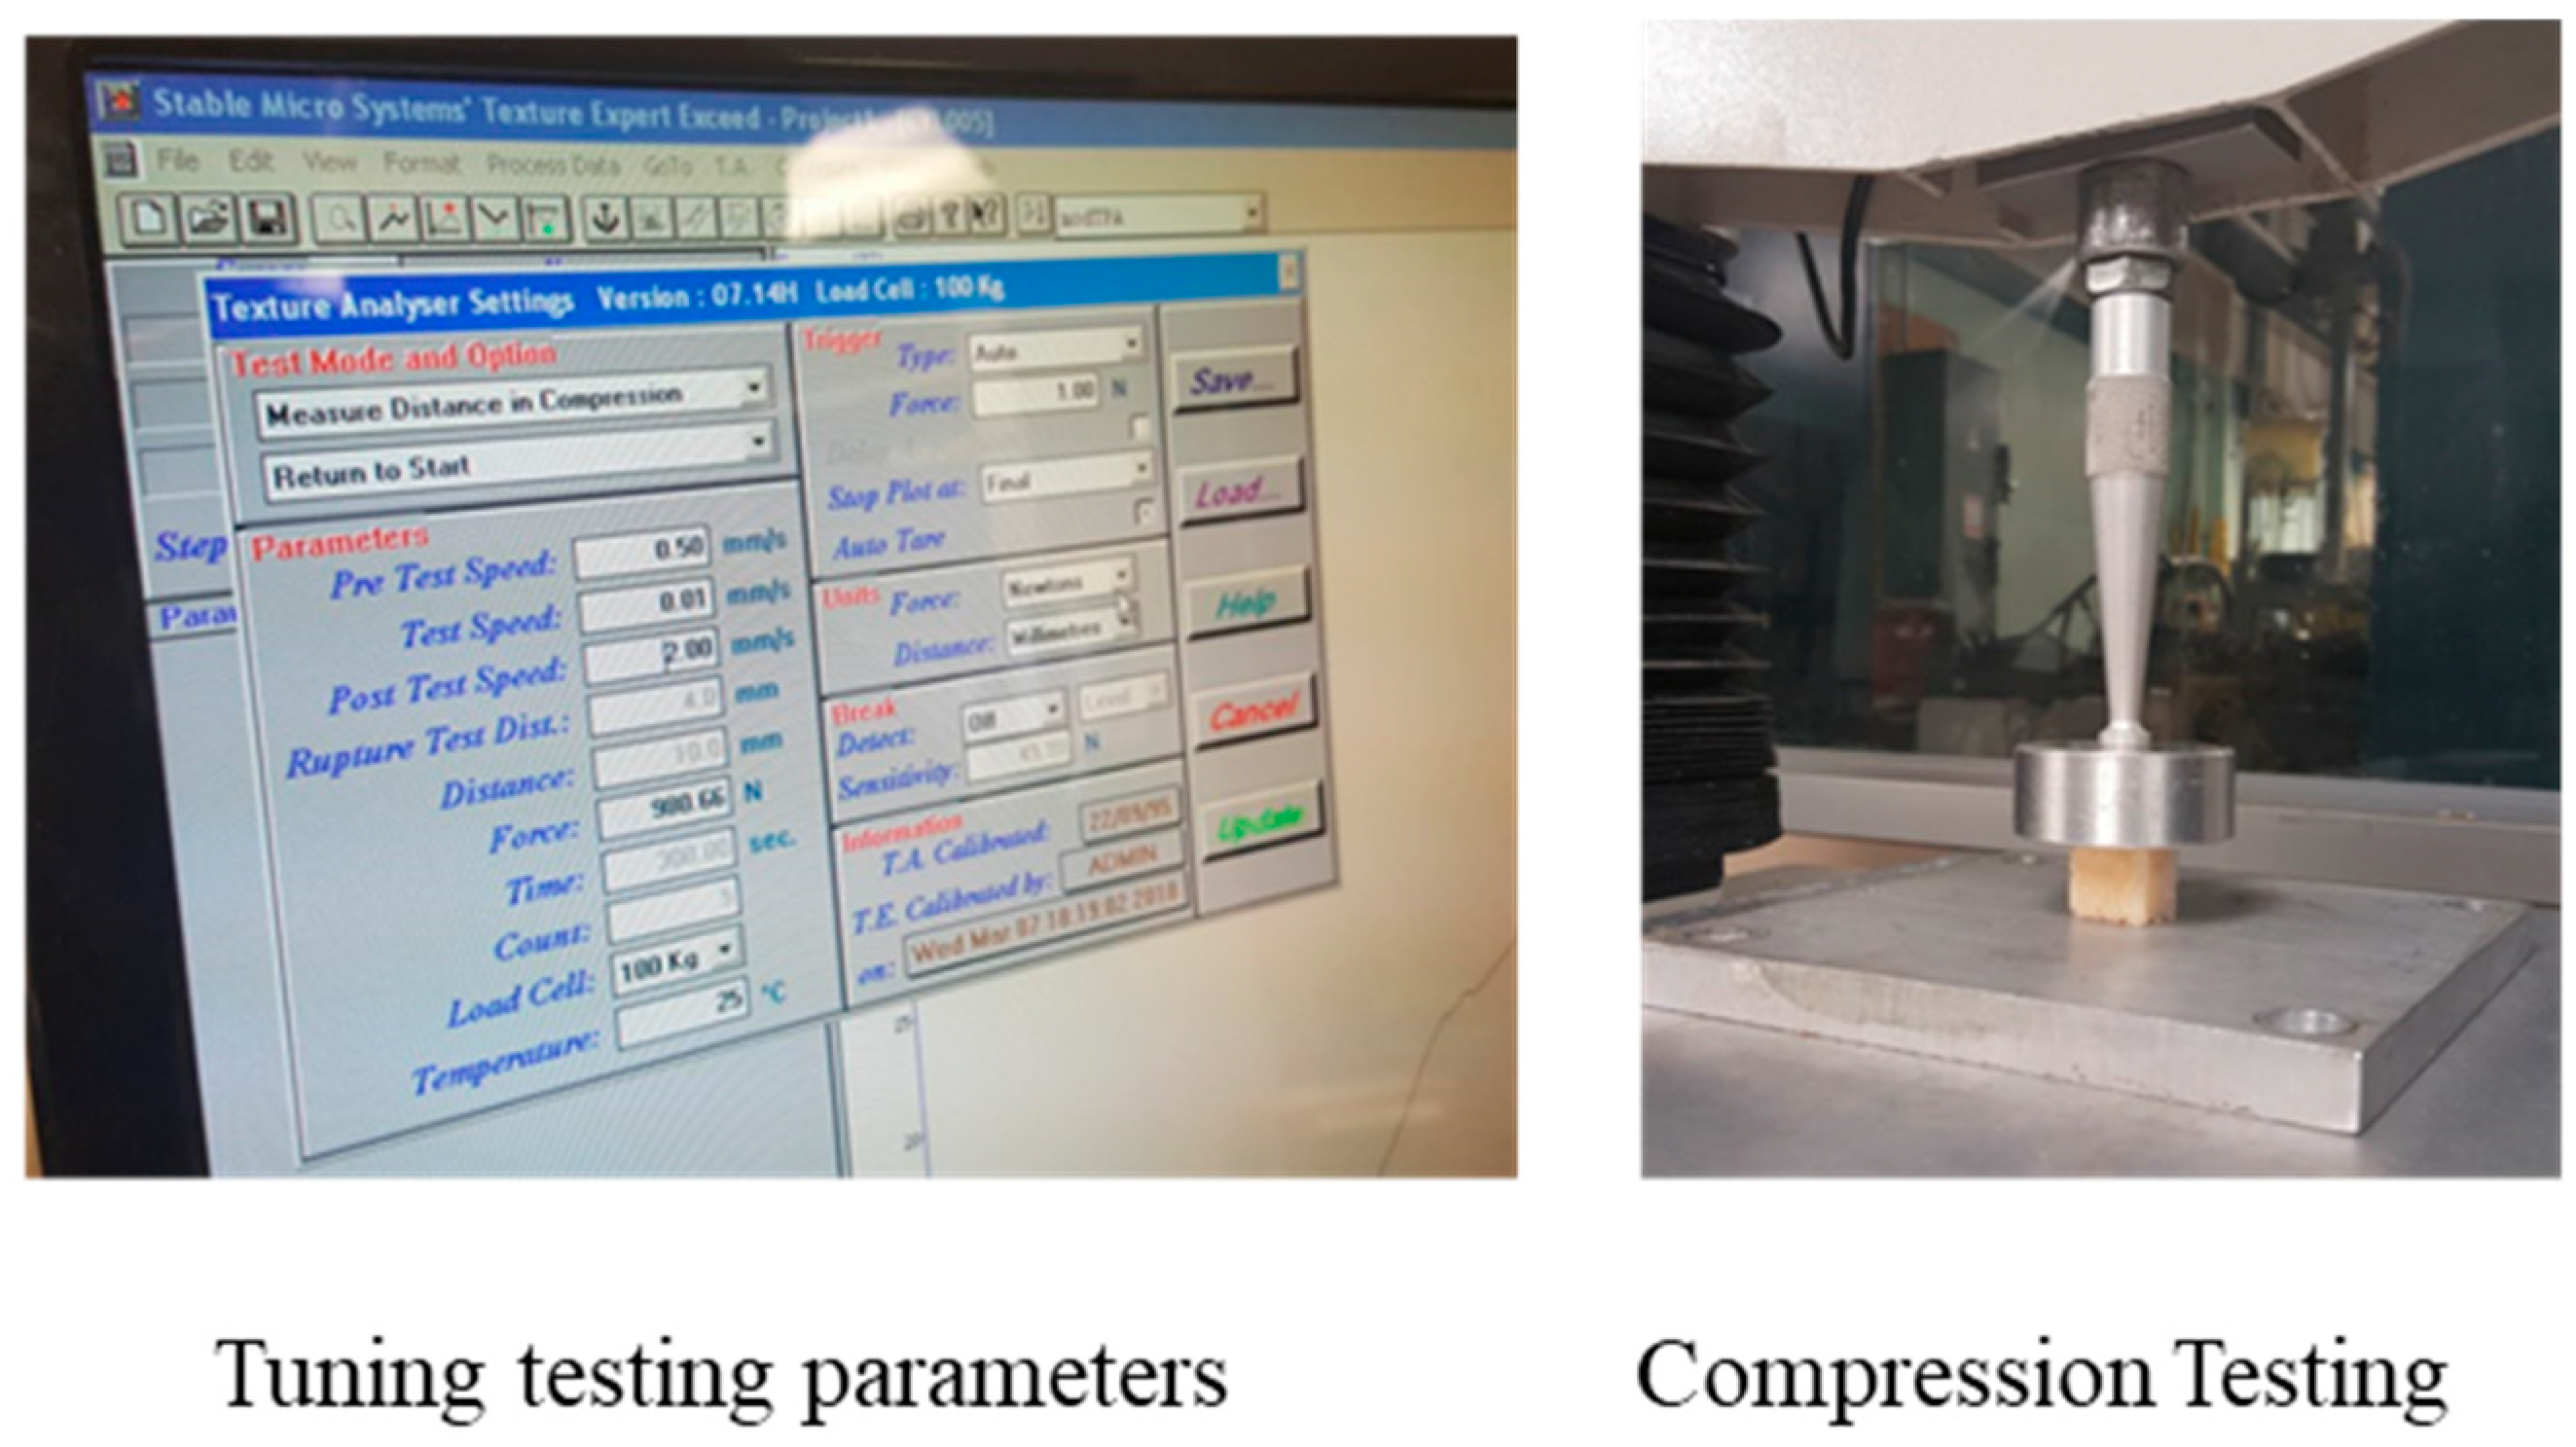
2.3. Experimental Characterization of Mechanical Properties of Bone

Mechanical properties of both the 21 M and 73 M cadaver bone samples were tested under compression using a Texture Analyser, Texture Technologies Corp, to determine the elastic modulus and yield strength of different bone samples. An average strain rate of 0.01 s−1 was applied with a sampling rate of 50 Hz. Figure 4 shows the setup of the compression testing.

3. Results and Discussion

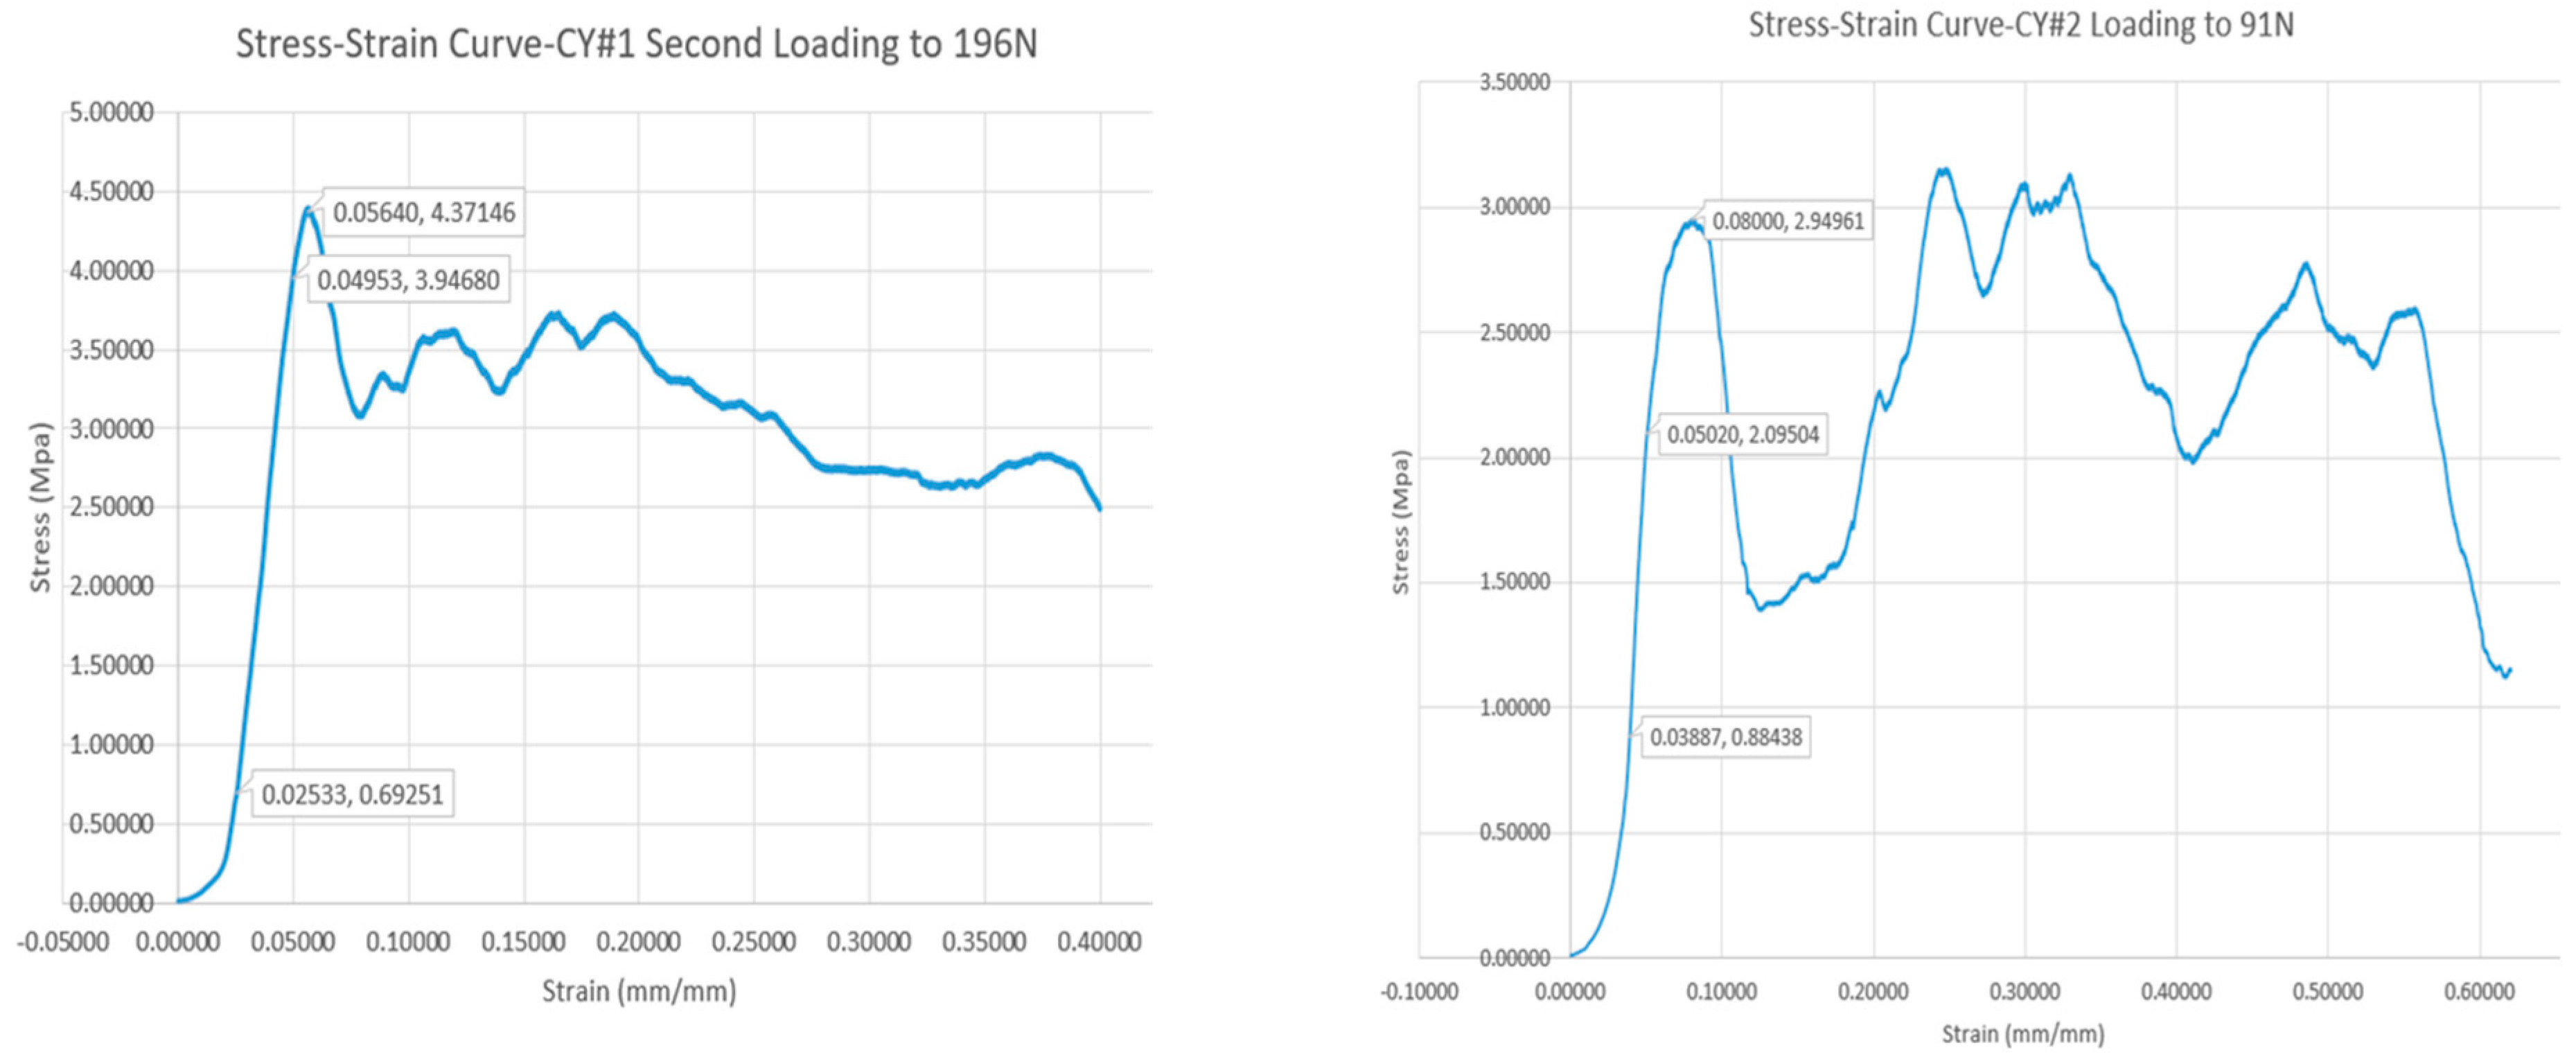
3.1. Mechanical Testing Results

The modulus of elasticity, yield strength, and yield strain results from cubic and cylindrical bone samples obtained on the first cadaver (21M) are summarized in Table 2. Typical stress–strain curves obtained from testing the two cylindrical bone samples are displayed in Figure 5. The displayed curves show peaks and valleys; since the trabecular bone is highly porous, when it fails, it may then subsequently show strengthening when the failed parts compress and start to touch on other trabeculae.
The results displayed in Table 2 show that the modulus of elasticity of the four tested samples varies between maximum value of 134 MPa and minimum value of 45 MPa with an average of 105 MPa and standard deviation of 42 MPa. Similar observations noticed on the measured yield strength with an average value of 4.679 MPa and standard deviation of 2.763 MPa. The results clearly show that stiffness properties, as indicated by the modulus of elasticity, are varied from sample to sample. The same pattern is echoed in yield strength results and yield strain results. These variations are indicative that trabecular bone material is heterogeneous could also have anisotropic behavior, due to a variation of properties from one location to another within the bone. Micro CT investigation results are thus useful in revealing more details about this behavior, including microarchitecture and property variation within the samples.
In order to confirm heterogeneity of trabecular bone material, Stress–strain curves were also obtained from compression testing twenty-two bone samples cut from a second cadaver for 73 years old male (73 M) who has died of cardiac arrest. The tibia was stored frozen until the preparation of the samples. The stress–strain curves obtained on all twenty-two samples are similar to those displayed in Figure 5 and reported in Table 3. All curves show peaks and valleys similar to the behavior of bone samples collected from the first cadaver of 21 years old male who has died of cardiac arrest. Each trabecular bone sample is unique, so they have different values of elastic modulus and yield strength. The reported measured elastic modulus varied from 9 MPa to 1903 MPa, with an average of 163 MPa and a standard deviation of 399 MPa. The range of reported yield strength varies from 0.3 MPa to 8.7 MPa, with an average of 2.4 MPa and a standard deviation of 2.5 MPa. These results reveal that, even for samples obtained from the same cadaver, stiffness and strength can vary significantly.

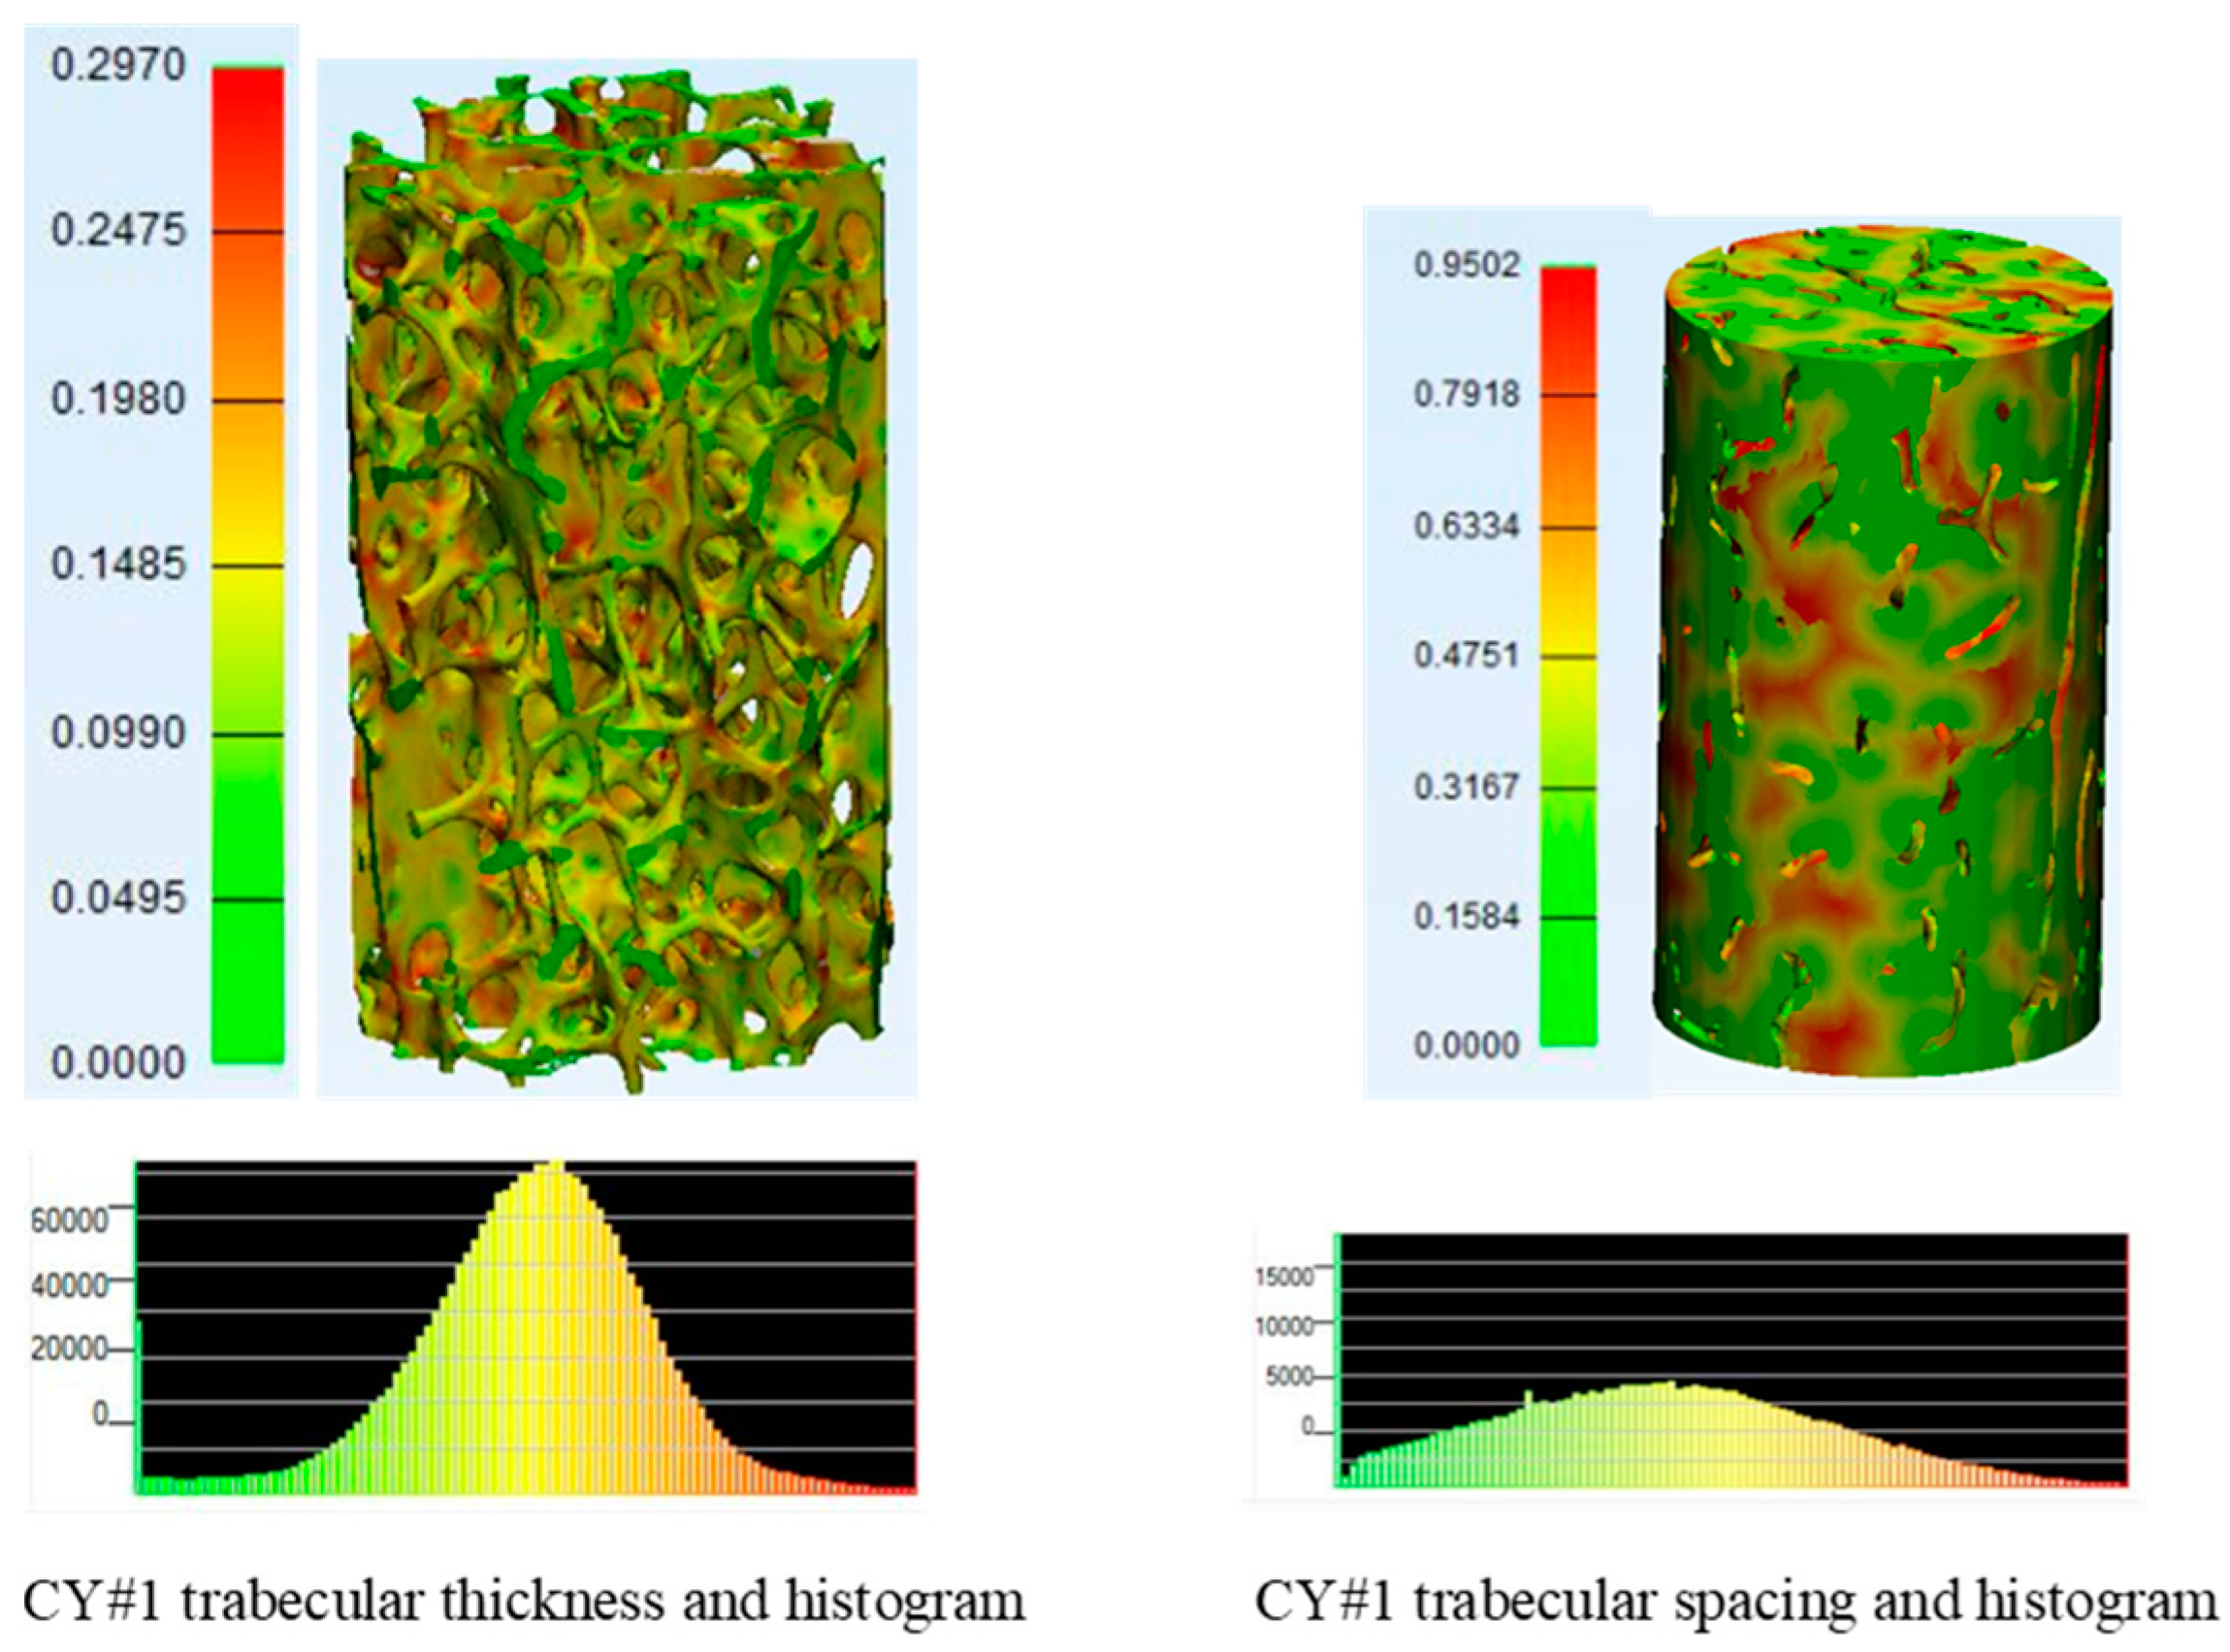
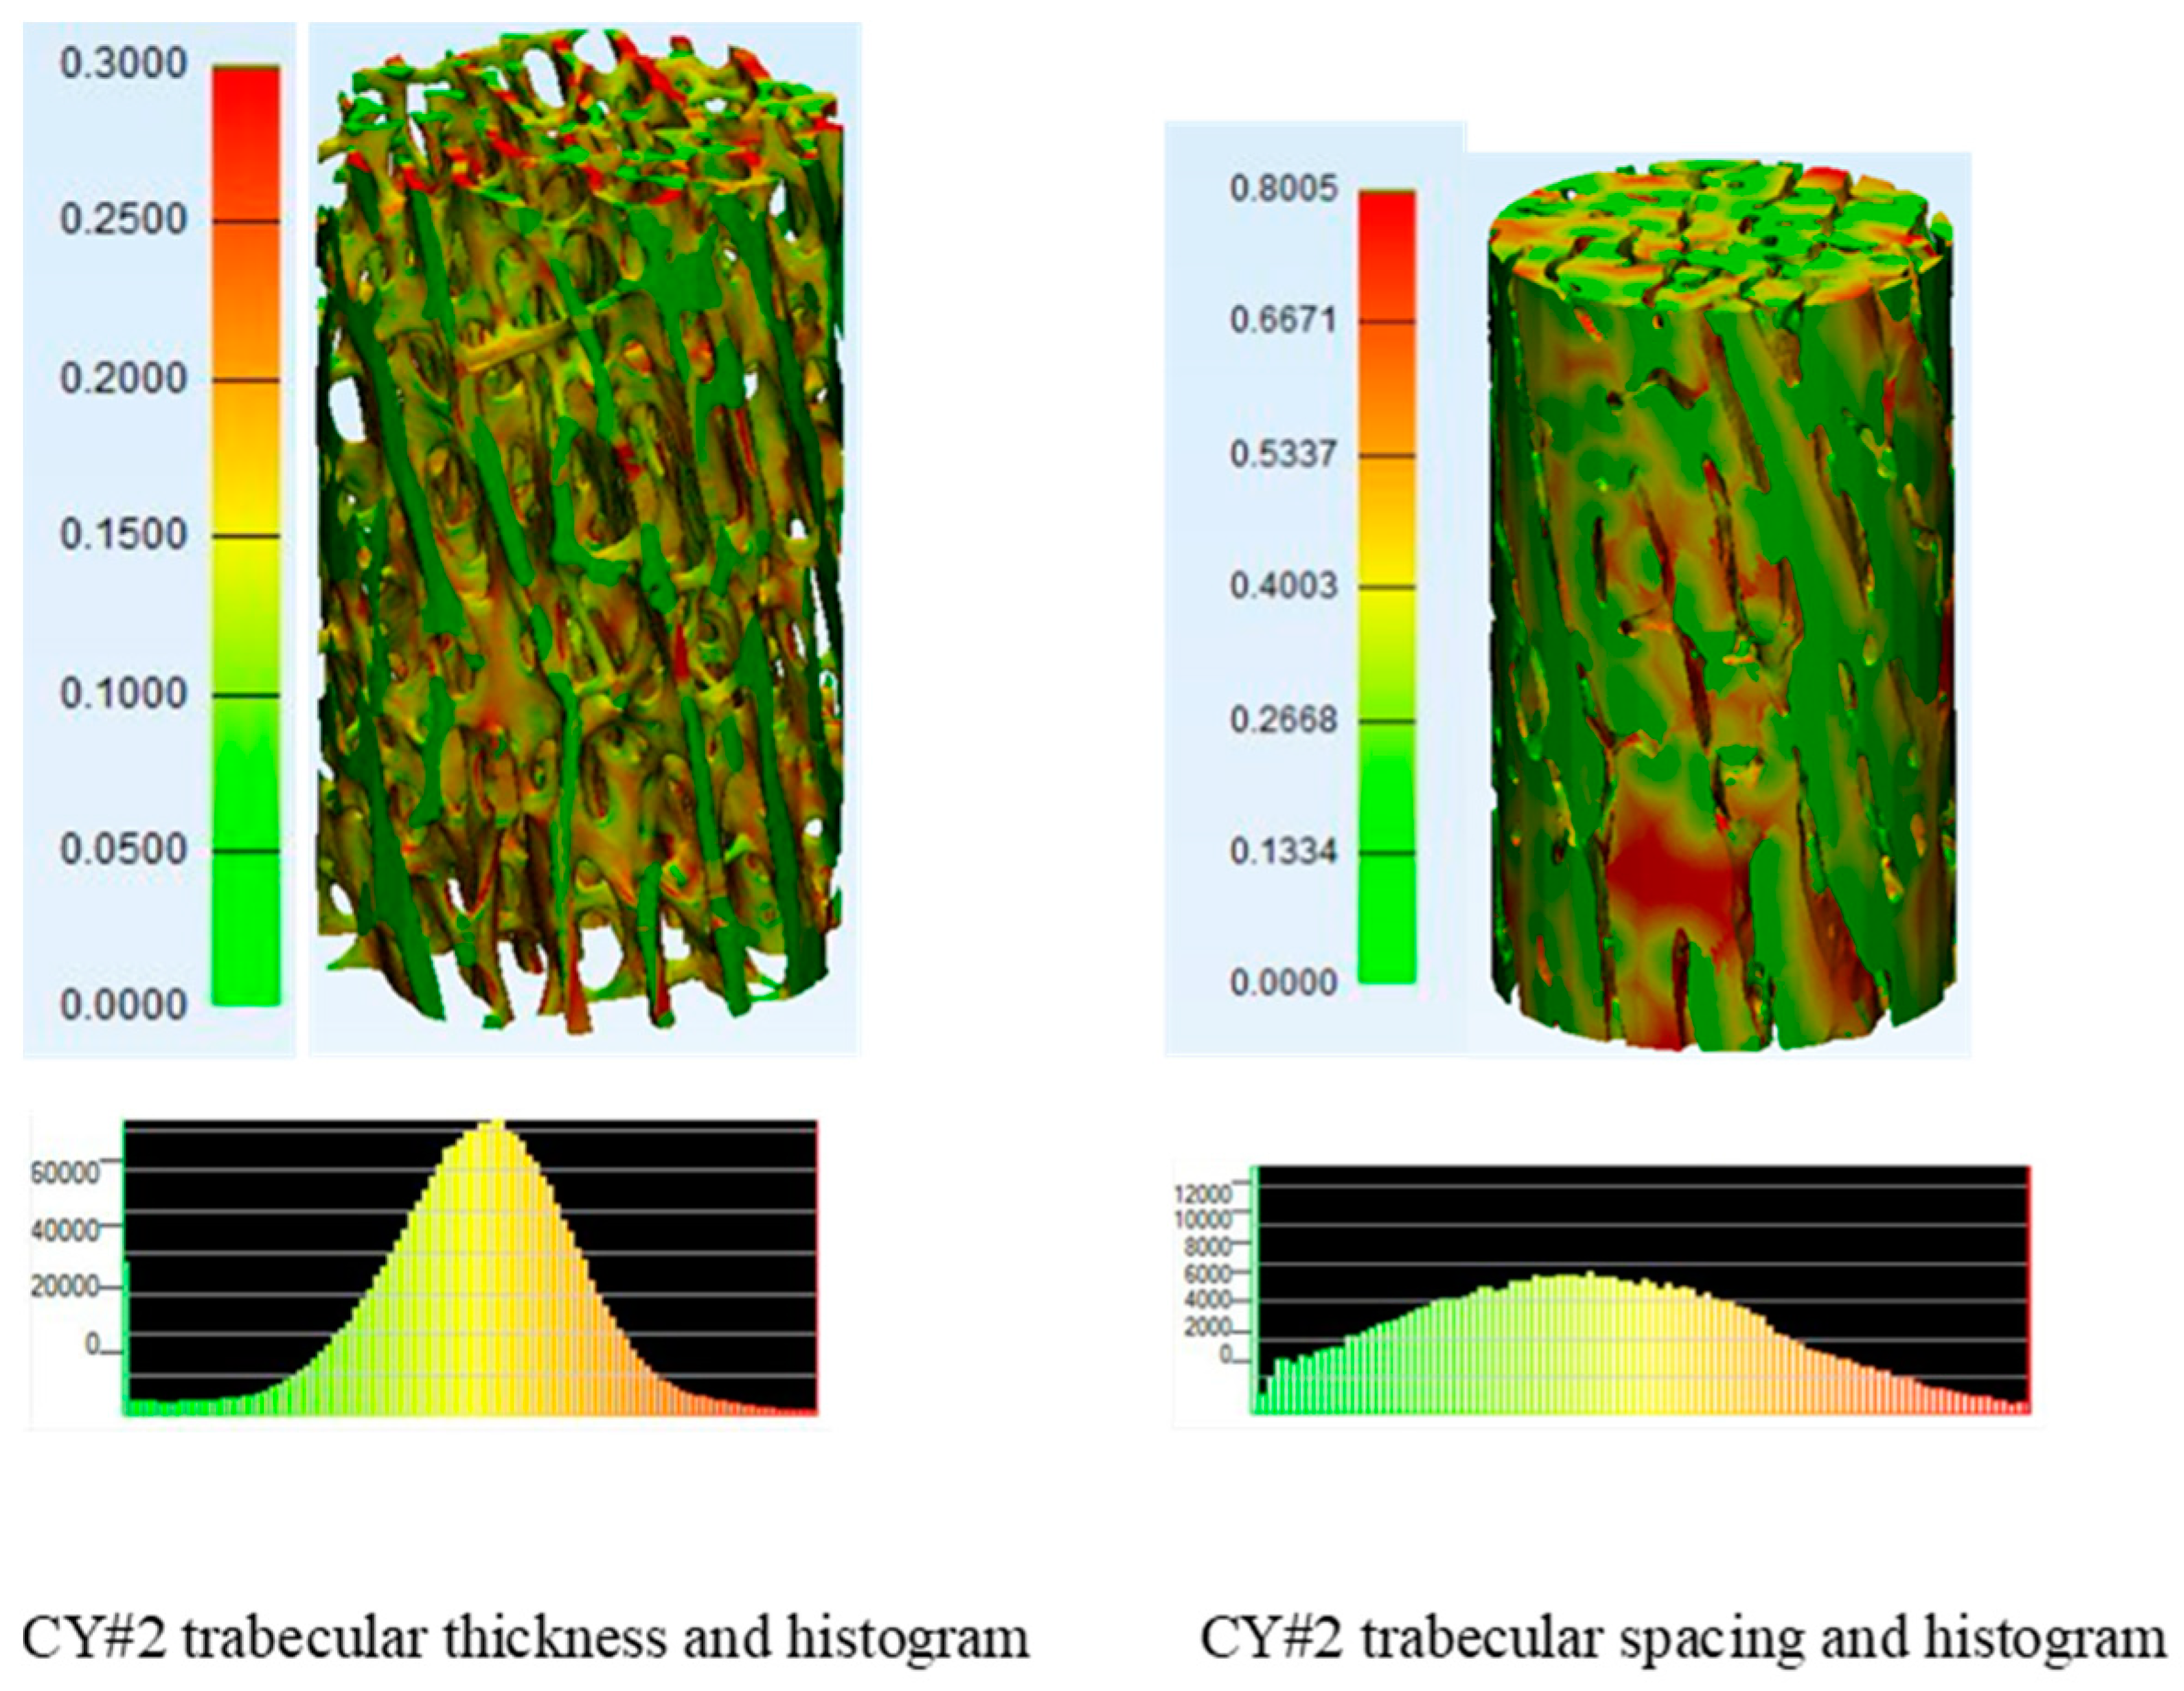
3.2. Micro-CT Scans Results and Analysis

3.2.1. Segmentation of Micro-CT Images

Micro-CT datasets were segmented to create accurate 3D models of the patient’s anatomy. The 3D models can be used for measurement, design customized medical devices, finite element analysis, optimization, and 3D printing, among numerous others. Figure 6 shows on the left, micro-CT segmented results of bone sample CU#1 and bone sample CY#1 and the representative 3D printed models using additive manufacturing techniques on the right.

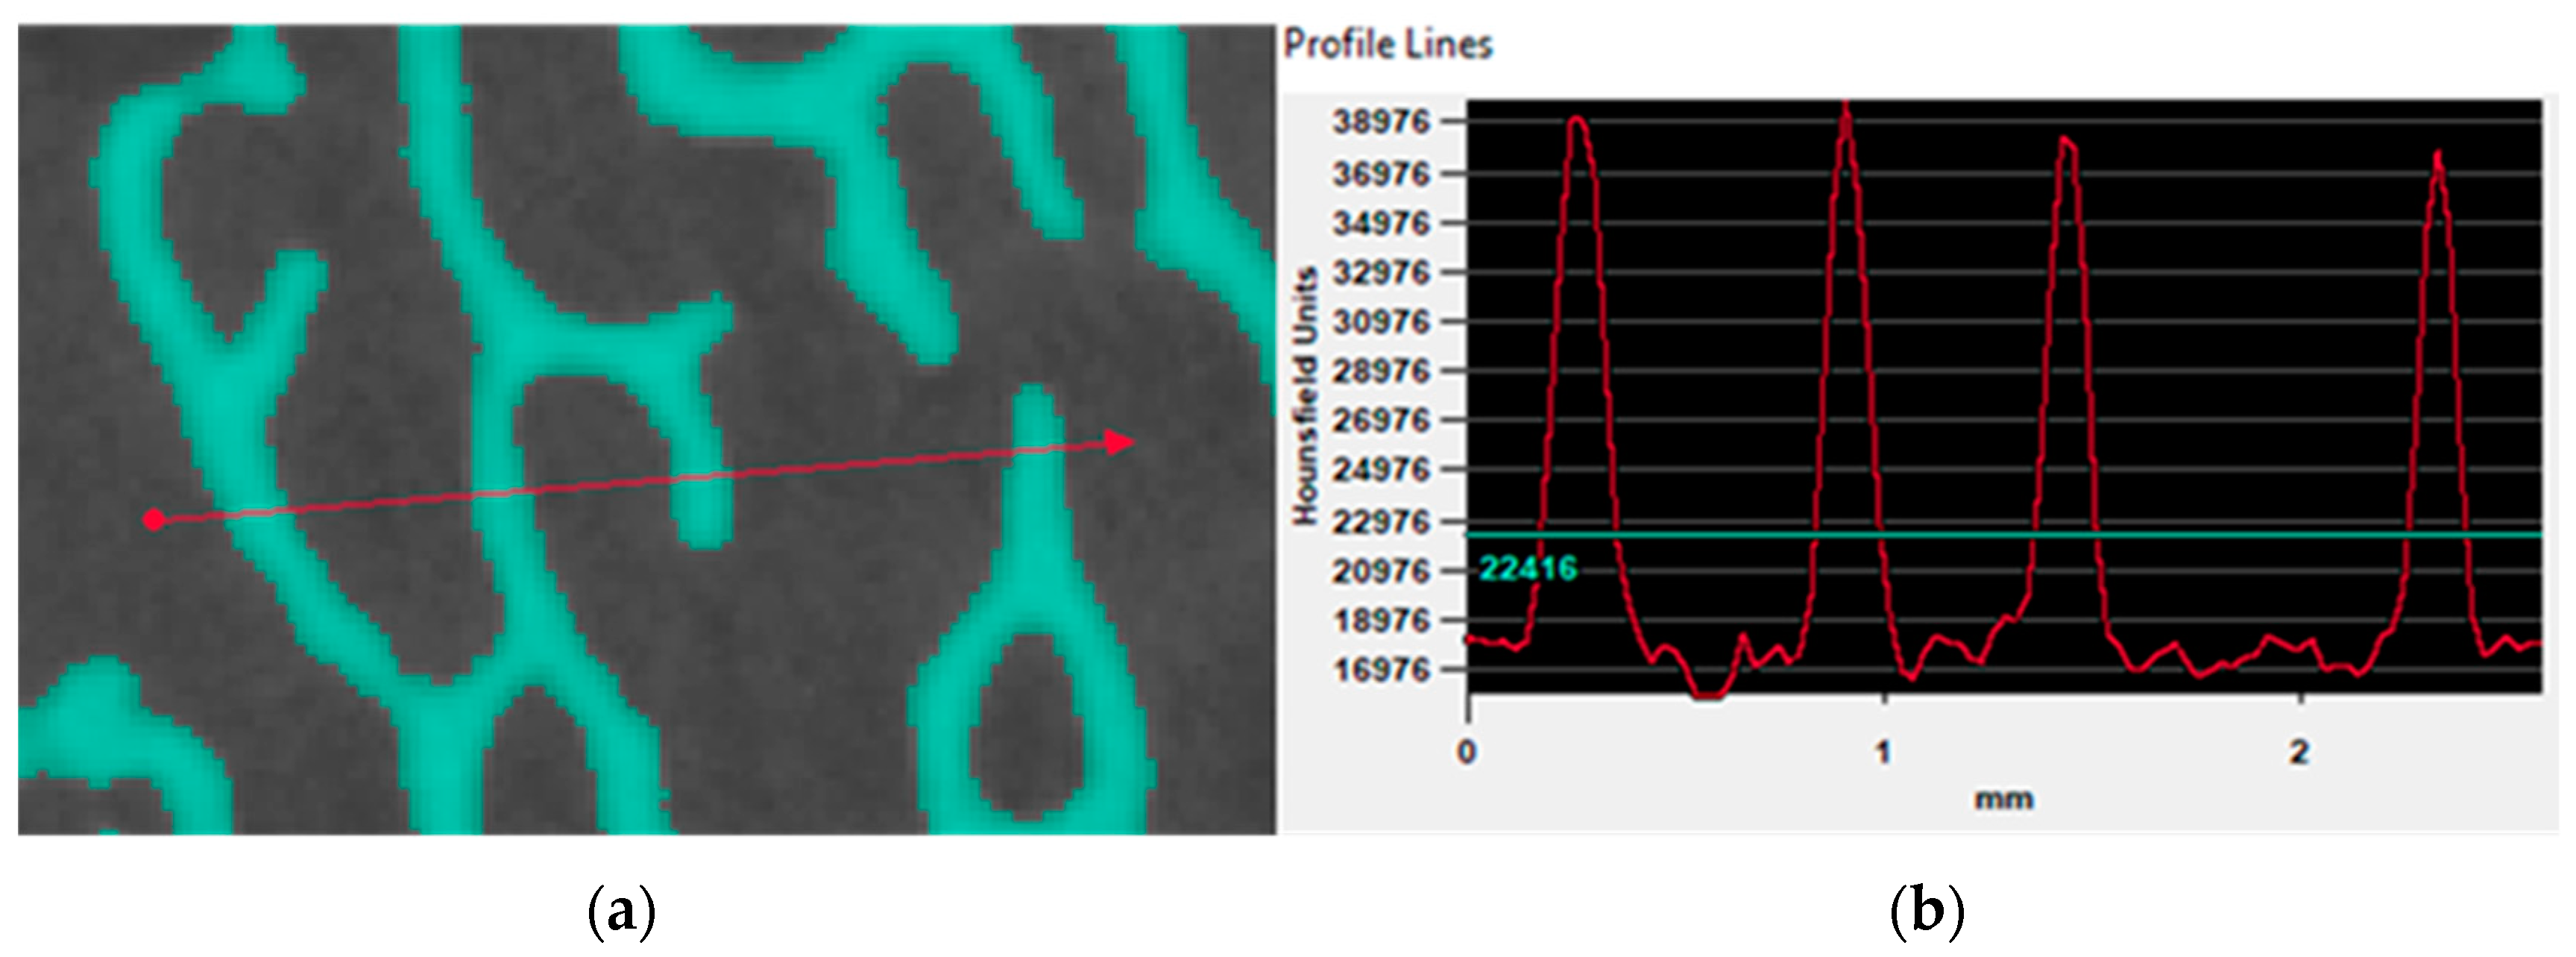
3.2.2. Gray Value Analysis on Micro-CT Data

The optimal gray value thresholds were visually determined for each bone sample based on minimizing noise while maintaining trabecular interconnectivity. Figure 7 shows a high-resolution gray value analysis from micro-CT data of sample CY#1. The arrow on the micro-CT slice image of the trabecular bone (Figure 7a), corresponds to the HU profile displayed in Figure 7b. It is determined that any pixels with a gray value greater than 22,416 HU have been highlighted, and the boundary represents the actual trabecular bone structure. The micro-CT reconstructed image slices were imported into ImageJ BoneJ software [15] and the following parameters have been measured and listed in Table 4.
The trabecular thickness and spacing of specimen CY#1 and CY#2 are analyzed using 3-matic software [11] to create a color map showing the variation of thickness and spacing. The trabecular thickness, spacing, and representative histograms of CY#1 are displayed in Figure 8. The histogram shows the number of mesh triangles with assigned color for the corresponding thickness value. The same parameters are presented for CY#2 in Figure 9.
In many structural systems, there exists a considerable degree of parametric variability and uncertainty. These factors are commonly prevalent when observing events that pertain to biological systems. Probabilistic analyses take into account the variability and uncertainty of a system’s random variables in order to quantify their effects on medical devices reliability and performance. The uncertainty and variability among orthopaedic applications generate a great challenge to probabilistic analyses in which variability of biological structures vary immensely from one location to another. The variability and uncertainty of a structural system can be assessed by defining these parameters as random variables. Random variables can be represented through various types of probability distributions that represent the parameter variation within the target design system. The images presented in Figure 8 and Figure 9, representing trabecular thickness, spacing, and representative histograms for CY#1 and CY#2, respectively. The histograms show the number of mesh triangles with assigned color for the corresponding thickness and spacing values. All presented histograms fit Gaussian functions. These observations mean that the mentioned microarchitecture parameters: trabecular thickness and spacing have significant degree of parametric variability. The Gaussian distribution, also known as the Normal distribution, is a continuous distribution symmetric about its mean. The distribution can be described via mean and standard deviation as described in Equation (1).
f x x = 1 σ 2 π e 1 2 x μ σ 2 d x , < x <
where μ is the distribution mean, σ is the standard deviation, and x is the value of variable.

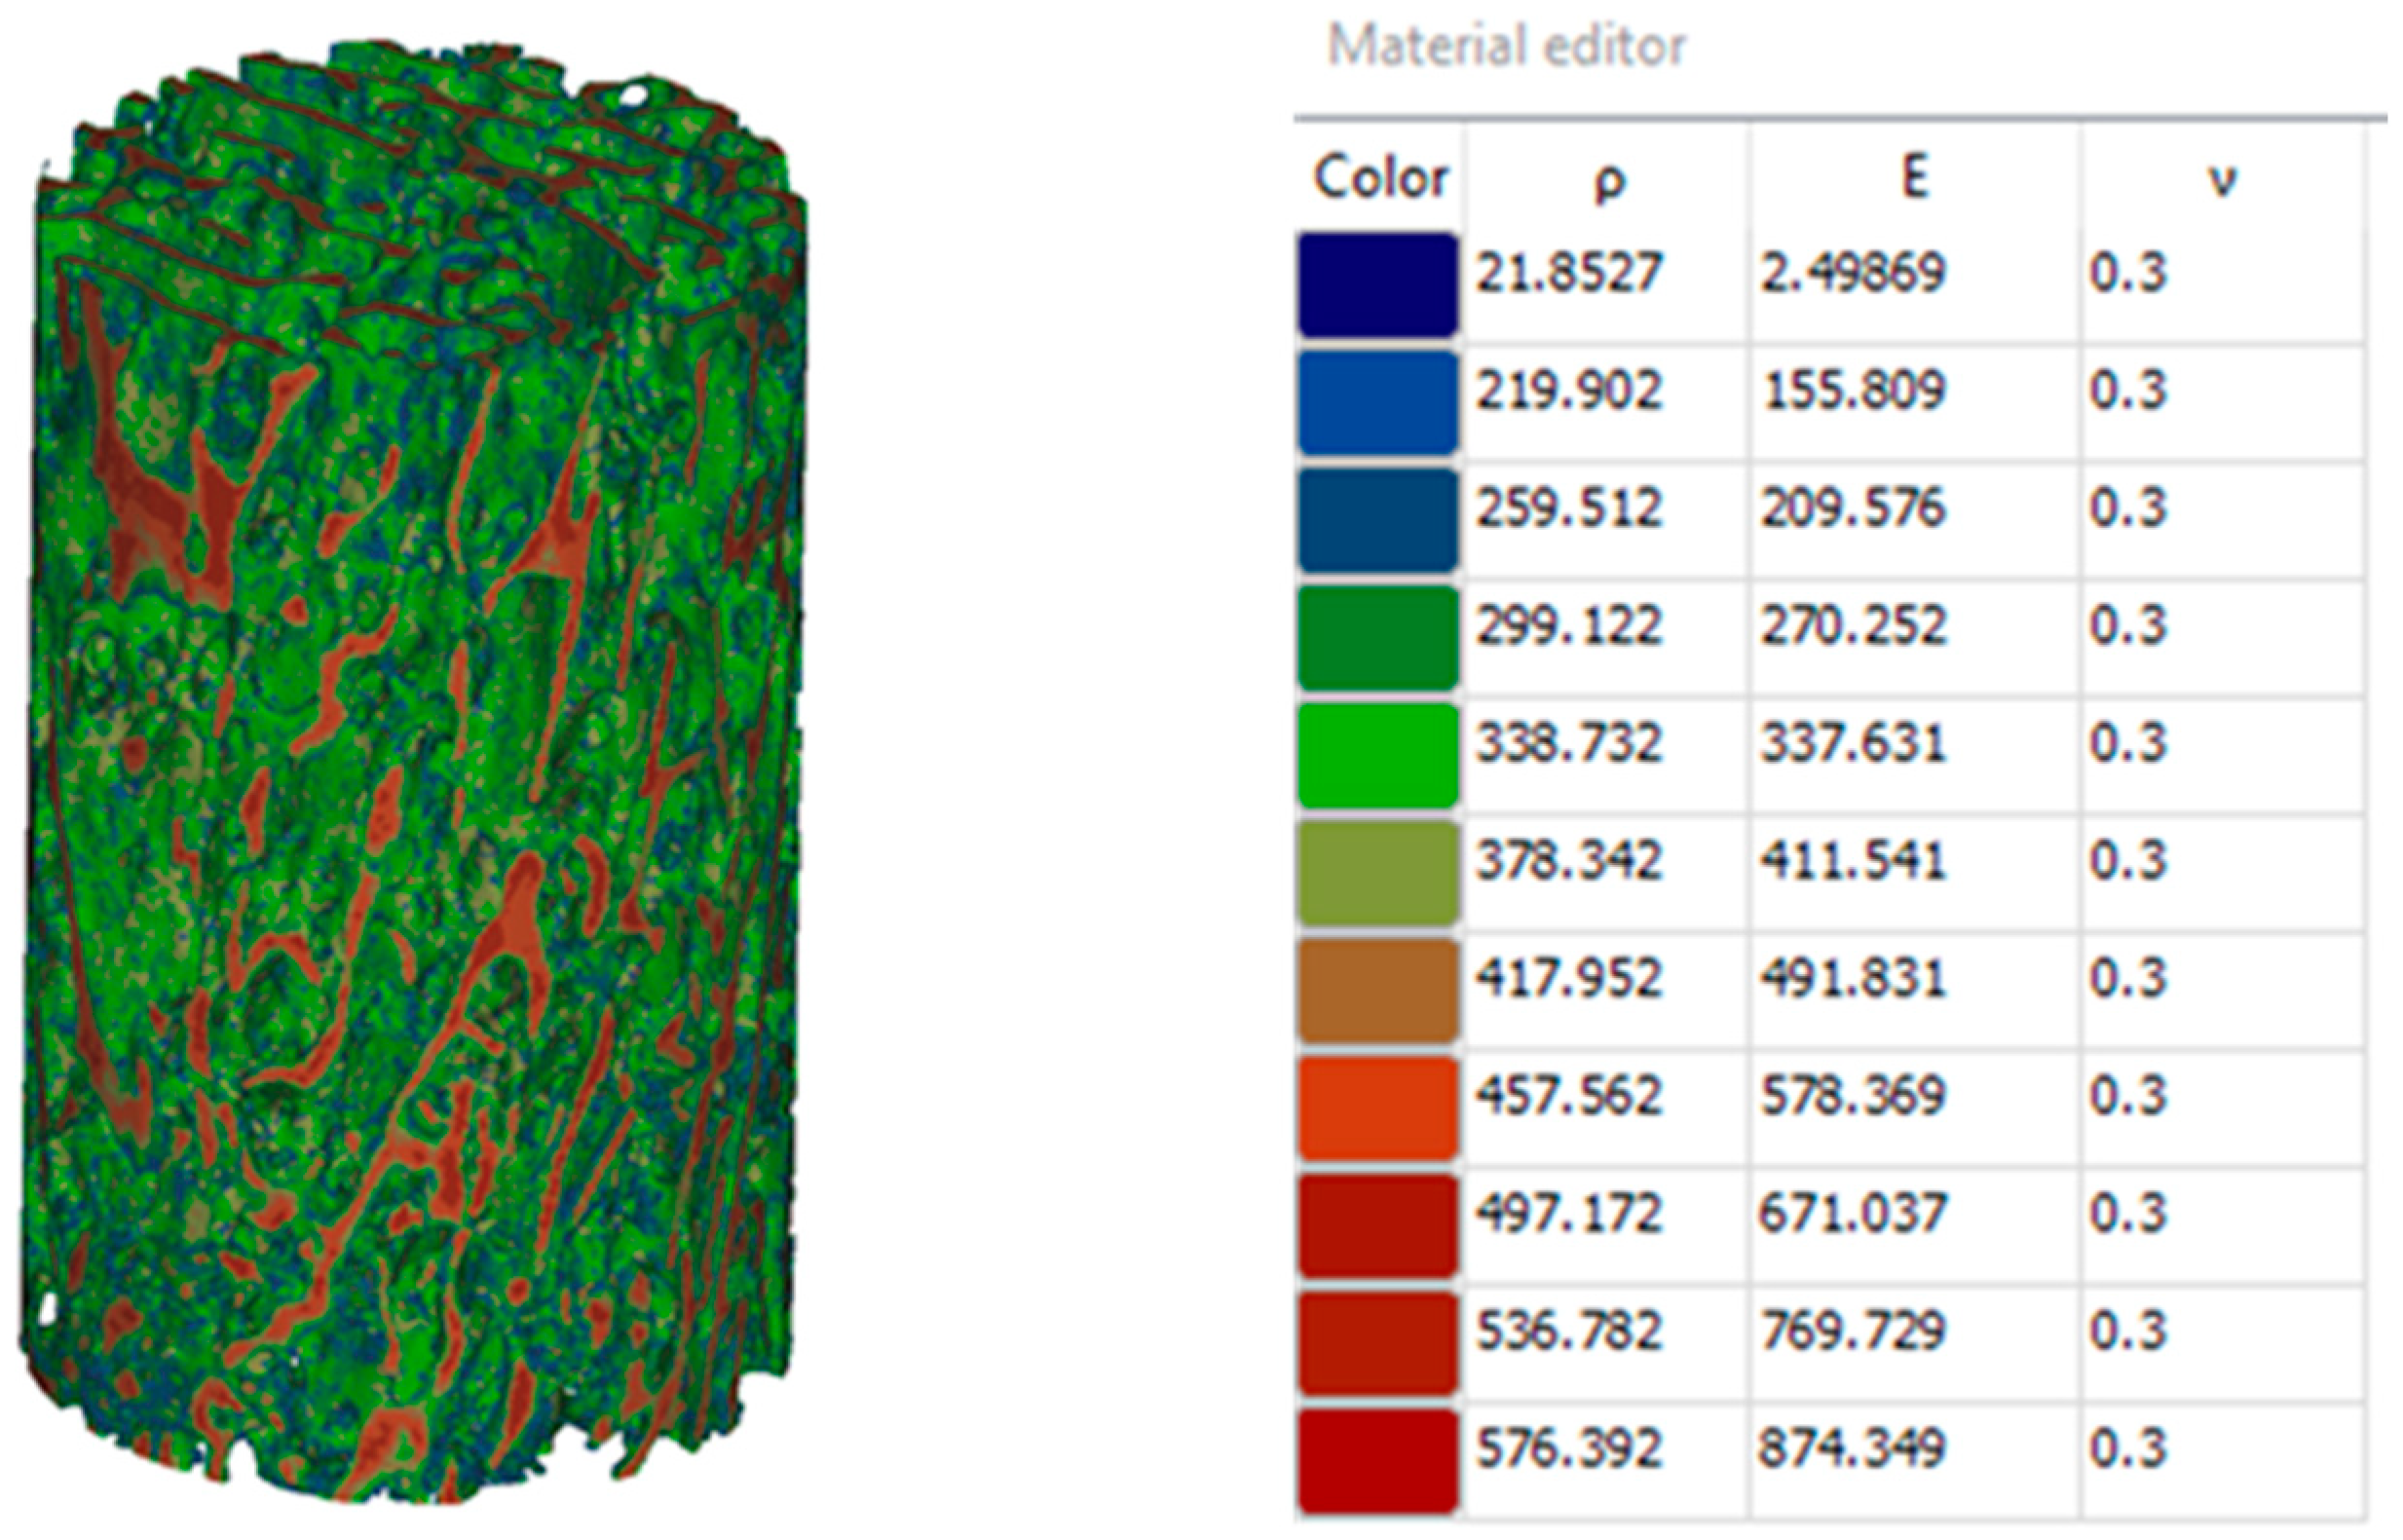
3.2.3. Gray-Scale Value Based Bone Properties

Clinical CT and micro-CT images are a pixel map of the linear X-ray attenuation coefficient of scanned material that reflects the level of beam attenuation due to sample density [1,11,12,15,16]. A Hounsfield scale is applied to the linear X-ray attenuation coefficient through Equation (2), [15,16]. This allows the bone samples to display a gray value distribution, which can be used to segment the geometrical features of a patient anatomy.
After segmentation, the 3D models (surface meshes) can be re-meshed into volume meshes using tetrahedral elements, after which the tetrahedrons can be assigned with material properties using an empirical formula, Equation (3). Different sites of the bone express different coefficients within the formula. For trabecular bone of the proximal tibia, the equations are [17,18]:
ρ = 0.916 H U + 114
E = 0.06 ρ 1.51
In this equation, HU is the gray value or CT number with in Hounsfield units, ρ is apparent density (kg/m3) of the bone, and E is elastic modulus (MPa).
Figure 10 and Table 5 display bone properties assigned based on the gray scale values obtained from micro-CT data. The predicted modulus varied significantly from point to point within the tested sample with an average of 506.7 MPa and standard deviation of 238.06 MPa.

4. Conclusions

The present work presents evaluation and experimental verification of the use of micro-CT for accurate characterization of geometry, microarchitecture, and stiffness properties of bones. These properties are crucial for designing and building optimized implants for joint and dental reconstruction applications.
Micro-CT scans, with their much higher resolution, provide more detailed and accurate information about the microarchitecture and density distribution across patient bones. The micro-CT scans of investigated bone reveal that the trabecular bone is highly anisotropic and heterogeneous. The results also showed considerable degree of parametric variability and uncertainty on microarchitecture and stiffness properties of patient’s trabecular bone. Probabilistic analyses of micro-CT data could take into account these variabilities. They can aid in generating the required lattice structures of optimum implant designs that match closely patient bones and hence can overcome most of the issues related to aseptic loosening phenomenon and premature failure of the treated joints.
Nevertheless, micro-CT application to live patients requires invasive procedures involving small bone biopsies. Such systems require very small samples and are not designed for use with live subjects. Alternatively, micro-CT could be used on samples collected from selected cadavers of different ages (as conducted herein), genders, and race groups to form a database that could be used for providing useful microarchitecture information.

Author Contributions

A.S.E.-G. had substantial contributions to research design, planning, coordination and management of all efforts, securing resources and drafting and submitting the final manuscript of this paper. X.M. had substantial contributions to research design, analysis and experimental work as part of his graduate research at University of Missouri. F.P. had substantial contributions to research design, design of experiments, supervising samples preparation and mechanical testing. J.D.S. and T.S. had substantial contributions to research design, conducting and supervising micro-CT scanning of bone samples. All authors have read and agreed to the published version of the manuscript.

Funding

This research received no external funding.

Institutional Review Board Statement

This study did not require ethical approval.

Informed Consent Statement

No information were obtained from known patients or animals.

Data Availability Statement

The original data presented in this study and related to micro-CT scans are available at the X-ray Microanalysis Laboratory, University of Missouri, Columbia. They are managed by Tara Selly (co-author of this article). All results regarding mechanical testing are available with X Ma, (co-author of this article).

Acknowledgments

The authors wish to acknowledge the in-kind and financial supports provided by Industrial Technology Development and Management (ITECH D&M), LLC, Columbia, Missouri, USA, for this research. Additionally, much gratitude is extended to Talissa Altes and Staff of the University Of Missouri Department of Radiology for sharing their CT scanner and expertise. Our appreciation is also extended to Robert Winholtz, Frank Feng, and Matthew Maschmann of the University of Missouri Department of Mechanical and Aerospace Engineering for their valuable discussions and encouragement during the course of the present project.

Conflicts of Interest

The authors declare no conflict of interest.

References

  1. Ciarelli, M.J.; Goldstein, S.A.; Kuhn, J.L.; Cody, D.D.; Brown, M.B. Evaluation of orthogonal mechanical-properties and density of human trabecular bone from the major metaphyseal regions with materials testing and computed-tomography. J. Orthop. Res. 1991, 9, 674–682. [Google Scholar] [CrossRef]
  2. Macneil, J.A.; Boyd, S.K. Bone strength at the distal radius can be estimated from high-resolution peripheral quantitative computed tomography and the finite element method. Bone 2008, 42, 1203–1213. [Google Scholar] [CrossRef] [PubMed]
  3. Dumas, M.; Terriault, P.; Brailovski, V. Modelling and characterization of a porosity graded lattice structure for additively manufactured biomaterials. Mater. Des. 2017, 121, 383–392. [Google Scholar] [CrossRef]
  4. Arnone, J.; Crist, B.; Ward, C.; El-Gizawy, A.; Pashuck, T.; Della Rocca, G. Variability of human femoral geometry and its implications on nail design. Injury 2021, 52, 109–116. [Google Scholar] [CrossRef] [PubMed]
  5. Wu, Y.; Adeeb, S.; Doschak, M.R. Using micro-CT derived bone microarchitecture to analyze bone stiffness—A case study on osteoporosis rat bone. Front. Endocrinol. 2015, 6, 80. Available online: www.frontiersin.org (accessed on 4 September 2022). [CrossRef] [PubMed] [Green Version]
  6. Ryan, M.; Barnet, L.; Rochester, J.; Wilkinson, J.M.; Dall’Ara, E. A new approach to comprehensively evaluate the morphological properties of the human femoral head: Example of application to osteoarthritic joint. Sci. Rep. 2020, 10, 5538. [Google Scholar] [CrossRef] [PubMed] [Green Version]
  7. Uklejewski, R.; Winiecki, M.; Patalas, A.; Rogala, P. Bone Density Micro-CT Assessment during Embedding of the Innovative Multi-Spiked Connecting Scaffold in Periarticular Bone to Elaborate a Validated Numerical Model for Designing Biomimetic Fixation of Resurfacing Endoprostheses. Materials 2021, 14, 1384. [Google Scholar] [CrossRef] [PubMed]
  8. Gibson, L.; Ashby, M.; Harley, B. Cellular Materials in Nature and Medicine; Cambridge University Press: Cambridge, UK, 2020; ISBN 9780521195447. [Google Scholar]
  9. Zhou, B.; Liu, X.S.; Wang, J.; Lu, X.L.; Fields, A.; Guo, X.E. Dependence of mechanical properties of trabecular bone on plate-rod microstructure determined by individual trabecula segmentation (ITS). J. Biomech. 2014, 47, 702–708. [Google Scholar] [CrossRef] [PubMed] [Green Version]
  10. Shiraishi, K.; Chiba, K.; Okazaki, N.; Yokota, K.; Nakazoe, Y.; Kidera, K.; Yonekura, A.; Tomita, M.; Osaki, M. In vivo analysis of subchondral trabecular bone in patients with osteoarthritis of the knee using second-generation high-resolution peripheral quantitative computed tomography (HR-PQCT). Bone 2020, 132, 115155. [Google Scholar] [CrossRef] [PubMed]
  11. Okazaki, N.; Chiba, K.; Motoi, M.; Osaki, M. Analysis of Subchondral Bone Microstructure by HR-PQCT: Relationship with the Severity of Knee Osteoarthritis and Alignments of Lower Extremities. Osteoarthr. Cartil. 2017, 25, S263. [Google Scholar] [CrossRef]
  12. Akhter, M.P.; Recker, R.R. High-resolution imaging in bone tissue research-review. Bone 2021, 143, 115620. [Google Scholar] [CrossRef] [PubMed]
  13. Diederichs, G.; Link, T.M.; Kentenich, M.; Schwieger, K.; Huber, M.B.; Burghardt, A.J. Assessment of trabecular bone structure of the calcaneus using multi- detector CT: Correlation with micro CT and biomechanical testing. Bone 2009, 44, 976–983. [Google Scholar] [CrossRef] [PubMed]
  14. Parsa, A.; Ibrahim, N.; Hassan, H.; Van der Stelt, P.; Wismeijer, D. Bone quality evaluation at dental implant site using multi-slice CT, micro-CT, and cone beam CT. Clin. Oral Implants Res. 2015, 26, e1–e7. [Google Scholar] [CrossRef] [PubMed]
  15. Domander, R.; Felder, A.A.; Doube, M. BoneJ2—Refactoring Established Research Software. Available online: https://pubmed.ncbi.nlm.nih.gov/33954267 (accessed on 4 September 2022).
  16. Materialize. Mimics Innovation Suite. 2022. Available online: https://www.materialise.com/en/medical/mimics-innovation-suite (accessed on 4 September 2022).
  17. Doube, M.; Kłosowski, M.M.; Arganda-Carreras, I.; Cordelières, F.P.; Dougherty, R.P.; Jackson, J.S.; Schmid, B.; Hutchinson, J.R.; Shefelbine, S.J. BoneJ Free and extensible bone image analysis in ImageJ. Bone 2010, 47, 1076–1079. [Google Scholar] [CrossRef] [PubMed] [Green Version]
  18. Kumar, A.; Mandal, S.; Barui, S.; Vasireddi, R.; Gbureck, U.; Gelinsky, M.; Basu, B. Low temperature additive manufacturing of three-dimensional scaffolds for bone-tissue engineering applications: Processing related challenges and property assessment. Mat. Sci. Eng. R 2016, 103, 1–39. [Google Scholar] [CrossRef]
Figure 1. Preparation of the trabecular bone samples.
Biomed 03 00007 g001
Figure 2. Setup in Micro-CT scanner.
Biomed 03 00007 g002
Figure 3. Tuning the Scanning Parameters.
Biomed 03 00007 g003
Figure 4. Compression testing of the bone specimens.
Biomed 03 00007 g004
Figure 5. Stress–strain curves for cylinder bone samples 1 and 2.
Biomed 03 00007 g005
Figure 6. Micro-CT segmented 3D models of cubic bone sample CU#1 and Cylindrical sample CY#1 (left) and 3-D printed model using additive manufacturing technique (right).
Biomed 03 00007 g006
Figure 7. Gray value analysis on a micro level on the Micro CT. The arrow on the micro-CT slice image of the trabecular bone (a), corresponds to the HU profile displayed in (b).
Biomed 03 00007 g007
Figure 8. Trabecular thickness and trabecular spacing colored maps and histograms for cylindrical bone sample CY#1.
Biomed 03 00007 g008
Figure 9. Trabecular thickness and trabecular spacing colored maps and histograms for cylindrical bone sample CY#2.
Biomed 03 00007 g009
Figure 10. Bone Stiffness Properties (MPa) Assigned Based on the Gray Scale Values.
Biomed 03 00007 g010
Table 1. Setting of the used Micro-CT Scanner.
Sample IdentificationVoxel Size (Micrometer)KvWObjectiveFilterExposure (Sec)ProjectionsTime per Sample (Hours)
CU#127.318504 4
CU#227.3180.4XLE1412012
CY#118.011 4.5
CY#218.011 4.5
Table 2. Properties obtained on the first cadaver (21M) of cubic and cylindrical bone samples.
Sample IdentificationModulus Si (MPa)Yield Strength
(MPa)
Yield Strain
CU#11338.67 (Max)0.093
CU#2452.70 (Min)0.101
CY#11344.400.056
CY#21072.950.080
AVERAGE1054.680.082
STANDARD DEVIATION422.760.0196
Table 3. Compression testing results of the trabecular bone specimens of the second cadaver.
Bone Sample
Identification
Elastic Modulus
(MPa)
Yield Strength
(MPa)
19.00.3
235.32.0
318.80.4
420.90.6
541.21.6
613.10.4
7108.22.5
854.92.5
9102.93.2
1020.72.0
1128.10.7
1246.30.6
1347.10.6
1435.80.6
15395.06.0
161903.48.5
1733.90.6
18101.62.0
19241.28.7
2082.42.7
21134.54.4
22106.83.0
AVERAGE
VALUE
163.02.4
STANDARD
DEVIATION
399.002.5
Table 4. Trabecular bone analysis in ImageJ BoneJ.
Trabecular Boone
Sample Identification
BV/TV
(%)
BS/TV
(MM−1)
BS/BV
(MM−1)
TB.TH
(MM)
TB.TH.SD
(MM)
TB.SP
(MM)
TB.SP.SD
(MM)
DACONN.D
(MM−3)
CU#126.8763.45412.8510.1540.0370.3180.1510.5524.523
CU#218.9292.68514.1870.1480.0410.3630.1720.2703.161
CY#115.8762.27014.2960.1510.0480.3820.2060.3703.032
CY#222.3563.06113.6800.1520.050.3410.1810.5562.919
Average21.0092.86713.7560.1510.0440.3510.1780.4373.409
Standard
Deviation
4.7230.5070.6580.00250.0060.0280.0230.1410.749
BV/TV: Bone volume fraction, ratio of the segmented bone volume to the total volume of the region of interest. BS/TV: Bone surface density, the ratio of the segmented bone surface to the total volume of the region of interest. BS/BV: Specific bone surface, the ratio of the segmented bone surface to the segmented bone volume. Tb.Th: Trabecular thickness, mean thickness of trabeculae, assessed using direct 3D methods. Tb.Sp: Trabecular separation, the mean distance between trabeculae, assessed using direct 3D methods. Tb.Th.SD: Standard deviation of trabecular thickness, the measure of the homogeneity of trabecular thickness, assessed using direct 3D methods. Tb.Sp.SD: Standard deviation of trabecular separation, the measure of the homogeneity of trabecular separation, assessed using direct 3D methods. DA: Degree of anisotropy with value of “zero” means the image is completely isotropic. DA with value of “one” means there is a very large variation on properties with orientation in the structure of the image. Conn.D: Connectivity density, a measure of the degree of connectivity of trabeculae normalized by the TV [15].
Table 5. Bone Stiffness Properties.
Grayscale Measurement
Location
Calculated Stiffness
(MPa)
1156
2210
3270
4338
5412
6492
7578
8671
9770
10874
Average (MPa)507
Standard Deviation (MPa)238
Disclaimer/Publisher’s Note: The statements, opinions and data contained in all publications are solely those of the individual author(s) and contributor(s) and not of MDPI and/or the editor(s). MDPI and/or the editor(s) disclaim responsibility for any injury to people or property resulting from any ideas, methods, instructions or products referred to in the content.

