1. Introduction
The need to control the location of assets in real-time is increasingly relevant worldwide [
1,
2,
3]. Currently, there is control over the location of vehicles, people, animals, cell phones/smartphones, materials, and equipment [
2,
3,
4]. Several technologies can be used as real-time location systems (RTLS) in the internet of things (IoT) context. RTLS is a wireless system that can locate an asset’s position anywhere, in a defined space, at an instance of time close to real-time. The location of the asset is obtained by measuring the properties of the electromagnetic wave propagation that form the communication link between the transmitter and receiver [
1,
2,
3,
4]. GPS (global positioning system) is the most commonly used technology for tracking and the remote management of assets in an external environment. Still, the emergence of 5G technology (the fifth generation of wireless communication systems for mobile telephony) opens new possibilities for using this technology in RTLS [
2,
3,
4]. Indoors, several technologies can be used for RTLS, such as Wi-Fi (wireless communication network with routers), Bluetooth (wireless communication network using radio waves), RFID (radio frequency identification), and, of course, UWB (ultra-wideband), the topic of this paper [
2,
3,
4].
UWB technology is characterized by radio communication with electromagnetic pulses of a short duration between a tag and fixed anchors, using trilateration (distances) or triangulation (angles) to estimate the location of the asset. The asset to be tracked is equipped with the tag, and fixed anchors are installed in the internal environment. The tag interacts with the fixed anchors, defining its position through the distances obtained by trilateration. The gateway sends this data wirelessly to the server [
2,
3,
4]. Along with the choice of this technology, it was decided that the method called two-way ranging (TWR) should be used to identify the tag’s positioning coordinates. Under this method, the transmitter sends a signal to the receiver first and then sends a return acknowledgment signal from the receiver to the transmitter. The TWR method eliminates the need for synchronization between the tag and the anchors, so the distance is obtained based on the round-trip time of the signal [
2,
3].
Previous studies have reported measurement errors in the RTLS tracking of assets in different types of environments using GPS [
5,
6], RFID [
7,
8,
9], and UWB [
3,
10,
11,
12,
13]. However, a measurement uncertainty calculation of the experimental data was not presented; the associated standard deviation was reported at most. However, measurement uncertainty is fundamental to express, quantitatively, the dispersion of the measurement result. This quantitative expression of the result dispersion delimits the confidence interval associated with each error and robustly characterizes the experimental error [
14,
15]. This enables a better interpretation of the measurement results and helps decision-making in the analysis of the use of the technology under study. It even makes it possible to quantify the minimum tolerance interval that this technology can meet. According to the “golden rule,” the tolerance amplitude should be equal to at least five times the measurement uncertainty [
16,
17,
18].
This work aims to quantify the mean error and calculate the measurement uncertainty of a RTLS system with UWB technology in an indoor environment without obstacles. The global uncertainty was calculated by adding the largest tag position mean error (
), among all measured points, to the tag position mean error uncertainty (
Uerror) [
14,
15]. In UWB technology, the RTLS location of an asset is determined by exchanging signals between a wireless tag (asset) and fixed anchors [
2,
3,
11,
12,
13]. Thus, the tag position mean error is obtained by the difference between the position indicated by the RTLS system and the Cartesian coordinates measured with a total station [
3,
13]. The total station is the reference measurement system that establishes the metrological reliability of the study. An Ishikawa diagram of the main sources of uncertainty was initially constructed for the uncertainty calculations. From these sources, the standard uncertainties were calculated and combined, according to ISO GUM—the Guide to the Expression of Uncertainty in Measurement, a bottom-up approach, resulting in the final uncertainty, which is the statistical basis of the work [
14,
15].
2. Materials and Methods
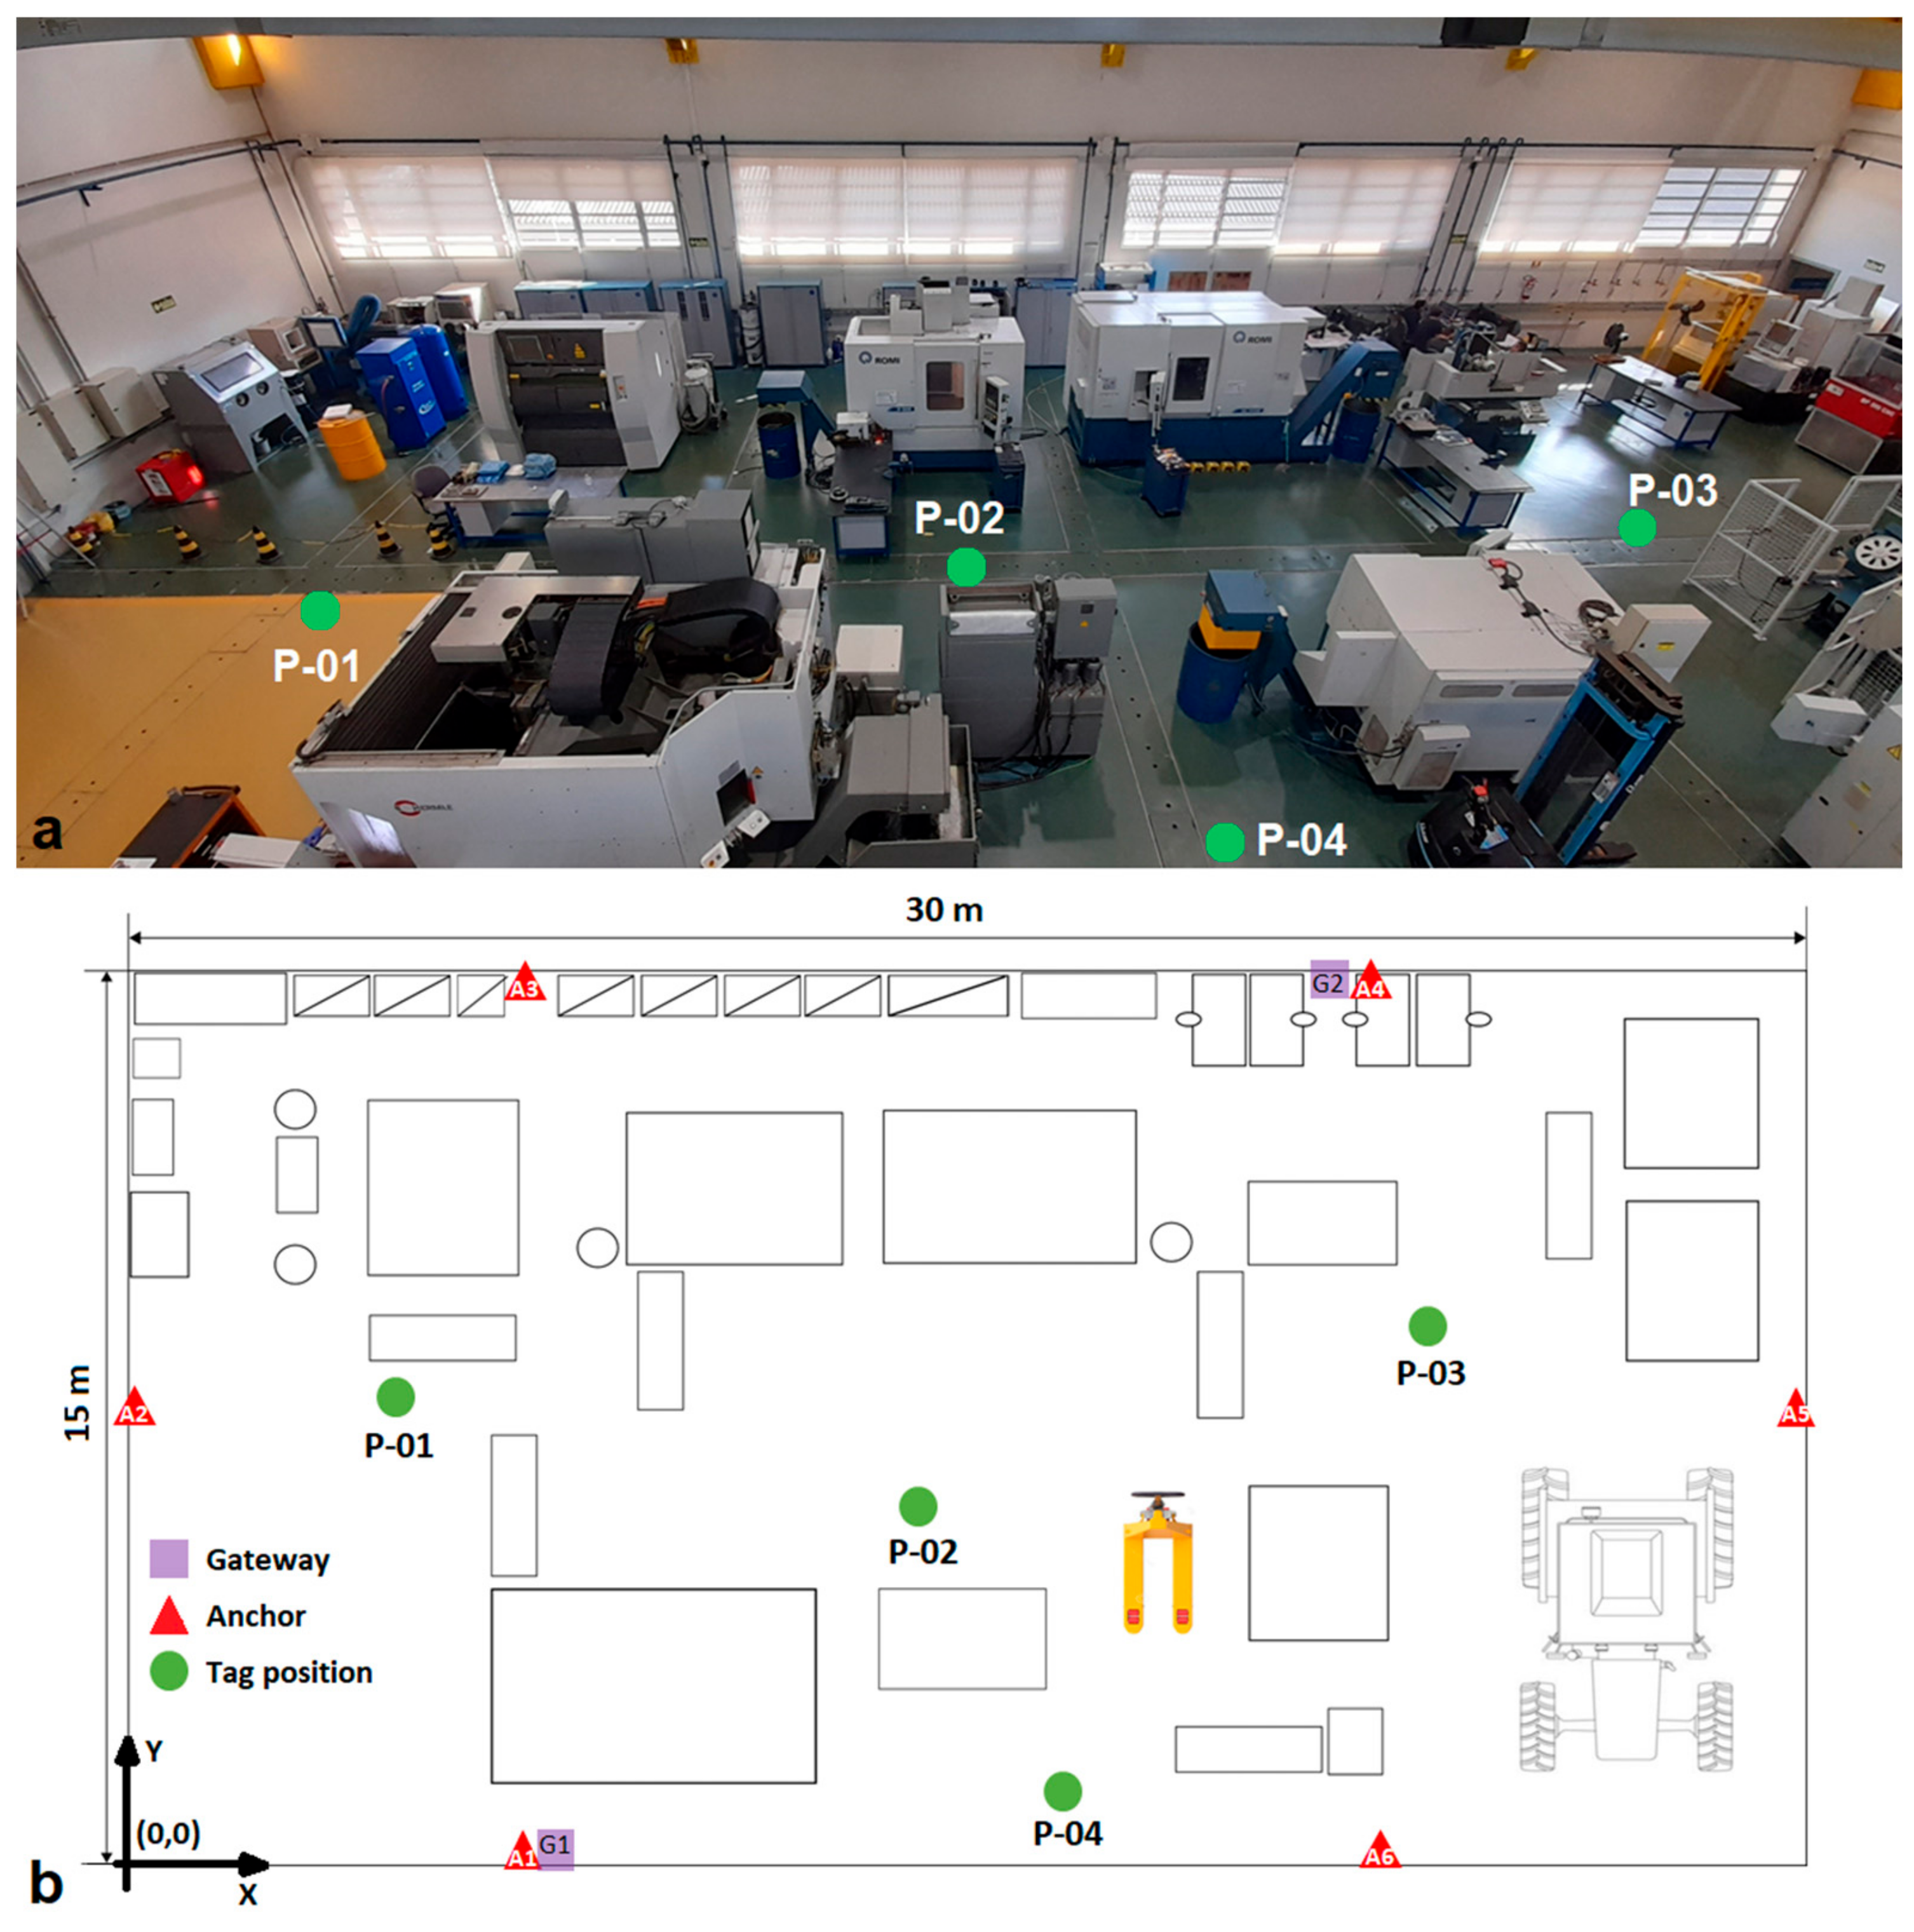
In this work, the RTLS asset tracking and location system was used with UWB technology and the TWR method, applied in an indoor environment. The indoor environment was the experimental factory of the SENAI Institute of Innovation in Integrated Solutions in Metal Mechanics—ISI-SIM, located in São Leopoldo—Rio Grande do Sul—Brazil. The implementation of UWB with TWR, in the experimental factory, was configured using a tag statically positioned at four measurement points (P-01 to P-04), six anchors (A1 to A6), two gateways (G1 and G2), and a server (
Figure 1).
The six anchors were positioned on the four inner walls of the experimental factory, one anchor was installed on each smaller wall (15 m), and two anchors were installed on each larger wall (30 m)—see
Figure 1. The schematic representation describes the positioning of the machine tools, the tractor, and the pallet truck (yellow element in
Figure 1b), inside the experimental factory, during the tests. A gateway was also installed next to anchor A1, and another gateway was installed next to anchor A4. Measurements of the spatial coordinates (X, Y, and Z) of all the anchors were made using an electronic total station [
3,
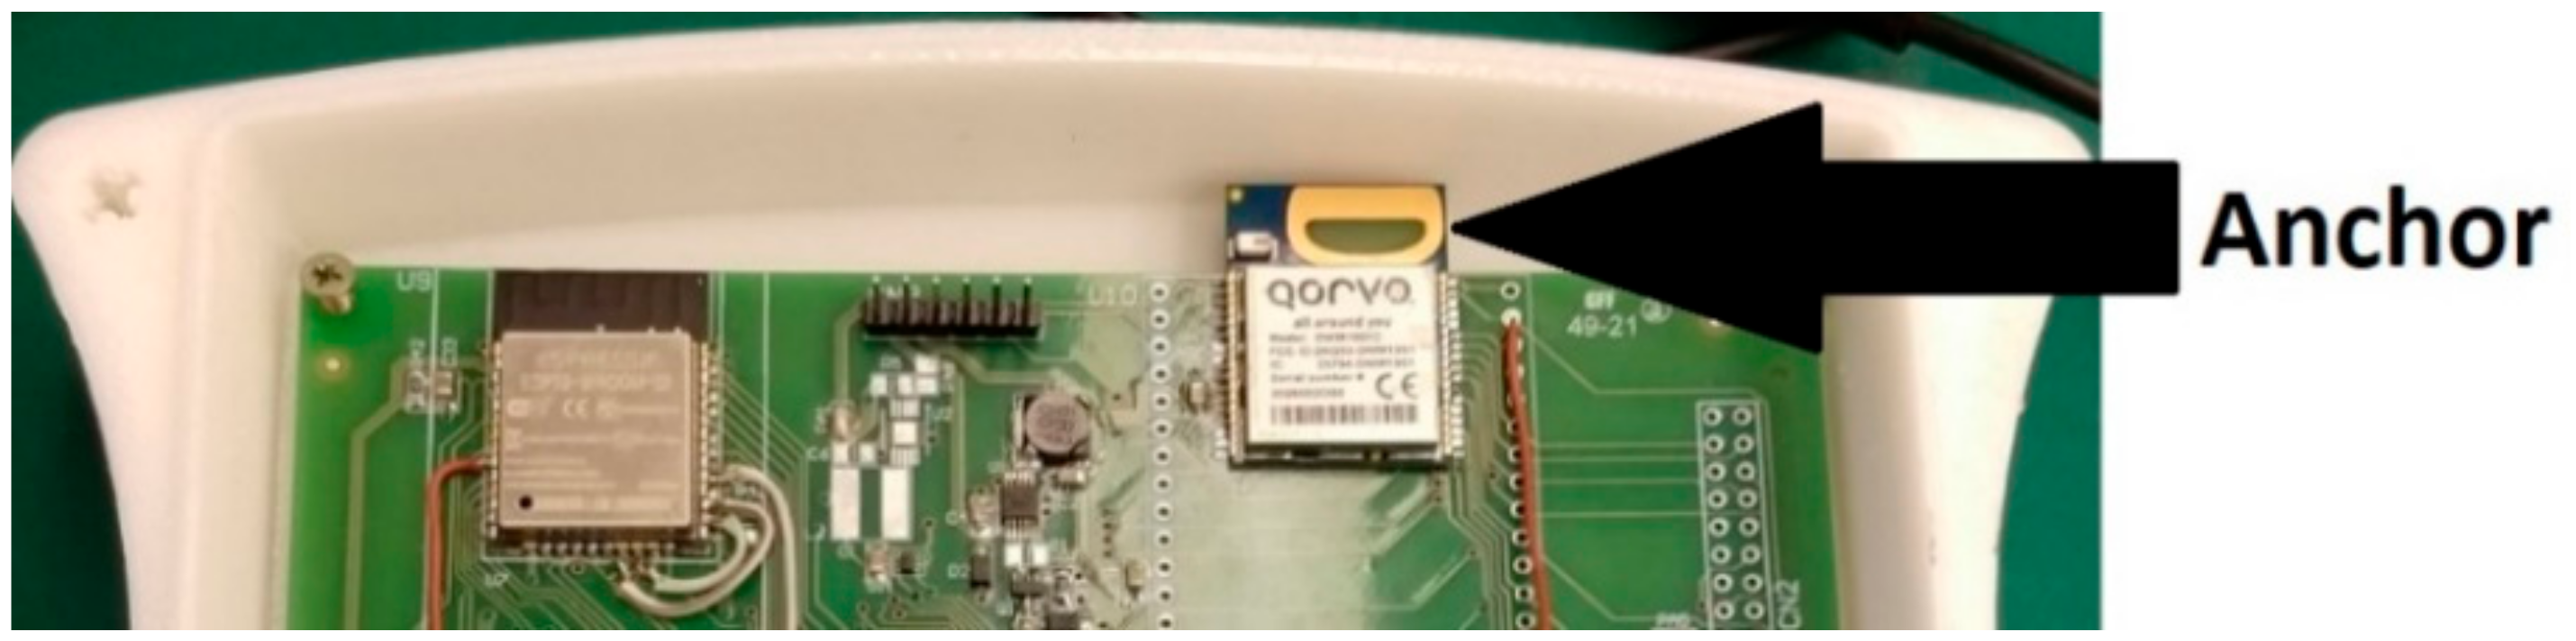
13]. The spatial position of the internal antenna of the anchor (
Figure 2) was projected onto the antenna housing, and a retro-reflective target was fixed on the outside of the housing to measure the three-dimensional coordinate with the total station.
The six UWB antennas, the two gateways, and the tag used in this study were developed by SENAI ISI-SIM. The DWM1001C module (
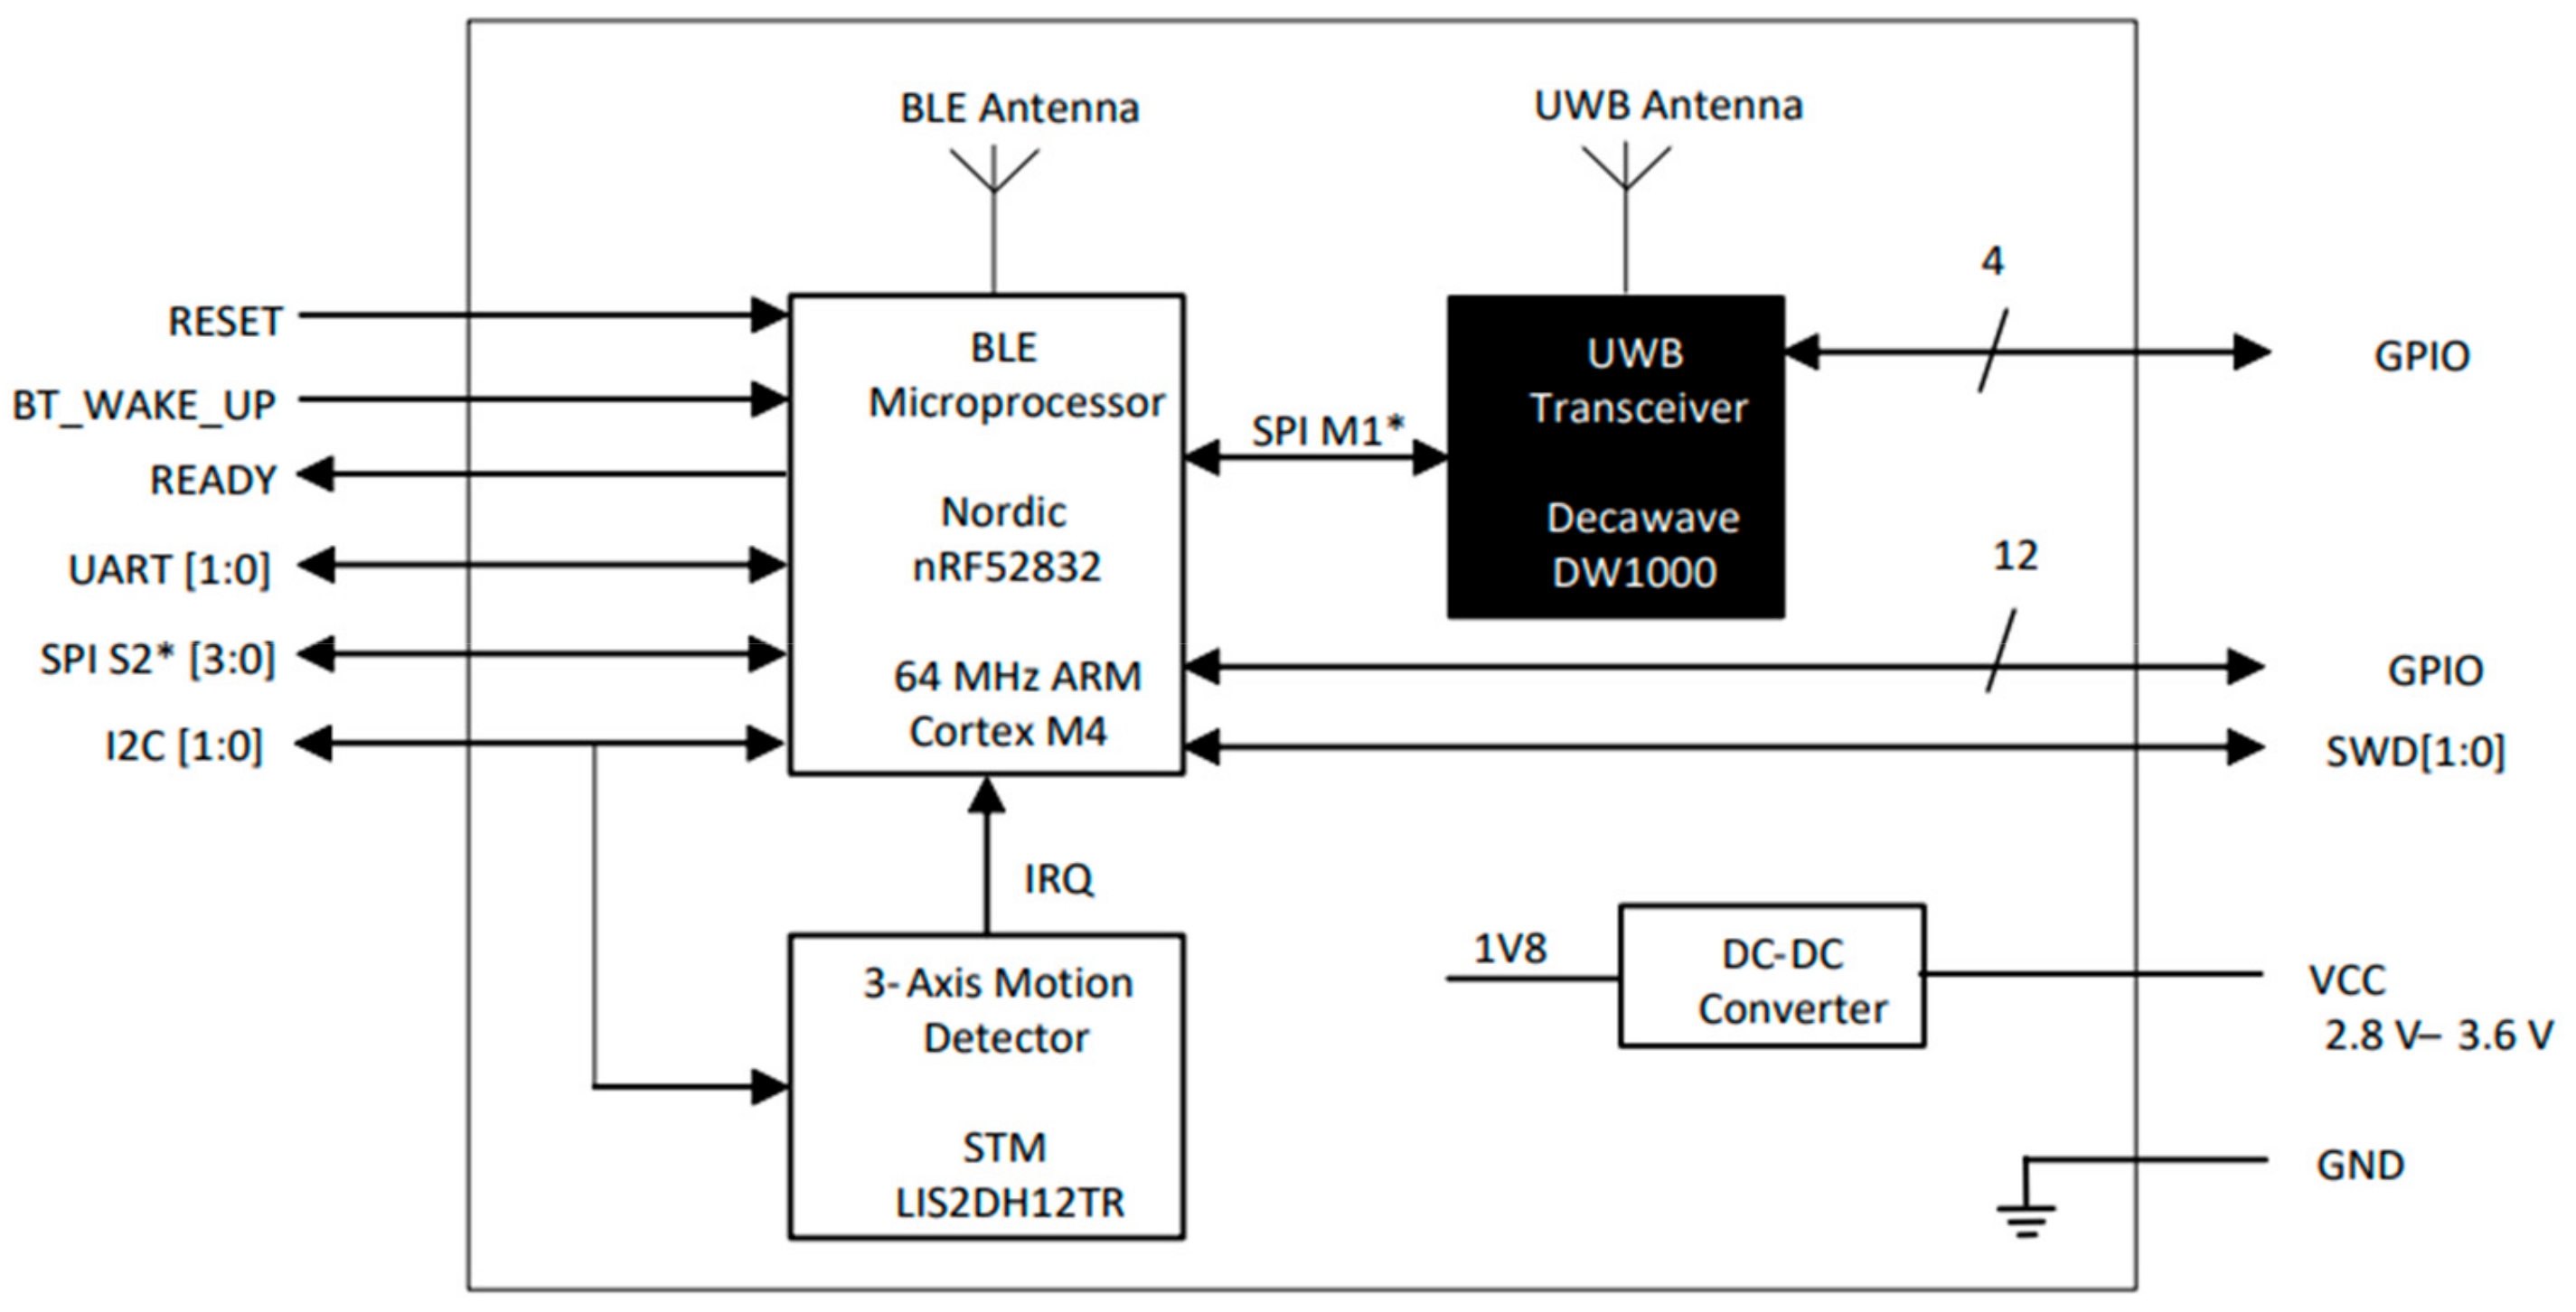
Figure 2) was used to create RTLS with UWB. This module is commercially supplied by the company Dacawave. The components integrated into the DWM1001C module (
Figure 3) are the DWM1000 UWB transceiver, the Nordic ARM Cortex-M4 nRF52832 microcontroller, and the LIS2DH12 triaxial accelerometer for motion detection. In addition, the module has the antenna and all the necessary radio frequency (RF) circuitry.
The DWM1000 transceiver uses UBW channel 5, with a center frequency of 6.5 GHz and a data rate of 6.8 Mbps. The signal transmission was configured so that the spectral power density was a maximum of −41.3 dBm/MHz. The nRF52832 microcontroller is an ultra-low power system-on-chip (SoC) with 2.4 GHz Bluetooth connectivity. The CPU is a 64 MHz ARM Cortex-M4 with 512 kB of flash memory and 64 kB of RAM memory, and the LIS2DH12 accelerometer is ultra-low power and has triaxial high performance, with an inter-integrated circuit (I2C) interface.
The great advantage of using DWM1001C is that Decawave provides a complete library for the implementation of a RTLS in this module, called the Decawave Positioning and Networking Stack (PANS). PANS implements a complete network for RTLS using the two-way-ranging (TWR) topology, called “DWM1001C Two-Way-Ranging Real Time Location System” (DRTLS). Through it, it is possible to configure the module as an anchor, gateway, or tag.
In this study, the basic principle of tag location is how its position is determined. In the case of PANS, the process is carried out through TWR. This technique consists of determining the time spent for the exchange of messages between the tag and the anchors. With the measured time, the distance between the devices is known. To determine the position, at least three known distances are needed so that signal trilateration can be performed. In this topology, the distance information is known only by the tag. In PANS, the tag itself already has the “location engine”, which performs the trilateration process with three antennas, converting the distances into an absolute position.
To determine the tag position errors (RTLS with UWB) and their measurement uncertainties, four reference points were chosen within the experimental factory of SENAI ISI-SIM (
Figure 1). The reference points were spaced apart within the coverage area of the six anchors (
Figure 1). This was performed to identify whether there was any influence on the distance between the tag and the anchors. As there were many metallic masses (
Figure 1a) four well-distributed points were chosen in the test environment. In this study, it would be difficult to obtain more than four points with free sight, and that had a different representation of these four chosen points. The four positions of the reference points (
Figure 1) were marked on the unobstructed floor (
Figure 4). This means that when the tag was positioned over each point, it had a clear field of view for all six anchors (free sight). Free sight refers to the condition under which, from the position of the tag, installed at 1.5 m above the ground, it is possible to see all the anchors; that is, there are no obstacles between the line of sight of the tag and each of the six anchors (
Figure 1a). Only points with free sight were established to determine the smallest measurement uncertainty associated with this case study, and, consequently, to be able to determine the minimum tolerance range associated with UWB technology with TWR. The measurements in 3D coordinates (
Xr,
Yr, and
Zr) of the four reference points (P-01, P-02, P-03, and P-04), identified in
Figure 1, were also made with the total station—see
Figure 4 [
3,
13].
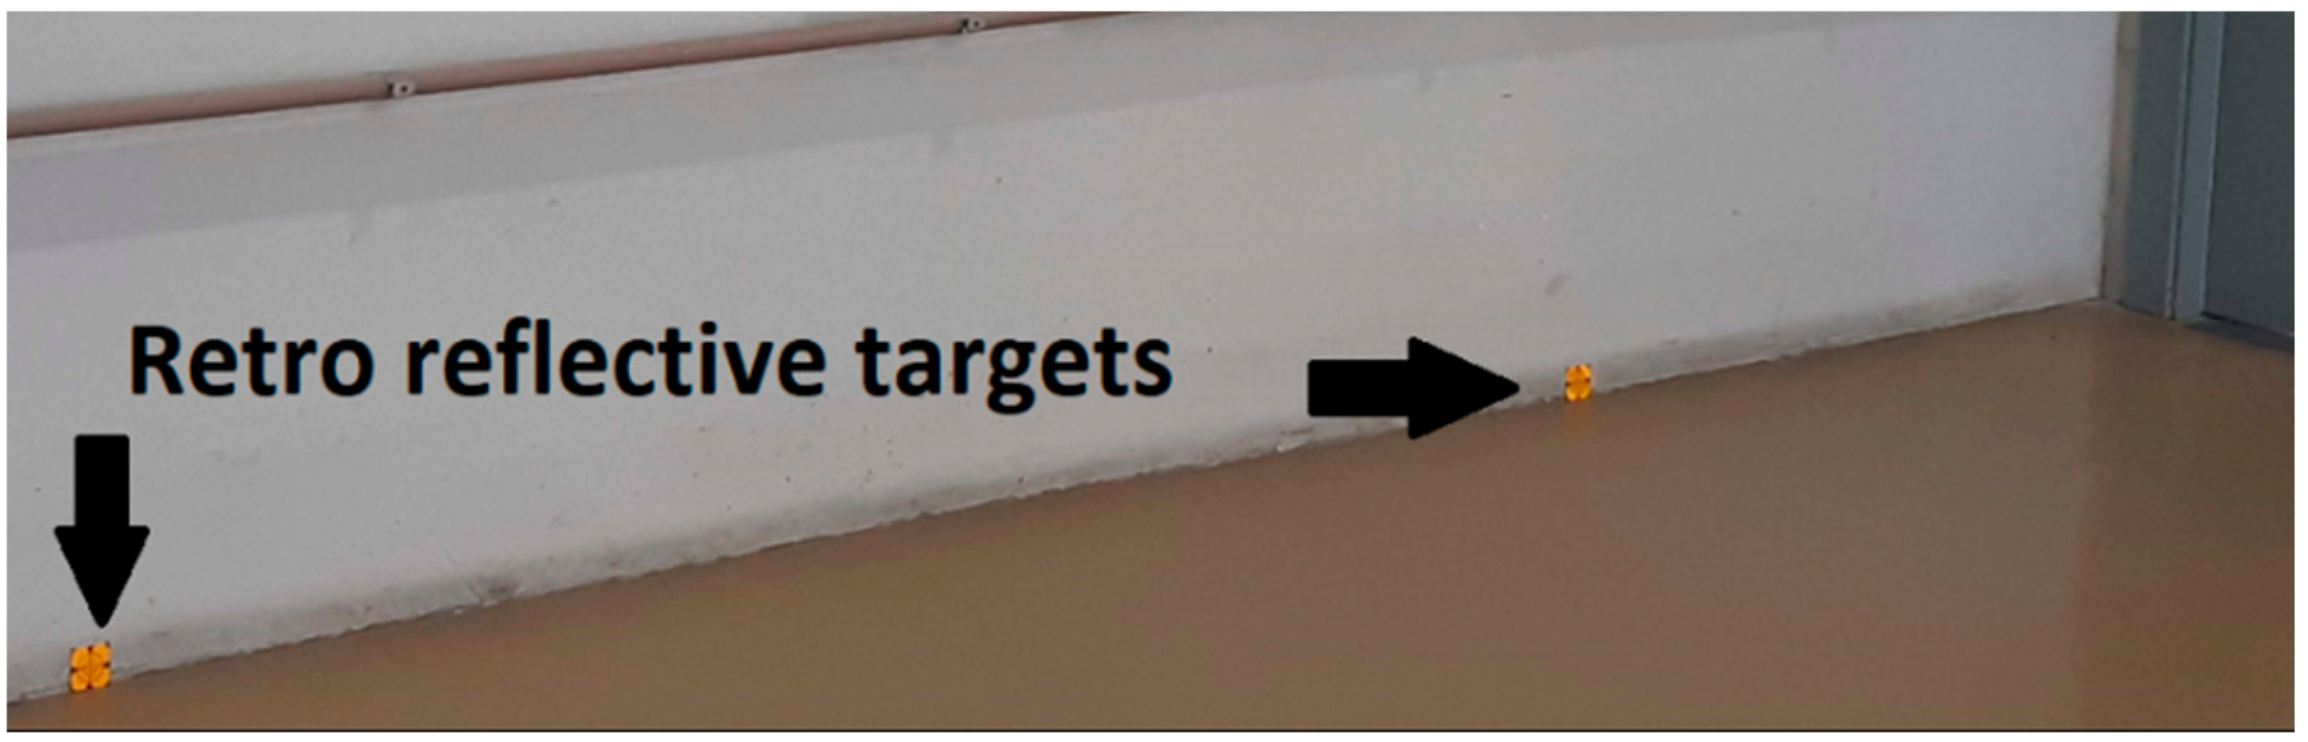
The accuracy of the 3D coordinates of the tag placement is correlated with the accuracy of the 3D coordinates of the position of each installed anchor. Since the two systems must be associated with the same local topographic reference system, in this case study, the point of origin was the intersection of two internal walls, according to the schematic representation of the experimental factory (
Figure 1a), and the Z coordinate (height) with the origin at the floor and increasing values for the zenith. The local topographic system, established in the internal environment of the experimental factory, was defined using two retro-reflective targets fixed to the side wall, the
X-axis of
Figure 1a. A retro-reflective target was positioned at the three-dimensional coordinates
Xr = 1.000 m,
Yr = 0.000 m, and
Zr = 0.000 m, and the other was positioned at
Xr = 3.000 m,
Yr = 0.000 m, and
Zr = 0.000 m (
Figure 5). Positioning was -performed using the steel scale and a magnifying glass.
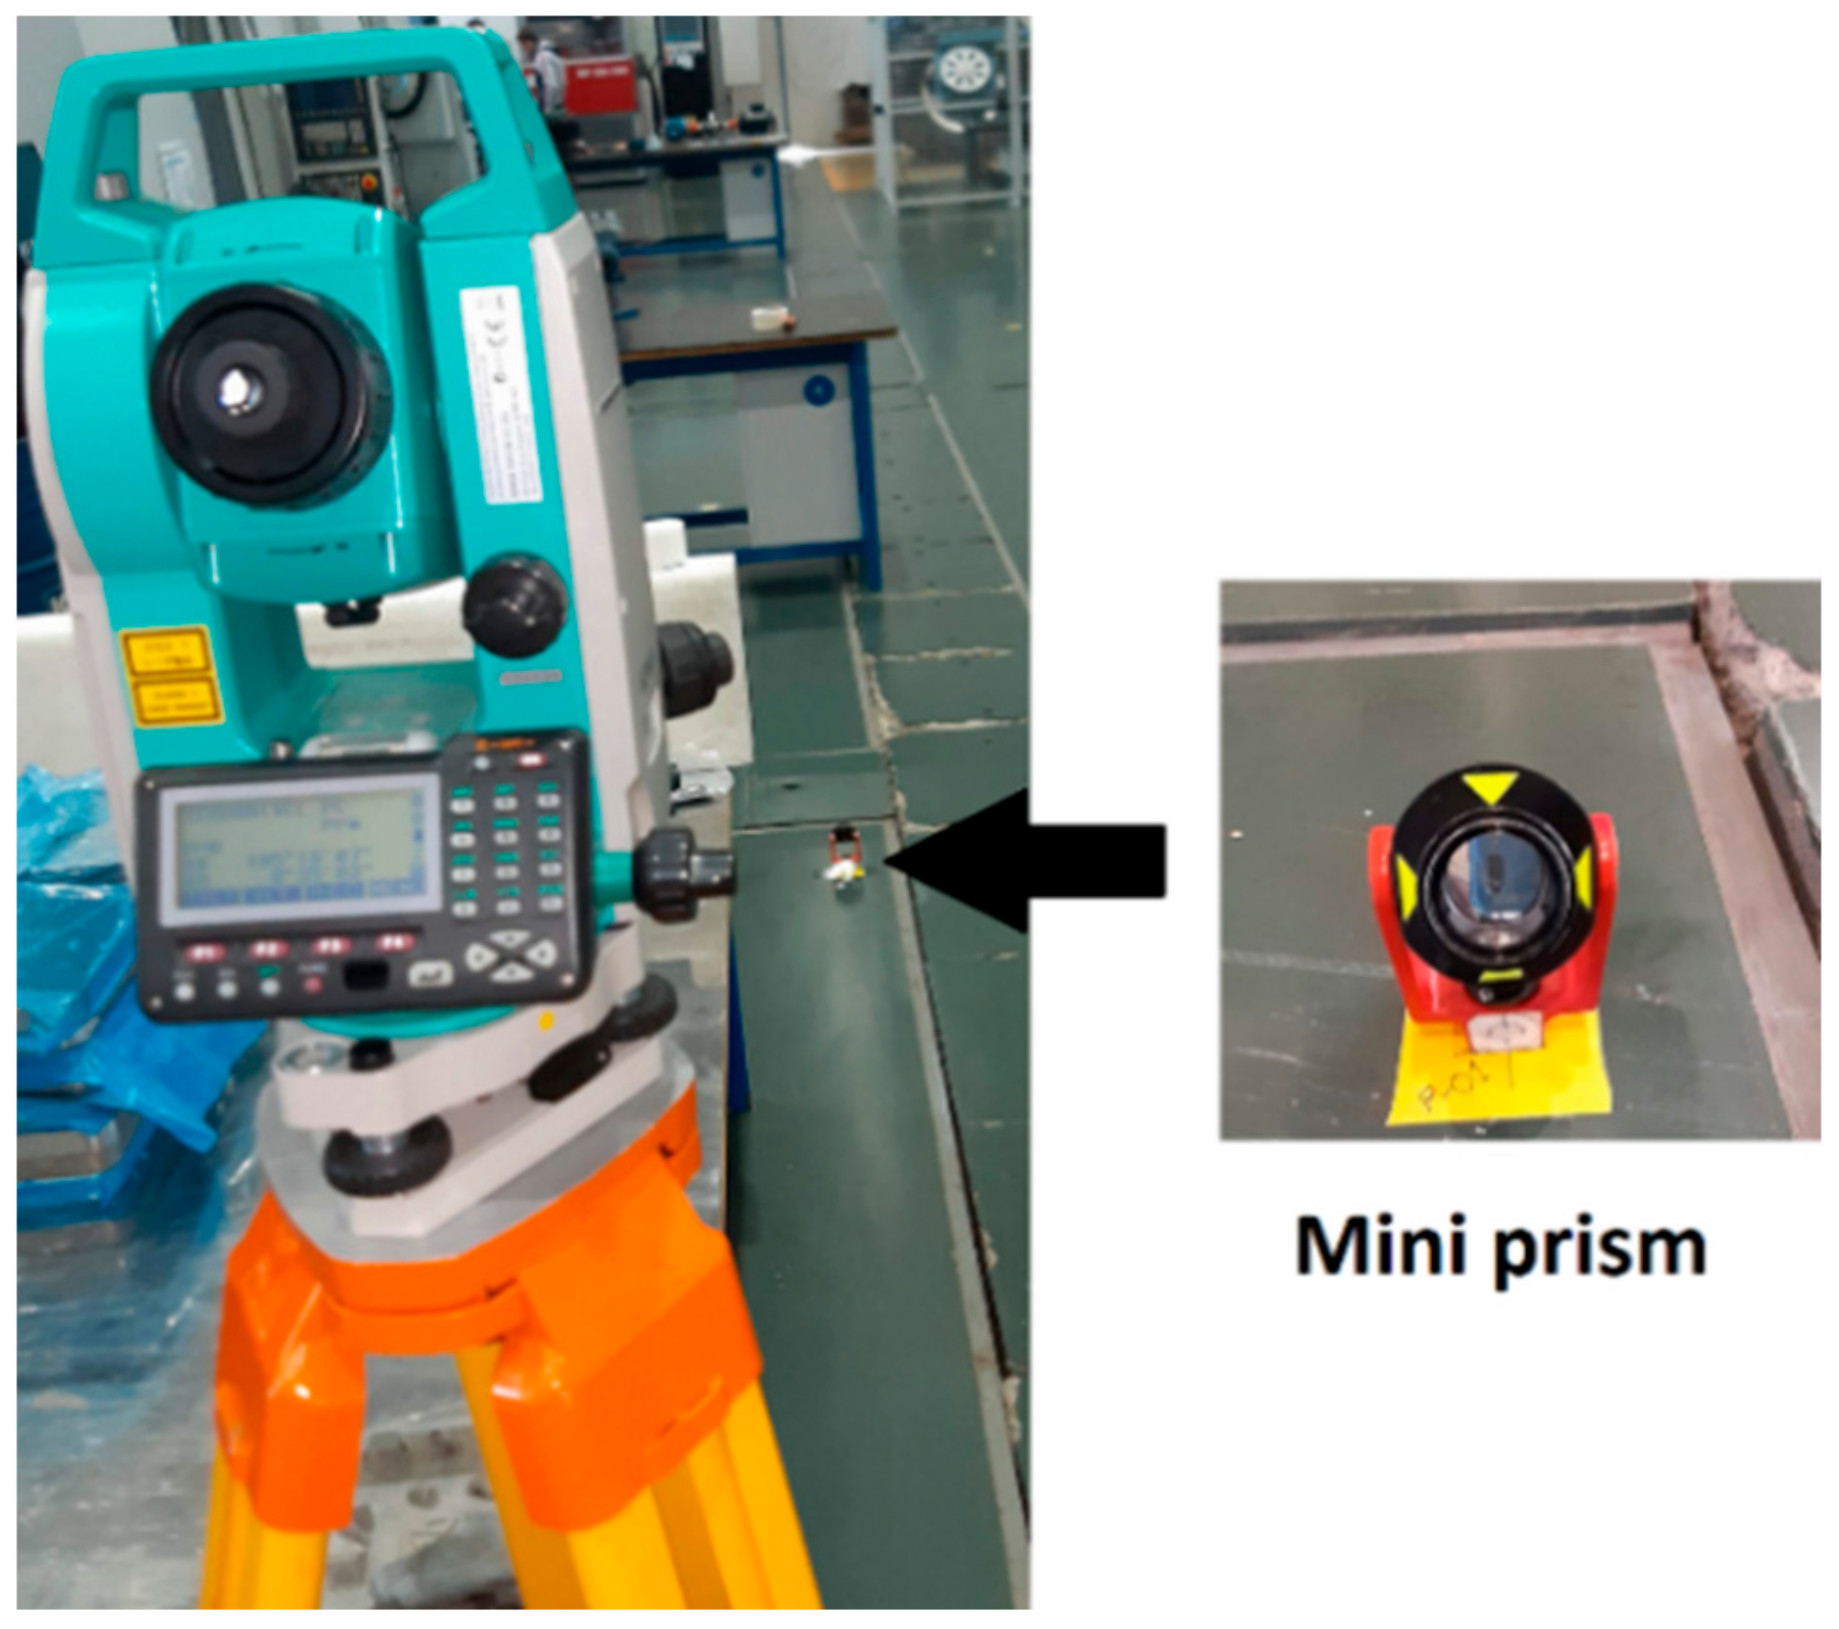
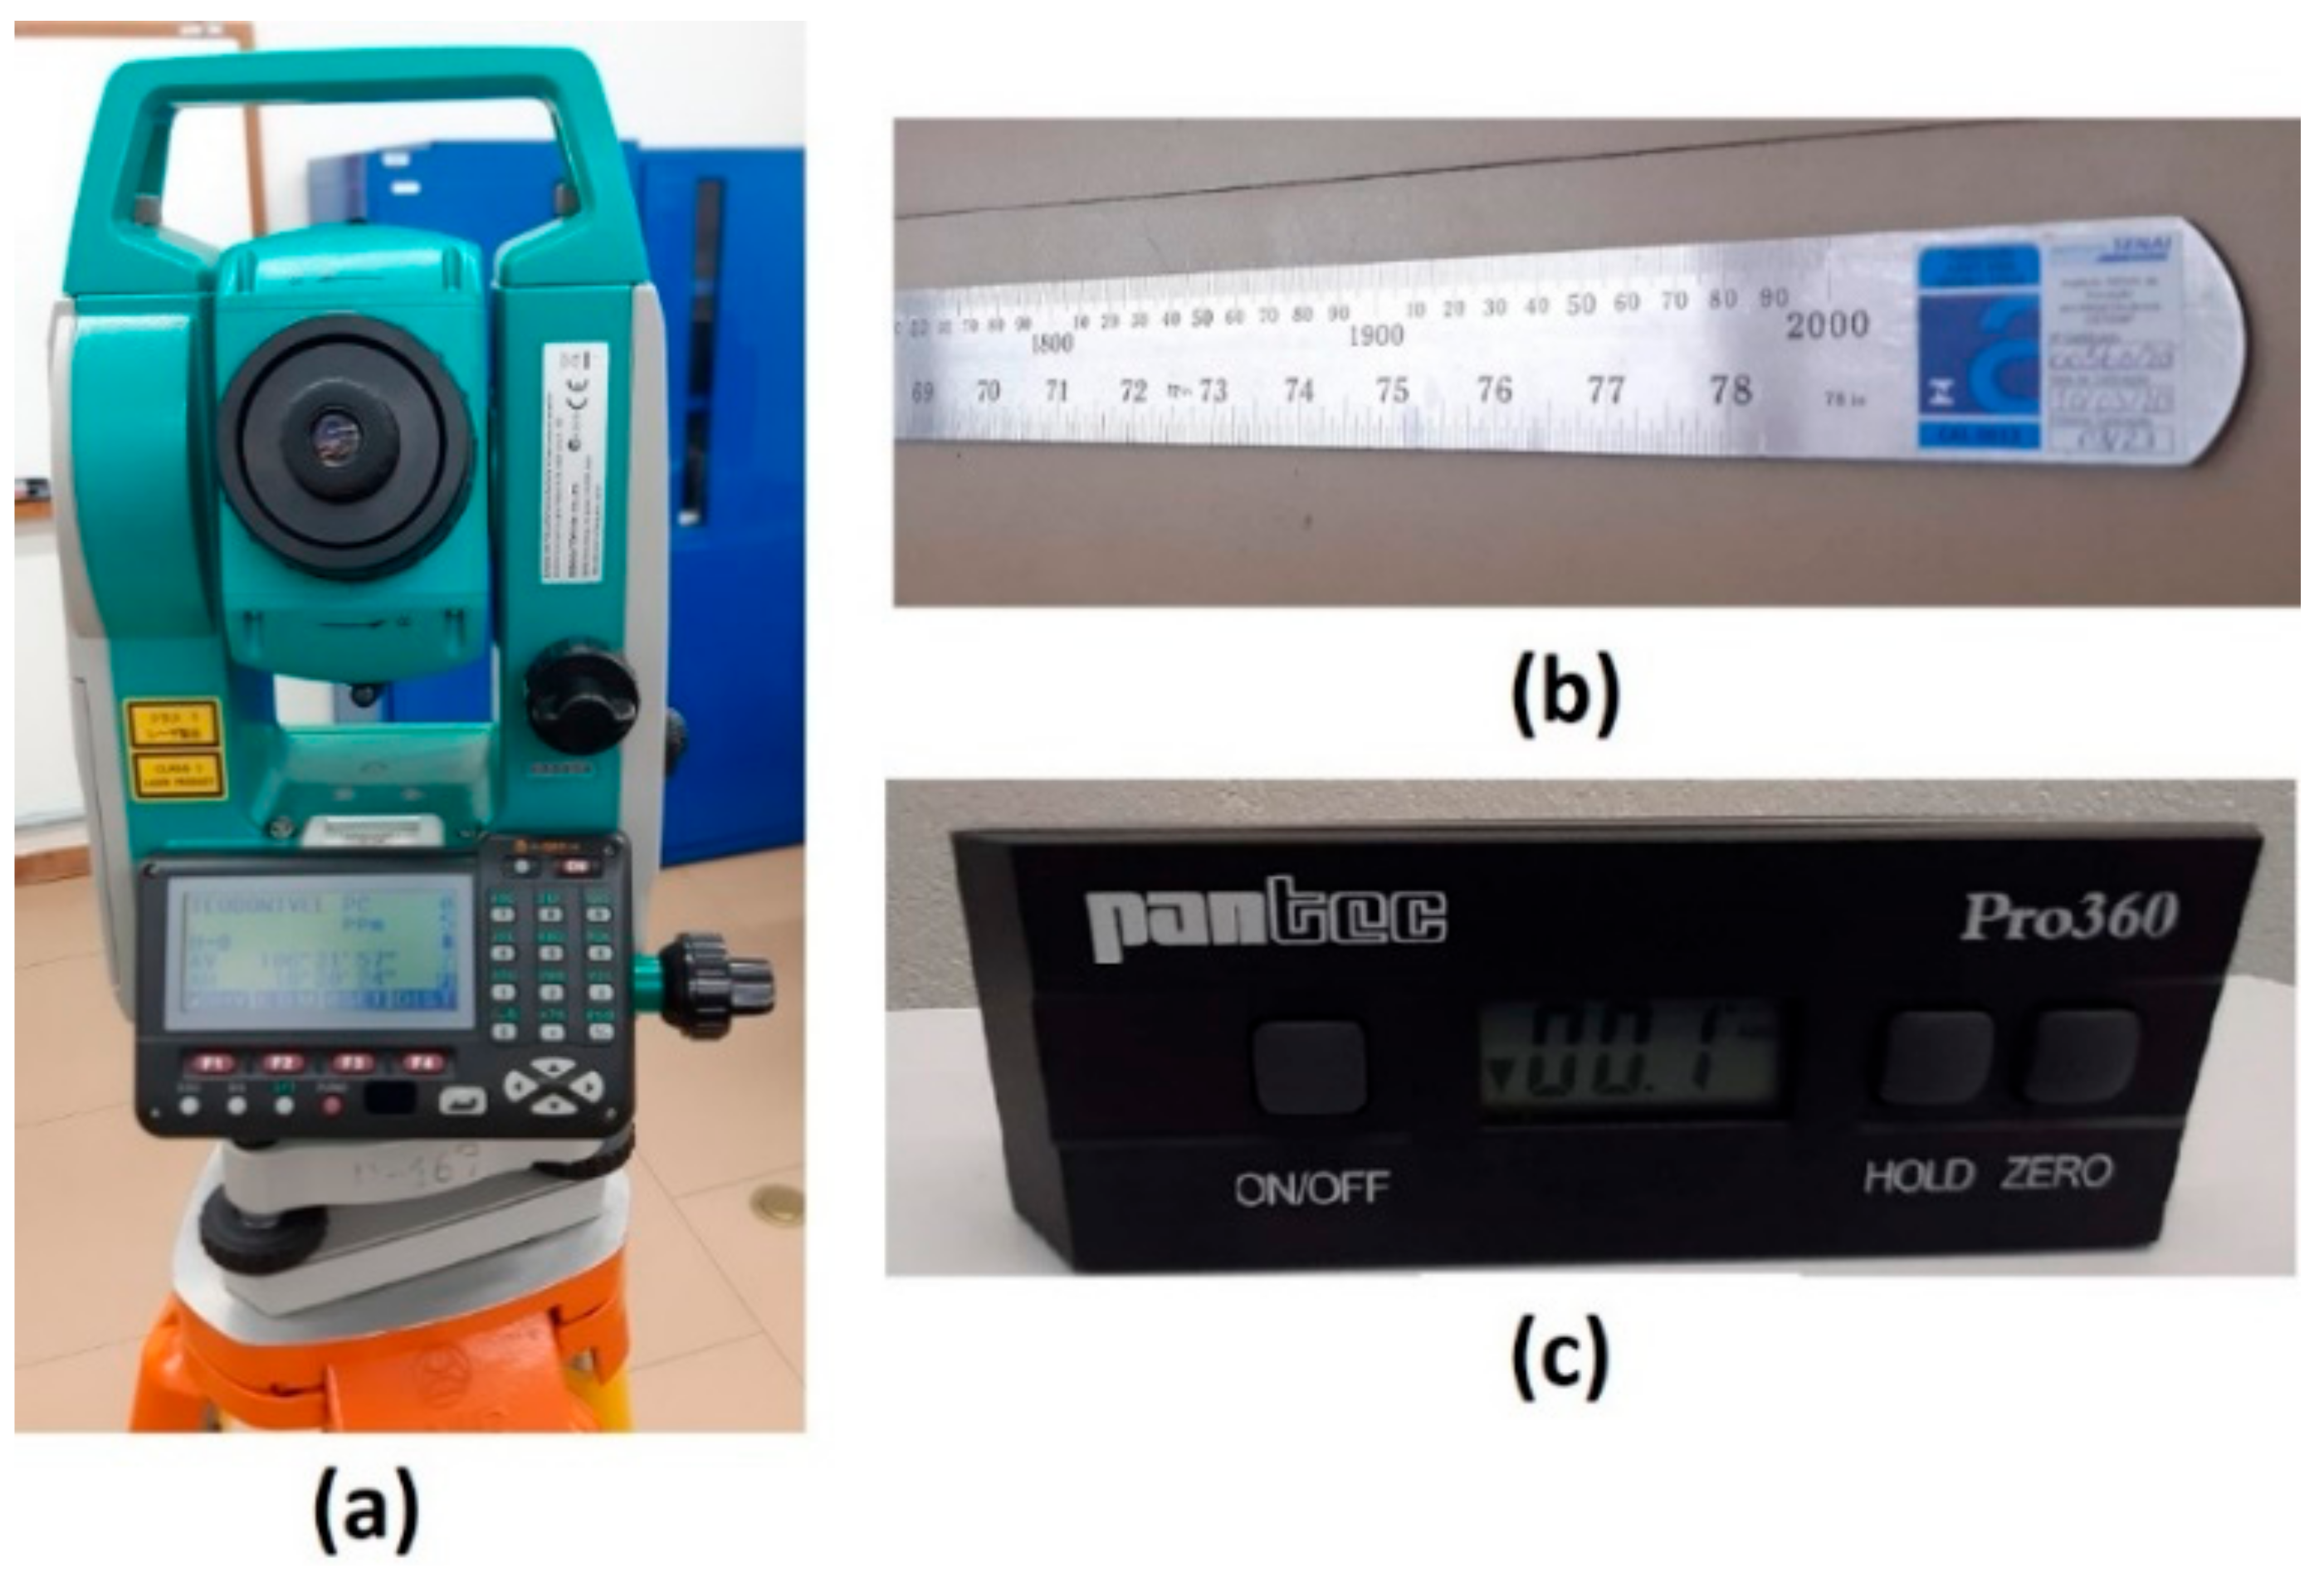
The electronic total station, Sokkia SET620K, was chosen as the reference measurement system—a portable coordinate metrology (PCM) device—both for the three-dimensional measurements of the anchor positions and for the measurement of the three-dimensional coordinates of the reference positions of the tag (
Figure 6a). This equipment has metrological traceability through calibration certificate no. 01032/22, issued by the ISI-SIM dimensional metrology laboratory, based on the standards of the National Institute of Metrology, Quality and Technology (INMETRO). The total station Sokkia SET620K has a maximum angular error limit of ±20”, and a maximum linear error limit of ±[4 mm + 6 ppm × D] (mm), where D is the distance measured in mm and ppm is the part per million. The calibration certificate indicates that these error limits were not exceeded. The other equipment used in conjunction with the total station were a steel scale (
Figure 6b) and a digital protractor (
Figure 6c). The main characteristics of these three instruments and their calibration certificates are shown in
Table 1. In addition to the equipment listed in
Table 1, the following accessories were also used: a wooden tripod, tripod for anchor, mini prism, retro-reflective targets, magnifying glass, and center plumb.
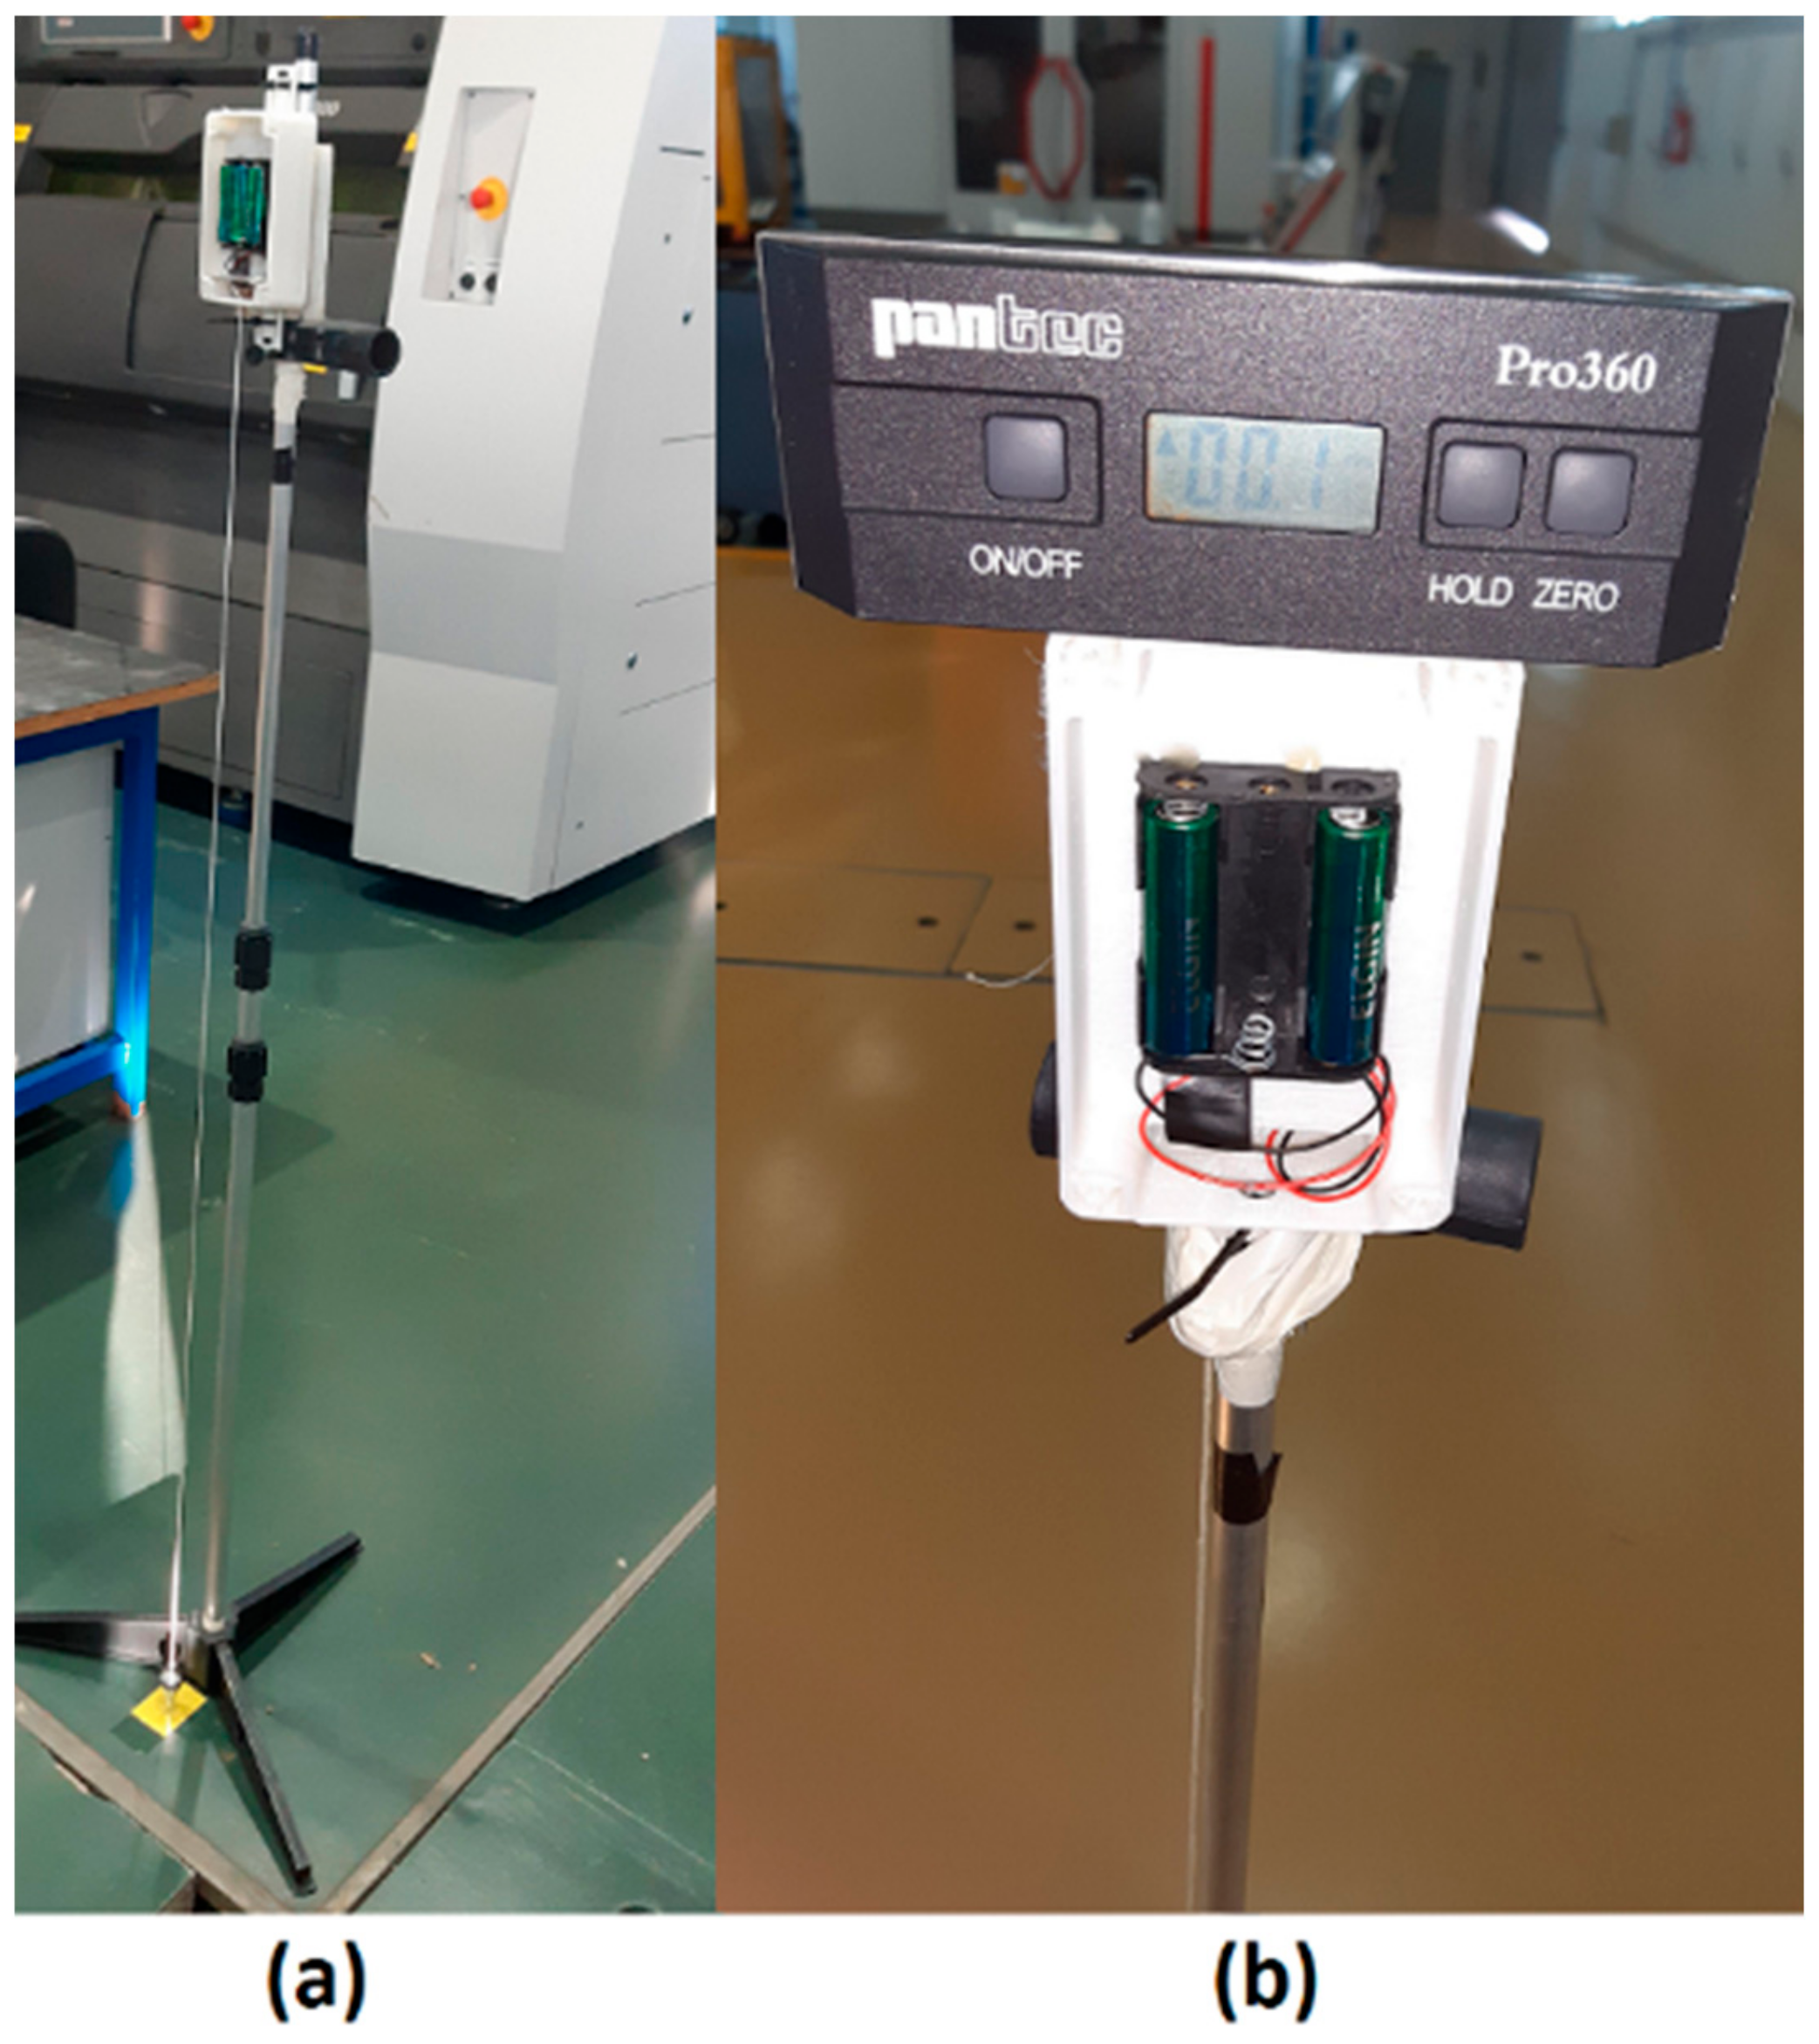
The tag positioning was performed over each reference point (
Xr and
Yr) with a tripod. The tag was at the height
Zr = 1.5 m, and a center plumb was also installed to transfer the position of the tag location sensor to the floor (
Figure 7a), where each reference point was materialized and thus measured the Cartesian coordinates of the tag positions (
Xs and
Ys). When installing the tag on the tripod, one must take care to level the tag the housing on two orthogonal axes using the digital protractor (
Figure 7b). When the center plumb was not precisely in the position of the tag location sensor in relation to the housing, it was necessary to measure the offset in the
X and
Y axes and correct the tag position coordinates (
Xs and
Ys). The tag was always positioned with the antenna in a vertical position.
After correctly positioning the tag on each reference point, the tag position (Xs, Ys) was collected in the software every second, for 10 s, at each of the four reference points.
The tag position error (
E) was calculated by the two-dimensional Euclidean distance [
3,
13], the difference between the tag position coordinates (
Xs and
Ys), and the reference point coordinates (
Xr and
Yr) using Equation (1).
3. Results
The fixed positions of the anchors (3D coordinates) were measured with the total station and referenced to the local topographic plane (
Table 2), defined in the internal environment (experimental factory).
Table 2 shows the sample means calculated from three measurements at each anchor, where the maximum sample standard deviation
s(
xi) of the coordinates
Xr,
Yr, and
Zr was 0.0011 m.
The anchor position measurement uncertainty spreadsheet (
Uanchor) is presented in the uncertainty budget (
Table 3); the result is a
Uanchor equal to 0.007 m, with
k = 2.00, according to ISO GUM [
14].
In the spreadsheet (
Table 3), the maximum standard deviation 0.0011 m was used to estimate the repeatability of the anchor position measurement. The linear measurement uncertainty of the total station (
Umax), informed by the ISI-SIM calibration certificate no. 01032/22, was calculated by the sum of the linear uncertainty of 0.001 m and the maximum error of 0.002 m; therefore,
Umax = 0.003 m, with
k = 2. It is assumed that there is a total station positioning uncertainty of 0.002 m, assuming a triangular probability distribution, and that there is an offset uncertainty between the retro-reflective target and the anchor position sensor of 0.005 m, with a rectangular probability distribution. The thermal expansion uncertainty, calculated through Equation (2), was calculated assuming a temperature uncertainty of 3 °C, a maximum coordinate of 30 m, and a coefficient of thermal expansion of concrete of 10
−5/°C [
20], with a rectangular probability distribution. The resolution of the total station is 0.001 m.
where Δ
L is the uncertainty of the change in the coordinate,
L is the value of the highest coordinate,
α is the coefficient of thermal expansion of the concrete, and Δ
T is the uncertainty of the change in temperature at the time of the measurements.
The 3D coordinates of the reference points were also measured with the total station and referenced to the local topographic plane (
Table 4).
Table 4 presents the sample means calculated from three measurements at each point, where the maximum sample standard deviation,
s(
xi), for coordinates
Xr,
Yr, and
Zr was 0.0015 m. The reference point position measurement uncertainty spreadsheet (
Uref) is presented in the uncertainty budget (
Table 5); the result is the
Uref being equal to 0.004 m, with
k = 2.03, according to ISO GUM [
14].
The (
Uref) measurement uncertainty (
Table 5) is associated with each coordinate of each reference point (
Table 4).
Measurements of tag positions with the UWB location system were made with ten measurements under each combination of the test conditions:
Number of anchors: the configurations of four linked anchors (A1, A3, A4, and A6) and six linked anchors were used.
Routes: three measurement routes were performed—route 1 (P-02, P-03, P-04, and P-01); route 2 (P-02, P-01, P-04, and P-03); route 3 (P-01, P-03, P-02, and P-04).
Machines: one condition had all machining machines off and the other condition had all machines turned on.
The mean value of the ten UWB location system measurements and the sample standard deviation of these measurements, after correctly positioning the tag on each reference point, the tag position (
Xs and
Ys) being collected in the software every second, for 10 s, at each of the four reference points, are presented for P-01 and P-02 in
Table 6 and for P-03 and P-04 in
Table 7.
3.1. Tag Position Mean Error
Initially, the tag position errors (
E) are calculated with Equation (1), at each reference point, using the tag position coordinate values (UWB), reported in
Table 6 and
Table 7, and the coordinates of the reference points (
Table 4). The calculations are made with the ten measurements (under repeatability conditions) [
21] of the tag positions (
Xs and
Ys) after correctly positioning the tag with the center plumb over each reference point and leveling the tag housing with the digital protractor (
Figure 7b). The means (
), standard deviations of samples,
s(
xi), and standard deviations of the means,
, of the tag position errors were calculated using Equation (3), where
n is the number of measurements. The statistical results are presented in
Table 8 [
14,
15,
16].
In addition to the repeatability
at each tag position calculated by Equation (3), an intermediate precision study was also performed for each of the four reference points where the tag was positioned. Intermediate precision is important to identify whether or not other random effects, in addition to repeatability itself, contribute to the composition of measurement uncertainty. Therefore, the calculated measurement uncertainty is less likely to be underestimated. The intermediate measurement accuracy is calculated with a set of conditions: the same measurement procedure, same location, and repeated measurements on the same object or similar objects, with other variable factors [
22,
23]. The other variable factors, in addition to time, used for the repeatability calculations were the number of anchors, routes, and machines.
Table 8 presents a summary of the calculated values of
and
for all the tag positions measured in the three intermediate precision conditions.
According to ISO 5725-3 [
22], the estimate of the standard deviation of the intermediate precision with three different factors,
, is given by Equation (4).
where
m is the total number of samples tested;
n is the total number of measurements performed per sample;
j is the sample number;
k is the test number of the sample;
yjk is the value of result
k for sample
j;
represents the arithmetic mean of the results of sample
j [
22].
Table 8 shows that we had twelve samples tested (
m = 12) and ten measurements per sample (
n = 10), and, therefore, the value of the expression “
m (
n − 1)” is greater than 15, as recommended by ISO 5725-3 [
22].
Table 9 presents the repeatability, the highest values of
obtained from
Table 8 for each tag position error, and the results of the intermediate precisions,
, calculated according to Equation (4).
Finally, the tag position mean error (
) over each reference point was calculated by averaging the errors
, reported in
Table 8. The mean error calculated value of each tag position is reported in
Table 10.
3.2. Tag Position Mean Error Uncertainty
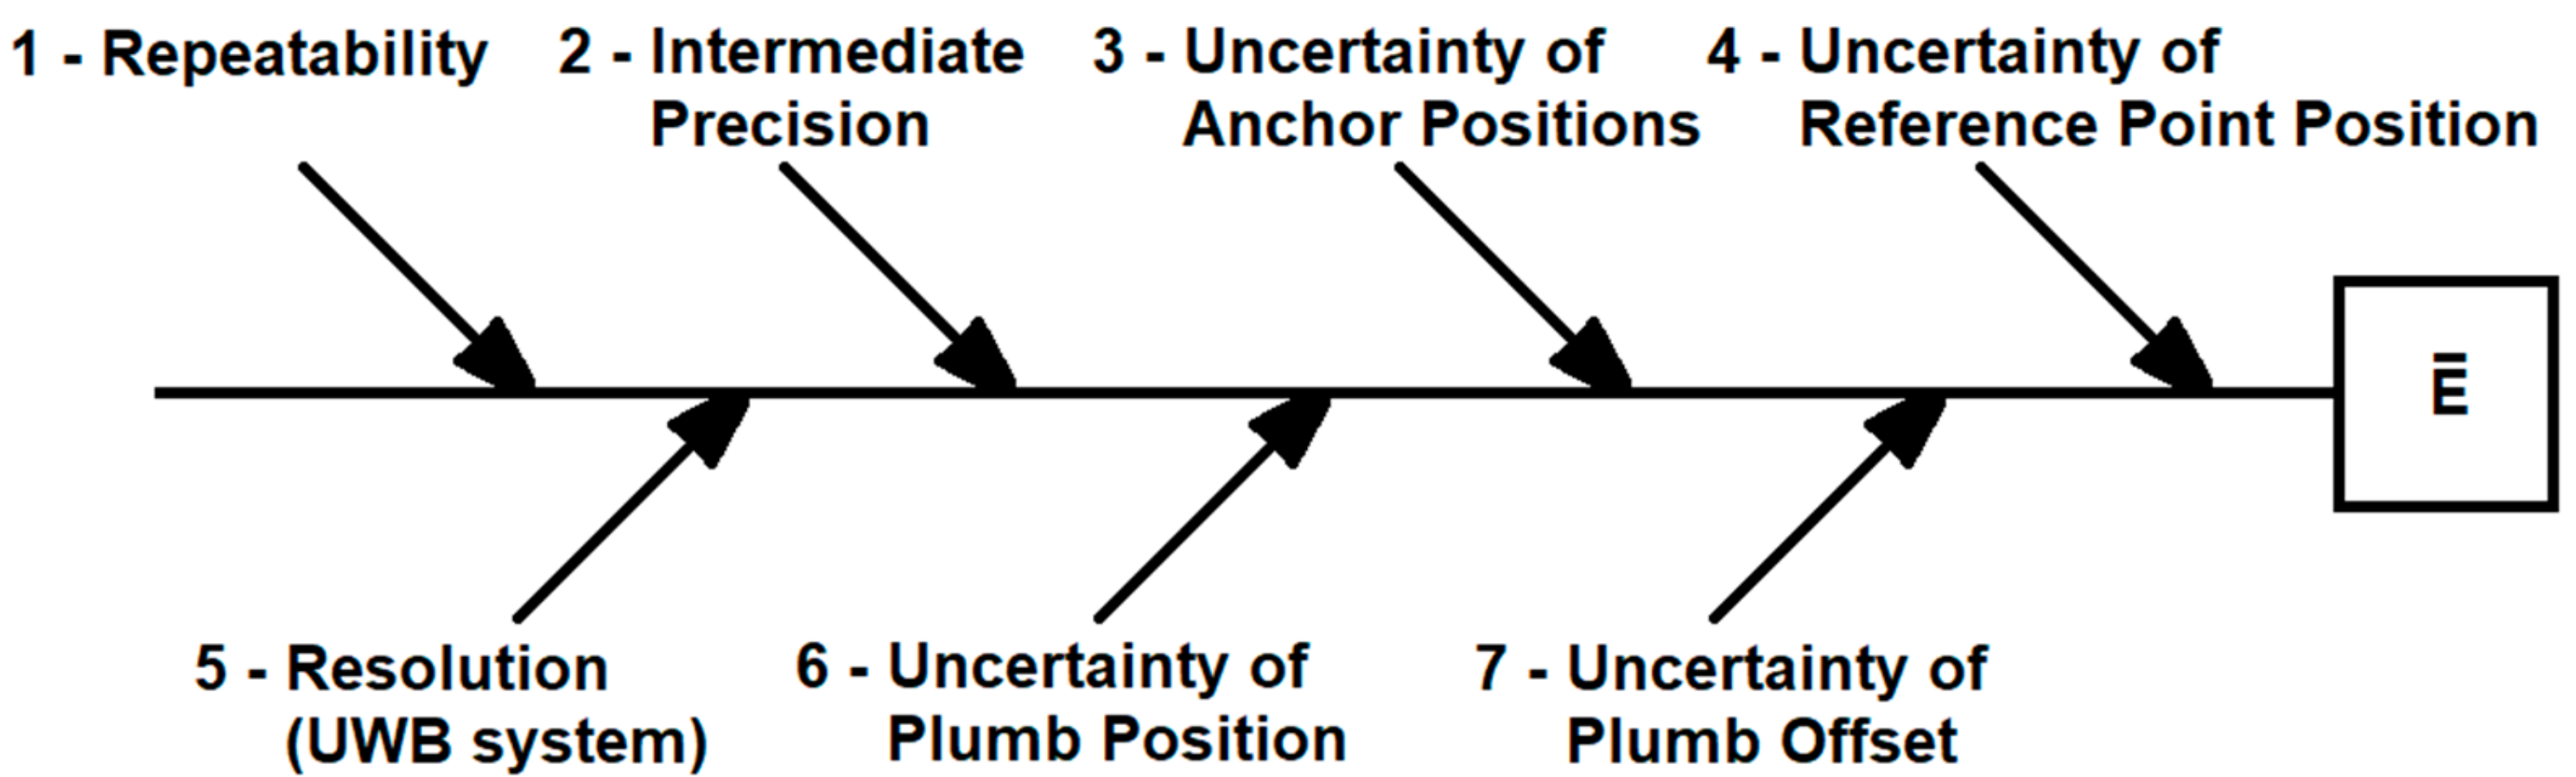
The tag position mean error uncertainty (
Uerror) analysis was started by investigating the sources of uncertainty, according to the Ishikawa diagram in
Figure 8 [
14,
15].
The uncertainty source for the repeatability of determining tag position errors is obtained from the measurement series at each point. It is a quantity,
, calculated according to Equation (3), with the sample standard deviations,
[
14], reported in
Table 9. In this case study, the degrees of freedom are
, where
n is the number of ten measurements. These values are used in a tag position mean error uncertainty spreadsheet.
The uncertainty source for the intermediate precision is a quantity,
, where
m is the total number of samples tested [
22]. In this study,
m = 12 and the values of
are in
Table 9. The degrees of freedom in this case study are
.
The source of uncertainty regarding the positions of anchors
is calculated according to the trilateration that the tag always makes with three anchors [
2,
3,
4]. Therefore, the combined uncertainty of three anchors must be considered to determine
, according to Equation (5).
The value of
Uanchor, according to
Table 3, is 0.007 m with
k = 2.00; therefore,
,
k = 1.00, and
. The combined uncertainty of the effect of three anchors is related to the principle of measuring the tag position by the trilateration of anchors. As each of the three anchors communicates with the tag, the uncertainty source,
u(
anch), referring to the three anchors, is the squared sum of the three individual measurement uncertainties of the anchors (Equation (5)).
The source of uncertainty regarding the position of the reference point is
[
14]. The value of
Uref, calculated in
Table 5, is 0.004 m, with
k = 2.03, and
, so
is equal to 0.002 m.
The source of uncertainty regarding the resolution (UWB system) is
, for a rectangular probability distribution [
14]. Since the resolution of the tag position measurements is equal to 0.001 m,
is 0.00029 m, with
.
It was estimated that there was a positioning uncertainty of the center plumb (
Figure 7a) of 0.002 m, assuming a triangular probability distribution, calculating
.
The last source of uncertainty considered was u(offset), which is the uncertainty of the offset calculated between the center plumb and the tag position sensor, with a rectangular probability distribution. It was estimated that , with .
After transforming all the uncertainties into standard uncertainties,
, they can be combined using Equation (6), which calculates the combined standard uncertainty,
. Since all the sensitivity coefficients (
) of
in this study are equal to 1 (because their contributions are given in meters), Equation (6) can be simplified into Equation (7) [
14,
15,
16].
The tag position mean error uncertainty (
Uerror) is obtained by multiplying the combined standard uncertainty,
, by a coverage factor (
k), according to Equation (8) [
14,
15,
16].
Equation (9) makes it possible to accurately calculate the
k value, using the two-sided t-distribution (
t95.45%), and the effective degrees of freedom
, to obtain an interval with a confidence level of 95.45 % [
14,
15,
16].
The
is obtained through the Welch–Satterthwaite Equation (10). If
does not result in an integer, which is usually the case, it is truncated to the next smallest integer [
14,
15,
16].
The calculated values of
,
k,
t95.45%, and
, for the tag’s position on the reference point P-01, are presented in the uncertainty budget (
Table 11). The values obtained for the other three points are summarized in
Table 12.
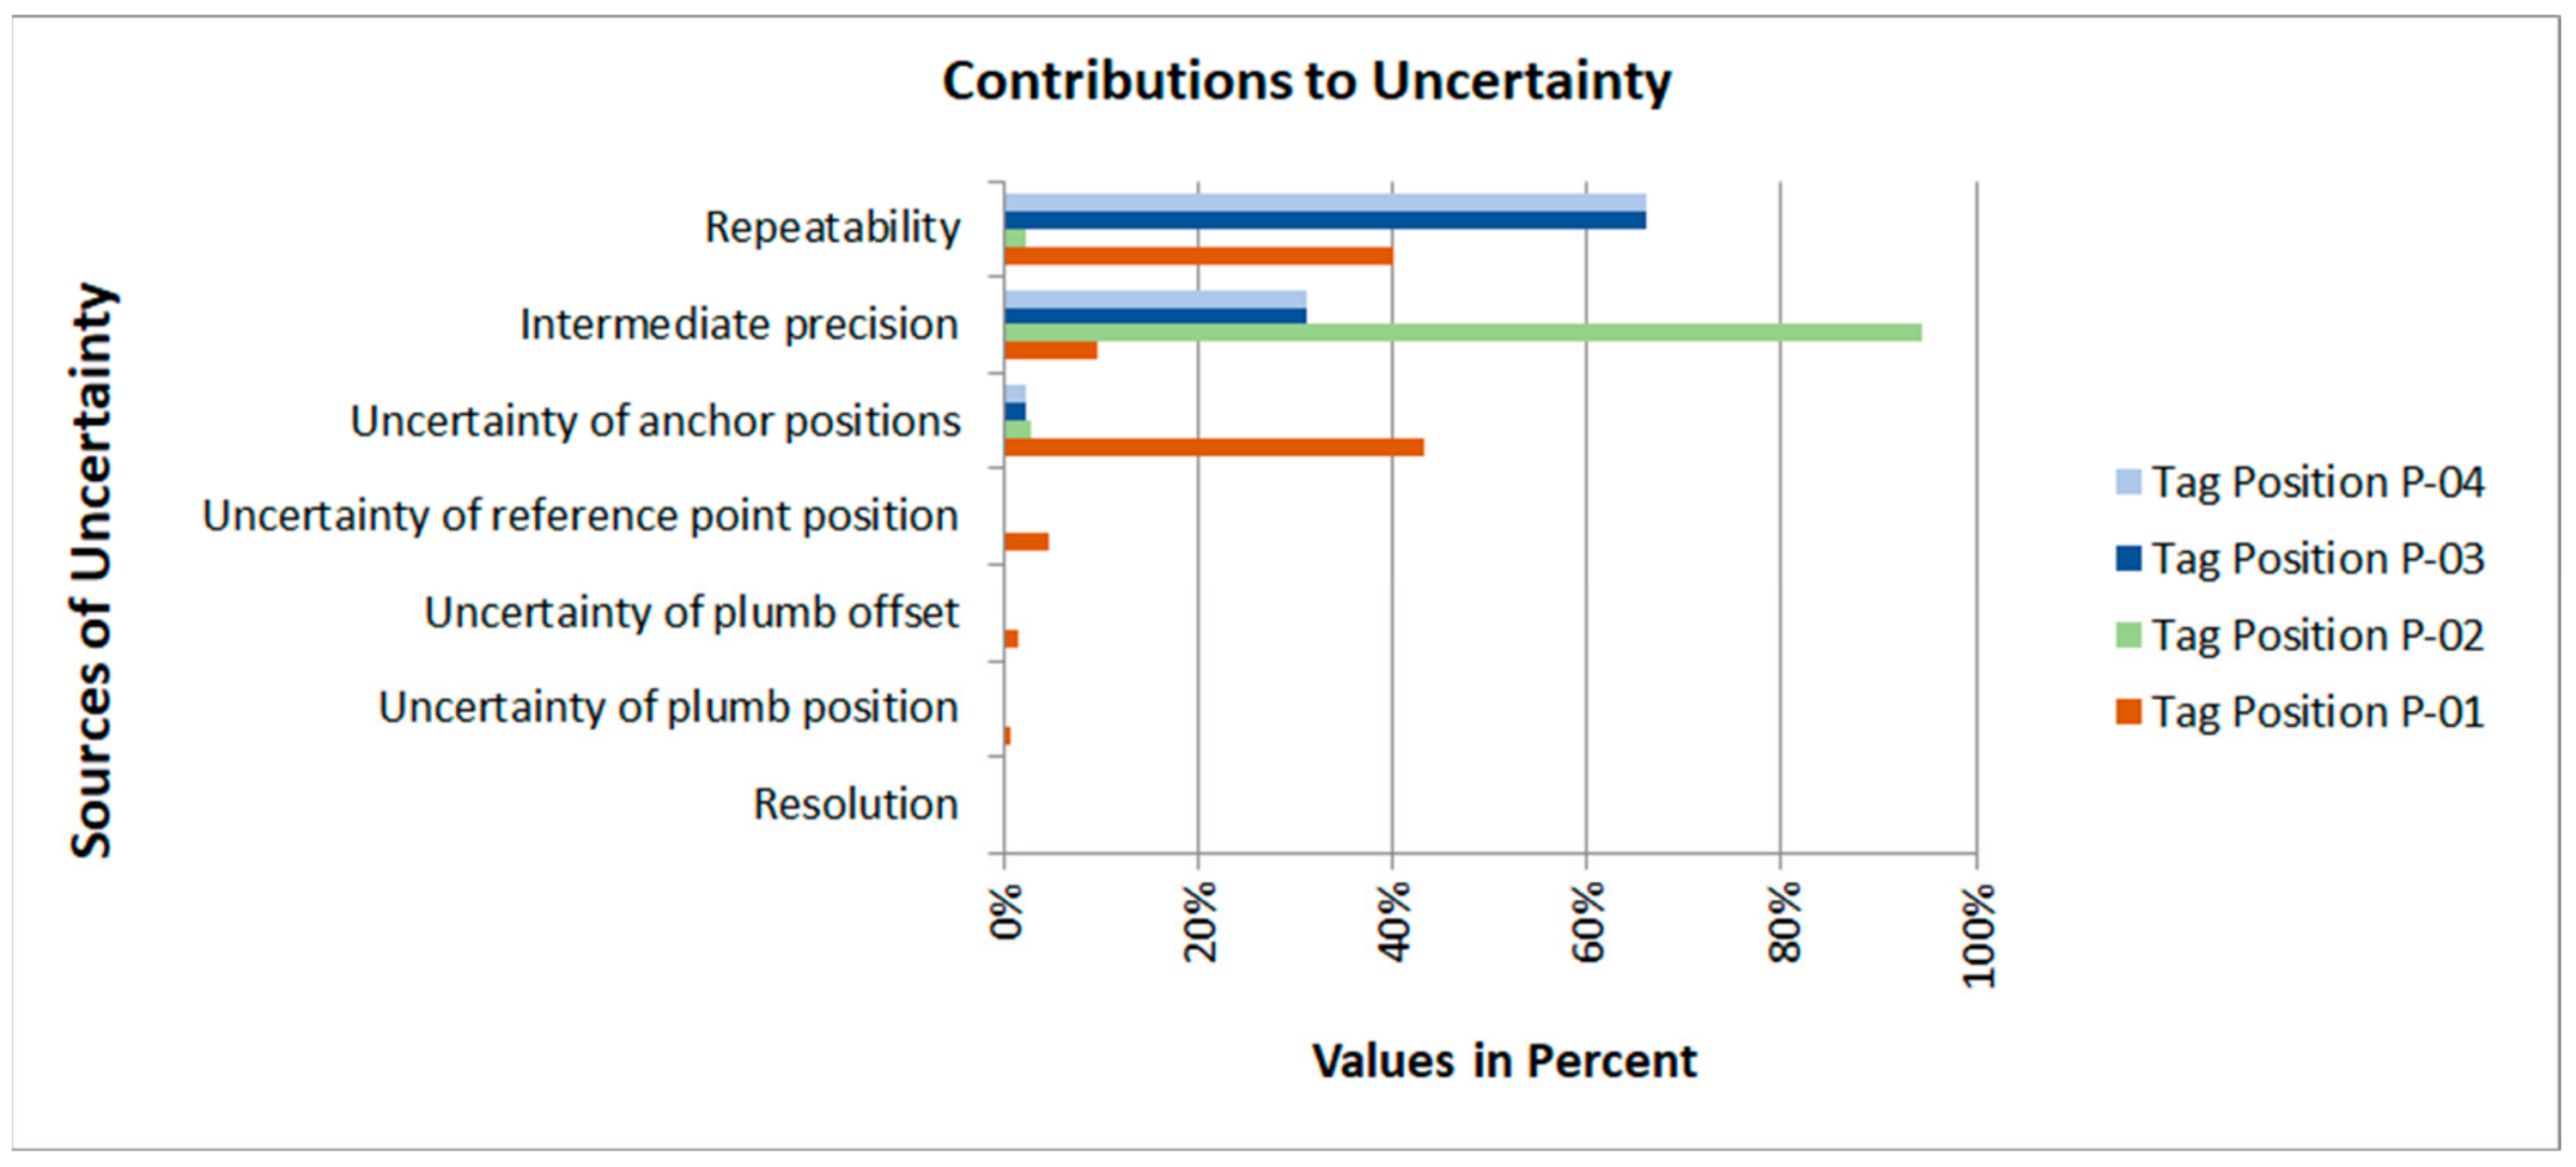
A budget of the standard uncertainties was prepared (
Figure 9), where the sources that predominated in the measurement uncertainty can be observed, quickly, clearly, and objectively [
24].
3.3. Global Uncertainty Calculations of the RTLS Location System with UWB Technology
The global uncertainty of this RTLS location system with UWB technology (
UUWB), when tag position errors are not corrected, was determined to be the sum of the tag position mean error (
) in
Table 10 and its tag position mean error uncertainty (
Uerror) in
Table 11, among all the measured points [
14,
15].
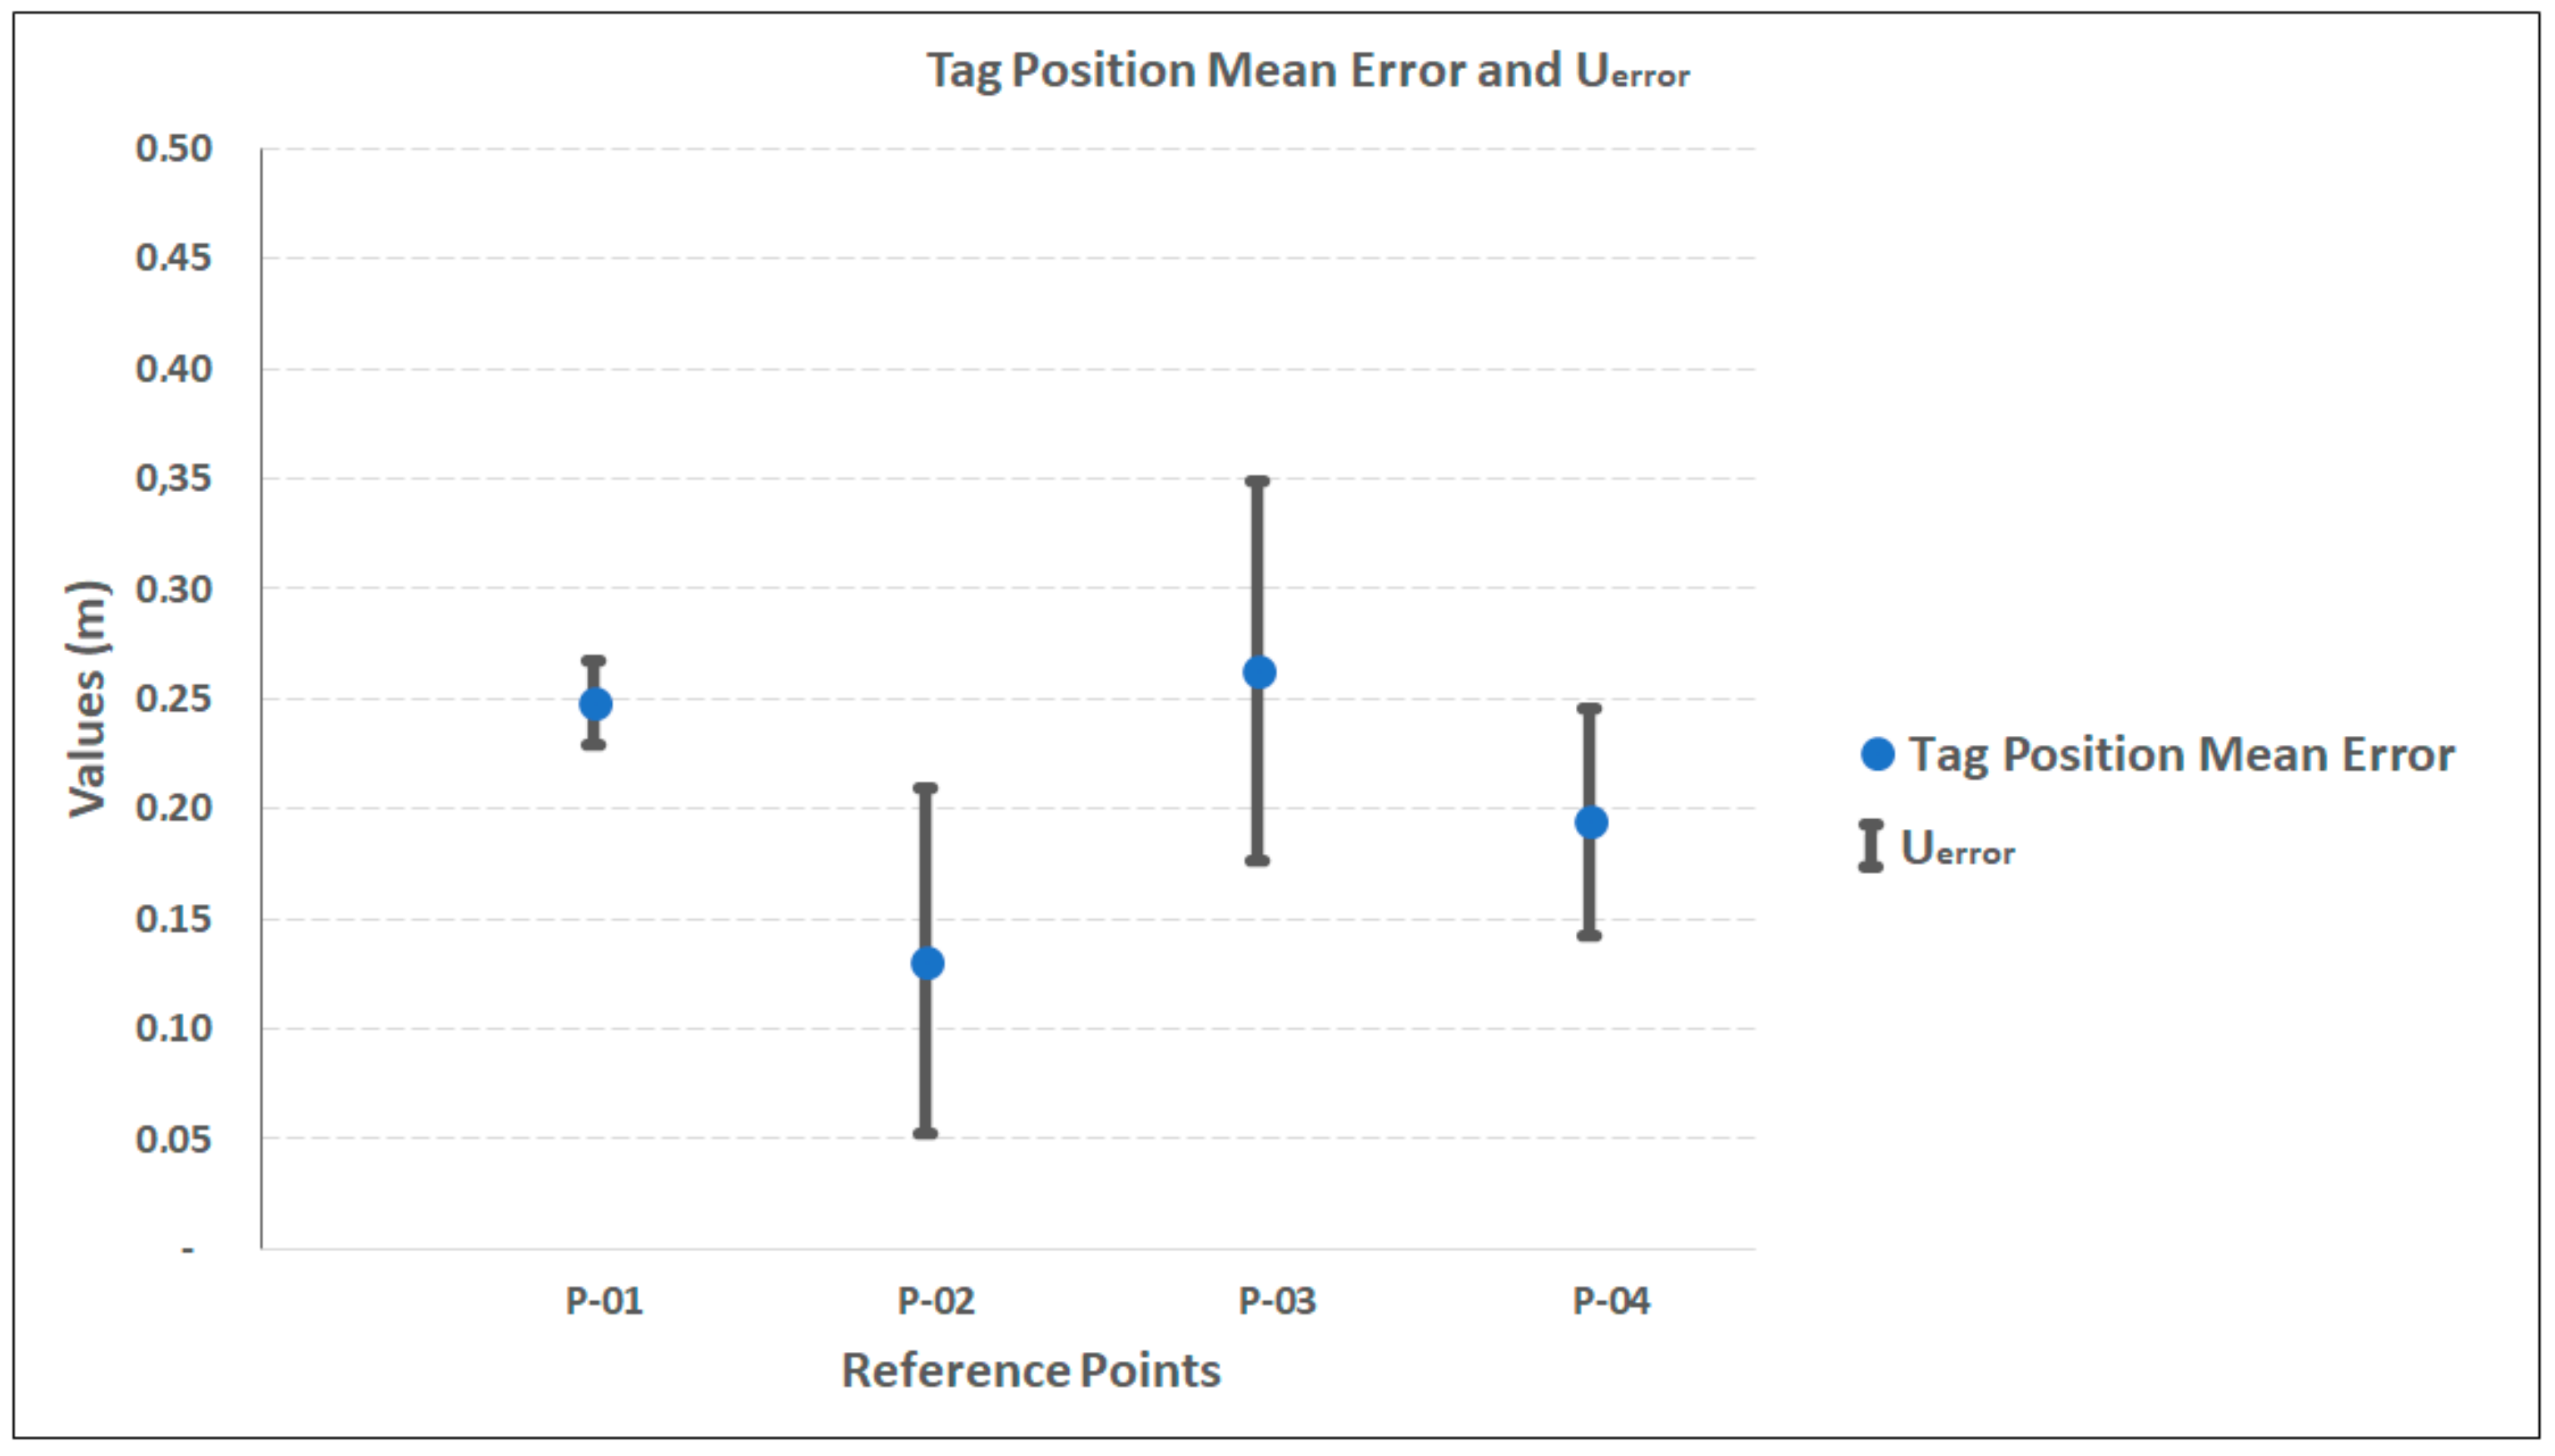
Table 13 shows the results obtained for the four measurement positions with clear sight, and
Figure 10 presents these results graphically.
Analyzing the U
UWB values in
Table 13, we can define the global uncertainty of the RTLS location system with UWB technology, which in this case study is estimated to be 0.35 m, associated with a confidence level of 95.45%.
3.4. Quantification of the Minimum Tolerance Range Served by the RTLS Location System with UWB Technology
According to the “Golden Rule of Metrology,” Berndt’s principle, the tolerance interval (T) is equal to at least five times the measurement uncertainty [
16,
17,
18].
Considering the situation where the tag position errors were corrected, the range,
Tmin, would be five times the
Uerror (
Table 12)—that is,
, an amplitude of 0.45 m; for a bilateral tolerance, we would have
.
If tag position errors are not corrected, the range,
Tmin will be five times the
UUWB (
Table 13). The calculation would be
, an amplitude of 1.75 m, and representing bilateral tolerance, it would be
.
4. Discussion
Initially, in this work, the result of a measurement uncertainty approach for calculation the spatial positions of the anchors (
Table 3) and the spatial positions of the reference points (
Table 5) is presented. The reference value of these 3D coordinates of the spatial positions were measured using a total station (
Figure 6a)—a portable coordinate metrology (PCM) device. It was observed that due to the difficulty of accurately identifying the spatial coordinate of the location where the anchor sent the signal to the tag, the anchor position uncertainty (
Uanchor) was estimated to be 0.007 m. It is almost twice the reference point uncertainty (
Uref), which is 0.004 m. It is also important to note that the anchor position uncertainty (
Uanchor), used to determine the tag position mean error (
Table 11), was not directly obtained. It is part of the combined uncertainty using the three anchor positions (trilateration) that were calculated to obtain the spatial position of the tag, according to Equation (5). None of the previous works cited here have presented this type of calculation of spatial position uncertainty of anchors or have made the linkage to a source of uncertainty in the tag’s position.
One may observe that the measurements of the tag’s position errors from the reference points have relevant variation in repeatability and intermediate precision (
Table 9), even though all the points are clear-sighted for all anchors. This variation is mainly due to the position of the tag in relation to the positions of the anchors and the distance that the tag was from other equipment and machines, among other random factors that caused variability in the tag position indications of the RTLS localization with UWB technology.
The calculated tag’s position mean error uncertainty (
Uerror) (
Table 11) shows a wide range of
Uerror between 0.02 m and 0.09 m. The combined uncertainty,
, ranges from 0.01 m to 0.04 m, only considering reference points without sight obstruction and indoors, with the dimensions 15 m × 30 m. Therefore, it can be assumed that the standard deviations reported in the article by Jiménez and Seco [
3] with a value of 0.2 m, and in the article by Cazzorla et al. [
10], which cites a type-A standard uncertainty of 0.01 m at short distances, are similar values in order of magnitude. However, they were estimated with calculations different from the ISO GUM’s [
14]. The article by Cazzorla et al. [
10] is one of the few articles that cite measurement uncertainty but only describes the type-A standard uncertainty of 0.01 m at short distances and does not explain combined uncertainty calculations or final measurement uncertainty, with
k = 2 or calculated
k, and no uncertainty budget.
As for the tag position mean error (
) values obtained in this case study, they ranged from 0.13 m to 0.26 m, in an indoor environment without sight obstruction. The article by Thiede et al. [
2] mentions that the “accuracy” of UWB technology can be around 0.5 m. Only the term “accuracy” was observed. Other VIM terms [
23] that are related to measurement variability, such as measurement uncertainty, precision, trueness, bias, repeatability, and error, are not mentioned. In this study, the biggest value for the tag position mean error (
) was 0.26 m considering reference points with clear sight for all anchors. Therefore, the results obtained in this case study are consistent with those of Thiede et al. [
2]. The article by Jiménez and Seco [
3] does not cite the expression “measurement uncertainty”, precision, repeatability, or trueness, but often cites error, bias, and accuracy, although in some passages it cites accuracy mistakenly associated with numerical values. Jiménez and Seco [
3] show that the no pairing UWB system has an error (bias) of less than 0.3 m. These values are in the same order of magnitude as those in this case study. The study by Li et al. [
4] is a review that summarizes studies carried out with RTLS, including UWB, and mentions only terms such as error and accuracy (mistakenly associated with a numerical value), with values from 0.01 m to 1.00 m, in an indoor environment with varying conditions of measurements. This result is consistent with that of this study. The study by Ma et al. [
11] cites accuracy, but also cites it as a quantitative parameter, with a value of <0.30 m (no occlusion) for the basic parameters of the total station and the target with UWB technology, but does not cite uncertainty, precision, or trueness. The study by Barbieri et al. [
12] was conducted in a smart factory, an internal environment similar to the one used in this study, but this article does not mention uncertainty, rather describing “ranging errors that are distributed around zero with a maximum value of 0.22 m for all positions”. This value is in the same order of magnitude of the mean error of the tag’s position (
) (
Table 10). The article by Cho et al. [
13] also does not mention uncertainty but reports accuracy as a quantitative parameter, calculated with the same error equation, as the one in this article, Equation (1), and presents an accuracy variation from 0.08 m to 0.34 m, in an open indoor environment.
Regarding the reference standard, in this work, a total station—a portable coordinate metrology (PCM) device—was used, both for measuring the 3D coordinates of the anchor positions and the 3D coordinates of the tag’s reference positions. It is observed that other studies also used similar instruments. The study by Jiménez and Seco [
3] used the Trimble S6 total station to calibrate the position of anchors and to track the tags obtaining the true position. The study by Barbieri et al. [
12] used a laser distance meter. Additionally, the study by Cho et al. [
13] cited the use of a total station and a prism.
Finally, the approach presented in this work suggests the quantification of the minimum tolerance interval of RTLS with UWB technology. This approach was not found in the literature review of UWB technology. One must emphasize that the “Golden Rule of Metrology” [
16,
17,
18], used as a reference to quantify the minimum tolerance interval, is a recommendation and has no normative character. Even in many industrial applications, it is common to get loose from the use of the rule and assume that the
Tmin is four times the measurement uncertainty, or in extreme cases is three times the measurement uncertainty.
5. Conclusions
This paper has presented a task-specific measurement uncertainty approach to estimate the position of assets using UWB technology. A case study was used to demonstrate the applied method. The measurement results presented in this paper are consistent with those of previous studies, although a measurement uncertainty calculation in those previous works is not shown according to the GUM. It was evidenced that the tag position mean error uncertainty (Uerror) varies between a wide range of values between reference points, from 0.02 m to 0.09 m. This variation occurs even considering that the reference points with free sight for the anchors and the 3D coordinates of the anchors were measured with a total station (laser) and in an indoor environment of the dimensions 15 m × 30 m. The most significant source of uncertainty was the repeatability of the indicated tag position, and the intermediate precision is the main contributions.
The tag position mean error (
), mentioned as accuracy in most of the cited articles, ranged from 0.13 m to 0.26 m. In the analysis of the variations of these errors and uncertainties, it was identified that they arise mainly from the position of the tag in relation to the positions of the anchors, the distance the tag is from the anchors, and the proximity of the tag to other equipment and/or machines. The variability of measurement errors and uncertainties also comes from random factors, such as electrical and/or magnetic disturbances in the communication signals, which cause variability in the position indications of the tag of the RTLS location system with UWB technology. Electrical or magnetic interference was not measured or monitored, and the intermediate precision tests were carried out with machines turned on and turned off inside the experimental factory (
Figure 1a) to verify if there was an amplification in the variability of the measurements. The experimental results of the machines turned on and off are presented in
Table 6 and were considered in the measurement uncertainty calculations.
Finally, the global uncertainty of this RTLS location system with UWB technology (UUWB), when the tag position errors were not corrected, was determined to be the sum of the average tag position error (), and the tag position mean error uncertainty (Uerror), among all the measured points, was estimated to be 0.35 m, associated with a confidence level of 95.45%. From the global uncertainty value, it was shown that one might propose a bilateral tolerance interval according to the “Golden Rule of Metrology”, Berndt’s principle. In this case, with the minimum tolerance interval (Tmin) equal to five times the measurement uncertainty of 0.35 m, when the tag position errors were not corrected, the estimated bilateral tolerance was Tmin = ±0.88 m.


