1. Introduction
The trend of a steadily increasing number of electric vehicles (EV) sold has been observed in global sales for more than ten years. According to [
1], the number of EVs amounts to 145 million until 2030 if the extrapolation is based on current policies. Therefore, the continuous development of electrical power train solutions, in particular, is crucial. Electrical engines basically comprise two components, a rotor and a stator, whereas the stator significantly impacts the value chain [
2]. The hairpin technology proposes a promising manufacturing technology that replaces thin copper wires in stator winding by massive flat stiff coils [
3].
In contrast to conventional winding technology, hairpin winding offers the ability for a higher automation degree in manufacturing. Additionally, due to the usage of methods that are considered to be well researched, such as welding and forming, a better process stability is feasible [
4,
5,
6]. According to [
7], the process chain differentiates the number of process steps with regard to the applied technologies. Particularly for contacting the wires and forming the pins to its determined shape, multiple technologies are deployed, where the selection is mainly pendent on the consumers requirements [
8].
Apart from process advantages, which result mainly in a higher reachable automation degree, hairpin stators come with some notable technical advantages [
6]. Compared to random winding, the usage of hairpin winding improves the overall space efficiency. The geometry enables higher slot fill factors that increase the maximum reachable torque as well as the overall power [
6,
9,
10]. Additionally, cooling is improved because of larger contact areas [
5,
9]. Apart from the mentioned technical advantages, increasing alternating current losses can be observed in hairpin technology, which limits the overall efficiency.
Approaches to overcome this issue as well as challenges with regard to automated forming and welding are further discussed in [
11]. These circumstances and the fact of having a complex process chain result in high demands regarding the quality aspects within each manufacturing step. This creates the need for extensive quality assurance. The creepage distance, which this study significantly contributes to determining, is described as the shortest distance along the surface of a solid insulating material between two conductors at different voltage potentials [
12]. The creepage distance is similar to the shortest distance in air between two conductors of different potential, and this is defined as the clearance distance.
To prevent surface flashover or insulation breakdown, both of these features must not fall below the required and prescribed limits depending on the application [
12]. In the field of electrical drives, specified requirements need to be ensured, e.g., to prevent parts from explosion [
12,
13]. Hence, these features are safety relevant; the precise measurement is crucial but has not been integrated within an automatic assurance procedure yet. Thus, further development and design processes of hairpin stators can be improved by an accurate estimation of geometric features, integrating appropriate methods for determining these will be relevant for several manufacturing companies.
The inspection with tactile measurement devices is limited due to the geometry of the hairpin stators. With the advantages of a short inspection time and an increasing resolution in 3D reconstruction, optical measurement systems based on fringe projection profilometry are becoming widely used for inspection applications in production technology [
14] and are also used in the proposed approach. Within this study, a novel method is presented in order to estimate the creepage distance based on meshed 3D data. Furthermore, the approach offers the feasibility for a simple integration within the inspection cycle that results in a higher efficiency within the automated inspection during manufacturing.
2. State of the Art
In the following, a brief overview of relevant processes in hairpin manufacturing is provided as well as image-based approaches for quality assurance along the process chain. The manufacturing procedure basically requires a stator core for further assembly comprising stamping sheet metals that are interlocked afterward [
15].
2.1. Hairpin Stator Manufacturing
According to [
7], the process chain of hairpin stator manufacturing can be differentiated in five steps as visualised in
Figure 1. First, the hairpins are processed utilizing different techniques from sheet-forming technology to produce the shape that has been developed within a previous design process. Depending on the design, different shapes of wires are used for stator manufacturing, which includes, for instance, straight bars that are described as
I-Pins [
16].
After the geometry of the wires has been defined, the positioning is conducted within a pre-assembly process according to a specified scheme. Subsequently, the hairpins are inserted into the stator core using high forces [
7]. After inserting the wires, the axial position is determined. In the following twisting process, defined forces are used to twist the wires cross-sections and to obtain the required tangential position. Therefore, the final position is defined, and the ends of the intended wire pairs can be contacted by multiple welding technologies [
7]. Glaessel et al. described different welding technologies and emphasized the importance of a proper removal of the insulation material [
17].
Thus, it is of importance, on the one hand, not to reduce conductive material along the cross-section of the wire and, on the other hand, to assure that no insulation material remains in the joining area. According to [
17], laser beam welding features some advantages in contrast to established technologies, such as resistance welding or ultrasonic welding. Furthermore, Glaessel et al. proposed the application of infrared lasers with a small focus as a promising technology [
17]. In a following processing step, the wires as well as the stator are impregnated to meet the requirements regarding the insulation characteristics that are also evaluated in the final testing procedure [
7,
15,
17].
2.2. Image-Based Quality Assurance in Hairpin Manufacturing
Single processes linked to the process chain in hairpin manufacturing have been the subject of intense research. Due to a high number of wires that need to be connected, the welding process features an integral role in hairpin stator manufacturing [
18]. In [
19], an image-based approach using a neural network architecture was evaluated for in-process monitoring of laser-based weld seams of hairpin stators. Mayr et al. [
20] proposed a comparable approach for estimating the quality of the cross-section in contacting, and they used pre-trained neural network architectures to classify the images.
A method that ensures quality monitoring within bending processes was described in [
5]. In contrast, Mayr et al. utilized three dimensional data instead of 2D images and performed the data processing based on machine-learning methods. In [
21], Vater et al. proposed an approach that processes 3D data that is conducted within hairpin manufacturing and applied for error classification in the laser welding process. It can be observed that some approaches apply 2D data instead of 3D data, which is mainly due to higher costs of 3D scanners.
In contrast, 3D scanning achieves higher inspection stability as well as the advantage of taking height information, which is crucial for reconstructing certain geometries [
22]. Extracting features out of 3D data constitutes a wide field of research, which is linked to many different use-cases. Due to an increasing development and cost reduction of surface-probing technologies and 3D scanning, an increasing demand for appropriate 3D data processing has been observed [
23].
2.3. 3D Feature Extraction and Product Metrology
Previous research analysed the performance and revealed the advantages of optical 3D metrology in different applications [
14,
24,
25], and active vision sensors using an additional light source are particularly widespread due to improved robustness and accuracy [
26]. Therefore, the development of 3D processing and spatial feature extraction algorithms is crucial. Li et al. [
27] introduced an early reverse engineering approach that used 3D reconstruction for modelling parts and subsequently derived tool paths to improve the efficiency in repair processes of worn mechanical parts.
Wang et al. [
28] also proposed an approach for robotic path planning based on feature extraction. Using 3D reconstruction, parental surfaces were created after segmentation and B-spline modelling. Recent measurement data were superimposed with the parental surfaces, which led to an improved computation time. In a second iteration of the feature-guided trajectory approach, Feng et al. [
26] additionally proposed a refining process that comprises outlier separation based on a nearest neighbour analysis (Kd-tree) and void filling. Achieving maximum root mean squared errors less than 0.7
, even the computational time was improved by approximately 65% compared to the reverse engineering approach mentioned.
In defect analysis and classification on 3D printed surfaces, Zhao et al. [
29] proposed an approach that introduces a novel feature descriptor to statistically evaluate the local topological information. The feature descriptor considers the results of normal differences in the neighbourhood of the keypoints in combination with a rotation projection statistic feature descriptor.
The state of the art emphasizes that quality assurance plays an essential role in the automation of the process chain in hairpin production. It can be observed that many related approaches apply 2D image data instead of 3D data; however, the importance of appropriate 3D data processing continues to increase. However, some exemplary research activities have shown promising developments in raising the robustness and computational efficiency for feature extraction and the processing of spatial data in different applications. This research contributes to the deployment of spatial feature extraction within the automated quality assurance in hairpin manufacturing to enable accurate determination of the safety-relevant creepage distance.
3. Problem Definition
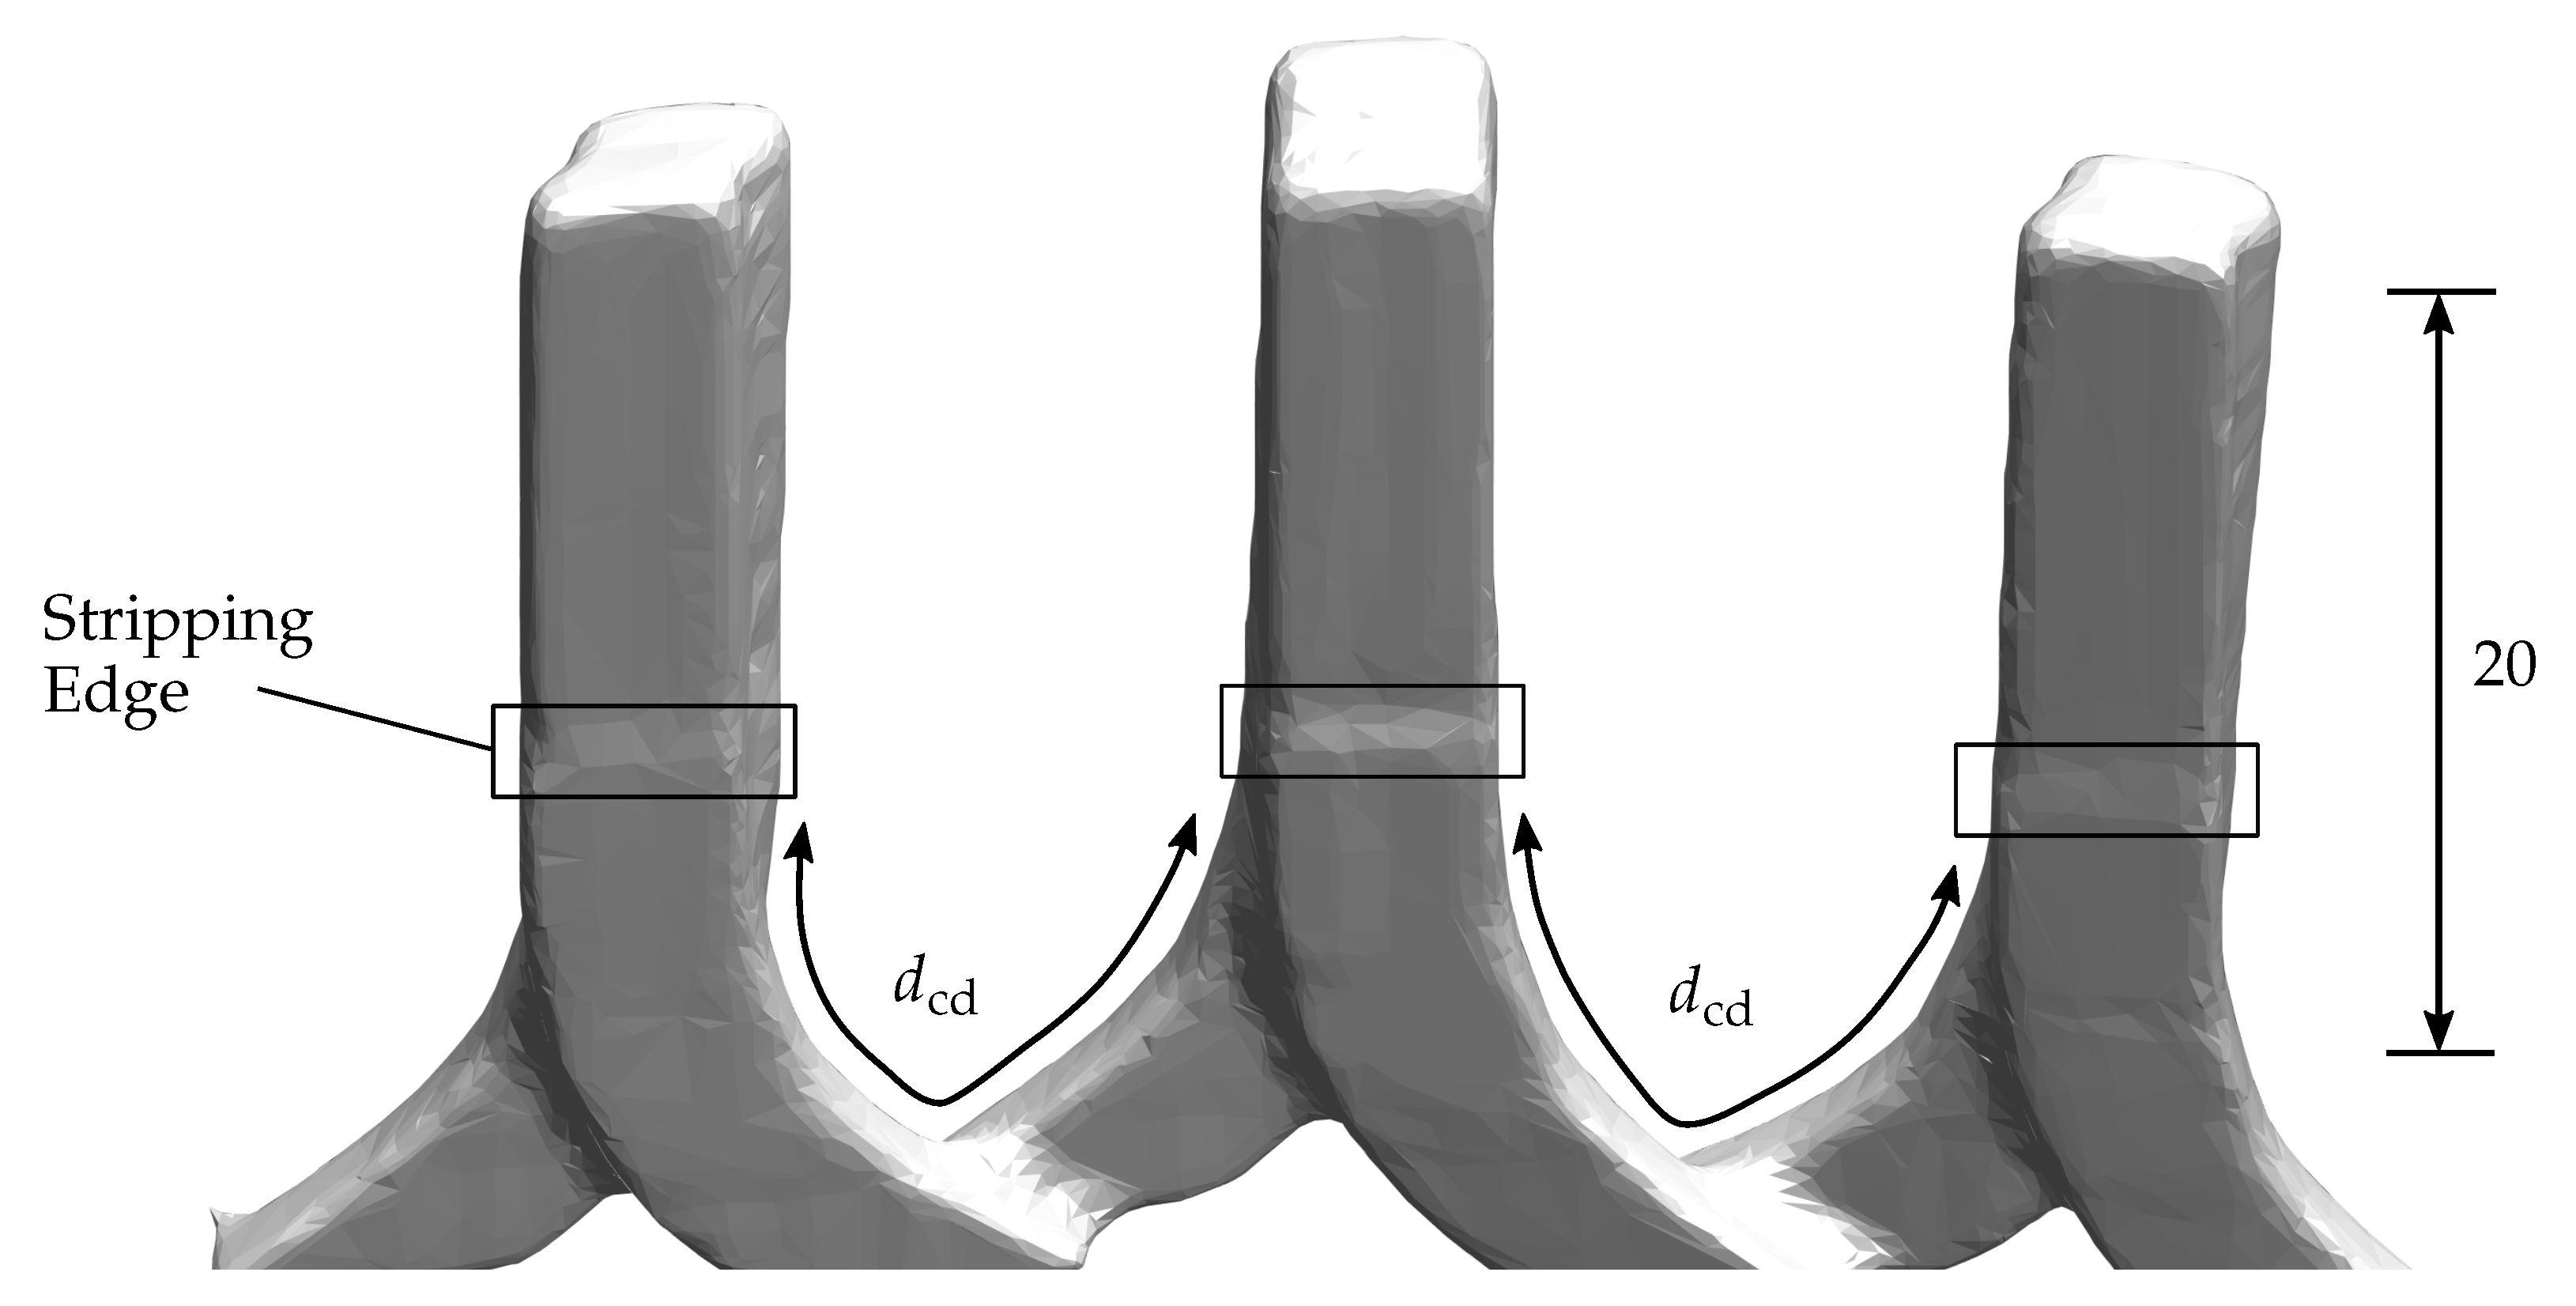
In
Figure 2, an exemplary hairpin winding is visualised in detail. The isolation edge can be observed in the highlighted areas, which feature the transition from insulating to non-insulating material on the wires surface. The challenge of estimating the creepage distance
automatically and accurately constitutes the main work of this study. Even under ideal conditions, to date, no approaches are available that go beyond simple estimation procedures and allow for robust implementation in the context of automated production measurement technology. The following section describes and evaluates a novel method to extract the relevant areas out of three dimensional data to quantify the creepage distance.
4. Experimental Setup
The data used in the following were acquired with a robot cell supplied by
GOM GmbH (Braunschweig, Germany). The utilised measurement system is described as ATOS ScanBox and comprises a six-axis jointed-arm robot (ARC Mate 120iC) by
FANUC K.K. (Oshina, Japan) with an optical sensor that is mounted at the robots end effector. A
GOM ATOS 5 3D-scanner was applied and is based on fringe projection profilometry to reconstruct 3D geometries. The specifications of the utilized robot kinematics as well as the applied fringe projection sensor are listed in
Table 1.
Additionally, a rotation table is located inside the cell to realize an improved orientation of the inspection parts. As a result, the data are epresented as a meshed 3D point cloud and stored in .STL-files. For a more detailed overview on the application of fringe projection metrology at various scales within production metrology, a comprehensive assessment is provided in [
14].Within the scope of this study, different types of hairpin stators were inspected and reconstructed. The dimensions as well as specifications in terms of the power differentiated depending on the stator type. The proposed approach was evaluated using one specific stator type.
For these initial investigations, and to develop the algorithmic pipeline, an automated measurement routine was programmed using the Inspect-Software from GOM. The implemented routine attempts to capture the specimen as well as possible since a hairpin stator features complex geometry, which requires multiple measurement poses. However, for better integration into the production process and higher reconstruction accuracies, other instruments and measurement approaches are also conceivable. The overall measurement duration amounts to a few minutes.
5. Data Processing
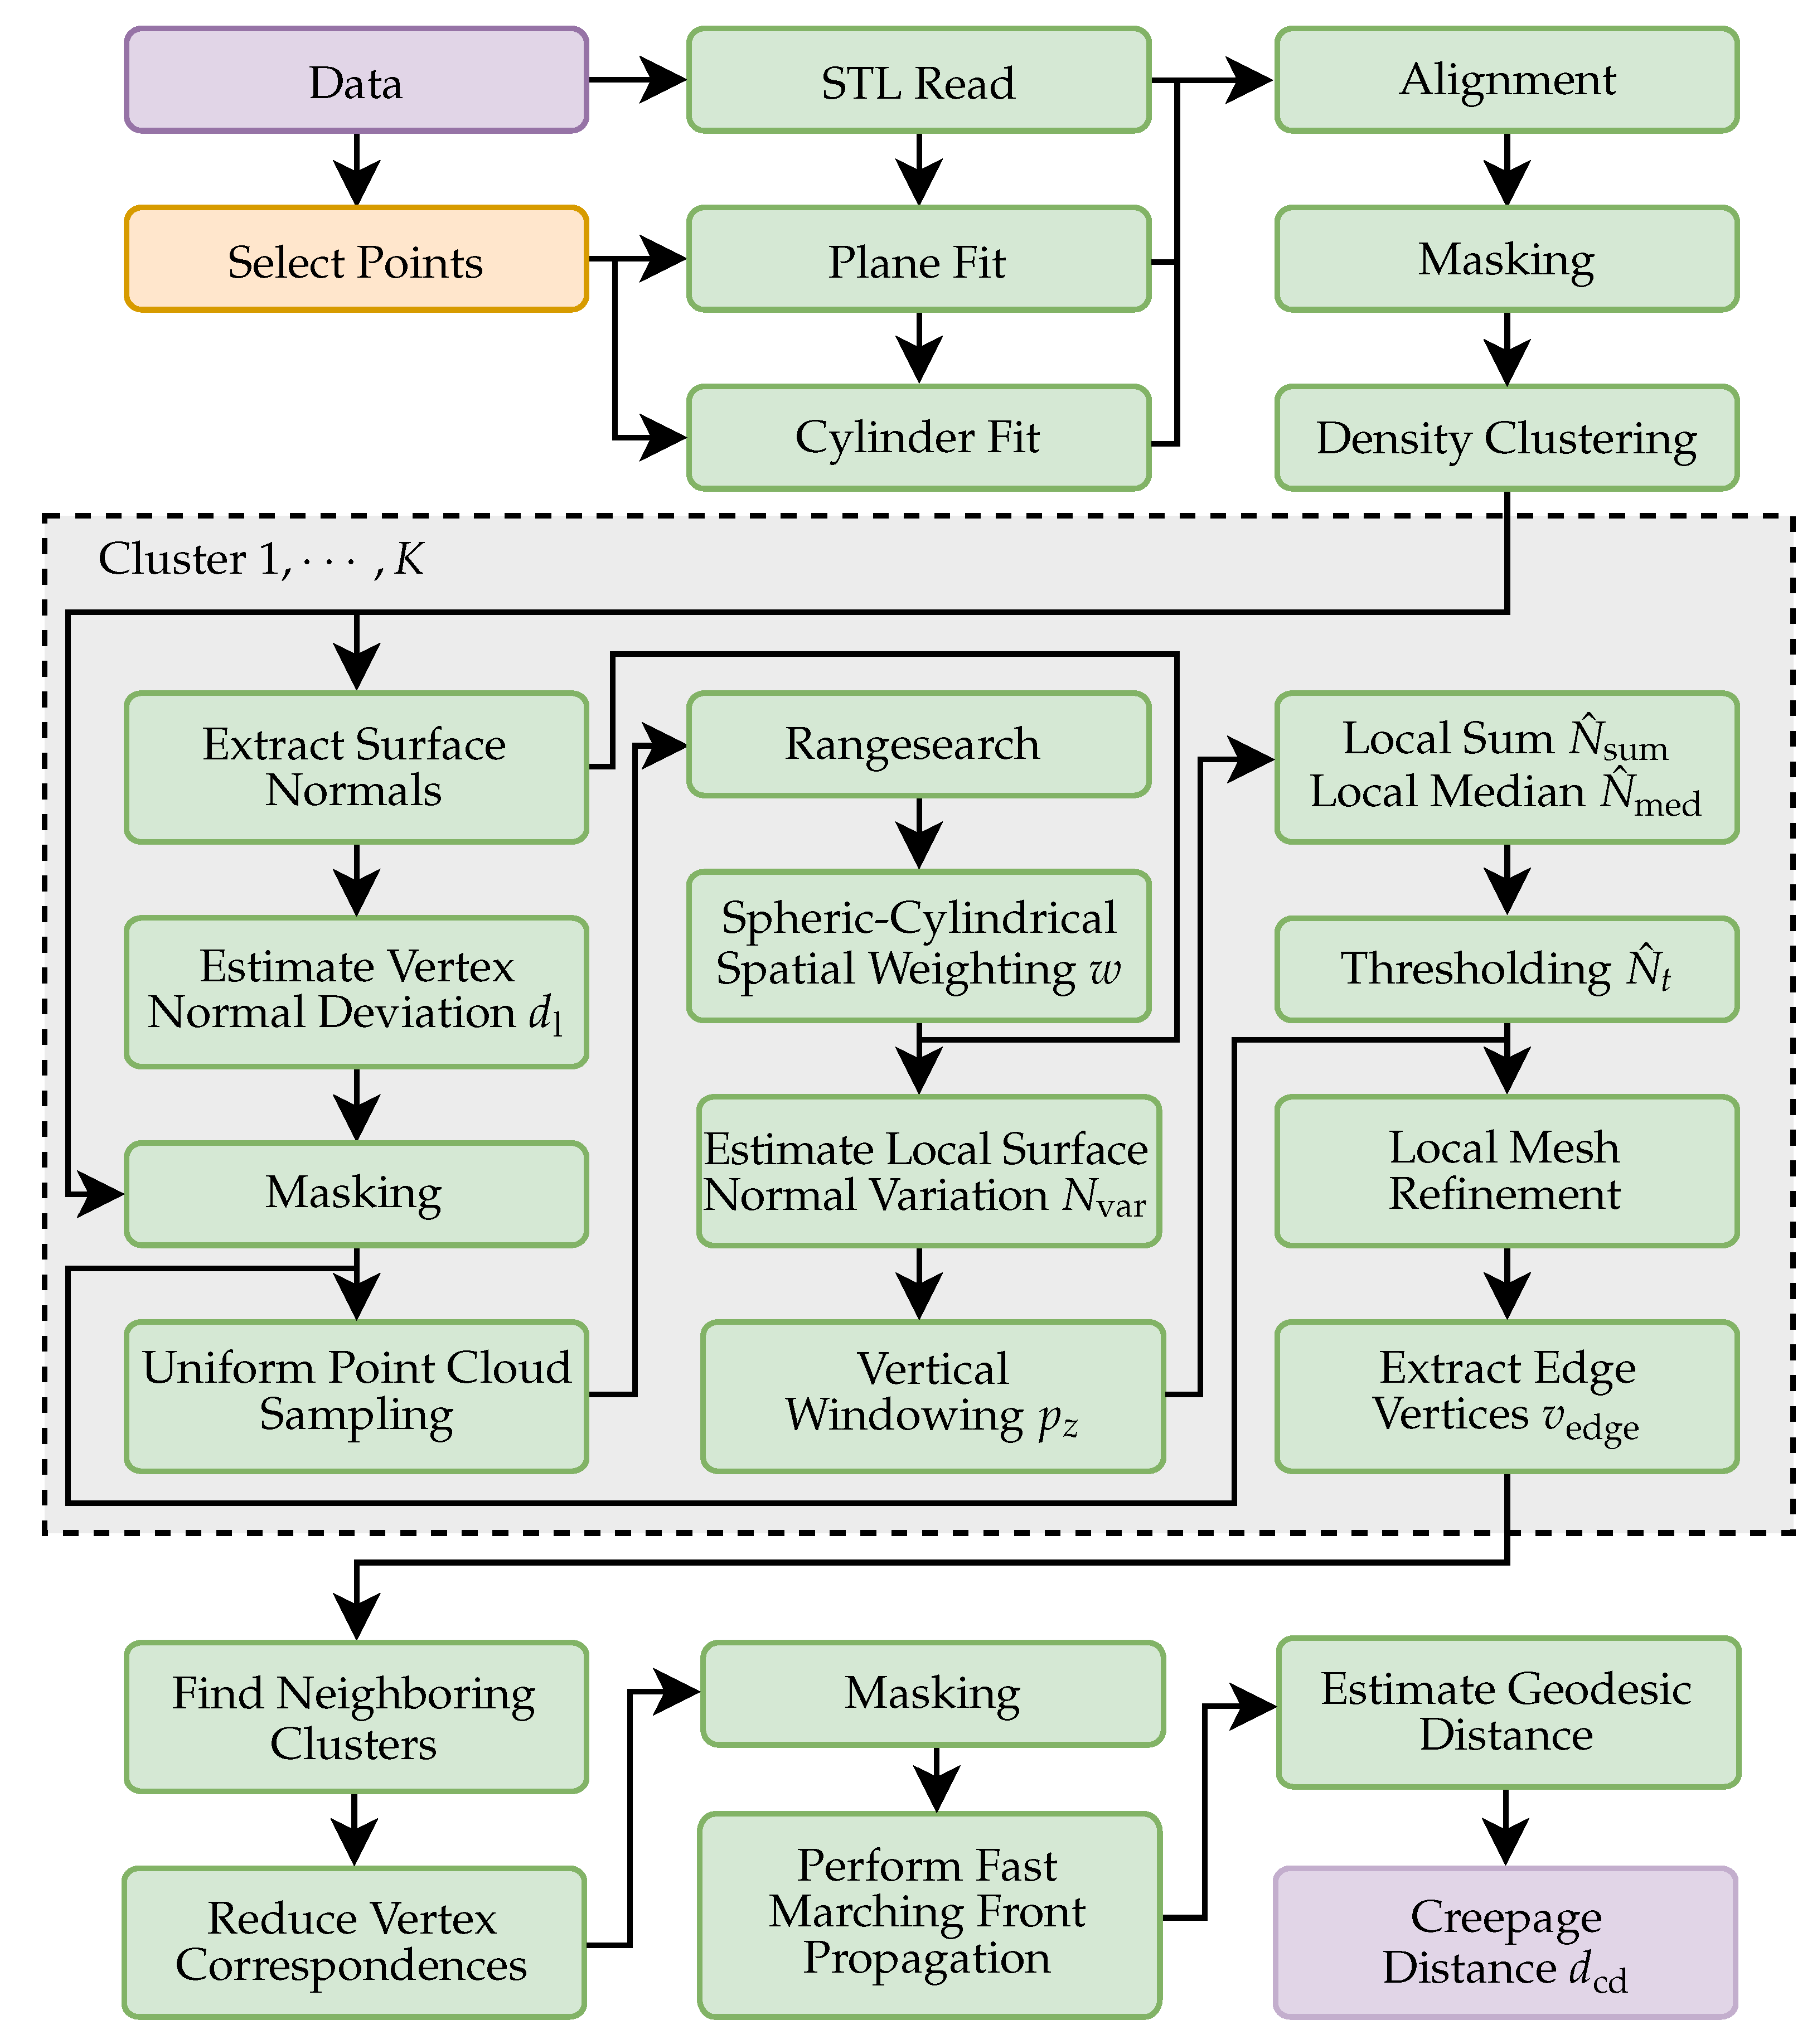
The main data processing steps for determining the creepage distance are visualized in
Figure 3 and mainly comprise data alignment based on manually assigned initial points and subsequent division into clusters, each corresponding to a pair of wires. The clusters are processed individually for determining the stripping edge, which is based on a local surface normal variation. For accurate results in regard to spatial windowing, a polygonal resampling is applied to transform the mesh into a point cloud with uniform point density. Subsequently, the creepage distance is determined as the geodesic distance of the neighbouring stripping edge points on the mesh for each cluster.
5.1. Data Alignment
The reconstructed 3D mesh
of the geometry comprises vertices
and faces
. The latter are stored in the form of a connectivity list for all respective polygons. The overall approach is based on clustering corresponding pairs of wires to subsequently analyse every clustered pair itself. Subsequently, the isolation edge is segmented so that the shortest distance between the two conductors can be estimated. An overview of the procedure for processing the 3D data is visualised in
Figure 3. The reconstructed mesh is aligned within a coordinate frame. In an initial implementation, this is performed via a two-step alignment process, which may be redundant in later automation due to fully identified kinematic relationships along with minor numerical corrections.
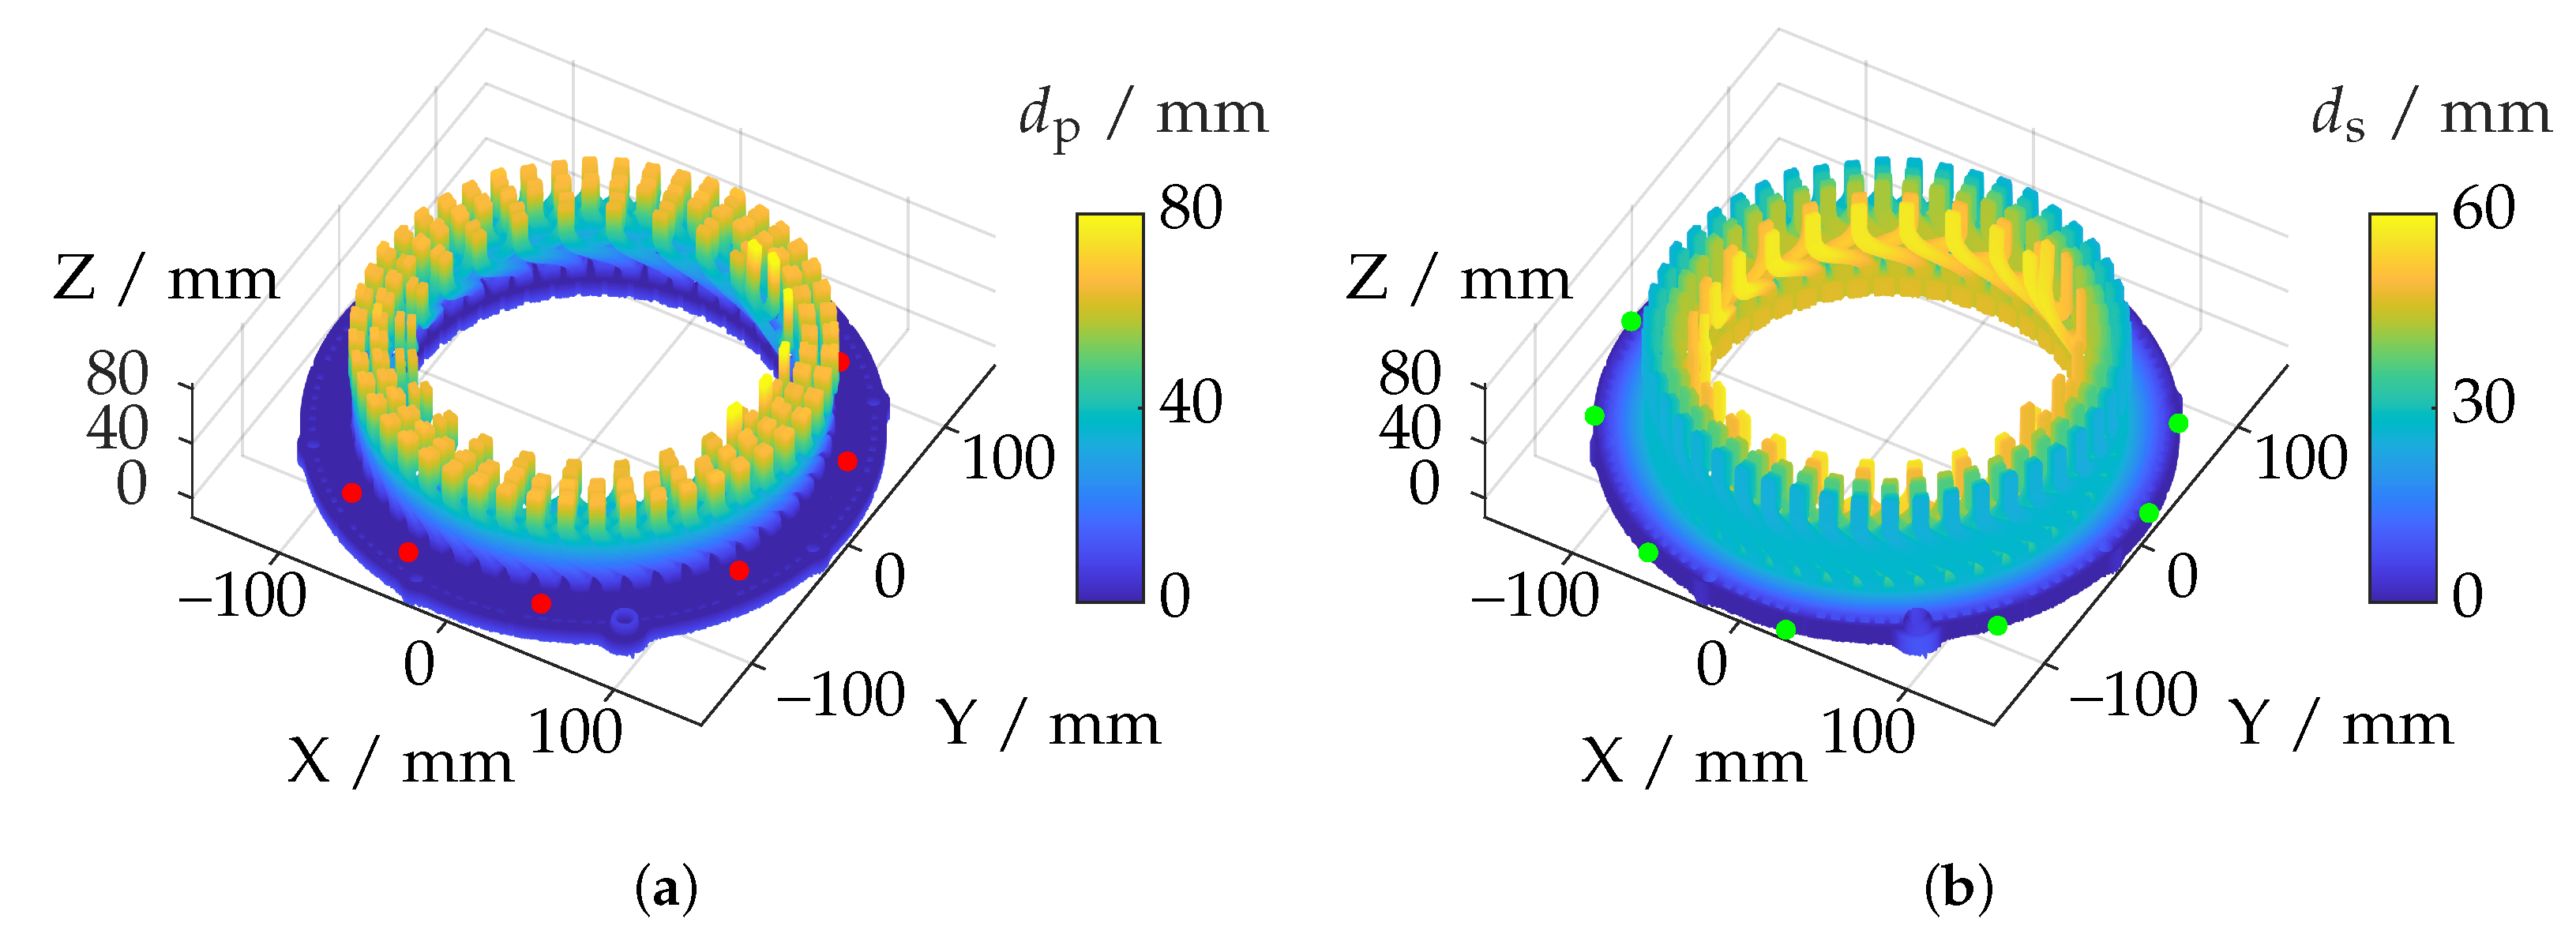
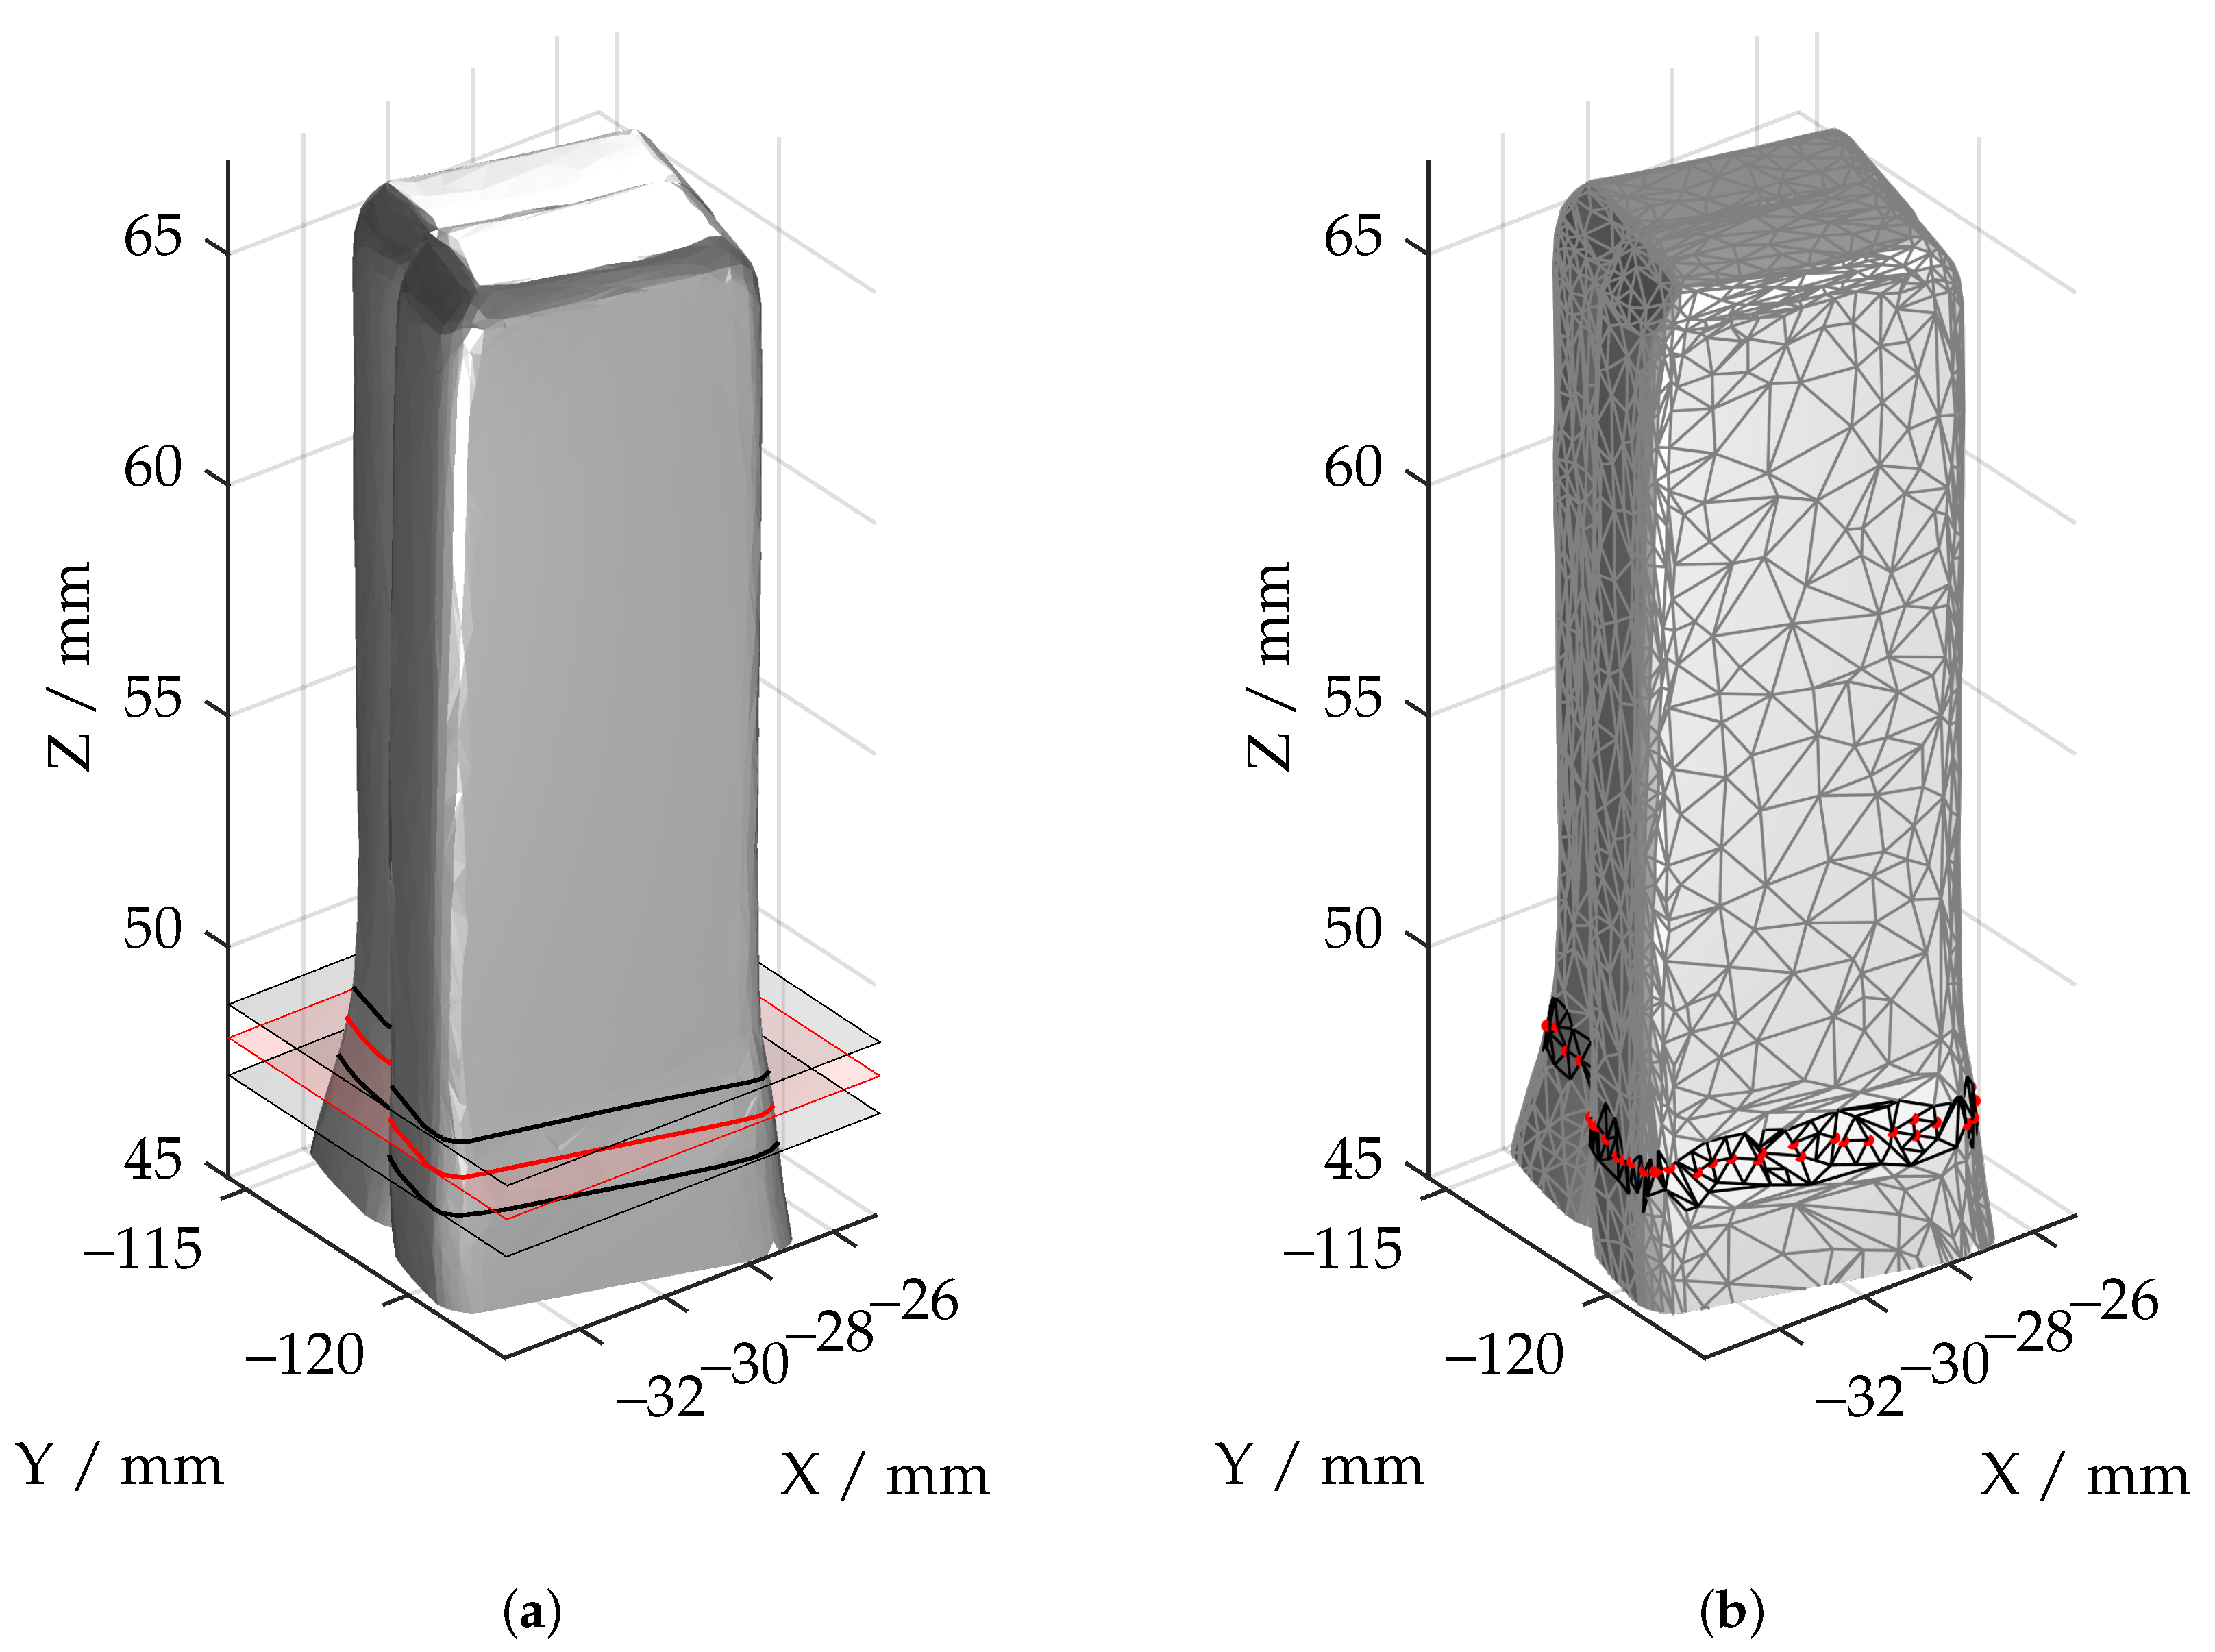
Let
be a set of points that are manually selected (
) via a graphical user interface and that are located in the base plane of the reconstructed mesh. This is visualized in
Figure 4a with red points, into which a plane is subsequently fitted via a least-squares approach [
32]. Additionally, the deviations of all vertices in the plane normal direction
are calculated. The subset
of all plane points with the maximum point-plane normal distance
is then used in the following for the optimization of the unknown rigid-body transformation
:
Due to numerical considerations, the quaternion convention is used for the optimization of the rotational component, since it performs well and converges fast [
33]. The non-linear Levenberg–Marquardt algorithm is applied as a solver [
34,
35,
36].
In a second step, on the basis of additional manually assigned points
(green points as per
Figure 4b), a circle is then fitted into the point clouds on a geometric circumference using a least-squares approach [
32]
based on the vertex-cylinder distance
. The aligned point cloud, subsequently centred around
, is further separated into different segments for subsequent cluster analysis with fixed geometric thresholds based on the polar coordinate representation with regard to the radius and
z-component.
For clustering the wires into corresponding pairs, the dbscan density-based clustering algorithm [
37] is applied.
5.2. Cluster Analysis
Figure 5 shows the division into
K clusters, which are processed individually in the following to estimate the corresponding vertices of the stripping edges for the determination of the creepage distance as accurately as possible. First, a reduced mesh
is derived via a rangesearch based on the fast
k-d search tree [
38,
39] with respect to the Euclidean distance in the
plane, and the polygon-based normal vectors
are extracted according to
Figure 6.
Using the shortest Euclidean distance with respect to the polygon normal vectors and the z-axis
the mesh is adjusted for polygons that do not point towards the z-axis:
In this case, a threshold of mm is selected.
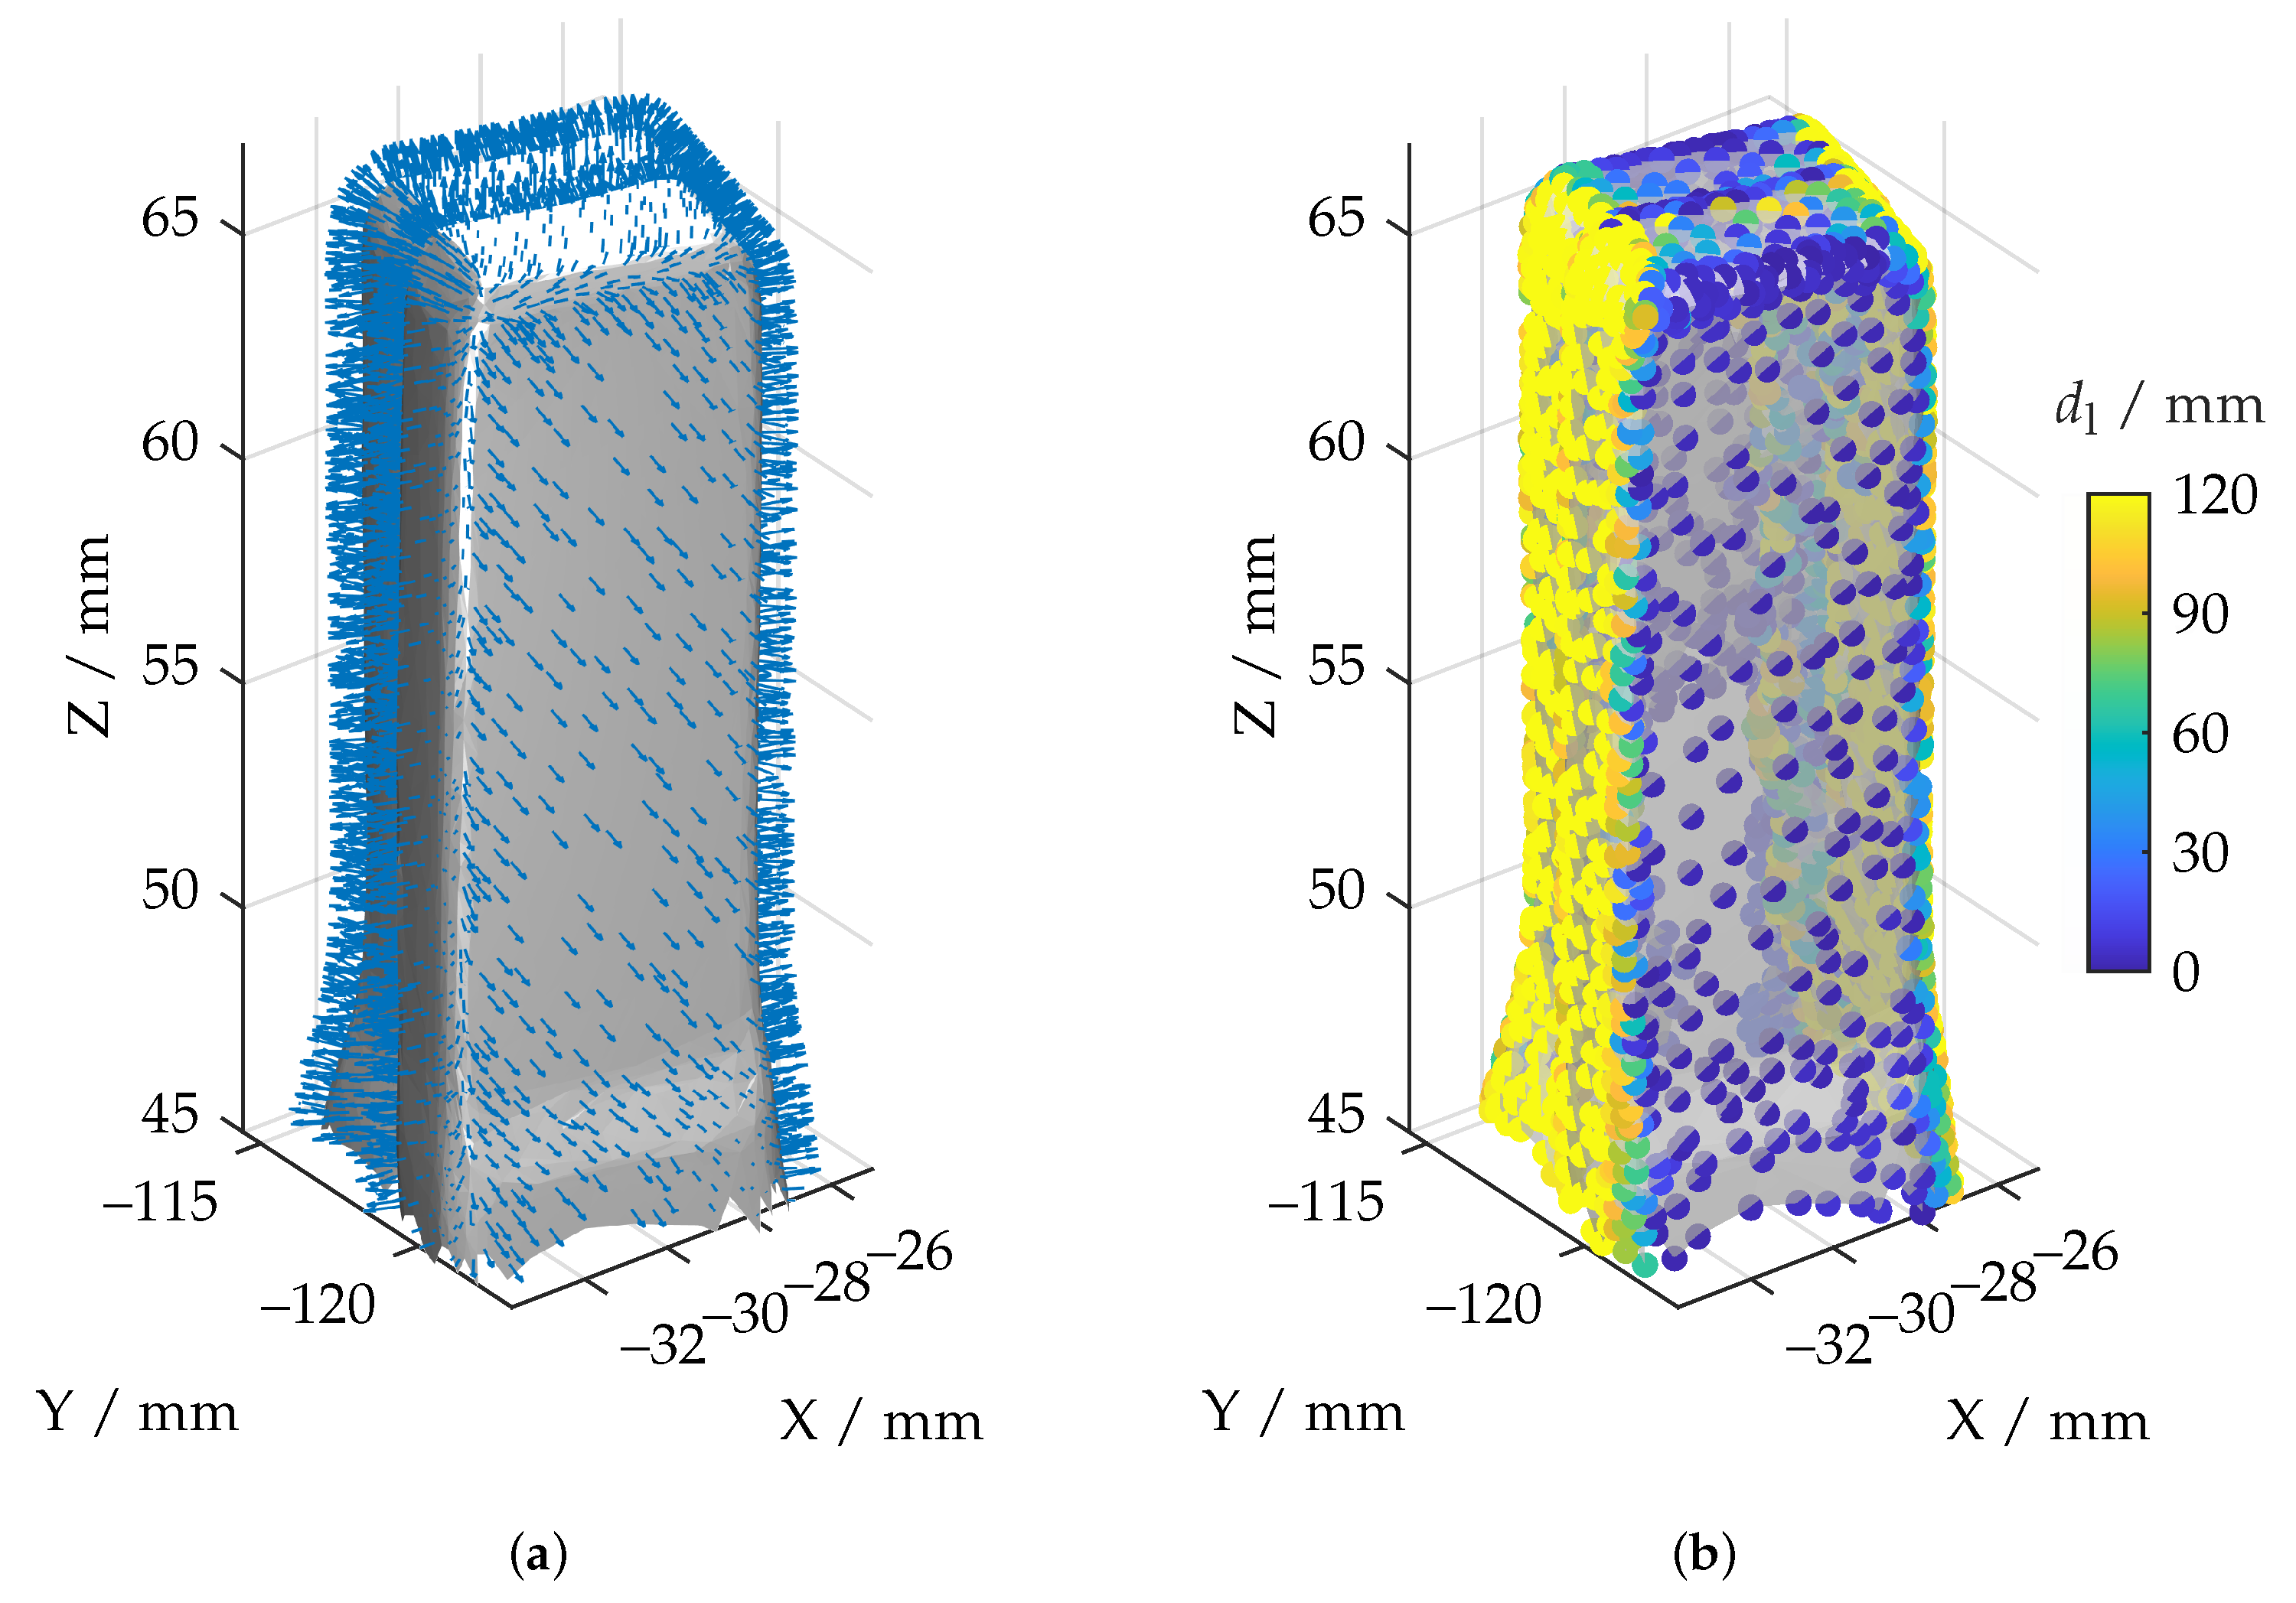
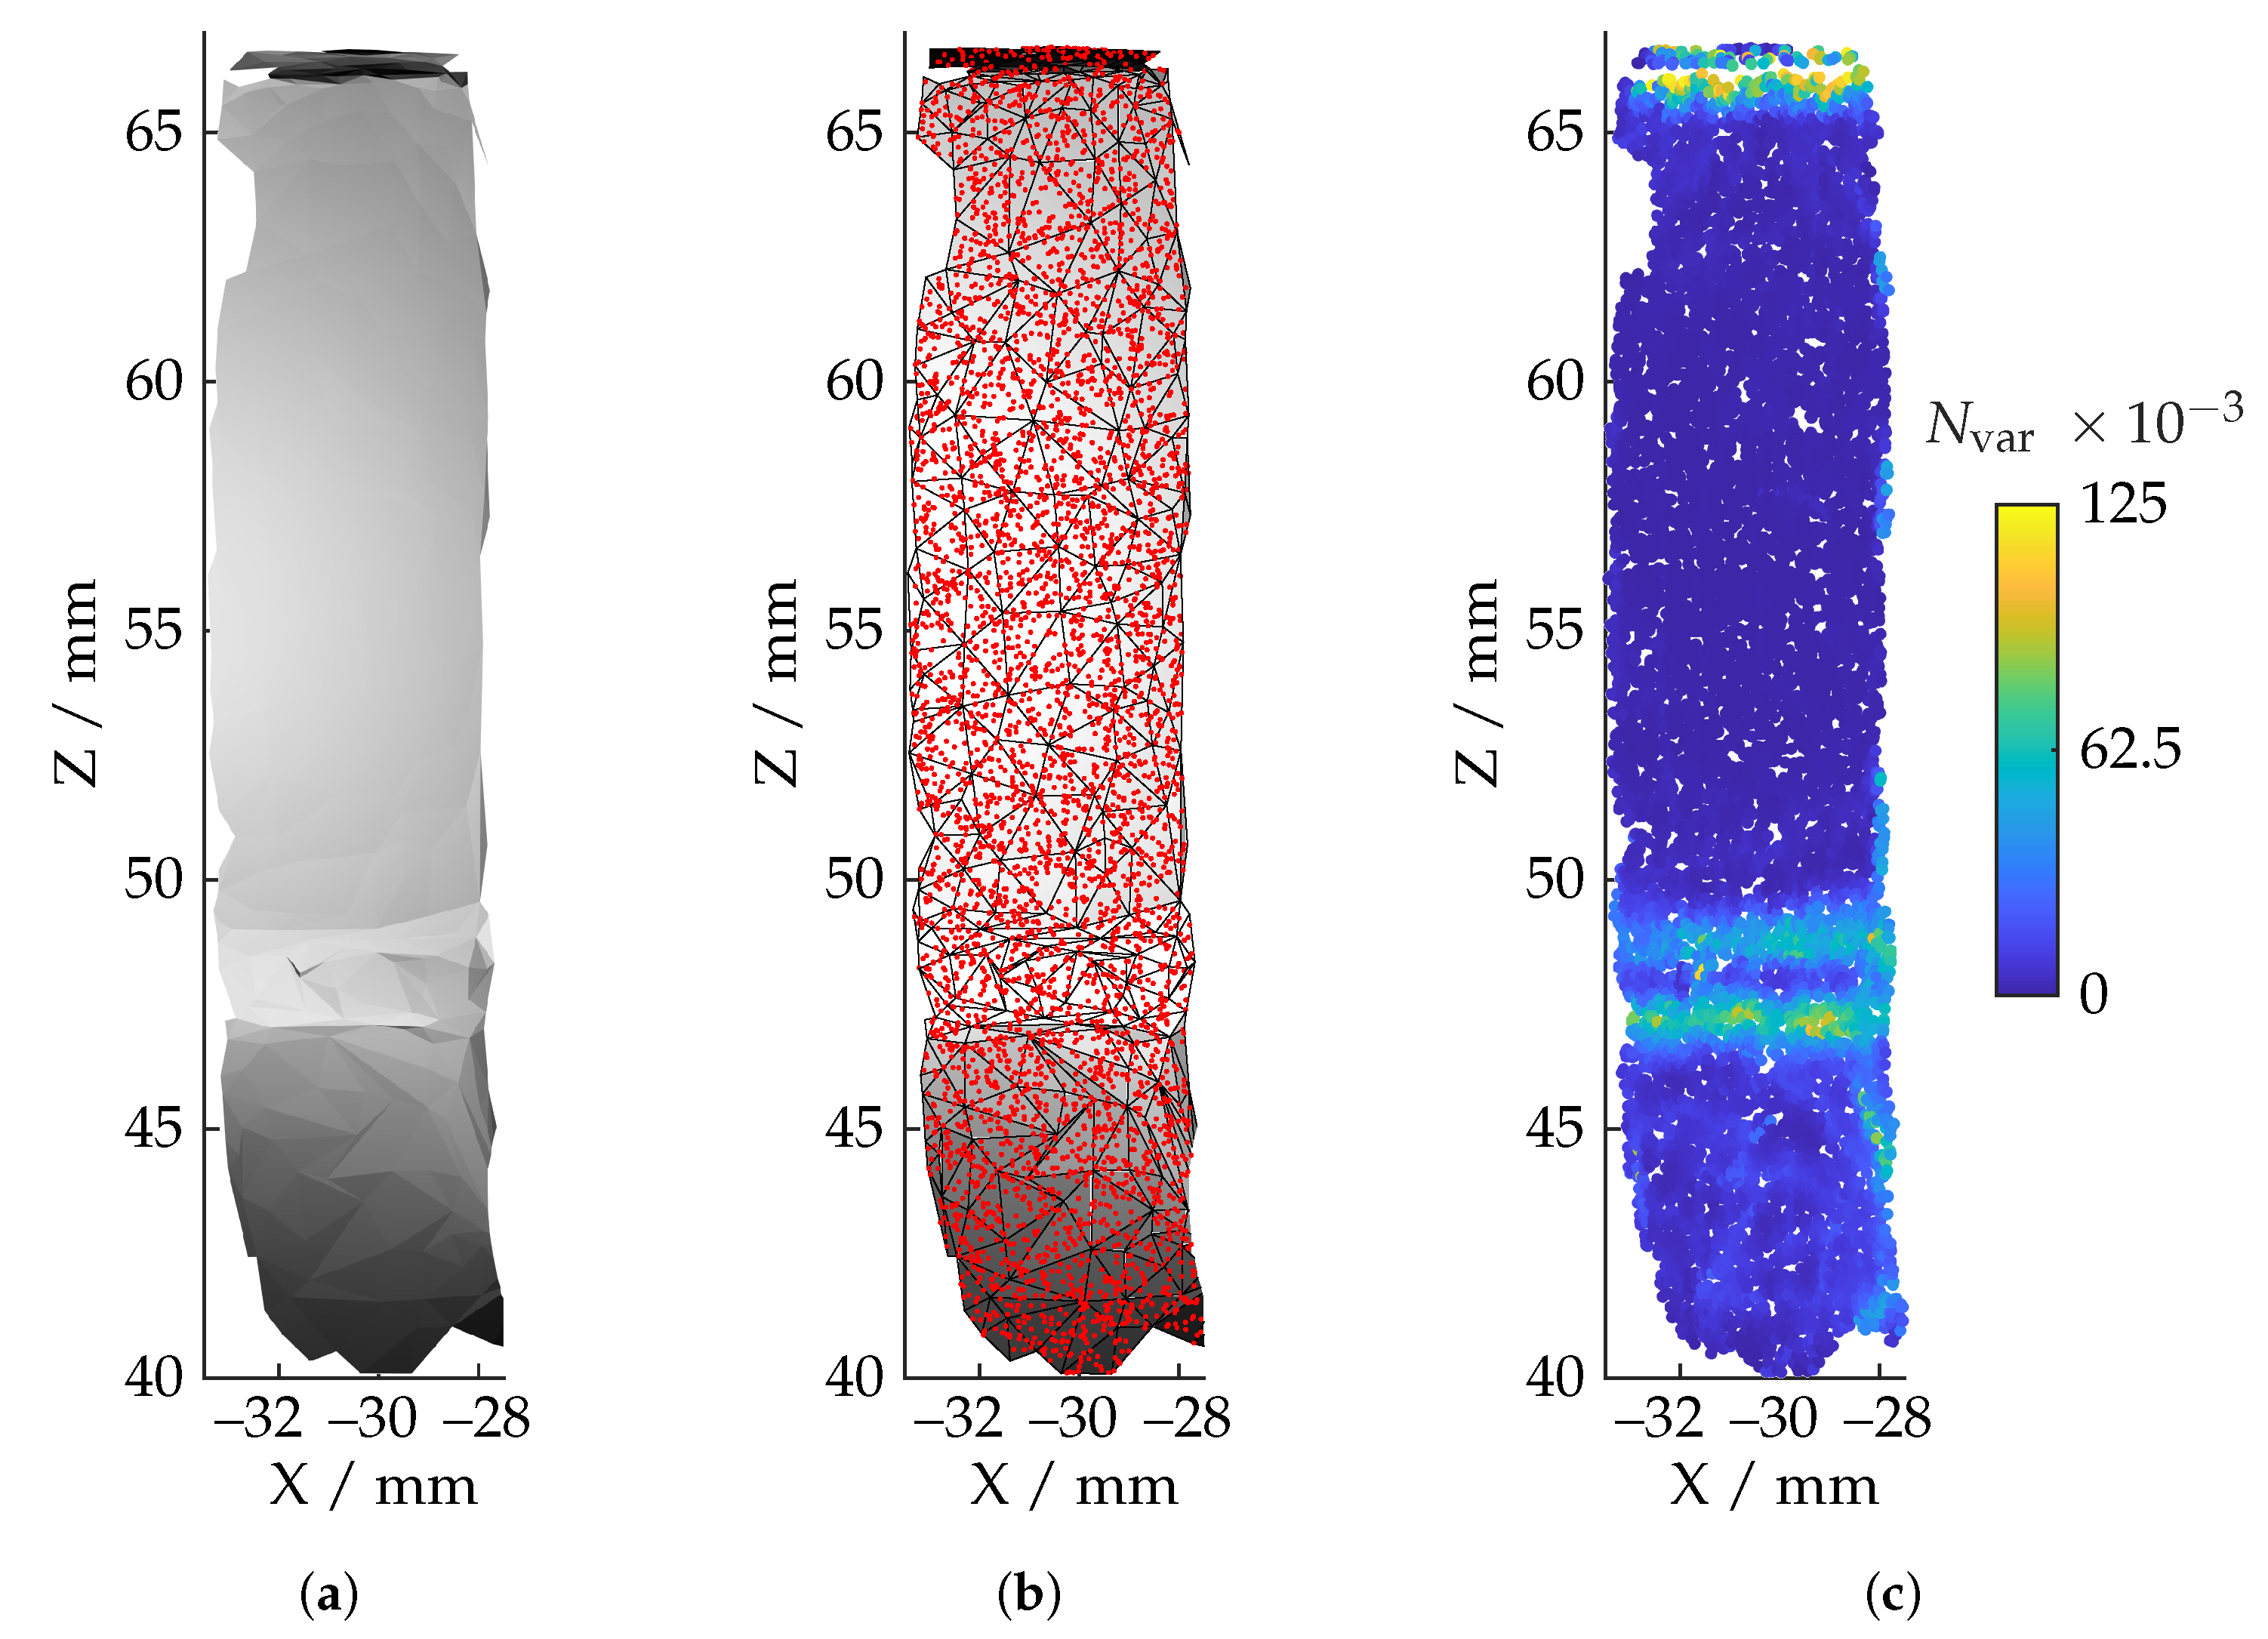
Based on the inlier vertices, the reduced mesh
with face normals
is generated according to
Figure 7a. For subsequent calculations, it is essential to generate a point cloud
with a relatively homogeneous local point density, which, accordingly, cannot be based on the simple vertices
due to strongly varying polygon sizes. Therefore, random samples are generated in dependence of the polygon size according to the approach of Osada et al. [
40], which was further developed in [
41,
42]. The result is shown in
Figure 7b. For the localization of the stripping edge, the local normal variation
is calculated, where
represents the indices of all neighbour points with respect to
within the cylinder–sphere intersection defined by
mm and
mm. Additional windowing is subsequently performed via spherical distance weighting:
The results are shown in
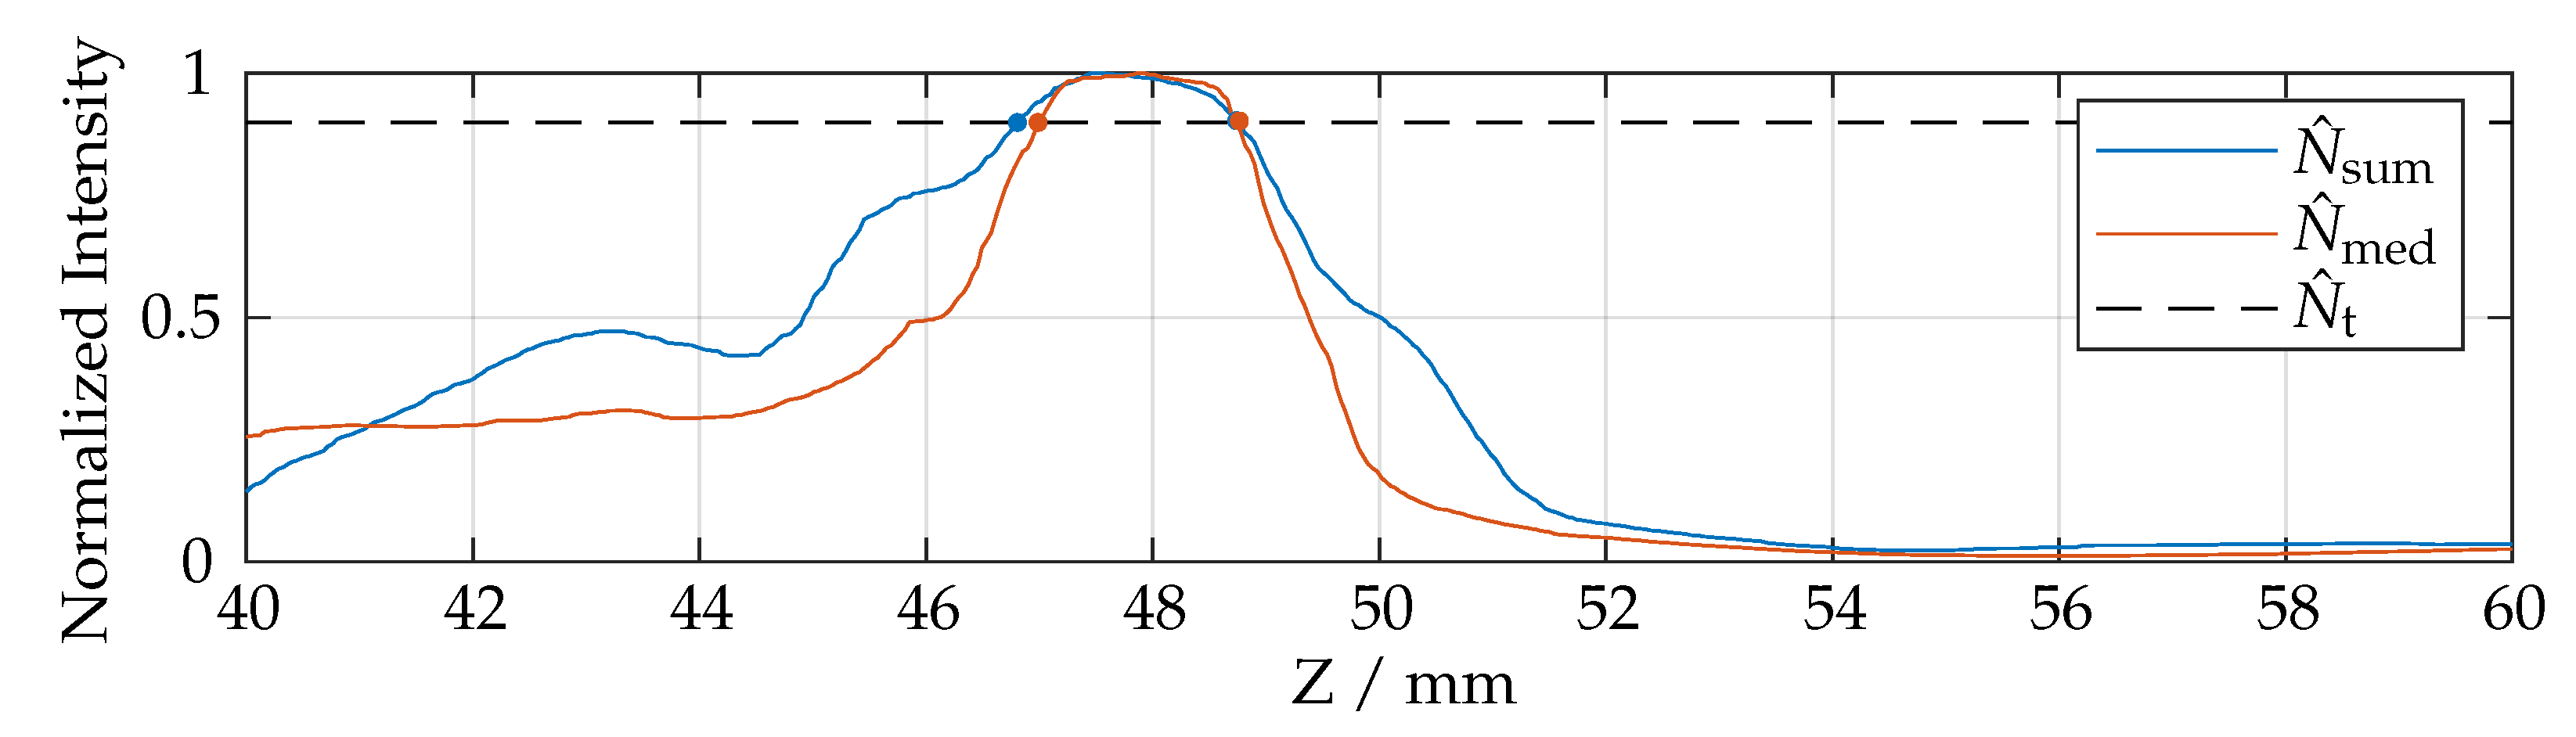
Figure 7c. Subsequently, the sum
or the median
of all normal variations
with regard to the vertical position
is determined. With
representing the indices of neighbouring points within regard to their vertical position and threshold
mm. The normalized results are depicted in
Figure 8.
In principle, similar characteristics of
and
can be observed, with the
likely being more robust with respect to strongly fluctuating numbers of points within the local neighbourhood. Although this did not occur in the experiment, it is conceivable with respect to the polygon masking according to
. For the identification of the stripping edge within mesh
, it is necessary to find neighbouring vertices with respect to the global maximum of
or
. Since neighbouring vertices
feature a certain distance to a mesh–plane intersection at a respective height, lower and upper limits are defined via the normalized distance
, which is represented in
Figure 8.
The resulting mesh
is further modified by triangle subdivision refinement until a sufficient number of vertices is close enough to the mean height
(red according to
Figure 9), respectively, and the overall maximum polygon area is reached. This is shown in
Figure 9b by the black, refined mesh
, which is incorporated in an updated mesh
.
5.3. Determination of the Creepage Distance
With the edge cutoff distance
mm, the subset
of all corresponding edge vertices is extracted. Subsequently, the centroid in the XY plane is determined for each cluster edge vertex set
, and the corresponding neighbour clusters are identified via 2-NN search. This determines the corresponding clusters within the mesh that may be affected by creepage currents. For determination of the creepage distance
, the geodesic distance on the mesh is calculated on the basis of the Graph toolbox of Peyre [
43], which is used with few modifications and features functions to be locally compiled for optimized runtime.
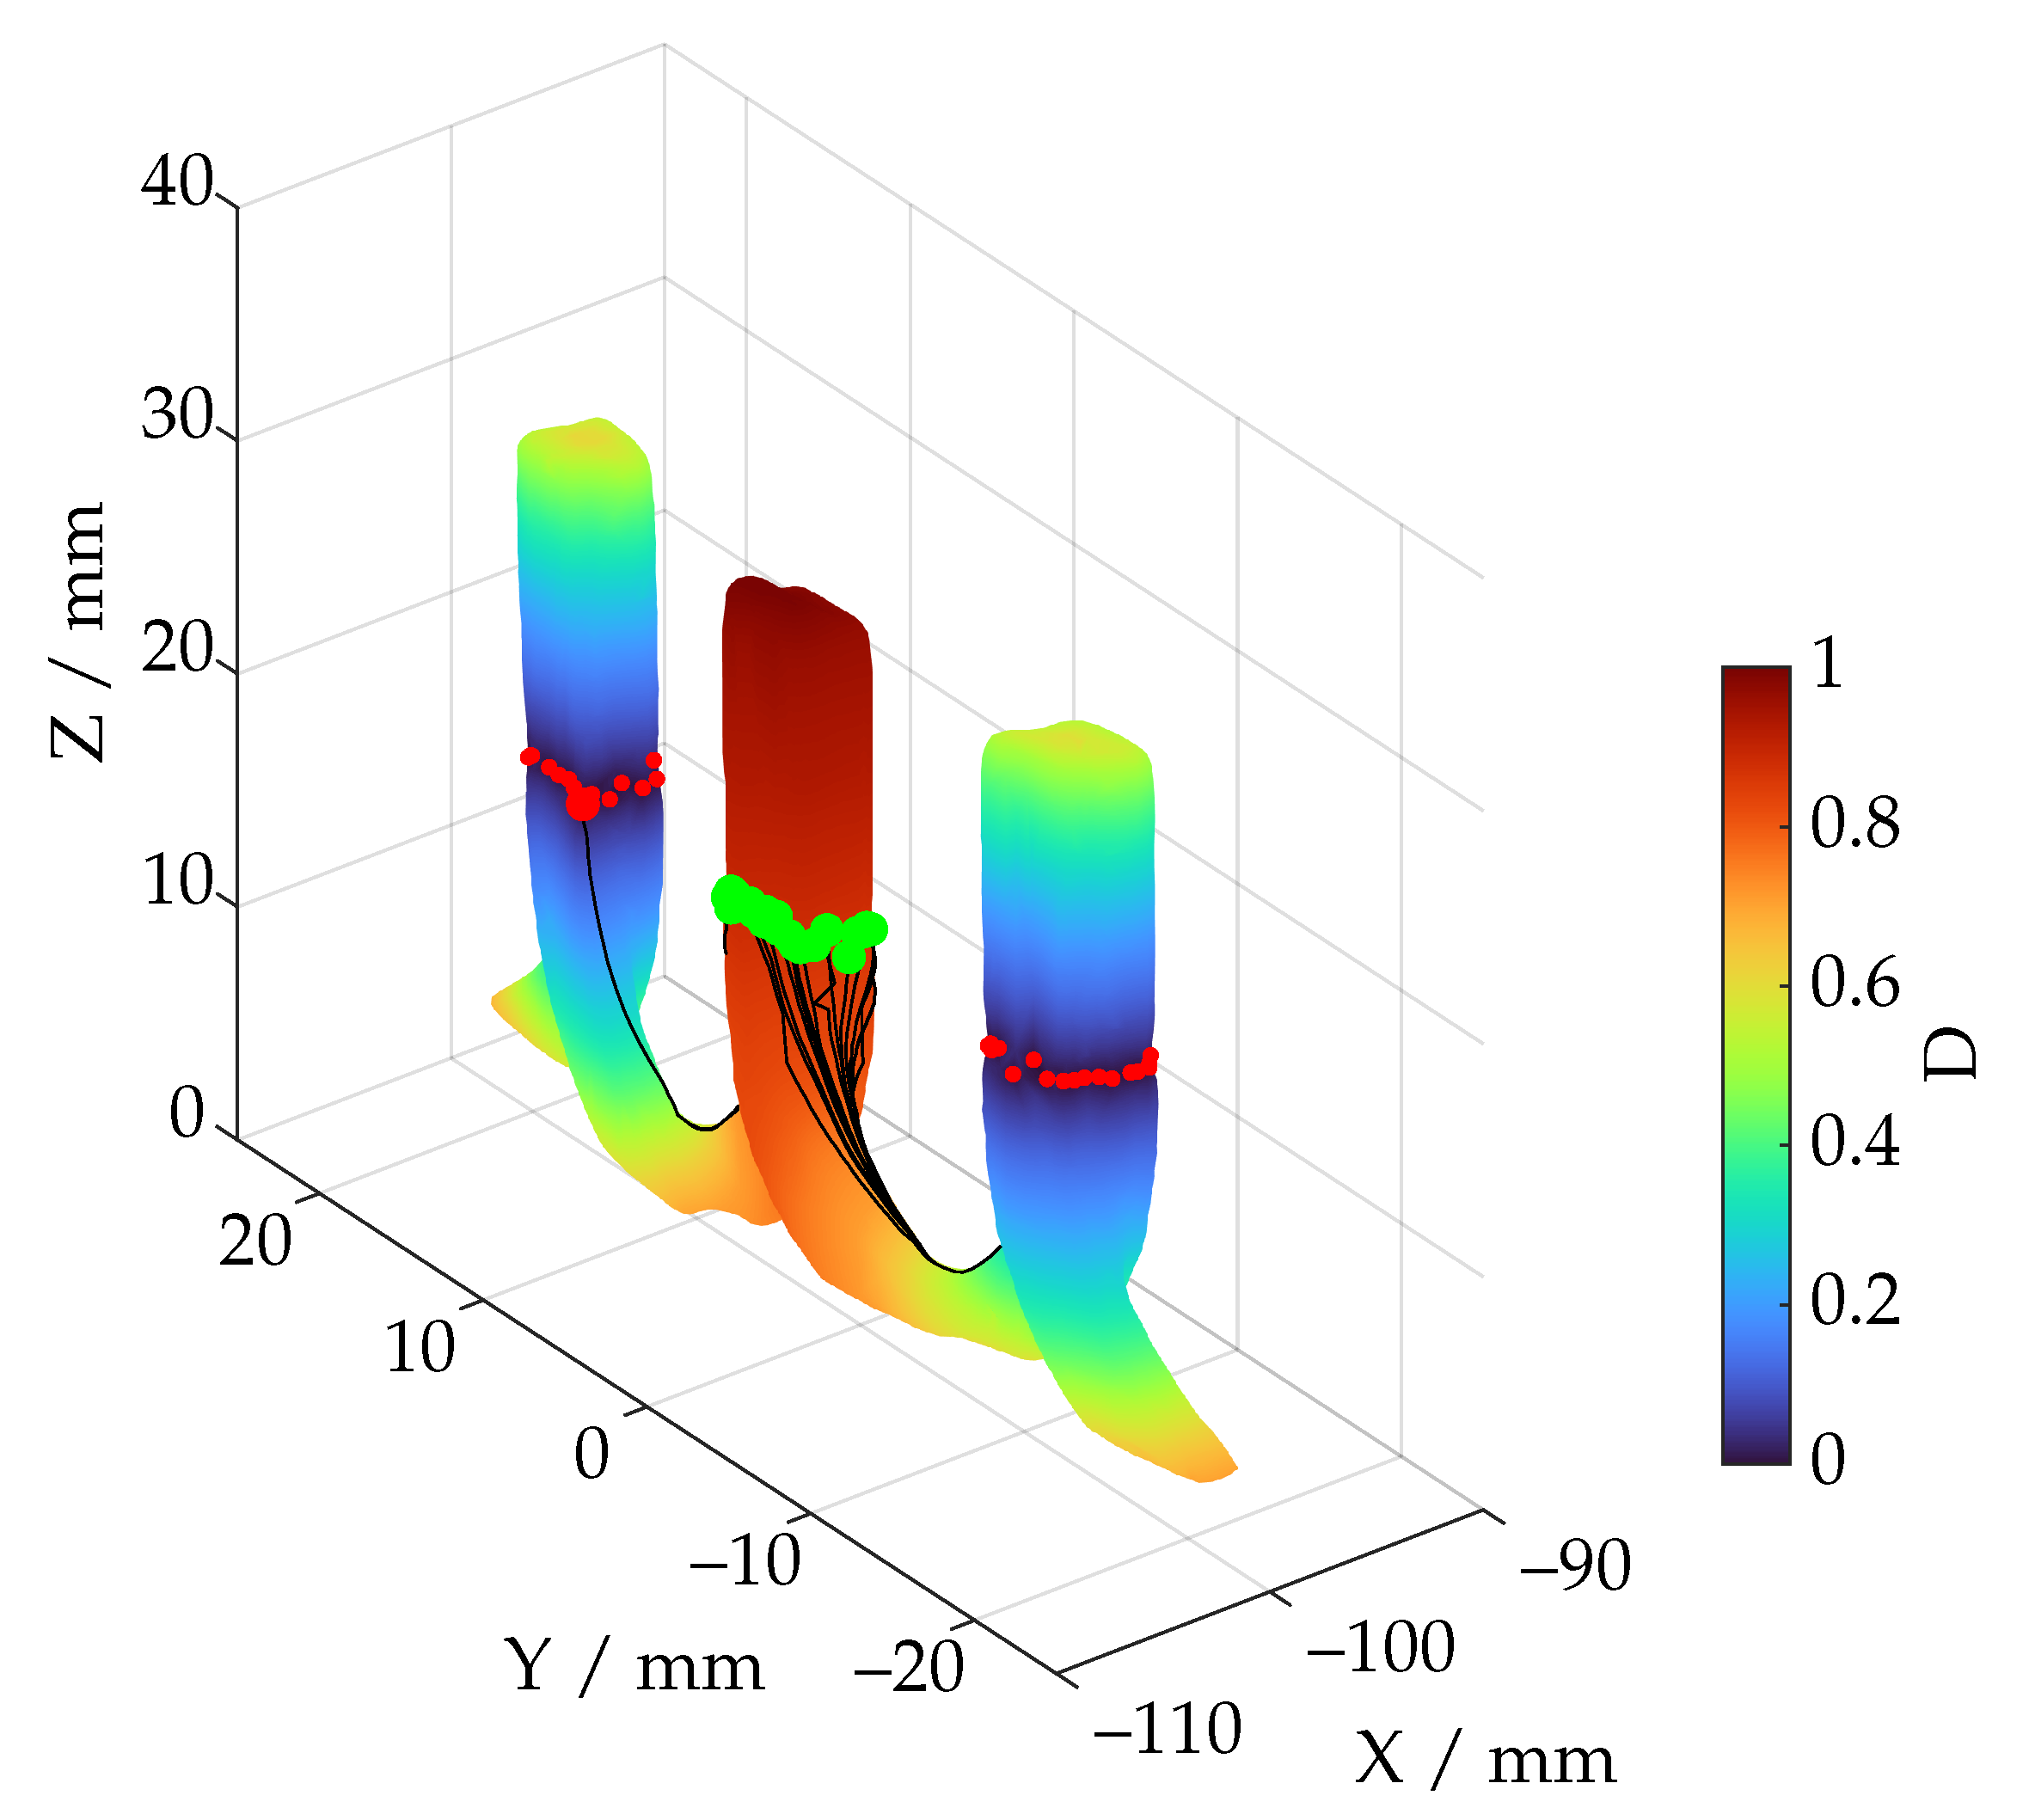
The process is visualized in
Figure 10 for a pair of wires, where, initially, the fast marching mesh front propagation [
44] is used to determine the distance function
D for all starting points (green) followed by the estimation of the geodesic distance [
45], which is visualized with black curves.
For further computational acceleration, the number of edge vertex correspondences to be computed is reduced via further neighbourhood classifications and rangesearch operations, and the mesh is trimmed for each search operation (refer
Figure 10), which, however, is not further elaborated here. In total, the computation time amounts to about 20 min with about 2.4 million polygons and 12,500 edge vertices (start resp. end points). All data processing operations were implemented using MATLAB (The MathWorks, Inc., Natick, MA, USA). Further reductions of the processing time, for example, by more efficient vectorizations or GPU implementations, are feasible. All neighbourhood searches were based on the data structure of the fast k-d search tree [
38], although more efficient search tree structures or queries are possible.
6. Results
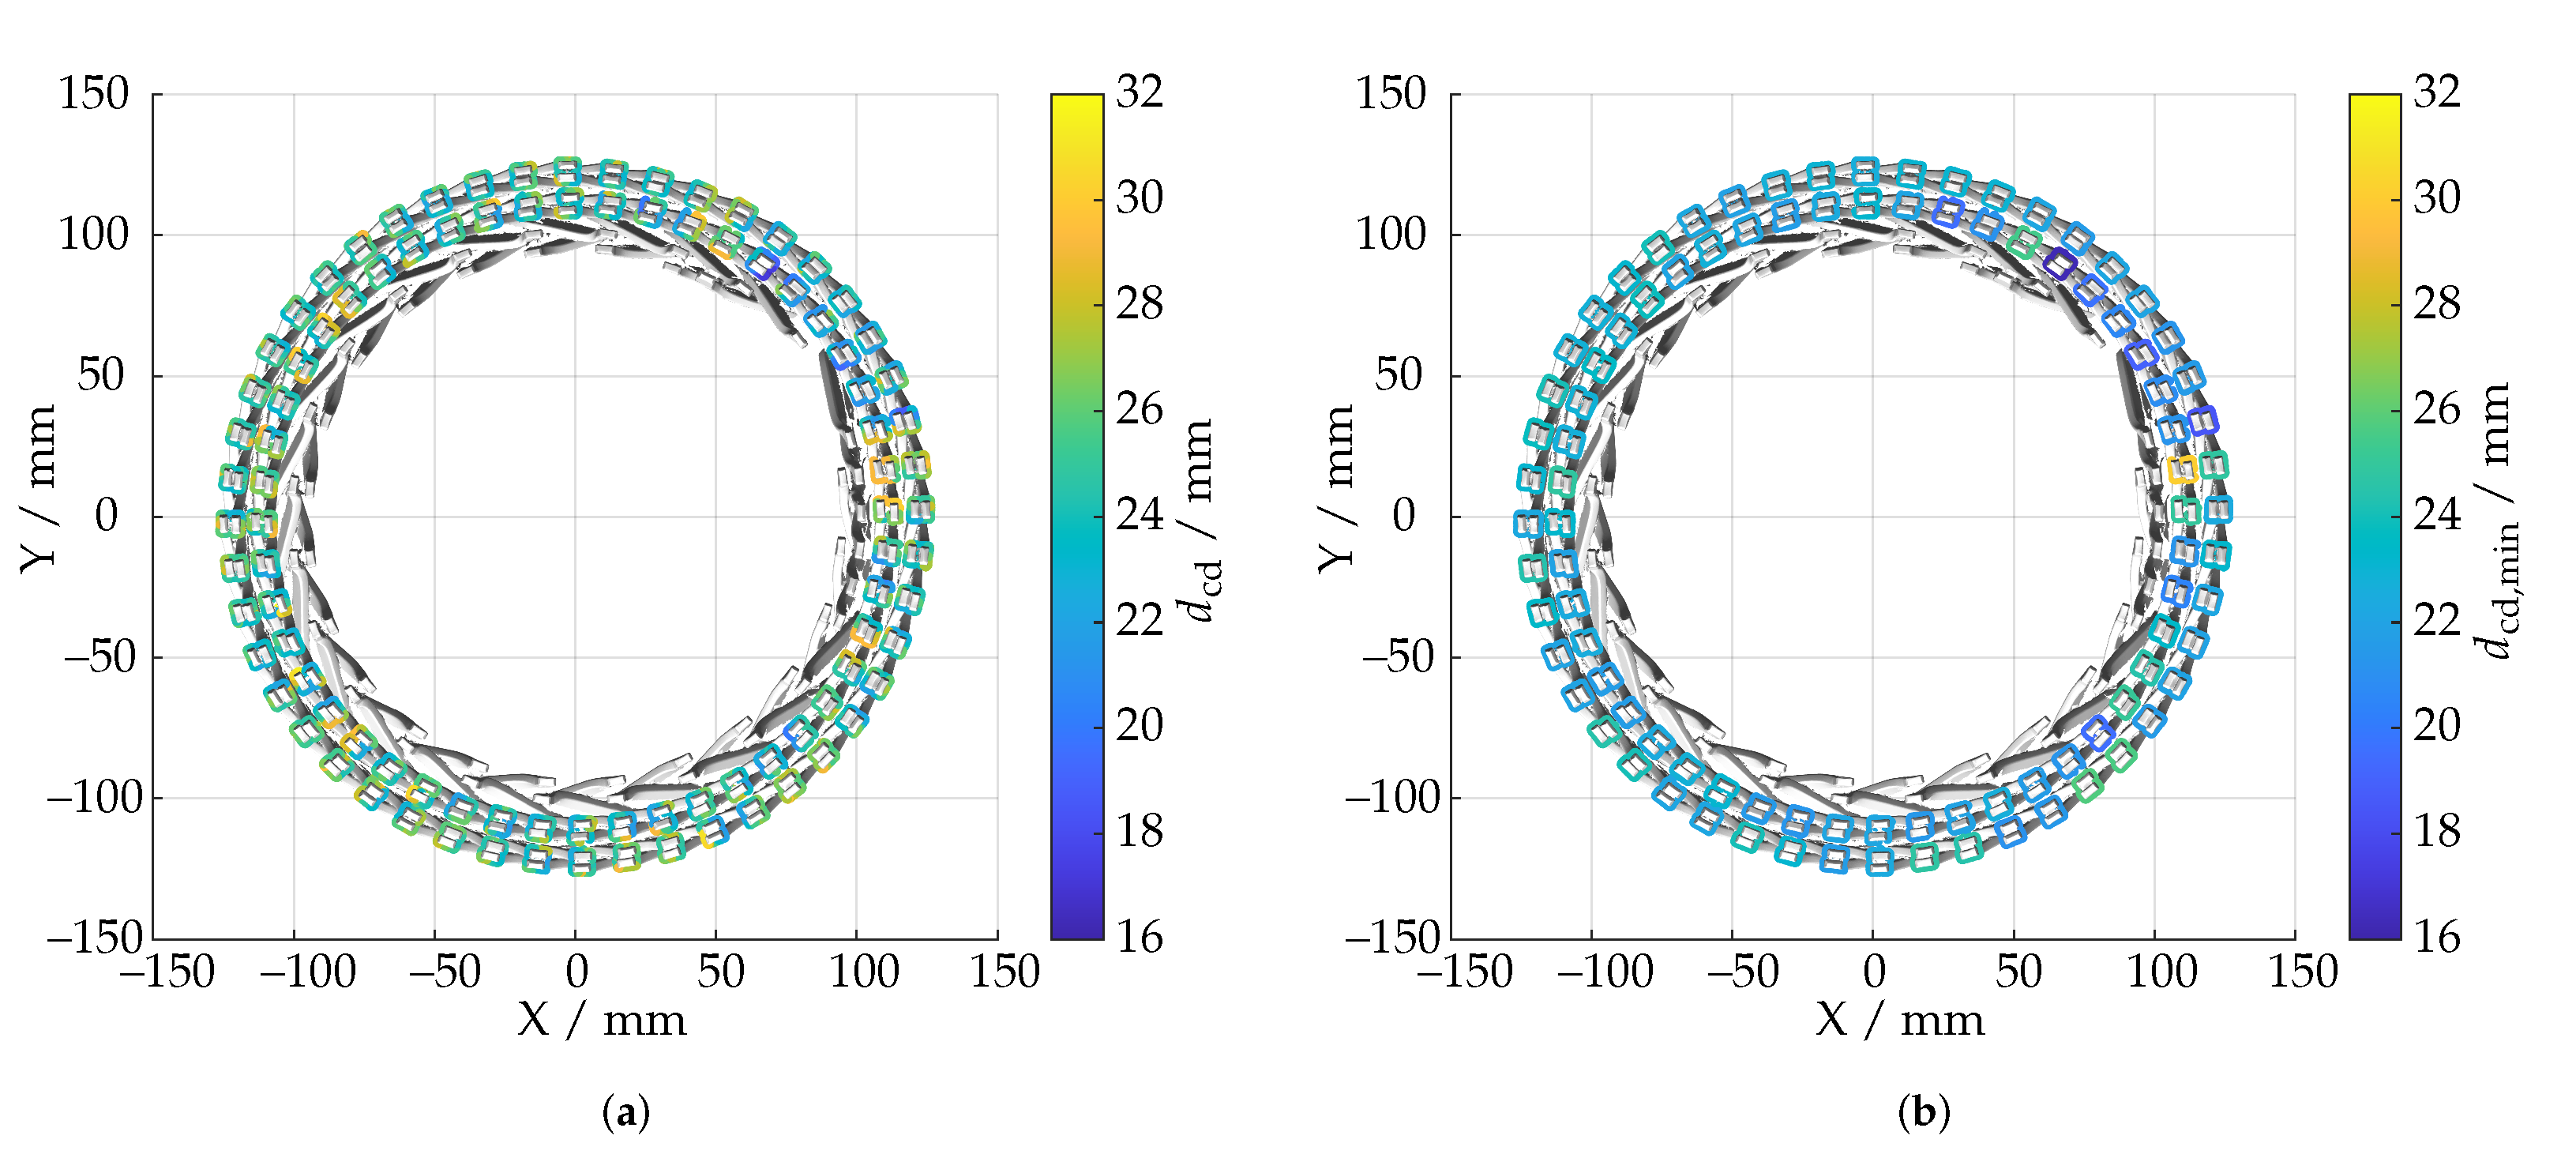
The following section presents the results of the proposed method applied to the conducted measurements. After assessing the stripping edge, the creepage distance is estimated for the whole stator and is visualised in
Figure 11a. In addition,
Figure 11b shows the minimal values for the creepage distance that are further considered to assess the feature since they are more relevant when investigating the potential leakage current.
On closer inspection, at
Figure 11b, one cluster exhibits an abnormally high creepage distance with
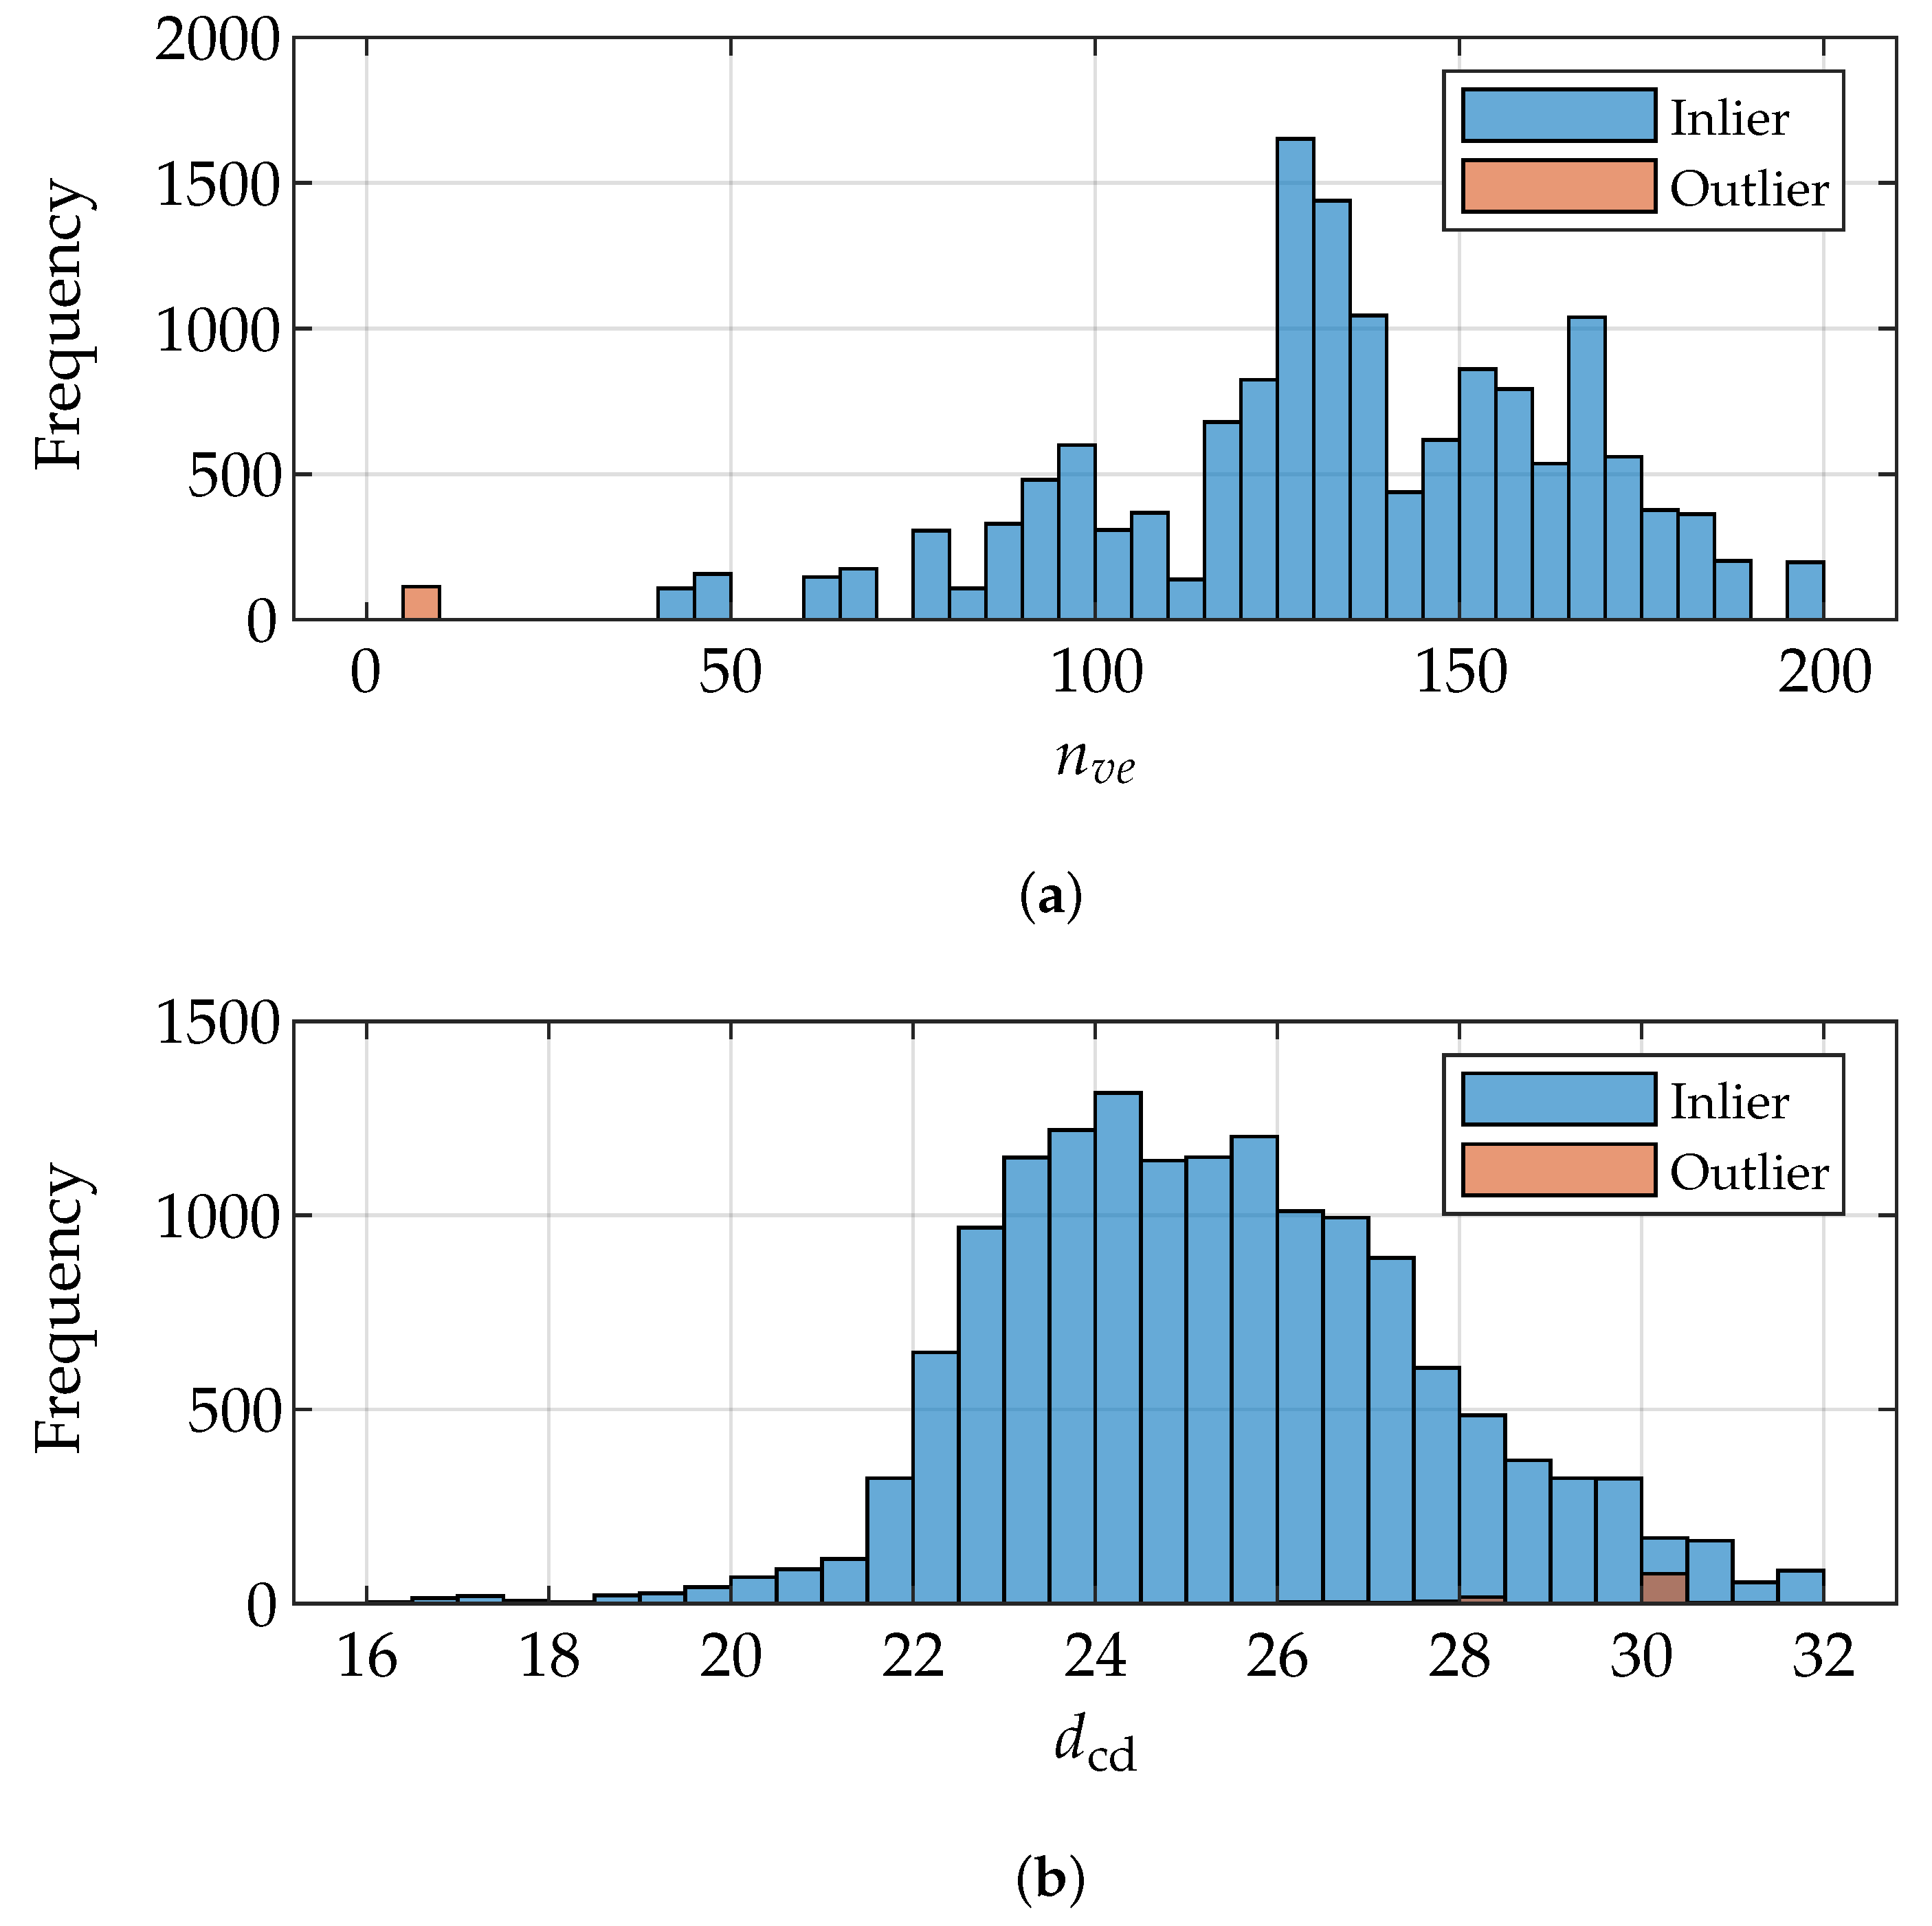
mm. This observation motivated a further analysis to attempt to evaluate whether the assessed value for the feature represents an outlier or an inlier. One possible cause for excessive creepage distances is an incomplete mesh with many holes, which is likely due to faulty reconstruction during data acquisition, e.g., shading effects. Therefore, according to
Figure 12a, the total number of geodetic edge vertices
of each cluster is examined. A low number of geodetic edge vertices indicates that either the stripping edge itself was incompletely reconstructed or, more likely, the geodetic path of all vertices corresponds to one or very few edge vertices of an adjacent stripping edge.
This may indicate that the mesh contains holes or other errors and that the path was presumably estimated as overly long. The results are shown in
Figure 12, where the data of the probable outlier are marked in orange. The supposed outlier is transferred to the creepage distance of all geodesic edge vertices
(
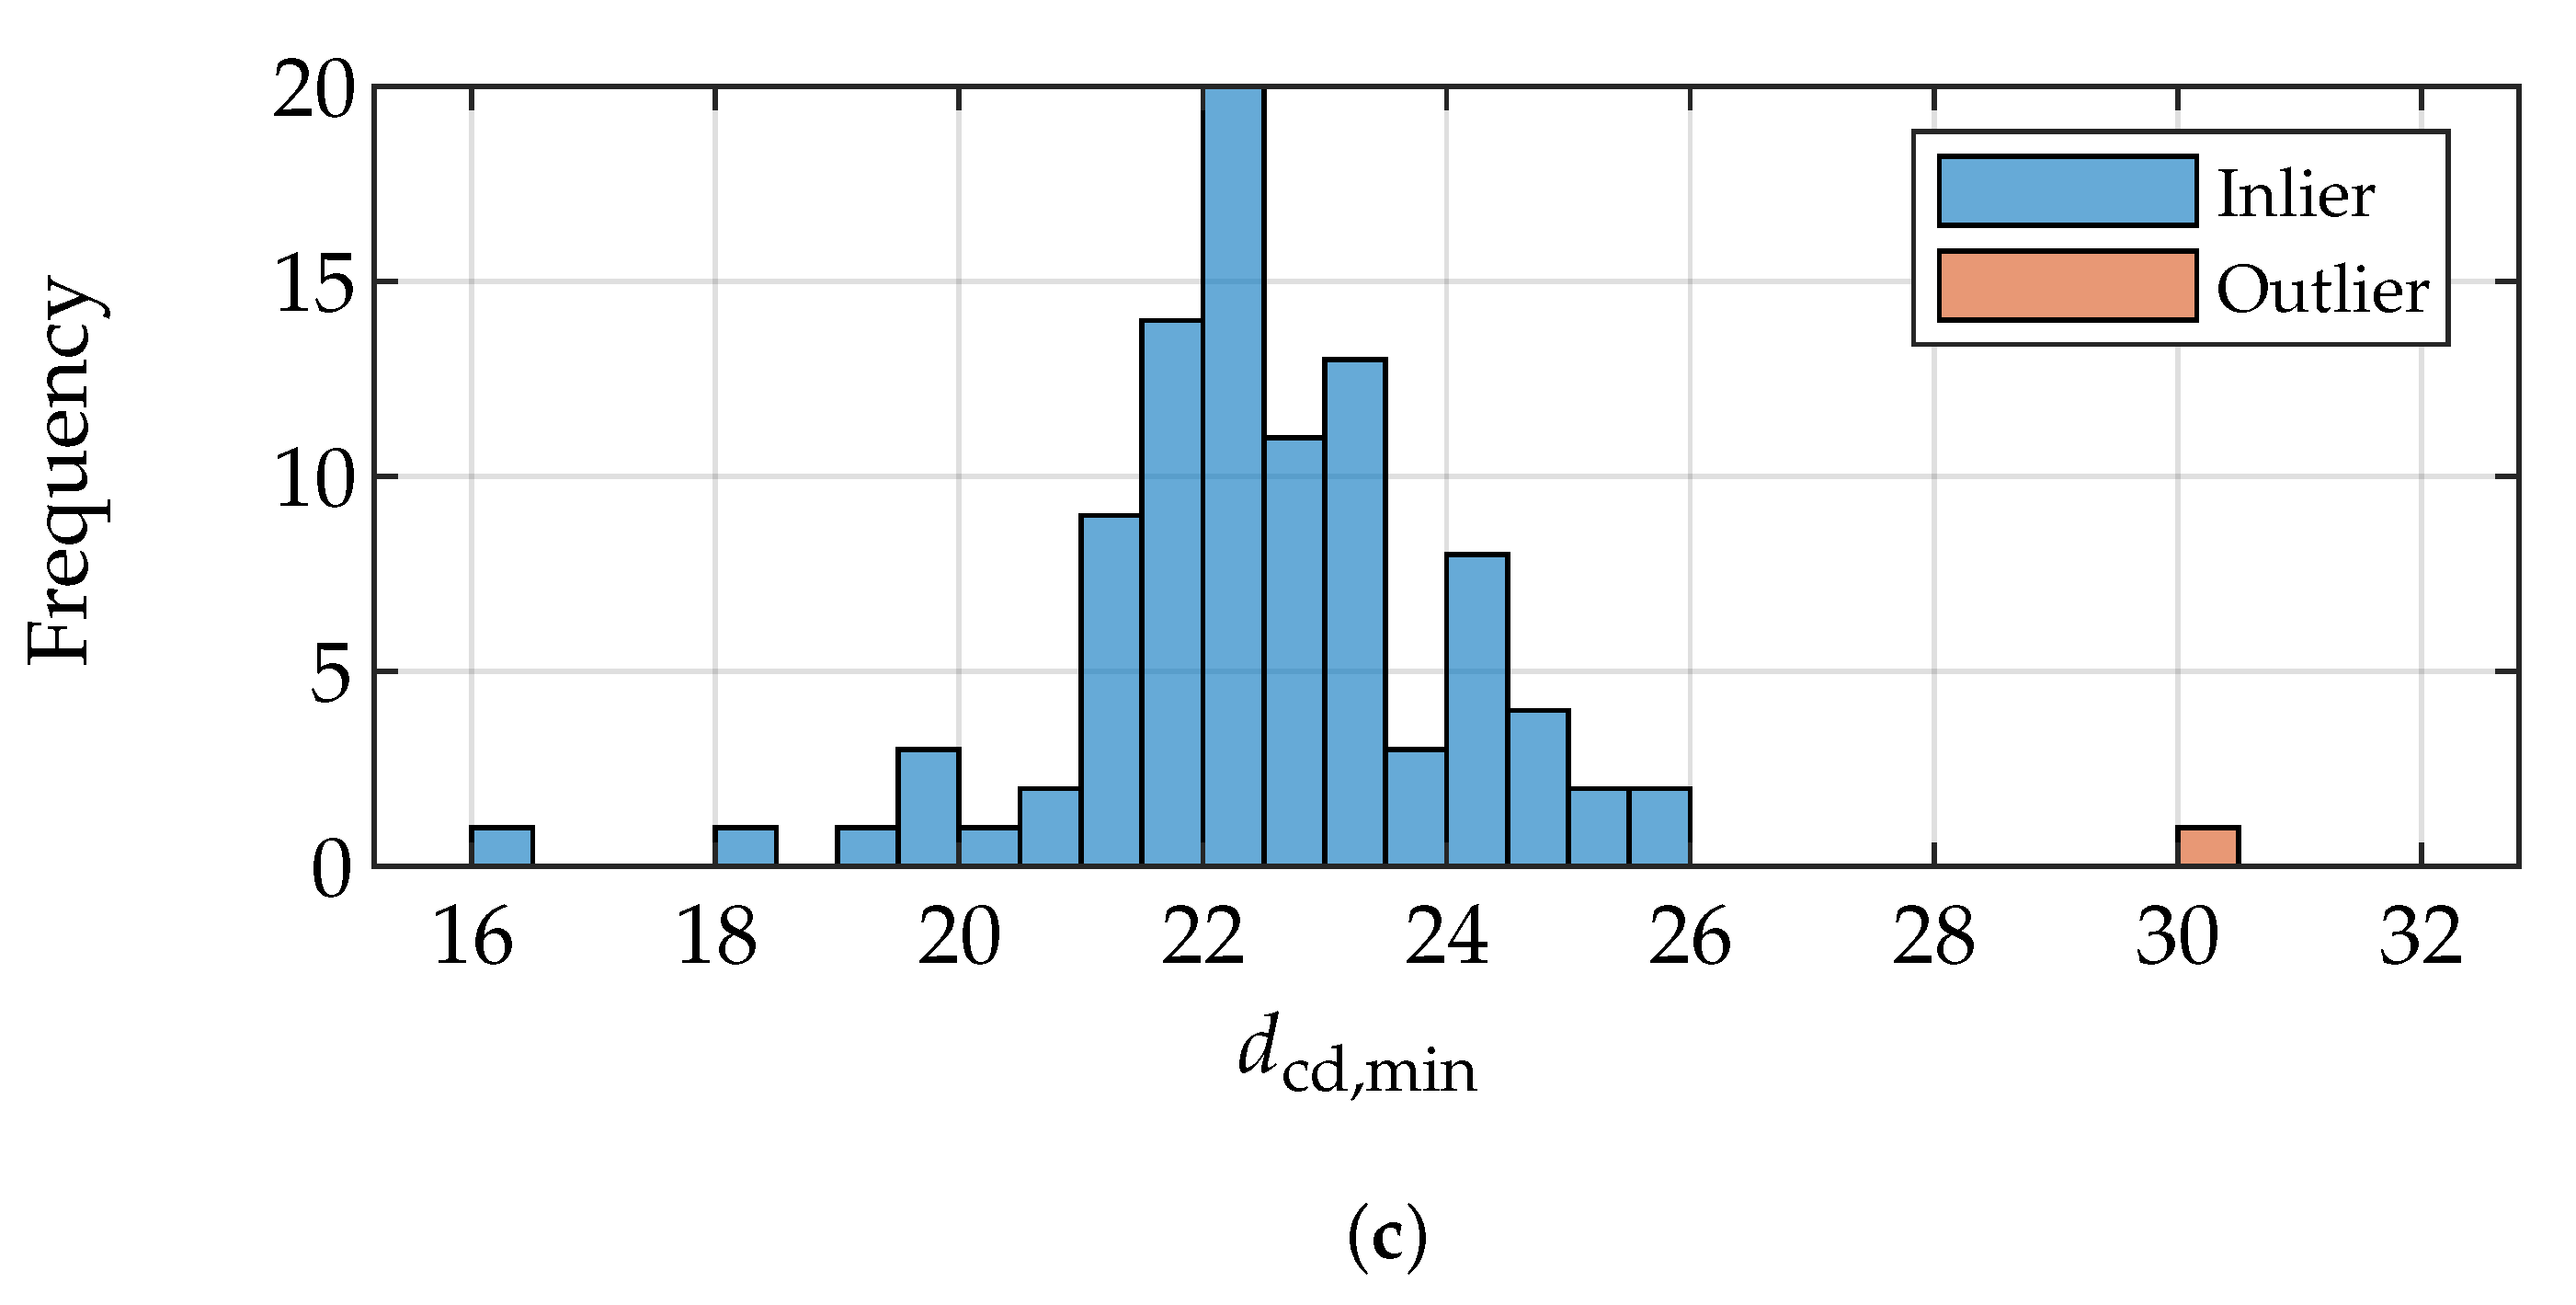
Figure 12b) as well as the minimum creepage distance
of each cluster, according to
Figure 12c. The results demonstrate that an estimation of plausible or implausibly determined creepage distances is feasible with this approach.
7. Discussion
The work conducted in this study and the results presented demonstrate that automated and accurate quantification of the creepage distance in electric motor stators is possible. For all clustered wire pairs, the creepage distance could be estimated. Although the vast majority of the results show comparable values representing the feature, an outlier can be observed by visually inspecting
Figure 11b. This motivated the further analysis that is presented in
Figure 12. To identify possible outliers only by interpreting
Figure 12b,c seems challenging. However, the results evaluated in
Figure 12a allow the outlier to be determined due to a very low number of vertices that are considered to estimate the creepage distance. Through combining with the previous results, the outliers can be neglected for further evaluation.
However, it should be noted that this approach requires a complete and seamlessly meshed surface model for precise estimation of the creepage distance. In the case of a faulty mesh, the creepage distance is estimated to be too long and, therefore, harmless from a safety point of view. Thus, it should be mentioned that, in its current form, even with the introduced outlier identification, the actual structure and condition of the mesh is not further evaluated. Further investigations and algorithmic improvements are, therefore, possible to improve the precision and robustness of the approach.
As there were no comparable solutions available on the market until now, the implementation leads to advantages within the quality assurance process and, in consequence, helps to improve the product quality. However, this also results in the inability to validate the approach and compare it with reference data.
The proposed method offers the ability for extensive evaluation of manufactured hairpin stators regarding absolute measurements of the creepage distance as well as the variance of the feature over each wire pair. Due to the fact that the length of the creepage distance influences the characteristics of the electrical machine [
46], an increased precision in measuring the feature allows optimizations in the design process. Although other product features are evaluated within the supplied software of the measurement system producer, the proposed method has the feasibility for a simple integration within the automated inspection cycle. However, raising the efficiency in the quality assurance process and, furthermore, integrating novel approaches, which results in a higher precision of determining features, leads to great value for manufacturing companies.
8. Conclusions
Within this work, a novel approach was proposed to provide the estimation of the creepage distance of hairpin stators. Using a fringe projection sensor, the 3D-geometry was reconstructed for further processing. Multiple steps for data processing were used mainly to align the measured part and cluster the wires. In the cluster analysis, the relevant points to estimate the creepage distance were located and extracted.
Finally, the geodesic distance was implemented to assume the creepage distance. The evaluation on experimental data showed promising results, and the discussion already mentioned some important components where further development is needed. Furthermore, we emphasize that the proposed approach has feasibility for integration within the automatic quality assurance process.
9. Further Research
Although we have shown the principal functionality of the method as well as promising results, various aspects can be addressed in further research. An integration in the quality assurance process offers the opportunity for acquiring a large quantity of data and, therefore, a profound evaluation of the proposed approach. This evaluation could include an analysis on the robustness regarding interferences and different types of stators. In order to analyse the accuracy of our method more extensively, it is crucial to include reference measurements for the creepage distance itself in the conducted measurements.
In addition, algorithmic or conceptual improvements are possible with respect to the concept presented in this study. First, it is worth investigating whether another metrological approach can possibly be pursued as an essential alternative to fringe projection profilometry. In particular, focus variation metrology should be considered in this context. However, it operates on a significantly smaller scale and can, accordingly, reconstruct only a very small part of the surface, which necessitates a combination with an appropriate positioning system for complete data acquisition from various individual measurements.
Advantageously, by omitting a triangulation basis, shadowing effects can be significantly reduced, and the reconstructed and meshed surface model presumably contains fewer holes. Furthermore, optical cooperativity (for example, by matting spray) does not need to be ensured in the same form, since the measurement principle is, in particular, more robust against effects, such as multiple reflections. Due to the smaller scale, a higher lateral and axial resolution can additionally be assumed.
An adapted inspection setup would also provide better and faster automatability as well as direct data prealignment by identifying all relevant kinematic relationships during system calibration. Although vectorized, precompiled or GPU-supported algorithms have been widely applied, further runtime improvements are certainly possible in order to not exceed a total inspection time in combination with a possible positioning setup and acquisition procedure.
Algorithmically, further improvements are feasible, including, in particular, mesh post-processing (such as the closing of holes) or the improved determination of the stripping edge height, which is of considerable importance in the case of diagonal stripping edges. Furthermore, additional quality metrics can assess the quality of the underlying mesh; thus, the accuracy of each reconstructed creepage distance can be developed to further improve the robustness and informative value of the inspection approach.
Author Contributions
Review of the state of the art, N.G.; Conceptualization, N.G.; methodology, N.G. and L.H.; software, L.H.; validation, N.G.; formal analysis, N.G.; investigation, N.G.; resources, N.G. and L.H.; data curation, N.G.; writing—original draft preparation, N.G.; writing—review and editing, L.H.; visualization, L.H.; supervision, L.H., C.B., J.K. and E.R.; project administration, N.G. All authors have read and agreed to the published version of the manuscript.
Funding
This research received no external funding.
Data Availability Statement
The measurements conducted to evaluate the proposed method come from a cooperation with an industry partner. Due to data confidentiality, the original geometry data cannot be provided. However, it is possible to provide artificial, manipulated geometry data upon request. The modifications made are not relevant for the methods presented herein.
Acknowledgments
We would like to thank Alexander Chugreev (Robert Bosch GmbH, Hildesheim, Germany) who supported this work during data acquisition. Furthermore, we want to thank Axel Vick (Fraunhofer Institute for Production Systems and Design Technology IPK, Berlin, Germany) for their valuable contribution.
Conflicts of Interest
The authors declare no conflict of interest.
Abbreviations
The following abbreviations are used in this manuscript:
| EV | Electric vehicles |
| GPU | Graphics processing unit |
| NN | Nearest neighbour |
| STL | Standard triangle language |
| PC | Point cloud |
| CD | Creepage distance |
References
- IEA. Global EV Outlook 2021. IEA: Paris, France, 14 December 2021; Available online: https://www.iea.org/reports/global-ev-outlook-2021 (accessed on 28 April 2023).
- Kampker, A. Elektromobilproduktion; Springer: Berlin/Heidelberg, Germany, 2014. [Google Scholar]
- Glaessel, T.; Seefried, J.; Franke, J. Challenges in the manufacturing of hairpin windings and application opportunities of infrared lasers for the contacting process. In Proceedings of the 2017 Seventh International Electric Drives Production Conference (EDPC), Würzburg, Germany, 5–6 December 2017; pp. 1–7. [Google Scholar] [CrossRef]
- Kampker, A.; Vallée, D.; Schnettler, A. Elektromobilität: Grundlagen Einer Zukunftstechnologie; Springer: Berlin/Heidelberg, Germany, 2018. [Google Scholar]
- Mayr, A.; Röll, P.; Winkle, D.; Enzmann, M.; Bickel, B.; Franke, J. Data-driven quality monitoring of bending processes in hairpin stator production using machine learning techniques. Procedia CIRP 2021, 103, 256–261. [Google Scholar] [CrossRef]
- Kampker, A.; Heimes, H.H.; Dorn, B.; Brans, F.; Stäck, C. Challenges of the continuous hairpin technology for production techniques. Energy Rep. 2023, 9, 107–114. [Google Scholar] [CrossRef]
- Kampker, A.; Treichel, P.; Kreisköther, K.D.; Krebs, M.; Büning, M.K. Ex-Ante Process-FMEA for Hairpin Stator Production by Early Prototypical Production Concepts. In Proceedings of the 2018 Eighth International Electric Drives Production Conference (EDPC), Schweinfurt, Germany, 4–5 December 2018; pp. 1–8. [Google Scholar] [CrossRef]
- Riedel, A.; Masuch, M.; Weigelt, M.; Gläßel, T.; Kühl, A.; Reinstein, S.; Franke, J. Challenges of the Hairpin Technology for Production Techniques. In Proceedings of the 2018 21st International Conference on Electrical Machines and Systems (ICEMS), Jeju, Republic of Korea, 7–10 October 2018; pp. 2471–2476. [Google Scholar] [CrossRef]
- Berardi, G.; Nategh, S.; Bianchi, N.; Thioliere, Y. A Comparison Between Random and Hairpin Winding in E-mobility Applications. In Proceedings of the IECON 2020 The 46th Annual Conference of the IEEE Industrial Electronics Society, Singapore, 18–21 October 2020; pp. 815–820. [Google Scholar] [CrossRef]
- Dimier, T.; Cossale, M.; Wellerdieck, T. Comparison of Stator Winding Technologies for High-Speed Motors in Electric Propulsion Systems. In Proceedings of the 2020 International Conference on Electrical Machines (ICEM), Gothenburg, Sweden, 23–26 August 2020; Volume 1, pp. 2406–2412. [Google Scholar] [CrossRef]
- Arzillo, A.; Braglia, P.; Nuzzo, S.; Barater, D.; Franceschini, G.; Gerada, D.; Gerada, C. Challenges and Future opportunities of Hairpin Technologies. In Proceedings of the 2020 IEEE 29th International Symposium on Industrial Electronics (ISIE), Delft, The Netherlands, 17–19 June 2020; pp. 277–282. [Google Scholar] [CrossRef]
- Damle, T.; Park, C.; Ding, J.; Cheetham, P.; Bosworth, M.; Steurer, M.; Cuzner, R.; Graber, L. Experimental setup to evaluate creepage distance requirements for shipboard power systems. In Proceedings of the 2019 IEEE Electric Ship Technologies Symposium (ESTS), Washington, DC, USA, 14–16 August 2019; pp. 317–323. [Google Scholar] [CrossRef]
- Gavranić, I.; Vražić, M.; Sumina, D. New approach in electrical drives at risk of explosive atmospheres. In Proceedings of the 2015 International Conference on Electrical Drives and Power Electronics (EDPE), Tatranska Lomnica, Slovakia, 21–23 September 2015; pp. 142–147. [Google Scholar] [CrossRef]
- Hinz, L.; Metzner, S.; Müller, P.; Schulte, R.; Besserer, H.B.; Wackenrohr, S.; Sauer, C.; Kästner, M.; Hausotte, T.; Hübner, S.; et al. Fringe Projection Profilometry in Production Metrology: A Multi-Scale Comparison in Sheet-Bulk Metal Forming. Sensors 2021, 21, 2389. [Google Scholar] [CrossRef] [PubMed]
- Du-Bar, C.; Mann, A.; Wallmark, O.; Werke, M. Comparison of Performance and Manufacturing Aspects of an Insert Winding and a Hairpin Winding for an Automotive Machine Application. In Proceedings of the 2018 Eighth International Electric Drives Production Conference (EDPC), Schweinfurt, Germany, 4–5 December 2018; pp. 1–8. [Google Scholar] [CrossRef]
- Eilenberger, D.A. In Proceedings of the High Efficient Electric Motors with Bar Windings for Serial Production, Vienna, Austria, 26–27 April 2018.
- Glaessel, T.; Seefried, J.; Masuch, M.; Riedel, A.; Mayr, A.; Kuehl, A.; Franke, J. Process Reliable Laser Welding of Hairpin Windings for Automotive Traction Drives. In Proceedings of the 2019 International Conference on Engineering, Science, and Industrial Applications (ICESI), Tokyo, Japan, 22–24 August 2019; pp. 1–6. [Google Scholar] [CrossRef]
- Gläßel, T.; Franke, J. Kontaktierung von Antrieben für die Elektromobilität—Innovative Vorgehensweisen, Prozessketten und Technologien. Z. Für Wirtsch. Fabr. 2017, 112, 322–326. [Google Scholar] [CrossRef]
- Hartung, J.; Jahn, A.; Bocksrocker, O.; Heizmann, M. Camera-Based In-Process Quality Measurement of Hairpin Welding. Appl. Sci. 2021, 11, 375. [Google Scholar] [CrossRef]
- Mayr, A.; Hauck, L.; Meiners, M.; Franke, J. Prediction of the Joint Cross-Section of Laser-Welded Hairpin Windings Based on 2D Image Data Using Convolutional Neural Networks. In Proceedings of the 2020 tenth International Electric Drives Production Conference (EDPC), Ludwigsburg, Germany, 8–9 December 2020; pp. 1–7. [Google Scholar] [CrossRef]
- Vater, J.; Schamberger, P.; Knoll, A.; Winkle, D. Fault Classification and Correction based on Convolutional Neural Networks exemplified by laser welding of hairpin windings. In Proceedings of the 2019 ninth International Electric Drives Production Conference (EDPC), Esslingen, Germany, 3–4 December 2019; pp. 1–8. [Google Scholar] [CrossRef]
- Vater, J.; Kirschning, M.; Scheurenberg, D.; Abel, D.; Knoll, A. Development of a Cloud- and Edge-Architecture for adaptive model weight optimization of a CNN exemplified by optical detection of hairpin welding. In Proceedings of the 2020 tenth International Electric Drives Production Conference (EDPC), Ludwigsburg, Germany, 8–9 December 2020; pp. 1–7. [Google Scholar] [CrossRef]
- Yu, F.; Luo, H.; Lu, Z.; Wang, P. 3D Model Feature Extraction. In Three-Dimensional Model Analysis and Processing; Springer: Berlin/Heidelberg, Germany, 2010; pp. 161–235. [Google Scholar] [CrossRef]
- Harmatys, W.; Gąska, P.; Gąska, A.; Gruza, M.; Jedynak, M.; Kobiela, K.; Marxer, M. Applicability Assessment of Different Materials for Standards Ensuring Comparability of Optical and Tactile Coordinate Measurements. Materials 2022, 15, 4128. [Google Scholar] [CrossRef] [PubMed]
- Urbas, U.; Zorko, D.; Vukašinović, N.; Černe, B. Comprehensive Areal Geometric Quality Characterisation of Injection Moulded Thermoplastic Gears. Polymers 2022, 14, 705. [Google Scholar] [CrossRef] [PubMed]
- Feng, H.; Xukai, R.; Li, L.; Zhang, X.; Chen, H.; Chai, Z.; Chen, X. A novel feature-guided trajectory generation method based on point cloud for robotic grinding of freeform welds. Int. J. Adv. Manuf. Technol. 2021, 115, 1763–1781. [Google Scholar] [CrossRef]
- Li, L.; Li, C.; Tang, Y.; Du, Y. An integrated approach of reverse engineering aided remanufacturing process for worn components. Robot.-Comput.-Integr. Manuf. 2017, 48, 39–50. [Google Scholar] [CrossRef]
- Wang, X.; Zhang, X.; Xukai, R.; Li, L.; Feng, H.; He, Y.; Chen, H.; Chen, X. Point cloud 3D parent surface reconstruction and weld seam feature extraction for robotic grinding path planning. Int. J. Adv. Manuf. Technol. 2020, 107, 827–841. [Google Scholar] [CrossRef]
- Zhao, X.; Li, Q.; Xiao, M.; He, Z. Defect detection of 3D printing surface based on geometric local domain features. Int. J. Adv. Manuf. Technol. 2022, 125, 183–194. [Google Scholar] [CrossRef]
- Arc Welding Robot Small/Medium Size Robot. Available online: https://www.fanuc.co.jp/en/product/robot/f_r_arc.html#arcmate100id (accessed on 28 April 2023).
- Atos 5: High-Speed 3D Scanning: For Industrial Demands. Available online: https://www.gom.com/de-de/produkte/hochpraezise-3d-messtechnik/atos-5 (accessed on 28 April 2023).
- Smith, I. LSGE: The Least Squares Geometric Elements library. In Centre for Mathematics and Scientific Computing; Technical Report; National Physical Laboratory: Middlesex, UK, 2004. [Google Scholar]
- Schmidt, J.; Niemann, H. Using Quaternions for Parametrizing 3-D Rotations in Unconstrained Nonlinear Optimization. In Proceedings of the Vision Modeling and Visualization Conference 2001 (VMV-01), Stuttgart, Germany, 21–23 November 2001. [Google Scholar]
- Levenberg, K. A method for the solution of certain problems in least squares. Quaterly J. Appl. Math. 1944, 2, 164–168. [Google Scholar] [CrossRef]
- Marquardt, D.W. An Algorithm for Least-Squares Estimation of Nonlinear Parameters. J. Soc. Ind. Appl. Math. 1963, 11, 431–441. [Google Scholar] [CrossRef]
- Moré, J.J. The Levenberg–Marquardt algorithm: Implementation and theory. In Numerical Analysis; Watson, G.A., Ed.; Springer: Berlin/Heidelberg, Germany, 1978; pp. 105–116. [Google Scholar]
- Ester, M.; Kriegel, H.P.; Sander, J.; Xu, X. A Density-Based Algorithm for Discovering Clusters in Large Spatial Databases with Noise. In Proceedings of the Second International Conference on Knowledge Discovery and Data Mining, Portland, OR, USA, 2–4 August 1996; AAAI Press: Washington, DC, USA, 1996. KDD’96. pp. 226–231. [Google Scholar]
- Friedman, J.H.; Bentley, J.L.; Finkel, R.A. An Algorithm for Finding Best Matches in Logarithmic Expected Time. ACM Trans. Math. Softw. 1977, 3, 209–226. [Google Scholar] [CrossRef]
- Bentley, J.L. Multidimensional binary search trees used for associative searching. Commun. ACM 1975, 18, 509–517. [Google Scholar] [CrossRef]
- Osada, R.; Funkhouser, T.; Chazelle, B.; Dobkin, D. Shape Distributions. ACM Trans. Graph. 2002, 21, 807–832. [Google Scholar] [CrossRef]
- Hinz, L.; Kästner, M.; Reithmeier, E. Metal Forming Tool Monitoring Based on a 3D Measuring Endoscope Using CAD Assisted Registration. Sensors 2019, 19, 2084. [Google Scholar] [CrossRef] [PubMed]
- Hinz, L. In-Situ 3D Endoscopy Based on Fiber-Optic Fringe Projection Profilometry in Production Metrology. Ph.D. Thesis, Gottfried Wilhelm Leibniz Universität, Hannover, Germany, 2022. [Google Scholar] [CrossRef]
- Peyre, G. Toolbox graph. MATLAB Cent. File Exch. Sel. 2009, 2. Available online: https://de.mathworks.com/matlabcentral/fileexchange/5355-toolbox-graph (accessed on 28 April 2023).
- Peyré, G.; Cohen, L. Geodesic Remeshing Using Front Propagation. Int. J. Comput. Vis. 2006, 69, 145–156. [Google Scholar] [CrossRef]
- Peyré, G.; Péchaud, M.; Keriven, R.; Cohen, L. Geodesic Methods in Computer Vision and Graphics. Found. Trends Comput. Graph. Vis. 2010, 5, 197–397. [Google Scholar] [CrossRef]
- Braunbeck, F.; Schmack, T.; Reuss, H.C. Experimental Investigation of an Extrusion Profile for Slot Liner Insulation of an Electric Traction Machine with Winding Direct Cooling. In Proceedings of the 2022 12th International Electric Drives Production Conference (EDPC), Regensburg, Germany, 29–30 November 2022; pp. 1–6. [Google Scholar] [CrossRef]
| Disclaimer/Publisher’s Note: The statements, opinions and data contained in all publications are solely those of the individual author(s) and contributor(s) and not of MDPI and/or the editor(s). MDPI and/or the editor(s) disclaim responsibility for any injury to people or property resulting from any ideas, methods, instructions or products referred to in the content. |
© 2023 by the authors. Licensee MDPI, Basel, Switzerland. This article is an open access article distributed under the terms and conditions of the Creative Commons Attribution (CC BY) license (https://creativecommons.org/licenses/by/4.0/).


