Article

3D Model-Based Large-Volume Metrology Supporting Smart Manufacturing and Digital Twin Concepts

by
Richard P. Lindqvist
1,2,3,*,
Daniel Strand
2,
Mikael Nilsson
2,
Victor Collins
2,
Johan Torstensson
3,4,
Jonas Kressin
3,4,
Domenico Spensieri
3,4 and
Andreas Archenti
1
1
Department of Production Engineering, Manufacturing and Metrology Systems, KTH Royal Institute of Technology, Brinellvägen 68, 114 28 Stockholm, Sweden
2
Saab Aeronautics, Bröderna Ugglas Gata, 581 88 Linköping, Sweden
3
Wingquist Laboratory at Chalmers, 412 58 Gothenburg, Sweden
4
Fraunhofer-Chalmers Research Centre for Industrial Mathematics (FCC), 412 58 Gothenburg, Sweden
*
Author to whom correspondence should be addressed.
Metrology 2023, 3(1), 29-64; https://doi.org/10.3390/metrology3010002
Submission received: 30 September 2022 / Revised: 23 December 2022 / Accepted: 9 January 2023 / Published: 18 January 2023
(This article belongs to the Special Issue Advances in Portable 3D Measurement)

Abstract

:
New automated laser radar measurement systems at the Saab Inc. West Lafayette, USA, facility will make airframe assembly of the aft body for the new eT7-A aircraft a quicker, more cost-efficient process. Digital twin concepts realized through simulation and off-line programming show advantageous results when studying future state scenarios or investigating how a current large-volume dimensional metrology system acts and behaves. The aim of this exploration has been to examine how to facilitate the design and programming of automated laser radar concepts by means of novel simulation-based software. High-speed computing algorithms efficiently solve tasks and sequence problems related to many statistical combinatorial possibilities in calculations. However, this approach requires accurate and reliable models and digital twins that are continuously updated with real world data and information. In this paper, the main contributions are to create procedures to define the dimensional metrology workflow at Saab and to model and simulate the laser radar process, enhancing and tailoring existing offline programming software by specific new functionalities. A case study conducted at Saab Aeronautics premises in Linköping acted as a clinical laboratory to generate our research findings. The exploratory work indicates that a reliable simulation-based development method can be used advantageously in the early-stage design layout of automated dimensional metrology systems to verify and guarantee the line-of-sight of, e.g., a laser light path and its allowed inclinations to a specific geometrical feature to be measured, extracted, and evaluated.

1. Introduction

Over the past four years, a dimensional management and metrology team from Saab Aeronautics (from now on Saab) conducted internal and external studies and research activities to prepare new large-volume metrology implementations at a new airframe assembly factory in West Lafayette, IN, USA, Figure 1. This new “greenfield” factory is sized and scaled to produce airframe assemblies and system installations for the aft body for the new eT7-A, USAF, pilot training aircraft, [1,2]. For this purpose, at an early stage the Saab research and development team identified and tested the predecessor of the Nikon APDIS laser radar system, [3,4,5]. Experimental and physical performance tests were carried out at Saab premises in Linköping and multiple virtual concepts of automated laser radar measuring were developed and investigated. One of the early concept studies is shown in Figure 2.
A laser radar is a high-performance, high-precision, non-contact measurement system using two heterodyne infrared lasers. The functional description of the laser radar in an automated solution has previously been investigated by Kiraci et. al., in 2017 and has acted as an inspiration for our research [6]. In addition, the recently published papers by Vlaeyen et al. [7], Kortaberria et al. [8], and Salicone [9] have also acted as a source of inspiration and have triggered new innovative ideas for further exploration and future research activities.
One main benefit of laser radar metrology is that the sensors measure without physically touching the surface of the airframe structure. There are other important advantages. For example, the old way of manually measuring with porTable 3D metrology systems, e.g., laser trackers and CMM measuring arms equipped with 6-DoF probing and laser-scanning capabilities, took time that the eT7-A manufacturing process simply does not have. It was not too long ago that Saab introduced manual 3D measurement of design and process-critical dimensions and geometries on the Gripen aircraft [10] airframe assemblies, and that has worked well. However, the main drivers for the introduction of an advanced automated Laser Radar metrology system are quality, time, technology, and cost. It means that Saab will become quicker, more persistent, and achieve more precise measurements. This is a huge step forward for Saab Aeronautics advanced manufacturing solutions. It has also been difficult to find and train enough skilled measurement technicians for the manual work, partly because it is such a specialized discipline and partly because the task itself is long and repetitive. Using calibrated laser radar sensors, Saab can rely on the automated system for repeatability and reproducibility of the measurement results. It frees up skilled employees to focus instead on new product development.
The Swedish Innovation Agency, Vinnova, supports the research conducted in the Digi-Q (Digital Quality Assurance for Sustainable Industry) research project [11]. The purpose of the Digi-Q research project and the work package focusing on “Measuring cell configuration” is to start exploring the possibility in developing the IPS (Industrial Path Solutions) [12] software into a virtual planning, simulation, and off-line programming software package. This will support large-volume dimensional measurements using Laser Radar metrology, i.e., the creation of an accurate digital twin simulation environment. The IPS Inspection Path Planner module is developed by FCC (Fraunhofer-Chalmers Research Centre for Industrial Mathematics) [13]. It is a scientifically verified and validated math-based toolbox for geometry, motion, and path planning optimization and analysis. The Digi-Q “Measuring cell configuration” work package tests, verifies, and validates a coherent concept for automatic configuration, off-line programming, and optimization of a realizable metrological pilot plant in an industrial environment. Saab plans and implements the virtual metrology solution in the local workshop network. Saab provides 3D models of measuring sensor, linear control, rotary table, PLC, peripherals, fixture, and measuring object, i.e., the MPQP (Model based Process and Quality Planning) test artifact.

Problem Description and Identification of Research and Development Tasks

Currently a laser radar system is manually programmed on-line using the “teach-in” method, which is a difficult, time-consuming, and cumbersome process. The functionality of virtual planning, simulation, and off-line programming of Laser Radars is currently lacking in most commercially available 3rd party metrology planning and programming software packages, except for the iRobot simulation software from Metrologic [14]. Saab identified the need to explore and develop advanced simulation software that supports automated laser radar measurements. Therefore, compared to the previous work by Kiraci et al. in 2017 [6], the main focus of this work is to explore and create a virtual simulation and test environment where the measurement sensor, in the form of a laser radar, is modeled and integrated into the virtual simulation and programming environment. This will enable the creation of a virtual digital twin, which ultimately should mimic and mirror the behavior of the real physical existing asset.
The automatic process for virtual simulation and off-line programming of dimensional measurement systems has, in previous research and projects, been verified to result in 90% reduced programming time (from weeks to hours and minutes) and 25% faster measurement programs (increased throughput in the factory). The main vision and goal for the Saab dimensional management team is to fully digitize the dimensional management and metrology process. This enables off-site virtual and digital dimensional management, dimensional metrology, and dimensional deviation management communication. This means that new and updated measuring programs will be managed and carried out at Saab premises in Linköping and will be implemented at Saab factories around the world.
Measurement technology, specifically geometrical and dimensional metrology, is one of the foremost and largest enablers of the transition to smart manufacturing, also highlighted in [6,7,8,9]. Therefore, one important Saab requirement on the simulation software is that the software should be able to be seamlessly integrated and connected to any commercially available 3rd party 3D metrology software.

2. Background

The advent of digitalization has generated the concepts of digital twins (virtual versions of physical objects) [15,16,17,18] and digital threads (using digital tools and representations for design, evaluation, and life cycle management). This allows manufacturers to optimize in a virtual space what a part or product will look like before it is even physically realized. Simulation techniques are becoming increasingly important to the optimization of production processes. The digital product model must carry complete and unambiguous critical dimensional and geometrical information-form, fit, and functional requirements.
As early as 2008, previous research by Maropoulos et al. [19] highlighted these problems. In their paper, the authors propose and describe a generic methodology dealing with the theoretical definition of metrology process models and their systematic integration with design evaluation and assembly planning. The research resulted in the specification of a novel, theoretical framework for the specification and generation of metrology process models, particularly focused on large-volume metrology that is suitable for the verification of large and complex products.
Interoperability between system software packages is critical and has been explored and debated in the past 20 years. Here we want to highlight two important publications on interoperable dimensional metrology that were published by Zhao et al. in 2011 [20,21]. The book, [21], is an important fundamental scientific reference and source of inspiration in our continued research work.
Later, Salman et al. wrote the 2016 paper “An industrially validated CMM inspection process with sequence constraints” [22]. This presented an efficient process for inspection planning and programming. In this paper, researchers from FCC (Fraunhofer-Chalmers Research Centre for Industrial Mathematics) Geometry and Motion Planning research group in Sweden explained the fundamentals of path planning and sequence optimization using advanced, science-based algorithms. One fundamental problem in a production line usually consists of a set of tasks or operations that need to be accomplished by an agent. The tasks range from those relating to assembly such as welding, sealing, painting, and inspection. The agent can be an industrial robot provided with different types of tools or a Coordinate Measuring Machine (CMM), and even a human operator. The order in which these tasks are performed is the main contributor to the total process time and therefore it is crucial to minimize it in order to keep it under the critical cycle time that guarantees the designed throughput. These kinds of sequencing and ordering problems are historically modelled as TSPs (Travelling Salesman Problems). Solving large TSP instances often usually requires heuristic algorithms such as Ant Colony Optimization, Genetic Algorithms, and others [23,24]. The research project showed that the productivity of CMM inspection planning and the application of a structured inspection planning process, combined with automatic path planning, significantly improves measuring equipment and CMM efficiency. They also highlighted inspection sequence optimization as a key part of the improvement. Furthermore, they presented the HACS (Hybridized Ant Colony System) algorithm as capable of reducing cycle time by more than 10% on average compared with the SEG (Sequentially Expanding GTSP) solver. The results identified the need for developing heuristic algorithms and special purpose optimizing algorithms for the PCGTSP (Precedence Constrained Generalized Travelling Salesperson Problem). They also identified for some industrial cases a growing need for multiple CMMs to evaluate features on the same object which corresponded to expanding the PCGTSP to a precedence-constrained generalized multiple travelling salesperson problem (PCGmTSP).
Moving on to 2020, there were numerous research papers on model-based definition, model-based enterprise, and methodology development, together with a focus on the use of digital twin technology. A particular paper of interest is by Goher et al. [25], and it presents comprehensive state of the art and future trends in model-based definition and enterprise. The authors summarize the current situation in this area, identify important gaps, and propose research directions, e.g., how to achieve interoperability in enterprise software domains by recommending the adoption of international standards, e.g., different neutral file formats such as the ISO 10303 STEP AP242 protocol [26] and the ISO 23952 QIF (Quality Information Framework) [27]. They systematically divided their identified research problems and gaps into three main categories, i.e., technical issues, management issues, and certification issues. The authors also highlighted the USA’s NIST (National Institute of Standards and Technology) as a major contributor to the MBD and MBE research and for their applied and pragmatic research results and contributions to this important research field.
Another important research contribution was also reported in 2020 by Wärmefjord et al. [28] and by the geometry assurance research group at Chalmers Institute of Technology in Sweden. In their paper entitled “Digital Twin for Variation Management: A General Framework and Identification of Industrial Challenges Related to the Implementation”, they present a survey, carried out by researchers and engineers with expertise in geometry assurance and variation management. The survey showed a gap between future research interest in academia and industry, identifying a larger need in industry. They also concluded that there are several barriers to overcome in industry before the full benefit of a digital twin for geometry assurance and variation management is complete and capitalized in an industrial context. One of the identified key challenges is to keep the 3D models completely updated, which requires keeping track of changes during the on-going product development process and providing feedback during production to the development engineers. This is part of what is known as the digital thread, which they also address and discuss in their paper.
Product Lifecycle Management (PLM) is a key capability for Saab, which develops and maintains complex systems. A recent published paper by Herzog et al. in March 2022, [29] presents a modular architectural pattern, entitled “Genesis”, for realizing a federated PLM capability. Starting by integrating multiple engineering discipline-specific development environments, the proposed solution opens the possibility for replacement of individual environments, while maintaining the overall development system landscape. According to the authors, the ability to exchange parts of the whole PLM system, without having to resort to migration of all product data, is a critical capability for Saab.
Saab has made significant progress in implementing 3D model-based definition and model-based enterprise practice using embedded semantically accurate product and manufacturing information in new automated dimensional metrology systems. This will ensure the principles of the digital thread and digital twin concept. The combination of these two phenomena allows companies to leverage their digital design artifacts during the measurement and inspection process in a seamless manner. Thus, the manufacturer knows exactly which parts and processes are needed before the physical production even takes place. National and international digital data standards readily enable information exchange between design, manufacturing, and quality, which is particularly helpful in a global supply chain network using different digital collaboration tools. In this paper a newly published result by ISO and its Smart Manufacturing Coordinating committee (SMCC) is highlighted [30]. One of the first main achievements of the SMCC group was to elaborate and create a definition of smart manufacturing. Endorsed by both ISO (International Organization for Standardization) and IEC (International Electro technical Commission) since 2019, the mutual definition of “smart manufacturing” is:
Manufacturing that improves its performance aspects with integrated and intelligent use of processes and resources in cyber, physical and human spheres to create and deliver products and services, which also collaborates with other domains within enterprises’ value chains”.
In its white paper, ISO SMCC brings forward enabling technologies and enhancers, where the enhancers use the potential provided by one or more enablers to generate new opportunities and business solutions. Enhancers are vital in order to enhance, i.e., facilitate and speed up, the development from traditional manufacturing to smart manufacturing. In this research paper, 3D model based large volume metrology, simulation, and internet of things are identified as the main enablers and the digital twin as the main enhancer in accordance with the information from the SMCC whitepaper. Many definitions of digital twin exists [15]; here, the developed definition by ISO/TC 184 SC4 Industrial data [31] is highlighted:
ISO 23247-1:2020: “Digital Twin <manufacturing> fit for purpose digital representation of an observable manufacturing element with a means to enable convergence between the element and its digital representation at an appropriate rate of synchronization.

3. Materials and Methods

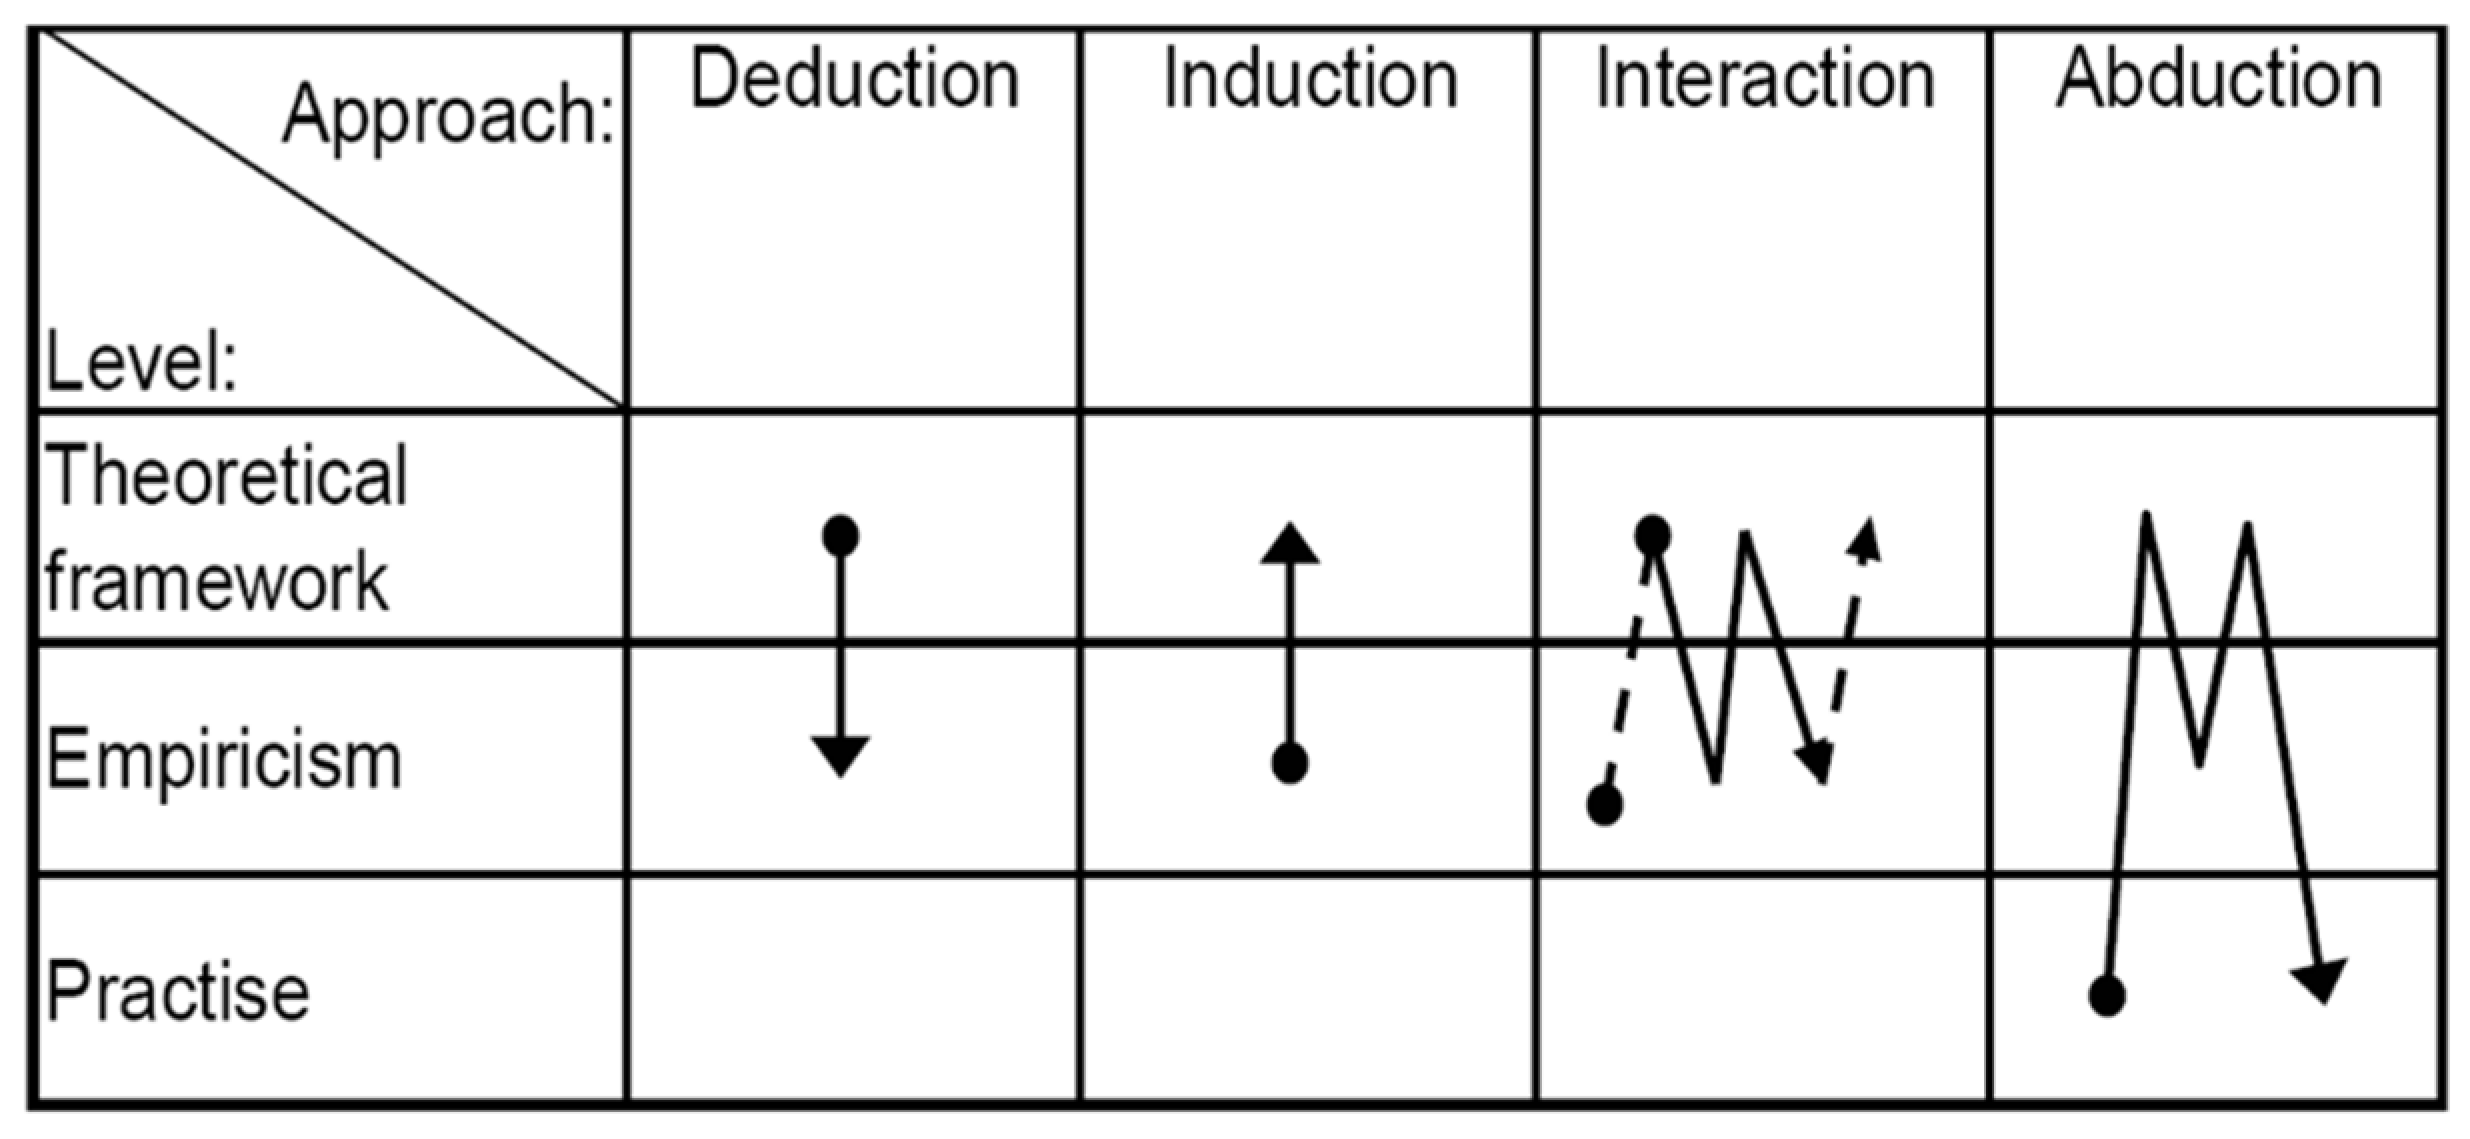
3.1. Research Approach and Methodology

Sohlenius (2004) [32] has developed and described a scientific method for research and development in the area of science of engineering, Figure 3. The method comprises of the following six steps:
Presented by Bagge in 2009 and by Lindqvist in 2011 [33,34], both describes a research concept called the “experiential researcher”. What is the experiential researcher? Per definition, the concept contains both theoretical and empirical methods with a solid origin in the pragmatic and practical knowledge base. The experiential researcher could be described as an experienced and pragmatic person with devoted reflecting knowledge, using the abduction method, Figure 4.
In abduction, the reflected knowledge gained from proven empirical and practical experiences is the start and the framework for the research. Illustrated in Figure Y is how the research work interacts between theory and empirical knowledge into practical knowledge, back and forth. The research is distinctive in its way that the research tends to be action-based, and generally results in novel and profound knowledge. Action-based research was designed specifically to bridge the gap between theory, research, and practice. The research presented in this paper has been performed using the method developed by Sohlenius (2004) and the method of experiential researcher and action-based research, described in [32,33,34].

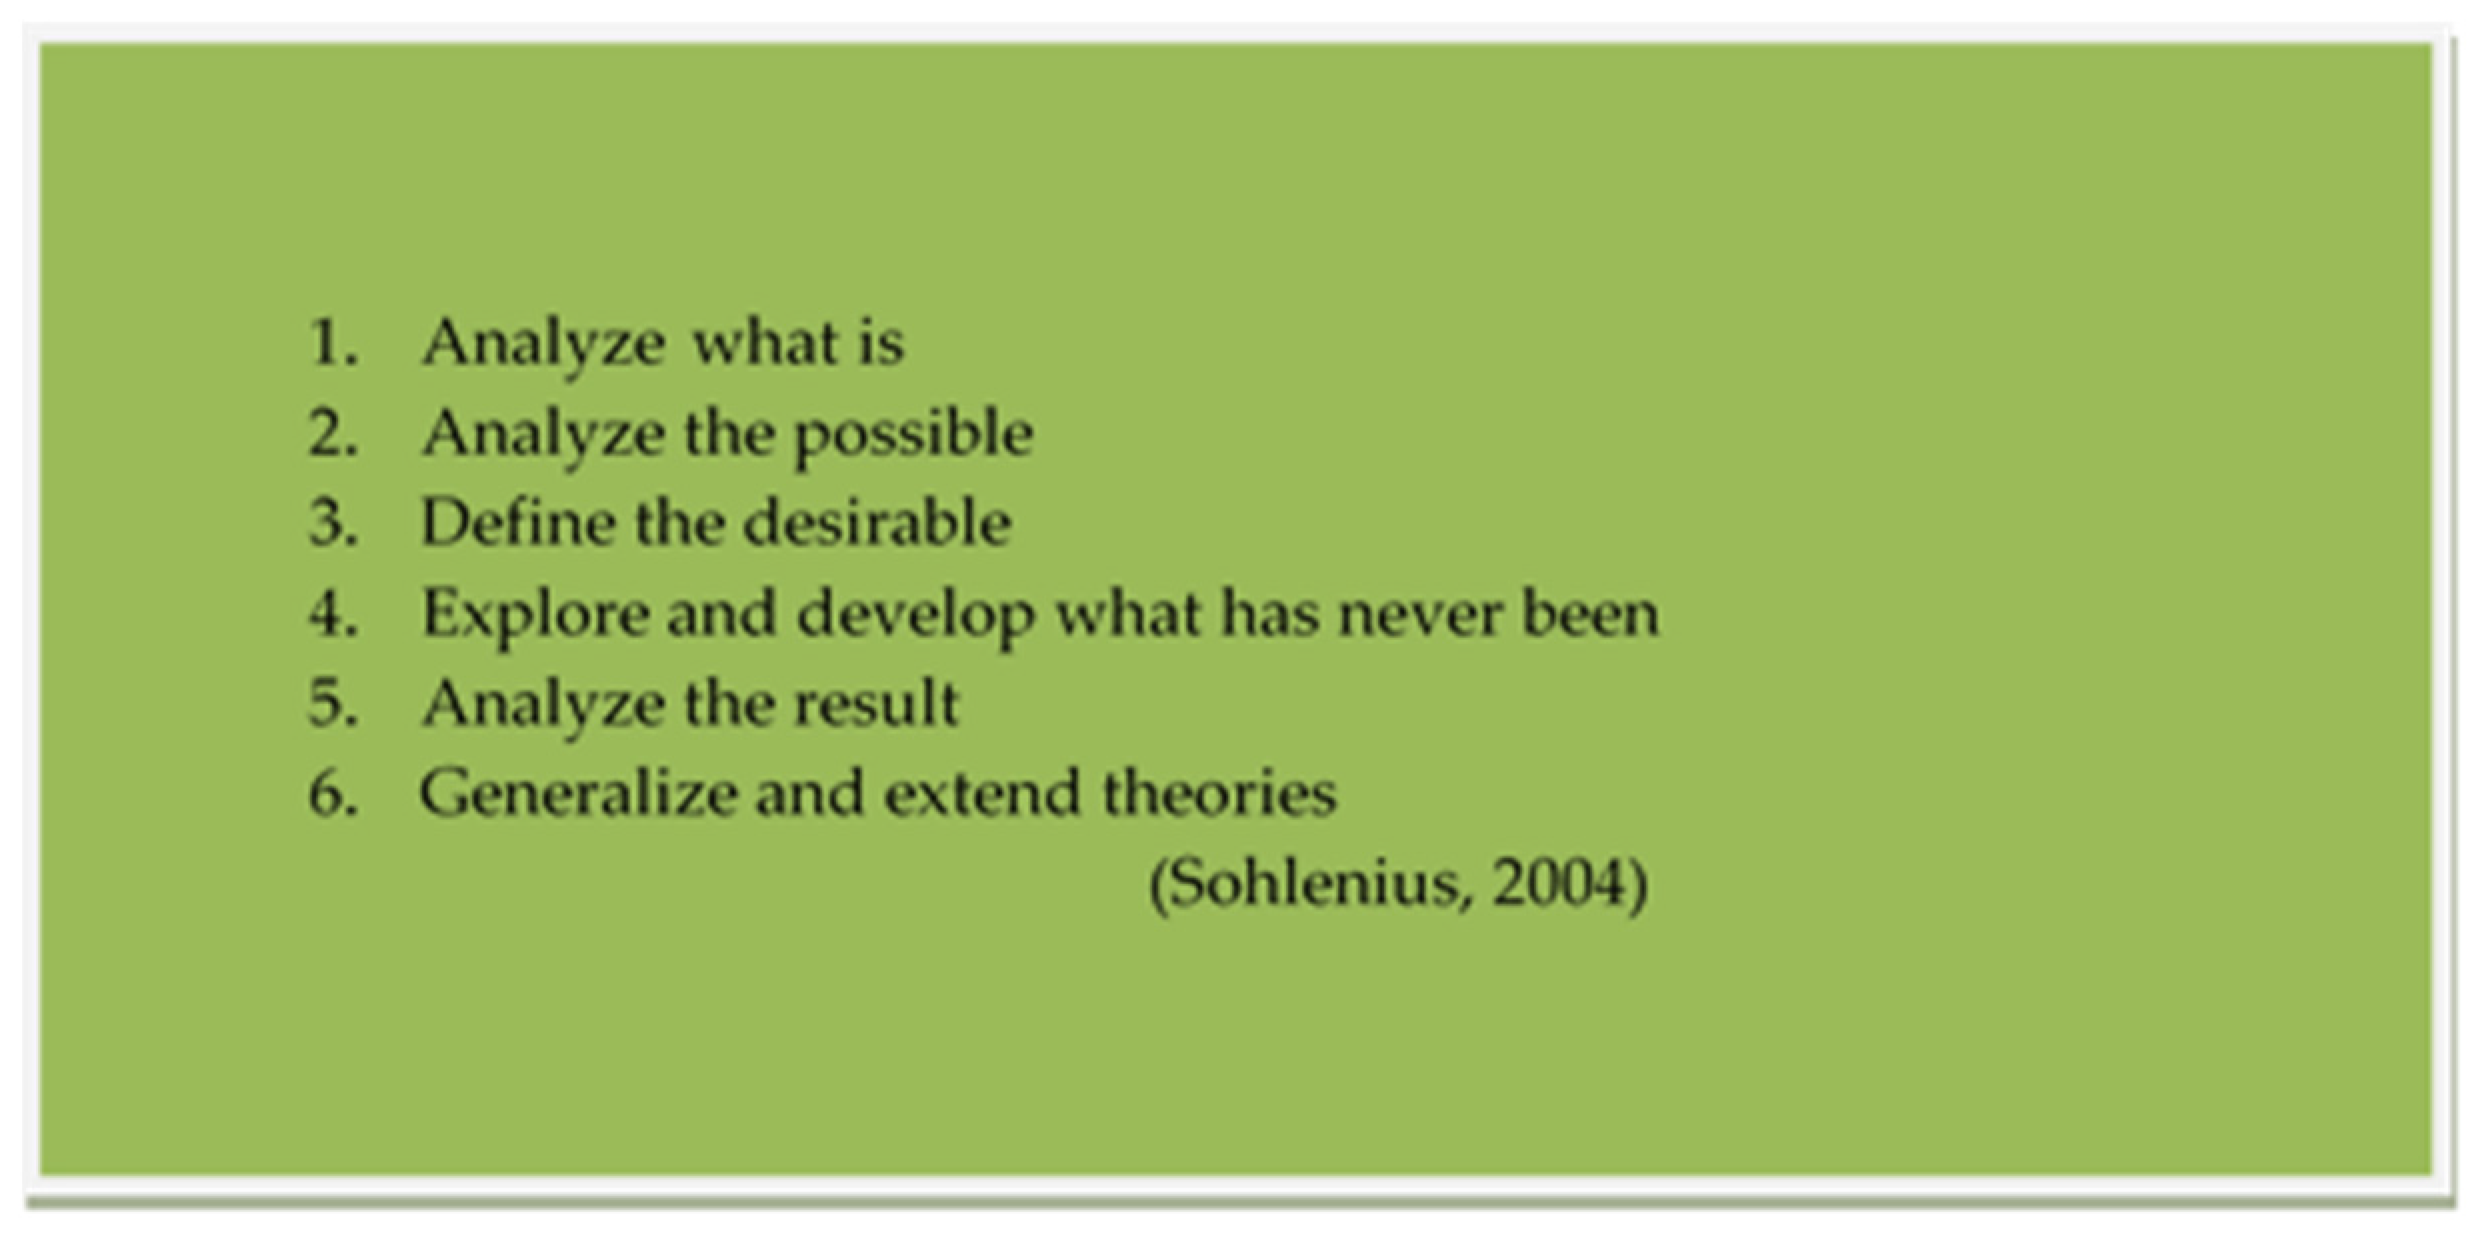
3.2. Analyze What Is and Analyze the Possible
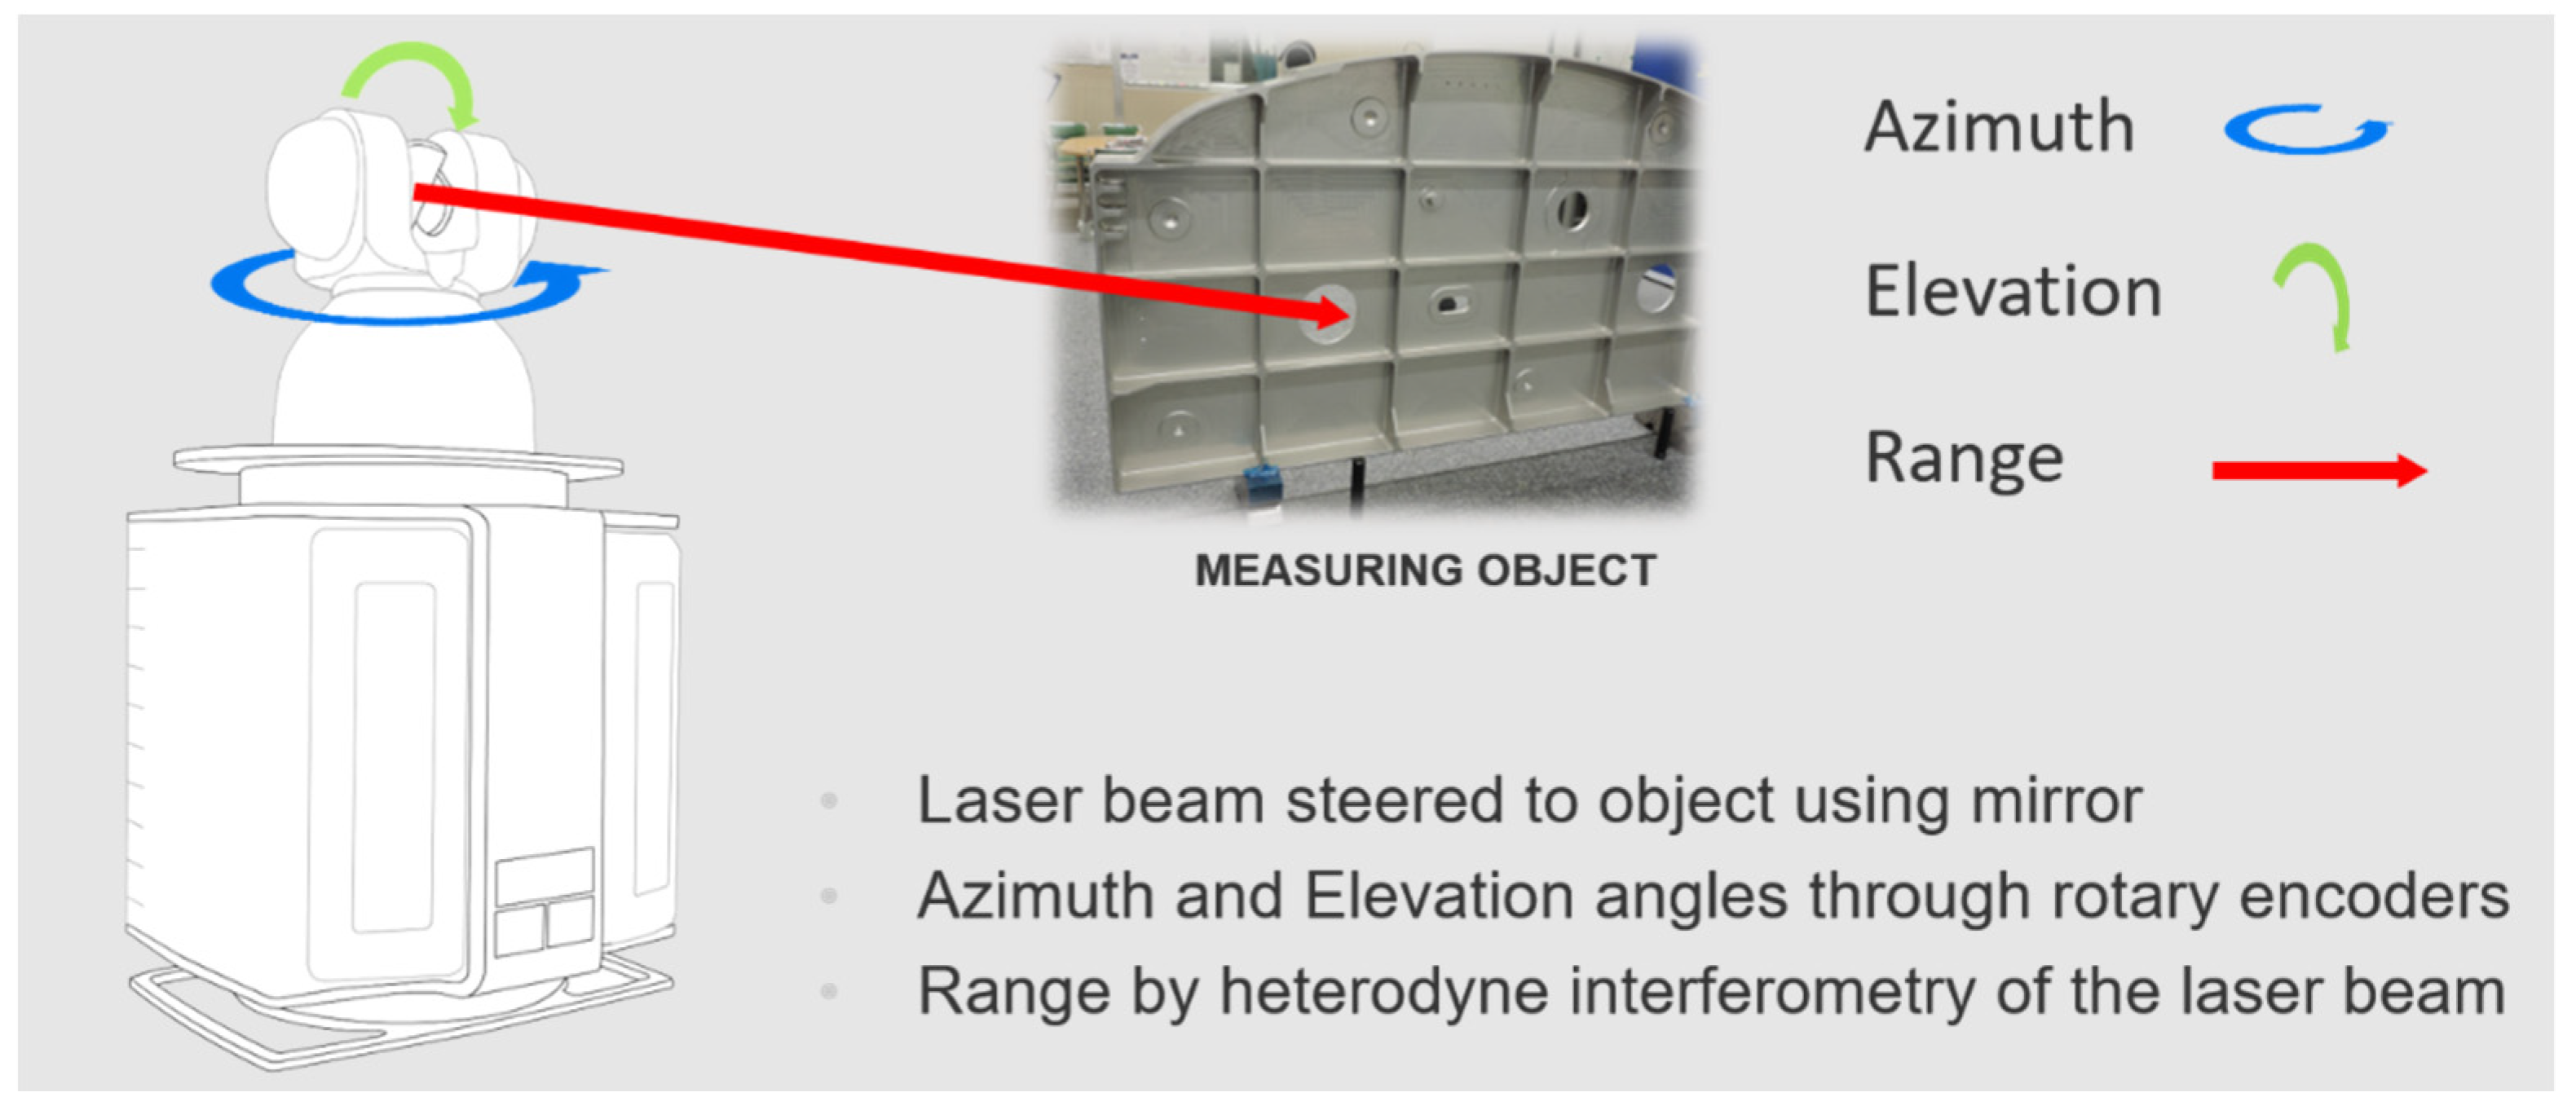
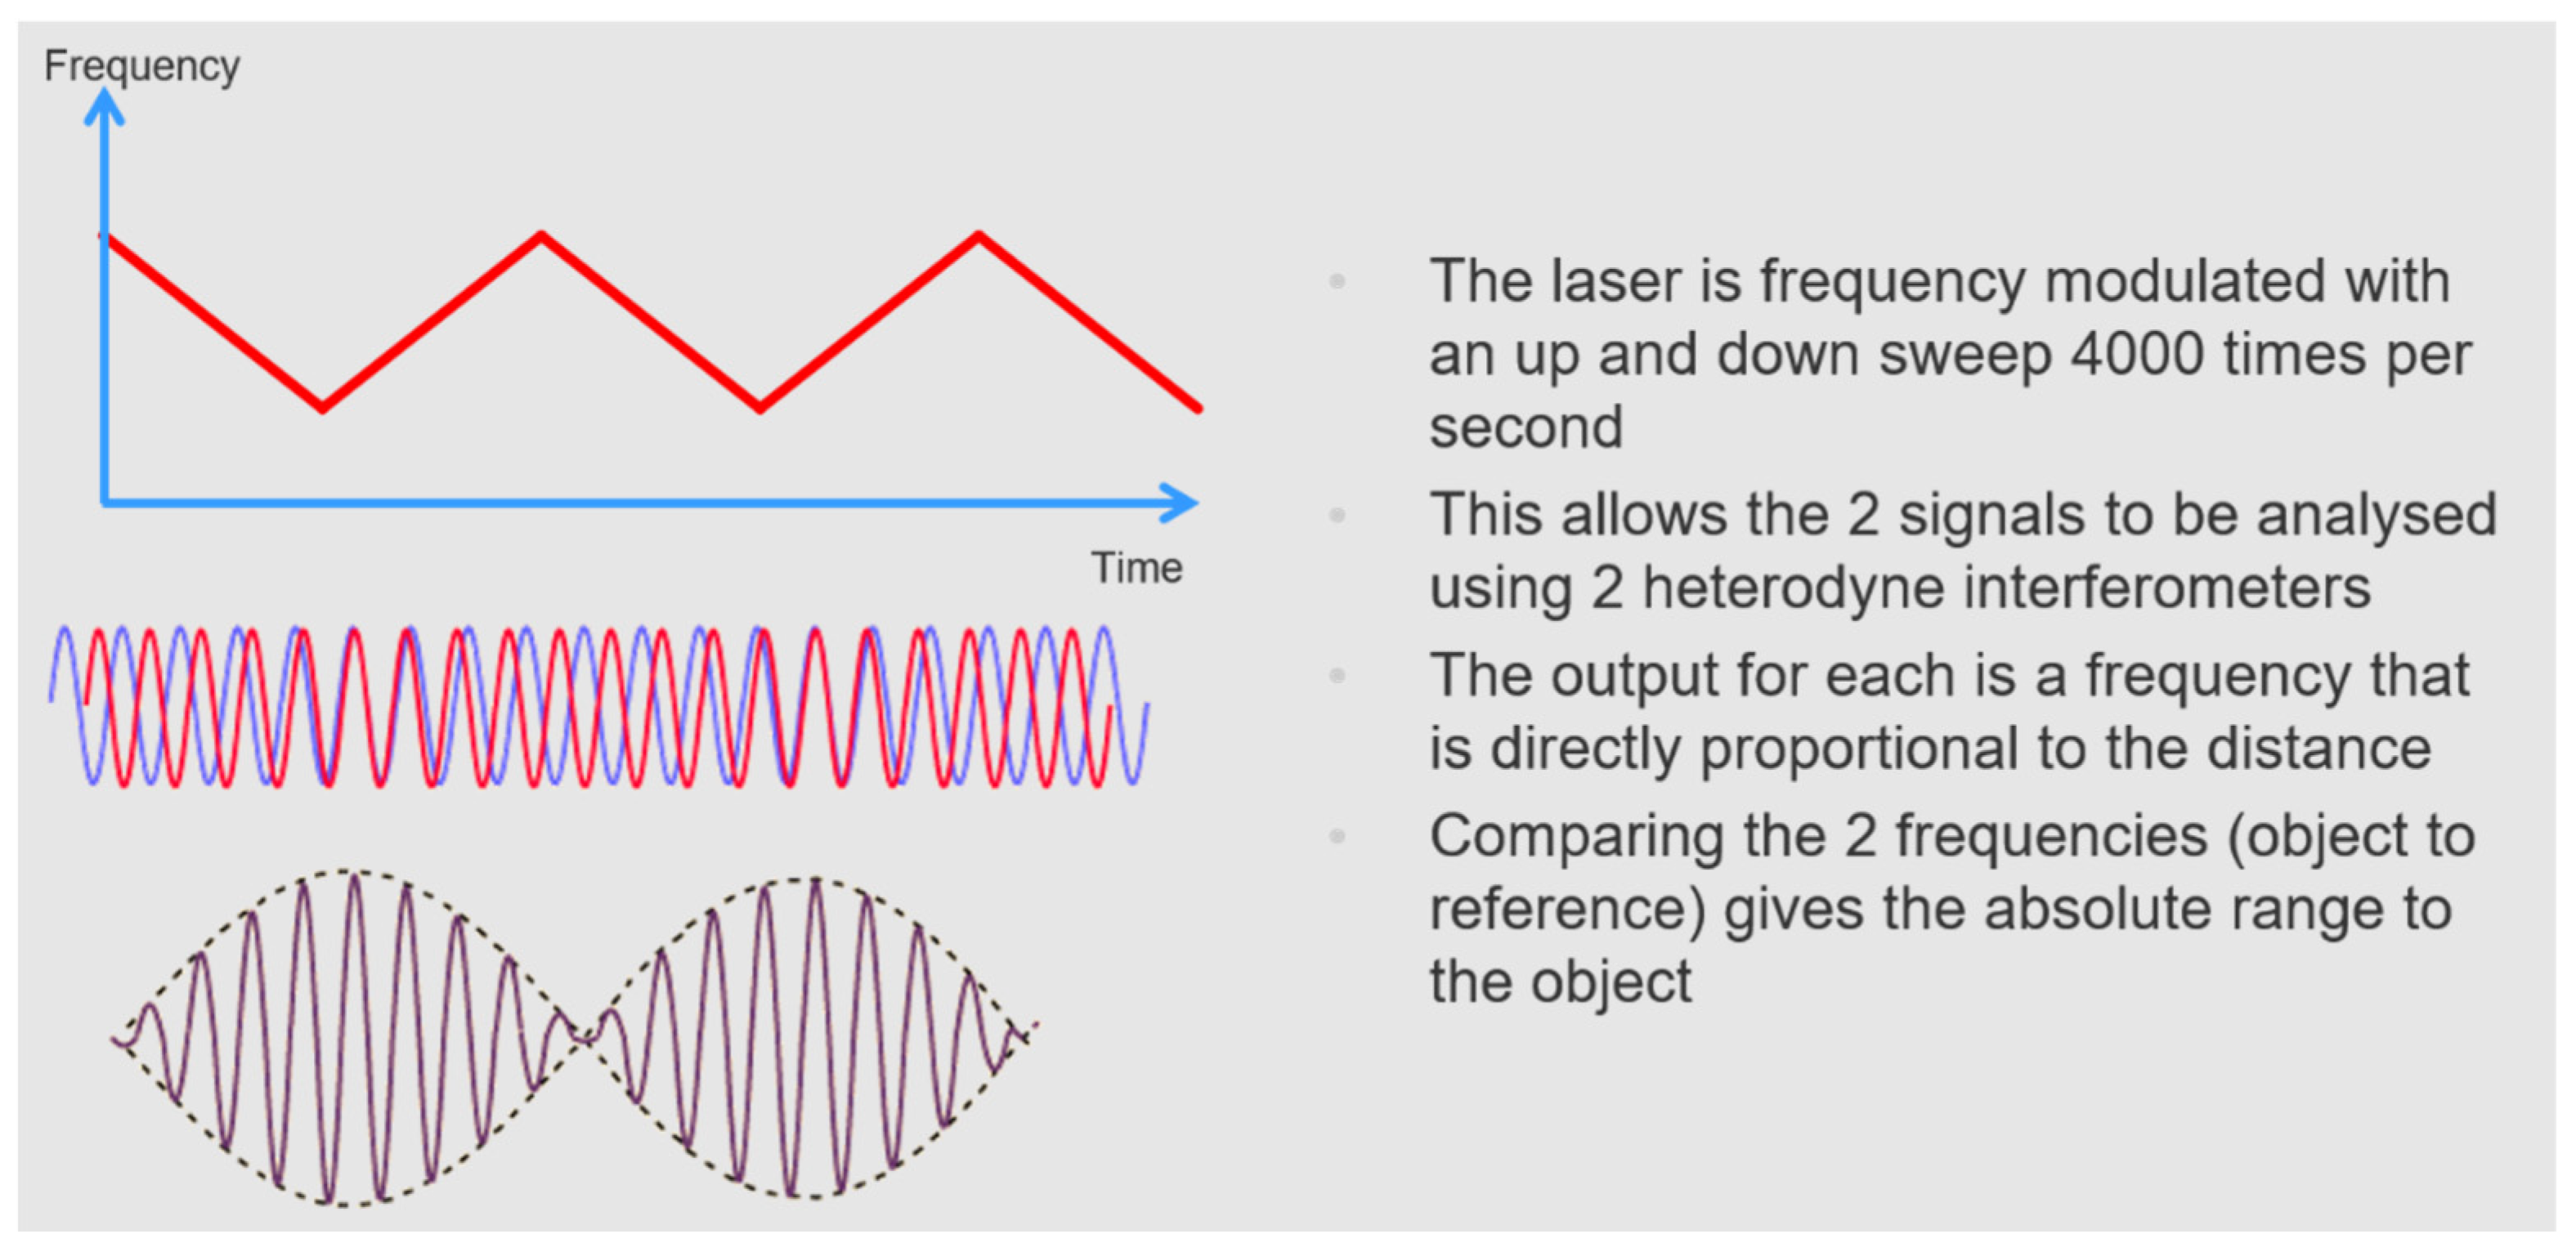
3.2.1. Laser Radar

A laser radar is a high-performance, high-precision, non-contact measurement system using two heterodyne infrared lasers. Its main operational characteristics and performance are described in Figure 5, Figure 6 and Figure 7.
The specification for the new APDIS MV430E laser radar is according to Nikon [3] and Table 1, Table 2 and Table 3:
Two Point Length Measurement Accuracy MPE ( µ m ) ; M P E = 2 ( 20 + 5 R A v e ) 2 + ( 13 , 6 R A v e ) 2
From the first calibration at Saab premises in Linköping, Sweden, performed in July 2021, the performance of the laser radars was verified. The verification was in accordance with the ASME B89.4.19–2006 test procedure. The results conformed to the Nikon APDIS MV430E specification of the laser radar measuring system. A closer look at the results shows better than guaranteed accuracy and precision, Figure 8 and Figure 9.

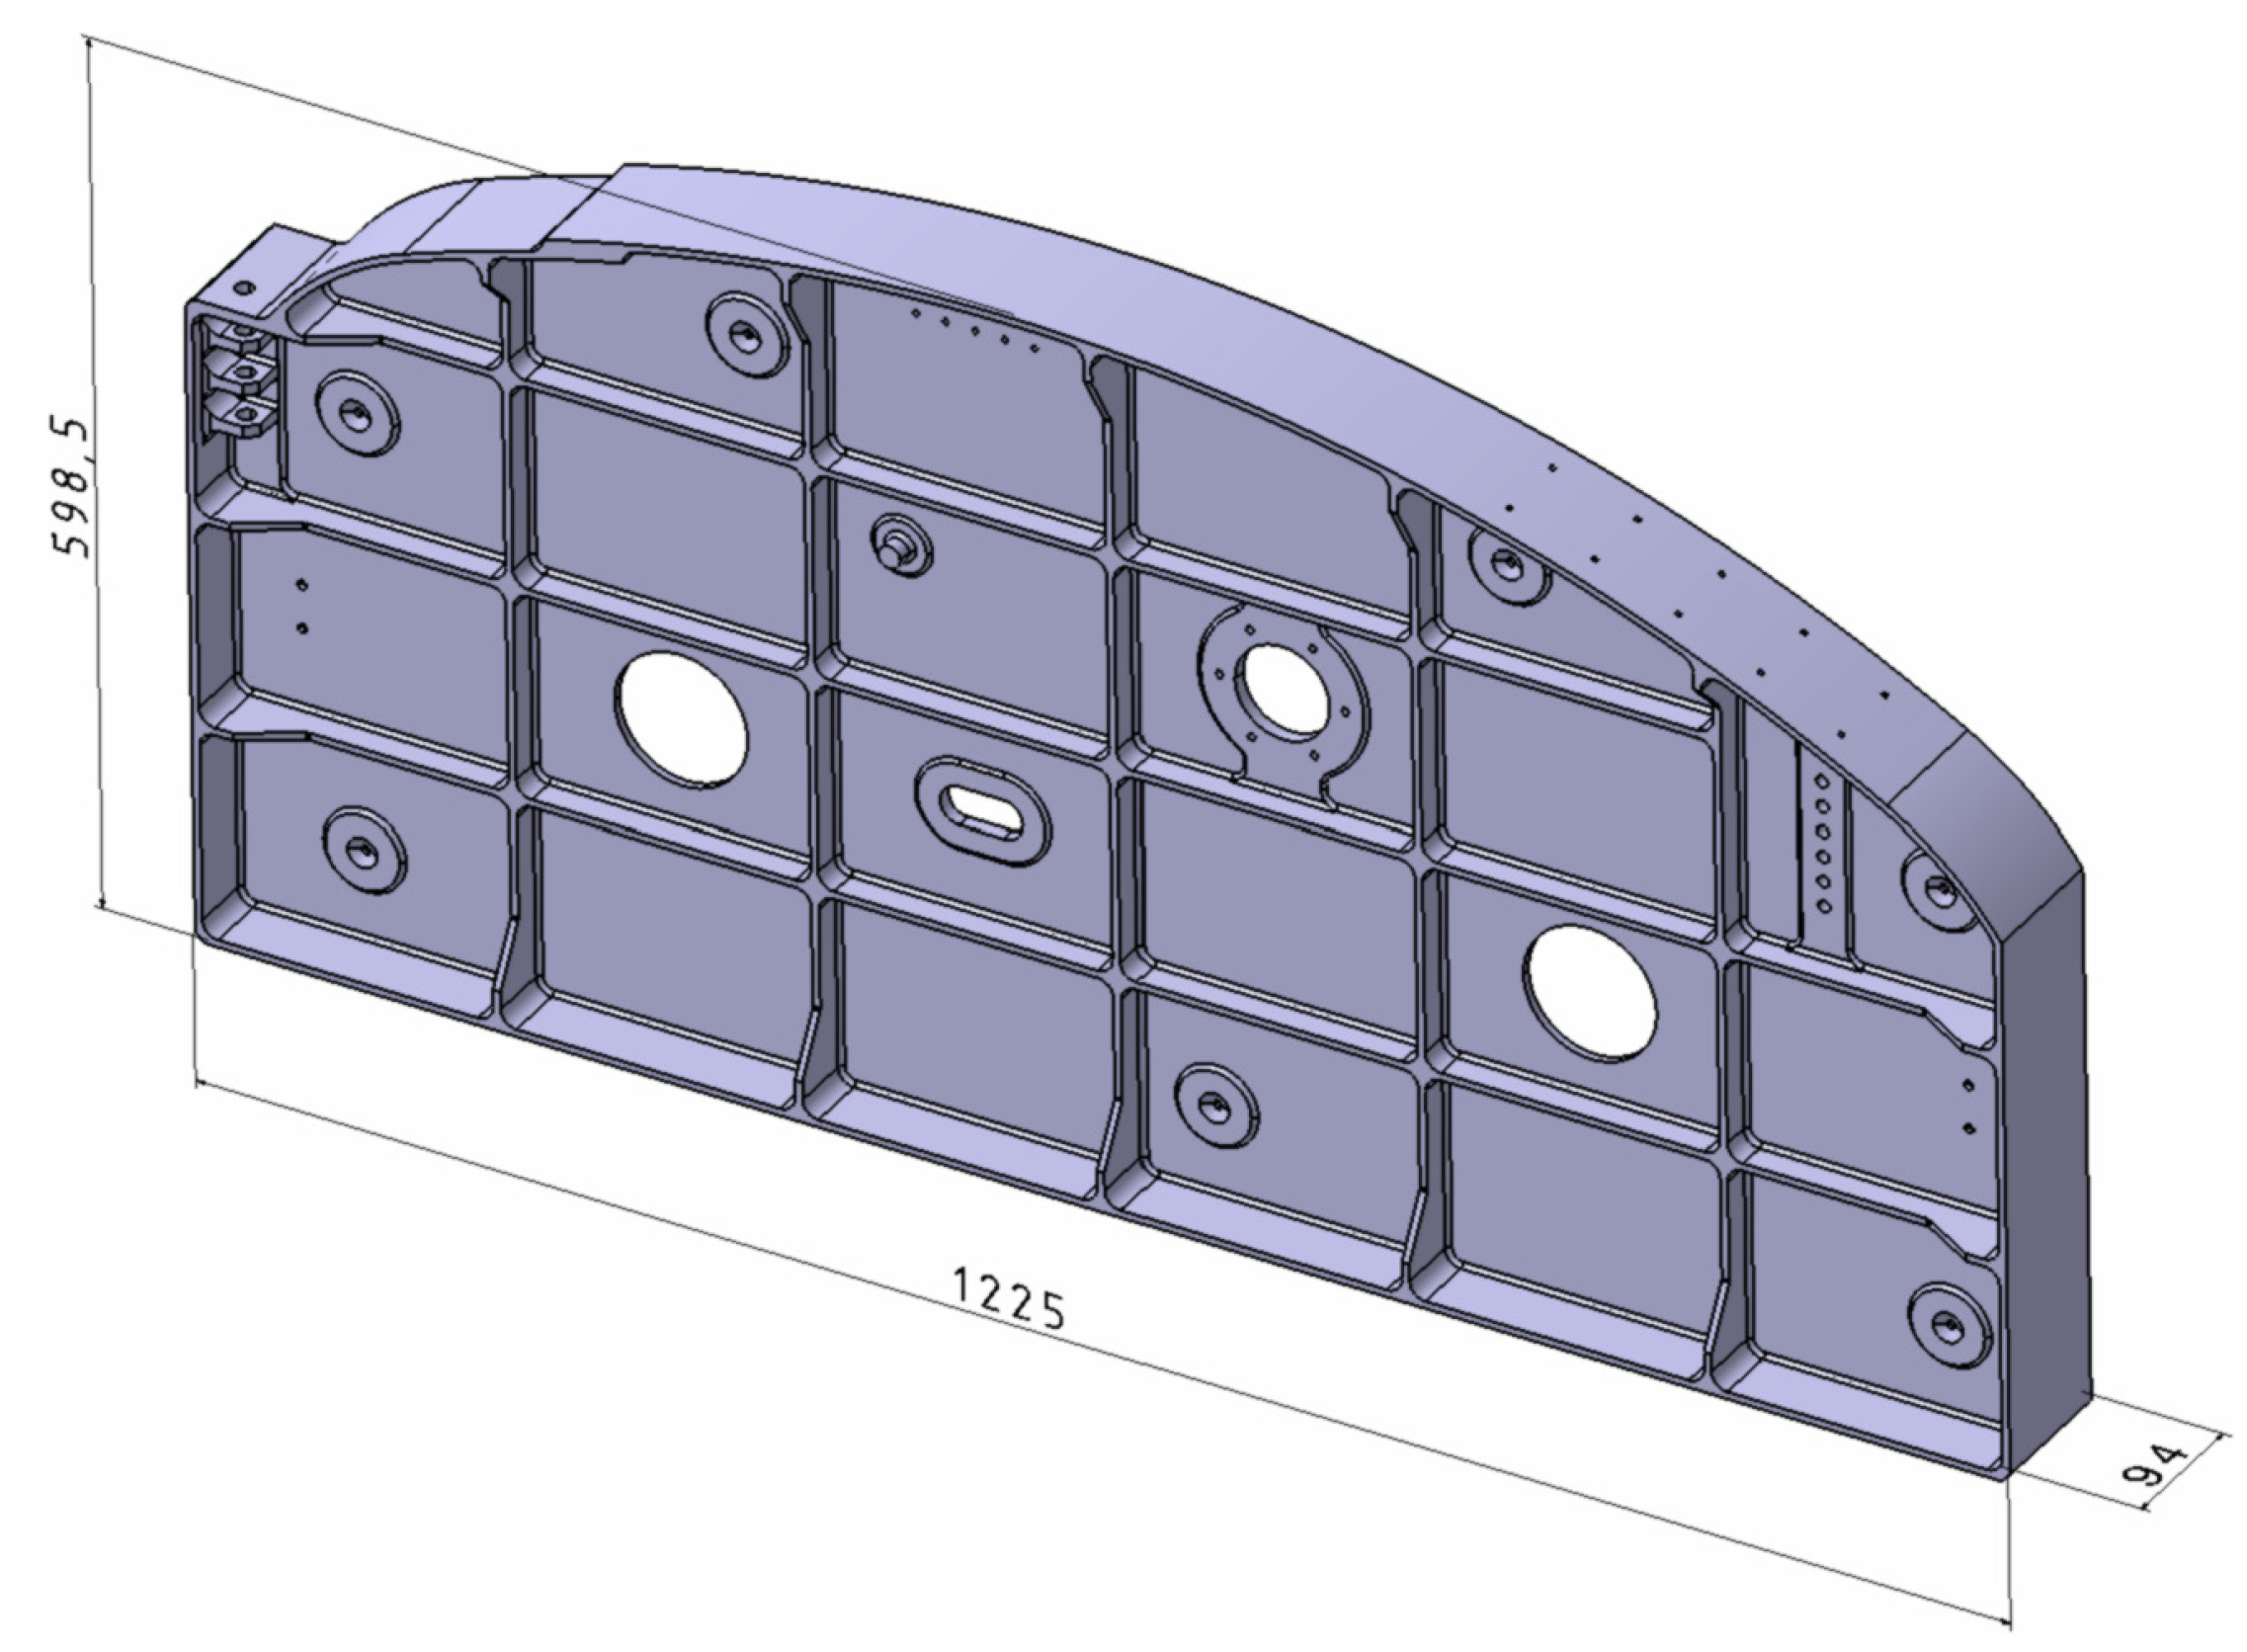
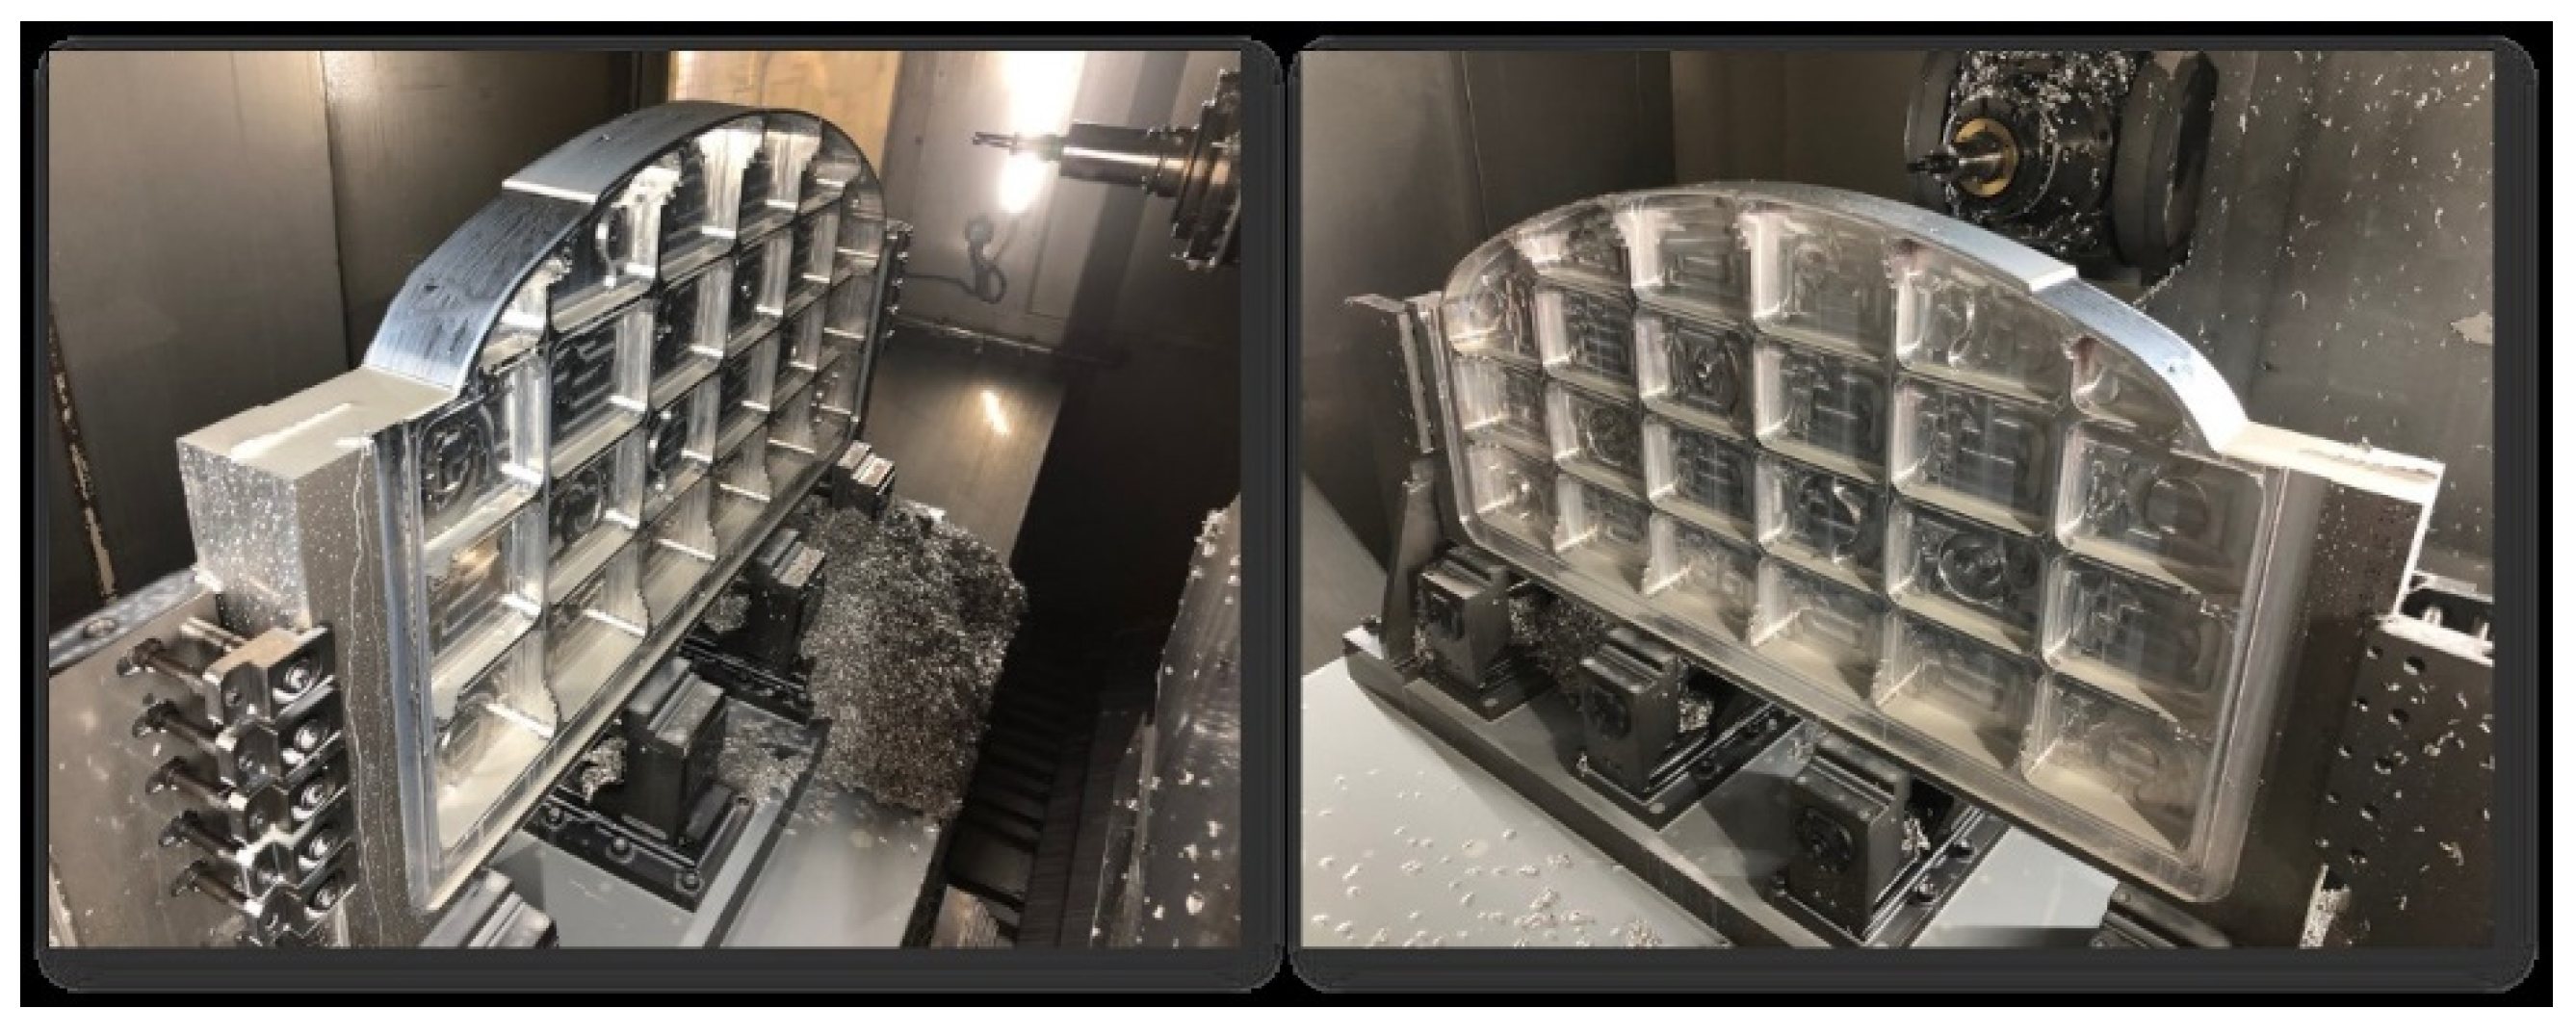
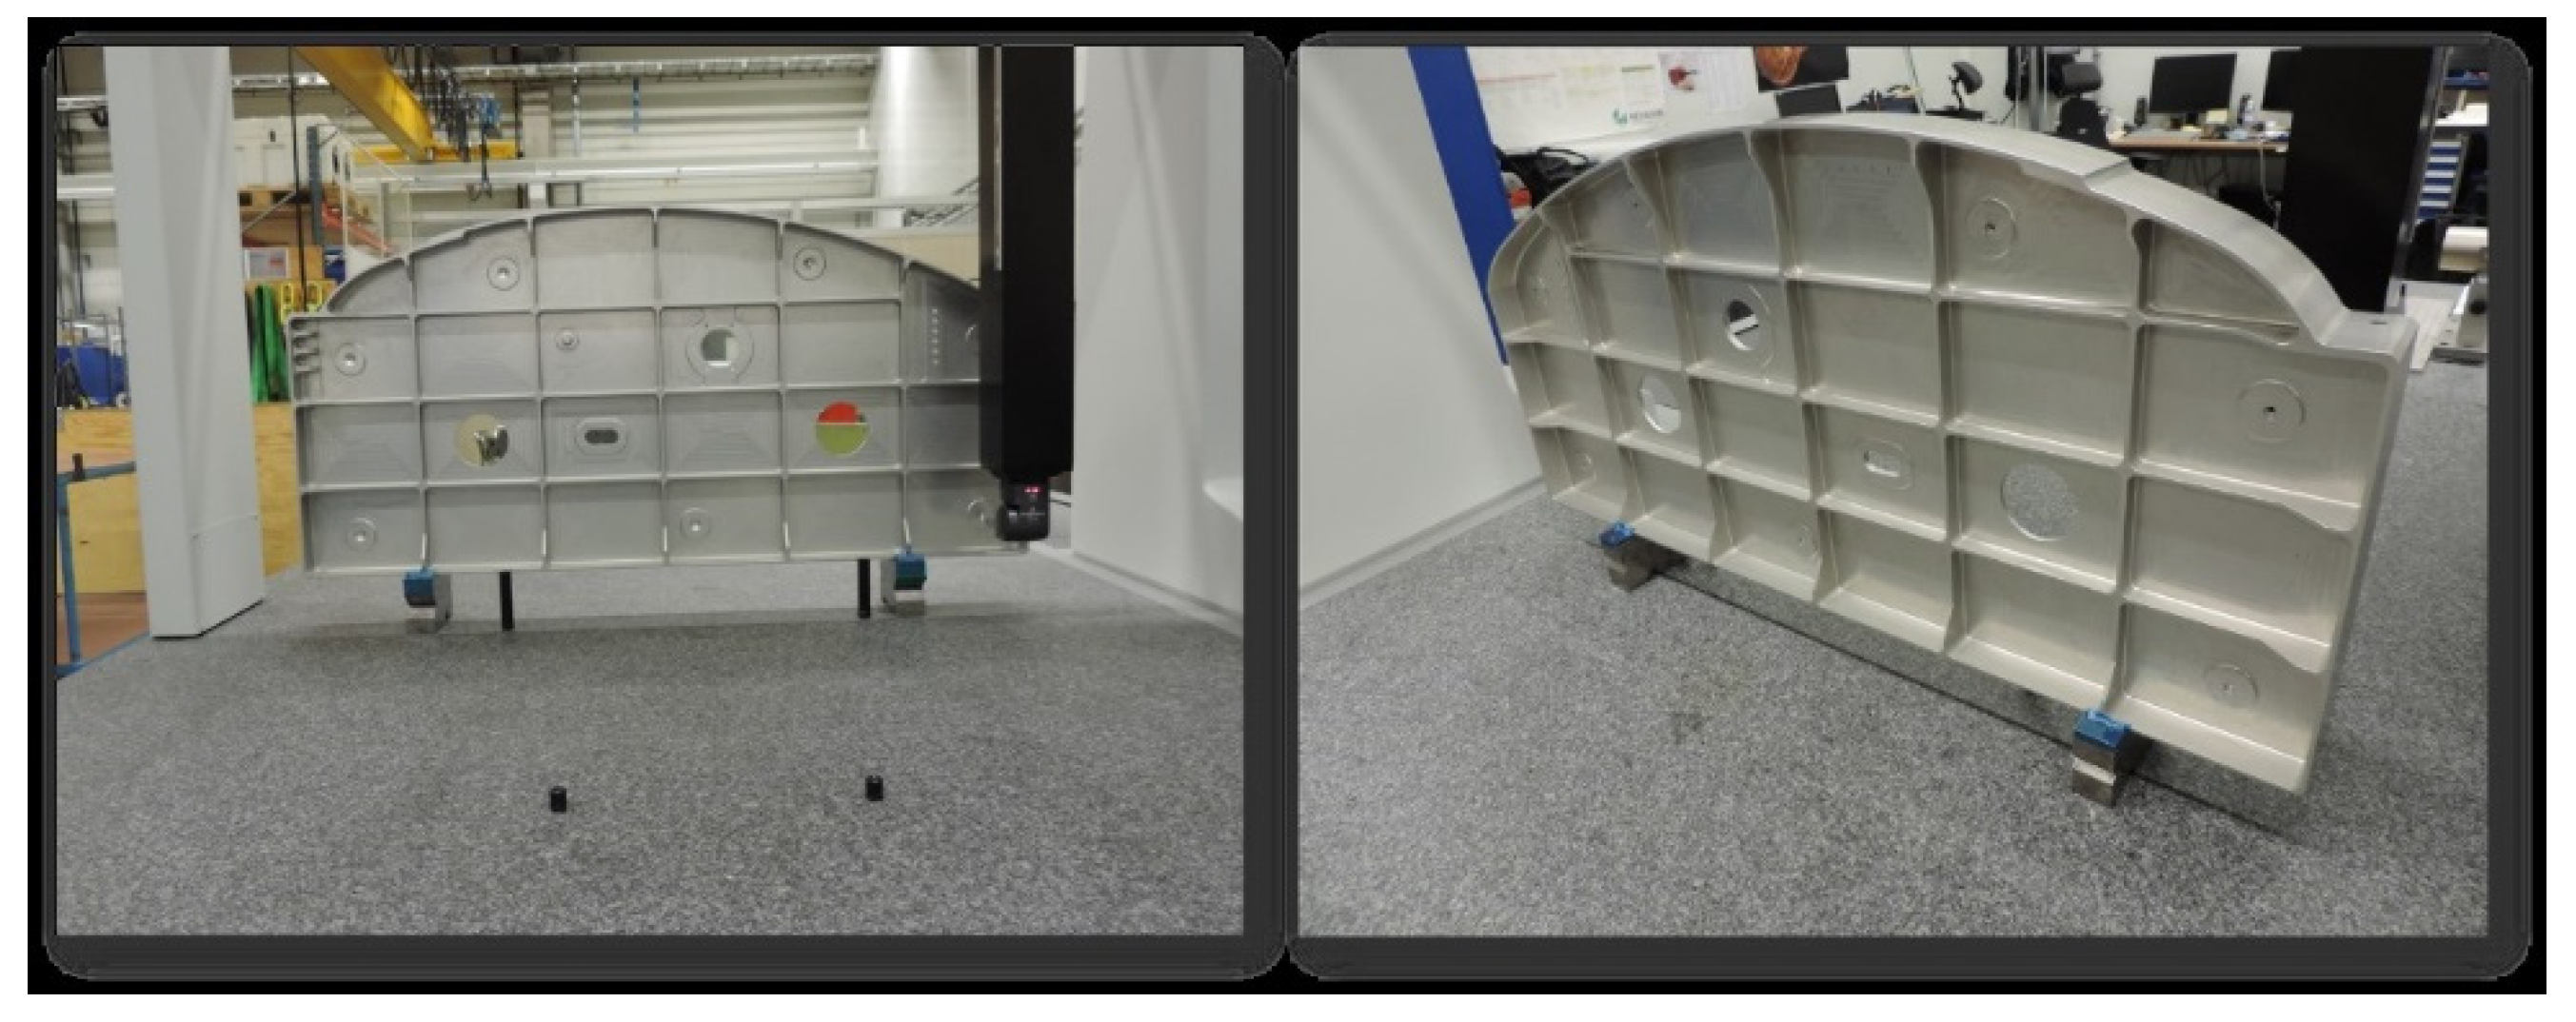
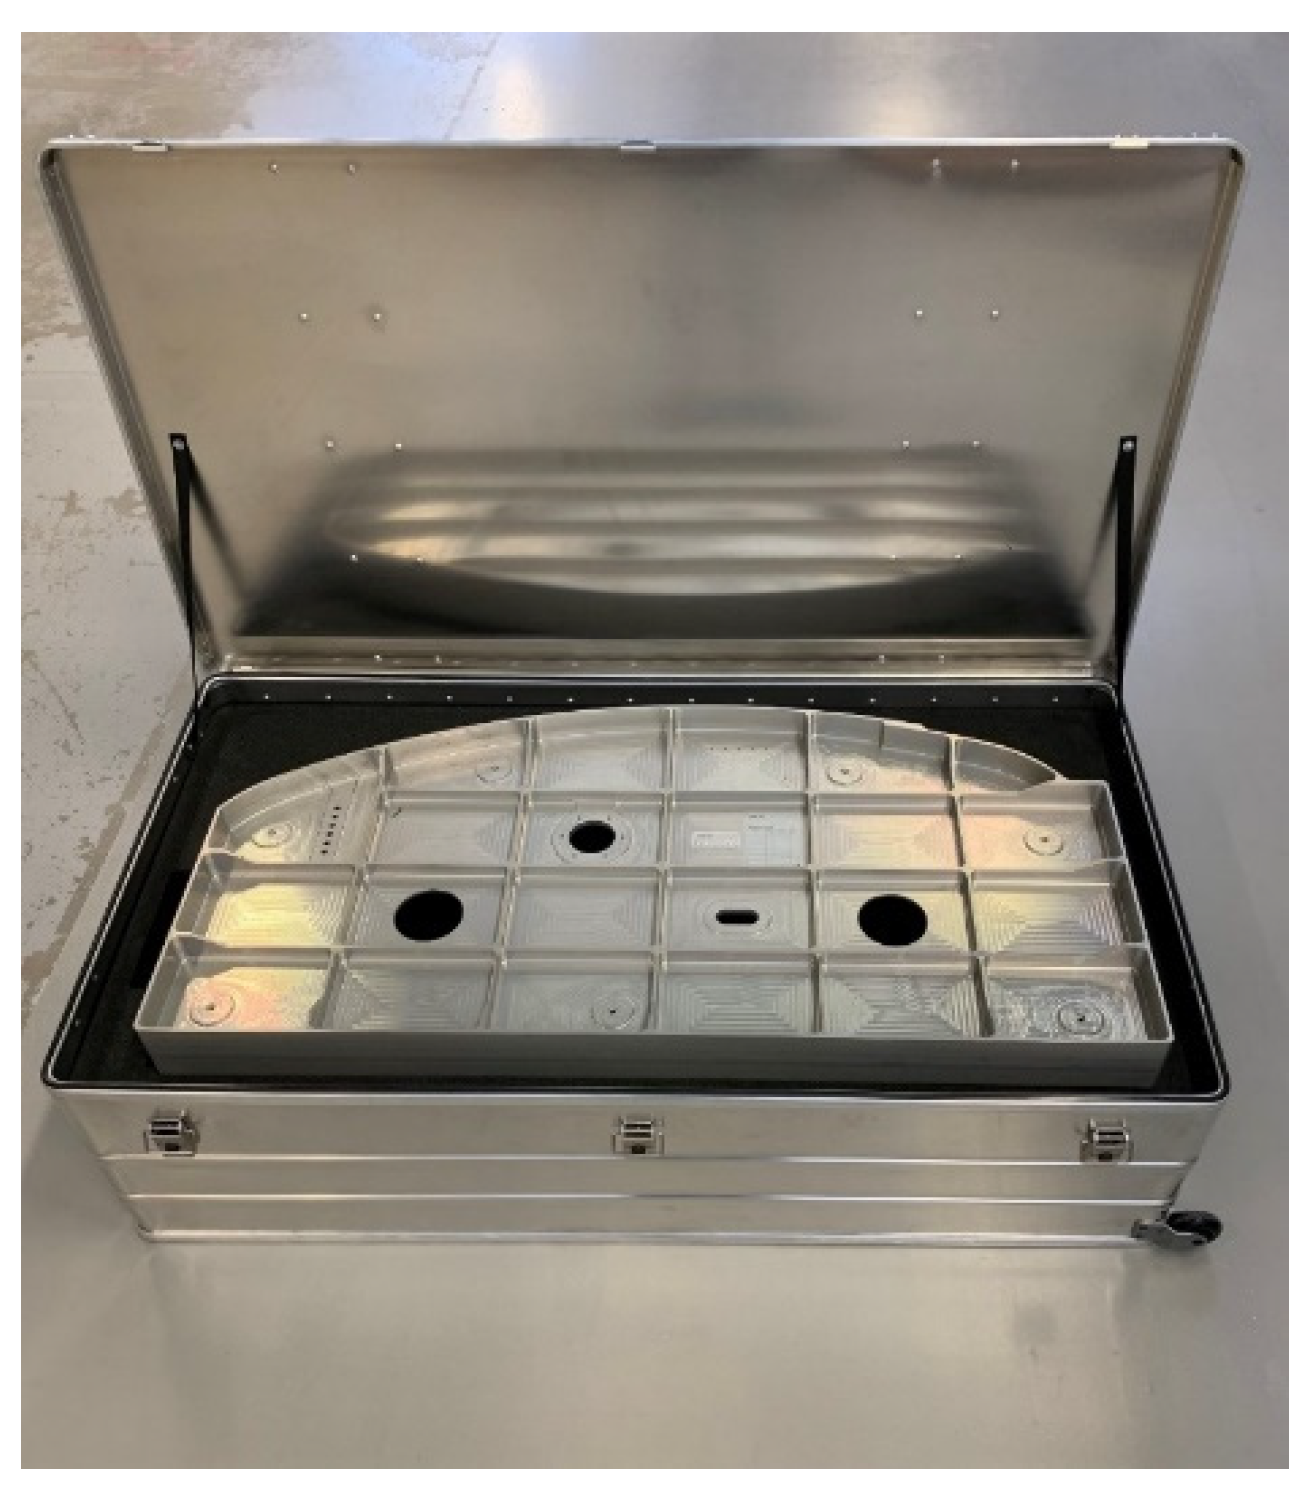
3.2.2. MPQP (Model based Process and Quality Planning) Test Artefact

As highlighted in previous research by, e.g., Schleich et al. [35], and due to the on-going digitalization of manufacturing, new requirements have been placed on the application of sophisticated virtual product and production models, referred to as digital twins, throughout all stages of product realization. The use of more realistic virtual and physical models of manufactured products are essential to bridge the gap between design and manufacturing and to mirror the real and virtual worlds through the use of dimensional metrology.
The MPQP test artefact is intended to be used in collaborative research, development, standardization, education, and learning activities. However, the primary purpose for Saab is to use the artefact as a “golden sample”, i.e., traceable test artefact for the qualification and interim and periodic inspection of 3D metrology systems. In total, six MPQP test artefacts, uniquely marked and identified for traceability, have been manufactured by Saab. The MPQP artefact will ensure and continuously secure the performance and reliability of the measuring systems operated in Saab factories around the world.
Furthermore, the data and information about the measurements of the artefact will be stored and retrieved through a connected enterprise measurement database.
Accordingly, qualification test plans for the laser radar measurement systems will also be implemented. A number of issues to be addressed have been identified as follows:
  • Determine the appropriate rate of calibration and verification (periodic inspection and maintenance interval)?
    • Initial proposal: Once/half year and/or as needed.
  • Determine the appropriate verification and validation frequency for measuring the MPQP test artefact in current production and in factory operations?
    • Initial proposal: When not measuring product and process dimensional features, then measure MPQP artefact dimensional features. This will gather data, information, and knowledge about the performance and drift of the measurement systems over time.
The artefact is a machined aluminium 7075 alloy part, Figure 10 and Figure 11, resembling an aircraft frame and consisting of flanges and pockets as well as a number of geometrical features and tolerances which could exist in an actual aircraft structure. The outer dimensions of the artefact are 1225 × 598.5 × 94 mm, Figure 10, with a general web thickness of 6 mm and a general flange thickness of 5 mm. The calculated mass is approximately 20.5 kg. The linear thermal expansion coefficient is 23.4 µm/m °C−1. Each MPQP test artefact is marked for traceability and verification data from the CMM and is stored in an internal calibration and verification system software. Approximately 2500 comparison points, i.e., vector points, are measured, extracted, and evaluated in the CMM, Figure 12. This covers all practical dimensional and geometrical features at every periodic inspection and verification occasion. Temperature variation during measurements was monitored and recorded and was within 20.8 ± 0.2 °C. The uncertainty of measurement and the start error is U = 3.0 µm. Calibration certificate according to Figure 13. All artefacts are securely stored in dedicated aluminium containers/boxes, Figure 14, which is clearly marked with a unique identity. Each aluminium box can contain a maximum of two MPQP artefacts each.

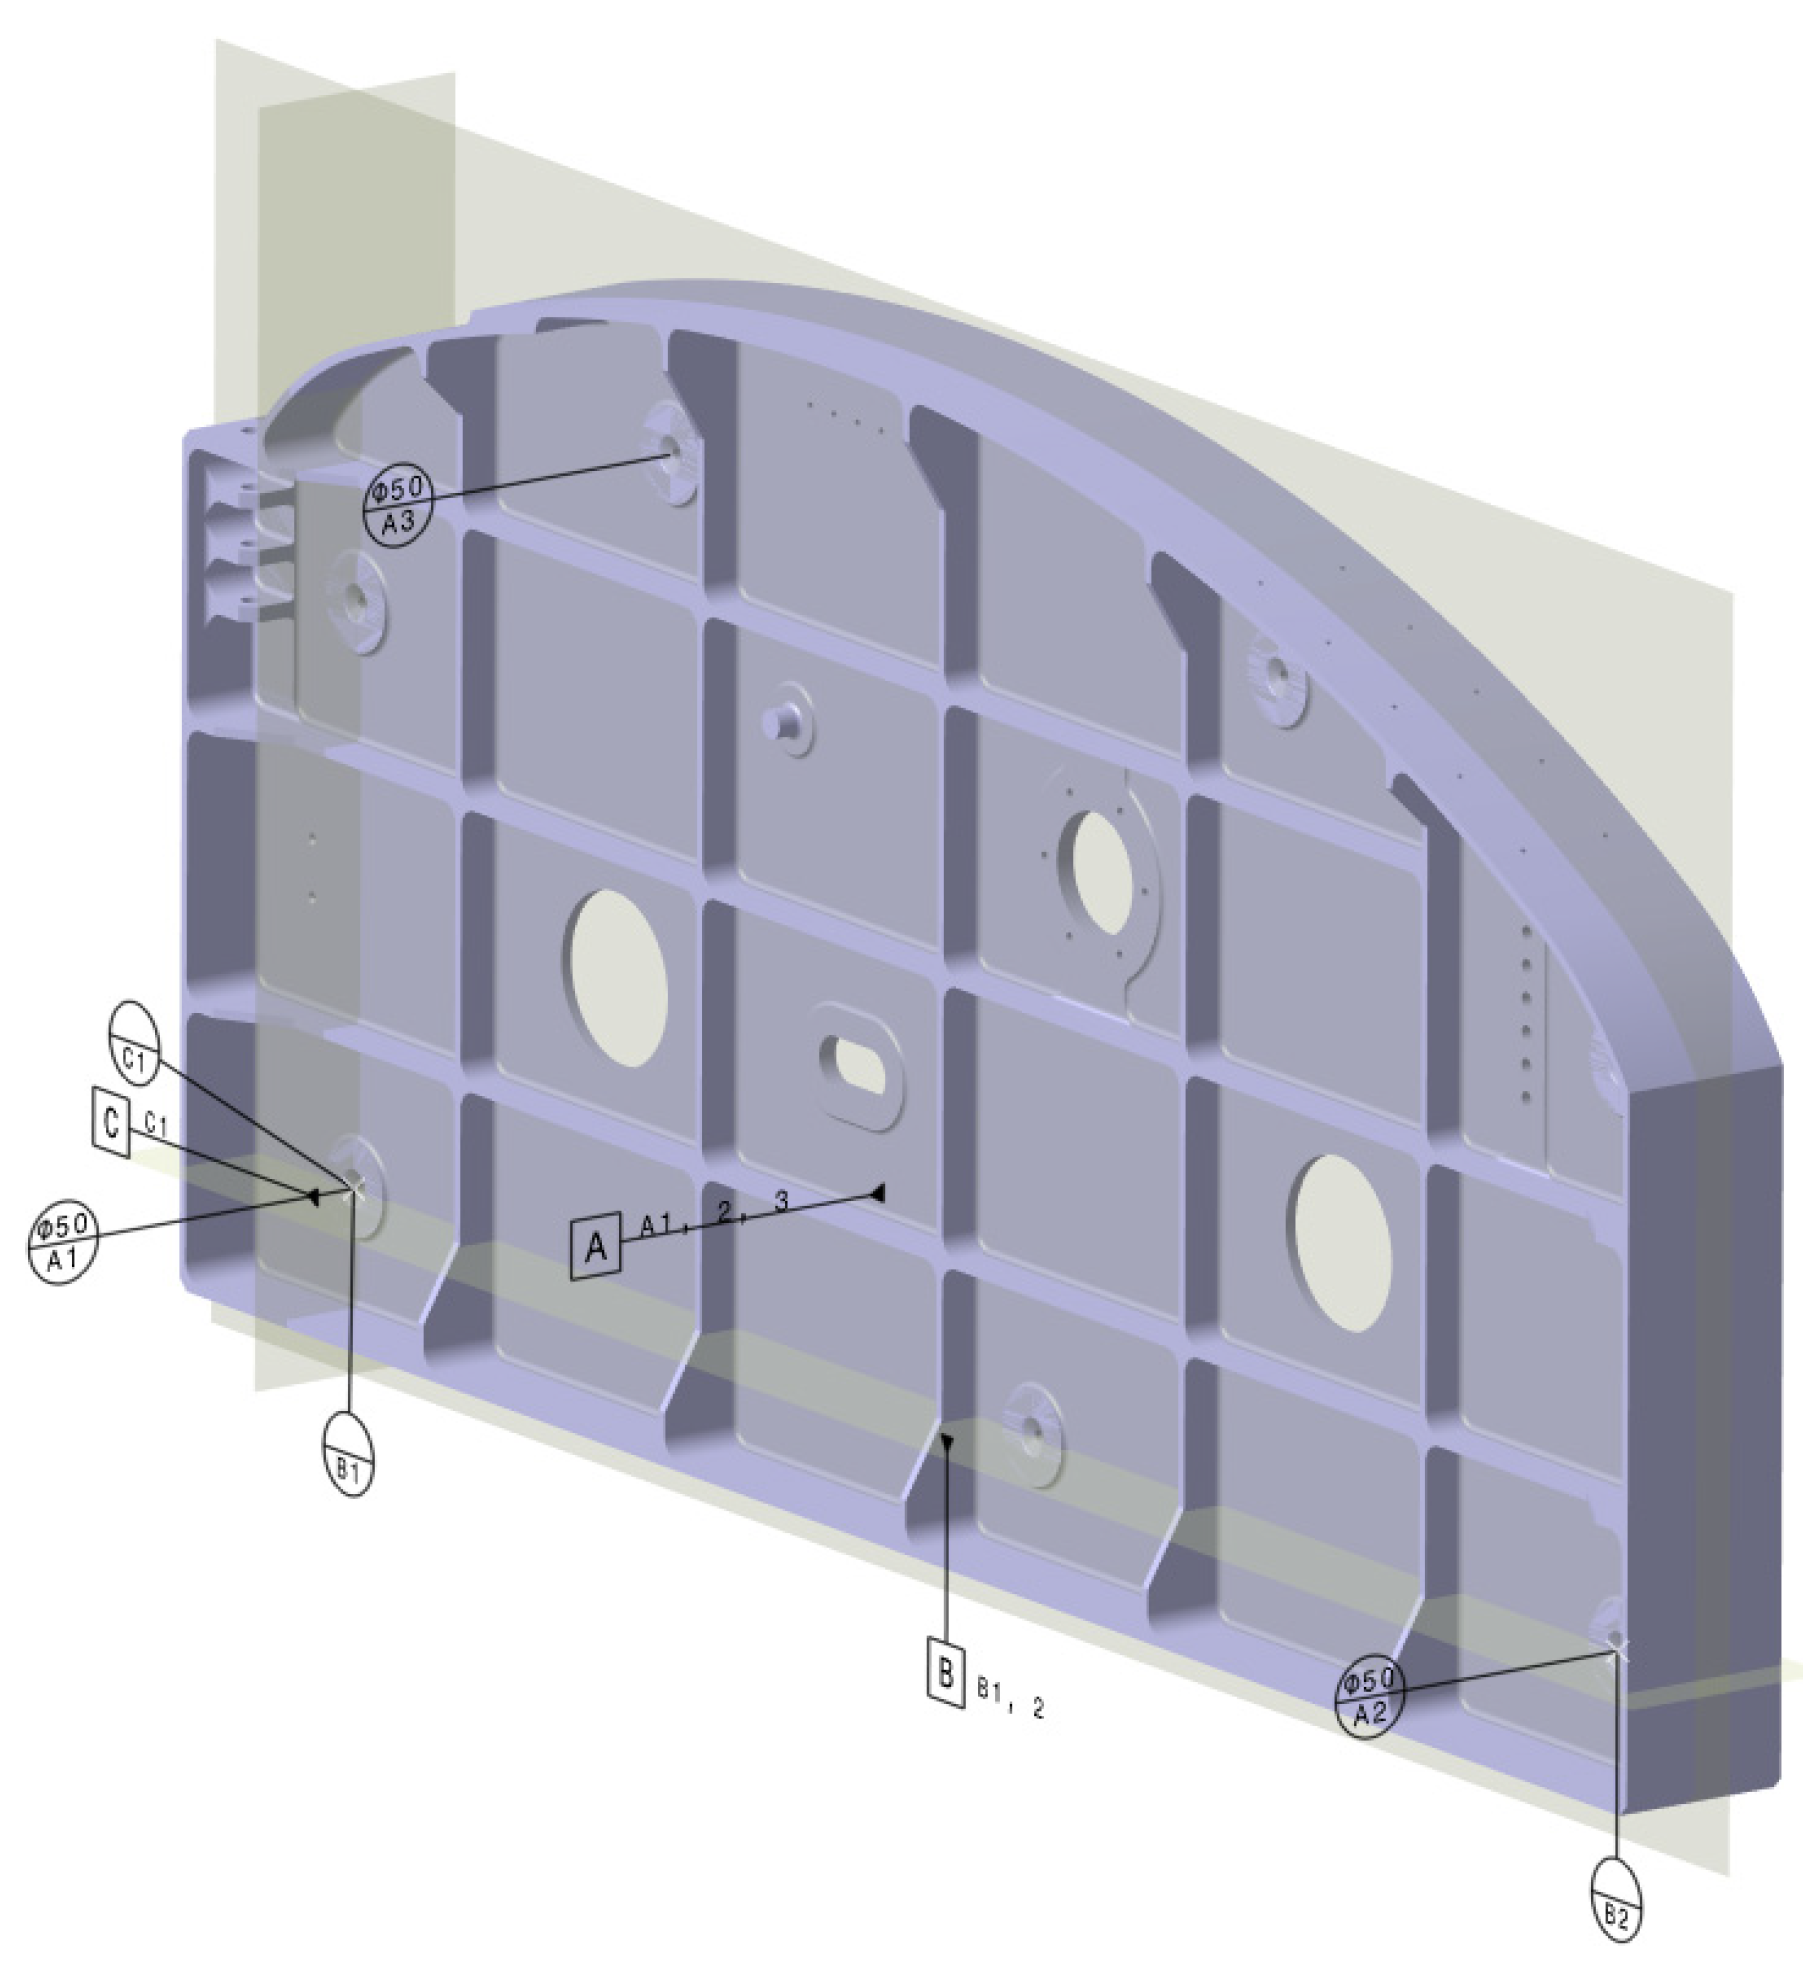
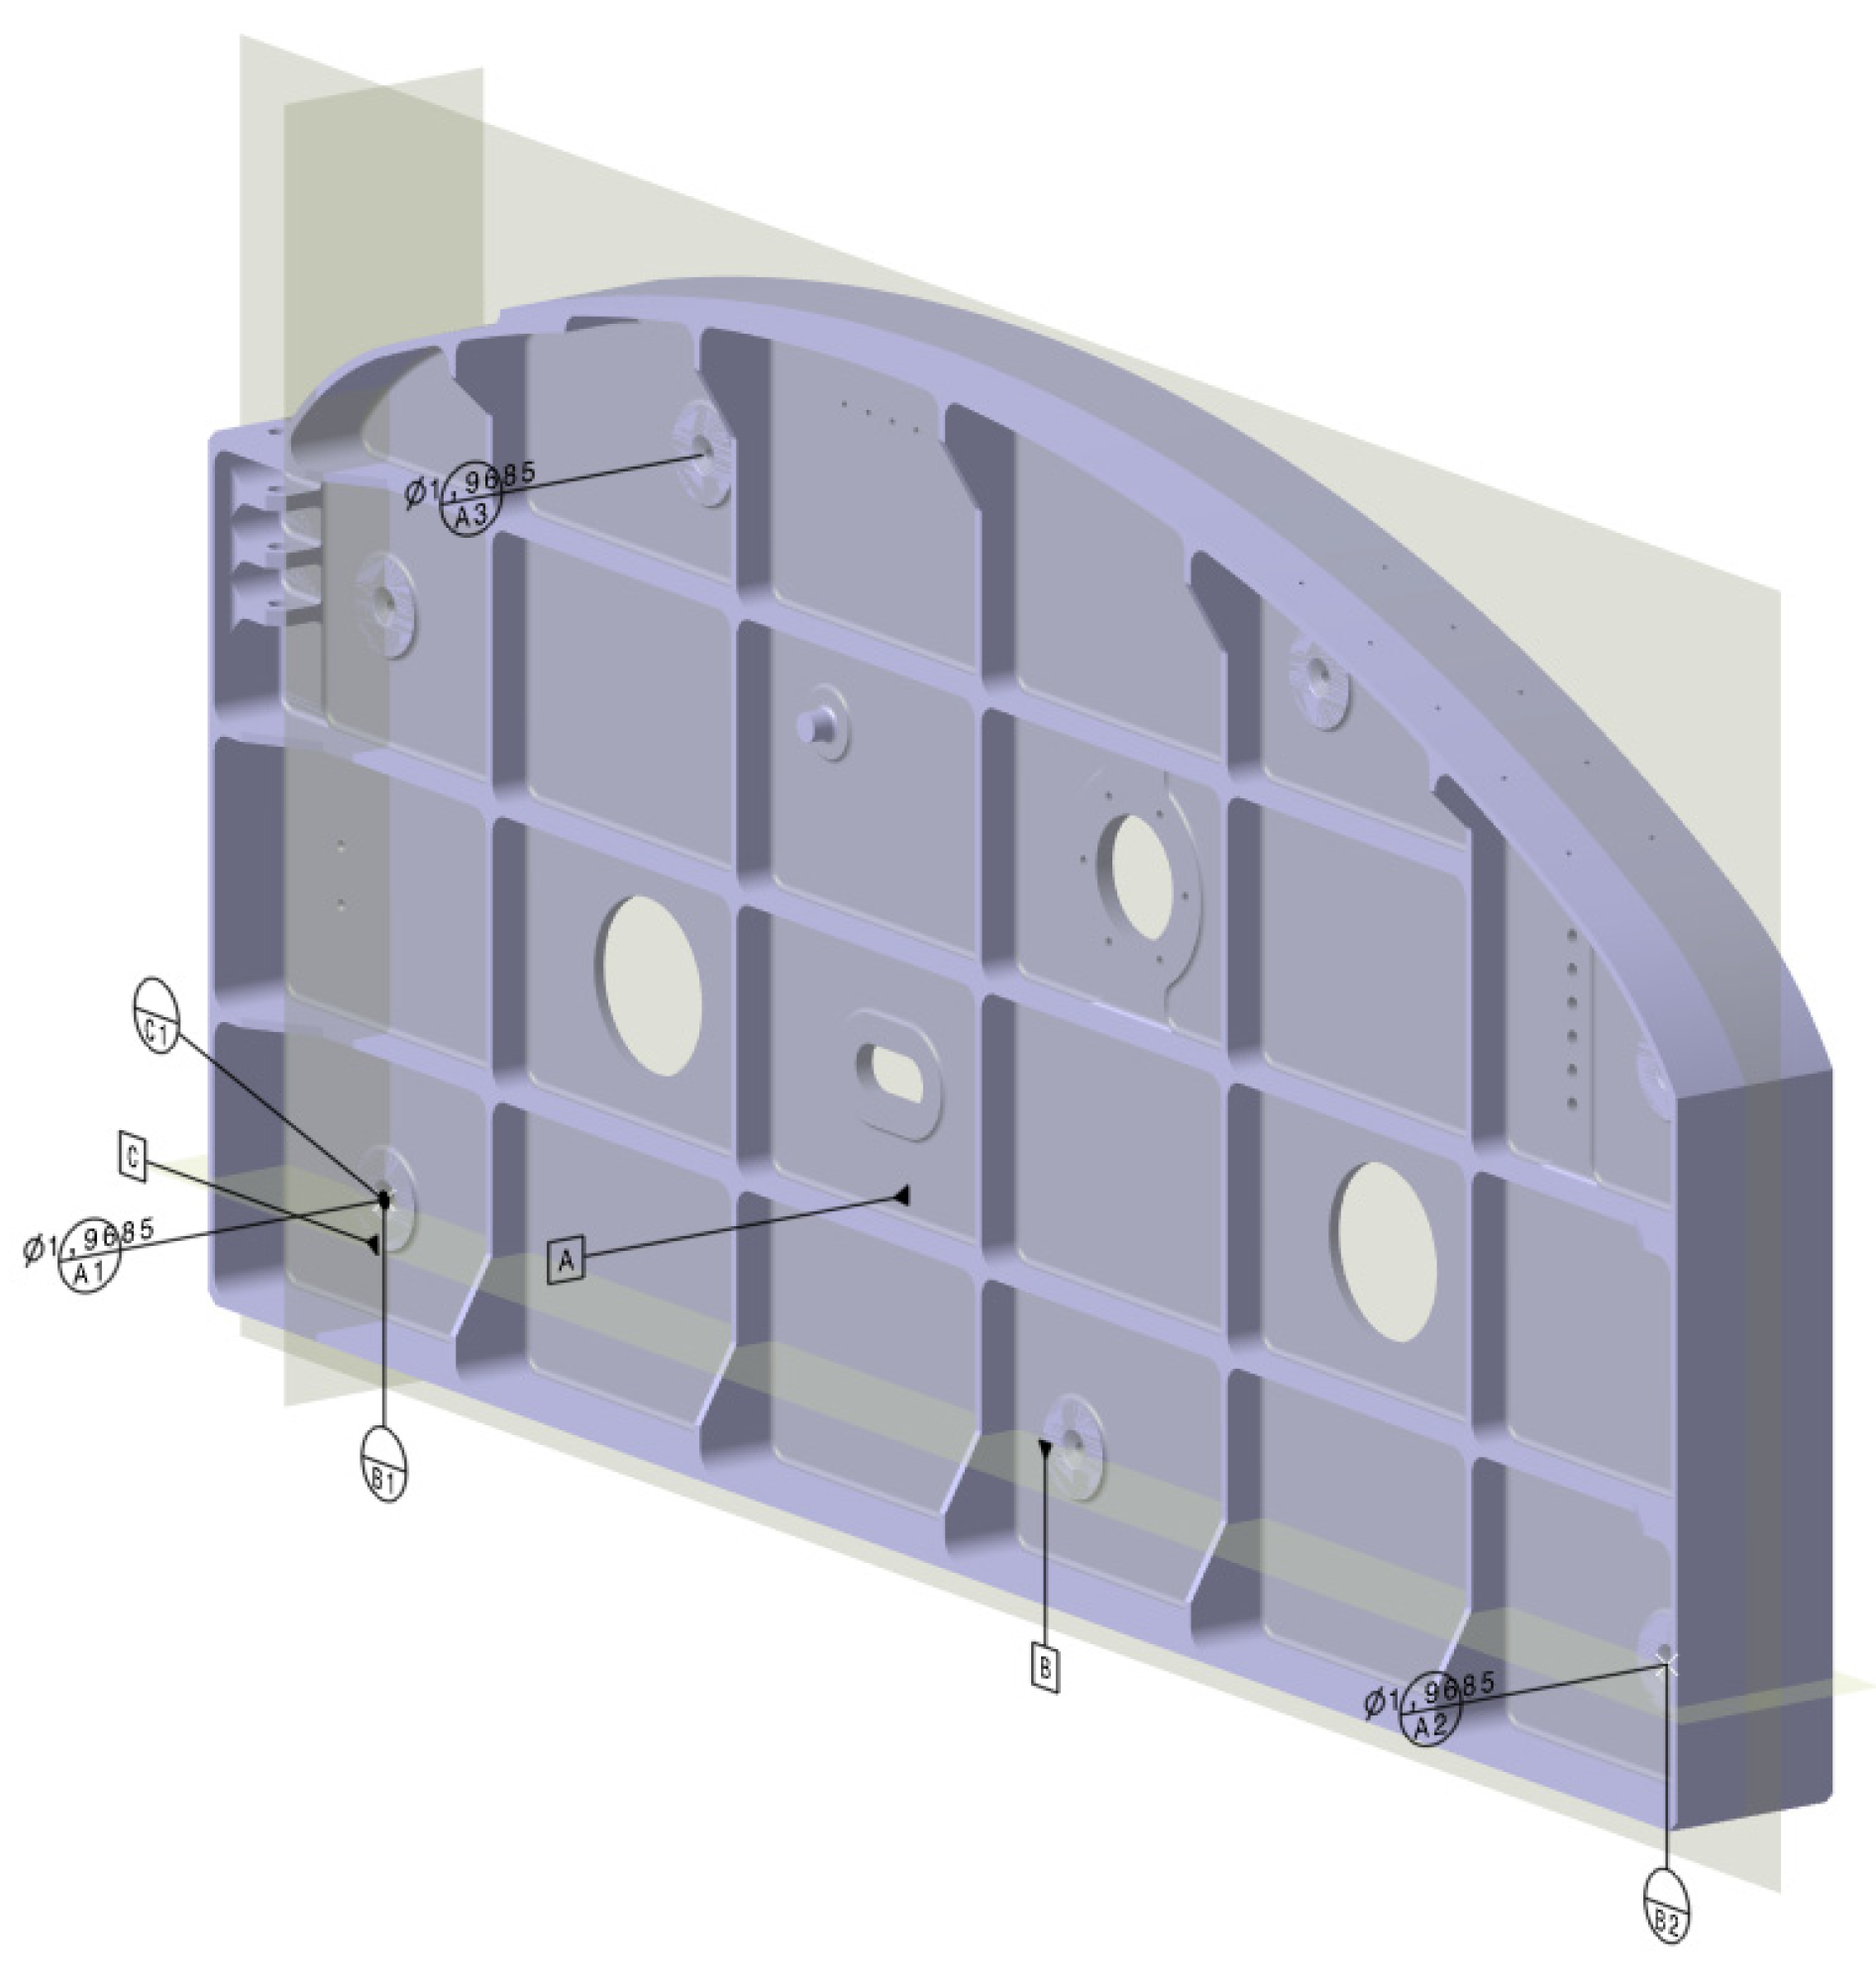
Design Definition and Functional Specification

The artefact is modelled in Catia V5 in the native CATPart file format. Two different design definitions exist due to different sets of standards regarding geometrical specifications. One CATPart model conforms to the ISO GPS set of standards and is dimensioned in millimetres, the other model conforms to ASME Y14.5-2009 and is dimensioned in inches. Tolerances and other specifications are included in each CAD model using the “Functional Tolerancing and Annotation workbench”.
The ISO and ASME models are toleranced to have analogous specifications. However, differences in the respective standards often make the tolerancing look quite different. One example is the envelope modifier (Ⓔ) for features of size, which is only used in the ISO model. This is because the ISO envelope specification is analogous to the default ASME size specification, and consequently the symbol is not included in the ASME Y14.5 standard.

Material and Surface Treatment

The artefact material is aluminium alloy Al 7075. The part is anodized and painted with primer. In certain areas the primer is omitted, and in certain areas the used primer is replaced with another primer as indicated in the design definition model.

Main Datum Reference System

The main datum reference system is a 3-2-1 system (Plane-Line-Point), defined by target points as shown in Figure 15 (ISO model) and Figure 16 (ASME model).

MPQP Data and Information Access and Further Reading

For a more comprehensive understanding of the MPQP geometrical product specification a detailed description of the MPQP’s test artefact’s tolerance allocation, definition, and specification is provided, see Appendix A.

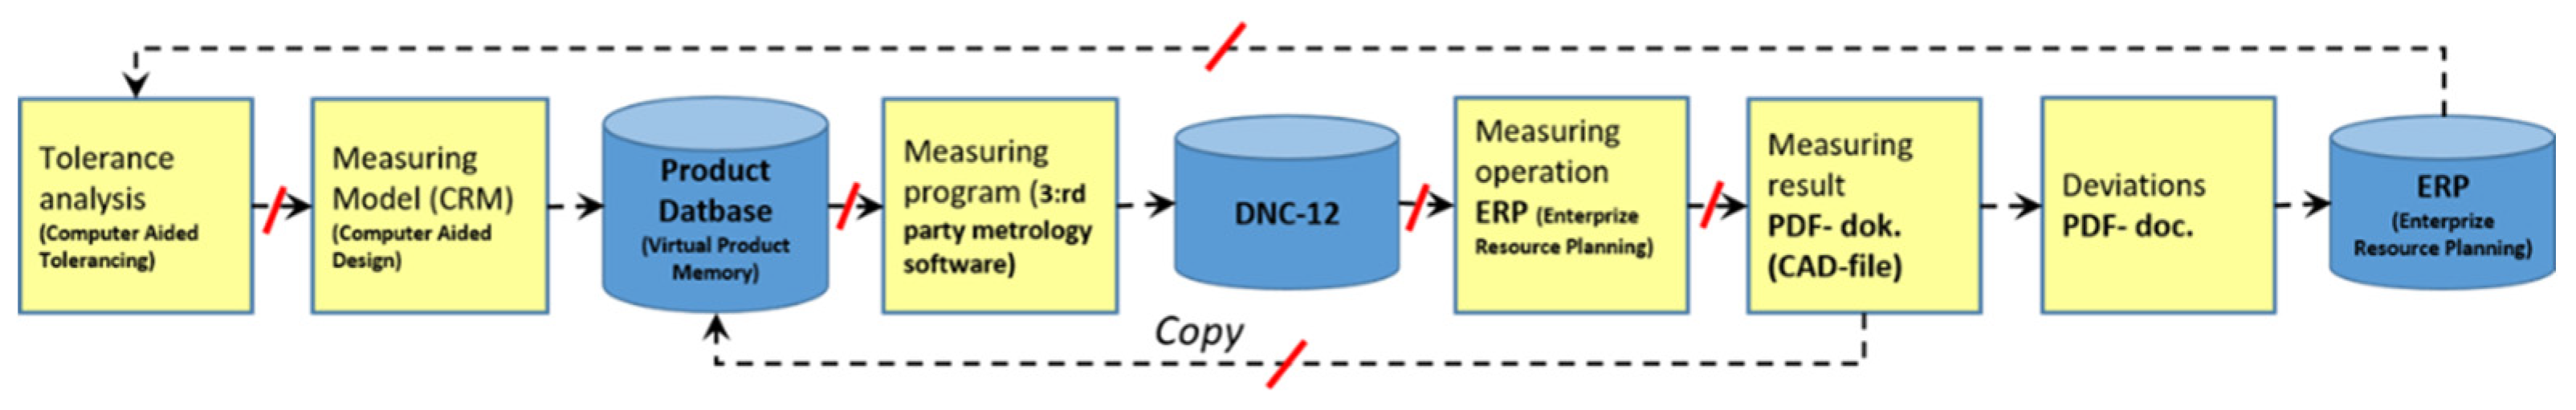
3.2.3. The Current Saab Dimensional Management and Metrology Process

The Saab dimensional management and metrology data and information process activity model, Figure 17, is logical and has connections between fragmented data, individual documents, and different file formats. However, broken digital data threads, red slashes in Figure 9, exist between software applications and in different file formats. Data and documents are, in some activities, created manually for single use, where needed. Static 2D (Two Dimensional) documents and various file formats that cannot be reused co-exist. A large amount of time-consuming manual work has been identified. The process lacks the ability to handle SPC (Statistical Process Control), repeatability studies, GR&R (Gauge Repeatability and Reproducibility) studies, and MSA (Measurements System Analysis) outcomes in an automated manner and within the digital thread.
From this survey of the Saab dimensional management and metrology process, one can observe and conclude the potential for improvements. This study shows that an unbroken chain of data and information can be accomplished through the adoption of new software tools and international standards which support the 3D model-based practice where data and information is defined and specified once and later used, re-used, and consumed downstream of the seemlessly and semantically connected digital thread. This is the ultmate goal of the work Saab is trying to reach. Saab wants to achieve an connected, interconnected, end-to-end solution which means that data and information are transfered across borders within the PLM (Product Lifecycle Management) and OT (Operational Technology) systems, i.e., this mean communication of data and information from the office to the workshop and back and forth as needed. The “heart and pump” of the system is where data is stored and retrieved in real time from the central measurement TPS/TPD (Technical Product Specification/Technical Product Documentation) database. A functional and holistic system that can handle this digital transition needs to be explored, tested, and verified.

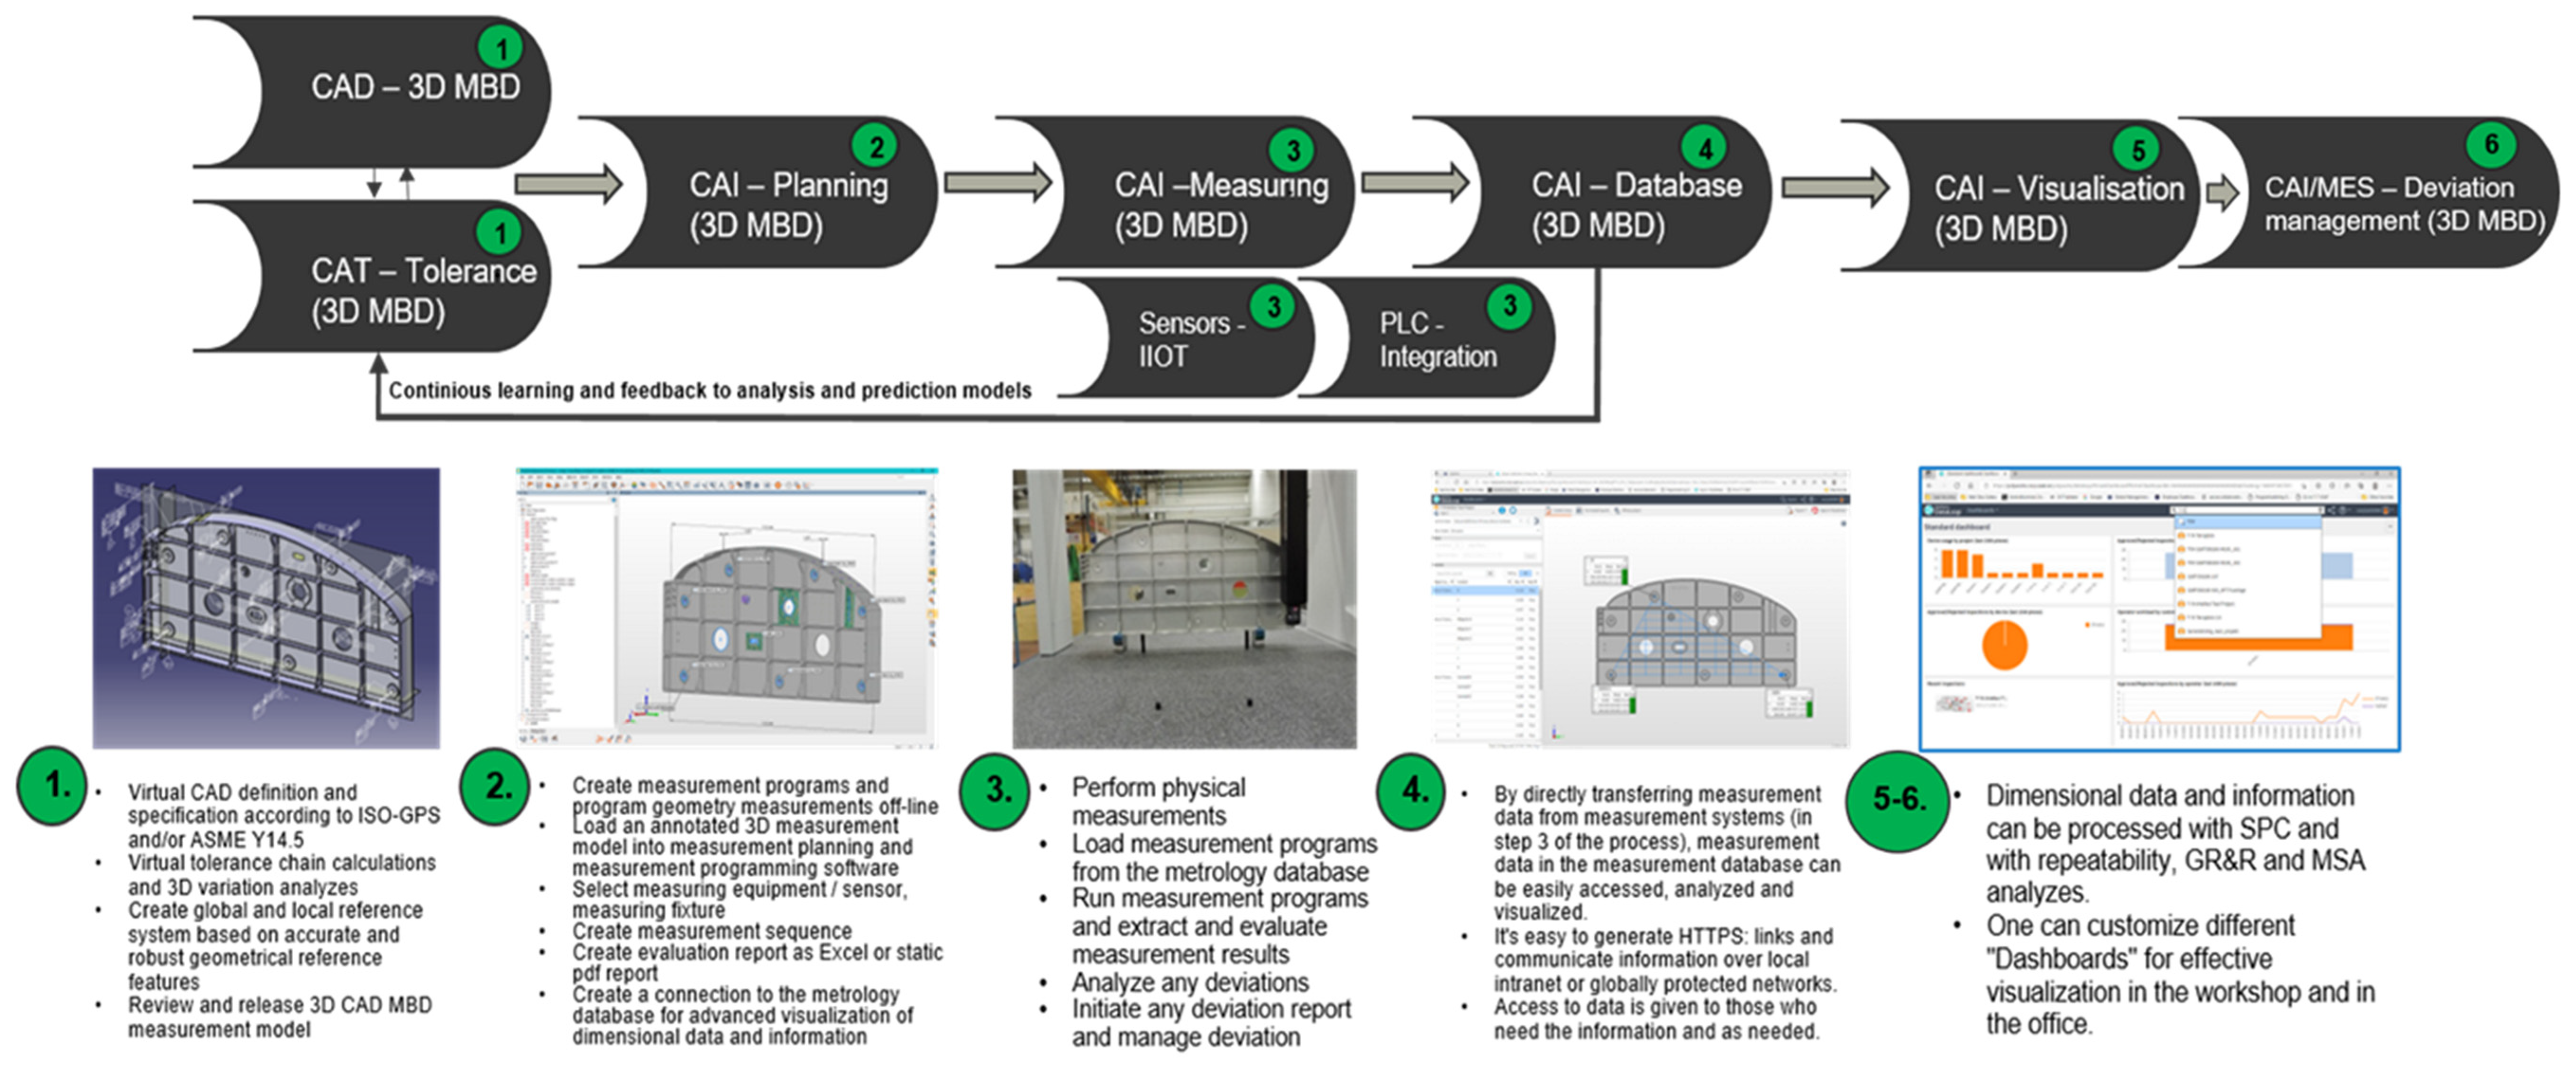
3.3. Analyze the Desirable and Explore What Has Never Been

Saab’s vision and future state is to digitize the complete dimensional management and metrology data and information process as illustrated in Figure 18. The generic digital thread for dimensional measurements has been mapped and is presented and illustrated throughout the Product Lifecycle Management and Operational Technology domains. In Figure 18, the MPQP test artefact is used as an example to illustrate the different process steps and what requirements and what activities are performed in each step. There is not much human intervention in the data management. Most of the work is digitized and automated and is carried out and managed by the computers and software packages. There is still a great need to understand what data and information is transported in the connected and inter-connected digital threads and how it is used, re-used, and consumed. Therefore, a more detailed description of the data and information activity flow is illustrated in Figure 19 where the different software packages acting in the different domains (i.e., CAD/CAI) and their associated file formats are presented. One can observe and notify the importance of the central database as the “heart and pump” of the integrated, connected, and inter-connected dimensional metrology system.
In Figure 20, connected and inter-connected processes between different computer-aided software application domains are presented. The semantical data and information are flowing and transferred between the different main areas in the PLM/PDM/OT domains by the use of defined and specified information protocols. Automation of mapped data and information can be carried out using well defined, implemented, and validated API:s (Application Protocol Interfaces). In the centre and core area of the closed loop, end-to-end, dimensional management, and metrology process is the “heart” of the system, i.e., the integrated TPS/TPD (Technical Product Specification/Technical Product Documentation) database, e.g., SQL, graph-based. The database is acting locally through different connections, e.g., API:s and HTTPS: transferring systems. Data and information from TPS (Technical Product Specification) and TPD (Technical Product Documentation) is locally stored and retrieved and used for, e.g., real time control and monitoring of dimensional measurement data and information generated in airframe manufacturing and assembly operations.
In this closed-loop, end-to-end process, Saab is using a 3D model-based definition and enterprise methodology solution. The principal idea is that the 3D model is carrying all necessary data and information for downstream processes and data and information is shared, used, re-used, and consumed in those specific downstream processes. Starting with geometry assurance activities, illustrated in the process “Improve”/“Design” phase, Figure 20. Here the dimensional management engineer performs conceptual design work, e.g., defining and specifying optimized locating schemes to secure a robust positioning system during the airframe assembly of parts. Advanced 3D variation simulations are performed to predict the variation in the critical dimensions of the final airframe assembly. Key inputs to the 3D variation simulation are part geometries, information about assembly sequences and fixturing, and empirical knowledge, e.g., inspection data, or proven dimensional tolerances on the part level. The analysis is conducted iteratively to find a reasonable set of part tolerances, i.e., finding limits for maximum allowed variations on the part level with a technically and economically acceptable cost in mind. The tolerance calculations and 3D variation simulation can be completed in a standalone CAT (Computer Aided Tolerancing) software, such as RD&T [36], or be integrated and connected by a direct plug-in and API into CAD systems, for example in Cetol 6σ [37]. When the definition and specification phase, i.e., the “Improve”/“Design” phase, is completed the dimensional management engineer has produced a robust airframe design taking into account manufacturing variation, and ultimately dimensional measurement uncertainty, in their prediction models. A complete and unambiguously specified design and 3D model has been produced. This 3D model is handed over to the dimensional metrology engineer who now can start the inspection planning and programming work. However, using the current methodology, the metrology engineer needs to make the CAD 3D model measurable. In the future, Saab is looking into the integration of a metrology planning plug-in tool in the CAD system, e.g., InnovMetric PMI+Loop™ [38]. With this tool, the measurement planning activity, e.g., creating the dimensional controls and definition of features to be measured and evaluated, starts. The estimated savings after the introduction of a new CAD integrated metrology planning software tool is in the region of 50% reduction in man-hours and its associated costs. As shown by the research, the most important goals and purposes of a CAD integrated planning software tool are as follows:
  • It entails secured and fast communication within the data and information flow while initiating and maintaining the digital thread and its traceability.
  • It simplifies the preparation of dimensional inspection projects in 3rd party metrology software packages.
  • After a new CAD revision, it will simplify the update of an existing dimensional inspection project in metrology software packages.
  • The dimensional and geometrical deviation management will become more efficient, e.g., when a designer can access the measuring results directly from the CAD MBD platform and analyze the result in its complete context.
In the next “Build” phase, as shown in Figure 20, the 3rd party metrology system is integrated in order to communicate with the MES (Manufacturing Execution System). Here the MES system gives operational command to the metrology system and a measurement cycle of an airframe assembly starts. When ready, a signal is sent back to the MES system confirming if the measurement was correct or not. If the measurement was correct, the MES system executes the next operation in the production process. If the measurements were not correct, the MES system triggers and initiates the deviation management process. Three-dimensional measuring instruction support is also needed at this point. This means that the measuring technician needs support before and after the measuring operation, i.e., 3D visual instructions about the measuring setup and disassembly and before the actual physical measurements can start. Then, in the “Measure” phase, Figure 20, the metrology engineer starts to off-line program and simulate the measurements. The software applications generate a complete, verified, validated, and executable dimensional measuring program. In addition, measuring templates and connections to the TPS/TPD database are constructed and the measuring program is updated accordingly. Then, in the final “Improve” phase, Figure 20, the dimensional management and metrology engineers retrieve data from the TPS/TPD database to learn and to improve the prediction models, measuring models, and measuring programs that were created in the “Design and Build” phase, and use the knowledge for continuous learning; knowledge is also reused in new product innovation and development work.

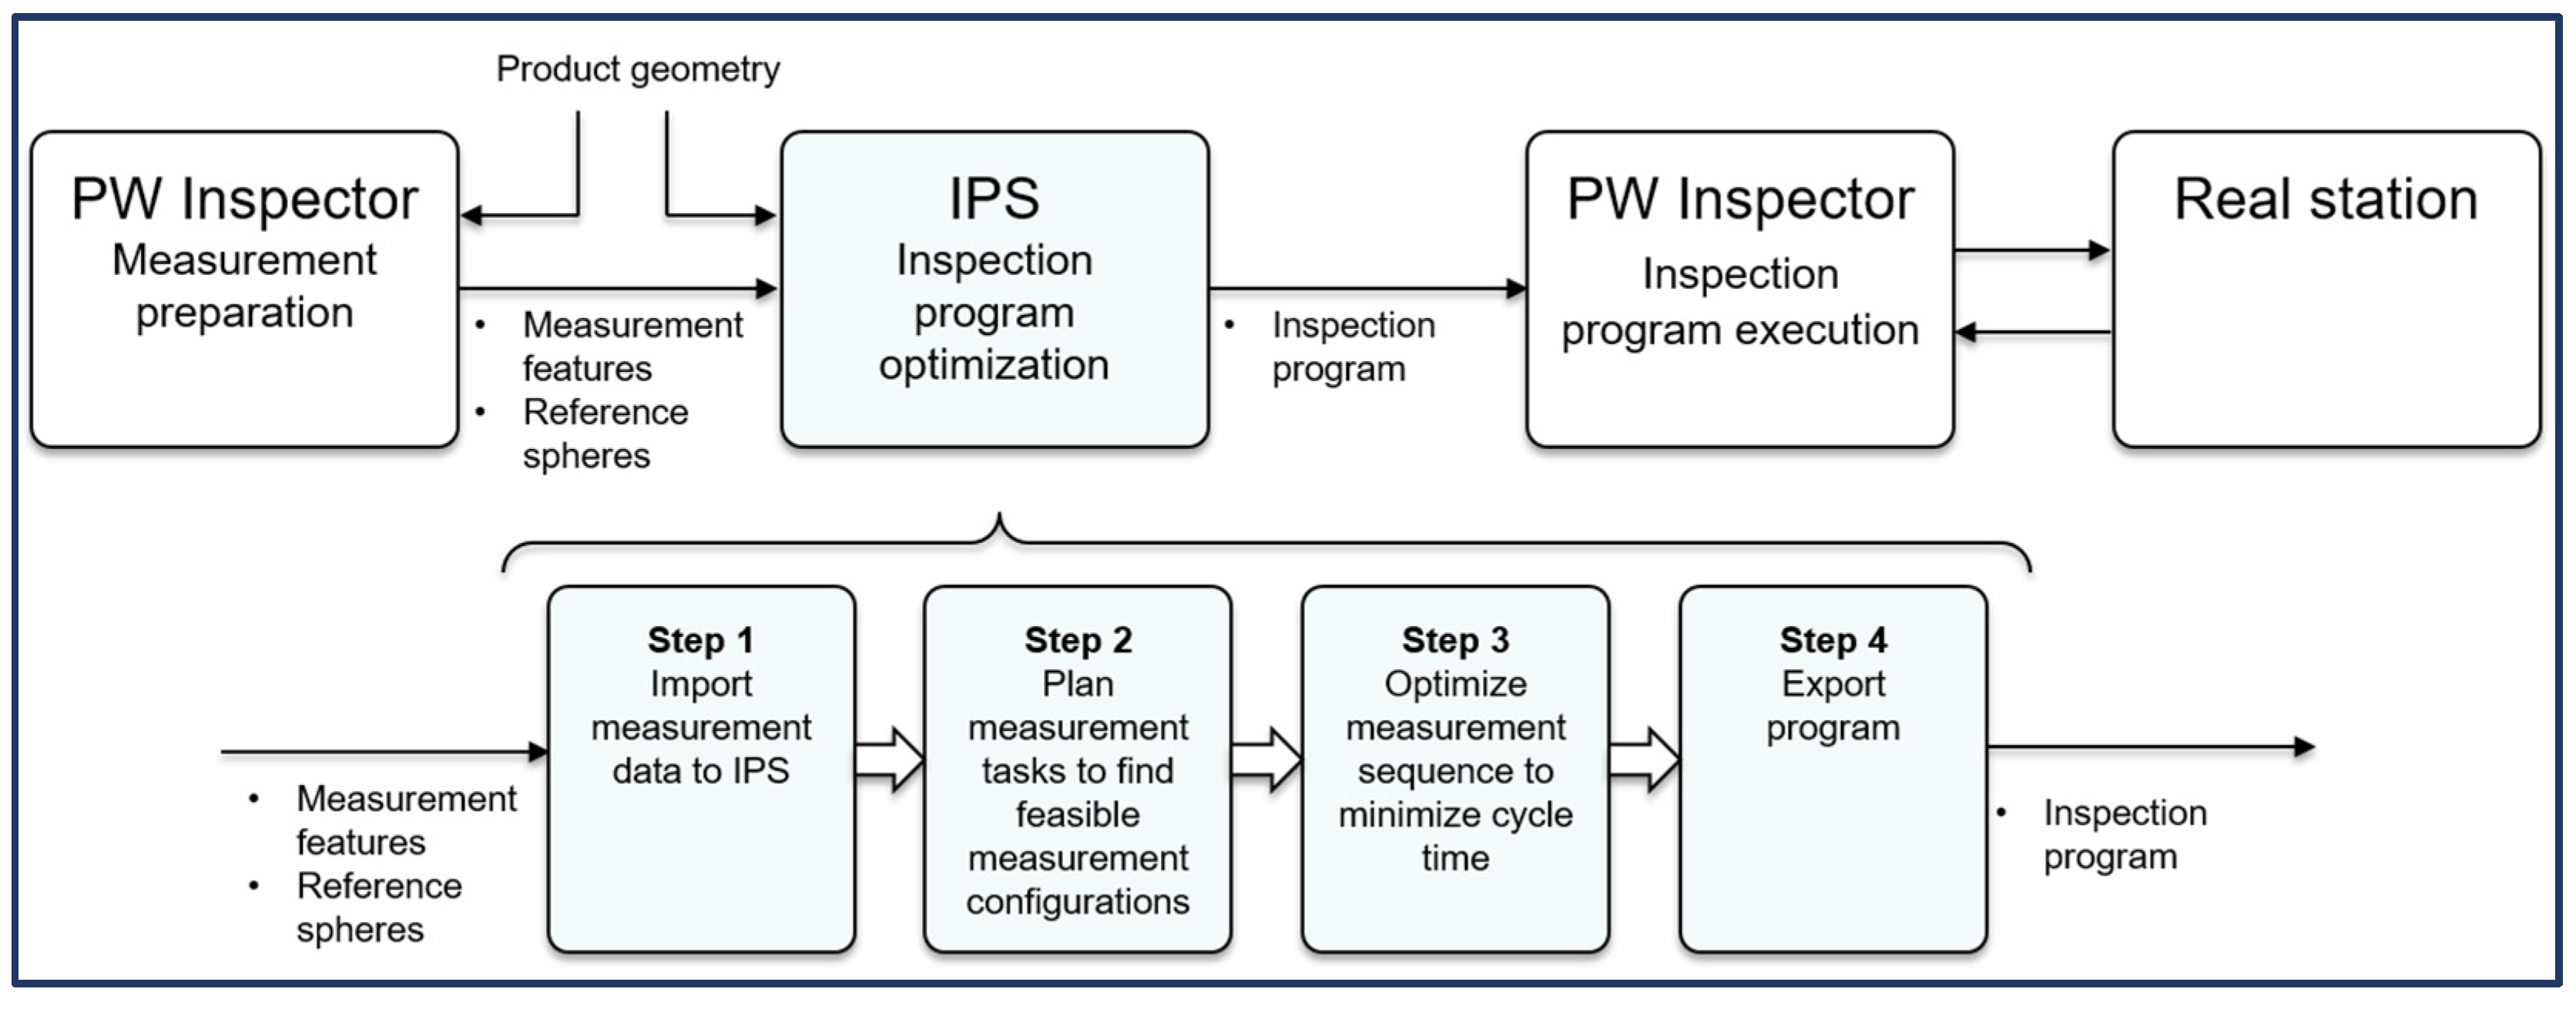
3.4. Functional Description of the Automated LVM System

The virtual and physical laser radar measuring cell was constructed and preliminarily accepted during the autumn of 2021. The measuring cell has acted and will continue to act as a “clinical research lab”. The laser radar measuring system cell is constructed and comprises the following major components, Figure 21:
The data and information process acting in this measuring cell is described in Figure 22, which shows the different steps and how the system is communicating on a high level.
  • First, one starts the offline programming by reading the complete and unambigously specified 3D modeled MPQP test artefact in 3rd party metrology software.
  • Then, information about the dimensional measurements in CSV file format is generated and exported. Currently this is a manual file transfer operation, which will be automated in the future by a direct protocol-based interface.
  • The software package then generates the optimized path and sequence for the dimensional measurements. One CSV file and multiple text files to be exported and imported in 3rd party metrology software are generated. There is one macro to manage the update of the measuring sequence.
  • Now a measuring program including textfiles that are being communicated and translated to OPC-UA language for PLC control is completed.

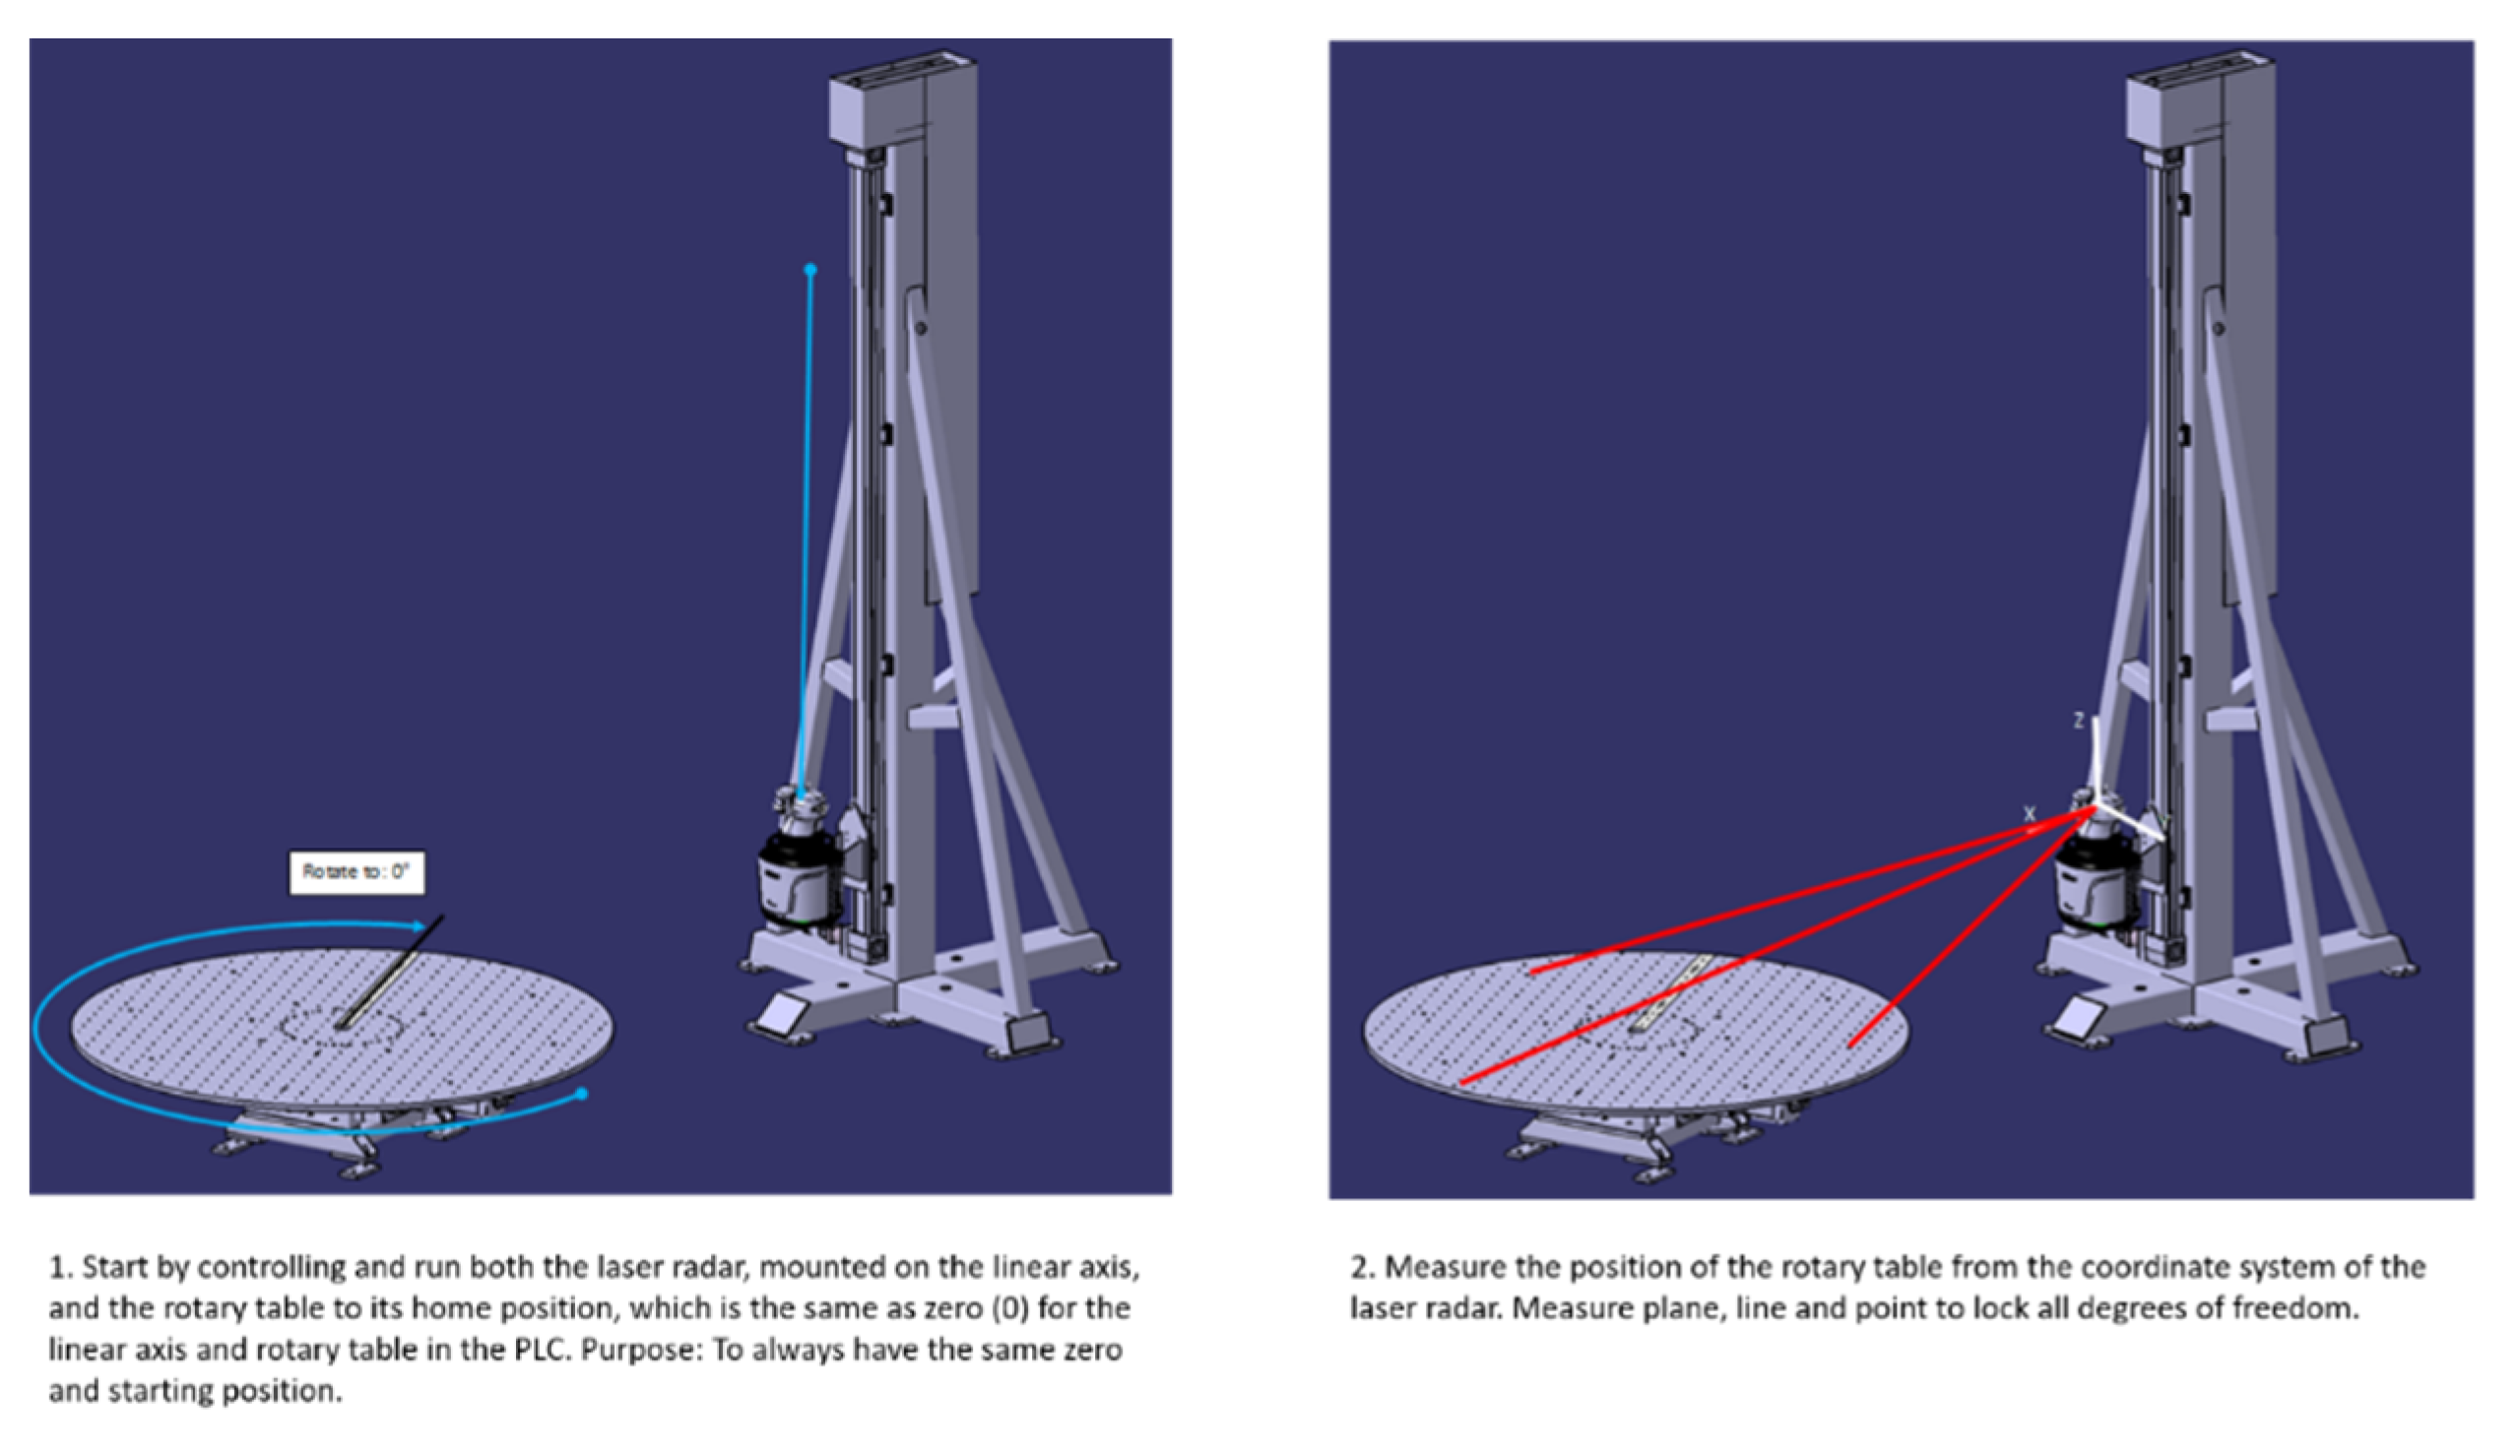
3.5. System Calibration Procedure and Method to Update the Digital Twin

The system calibration procedure and update of the digital twin model as input for the off-line programming and simulation software package is described in Figure 23, Figure 24 and Figure 25.
Currently, this procedure is a manual process performed by the measuring technician operating the metrology system. However, in the future this manual process will be automated and included in the main measuring program as a separate macro script.
The first two steps in this procedure are shown in Figure 23.
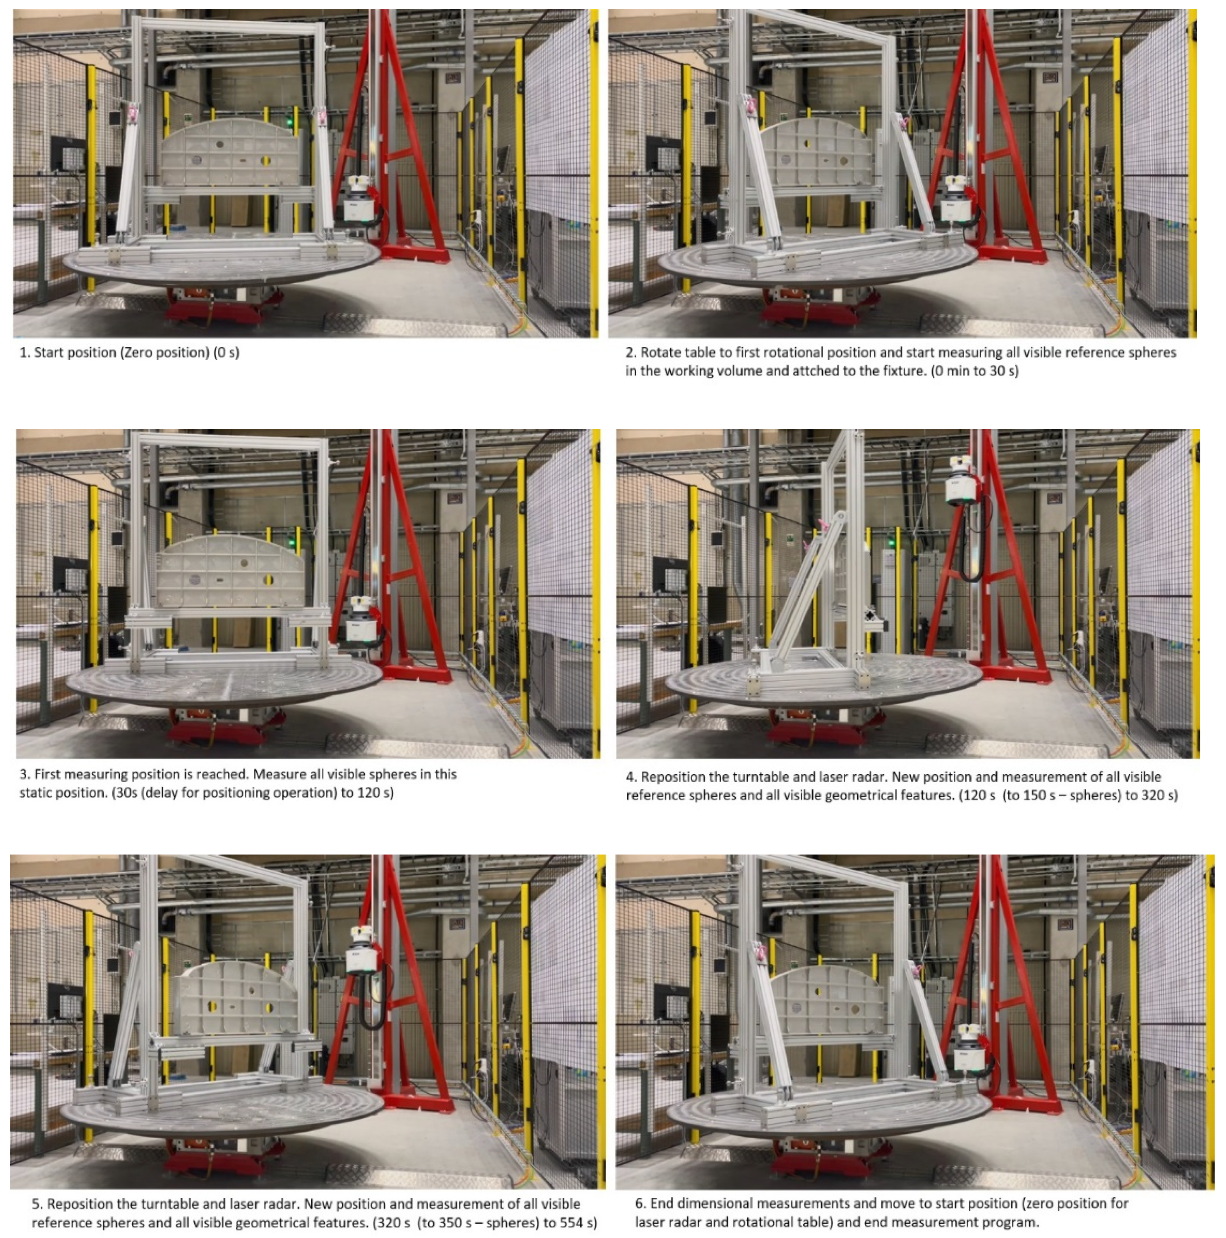
  • Start by controlling and running both the laser radar, mounted on the linear axis, and the rotary table to its home position, which is the same as zero (0) for the linear axis and rotary table in the PLC. The purpose of this is to always have the same zero and starting position.
  • Measure the position of the rotary table from the machine coordinate system of the laser radar. Measure plane, line, and point to lock all degrees of freedom.
The third and fourth steps in this procedure are shown in Figure 24.
3.
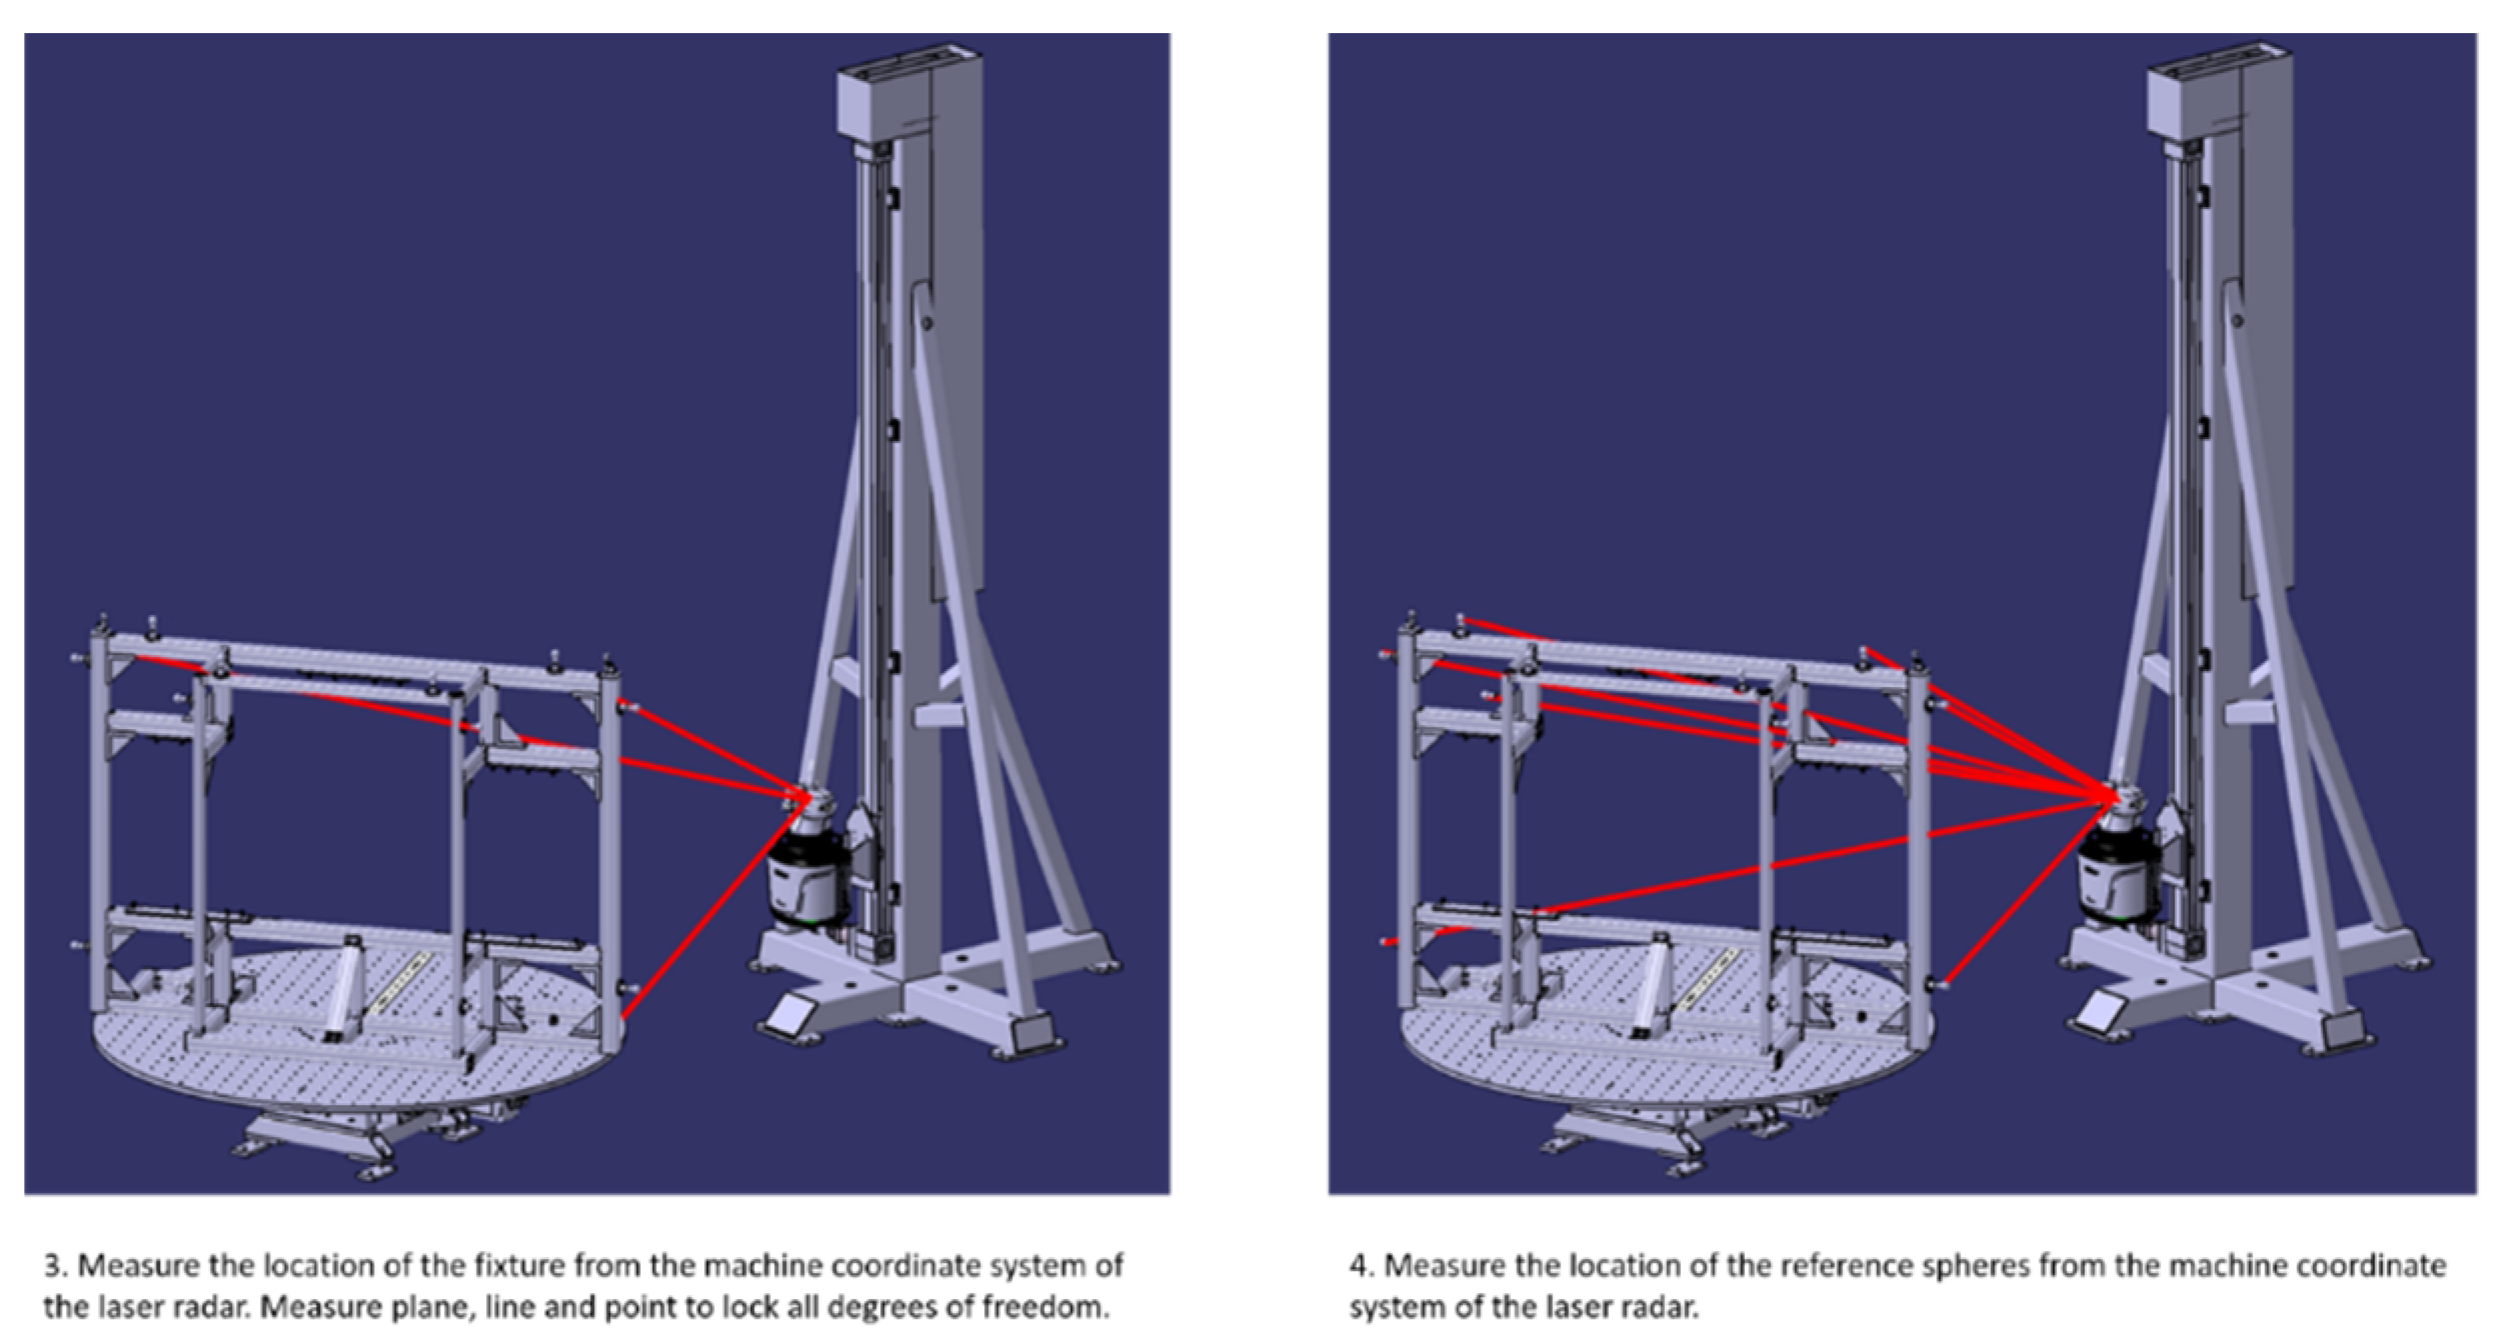
Measure the location of the fixture from the machine coordinate system of the laser radar. Measure the plane, line, and point to lock all degrees of freedom.
4.
Measure the location of the reference spheres from the machine coordinate system of the laser radar.
The last two steps in this procedure are shown in Figure 25.
5.
Define and construct the physical and real linear axis transportation line:
  • Drive the laser radar upwards to the 2-metre position.
  • Measure the reference spheres for correct positioning against the position of the laser radar in the home position.
  • Create points in the origin of the laser radar in the home position and in the position of 2 metres.
  • Create a 3-metre-long line that starts at the point in the home position and that intersects the point that is located at the 2-metre position.
There is now a digital skeleton measured from what it looks like in reality in the measuring cell. Import this skeleton into CAD (Catia V5) and change and update the start and digital twin model accordingly.

3.6. Development of Laser Radar Off-Line Programming and Simulation Capabilities

The aim of this exploration has been to examine how to facilitate the design and programming of automated laser radar concepts by means of novel simulation-based software. Tasks and problems related to many statistical combinatorial possibilities in calculations are efficiently solved by high-speed algorithm computing. However, this approach requires accurate and reliable models and digital twins that are continuously updated with real world data and information. An initially very important requirement and incentive for the development of an LR (Laser Radar) simulation software application in the Digi-Q research project is that it is interoperable and communicable with other software applications.
A case study conducted at Saab Aeronautics premises in Linköping acted as a clinical laboratory to test, verify, and validate the software functionality. The explorative work indicates that a reliable simulation-based development method can advantageously be used in the early stages in virtually designing layouts of automated dimensional metrology systems and verify and guarantee the line-of-sight of a laser light path and its allowed inclinations to a specific geometrical feature to be measured and evaluated.
The efficient inspection process implemented to support programming of automated LR inspection is built up by the following five main steps.
  • Define the inspection task by breaking down product and process requirements to geometrical inspection features, e.g., a hole, a slot, on a part and subassembly level.
  • Create parameterized inspection rules that define how a feature should be measured, i.e., number of surface points, distribution, coordinate and reference system, inclination angles.
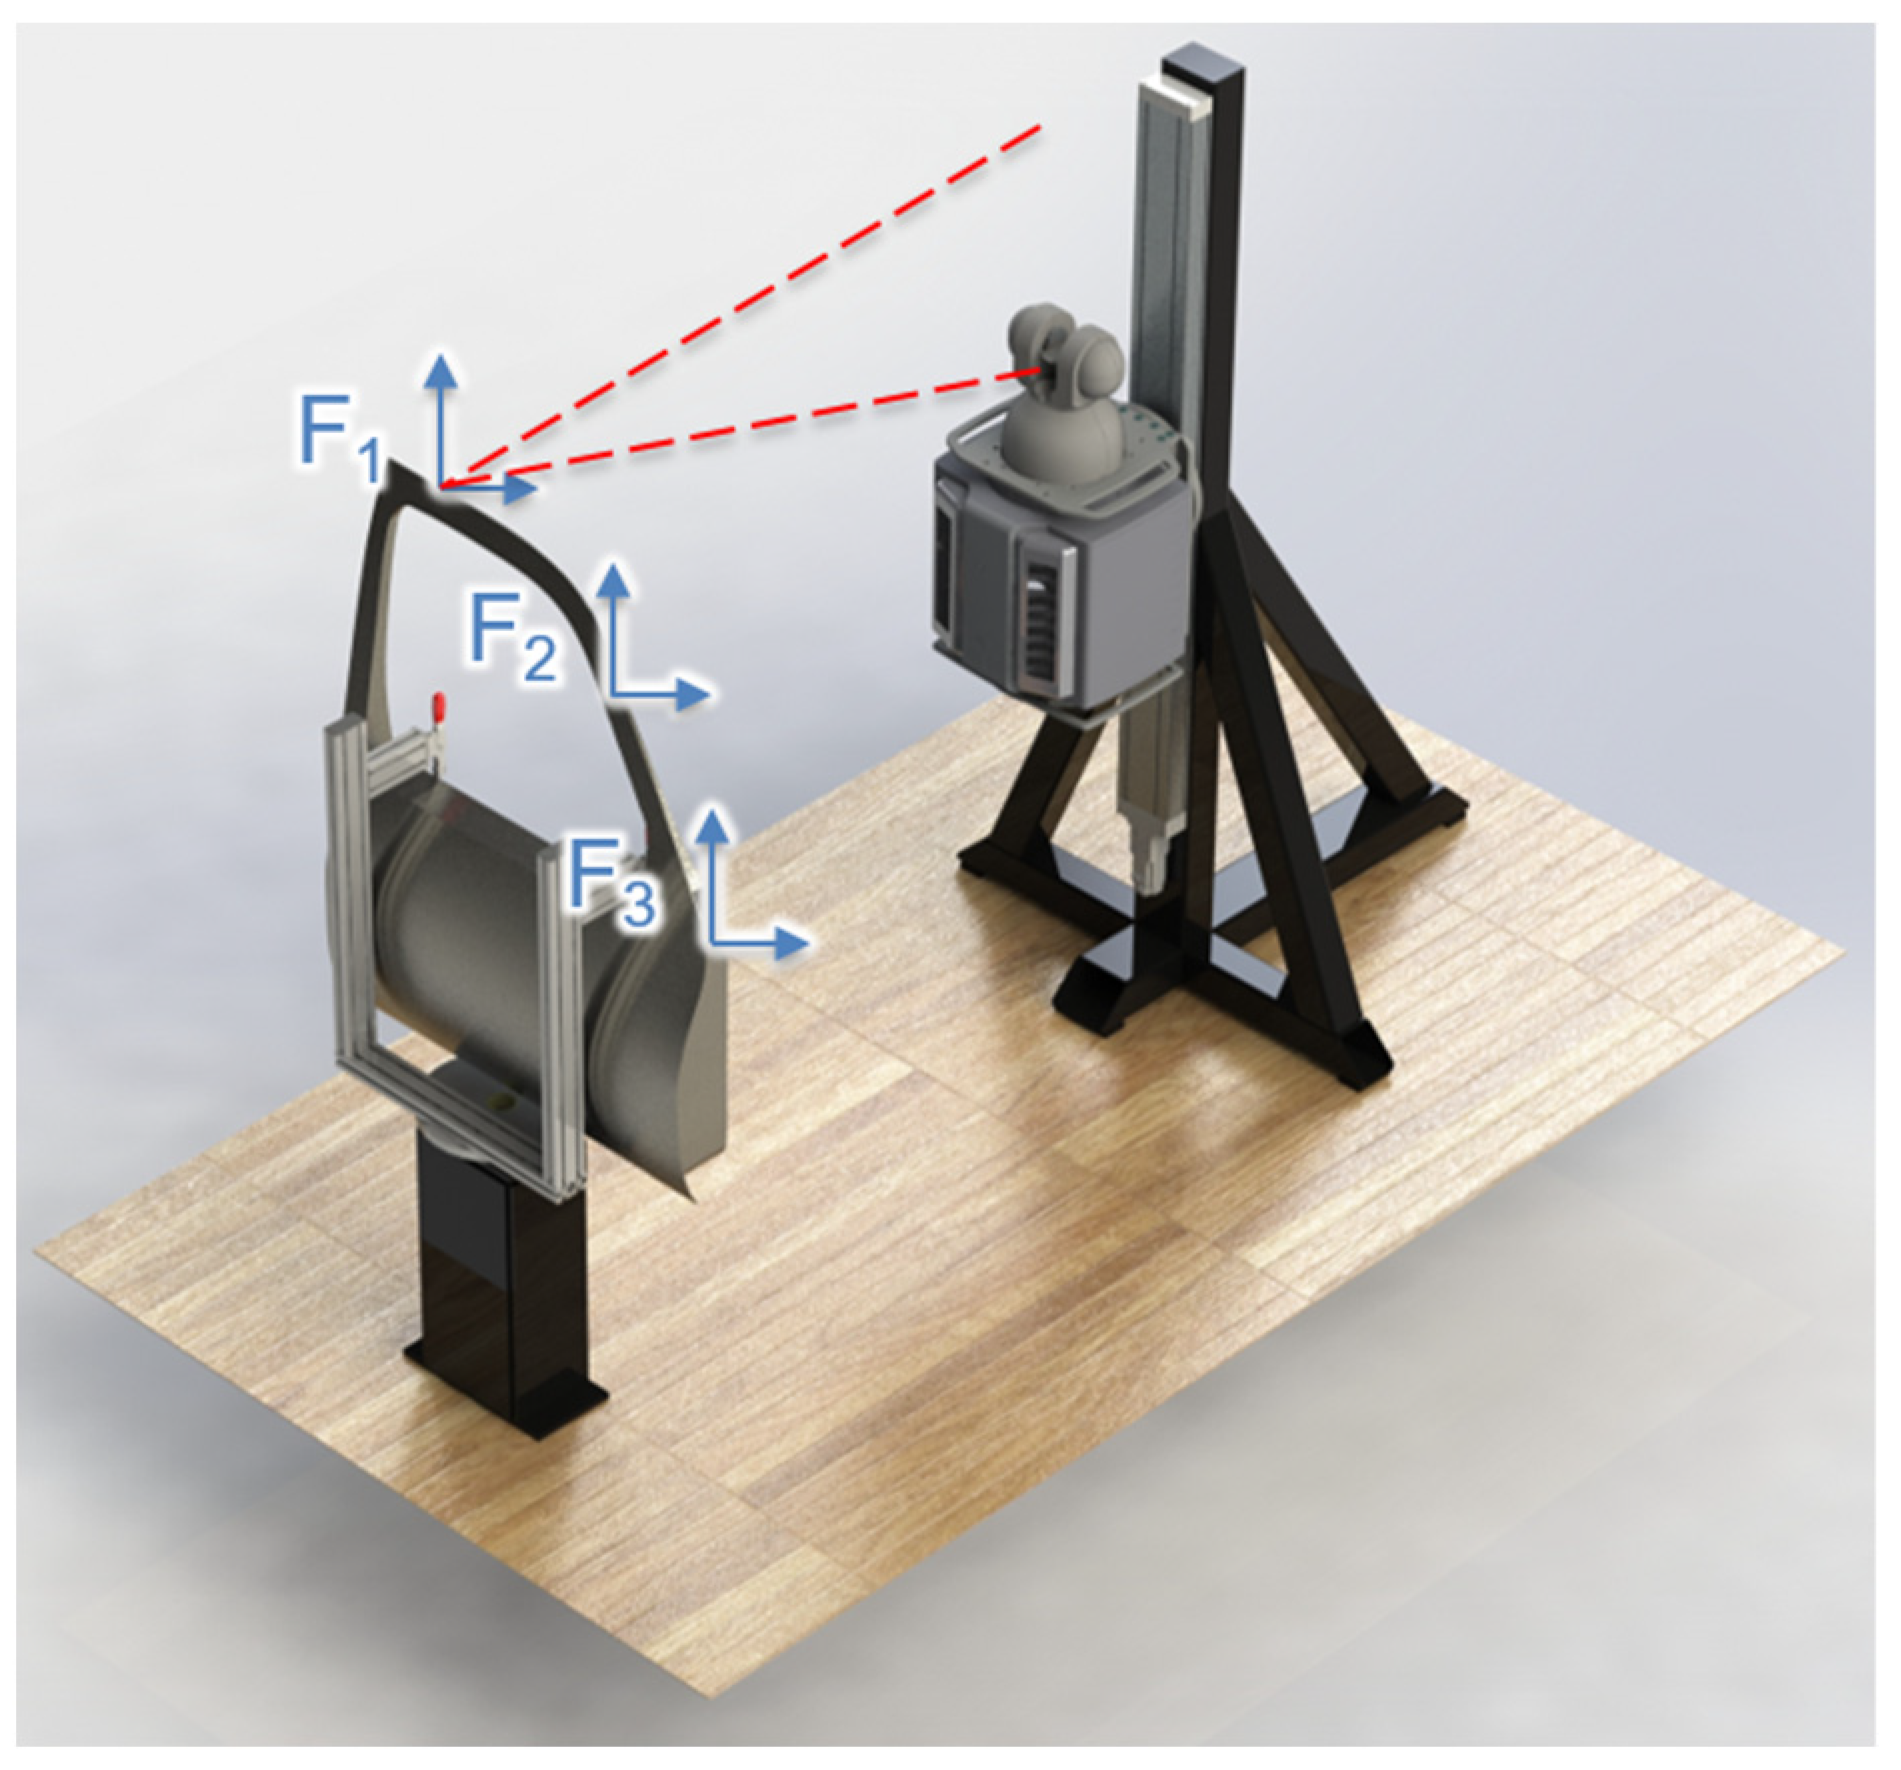
  • Perform dimensional feature accessibility analysis to find a set of LR configurations that can reach all inspection points with line-of-sight configurations.
  • Plan by math-based algorithms for motion planning and combinatorial optimization of the collision free motions and sequence of the measurement equipment to visit each feature, and
  • Generate the control code, e.g., a number of CSV files, consumed by 3rd party metrology software (the master program) to instruct the equipment to perform the actual dimensional measurements.

3.6.1. Initial Study and Development Work

During the period April–June 2021, the limitations and requirements of the existing offline simulation software were identified.
Modelling of senor including inspection rules and kinematical mechanism and constraints:
Regarding the modelling of the sensor including the inspection rules and mechanism, the following initial requirements applies and Figure 26:
LR Sensor: Azimuth α: ±180° and Elevation θ: ±45°
Mechanism: Linear ZM
Plan measurement features represented as surface vector points (x,y,z,i,j,k)–Task planning
When finding valid measurement configurations for target features, represented as surface vector points with position (x,y,z) and normal vector (i,j,k), certain inspection rules must be obeyed. Nikon and Saab provided default values for these rules in terms of, e.g., allowed cone and inclination angle.
Criteria: For each measurement feature Fi:
For n discrete positions/configurations of ZM, find α and θ such that the feature Fi is visible from the sensor, if such a solution exists, see Figure 27.
Task alternative filtering
In case of a measurement cell with many Degrees of Freedom (DOF) and/or high resolution in number of allowed mechanism configurations, the problem of finding an optimized visiting order between features can become too extensive to solve in a reasonable amount of time. For such situations, it was identified that a Task alternative filtering algorithm might be necessary.
Criteria: Minimize the number of ZM configuration alternatives, see Figure 28.
Sequencing
When valid measurement task alternatives have been found (and potentially filtered), the final step to create a valid measurement program is to find an optimized sequence for visiting all measurement tasks.
Criteria: Optimize sequence to minimize cycle time, see Figure 29.

3.6.2. Extended Study and Current State of the Work

After some intensive and focused months of software development work in modelling the sensor, the mechanism, and initial measuring rules, the work continued to establish a 3D scene of the physical and real-world metrology cell configuration. All virtual 3D models were made available and integrated in the Catia V5 CAD software platform. The complete model of the 3D scene was modelled in Catia V5, which is the authoritative CAD tool at Saab. All models were saved and archived in Enovia VPM (Virtual Product Management) database. The starting model in Catia V5 was imported into the software application to create the new 3D scene, Figure 30.
The offline software was adapted to support Laser Radar key capabilities:
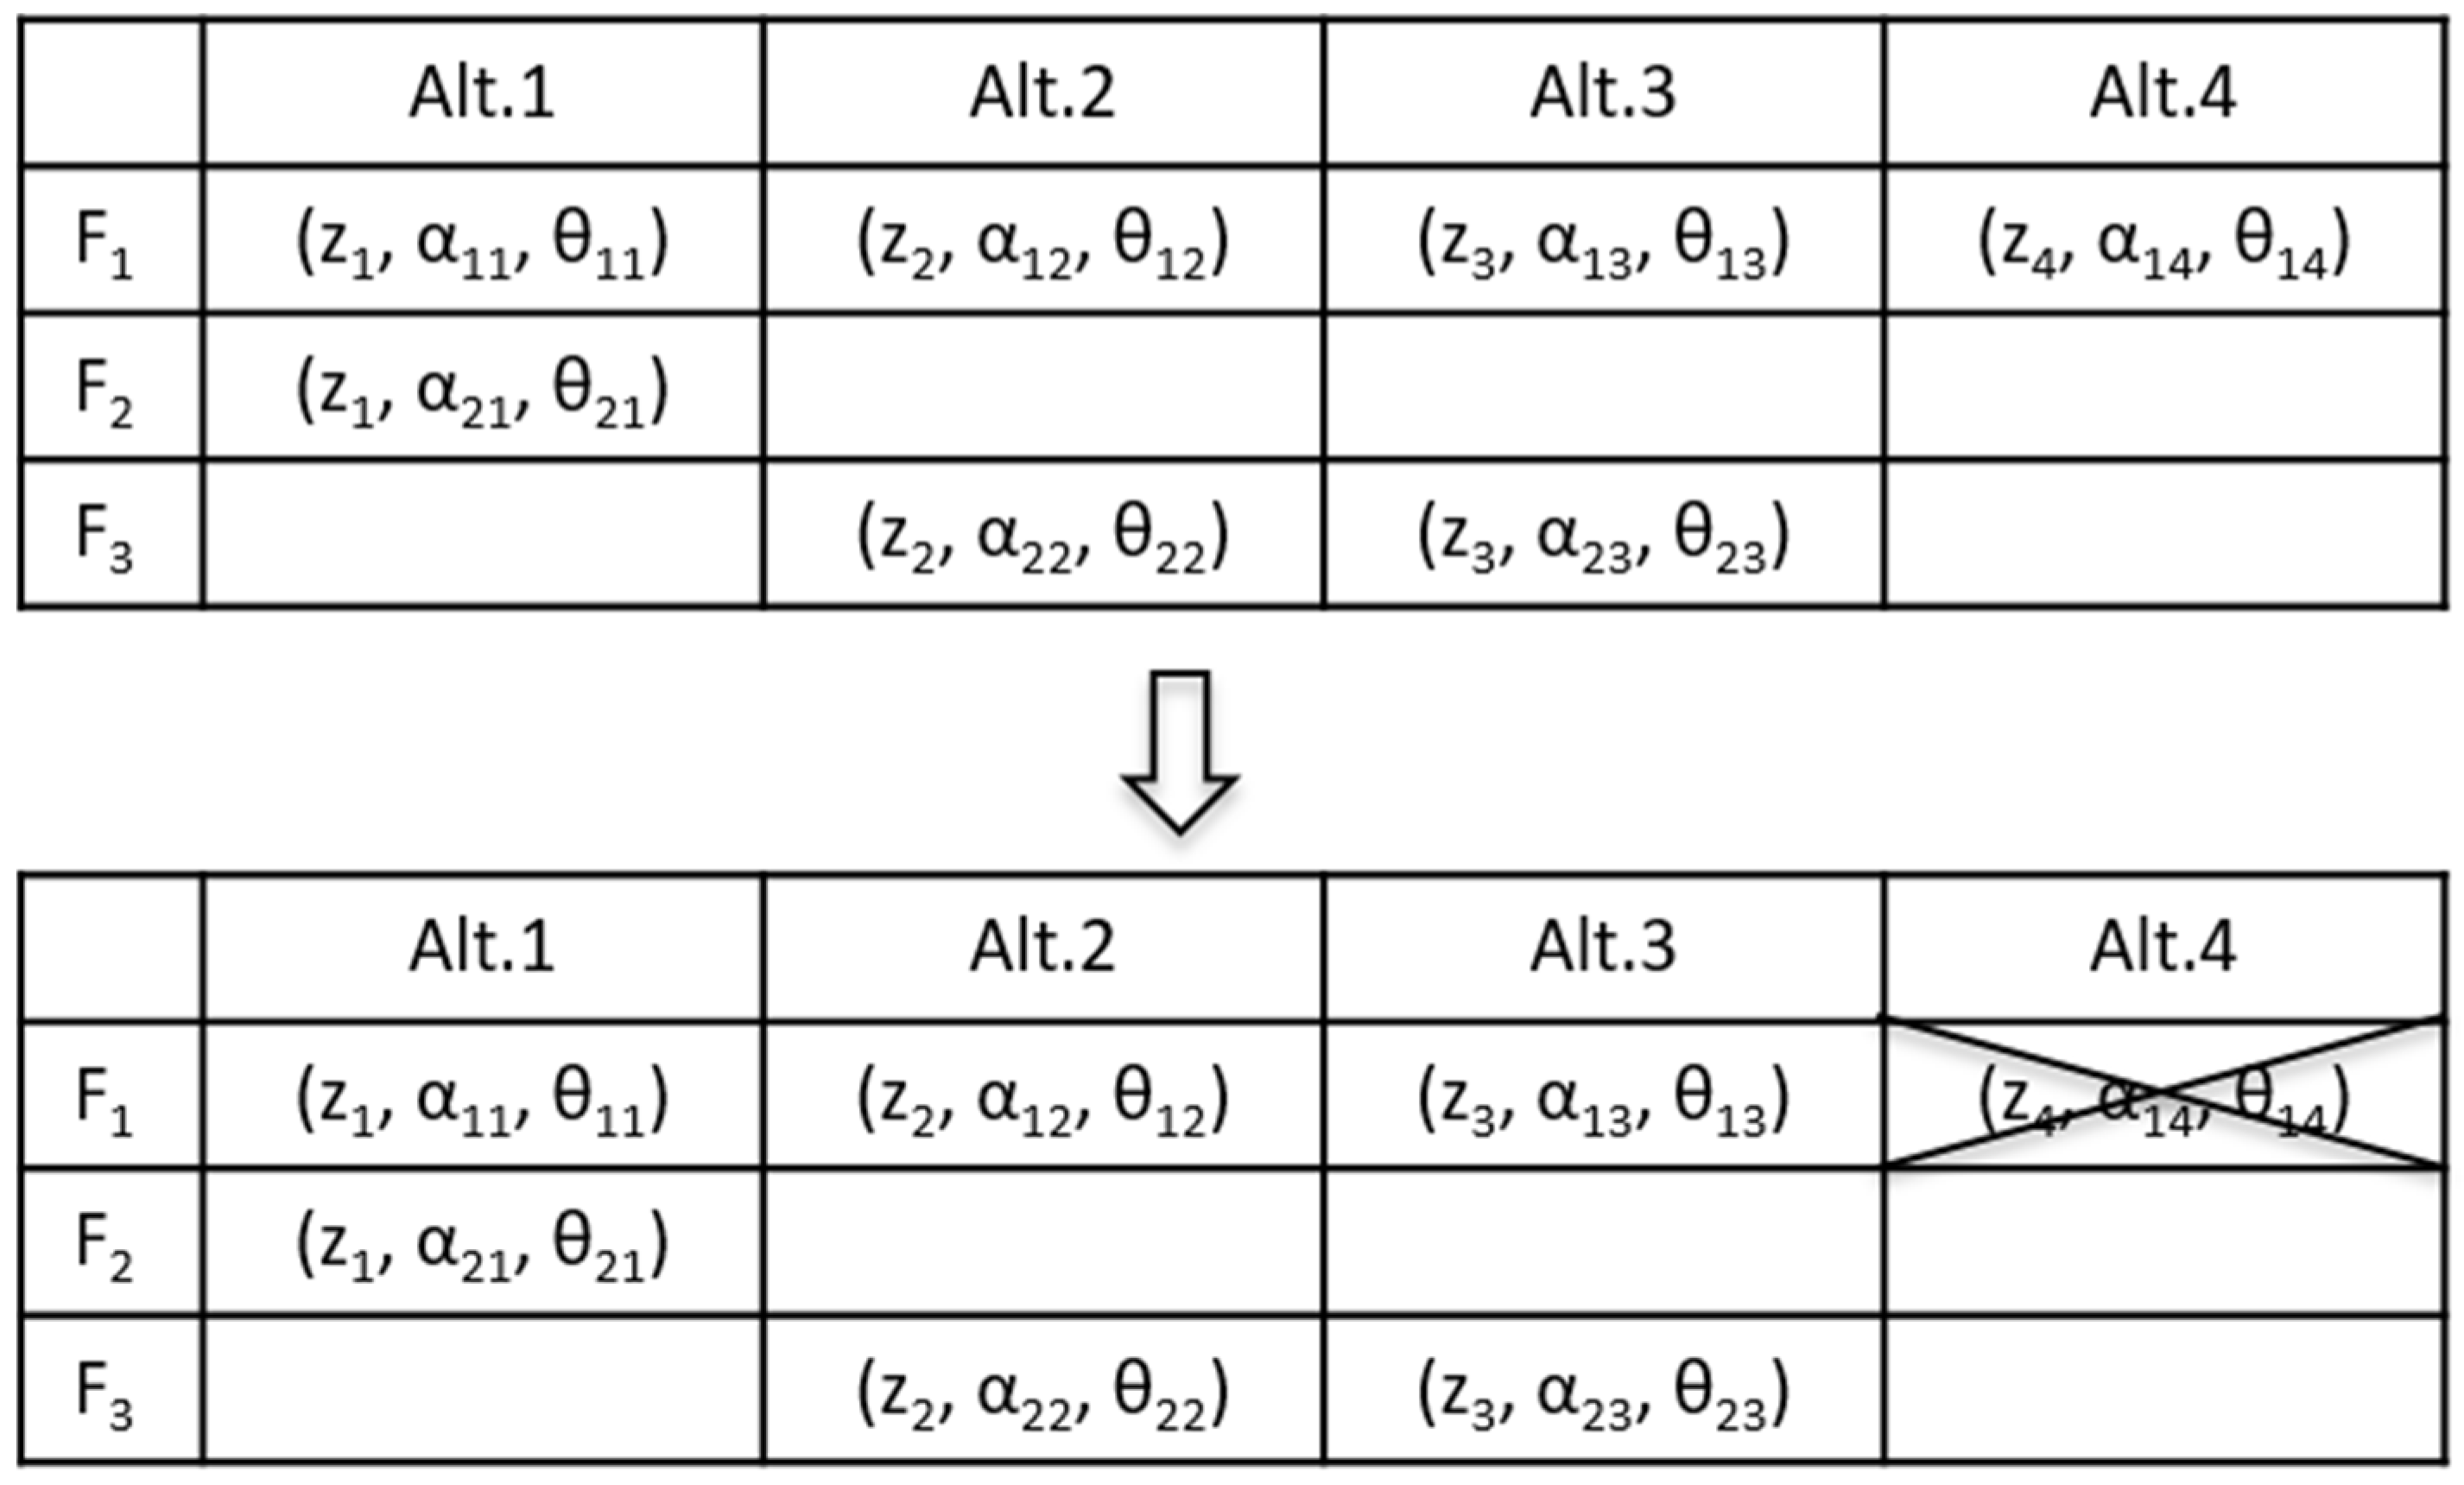
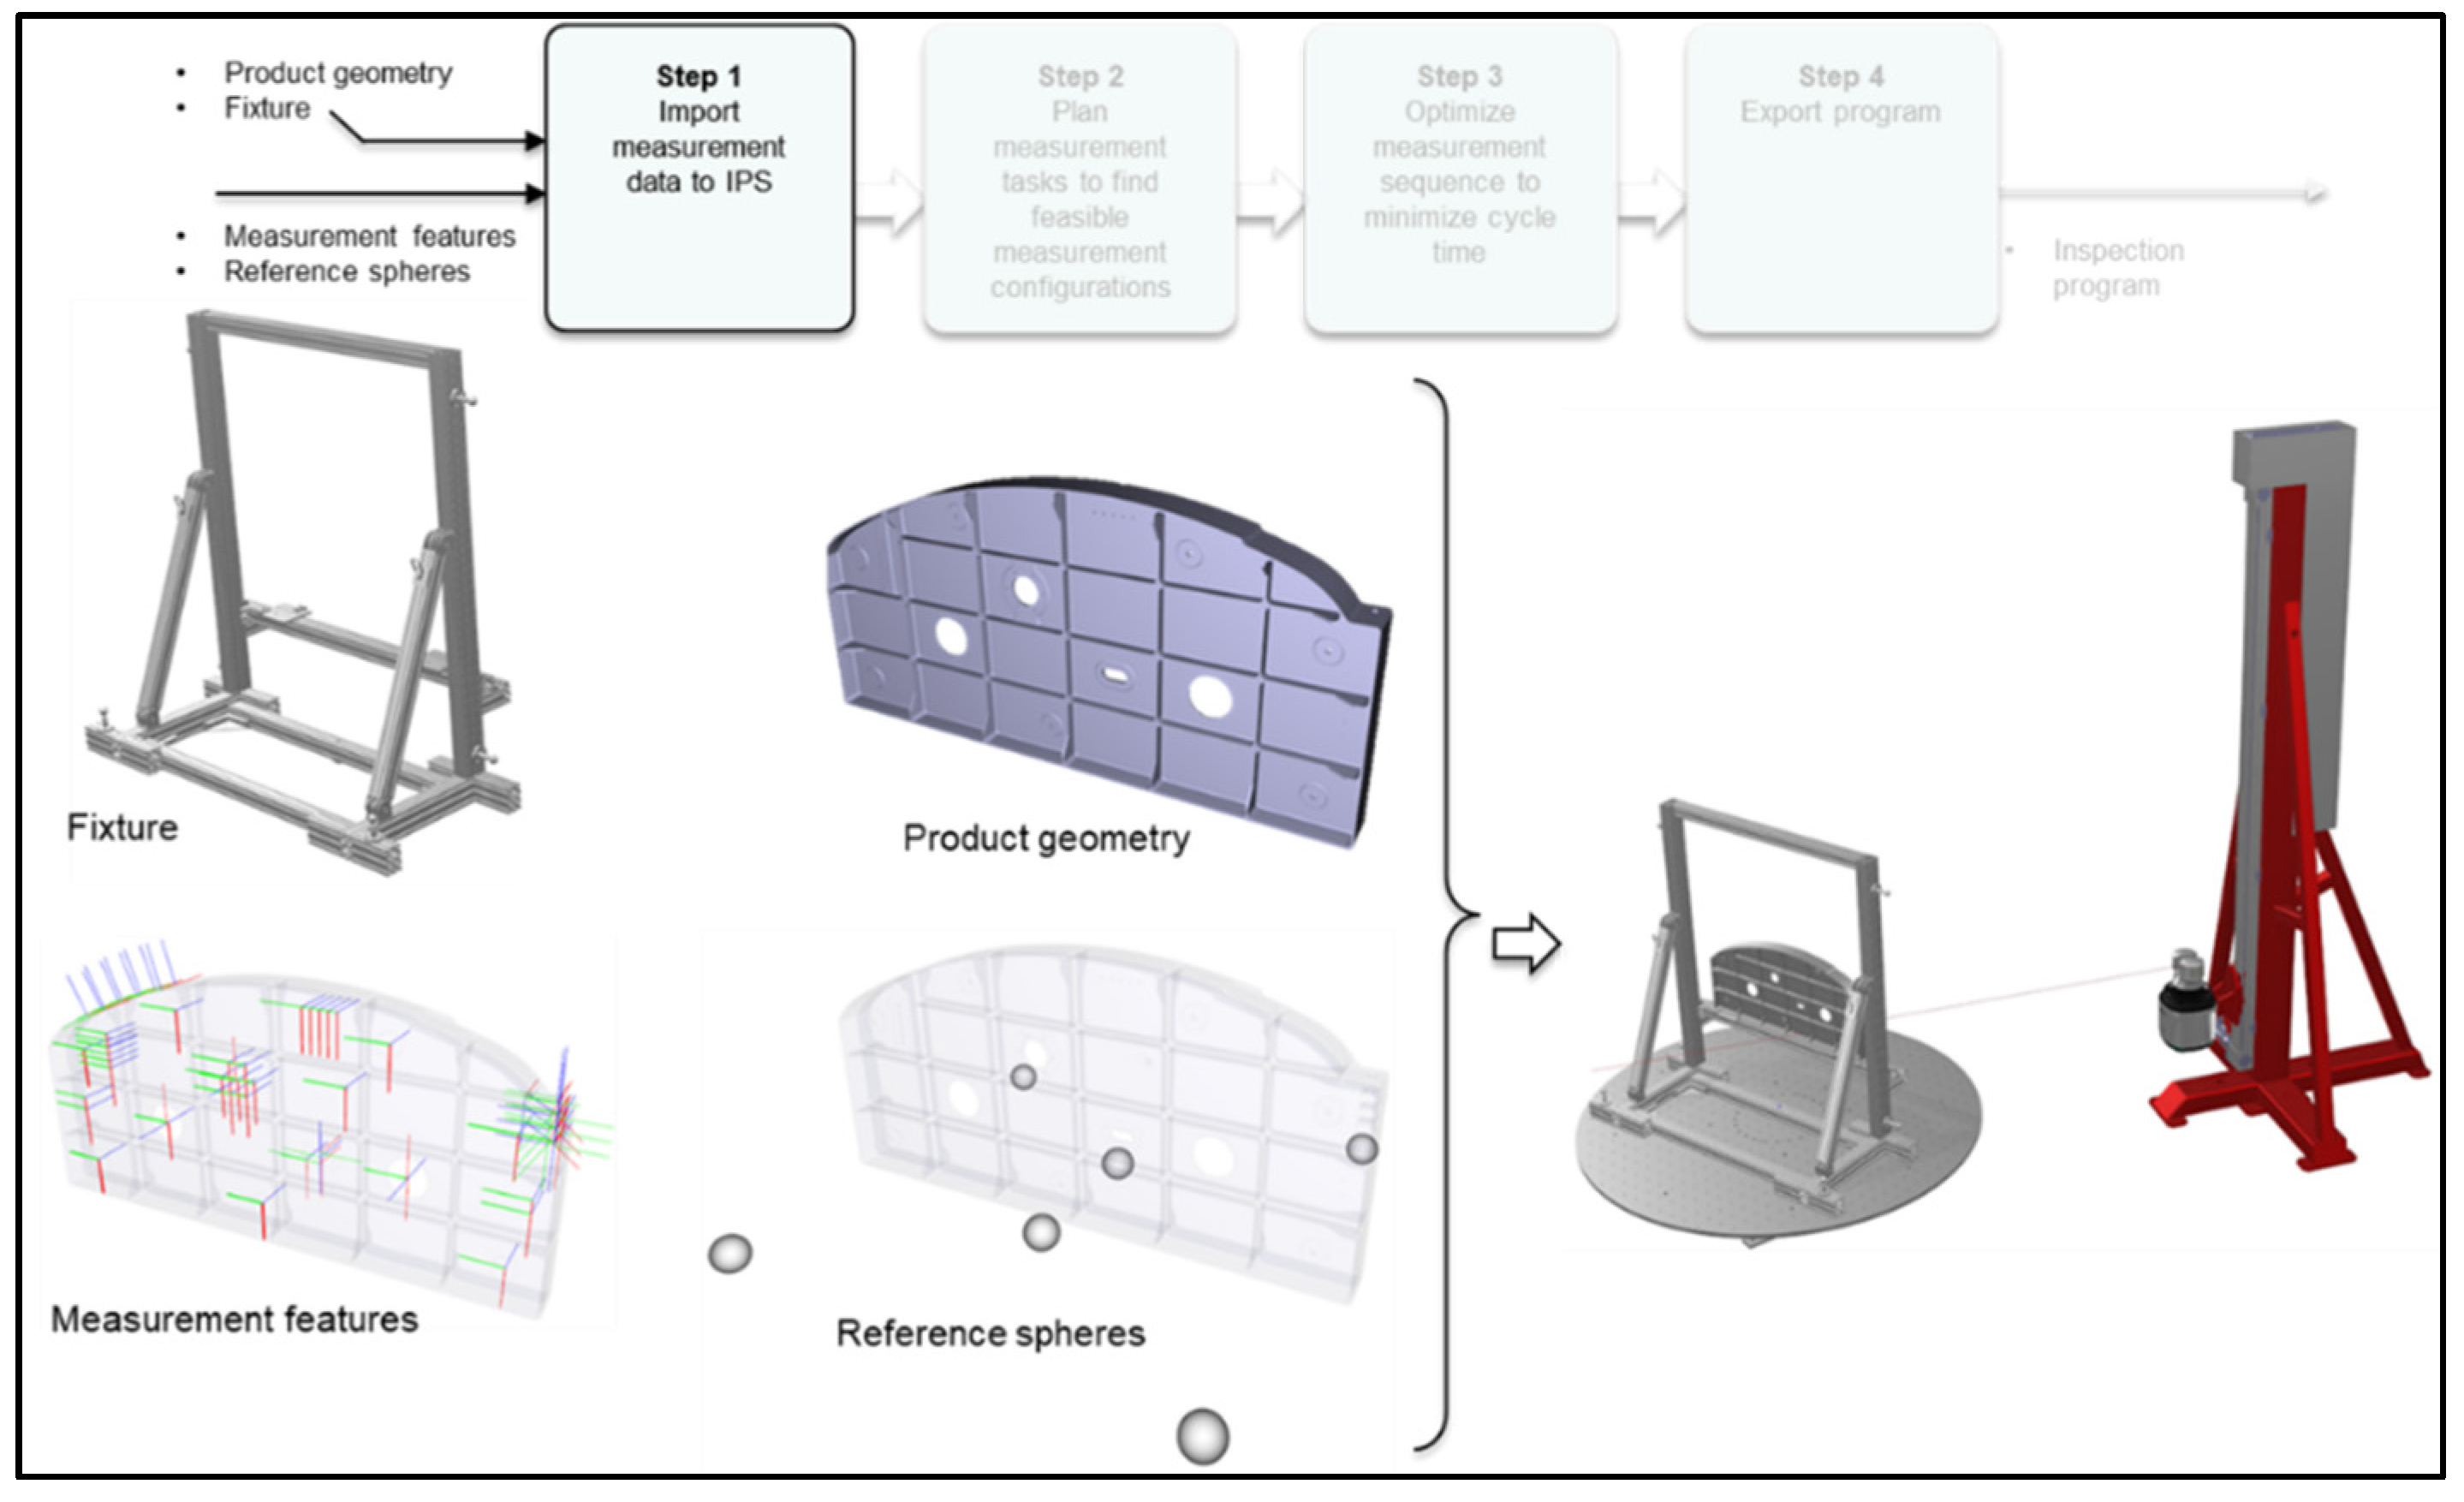
  • Automatically find feasible measurement configurations
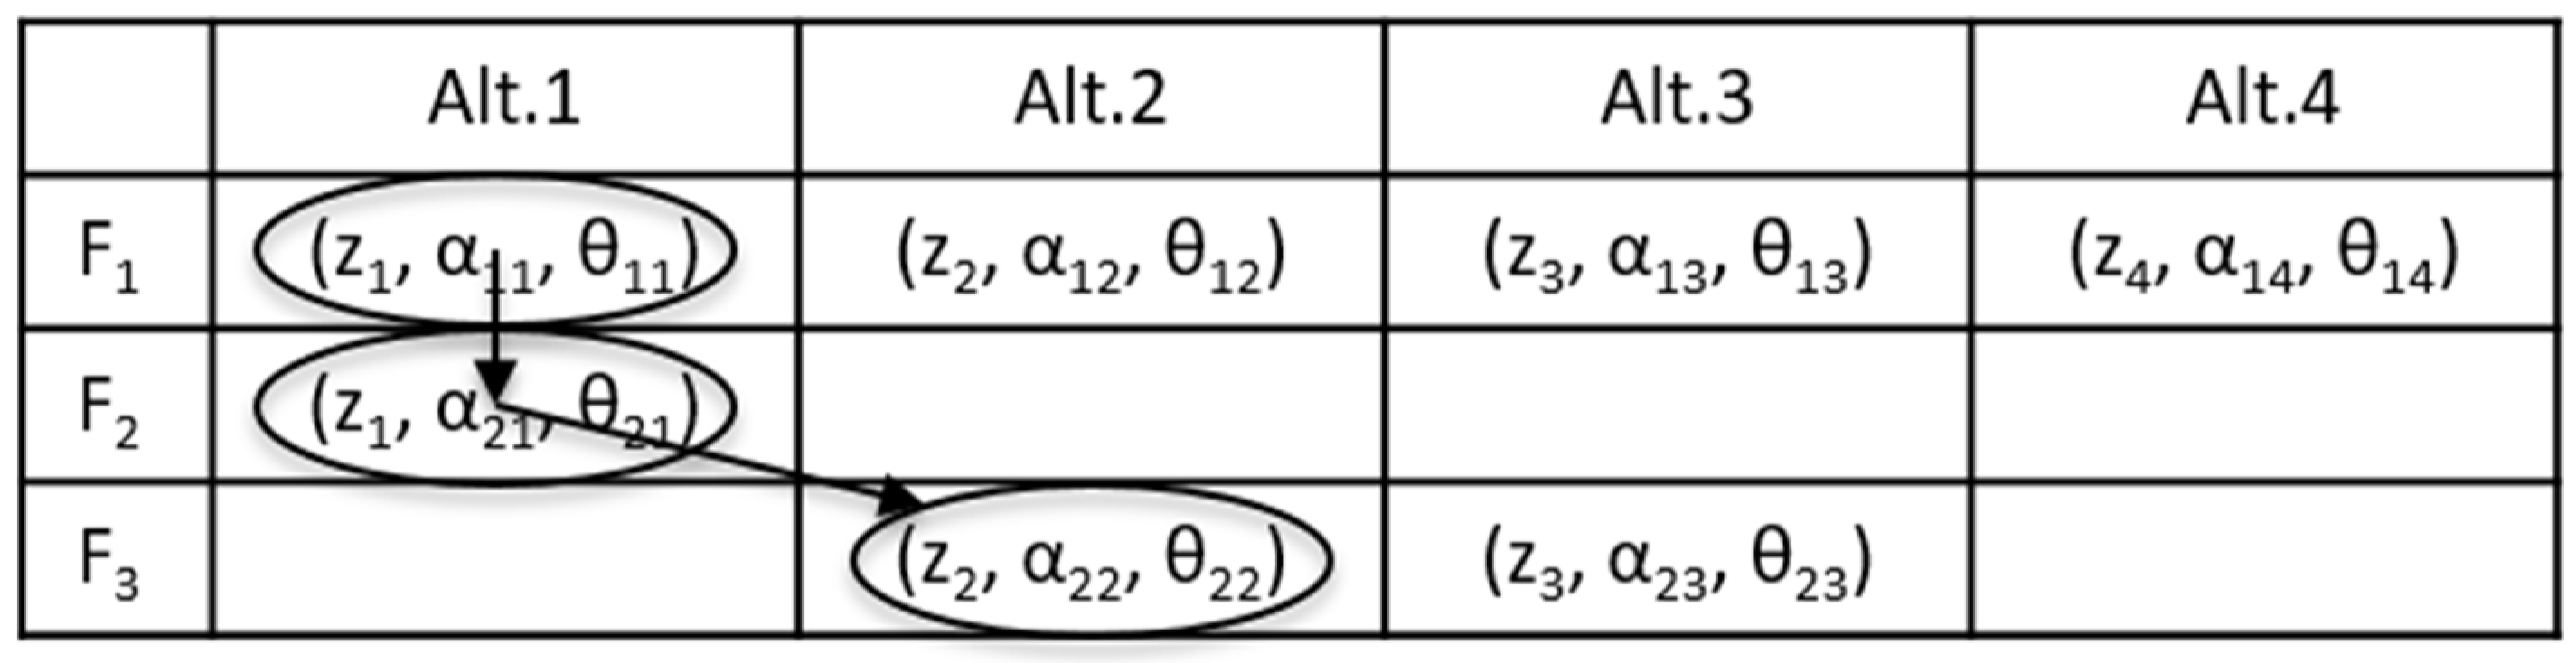
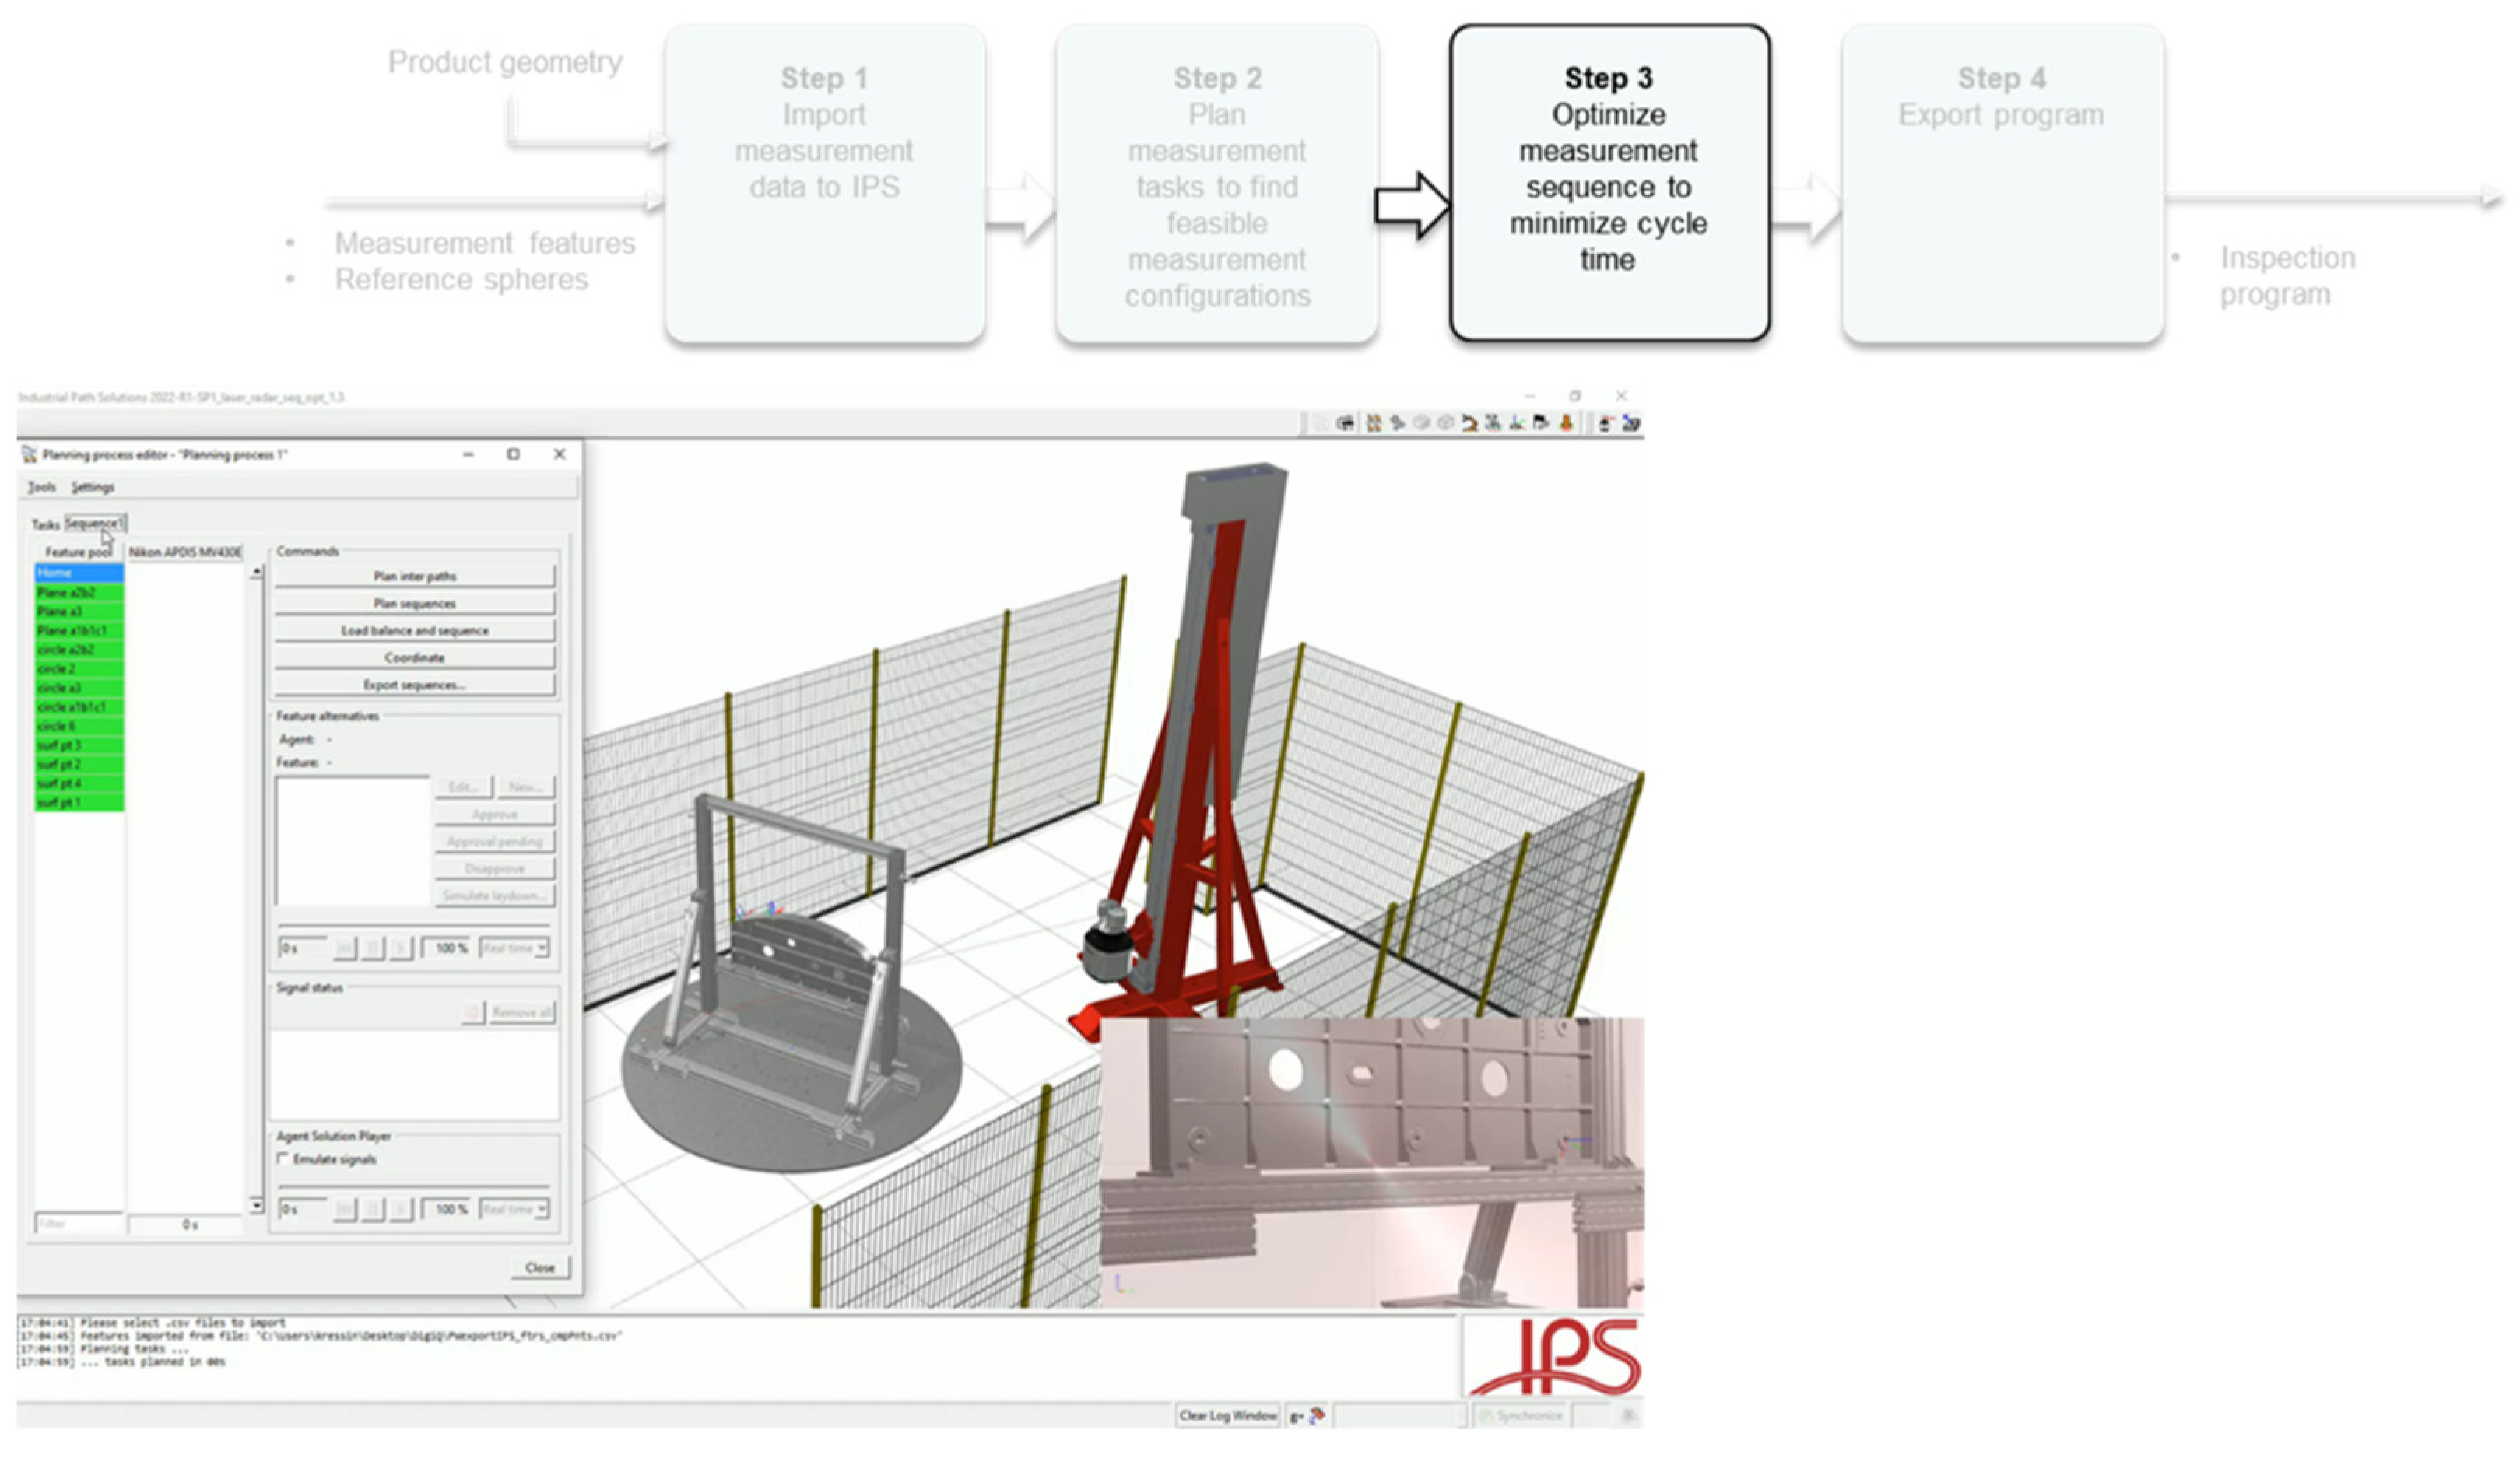
  • Automatic sequence optimization to minimize cycle time
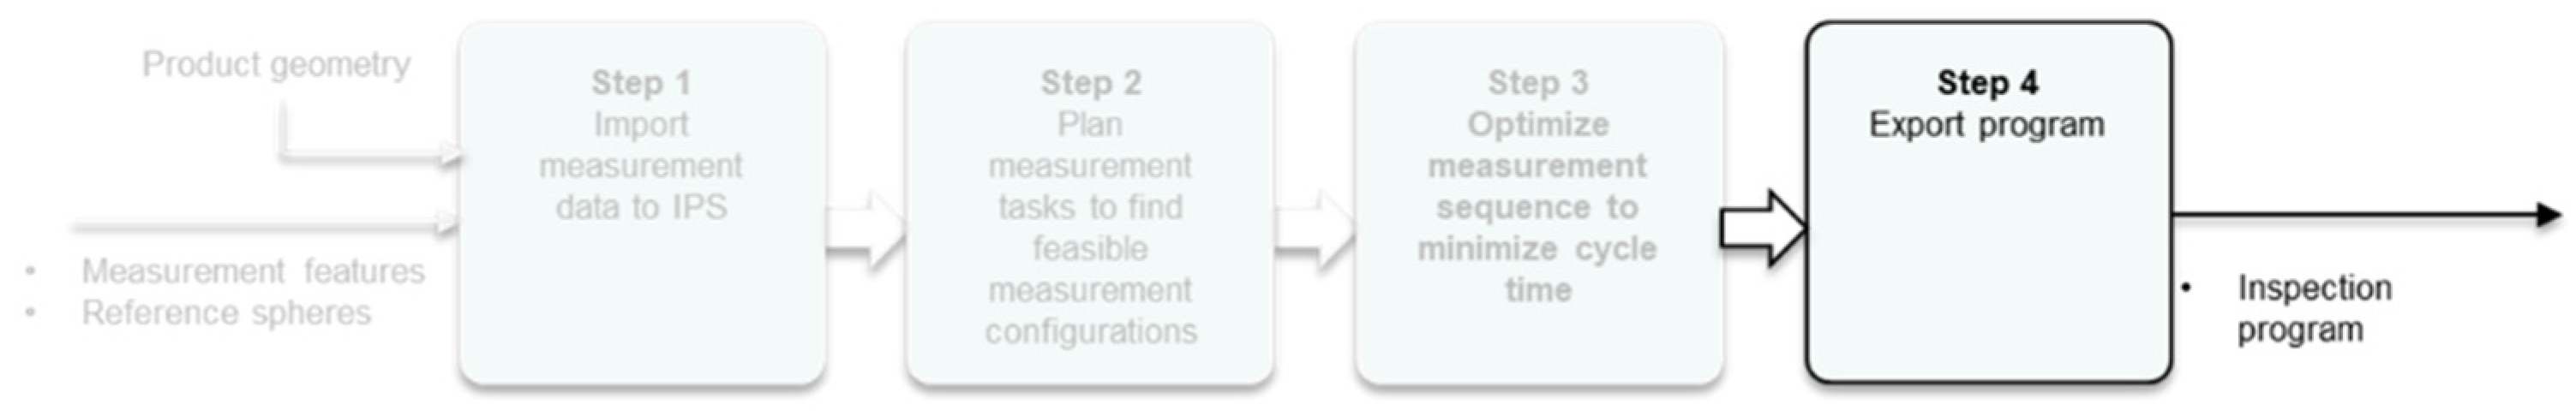
  • Customizable code export
In Figure 31, the evolved workflow is depicted, including now an offline simulation software. The functionalities in each step of the inspection program optimization process are presented and focused on.
Step 1
In the step 1 of the process, the user imports measurement data. Input data are product geometry, i.e., the measurement object geometry, the dimensional measurements features, and reference spheres, Figure 32.
Step 2
In step 2 of the process, Figure 33, automatic checks are performed, i.e., geometrical features to be inspected on the measurement object. The requirements are as follows:
  • Kinematically reachable.
  • Collision-free (No direct problem in this application).
  • An infrared laser beam ray can be cast from the laser radar to the feature without any obstacles in the way, i.e., verification and validation of the line-of-sight.
  • The measurement angle towards the nominal axis of the feature (θ) must be within an allowed range; this is dependent on which geometrical feature is to be inspected.
  • A certain number of reference spheres must be visible.
Step 3
In step 3 of the process, Figure 34, automatic sequence optimization is performed, i.e., the following:
  • Optimize the visiting order for all geometrical feature measurements
  • Optimize configuration alternatives.
  • Automatic path planning.
  • Automatically add measurement of reference spheres each time the linear axis or turn table moves, i.e., repositioning of the LR unit, and/or linear axis and or the rotational table.
    Min and max number of spheres
    Possibly add criterion for measuring many spheres in first position, and re-measure the same spheres in the following positions.
Step 4
In step 4 of the process, Figure 35, program files are generated and exported, i.e., as follows:
  • The program export is customized using scripts outside the IPS core.
  • For N measurement positions, a total of (N+8) files are exported.
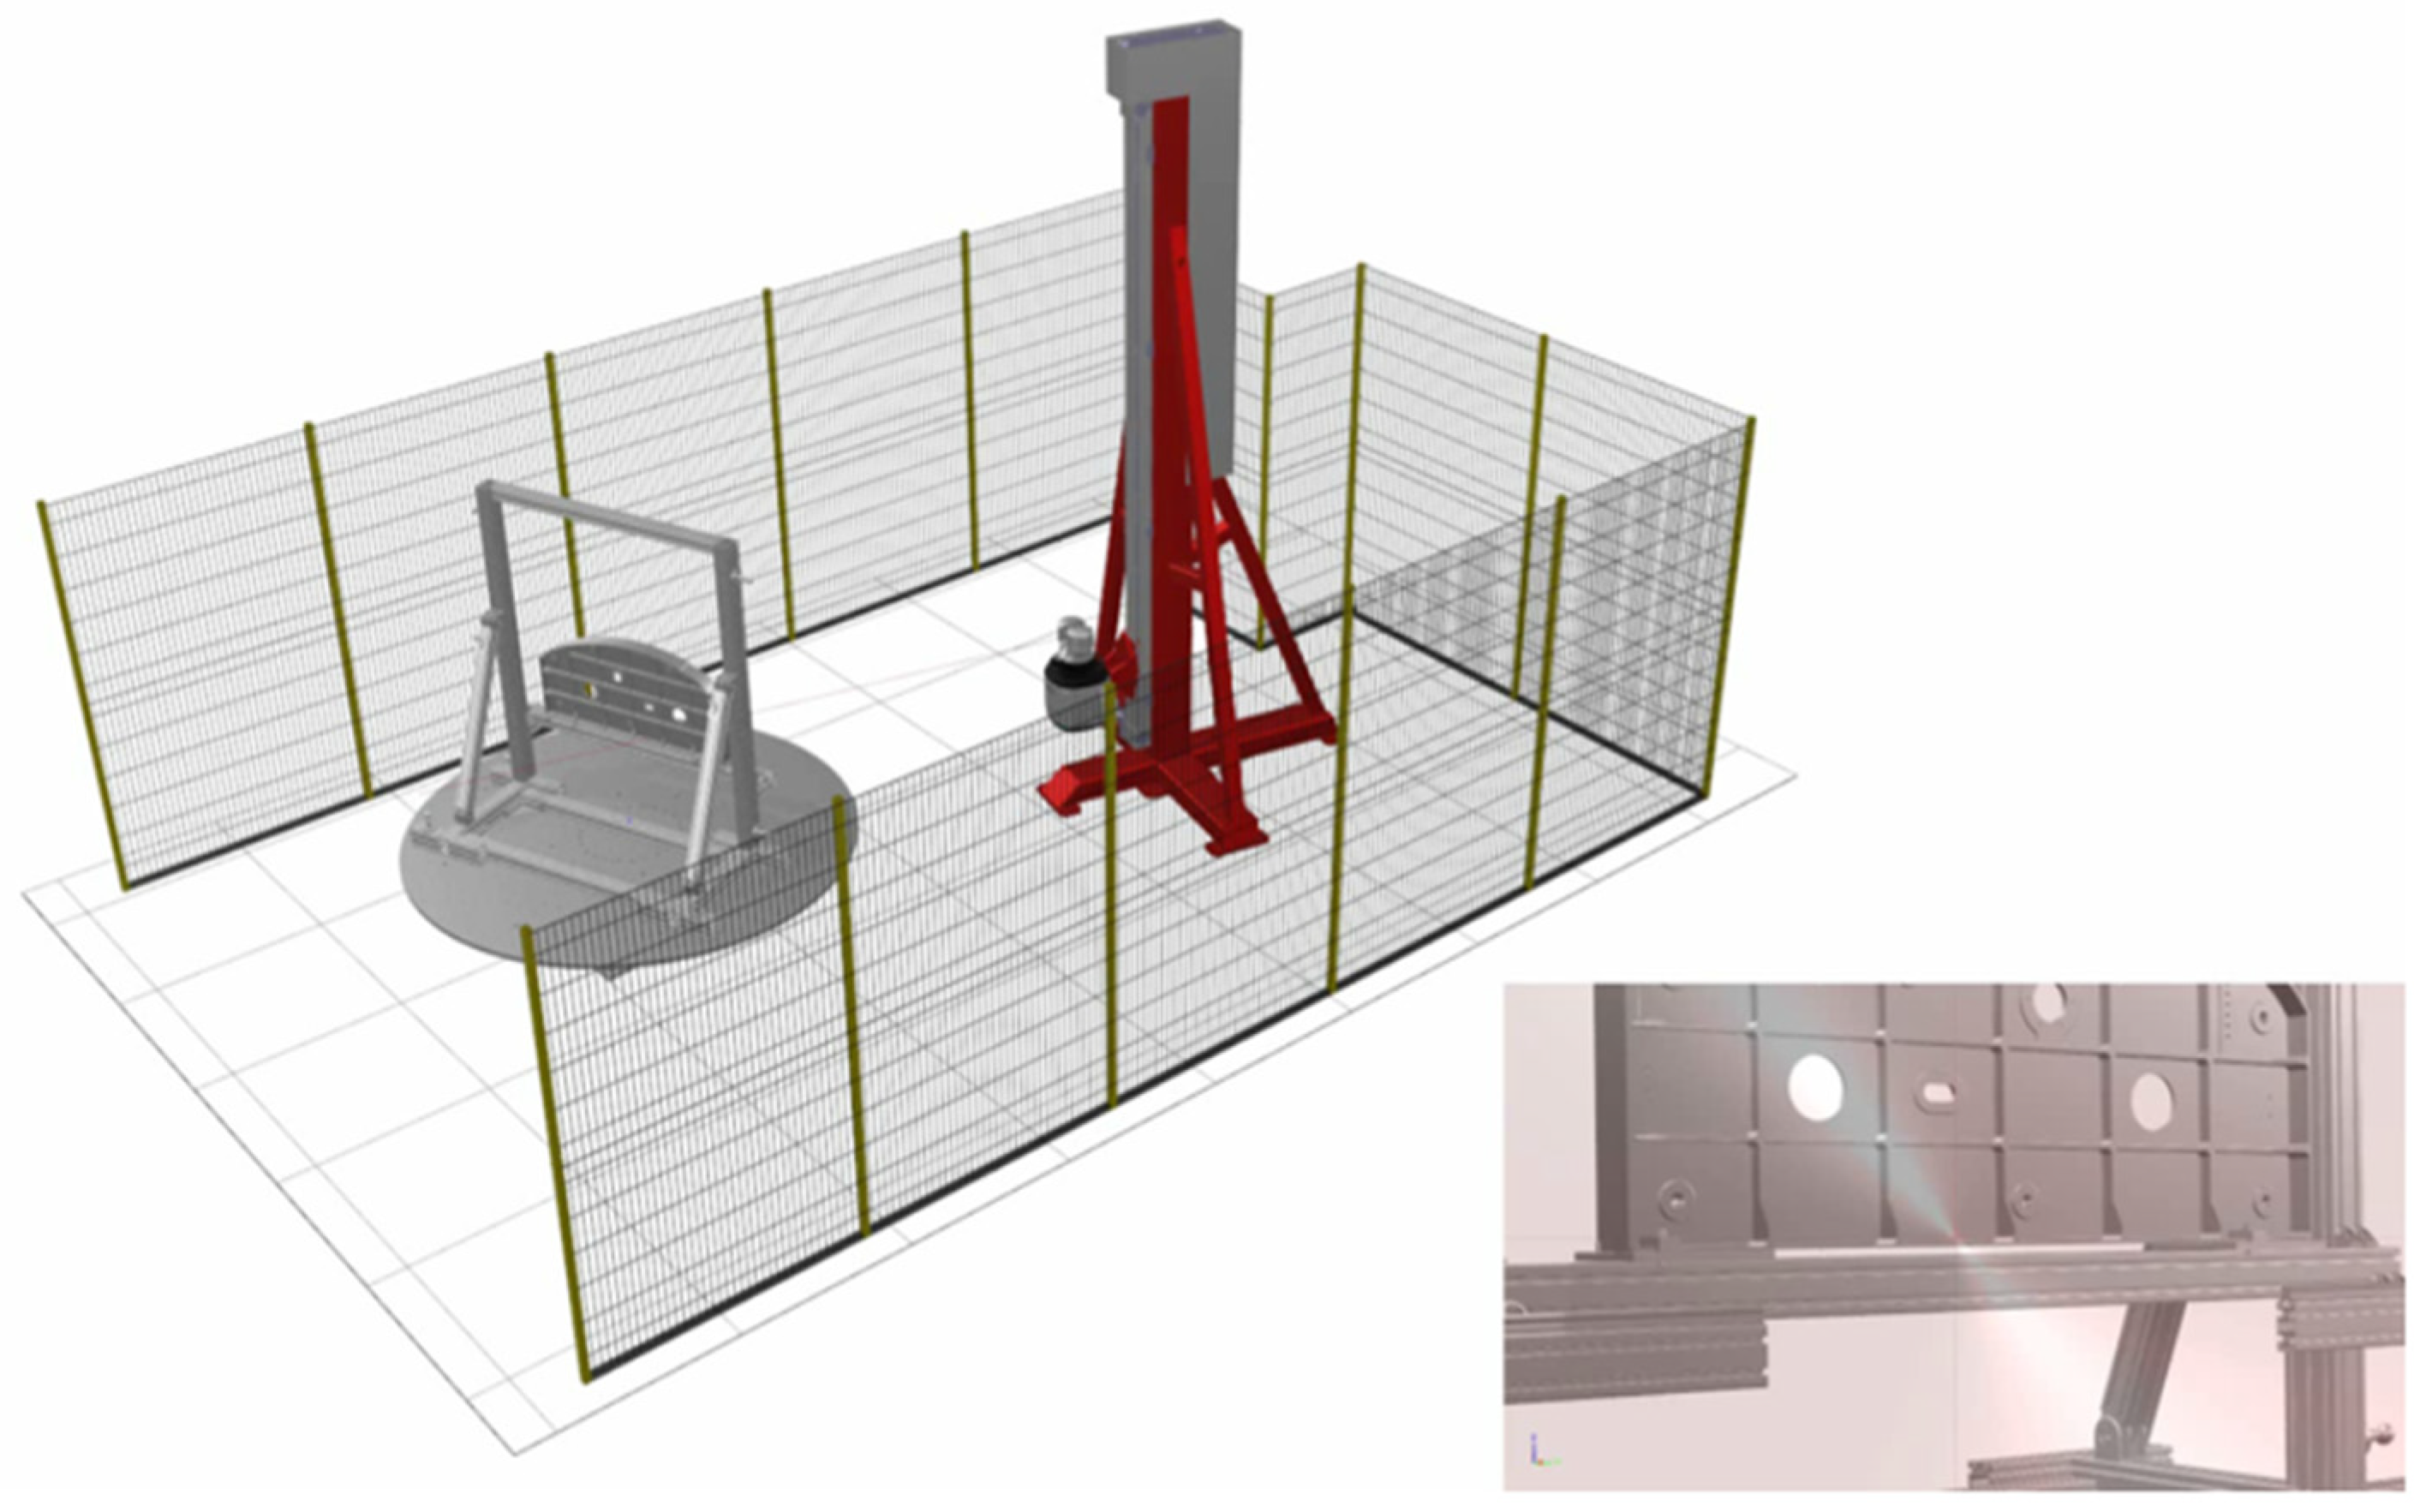
  • The exported files are then passed on to another software, in this case to Polyworks Inspector, for program execution in the real station.

3.6.3. Verification and Validation of the Digitized Data and Information Workflow

The complete verification and validation of the data and information workflow, i.e., the file-based transfer solution between Polyworks Inspector and IPS LR 2.0 software solution, was carried out during a workday held at Saab premises in Linköping on the 3rd of March 2022. The verification and validation study were successful. The team managed to run the complete test five times and observed and verified the functionality and conformity.
The team decided to create a minor measurement program comprising the following dimensional and geometrical features, Figure 36.
Figure 36 is displaying the actual dimensional and geometrical features included in the measuring test program for the verification and validation of the path planning and sequence optimization software application.
  • tgt = Reference target spheres
  • Planes
  • Circles
  • Comparision points, i.e., surface points = surf pt
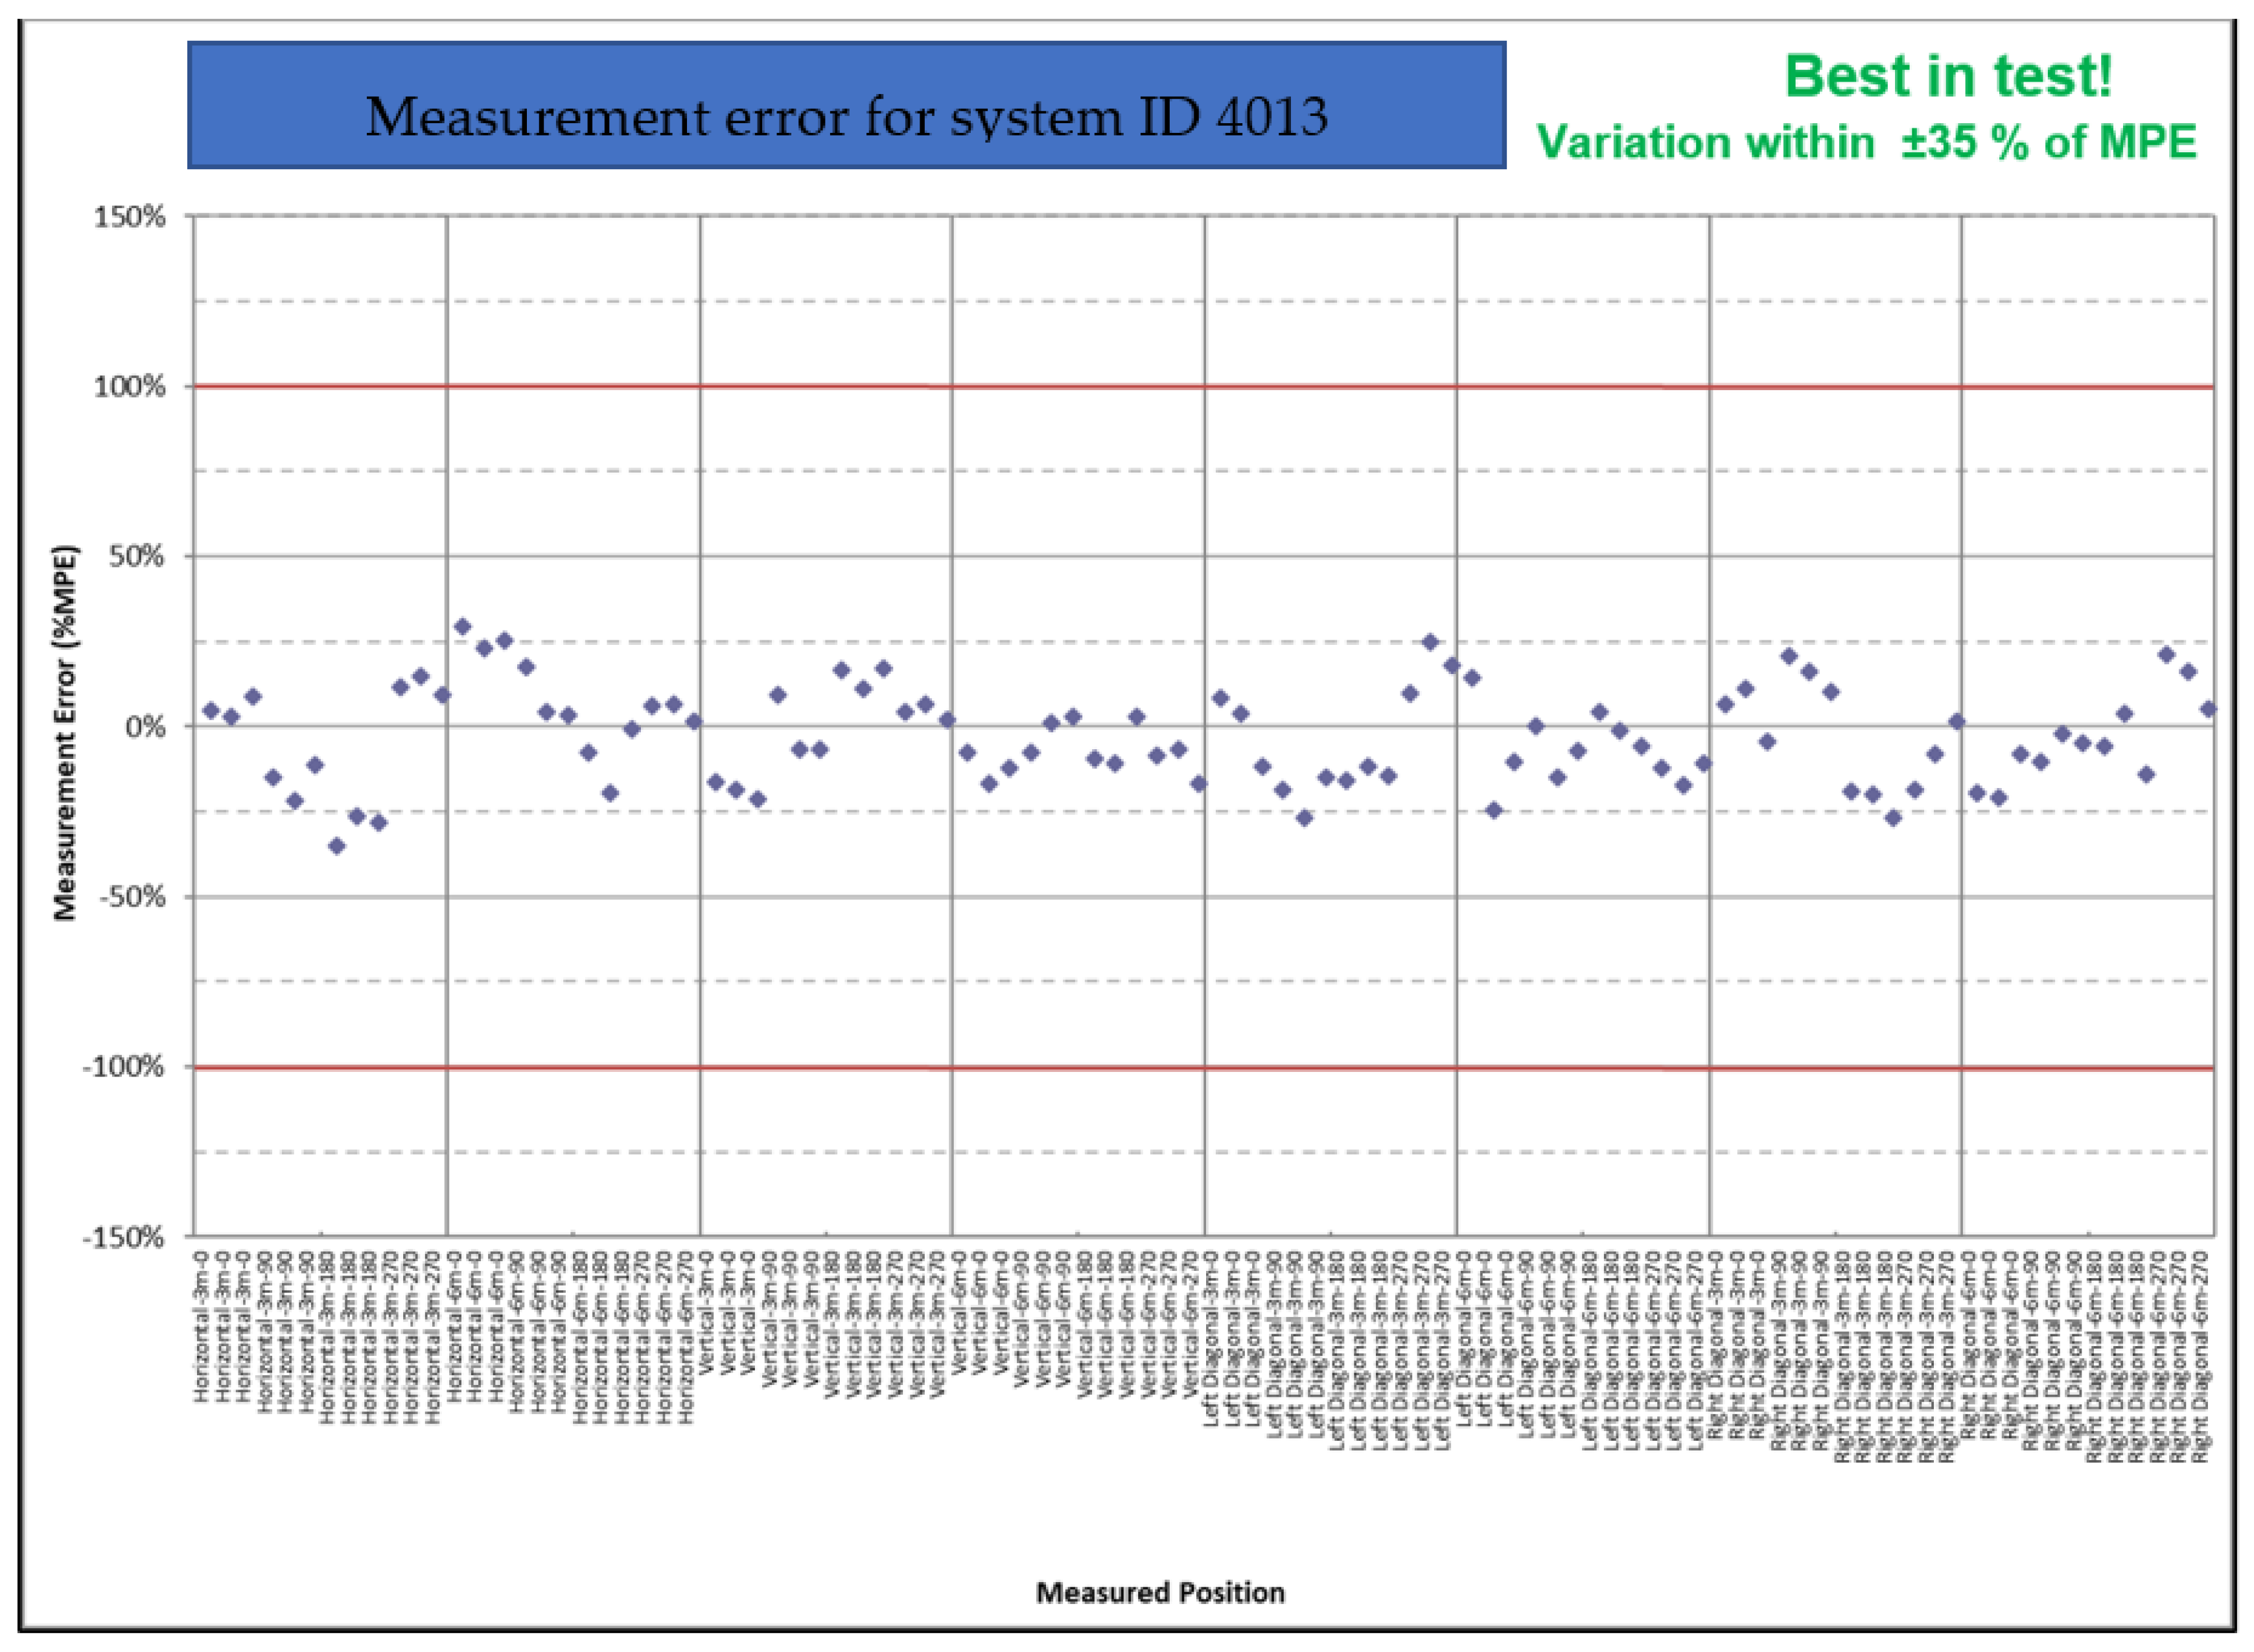
The real and physical measuring sequences as illustrated in Figure 37 were observed and validated against the simulated and off-line programmed measuring program. The only observed major deviation was the synchronization and mismatch concerning the offline software of the laser radar parameters, i.e., scanning speed, stacking, point-spacing, and line-spacing settings.

4. Results

This research has verified and validated the 3D model-based large volume metrology system process for the measurement of large volume objects. The identified and presented digital threads and digital twins is fully functional and conforms to Saab stated requirements. The physical laser radar metrology system has been transferred, installed, and commissioned at the new Saab factory in West Lafayette. Saab metrology engineers have the possibility to monitor and control the system remotely from Linköping. This is assumed to save a lot of unnecessary travels and time spent abroad. The progress of results during the first half-year of 2022 includes the updated, verified, and validated IPS LR 2.0 simulation software version. Functionality includes but is not limited to the following: Import of reference spheres and creation of sphere geometries. Make imported reference spheres work for 3rd party metrology software. Speed-up initialization step in optimization. Handle larger problem instances in optimization. Set maximum number of reference spheres to consider in task planning.
Regarding developed scripts. There is a functional export of inspection program information which is sent to 3rd party metrology software using txt-files and csv-file format. A new novel developed script for automating the scene build up based on Saab CATIA V5 3D starting model. One new novel script which creates a virtual guided red-laser beam geometry in the 3D simulation scene supports the metrology engineer in the programming of the measurements.
Through the novel research presented in this paper, Saab has made a significant step towards a fast and responsive ability to build and configure large volume metrology system concepts at an early stage in aircraft concept development. This is performed in the 3D virtual space and entails the evaluation, verification, and validation of automated laser radar metrology system concepts.

5. Discussion

The lack of results from planned repeatability test studies on the MPQP test artefact is in great demand. From the explored research and gained results during the verification and validation test period of the IPS LR 2.0 simulation software package, there is gained insights of the functionality. In order to create a fully functional digital twin, there is still a lack of perfect interpretation and implementation of the Laser Radar unit controller, i.e., scanning velocity parameters. Therefore, further exploration of functionality in the software package will focus on the following:
  • Enhanced handling of measurement parameters for different dimensional features. Laser radar scanning parameters will be controlled through a novel script.
  • How to export theoretical measurement uncertainty based on the virtual simulations and gathered virtual absolute distances from the laser radar to the measurement object, by using Equation (1), i.e.,
  • Planning of tasks, i.e., more information about when a feature is infeasible if, for example, reference spheres cannot be observed or for other reasons.
  • Planning of sequence, i.e., more information about which features are seen in each position. This could be solved partially by program export, but it would be beneficial to see in GUI (Graphical User Interface).
  • Reference spheres
    Maximize volume between chosen spheres, or based on stability analysis
    Possibility to set measurement time for reference spheres.
    Possibility to optimize position of reference spheres. Currently possible in a semi-automatic way, by moving the spheres and then replanning.
Future work includes the exploration of algorithms to include the task of minimizing the number of needed measurement positions. Measurement rules specification, e.g., the number of surface points in relation to what dimensional feature is to be measured and evaluated.

Author Contributions

State-of-the-art, R.P.L.; Conceptualization, R.P.L., D.S. (Daniel Strand), V.C., J.T. and J.K.; Methodology, R.P.L., M.N. and D.S. (Daniel Strand); Software, D.S. (Domenico Spensieri), J.K, J.T. and D.S. (Daniel Strand); Verification and Validation, R.L, M.N, D.S. (Daniel Strand), J.K., J.T. and D.S. (Domenico Spensieri); Writing—original draft preparation, R.P.L.; Writing—review and editing, R.P.L., J.K., D.S. (Domenico Spensieri) and A.A. Visualization and illustrations, R.P.L., M.N., D.S. (Daniel Strand) and J.T.; Project administration, R.P.L. All authors have read and agreed to the published version of the manuscript.

Funding

This work benefited from funding from Saab Aeronautics eT7-A internal development project and from the Swedish Innovation Agency-Vinnova, as part of its Digi-Q research project.

Data Availability Statement

The virtual 3D model of the MPQP test artefact is by the courtesy of Saab Aeronautics made available, after specific request from individuals and/or stakeholders who which to use the artefact for research, development, standardization, education and learning activities. The 3D model can be supplied in the following formats: Catia V5 native format, neutral STEP AP 242 format.

Acknowledgments

KTH: Saab Aeronautics, FCC and the Digi-Q AP3 project partners and stakeholders are very grateful to Swedish Innovation Agency-Vinnova for their support of the Digi-Q research project.

Conflicts of Interest
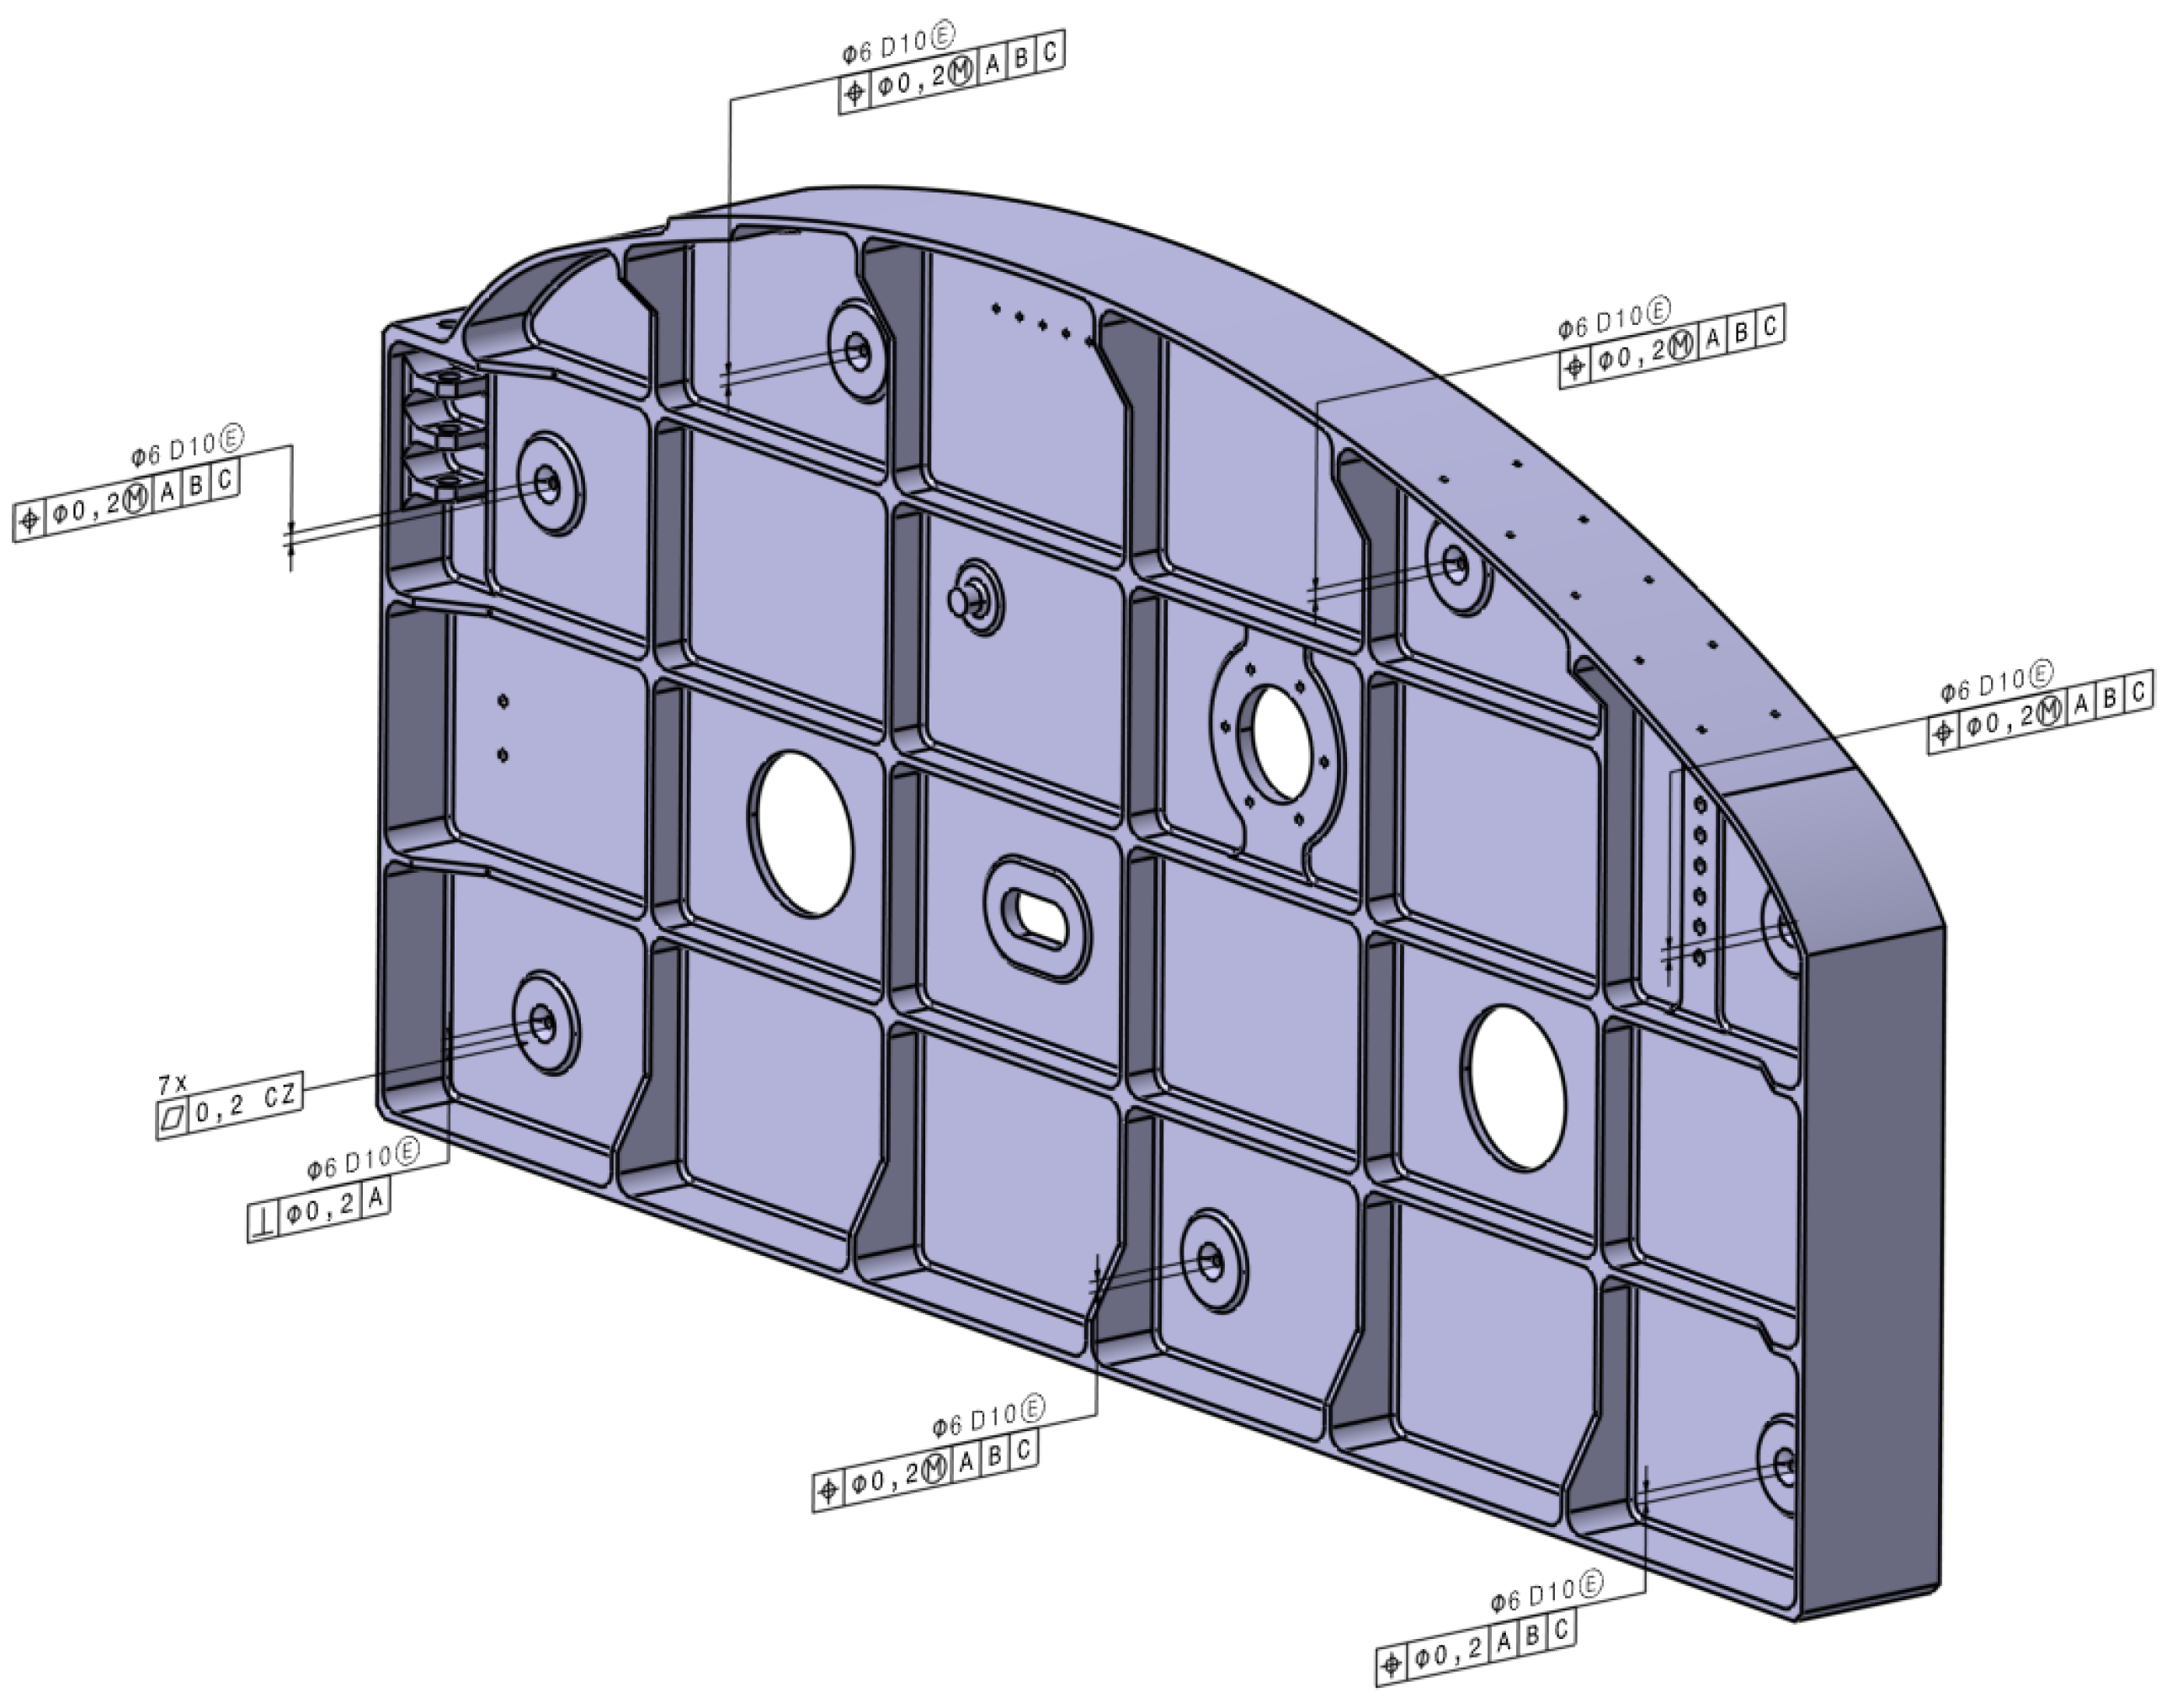
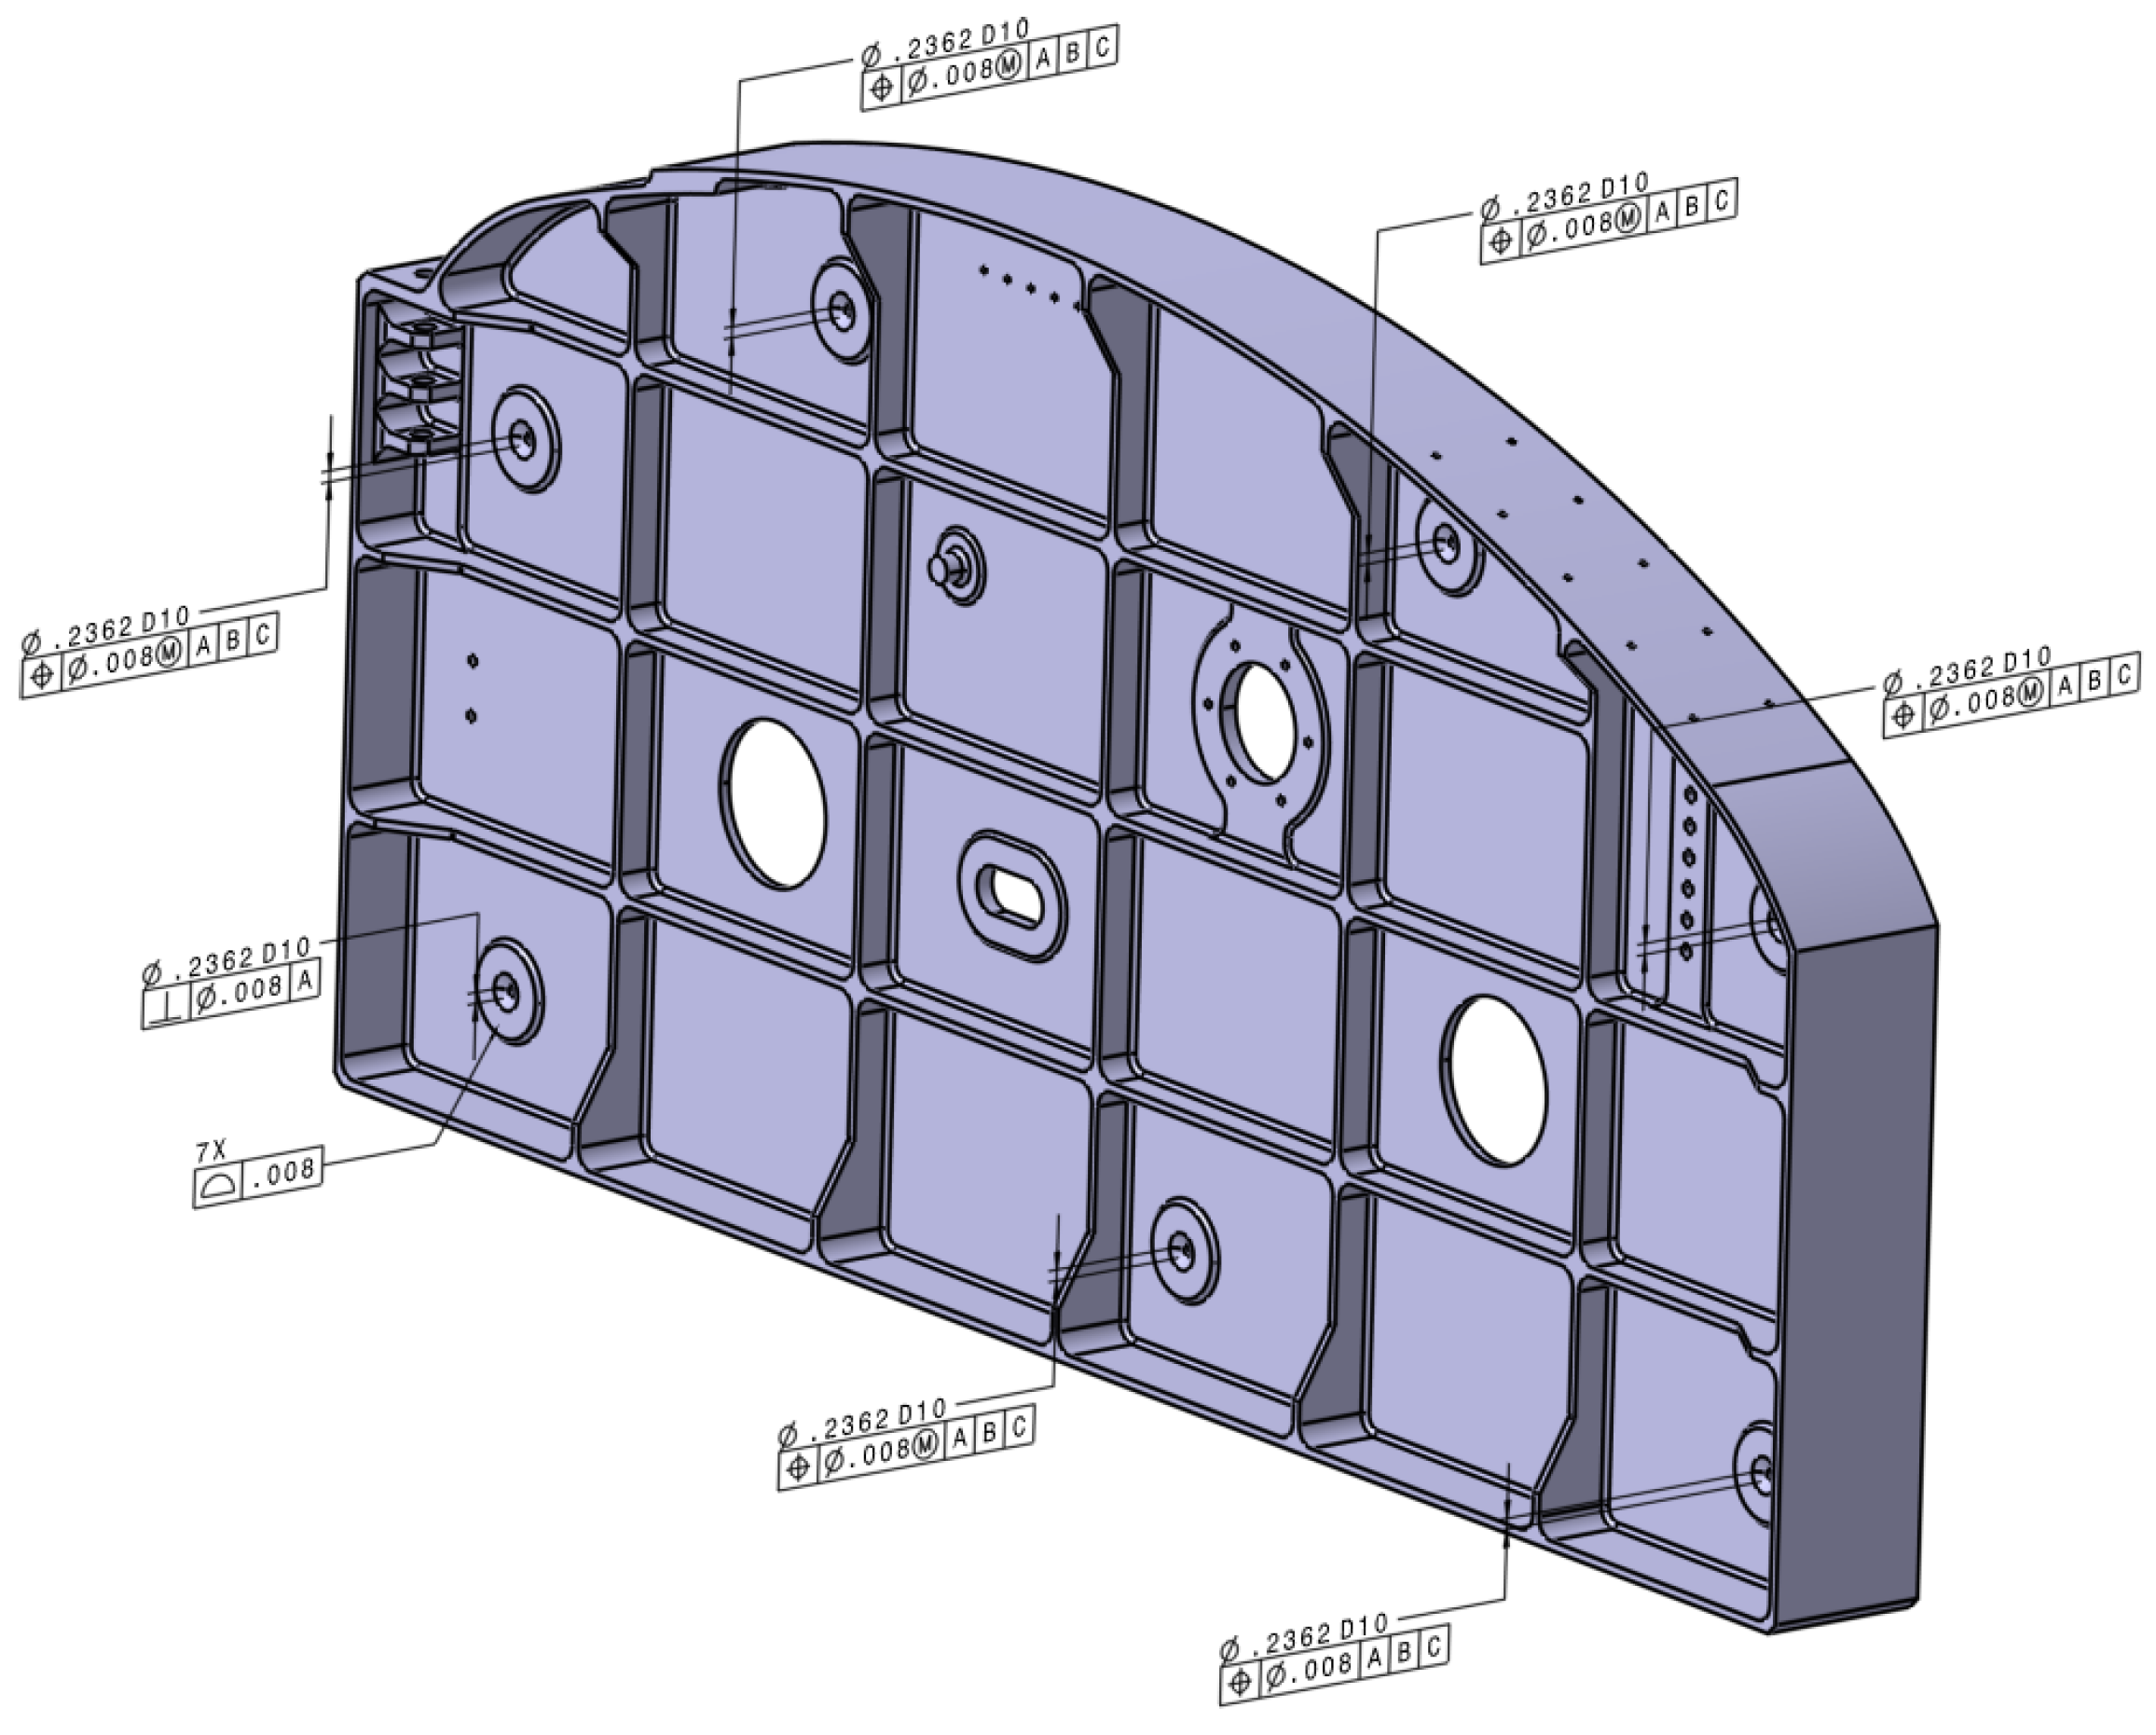
Certain commercial systems and software’s identified in this paper does not imply recommendation or endorsement by KTH, Saab AB (Publ.) or FCC. Nor does it imply that the products identified are necessarily the best available for the purpose. The authors declare no conflict of interest.

Appendix A

Appendix A.1. Toleranced Features

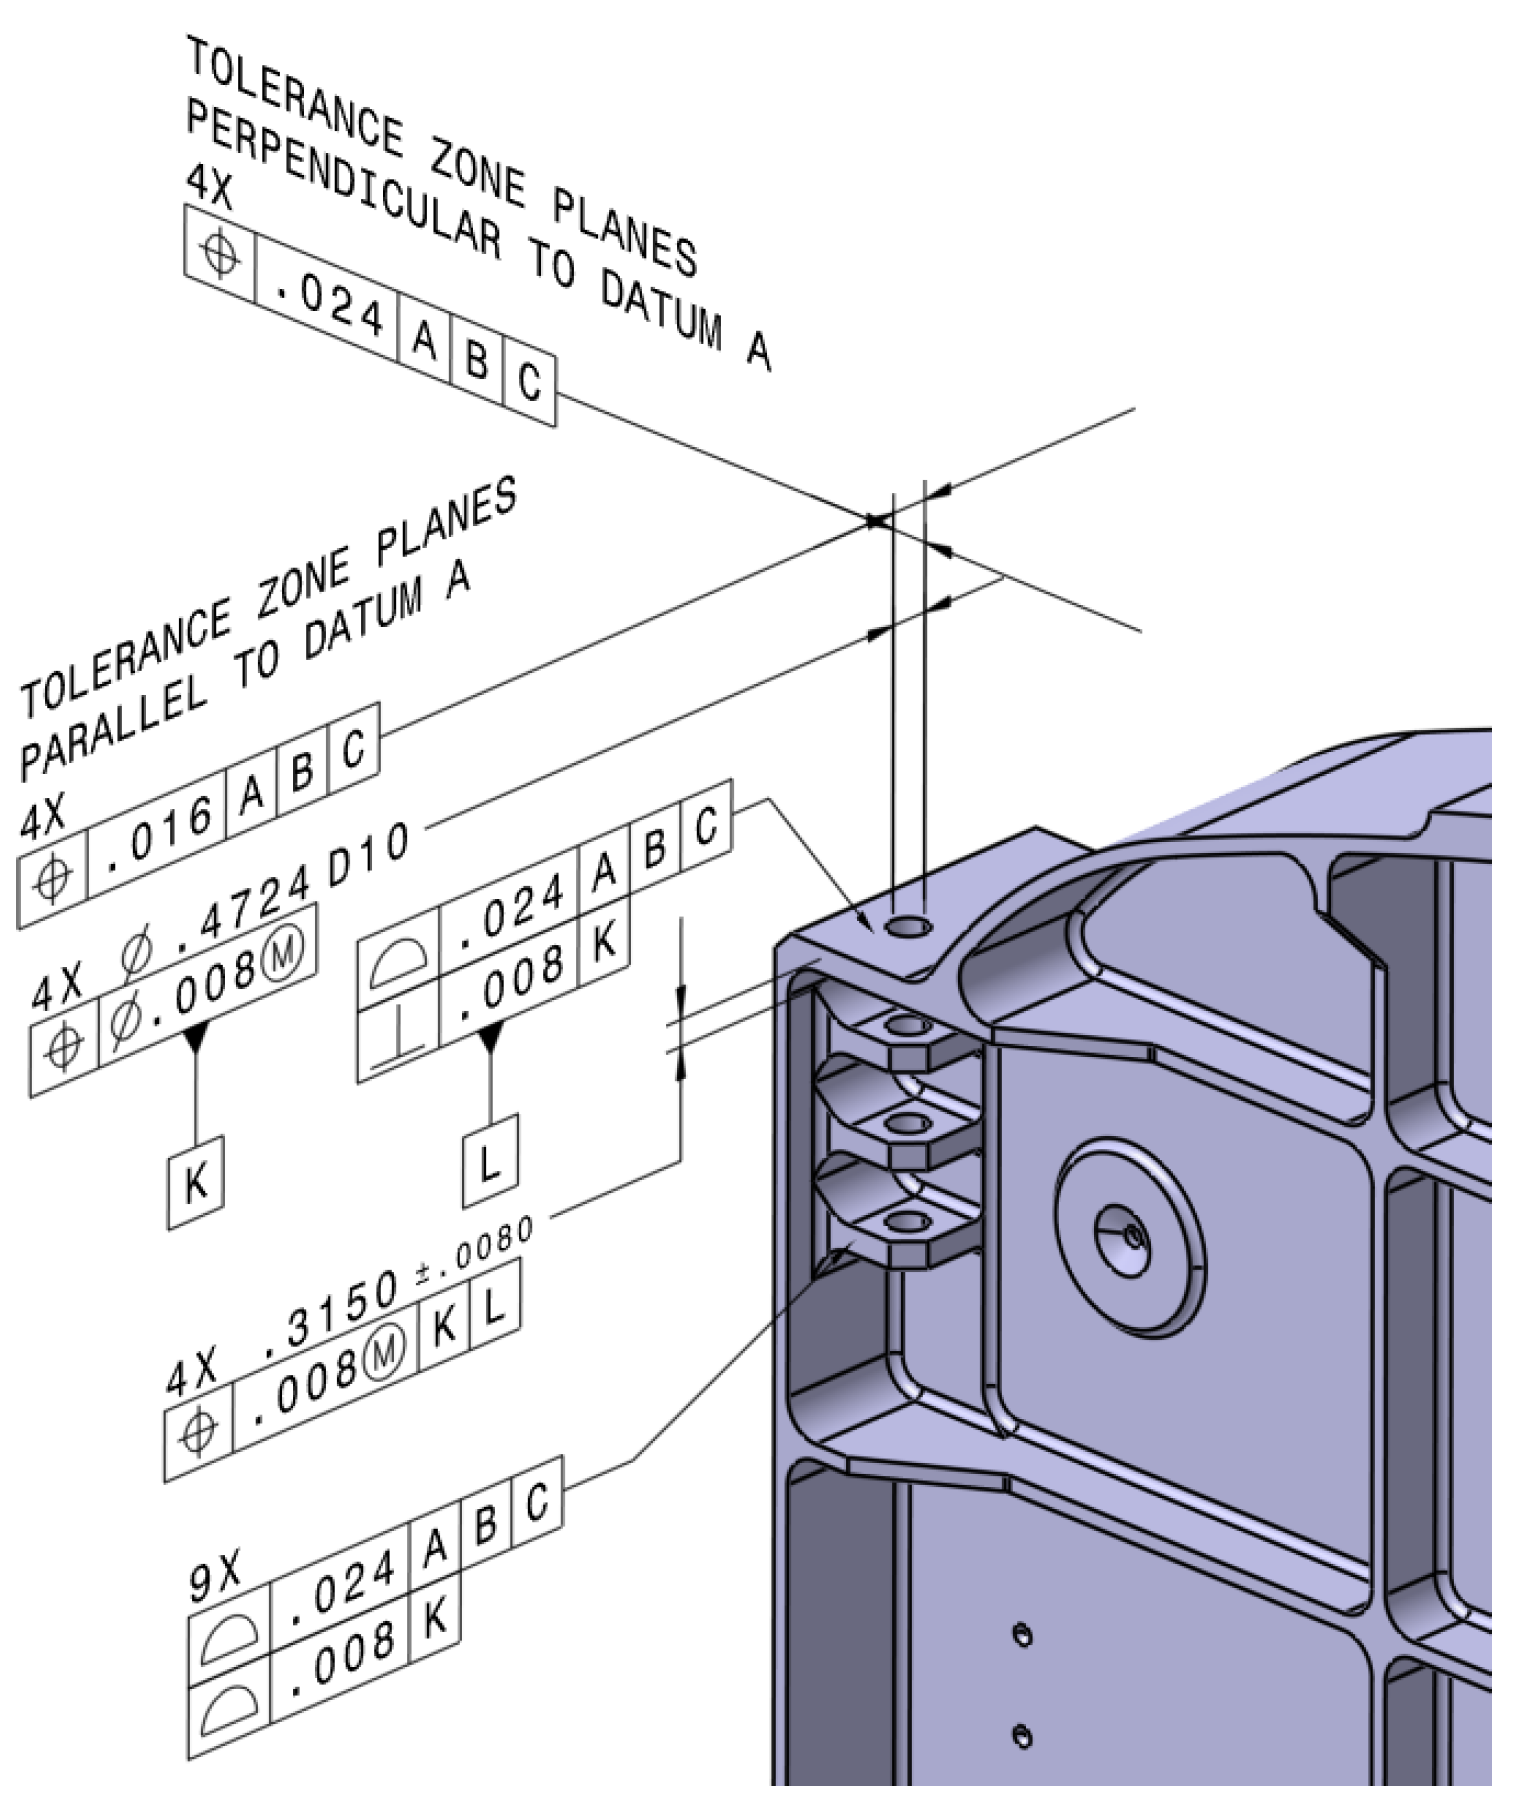
Appendix A.1.1. Tooling Interface

The tooling interface consists of seven pads on the web. Each pad has a ⌀6 mm countersunk hole designed for use with measurement equipment such as SMR:S (Spherical Mounted Reflectors). The datum targets for the main datum system A|B|C is placed on three of the seven pads/holes. The pad surfaces have a common surface tolerance in order to ensure a good fit to an assembly fixture. The holes have positional tolerances in relation to the main datum system in order to ensure fit to tooling pins, Figure A1 and Figure A2.
Figure A1. Tooling interface in ISO model.
Metrology 03 00002 g0a1
Figure A2. Tooling interface in ASME model.
Metrology 03 00002 g0a2

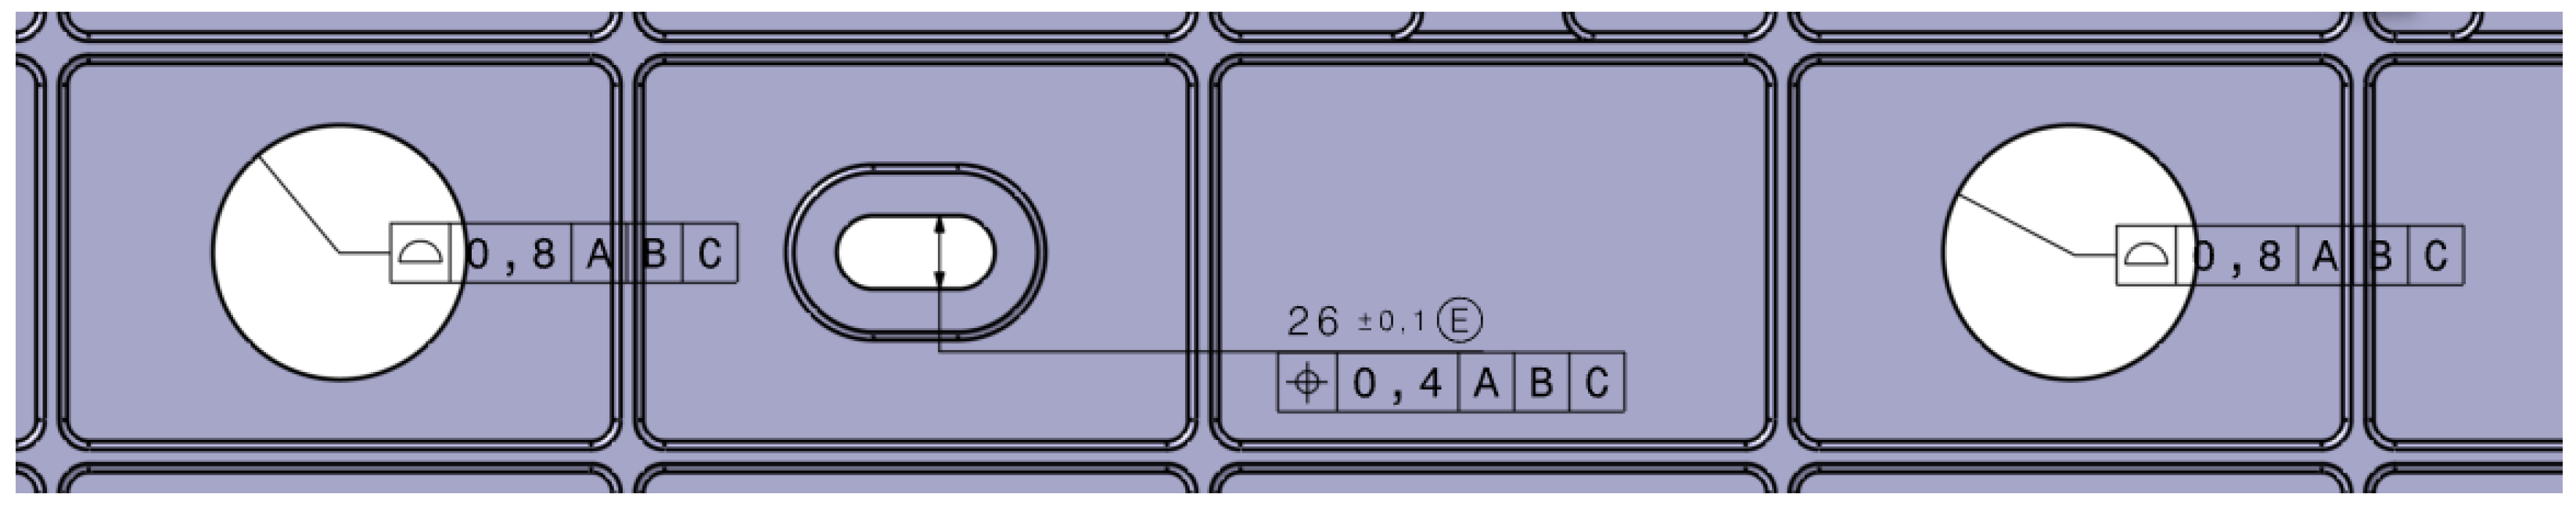
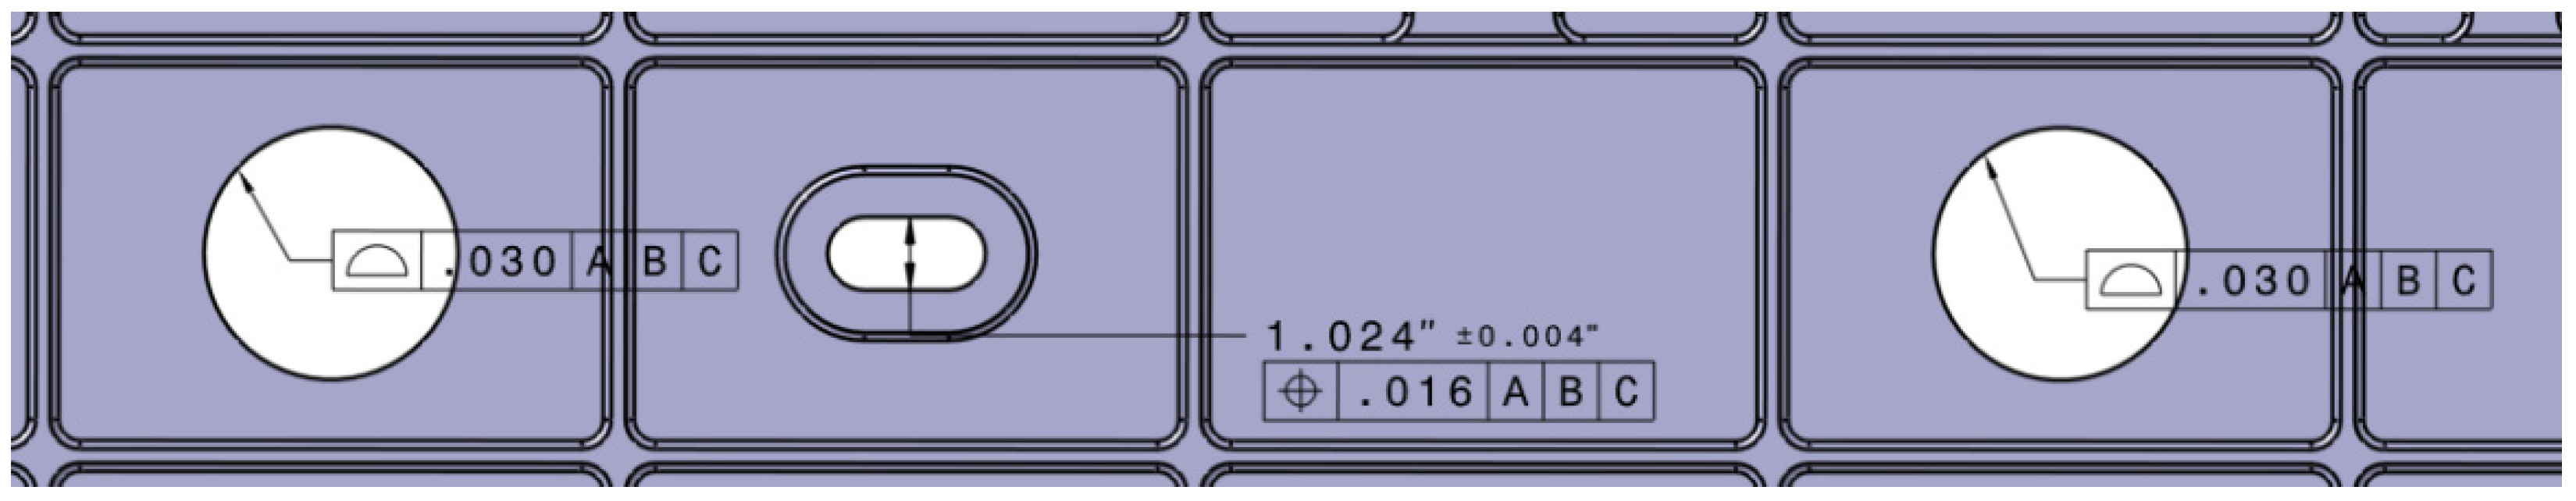
Appendix A.1.2. Web Cutouts

Two web cutouts are circular but are not toleranced as features of size (i.e., size and position); instead, they are toleranced with surface profile with respect to the main datum systems, as this resembles typical tolerancing for the contour of thin parts. Another cutout is elongated and toleranced as a feature of size with size tolerances and position to the main datum system. The positional tolerance controls the vertical position of the mid plane between the two horizontal surfaces. One purpose of these cutouts is to demonstrate internal features that are not cylindrical holes, Figure A3 and Figure A4.
Figure A3. Web cutouts in ISO model.
Metrology 03 00002 g0a3
Figure A4. Web cutouts in ASME model.
Metrology 03 00002 g0a4

Appendix A.1.3. Hinge Line

On one end of the artefact are features that simulate a piano hinge line, designs often used in doors and hatches. It consists of four holes in a line (hinge line) through four teeth. Two of the purposes of this interface are to demonstrate how complex interfaces may have complex tolerancing, and to show how ISO and ASME tolerancing may differ while still being in analogy, Figure A5. The hinge line is positioned with a rectangular tolerance with respect to the main datum system in order to control the hinge line location in the part. It also has an internal position at MMC (Maximum Material Condition) between the holes in order to provide fit for a hypothetical hinge pin. A local system K-K|L is used to simulate a hypothetical meeting hinge part. This datum system is then used to tolerance hinge teeth axially and radially to provide clearance to the mating hinge part.
Figure A5. Hinge line in ISO model (top illustration) and Hinge line in ASME model (bottom illustration).
Metrology 03 00002 g0a5aMetrology 03 00002 g0a5b

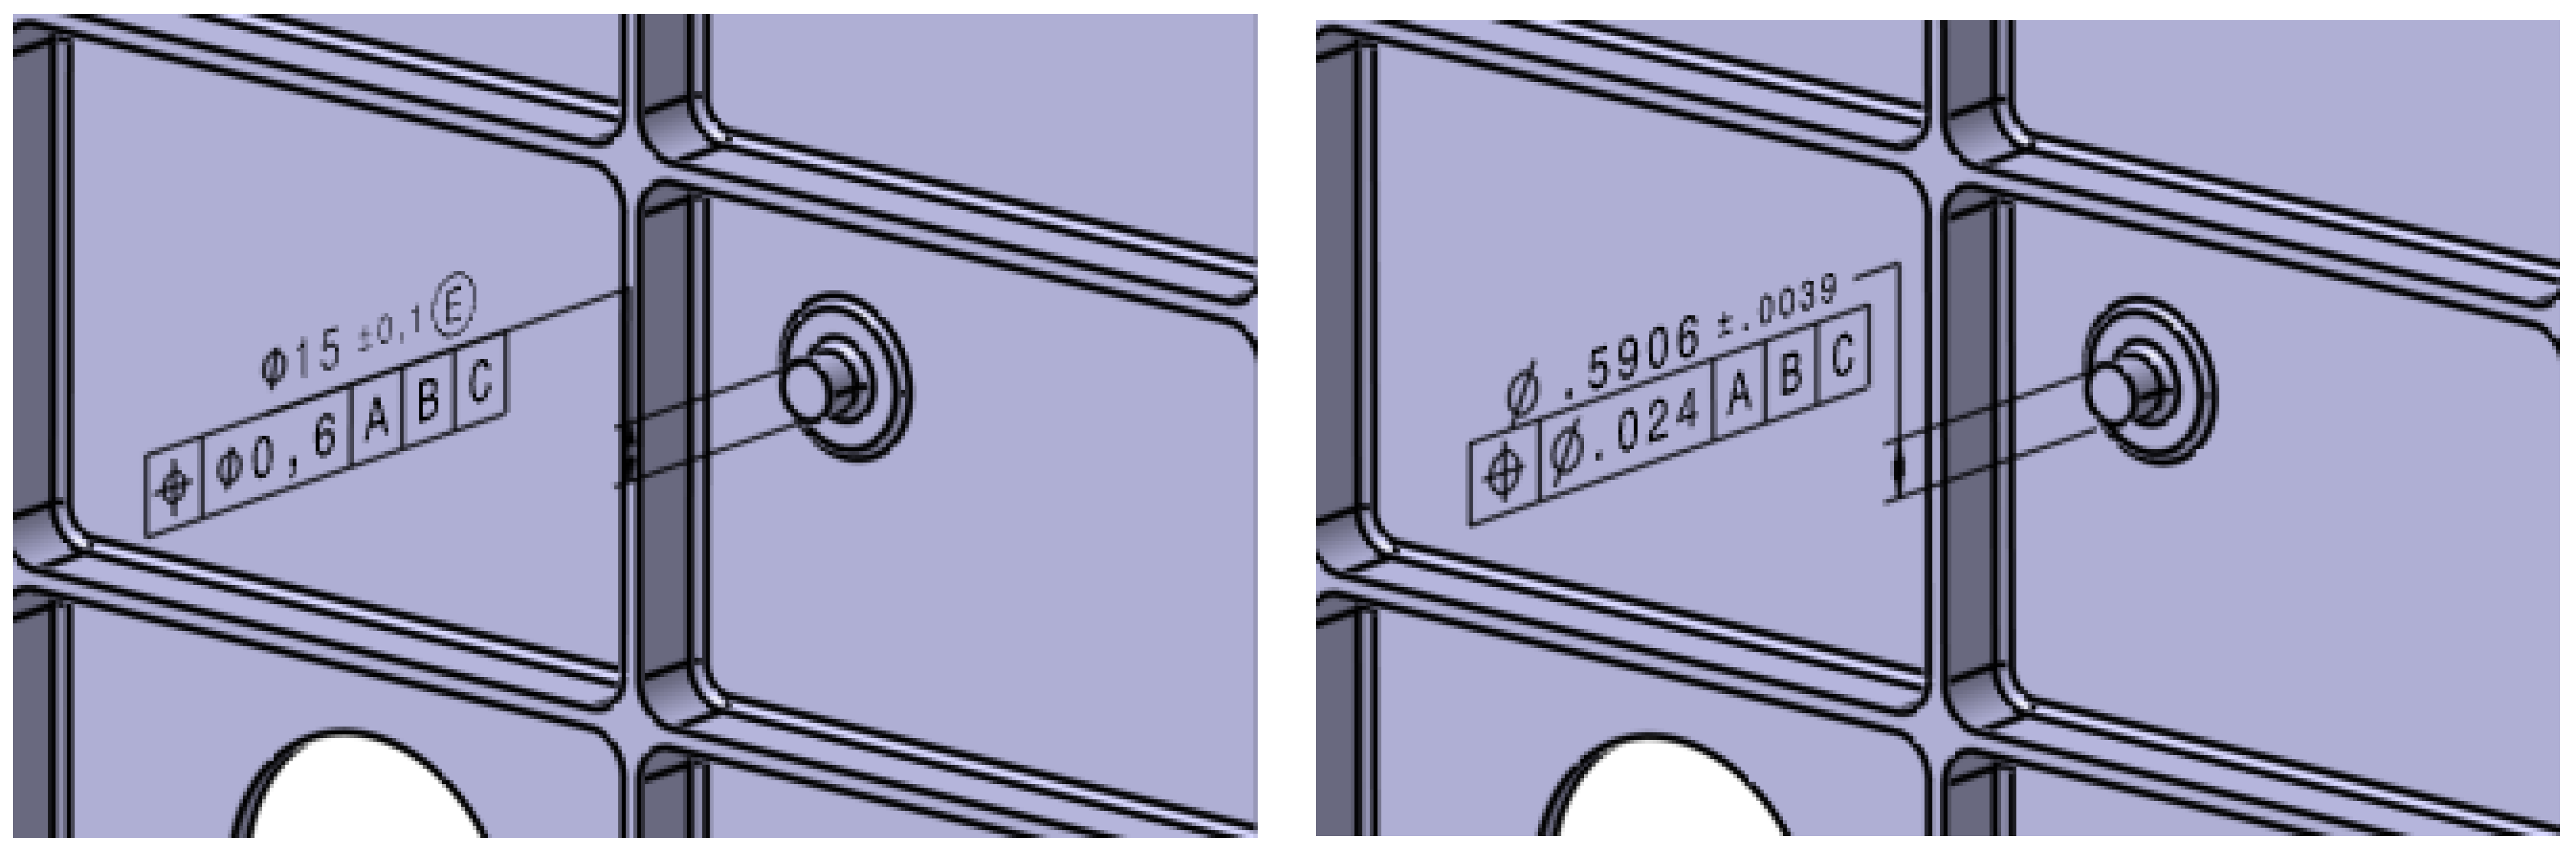
Appendix A.1.4. Flange Holes

A pattern of 10 holes on a curved surface. A position tolerance to the main datum system controls the location and orientation of the pattern relative to the part. A tighter tolerance controls the relative locations of the holes in order to ensure a fit to a hypothetical interfacing part, Figure A6.
Figure A6. Flange holes in ISO model (top illustration) and Flange holes in ASME model (bottom illustration).
Metrology 03 00002 g0a6

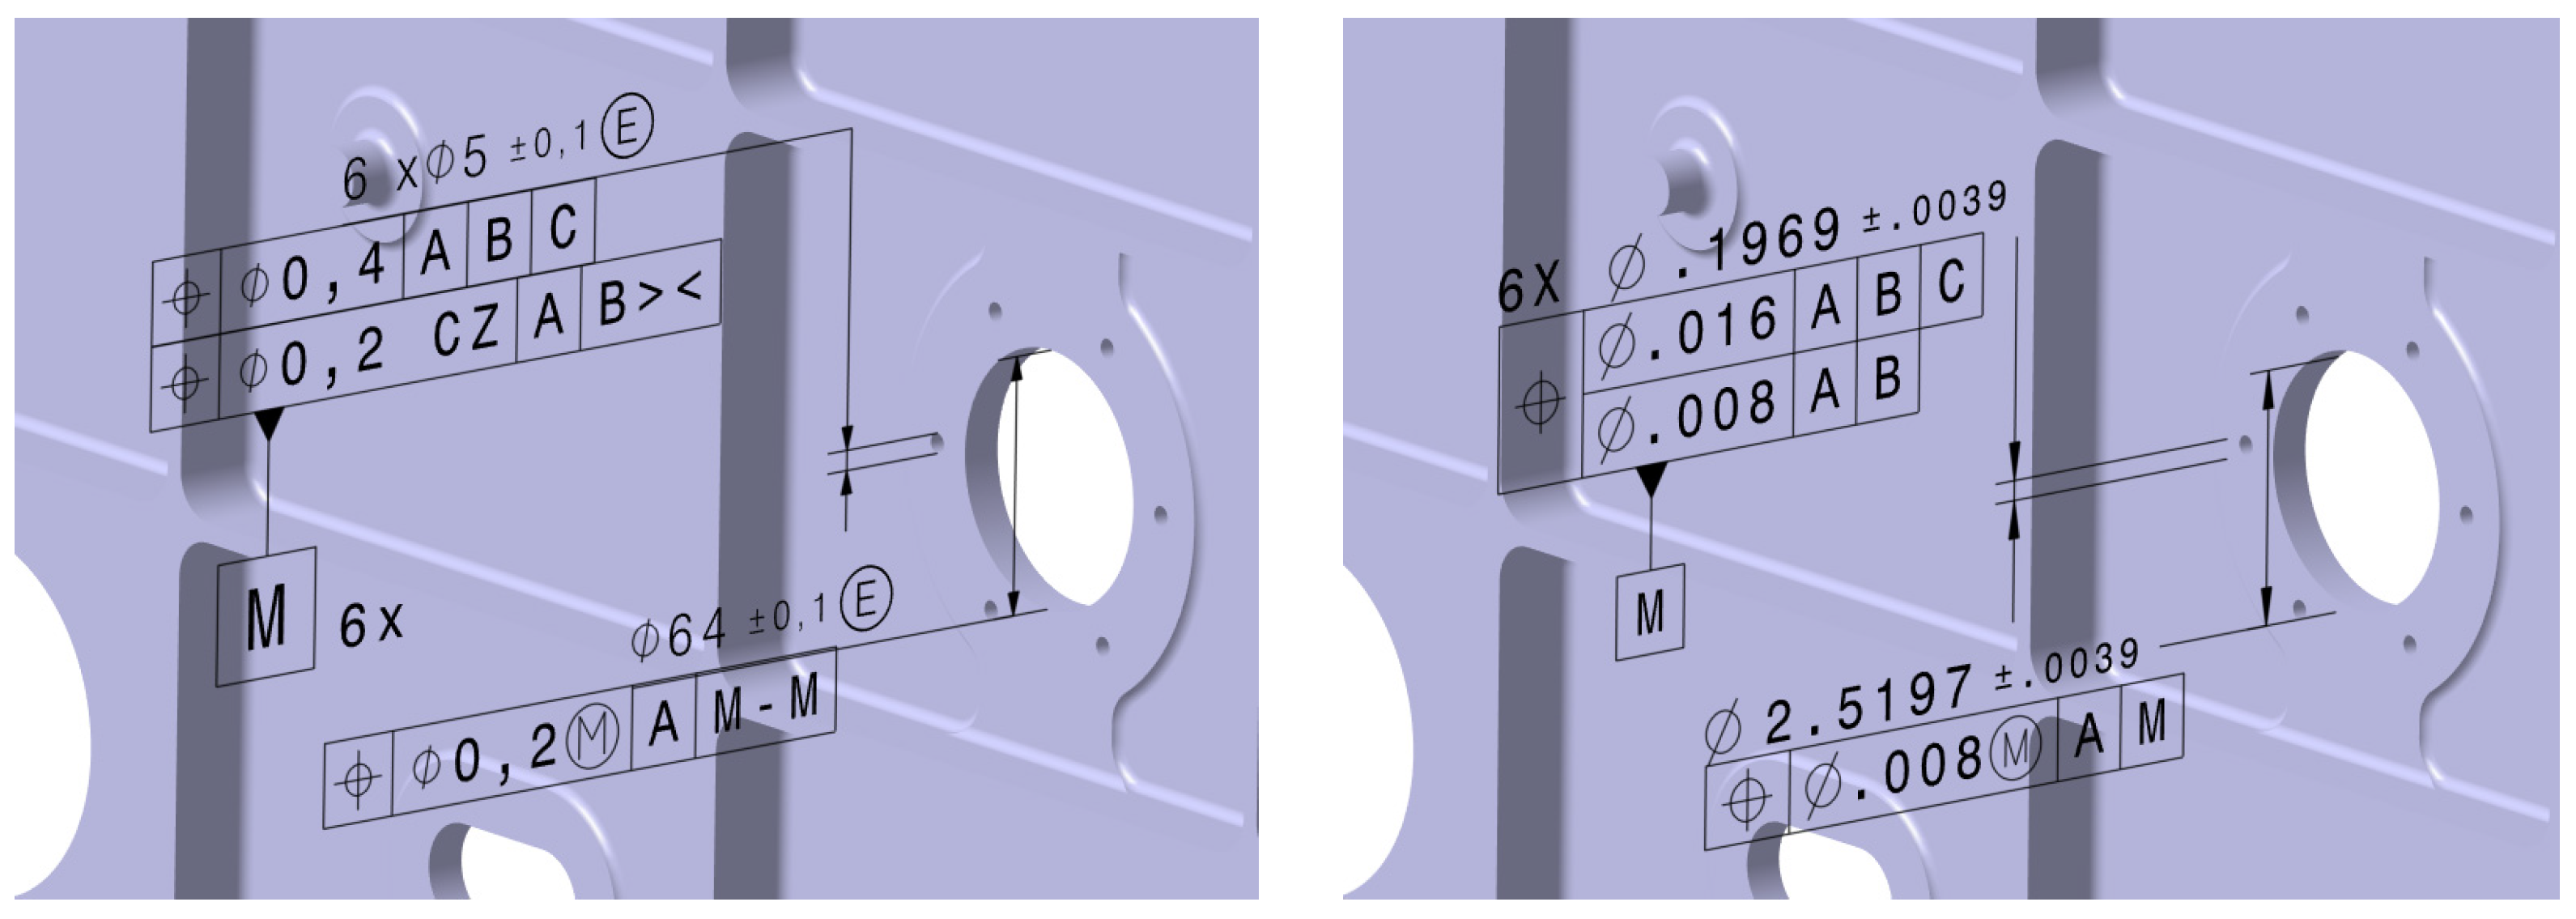
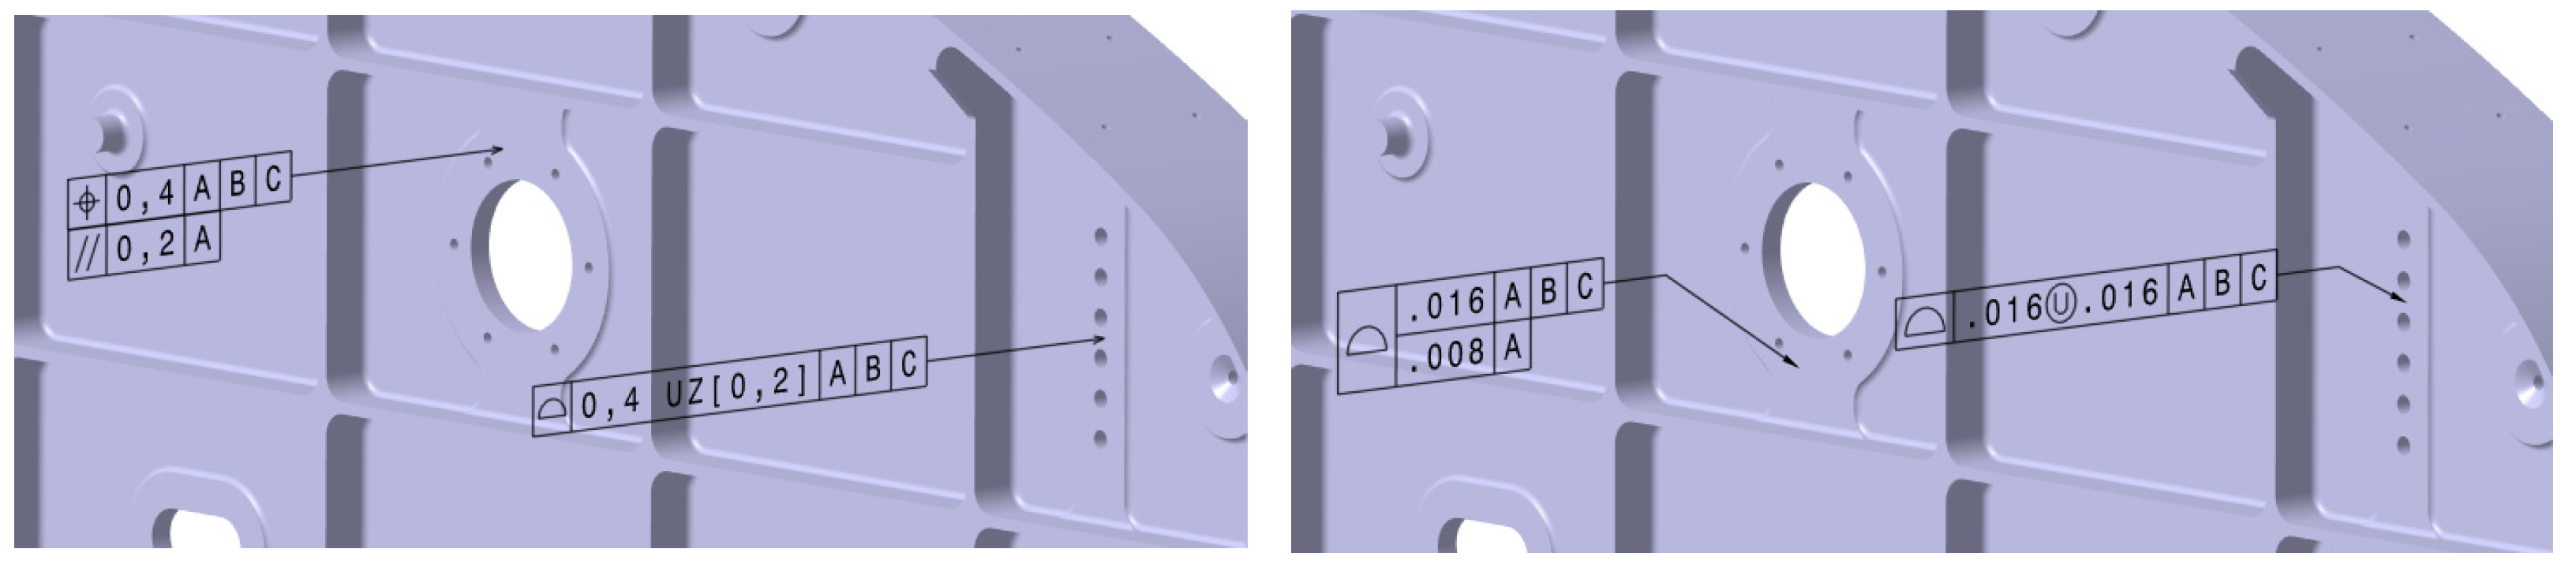
Appendix A.1.5. Satellite Hole Pattern

A large hole in the web surrounded by six satellite holes. This resembles an interface where a cylindrical connector is positioned on a circular pattern of satellite holes. The two position tolerances, ASME: composite tolerance, control a hypothetical mating part’s location and rotation. The mating part is simulated by a local datum system (A|M-M) to which the centre hole is positioned in order to fit to the mating part. One purpose of this interface is to demonstrate hole patterns toleranced in rotational degrees of freedom, Figure A7.
Figure A7. Satellite hole pattern in ISO model (left illustration) and Flange holes in ASME model (right illustration).
Metrology 03 00002 g0a7

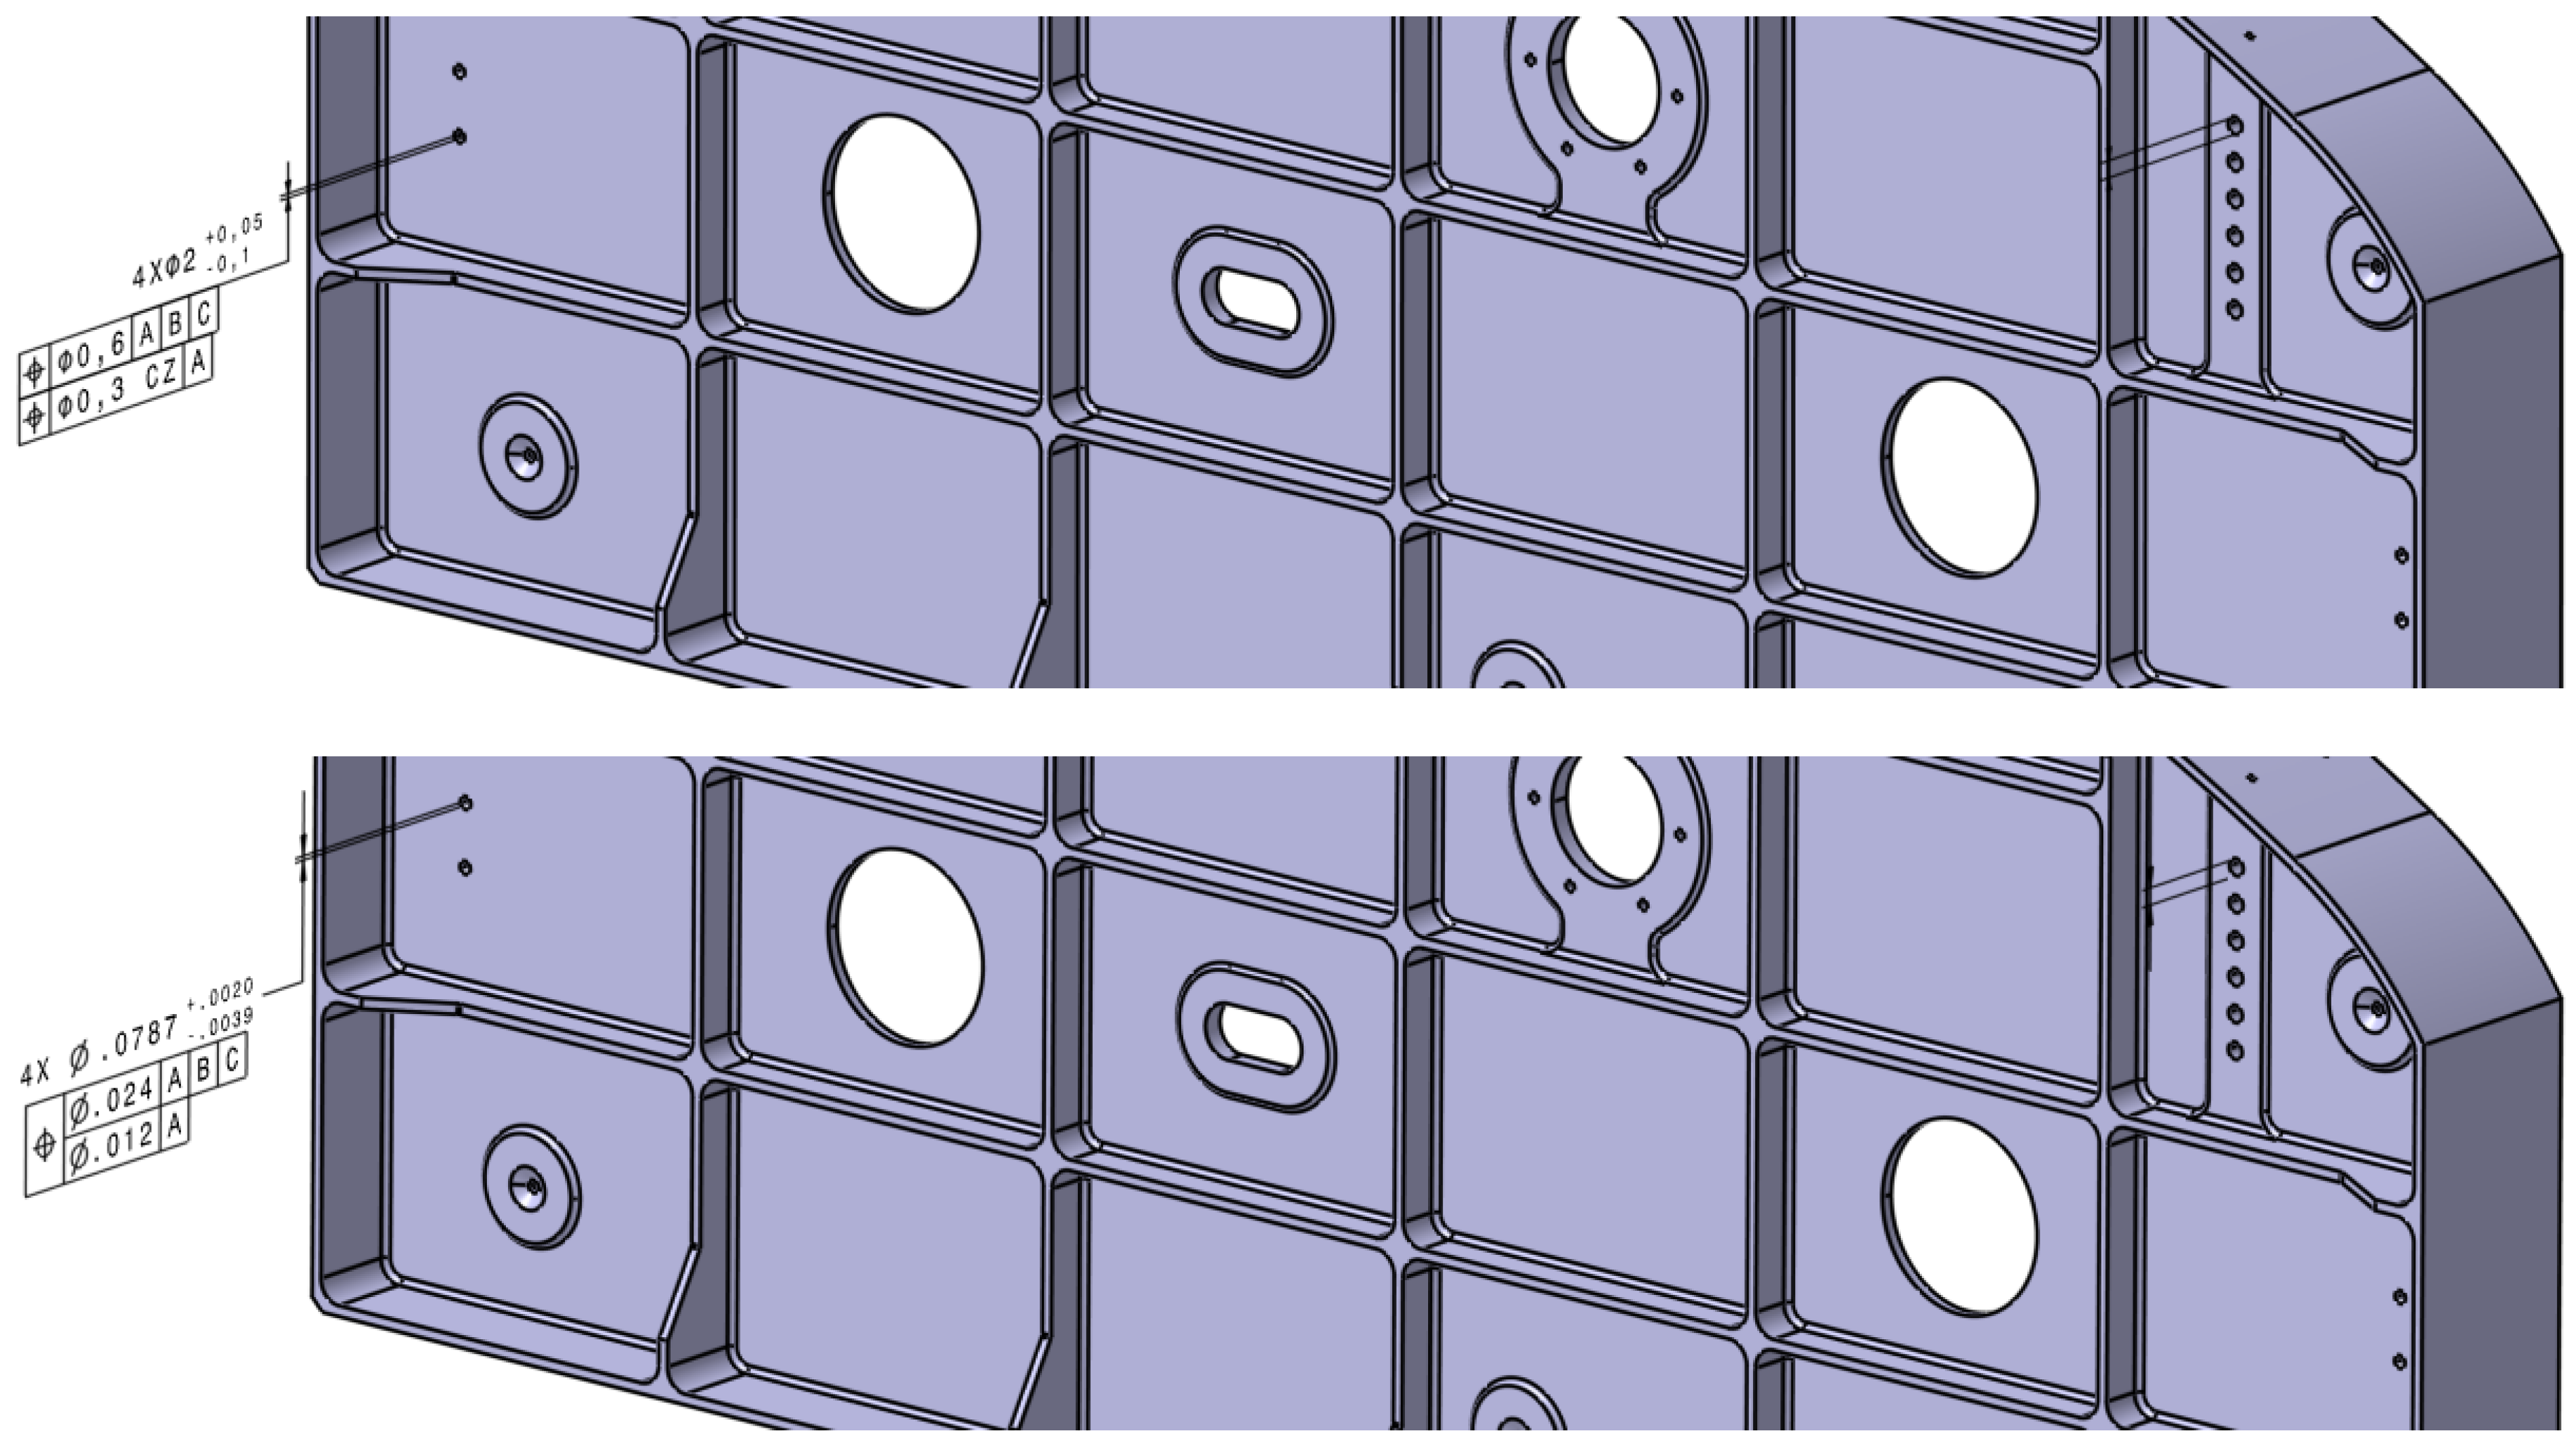
Appendix A.1.6. Wide Hole Pattern

A pattern of four countersunk ⌀2 mm holes 1125 mm apart, Figure A8. The holes have a positional tolerance with respect to the main datum system and an internal position tolerance. One purpose of this pattern is to demonstrate a pattern that extends over a longer distance.
Figure A8. Wide hole pattern in ISO model (top illustration) and Wide hole pattern in ASME model (bottom illustration).
Metrology 03 00002 g0a8

Appendix A.1.7. Pin

Simple cylindrical pin on the web purposed to demonstrate external features of size. It is toleranced with a position tolerance with respect to the main datum system, Figure A9.
Figure A9. Pin specified in ISO model (left illustration) and Pin specified in ASME model (right illustration).
Metrology 03 00002 g0a9

Appendix A.1.8. Upper Flange

The larger part of the upper flange has an ordinary profile tolerance with respect to the main datum system. A smaller portion of the upper flange also has an orientation-only profile tolerance. This is purposed to demonstrate orientation tolerance on a non-planar surface. There is also an 8 mm step to demonstrate tolerancing of step height which is done by simultaneously tolerancing profile (form) on both sides of the step, Figure A10.
Figure A10. Upper flange in ISO model (top illustration) Upper flange in ASME model (bottom illustration).
Metrology 03 00002 g0a10

Appendix A.1.9. Aft Web Surfaces

Since the main datum system is located on the forward web, two surfaces on the aft web are toleranced with respect to the datum system. One is toleranced using position and parallelism (ASME: composite profile tolerance) in order to demonstrate both locational and orientational tolerancing. The other is toleranced with an offset profile specification where the whole tolerance zone lies outside of the nominal location, the purpose of which is to demonstrate asymmetric tolerancing as well as the different syntaxes in ISO and ASME, Figure A11.
Figure A11. Aft web surfaces in ISO model (left illustration) and Aft web surfaces in ASME model (right illustration).
Metrology 03 00002 g0a11

References

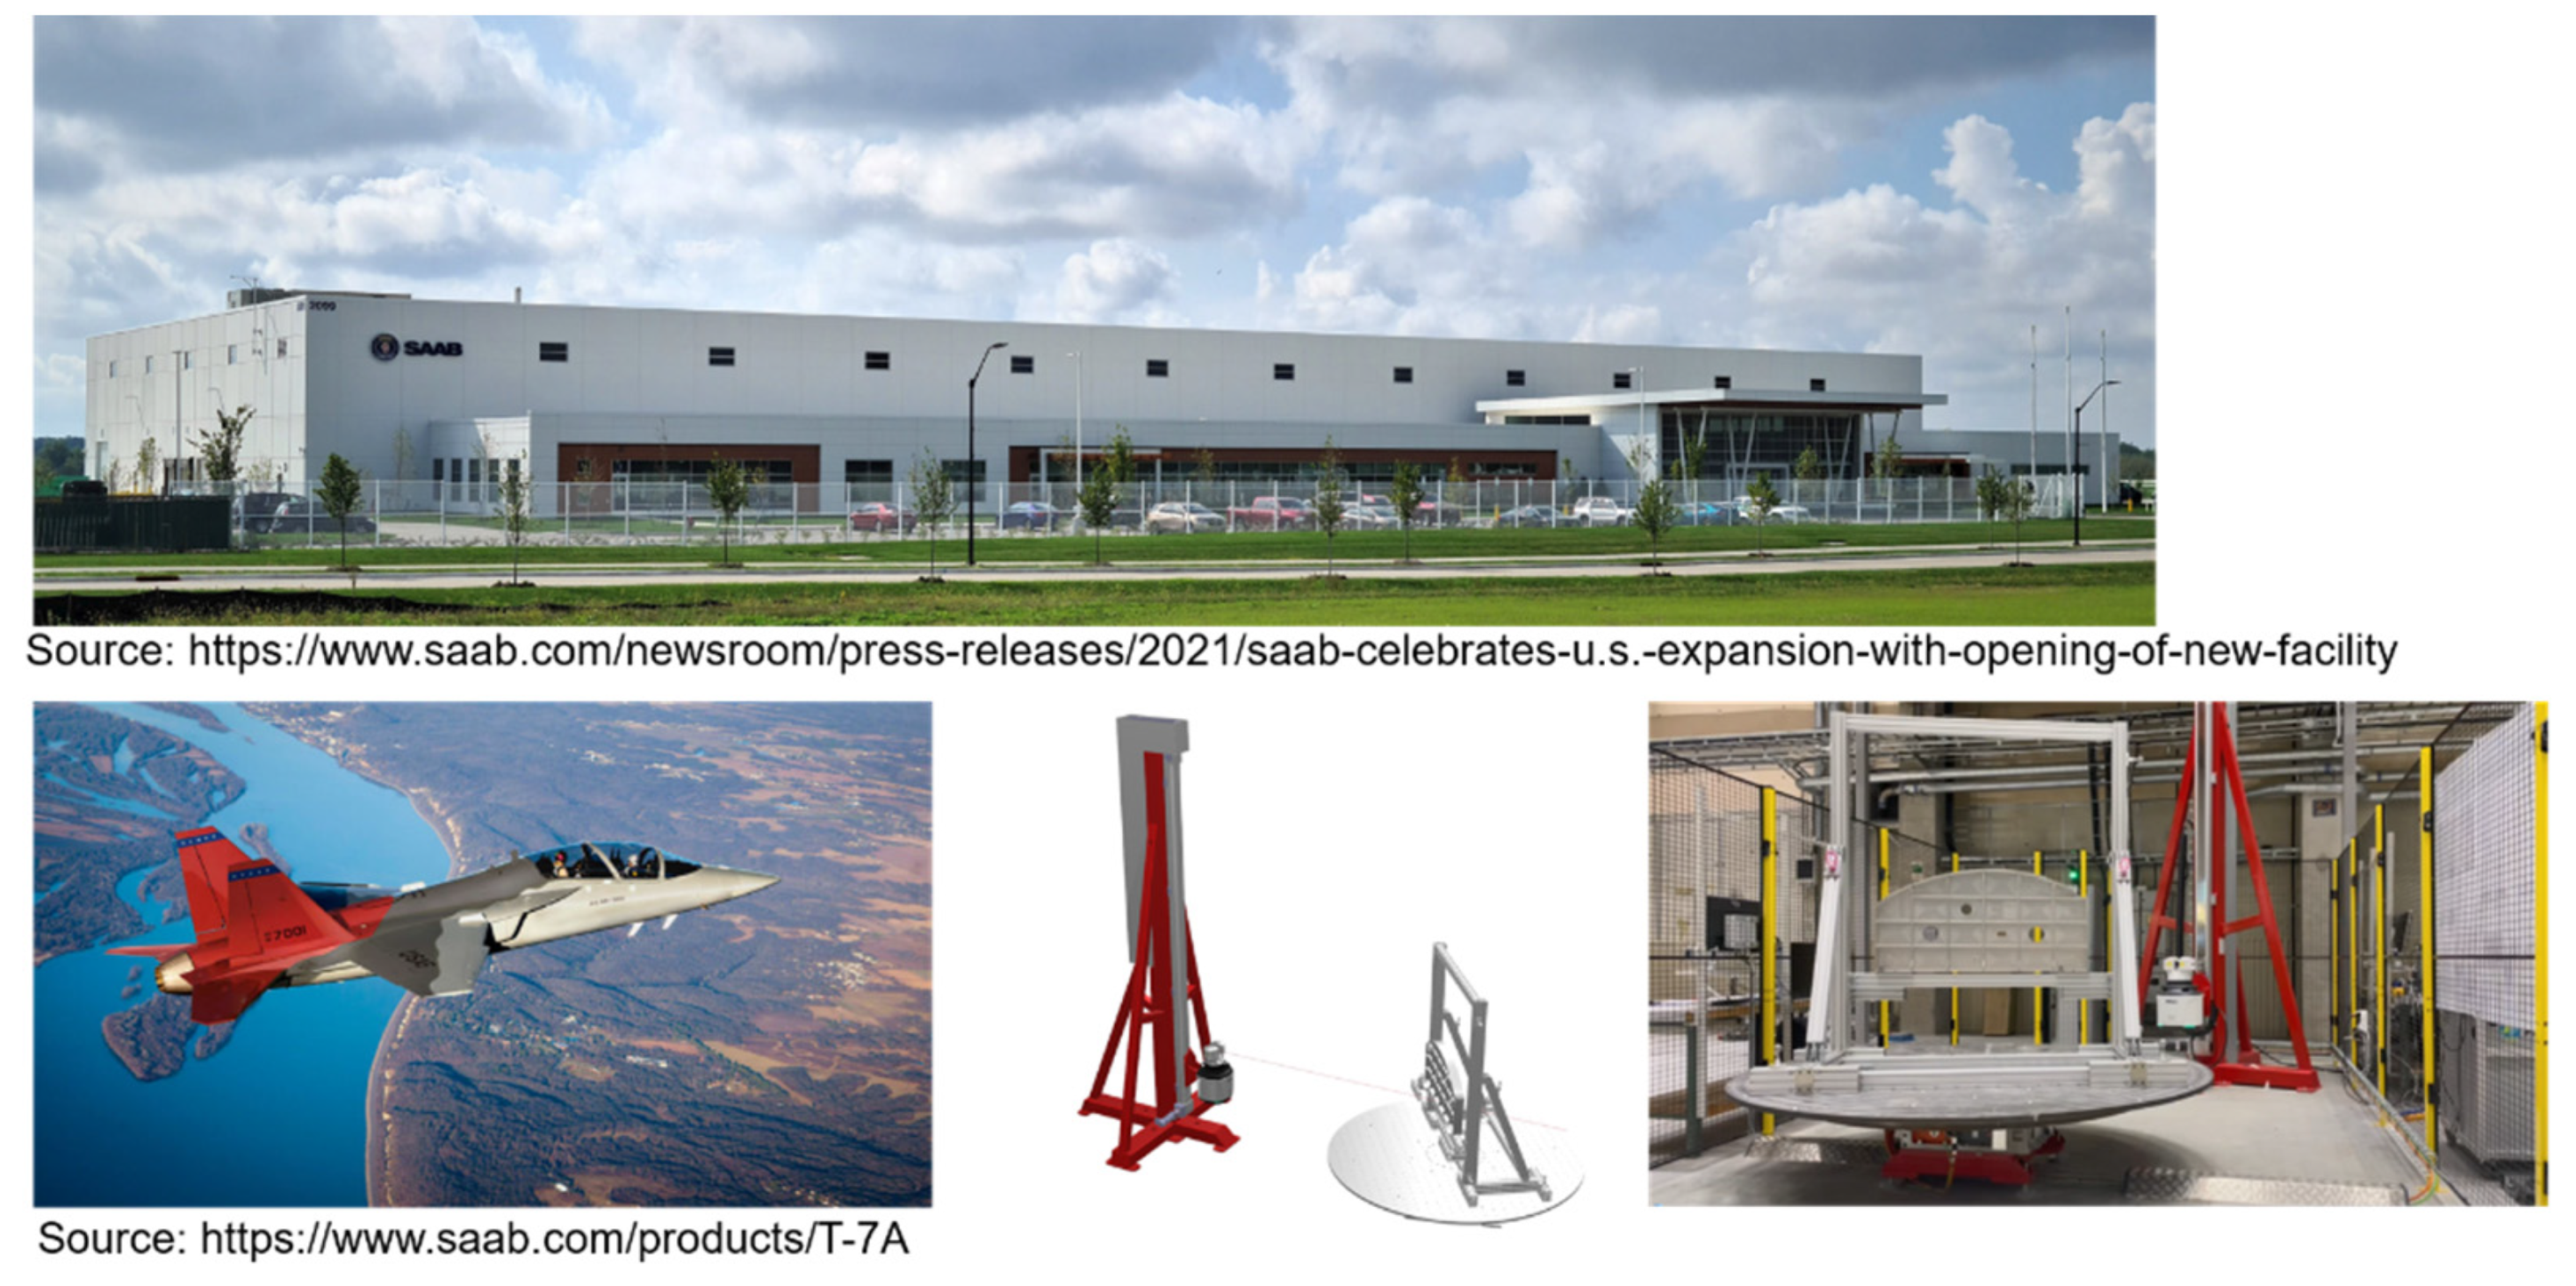
  1. Information about the eT-7A Aircraft Program, Saab AB Homepage. 18 March 2022. Available online: https://www.saab.com/products/T-7A (accessed on 28 September 2022).
  2. John, A. Tirpak, Boeing Rolls out Production T-7A, First New Jet Trainer in 60 Years. Air Force Magazine. 28 April 2022. Available online: https://www.airforcemag.com/boeing-rolls-out-production-t-7a-first-new-jet-trainer-in-60-years/ (accessed on 28 January 2022).
  3. Nikon Metrology Products Homepage. 26 April 2022. Available online: https://www.nikonmetrology.com/en-gb/3d-metrology/large-volume-metrology-apdis-mv4x0 (accessed on 28 January 2022).
  4. Nikon, Automotive. 2021. Available online: https://industry.nikon.com/en-gb/blog/laser-radar-helps-automotive-manufacturers-push-the-accelerator/ (accessed on 28 January 2022).
  5. Metrology News, 25 May 2022, Laser Radar Heralds a Paradigm Shift In Automotive Metrology. Available online: https://metrology.news/laser-radar-heralds-a-paradigm-shift-in-automotive-metrology/ (accessed on 28 January 2022).
  6. Kiraci, E.; Franciosa, P.; Turley, G.A.; Olifent, A.; Attridge, A.; Williams, M.A. Moving towards in-line metrology: Evaluation of a Laser Radar system for in-line dimensional inspection for automotive assembly systems. Int. J. Adv. Manuf. Technol. 2017, 91, 69–78. [Google Scholar] [CrossRef] [Green Version]
  7. Vlaeyen, M.; Haitjema, H.; Dewulf, W. Uncertainty-Based Autonomous Path Planning for Laser Line Scanners. Metrology 2022, 2, 479–494. [Google Scholar] [CrossRef]
  8. Kortaberria, G.; Mutilba, U.; Gomez, S.; Ahmed, B. Three-Dimensional Point Cloud Task-Specific Uncertainty Assessment Based on ISO 15530-3 and ISO 15530-4 Technical Specifications and Model-Based Definition Strategy. Metrology 2022, 2, 394–413. [Google Scholar] [CrossRef]
  9. Salicone, S. New Frontiers in Measurement Uncertainty. Metrology 2022, 2, 495–498. [Google Scholar] [CrossRef]
  10. Information about the Gripen E Aircraft Program, Saab AB Homepage. 18 March 2022. Available online: https://www.saab.com/products/gripen-e-series (accessed on 28 January 2022).
  11. Vinnova Homepage, 18 March 2022, Digi-Q Research Project Information. Available online: https://www.vinnova.se/en/p/digital-quality-assurance-for-sustainable-industry/ (accessed on 28 January 2022).
  12. IPS (Industrial Path Solution) Homepage. Realize the Potential of the Virtual World. 18 March 2022. Available online: https://industrialpathsolutions.se/#top (accessed on 28 January 2022).
  13. IPS (Industrial Path Solution). Inspection Path Planner Homepage. 18 March 2022. Available online: https://industrialpathsolutions.se/ips-inspection-path-planner (accessed on 28 January 2022).
  14. Metrologic Group Homepage, i-Robot is Now Compatible with the Newest NIKON APDIS Laser Radar. 19 January 2021. Available online: https://www.metrologic.group/i-robot-is-now-compatible-with-the-newest-nikon-apdis-laser-radar/ (accessed on 28 January 2022).
  15. Jones, D.; Snider, C.; Nassehi, A.; Yon, J.; Hicks, B. Characterising the Digital Twin: A systematic literature review. CIRP J. Manuf. Sci. Technol. 2020, 29, 36–52. [Google Scholar] [CrossRef]
  16. Shao, G.; Helu, M. Framework for a digital twin in manufacturing: Scope and requirements. Manuf. Lett. 2020, 24, 105–107. [Google Scholar] [CrossRef] [PubMed]
  17. Maggiano, L. Manufacturing net. How Digital Twins for Metrology Enables Smart Manufacturing. 30 May 2018. Available online: https://www.manufacturing.net/operations/article/13228531/how-digital-twins-for-metrology-enables-smart-manufacturing (accessed on 28 January 2022).
  18. Metrology News. Digital Twins—More Than Just A Software Solution. 1 August 2022. Available online: https://metrology.news/digital-twins-more-than-just-a-software-solution/ (accessed on 1 August 2022).
  19. Maropoulos, P.; Guo, Y.; Jamshidi, J.; Cai, B. Large-volume metrology process models: A framework for integrating measurement with assembly planning. CIRP Ann. 2008, 57, 477–480. [Google Scholar] [CrossRef]
  20. Zhao, Y.F.; Xu, X.W.; Kramer, T.R.; Proctor, F.M.; Horst, J.A. Dimensional metrology interoperability and standardization in manufacturing systems. Comput. Stand. Interfaces 2011, 33, 541–555. [Google Scholar] [CrossRef]
  21. Zhao, Y.; Brown, R.; Kramer, T.R.; Xu, X. Information Modeling for Interoperable Dimensional Metrology; Springer: London, UK, 2011. [Google Scholar] [CrossRef]
  22. Salman, R.; Carlson, J.S.; Ekstedt, F.; Spensieri, D.; Torstensson, J.; Söderberg, R. An Industrially Validated CMM Inspection Process with Sequence Constraints. Procedia CIRP 2016, 44, 138–143. [Google Scholar] [CrossRef]
  23. The Traveling Salesman Problem (TSP) Explained by Using the Held–Karp Algorithm, Also Called Bellman–Held–Karp Algorithm. Available online: https://en.wikipedia.org/wiki/Held%E2%80%93Karp_algorithm (accessed on 28 January 2022).
  24. Popular Science Description of the TSP Explained. Available online: https://mathonweb.com/entrtain/tsp/t_tsp.htm (accessed on 28 January 2022).
  25. Goher, K.; Shehab, E.; Al-Ashaab, A. Model-Based Definition and Enterprise: State-of-the-art and future trends. Proc. Inst. Mech. Eng. Part B J. Eng. Manuf. 2021, 235, 2288–2299. [Google Scholar] [CrossRef]
  26. STEP AP242 Project Homepage. 23 December 2022. Available online: http://www.ap242.org/ (accessed on 20 December 2022).
  27. ISO Homepage. ISO23952:2020 Quality Information Framework (QIF). 23 December 2022. Available online: https://www.iso.org/standard/77461.html (accessed on 20 December 2022).
  28. Wärmefjord, K.; Söderberg, R.; Schleich, B.; Wang, H. Digital Twin for Variation Management: A General Framework and Identification of Industrial Challenges Related to the Implementation. Appl. Sci. 2020, 10, 3342. [Google Scholar] [CrossRef]
  29. Herzog, E.; Tingström, J.; Nordling Larsson, Å. Genesis—An Architectural Pattern for Federated PLM. In Proceedings of the 19th Annual Conference on Systems Engineering Research. Transdisciplinary Nature of SE: Impact on Traditional and Novel Applications, Virtual, 24–26 March 2022; Norwegian University of Science and Technology: Trondheim, Norway, 2022. [Google Scholar]
  30. ISO SMCC (Smart Manufacturing Coordinating Committee). Whitepaper, Publication Date November 2021, Edition 1. 28 March 2022. Available online: https://www.iso.org/files/live/sites/isoorg/files/store/en/PUB100459.pdfP (accessed on 20 December 2022).
  31. ISO 23247-1:2021, Automation Systems and Integration—Digital Twin Framework for Manufacturing—Part 1: Overview and General Principles. Available online: https://www.iso.org/standard/75066.html (accessed on 20 December 2022).
  32. Sohlenius, G. Systemic Nature of the Innovation Process in Industrial Production—Our Engine of Welfare. Forthcoming. Doctoral Thesis, Tampere University of Technology, Tampere, Finland, 2004. [Google Scholar]
  33. Bagge, M. An Approach for Systematic Process Planning of Gear Transmission Parts [Internet] [Licentiate Dissertation]. [Stockholm]: KTH; 2009. (Trita-IIP). Available online: http://urn.kb.se/resolve?urn=urn:nbn:se:kth:diva-9942 (accessed on 20 December 2022).
  34. Lindqvist, R. Geometrical and Dimensional Measurement Planning: A Systematic and Holistic Approach [Internet] [Licentiate Dissertation]. [Stockholm]: KTH Royal Institute of Technology; 2011. (Trita-IIP). Available online: http://urn.kb.se/resolve?urn=urn:nbn:se:kth:diva-42163 (accessed on 20 December 2022).
  35. Schleich, B.; Anwer, N.; Mathieu, L.; Wartzack, S. Shaping the digital twin for design and production engineering. CIRP Ann. 2017, 66, 141–144. [Google Scholar] [CrossRef]
  36. RD&T (Robust Design and Tolerancing) Homepage. 2 September 2022. Available online: http://rdnt.se/ (accessed on 28 September 2022).
  37. Cetol 6σ Homepage. 2 September 2022. Available online: https://www.sigmetrix.com/products/cetol-tolerance-analysis-software/ (accessed on 28 September 2022).
  38. InnovMetric Software Inc. PMI+Loop Computer Application. Available online: https://www.innovmetric.com/products/polyworks-pmi-loop (accessed on 28 September 2022).
Figure 1. The new Saab Inc “greenfield” factory. The new eT7-A, USAF, pilot training aircraft and the experimental automated dimensional metrology system virtually and physically displayed. By the courtesy of Saab AB and Saab Aeronautics.
Metrology 03 00002 g001
Figure 2. Early concept illustration of an automated large-volume dimensional measuring system. Two robots mounted on linear guides carrying one laser sensor each together with one overhead linear guide carrying one laser radar sensor. Measuring volume: 14 × 10 × 4 m3.
Metrology 03 00002 g002
Figure 3. Scientific method for research and development in the area of science of engineering [32].
Metrology 03 00002 g003
Figure 4. Comparison and presentation of different research methods. (Lindqvist, 2011) [34].
Metrology 03 00002 g004
Figure 5. The principal functional operation of a laser radar for absolute distance measurements, using heterodyne interferometry for automatic non-contact dimensional measurements. By the courtesy of LK Scandinavia.
Metrology 03 00002 g005
Figure 6. The principal functional operation of a laser radar. By the courtesy of LK Scandinavia.
Metrology 03 00002 g006
Figure 7. The principal functional operation of a laser radar. By the courtesy of LK Scandinavia.
Metrology 03 00002 g007
Figure 8. The first verification and calibration performance test and results, Nikon APDIS MV430E Laser Radar, sensor unit ID 4013. The control chart displays measured position of the scalebar as a function of the percentage of the Maximal Permissible Error (%MPE).
Metrology 03 00002 g008
Figure 9. The first verification and calibration performance test and results, Nikon APDIS MV430E Laser Radar, sensor unit ID 4014. The control chart displays measured position of the scalebar as a function of the percentage of the Maximal Permissible Error (%MPE).
Metrology 03 00002 g009
Figure 10. Virtual 3D-model, illustrating the outer dimensions of the MPQP test artefact.
Metrology 03 00002 g010
Figure 11. Manufacturing of MPQP test artefacts by NC machining operations.
Metrology 03 00002 g011
Figure 12. Verification and periodic inspection of manufactured MPQP test artefacts in a dedicated Saab calibrated and traceable reference CMM machine.
Metrology 03 00002 g012
Figure 13. Calibration report for Hexagon DEA Global CMM. Test date 31 August 2021.
Metrology 03 00002 g013
Figure 14. Each MPQP test artefact is securely stored in dedicated and marked aluminium containers/boxes. Every container/box can store a maximum of two MPQP artefacts.
Metrology 03 00002 g014
Figure 15. Main datum reference system in ISO model.
Metrology 03 00002 g015
Figure 16. Main datum reference system in ASME model.
Metrology 03 00002 g016
Figure 17. Holistic illustration and activity model of the Saab dimensional management and metrology data and information process.
Metrology 03 00002 g017
Figure 18. Generic digital thread and description of dimensional measurement activities. Presented and illustrated throughout the Product Lifecycle Management (e.g., CAD/CAI/MES) and Operational Technology domains (e.g., Sensor IIOTcontrol and PLC integration).
Metrology 03 00002 g018
Figure 19. Digital thread and description of large volume metrology presented and illustrated through a data and information activity workflow. Exchange of different file formats are presented.
Metrology 03 00002 g019
Figure 20. Illustration of a holistic closed-loop, end-to-end, dimensional management, and metrology data and information process based on direct API (Application Protocol Interface) connections. Saab vision and future state.
Metrology 03 00002 g020
Figure 21. Principal construction of the laser radar measuring cell.
Metrology 03 00002 g021
Figure 22. General description of the data and information process acting in the measuring cell. Starting with off-line programming, including path planning and sequence optimization. Then a complete dimensional metrology program is generated by scripts.
Metrology 03 00002 g022
Figure 23. Description of system calibration procedure and update of the digital twin. First and second working steps (moving from the left illustration to the right illustration).
Metrology 03 00002 g023
Figure 24. Description of system calibration procedure and update of the digital twin. Third and fourth working steps moving from the left illustration to the right illustration).
Metrology 03 00002 g024
Figure 25. Description of system calibration procedure and update of the digital twin. Fifth and six working steps.
Metrology 03 00002 g025
Figure 26. Early virtual illustration example of the 3D scene in IPS LR application using a car door as virtual test object.
Metrology 03 00002 g026
Figure 27. Early virtual illustration example of the 3D scene in IPS LR application for task planning.
Metrology 03 00002 g027
Figure 28. The matrices illustrates how the optimization criteria minimizes the number of ZM configuration alternatives.
Metrology 03 00002 g028
Figure 29. The matrix illustrates how to optimize the sequence to meet the criteria of minimizing measuring cycle time.
Metrology 03 00002 g029
Figure 30. Illustration of the new and updated 3D scene in IPS LR software application.
Metrology 03 00002 g030
Figure 31. The evolved IPS laser radar process overview.
Metrology 03 00002 g031
Figure 32. The evolved IPS LR system concept, Step 1.
Metrology 03 00002 g032
Figure 33. The evolved IPS LR system concept, Step 2.
Metrology 03 00002 g033
Figure 34. The evolved IPS LR system concept, Step 3.
Metrology 03 00002 g034
Figure 35. The evolved IPS LR system concept, Step 4.
Metrology 03 00002 g035
Figure 36. Illustration from 3rd party metrology software application, i.e., Polyworks Inspector GUI (Graphical User Interface).
Metrology 03 00002 g036
Figure 37. Illustration of the complete measuring cycle and the measuring sequences in the real measuring cell.
Metrology 03 00002 g037
Table 1. APDIS laser radar MV430E product specification and performance measures.
Product model/name:MV430E
Range:0.5 m to 30 m
Data Rate:4000 Hz
Scanning Speed *:1000 pts/s, 1 s/cm2
Feature Measurement:Enhanced Feature Scan **
Vibration Measurement: 2000 Hz Maximum: 1 µm/m sensitivity
Environmental:IP54
* Default settings–stacking 4, point spacing 0.1 mm, line spacing 1 mm; ** Feature measurement up to twice as fast as standard variant. Exact speed depends on the settings.
Table 2. APDIS laser radar MV430E working limit and accuracy performance measures.
RangeAzimuthElevation
Working limit:0.5 m to 30 m±180°±45°
Accuracy (MPE):20 µm + 5 µm/m13.6 µm/m
Table 3. APDIS laser radar MV430E average range, MPE, and typical accuracy performance measures.
Average range (m)0.5125102030
MPE (µm) *334057115216420625
Typical (µm) **:17202858108210313
* Accuracy given as Maximum Permissible Error (MPE) in accordance with ASME B89.4.19–2006 verified in vertical orientation at 20 °C. ** Typical accuracy shown is half MPE. All measurements taken in a stable environment with ½″ grade 25 or better tooling ball.
Disclaimer/Publisher’s Note: The statements, opinions and data contained in all publications are solely those of the individual author(s) and contributor(s) and not of MDPI and/or the editor(s). MDPI and/or the editor(s) disclaim responsibility for any injury to people or property resulting from any ideas, methods, instructions or products referred to in the content.

