Article

Three-Dimensional Point Cloud Task-Specific Uncertainty Assessment Based on ISO 15530-3 and ISO 15530-4 Technical Specifications and Model-Based Definition Strategy

Department of Mechanical Engineering, Tekniker Research Centre, 20600 Eibar, Spain
*
Author to whom correspondence should be addressed.
Metrology 2022, 2(4), 394-413; https://doi.org/10.3390/metrology2040024
Submission received: 22 July 2022 / Revised: 19 September 2022 / Accepted: 22 September 2022 / Published: 27 September 2022
(This article belongs to the Collection Measurement Uncertainty)

Abstract

:
Data-driven manufacturing in Industry 4.0 demands digital metrology not only to drive the in-process quality assurance of manufactured products but also to supply reliable data to constantly adjust the manufacturing process parameters for zero-defect manufacturing processes. Better quality, improved productivity, and increased flexibility of manufacturing processes are obtained by combining intelligent production systems and advanced information technologies where in-process metrology plays a significant role. While traditional coordinate measurement machines offer strengths in performance, accuracy, and precision, they are not the most appropriate in-process measurement solutions when fast, non-contact and fully automated metrology is needed. In this way, non-contact optical 3D metrology tackles these limitations and offers some additional key advantages to deploying fully integrated 3D metrology capability to collect reliable data for their use in intelligent decision-making. However, the full adoption of 3D optical metrology in the manufacturing process depends on the establishment of metrological traceability. Thus, this article presents a practical approach to the task-specific uncertainty assessment realisation of a dense point cloud data type of measurement. Finally, it introduces an experimental exercise in which data-driven 3D point cloud automatic data acquisition and evaluation are performed through a model-based definition measurement strategy.

1. Introduction

Metrology is considered a fundamental tool in the context of Industry 4.0, where reliable data are needed to realise data-driven manufacturing strategies [1,2,3]. As far as metrology is moving from the lab to the shop floor where the manufacturing of goods takes place, it is breaking the stigma of non-productive activity and gaining a position as an enabling technology that adds value to every step of the production process [4]. This perception is becoming more evident in Industry 4.0, where measurement data from several sensors are required, including dimensional data, for the monitoring of complete manufacturing processes and real-time adjustment of process parameters, including the creation and use of metrological digital twins [2,5,6,7,8,9].
Massive integration of 3D optical sensors within manufacturing processes is occurring nowadays, replacing traditional Coordinate Measurement Machines (CMM) within the automotive, aerospace and power generation industries, among the leading industries in the adoption of MBD [10]. However, while the delivery of millions of points in a matter of seconds is assumed by 3D optical sensors, the process of automatically converting dense data into meaningful information and assuring the quality of these data remains a challenge [11].
This research article presents a practical approach to addressing both challenges. While the process of converting dense data into meaningful information is solved through a Quality Information Framework (QIF)–Model-based Definition (MBD) based measurement post-processing strategy, the assurance of the quality of the data that relies on the establishment of metrological traceability is assessed by the combination of the ISO 15530-3 and ISO 15530-4 technical specifications through which the establishment of metrological traceability, which requires (a) evaluation of the measurement uncertainty and (b) the realisation of an unbroken chain of calibrations to relate a measurement result to a reference value [12], is realised. Thus, the article introduces a task-specific uncertainty assessment of a dense point cloud type of data acquisition in the absence of reliable numerical simulation models for optical systems.
Considering the evaluation of the measurement uncertainty, the Guide to the Expression of Uncertainty in Measurement (GUM) JCGM 100:2008 [13] establishes general rules for evaluating and expressing uncertainty in measurements that are intended to be applied to a broad spectrum of measurements. The GUM-proposed general measurement procedure seems to be clear and easy to adopt but it can be extremely difficult to implement when a complex measurement system is evaluated. As stated by Dury et al., in the broad study about 3D optical systems characterisation performed in the National Physical Laboratory (NPL) “National FreeFrom centre” [11,14,15,16], there are many potential uncertainty error sources such as the light condition, measurand surface properties, system orientation and resolution, ambient temperature, measurement volume, chromatic effects, etc. that complicate to a high extent the reliable characterisation of those systems.
Compared with traditional CMMs, 3D optical systems are a relatively new technology, and their measurement error sources are still being researched. Even though the German guideline for optical 3D measuring systems, the VDI/VDE 2634 series (parts 2 and 3) [17,18], attempts to provide a procedure for comparing the performance of different systems for the acceptance and re-verification of these systems, it does not consider all the potential uncertainty sources while operating in unfavourable environments. Therefore, the lack of measurement procedures to fully understand how 3D optical systems behave under different measurement scenarios limits to a high extent the development of mathematical modelling for those systems [11], and therefore, the development of a digital metrology twin.
The challenge of converting dense data into meaningful information in a matter of seconds involves providing real-time automatic decision-making capability and therefore constantly adjusting process parameters for a zero-defect manufacturing scenario. However, when a 3D optical system is integrated into a manufacturing process and captures millions of points in seconds, “faster data processing” remains a challenge. Thus, the recent publication of the ISO Standard 23952:2020 “Automation systems and integration—Quality Information Framework (QIF)—An integrated model for manufacturing quality information” [19] opens the door to real-time automatic in-line quality control. This Standard suggests a new XML Schema Definition Language that defines, organises and associates the quality and metrology information needed in manufacturing systems and therefore, it allows the effective exchange of metrology data throughout the entire manufacturing quality measurement process—from product design to inspection planning to execution to analysis and reporting. For product definition, QIF includes the ISO QIF part 3: QIF Model-based Definition (MBD) [20,21,22], which defines a digital data format to convey part geometry (typically called the “CAD” model) and information to be consumed by downstream manufacturing quality processes, such as Product Manufacturing Information (PMI) [21,22,23]. This means that MBD allows the attachment of Geometric Dimensioning and Tolerancing (GD&T) information to a CAD model, typically with full “smart” associativity, to create a semantic model. This semantic CAD model allows metrology software to automatically create either an inspection plan or decision-making results (angles, distances, GD&T tolerances, etc.) from available 3D point data. Thus, the QIF MBD information model allows converting the captured dense data into meaningful information using automatic data processing methodologies [1,8,21,24,25]. Therefore, in general terms, MBD is a digital-product model that defines the requirements and specifications of the product and is the cornerstone for Model-Based Enterprise (MBE) since MBE uses MBD to define the product requirements and specifications instead of paper-based documents as the data source for all engineering activities, including the metrology activities during the manufacturing of the product, throughout the product lifecycle [20,21,22,23,26,27,28].
The state-of-the-art of uncertainty assessment to point cloud measurement shows that task-specific uncertainty assessment has not been frequently applied to dense point cloud measurements. Different approaches were suggested for the uncertainty assessment of point clouds, such as the approach introduced by Ding et al., based on spatial feature registration analysis [29]. Senin et al. suggested a method based on fitting Gaussian random fields to high-density point clouds produced by measurement repeats where the fitted field delivers a depiction of the spatial distribution of random measurement error over a part geometry [30]. Yang et al. investigated the point cloud registration step as a major uncertainty source in the laser scanning-aided aircraft assembly process [31]. Zhang et al. also appointed the reconstruction of every point cloud acquisition process as a critical uncertainty source [32]. Forbes et al. presented an uncertainty assessment method associated with the position, size and shape of point cloud data [33]. Another important approach for the uncertainty assessment of point clouds is the mathematical modelling of the measurement instruments, mainly optical systems, employed in the data acquisition process. Mohammadikaji et al. suggested an approach to categorise and model the dominant sources of uncertainty and study the probabilistic propagation of the uncertainties in a 3D inspection using laser line scanners [34]. Zhao et al. suggested the use of a structured light system including the instrument itself, data acquisition, data processing, and other factors as a black model for the uncertainty assessment of 3D point clouds [35]. Some researchers also presented experimental methods to model the systematic errors pertinent to laser scanners [36,37]. Xi et al. suggested various scanner-to-surface distances and inclination angles raise systematic uncertainties for optical sensors [38,39]. Finally, the use of physical artifacts combined with a Design of Experiment (DOE) method was also suggested for the uncertainty assessment of optical systems [40,41,42,43,44,45].

2. Methods

2.1. Practical Approaches to the Uncertainty Assessment within Production Metrology

In cases where potential uncertainty sources for a measurement process can be ascertained, it is relatively easy to follow the prescription of the GUM JCGM 100:2008 [13] uncertainty framework. However, this is not the case for CMMs or 3D optical systems, in which it is extremely difficult to understand how every potential uncertainty source affects the final result. In these cases, different approaches were applied to estimate the uncertainty of the coordinate measurement. In the case of CMMs, the prevailing guidance for users is given in the ISO 15530 technical specifications. While part 1 is very informative and tutorial but not intended to provide operative evaluation tools, parts 3 and 4 are the procedures followed by the manufacturing industry for the uncertainty assessment of coordinate measurement [46,47]. While Section 3 defines an experimental comparison method using a calibrated workpiece, Section 4 suggests a computer simulation approach to provide task-specific uncertainty assessment. The project “Evaluating the Uncertainty in Coordinate Measurement” (EUCOM–under grant agreement nº 17NRM03) project within the European Metrology Programme for Innovation and Research (EMPIR) program has performed the research to develop the two missing parts of the ISO 15530 series: part 2 on a repetition and reversal method and part 5 on a method based on prior information and expert judgement.
In the case of 3D optical systems, system manufacturers employ VDI 2634 parts 2 and 3 [17,18] to characterise and run the product acceptance test before product delivery, but this does not mean that complete system characterisation is performed for a robust measurement uncertainty assessment.

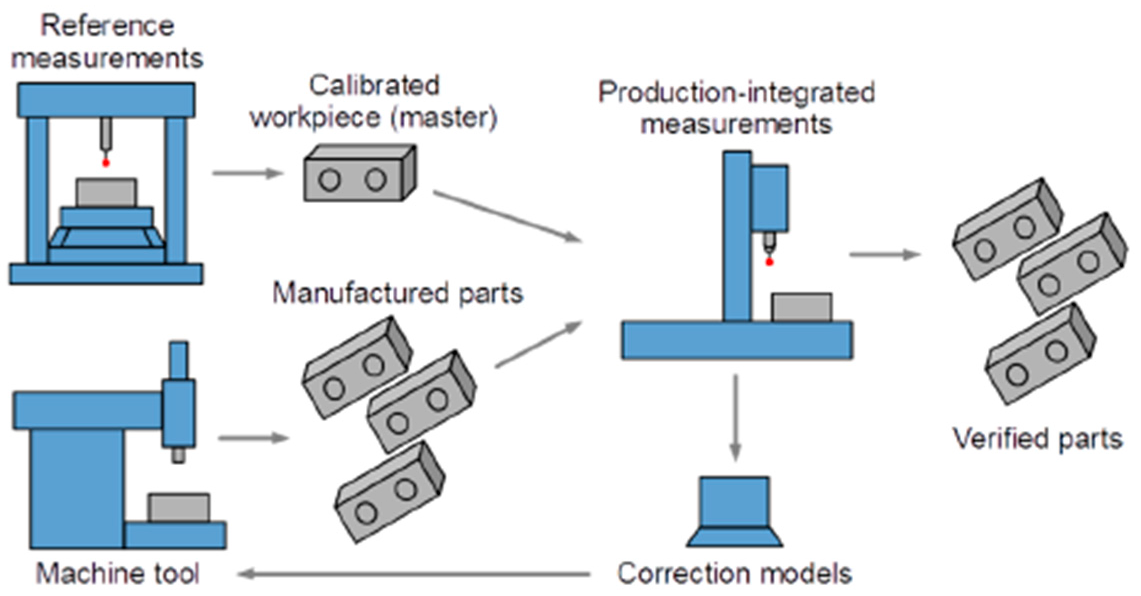
2.1.1. ISO 15530-3 Technical Specification

The ISO 15530-3 [46] technical specification is a substitution method that simplifies the uncertainty evaluation exercise through the similarity between the dimensions and shapes of the workpiece and one calibrated reference part. It is based on a statistical evaluation of the measurement errors observed concerning the calibrated value of the reference part. The user must perform a relevant number (>20) of measurements under various conditions that they might expect while measuring real workpieces. This approach appears to be straightforward from the viewpoint of the user and attempts to cover intrinsic and extrinsic uncertainty contributors. However, in practice, it is fraught with difficulties. Any divergence between the master and measured parts can lead to uncertainties. Because of the similarity requirement between the produced workpiece and the calibrated standard, this approach is very arduous and expensive for large-scale metrology, where the storage, maintenance and calibration of large components is a major expense. However, it is a reliable approach for serial production, usually for small- and medium-sized components because it is affordable to manufacture and calibrate a reference part for uncertainty assessment purposes. It is usually employed for medium-size component uncertainty assessments in CMMs or Machine Tools (MT). This approach determines four input quantities as explained below [46]:
ub: standard uncertainty associated with the systematic error of the measurement process;
up: standard uncertainty associated with the measurement procedure;
ucal: standard uncertainty associated with the uncertainty of the workpiece calibration;
uw: standard uncertainty associated with material and manufacturing variations.
U = k u p 2 + u c a l 2 + u w 2 + u b 2
Finally, the law of uncertainty propagation is applied to obtain the combined standard uncertainty according to GUM JCGM 100:2008 [13] and the result is multiplied by an appropriate coverage factor to yield an expanded uncertainty, according to Equation (1). Figure 1 shows the practical approach to this method.
According to the ISO 15530-3 technical specification, the standard uncertainty (up) is determined using Equation (2). The standard uncertainty associated with the systematic error is given by Equation (3). Moreover, if the measurement result is not corrected by the systematic error, the error fully contributes to the uncertainty budget; thus, (ub) = b. Thus,
y ¯ = 1 n i = 1 n y i         u p = 1 n 1 i = 1 n ( y i y ¯ ) 2
b = y ¯ x c a l
wherein:
y ¯ : mean value of the measurement results;
Y: measured value;
n: number of measurement results;
xcal: calibrated value of the calibrated workpiece.

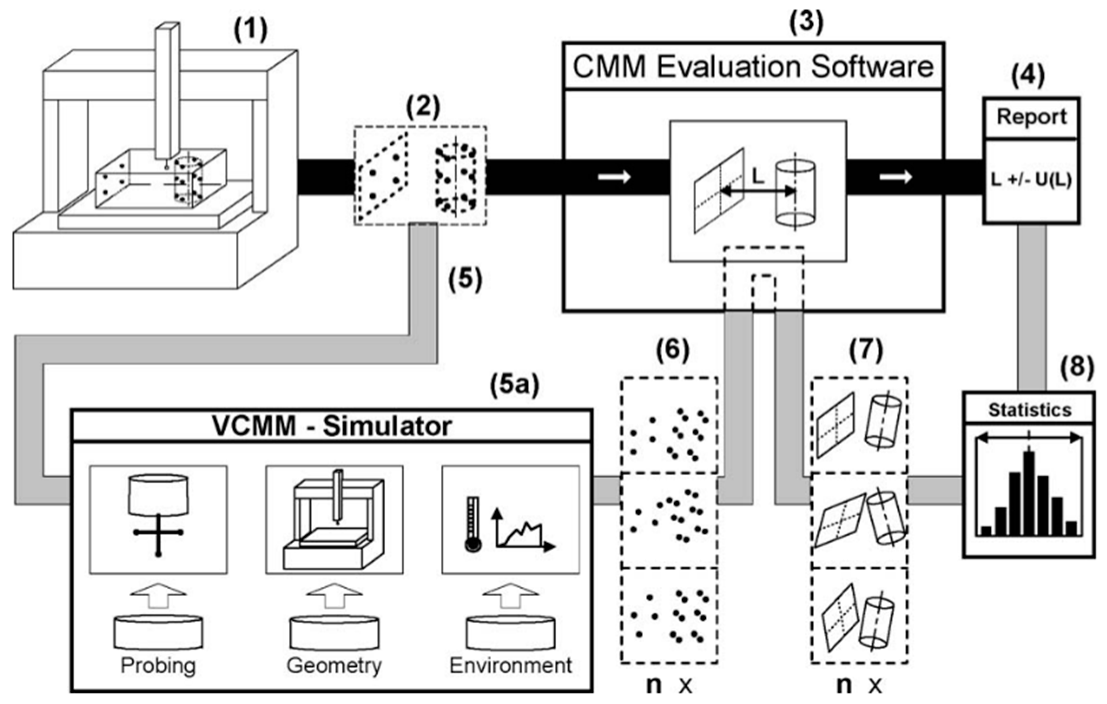
2.1.2. ISO 15530-4 Technical Specifications

The ISO 15530-4 [47] technical specification introduces a “task-specific uncertainty” assessment method based on computer simulation. Measuring instruments such as CMMs and 3D optical systems are multi-purpose instruments which means that potential measurement uncertainties vary with the task being performed, environment, operator, or chosen measurement methodologies. The “task-specific uncertainty” in coordinate measurement is the measurement uncertainty that results when a specific feature is measured using a specific inspection plan. The approach is similar to GUM but instead of using an analytical approach based on a complete closed-form mathematical model, it uses a simulation method (for example, the Monte Carlo method) run on a computer to estimate the uncertainty statement for a particular measurement task. This is even more complex than the GUM approach because an initial model of the measurement instrument and process is required to run the simulation. The simulation model or virtual instrument model generates a perturbed point that represents an estimate of what a particular measurement instrument would have reported when measuring that commanded point. This process is performed several times, running as many measurements as the simulation iterations (hundreds or thousands), which enables the creation of simulation results of the measurement uncertainty.
The current state-of-the-art shows that the ISO 15530-4 approach is already being applied to measuring instruments such as CMMs or laser trackers, while modelling of optical sensors is still being developed by the research community and therefore VCMM for optical sensors is not still commercially available. The popular name for the method applied to CMMs is the so-called Virtual Coordinate Measuring Machine (VCMM) [48], which performs a point-by-point simulation of measurements, emulating the measurement strategy, measuring conditions, and physical behaviour of the CMM with dominant uncertainty contributions disturbing the measurement [48,49,50]. For spherical measuring instruments such as laser trackers or laser scanners, a basic spherical error model is considered in combination with a Gaussian Probability Density Function (PDF) to apply the law of uncertainty propagation. Figure 2 shows the VCMM approach, where the thick black lines show the data flow for a normal CMM measurement, while the thick grey lines show the additional data flow that is employed to achieve a VCMM estimate. Wilhelm et al. [50] presented a description of the complete VCMM workflow, as shown in Figure 2.
The so-called Digital Metrology/Measurement Twin (D-MT) is the virtual representation of either a measurement instrument or the complete measurement procedure [51,52,53] and it is frequent to use a similar mathematical model to that developed within the ISO 15530-4 approach to run the simulation. Here, Artificial Intelligence (AI) algorithms such as machine learning, deep learning or neural networks are being researched for the development of those D-MT and uncertainty assessment tasks [54,55,56].

2.2. MBD-based Metrology

The MBD approach will allow meeting the challenge of converting dense data into meaningful information in a matter of seconds within the production line which will allow a quick decision-making process within the production environment. However, the current state of MBD industrial implementation shows that manufacturers have applied MBD to product definition for some time, whereas aerospace and defence customers have played the role of leaders with a slower adoption in other industries [22].
From the CAD suppliers’ point of view, MBD is seen as the cornerstone of creating a functioning digital thread. While the goal is to have a single source of truth for downstream operations in making a part, most CAD suppliers provide MBD in a proprietary format which means that interoperability between systems remains a challenge. Previously, a universal CAD format already exists, the ISO 10303 STEP format [57] with its accompanying AP 242 extension which includes 3D model data representation, geometric tolerance and PMI to enable global design and manufacturing collaboration [23]. However, several questions remain regarding the full definition of MBD. Standards such as ASME Y14.41 [58] and ISO 16792 [59] still exist to document how a model should be defined with annotations. These standards also help in understanding how to interpret the data within the model but the standards do not document the required amount of information that the model must contain [60].
From an MBD-based metrology point of view, MBD is allowing an automatic quality assurance workflow, allowing the automation of either the measurement program creation or the data evaluation process stages [24]. While the former is already available within the main CMM commercial software, the latter can be applied for any point cloud if the measurand MBD model and the MBD software are available. Model-based inspection has not been paid much attention to within the metrology community since the 1990s [61,62,63,64].
The MBD-based metrology process starts by creating a 3D CAD model with semantic PMI information that should be both human and machine-readable [65]. The 3D model with PMI shall contain all GD&T geometric information related to the component under measurement as well as the information related to the Bill of materials (BOM), Surface finish, weld symbols, manufacturing or measurement process plan data, metadata and notes, history of an engineering change order, legal/proprietary/export control notices and other definitive digital data [65].
The associativity between the CAD model and MBD is required to have a fully semantic smart model that allows automatic part programming and post-processing. The ability of downstream programs to read MBD models and create measurement programs is as important as creating CAD models with an attached semantic MBD. Thus, the CMM is virtually configured, and once the MBD file is imported and a set of rules is applied and matched to the configured CMM, a part program is automatically generated aided by these a priori digital approaches [24,66,67]. Typically, a second optimisation is performed to reduce the number of probe changes and minimise the CMM path length.
In the post-processing stage, the MBD concept allows fast point cloud analysis and evaluation of the measurement data. During the automatic evaluation process, the acquired point cloud is aligned to the CAD model, and an automatic segmentation process is performed using the available MBD data. At this stage, each measured point is associated with its corresponding geometric features. Then, the geometric features were adjusted using linear regression methods, rejecting possible outliers. Finally, the real relationships among the adjusted features were estimated (dimension, form error, relative positioning, etc.) through the fully automatic interpretation and evaluation of previously defined GD&Ts. Thus, the process of converting dense data into meaningful metrology-rich information is executed automatically in seconds.

2.3. The Methodology and Its Experimental Implementation

The following lines describe the experimental exercise performed on the dummy part to realise the practical implementation of the previously mentioned technological concepts (see Figure 3). In general terms, the suggested workflow is based on three main steps: (1) measurement of the dummy part, including the data acquisition process (×10 repetitions) and automatic data process strategy (MBD) (box 1); (2) reference measurement of the dummy part on a CMM according to the ISO 15530-4 technical specification (box 2), and (3) the task-specific (GD&T) uncertainty assessment process according to the ISO 15530-3 technical specification (box 3).
The three main steps of the methodology are explained next and linked to the uncertainty contributors that comprise the uncertainty budget presented in the third step.
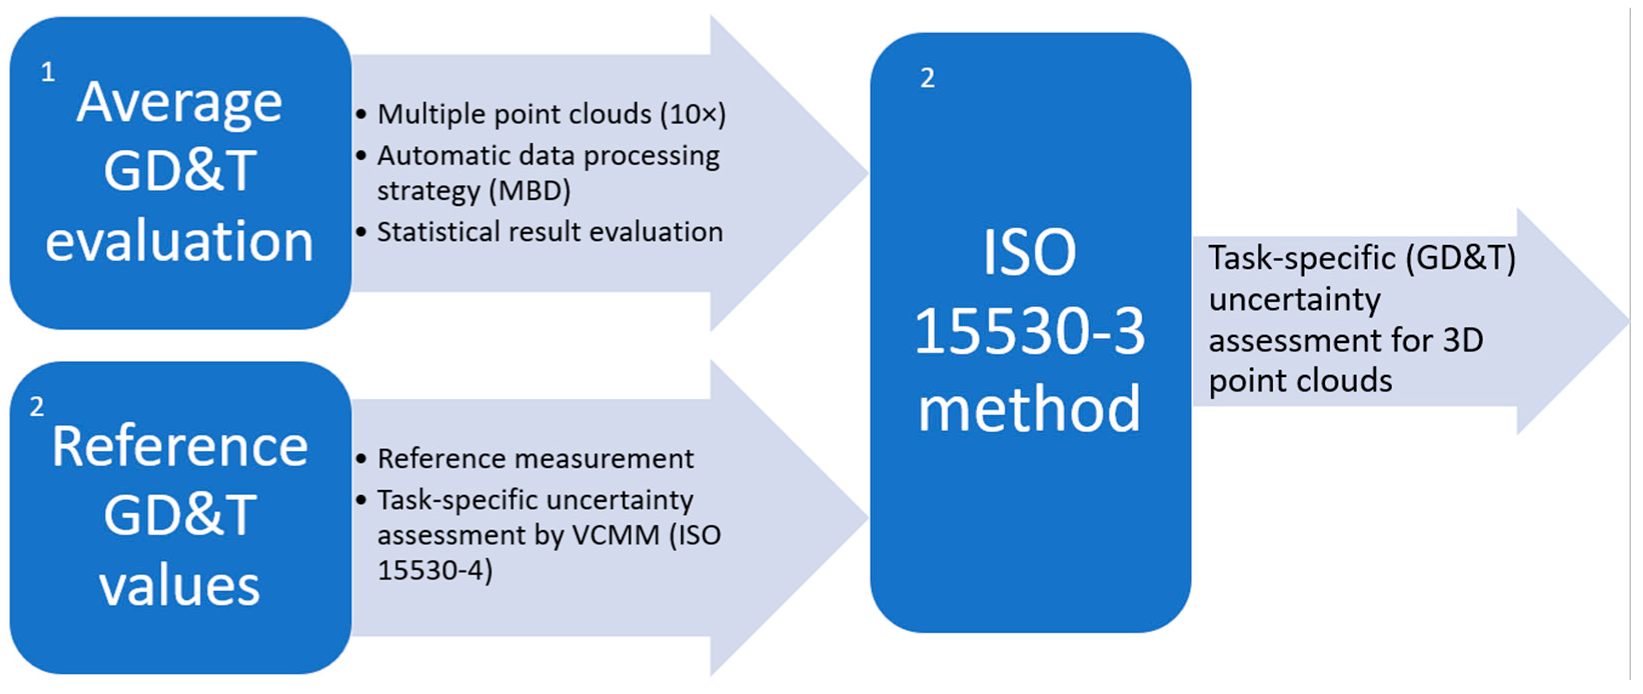
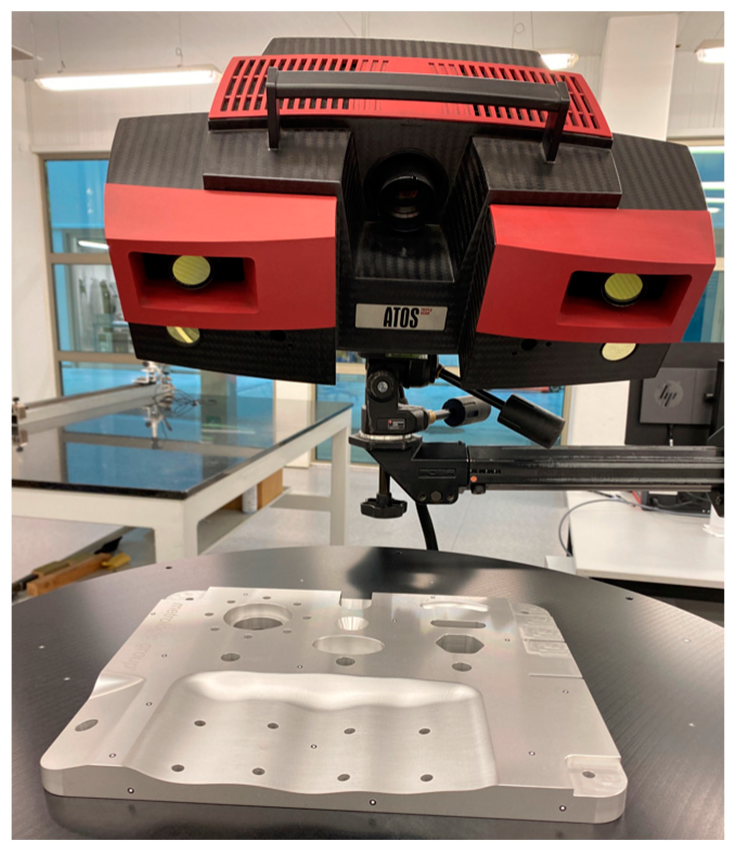
  • Measured GD&T evaluation: Automatic 3D point cloud measurement, evaluation, and statistical analysis of multiple GD&T results based on the MBD-based approach are performed. From these data, the standard uncertainty associated with the measurement process variability (up) is obtained.
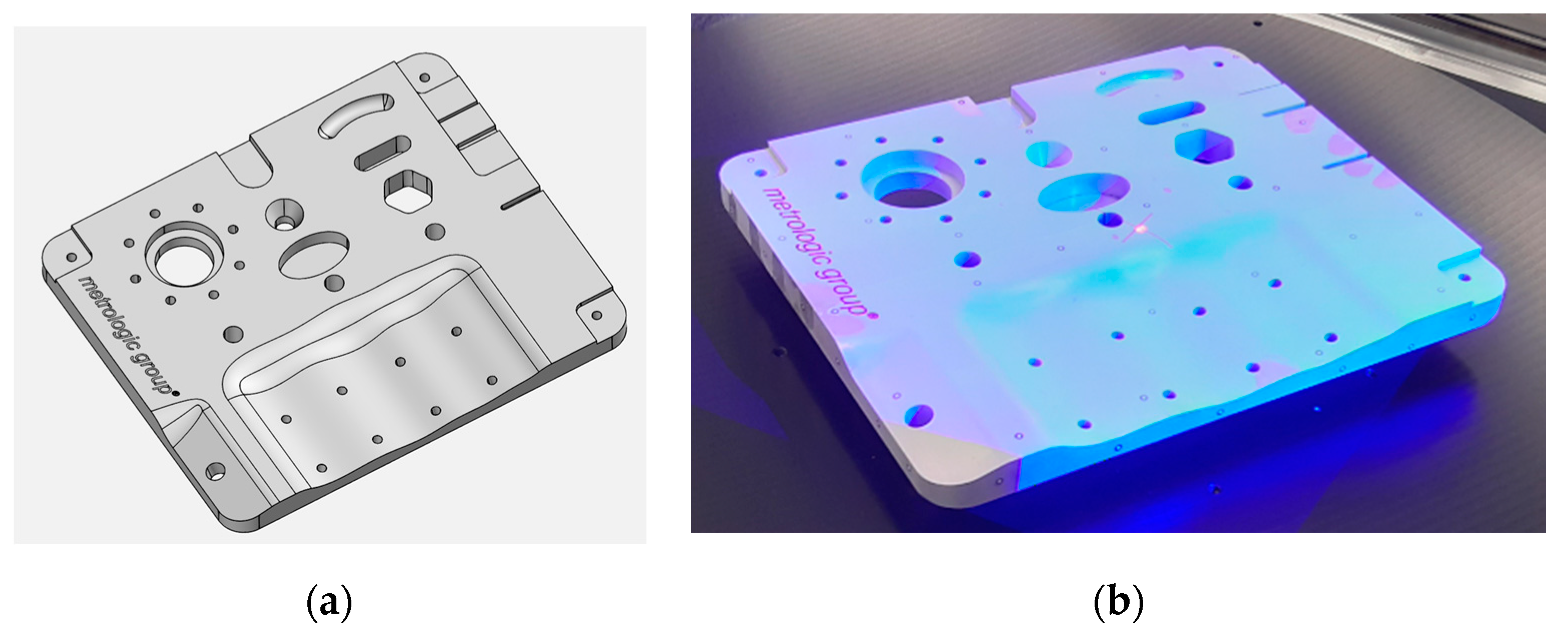
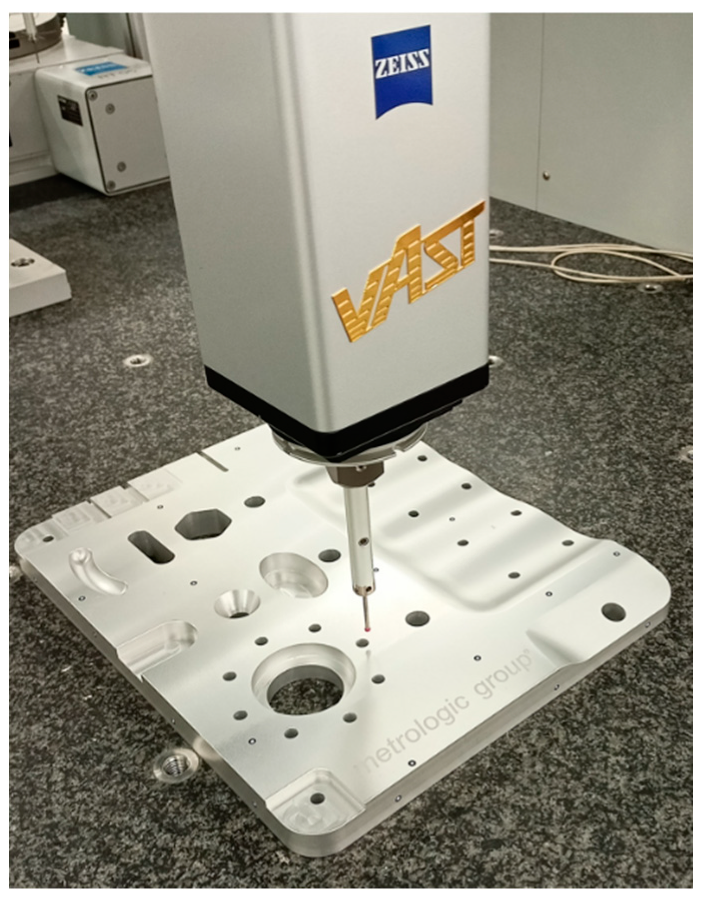
  • Reference GD&T values: The dummy part is calibrated in an MMC according to the ISO 15530-4 technical specification [47]. The ZEISS VCMM™ tool is used to assess the task-specific uncertainty value for every calibrated feature. From these data, the standard uncertainty associated with the uncertainty of the MMC calibration (ucal) is obtained.
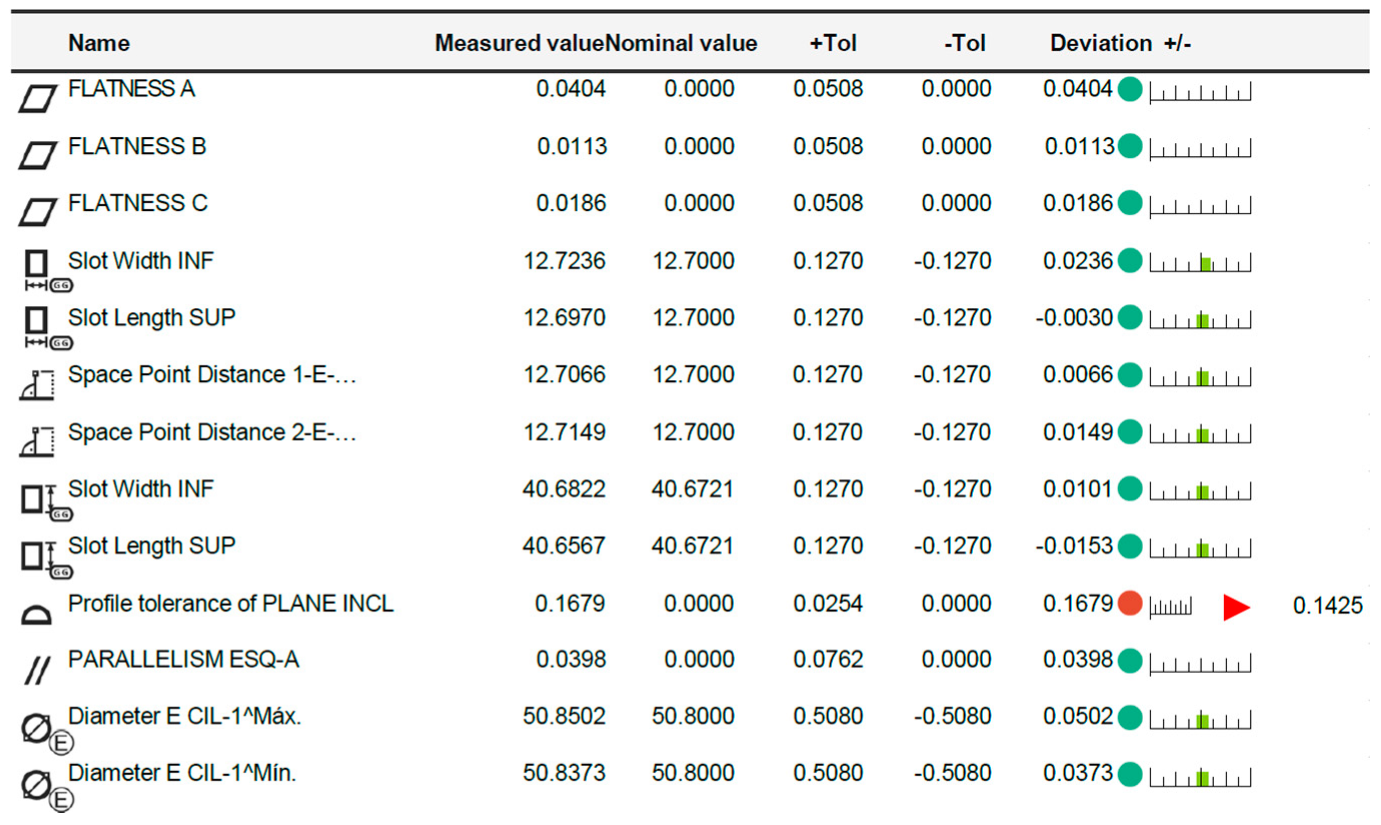
  • ISO 15530-3 method: The task-specific uncertainty assessment of every GD&T value obtained from the 3D point cloud measurement is performed according to the ISO 15530-3 technical specification [46]. From these data, the standard uncertainty associated with the systematic error of the measurement process is obtained (ub).
The experimental implementation of the suggested methodology is explained next point by point:

2.3.1. Measured GD&T Evaluation

A dense 3D point cloud data acquisition process is performed using a GOM ATOS III Triple Scan™ 3D optical system on a medium-sized geometric-type dummy part. The data acquisition process is fully automatic by combining an automatic rotary table with the manual triggering of the measuring instrument. Thus, any potential error source derived from external sources, such as the alignment process between partial scanning or operator influence, is avoided.
The experimental exercise is performed in a metrology laboratory at a temperature of 20 ± 1 °C. In this way, thermal stability during the data acquisition process is guaranteed; and therefore, the geometric variation of the dummy part caused by thermal drift is avoided. Figure 4 shows the dummy part employed during the experimental exercise.
The measurement instrument configuration is set at a working volume of 320 × 240 × 240 mm3 so that the measurement resolution was optimised for the specific dummy part under measurement. The automatic data acquisition process is realised by eight angular rotary table equidistant positions, where partial scans are performed and stitched together automatically to reconstruct the overall 3D point cloud. Thus, the entire measurement process is executed within 45 s, and a point cloud comprised of 1 million points is obtained.
The fiducial targets are attached to the rotary table and unequivocally identified in each partial scan. In this manner, the automatic partial point cloud registration problem is solved, and an automatic data merging process between partial scans is performed. Once the reconstructed 3D point cloud is obtained, it is converted into a mesh using the Delaunay triangulation method. In addition to the XYZ information of every point within the point cloud, this mesh also contains information related to the surface normal value for every point which makes the final MBD-based automatic point cloud segmentation process smarter and more robust.
Figure 5 depicts the measurement scenario, comprising a GOM ATOS III Triple Scan™ 3D optical system in combination with the automatic rotary table and the dummy part on it.
The batch of experiments comprises ten 3D point cloud measurement repetitions on the dummy part. Once they are completed, an automatic data-processing approach based on the MBD strategy is applied. Thus, the dense point cloud is automatically processed and converted into meaningful GD&T information.
The software employed at this point is GOM Inspect™ metrology software. It allows MBD-type post-processing of data which means that it can digitally establish a relationship between nominal GD&T information and geometric elements within the captured data. This workflow is aligned with the PMI concept and interpreted using the ISO 1101 standard [68]. A different option to run MBD-type post-processing is to define the MBD data within the CAD model by adding the GD&T information to the available CAD file (for example, a catpart file in SolidWorks). Once this nominal MBD data-based file is prepared, the automatic evaluation of every GD&T can be performed. The workflow is as follows.
  • Step 1: Point cloud-to-mesh data conversion: The measured point cloud is converted into a mesh format to make the following data management and processing steps more robust and precise. The mesh format estimates and adds the surface normal values to the point cloud format, enabling it to achieve higher accuracy results through posterior segmentation operations (step 3 below).
  • Step 2: The 3D mesh is aligned with the available CAD model, which is crucial to ensure the accuracy and robustness of the MBD-based data evaluation method because it determines the correct parameterisation within the point cloud segmentation method. Thus, accurate alignment is required to achieve reliable results. In this study, the best-fit alignment method is used as an accurate method (acceptance criteria below a few microns).
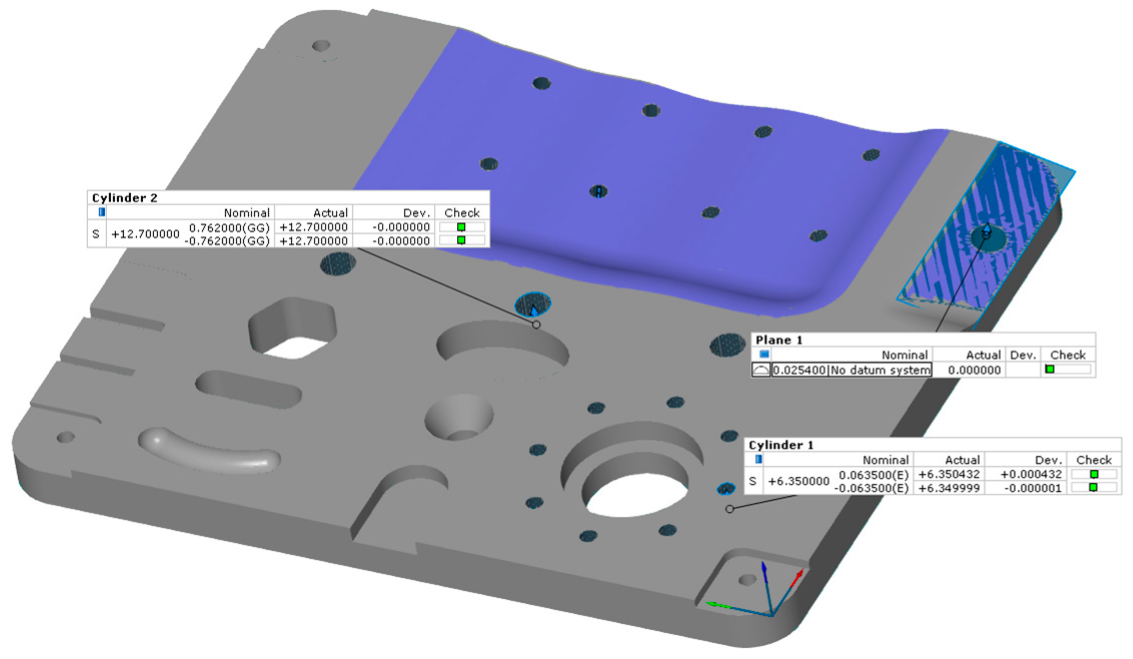
  • Step 3: Automatic geometric feature segmentation is performed, and the mesh is split into multiple point clouds corresponding to each geometric feature with the aid of CAD nominal feature information. In this step, the point coordinates, surface normal data (real and nominal values), and surface curvature parameters are employed to support the point cloud segmentation algorithms and reinforce their robustness.
  • Step 4: Real geometric feature adjustment process: At this point, the previously obtained geometric-specific point cloud segmentation data are fitted to the corresponding geometric features by linear regression methods, rejecting possible outliers. The elimination of noisy points is established using suitable filters that estimated the 3D distance of each point concerning the fitted geometric feature. If the point-to-element distance parameter is higher than the standard deviation value (2σ) of the input points during the geometric feature adjustment process, this input point is detected as a non-suitable point and consequently removed from the process.
  • Step 5: GD&T evaluation: Once the previous step is successfully performed, an automatic evaluation of every GD&T for the fitted features (measured values) is performed with the help of nominally defined annotations and relationships (ISO 1101 standard [68]). Because the software already knows the theoretical relationships among the geometric features and datum objects by the previously recognised annotations, it can estimate the real GD&T values.
Following this process, the standard uncertainty associated with the measurement process variability (up) is obtained for each feature. The ten available 3D point cloud measurement repetitions are statistically processed, and the uncertainty (up) is given by the standard deviation parameter according to the ISO 15530-3 technical specification. In addition, the average value is reported at this step for the evaluation of the systematic error (ub) value within the next step.
Figure 6 shows the experimental results for the dummy part of the GOM Inspect™ metrology software.

2.3.2. Reference GD&T Values

The aim is to calibrate the measured dummy part and obtain the reference values for each evaluated feature to realise the uncertainty budget according to the ISO 15530-3 technical specification [46]. Thus, the dummy part is measured in a ZEISS UPMC 850 CARAT CMM, in which the ZEISS VCMM™ tool is available for task-specific uncertainty assessment according to the ISO 15530-4 technical specification [47]. The ZEISS VCMM™ tool considers the mathematical model of the UPMC 850 CARAT CMM to perform the task-specific uncertainty assessment process through multiple iterations (×1000 repetitions). To feed the mathematical model running within the ZEISS VCMM™ tool, the error and influence factors, as well as their variability affecting the measurement accuracy, were previously characterised and introduced into the model. Figure 7 shows the dummy calibration process.
In this manner, a selection of the GD&T features to be considered within the experimental implementation is performed. The types of geometric elements and tolerances that were considered are explained next, according to the type of tolerance and the number of features measured.
  • Size: Cylinder diameter (20× divided into groups by diameter);
  • Form: Flatness–planes (3×) and complex surfaces (2×);
  • Location and orientation: Positioning and composed positioning of cylinders (divided into three groups).
The positioning tolerances are evaluated considering the coordinate system created by the three planes which define the ABC datums. In total, the task-specific uncertainty of the 52 GD&T features is evaluated. Figure 8 shows the task-specific uncertainty assessment exercise based on the ZEISS UPMC CARAT 850 CMM measurements.
From these data, the standard uncertainty associated with the uncertainty of the MMC calibration of the dummy part (ucal) is obtained.

2.3.3. Implementation of ISO 15530-3 Technical Specification

As previously stated, the uncertainty assessment method suggested in this article is based on the ISO 15530-3 technical specification application backed by the ISO 15530-4 technical specification, through which the task-specific uncertainty assessment for the calibrated values (ucal) is realised.
According to the ISO 15530-3 technical specification, the uncertainty of the systematic error b (ub) is assessed by the difference between the average value obtained during the measurement process variability (up) parameter assessment and the indicated value of the CMM. However, according to the GUM recommendation, the measurement results should be corrected by the amount of systematic effect. Thus, if the measurement result is not corrected by the systematic error, the error fully contributes to the uncertainty budget; thus, (ub) = b.
The uncertainty budget presented here comprises the uncertainty contributors ub, up and ucal, whereas uw is negligible because of the lack of variation between the calibrated and measured dummy. The same physical dummy part is used during the calibration and measurement processes.
Other potential uncertainty sources, such as the measuring system resolution or any divergence between the master and measured dummy parts, were discarded because of their negligible effect on the uncertainty budget.
Equation (4) shows the combined standard uncertainty, u, which is given by the quadrature sum of each uncertainty contributor. Equation (1) shows the expanded measurement uncertainty U determined with a coverage factor k = 2 for an approximated coverage probability of 95%.
u = u p 2 + u c a l 2 + u w 2 + u b 2
wherein:
uw: standard uncertainty associated with material and manufacturing variations. This was negligible in this case.
ucal: standard uncertainty associated with the uncertainty of the MMC calibration (task-specific uncertainty value of each GD&T estimated by ZEISS VCMM™)
ub: standard uncertainty associated with systematic errors in the measurement process. It was assessed by the difference between the average value obtained during the measurement process variability (up) parameter assessment and the indicated value of the CMM.
up: to the standard uncertainty associated with the measurement process variability. The standard deviation of the ten-3D point cloud measurement repetitions was considered for each GD&T.
k: confidence interval: defines an interval with a level of confidence of approximately 95% (k = 2) with a normal distribution
U: expanded uncertainty for each GD&T comprising all the uncertainty error sources and their propagation with a confidence interval of 95% (k = 2).
Other uncertainty sources, such as thermal effects, measuring process drift, or the interaction between the light and the part surface, have not been considered separately within the uncertainty budget, as it is assumed that they contribute to (up) the standard uncertainty associated with the measurement process variability.

3. Results

This section describes the results obtained during the experimental implementation of the proposed uncertainty assessment method. For the sake of understanding, the experimental results are presented in such a way that every uncertainty contributor can be explained in detail. First, the standard uncertainty results associated with the measurement process variability (up) are presented. Then, the standard uncertainty results associated with the uncertainty of the MMC calibration (ucal) are presented, along with the values indicated by the ZEISS CMM for each evaluated GD&T. Subsequently, the standard uncertainty results associated with the systematic error of the measurement process (ub) are presented. Finally, the uncertainty budget for the 3D point cloud task-specific measurement uncertainty assessment is presented, where the expanded measurement uncertainty U is obtained for each GD&T element.

3.1. Measurement Process Variability, up

Table 1 lists the results obtained for the (up) uncertainty contribution. The result comprises every uncertainty component that falls within the measurement process variability, such as the instrument repeatability itself, MBD data processing strategy, or any potential thermal drift, among other minor contributors. Table 1 also considers the obtained mean value for every measured GD&T for further (ub) uncertainty contributor assessment.
For every GD&T element, the highest measurement process variability (up) results were below 20 µm whereas the average standard deviation was less than 10 µm. These results demonstrate that the measurement process, from the data acquisition process and 3D point cloud reconstruction to the MBD-based data processing procedure, is within the micrometre accuracy.

3.2. Uncertainty of the MMC Calibration, ucal

Table 2 shows the results indicated by the CMM for every GD&T under study. Thus, it shows the reference result reported by the ZEISS UPMC CARAT CMM in addition to the task-specific uncertainty value (ucal) estimated using the ZEISS VCMM™ tool. In this way, the CMM measurement uncertainty for every measured GD&T is assessed, and thus, a task-specific uncertainty budget can be finally accomplished.
For every GD&T element, the highest CMM calibration uncertainty (ucal) values are up to 7 µm, whereas the average value is within 1 µm. These results demonstrate that (ucal) uncertainty values estimated by the ZEISS VCMM™ tool are consistent with the ZEISS UPMC CARAT CMM Maximum Permissible Error (MPE) specification (0.6 ± L/1000 in µm) although some specific and complex GD&T results are much worse due to the complexity of the evaluation. At this point, the authors made a special effort to understand these results. Thus, a second batch of calibration measurements is performed on the CMM, but the results did not vary significantly, indicating that the obtained results are properly evaluated by the VCMM tool. At this point, the author hypothesises that the source of these results possibly arises from the acquired raw data and employed measuring strategies.

3.3. Uncertainty of the Systematic Error, ub

Table 3 lists the standard uncertainty associated with the systematic error of the measurement process (ub). It is assessed by the difference between the average value obtained during the measurement process variability (up) parameter assessment and the indicated value of the CMM during the dummy calibration process.
The systematic error (ub) results show a wide range of values. While some results are within a few microns, others are between 0.1 ÷ 0.2 mm (absolute values). The average value for all the GD/Ts is within 50 µm. At this point, it is not easy to understand and justify the wide range of values obtained for the (ub) uncertainty contributor, but it is possibly explained by the higher point quantity and more homogeneous point distribution of the measurements obtained by the 3D optical system compared to the CMM measurements.
At this point, it makes sense to highlight, as in the introduction, that 3D optical systems are a relatively new technology, and their measurement error sources are still being researched. They are affected by many potential uncertainty error sources, such as the light condition, measurement and material properties, system orientation and resolution, ambient temperature, measurement volume, and chromatic effects, which complicate the measurement uncertainty assessment process to a large extent. Nonetheless, as stated previously within the introduction, this study aims to present a point cloud measurement task-specific uncertainty assessment method and its experimental implementation. The obtained expanded measurement uncertainty results are not as important as those of the method presented by the authors.

3.4. Expanded Measurement Uncertainty, U

Table 4 summarises the uncertainty budget for the experimental implementation of the proposed method. It shows the three major uncertainty contributors and the expanded measurement uncertainty result U obtained from Equation (2). It should be noted that the measurement results are not corrected by the amount of systematic effects; therefore, the (ub) contributor is considered within the final uncertainty budget.
The uncertainty budget shows that the systematic error contributor (ub) is the main contributor to the final result. While the CMM calibration uncertainty (ucal) contributor average value falls within 1 µm and the measurement process variability (up) average value is less than 10 µm, the systematic error (ub) average value falls within 50 µm. Thus, the CMM calibration uncertainty (ucal) becomes negligible, which means that the main contributors to the task-specific uncertainty budget are the measurement process variability (up) and systematic error contributor (ub). As stated before, the measurement result is not corrected by the number of systematic effects which, in this case, are the main uncertainty sources for the measurement with 3D optical systems.

4. Discussion

This article presents a methodology for task-specific uncertainty assessment of 3D point clouds based on ISO 15530-3 and ISO 15530-4 technical specifications and the application of MBD-based post-processing for the automatic processing of point clouds.
It presents an uncertainty budget comprising three main uncertainty contributors according to ISO 15530-3 technical specifications. The three major uncertainty contributors are (a) measurement process variability (up), (b) uncertainty of the CMM calibration (ucal), and (c) uncertainty of the systematic error (ub). The uncertainty associated with the material and manufacturing variations, uw, is considered negligible.
The methodology presented here suggests an automatic 3D point cloud measurement and evaluation process, where the statistical analysis of multiple GD&T results is based on an MBD-based approach. From these data, the standard uncertainty associated with the measurement process variability (up) is automatically obtained. The standard uncertainty associated with the uncertainty of the MMC calibration (ucal) is obtained using the ZEISS VCMM™ tool, which assesses a task-specific uncertainty value for every calibrated feature according to ISO 15530-4 technical specifications. Finally, the standard uncertainty associated with the systematic error of the measurement process (ub) is obtained from the difference between the average value obtained during the measurement process variability and the indicated value of the CMM during the dummy part calibration process.
The experimental results show that the systematic error contribution (ub) is the main contributor to the uncertainty budget. While the CMM calibration uncertainty (ucal) contributor average value falls within 1 µm and the measurement process variability (up) average value is less than 10 µm, the systematic error (ub) average value falls within 50 µm. Thus, the CMM calibration uncertainty (ucal) becomes negligible, which means that the main contributors to the task-specific uncertainty budget are the measurement process variability (up) and systematic error contributor (ub).
In summary, a reliable task-specific uncertainty method is developed and successfully implemented. In the absence of numerical simulation models for optical systems, which are not currently available, this methodology allows for the establishment of an uncertainty budget to understand the order of magnitude of the measurement uncertainty of 3D optical systems.
One of the limitations of the presented methodology is scalability to large components, where CMM reference values are hardly achievable by calibrating the existing dummy part. Hence, this methodology could be applied to the scanning of geometric parts approximately up to 1.5 ÷ 2 m and manufactured in serial production, since this is the most common working range for many applications such as automotive or the manufacturing of metallic components.
Finally, concerning the MBD-based metrology data processing strategy, the experimental approach presented in this article demonstrates that the nominal PMI-based method is appropriate for converting dense point cloud data into desired dimensional metrology results (GD&Ts). It enables an effective data processing approach in terms of accuracy, speed, and robustness which in turn allows a fully automatic geometric point cloud evaluation process to avoid errors during the result interpretation and procurement processes.
Further work will focus on analysing the deviations between the results of the 3D optical system and the reference values obtained with CMM. Because these measuring technologies differ considerably in terms of accuracy, number, and point distribution, deviations will remain, but they would help to understand the complex intrinsic performance of 3D scanning systems. These preliminary results and accuracy assessment methods could support the development of AI-based numerical methods that describe the optical performance of 3D scanners.
Regarding the VCMM approach, this study demonstrates that simulation-based metrology should be applied for task-specific assessment of reference values. This shows the applicability of digital twins within the metrology field in terms of a priori uncertainty estimation and a posteriori uncertainty assessment. Thus, the measurement procedure can be optimised based on those digital twin simulation results. Another interesting future research line within the VCMM field is to employ the simulation-based metrology concept to create nominal dense reference point clouds with known uncertainty values. Therefore, fast uncertainty assessment procedures should be developed for dense point cloud data.

Author Contributions

U.M. contributed to the state-of-the-art and uncertainty budget realisation. G.K. contributed to the development of the methodology for uncertainty budget realisation. B.A. contributed to the information related to technical specifications and uncertainty budget realisation. S.G. contributed to experimental realisation. All authors have read and agreed to the published version of the manuscript.

Funding

This work was carried out under a research program called ELKARTEK 2021–2022. The project called PRECITEK (grant number KK-2021/00039) is supported by The Basque Business Development Agency.

Informed Consent Statement

Not applicable.

Conflicts of Interest

The authors declare no conflict of interest.

References

  1. Barbosa, C.R.H.; Sousa, M.C.; Almeida, M.F.L.; Calili, R.F. Smart Manufacturing and Digitalization of Metrology: A Systematic Literature Review and a Research Agenda. Sensors 2022, 22, 6114. [Google Scholar] [CrossRef]
  2. Imkamp, D.; Berthold, J.; Heizmann, M.; Kniel, K.; Peterek, M.; Schmitt, R.; Seidler, J.; Sommer, K.-D. Challenges and trends in manufacturing measurement technology–the “Industrie 4.0” concept. J. Sens. Sens. Syst. 2016, 83, 325–335. [Google Scholar] [CrossRef]
  3. Lazzari, A.; Pou, J.-M.; Dubois, C.; Leblond, L. Smart metrology: The importance of metrology of decisions in the big data era. IEEE Instrum. Meas. Mag. 2017, 20, 22–29. [Google Scholar] [CrossRef]
  4. Peter de Groot. Metrology–Fuelling Industry 4.0 Data Driven Production. Metrology News. 28 June 2021. Available online: https://metrology.news/metrology-fuelling-industry-4-0-data-driven-production/ (accessed on 21 July 2022).
  5. Carmignato, S.; De Chiffre, L.; Bosse, H.; Leach, R.K.; Balsamo, A.; Estler, W.T. Dimensional artefacts to achieve metrological traceability in advanced manufacturing. CIRP Ann. 2020, 69, 693–716. [Google Scholar] [CrossRef]
  6. Gohari, H.; Berry, C.; Barari, A. A Digital Twin for Integrated Inspection System in Digital Manufacturing. IFAC-PapersOnLine 2019, 52, 182–187. [Google Scholar] [CrossRef]
  7. Kunzmann, H.; Pfeifer, T.; Schmitt, R.; Schwenke, H.; Weckenmann, A. Productive metrology-adding value to manufacture. CIRP Ann.-Manuf. Technol. 2005, 54, 155–168. [Google Scholar] [CrossRef]
  8. Rubel, R.I.; Ali, M.H.; Akram, M.W. Role of in-process metrology in industry 4.0 smart manufacturing. Acad. J. Manuf. Eng. 2022, 20, 1–7. [Google Scholar]
  9. Yandayan, T.; Burdekin, M. In-process dimensional measurement and control of workpiece accuracy. Int. J. Mach. Tools Manuf. 1997, 37, 1423–1439. [Google Scholar] [CrossRef]
  10. Kuş, A. Implementation of 3D optical scanning technology for automotive applications. Sensors 2009, 9, 1967–1979. [Google Scholar] [CrossRef]
  11. Dury, M.R.; Woodward, S.D.; Brown, S.B.; McCarthy, M.B. Characterising 3D optical scanner measurement performance for precision engineering. In Proceedings of the ASPE 2016 Annual Meeting, Portland, OR, USA, 23–28 October 2016; pp. 167–172. [Google Scholar]
  12. Joint Committee for Guides in Metrology (JCGM). International Vocabulary of Metrology, 4th ed. Committee Draft. 11 January 2021.
  13. Joint Committee for Guides in Metrology (JCGM). JCGM 100:2008 GUM 1995 with Minor Corrections—Evaluation of Measurement Data—Guide to the Expression of Uncertainty in Measurement. September 2008. Available online: https://www.iso.org/sites/JCGM/GUM/JCGM100/C045315e-html/C045315e.html?csnumber=50461 (accessed on 21 July 2022).
  14. Dury, M.R.; Brown, S.B.; McCarthy, M.B.; Woodward, S.D. 3D optical scanner dimensional verification facility at the NPL’s “national FreeForm centre”. In Proceedings of the Laser Metrology and Machine Performance 11th International Conference and Exhibition on Laser Metrology, Machine Tool, C Robot Performance, LAMDAMAP 2015, Huddersfield, UK, 17–18 March 2015; pp. 187–197. [Google Scholar]
  15. Dury, M.; Brown, S.; McCarthy, M.; Woodward, S. Blowing hot and cold: Temperature sensitivities of 3D optical scanners. In Proceedings of the 15th International Conference of the European Society for Precision Engineering and Nanotechnology, EUSPEN 2015, Leuven, Belgium, 1–5 June 2015; pp. 161–162. [Google Scholar]
  16. Dury, M.; Woodward, S.; Brown, S.; Mccarthy, M. Assessing fringe projector volumetric error sources using the NPL tetrahedral artefact. In Proceedings of the 16th International Conference of the European Society for Precision Engineering and Nanotechnology, EUSPEN 2016, Nottingham, UK, 30 May–3 June 2016; pp. 1–3. [Google Scholar]
  17. Verein Deutscher Ingenieure (VDI). VDI/VDE 2634 Part 2: Optical 3-D measuring systems-Optical systems based on area scanning. Engl. VDI/VDE-Gesellschaft Mess- und Automatisierungstechnik. 2012, Düsseldorf. Available online: https://standards.globalspec.com/std/9914533/vdi-vde-2634-blatt-2 (accessed on 21 July 2022).
  18. Verein Deutscher Ingenieure (VDI). VDI 2634 Part 3: Optical 3D-measuring systems (Multiple view systems based on area scanning). Engl. VDI/VDE-Gesellschaft Mess- und Automatisierungstechnik 2008, Düsseldorf. Available online: https://standards.globalspec.com/std/9914423/vdi-vde-2634-blatt-3 (accessed on 21 July 2022).
  19. Digital Metrology Standards Consortium (ANSI). Quality Information Framework (QIF)—An Integrated Model for Manufacturing Quality Information. Engl. VDI/VDE-Gesellschaft Mess- und Automatisierungstechnik 2020, Düsseldorf. Available online: https://qifstandards.org/ (accessed on 21 July 2022).
  20. Goher, K.; Shehab, E.; Al-Ashaab, A. Model-Based Definition and Enterprise: State-of-the-art and future trends. Proc. Inst. Mech. Eng. Part B J. Eng. Manuf. 2020, 235, 2288–2299. [Google Scholar] [CrossRef]
  21. Ram, P.S.; Lawrence, K.D. Implementation of Quality Information Framework (QIF): Towards Automatic Generation of Inspection Plan from Model-Based Definition (MBD) of Parts; 29 October 2020; Springer: Singapore, 2020. [Google Scholar] [CrossRef]
  22. Ruemler, S.P.; Zimmerman, K.E.; Hartman, N.W.; Hedberg, T.; Feeney, A.B. Promoting model-based definition to establish a complete product definition. In Proceedings of the ASME 2016 11th International Manufacturing Science and Engineering Conference, MSEC 2016, Blacksburg, VA, USA, 27 June–1 July 2016; p. 2. [Google Scholar] [CrossRef]
  23. Lu, Y.; Xu, X.; Wang, L. Smart manufacturing process and system automation—A critical review of the standards and envisioned scenarios. J. Manuf. Syst. 2020, 56, 312–325. [Google Scholar] [CrossRef]
  24. Bruce, M. Reduce Cost, Increase Speed with Model-Based Definition. SME Media 2020. 2020. Available online: https://www.sme.org/technologies/articles/2020/december/reduce-cost-increase-speed-with-model-based-definition/?ite=2522&ito=2433&itq=e7e28286-9020-4706-8ec4-21d7883bf037&itx%5Bidio%5D=1144843 (accessed on 21 July 2022).
  25. Heysiattalab, S.; Morse, E.P. From STEP to QIF: Product and Manufacturing Information. In Proceedings of the 31st ASPE Annunal Meeting, 2016, Portland, OR, USA, 23–28 October 2016. [Google Scholar] [CrossRef]
  26. Corallo, A.; Del Vecchio, V.; Lezzi, M.; Luperto, A. Model-Based Enterprise Approach in the Product Lifecycle Management: State-of-the-Art and Future Research Directions. Sustainability 2022, 14, 1370. [Google Scholar] [CrossRef]
  27. Shehab, E.; Schuler, M.; Bamforth, P.; Goher, K. Model-Based Enterprise Framework for Aerospace Manufacturing Engineering. Adv. Transdiscipl. Eng. 2019, 9, 207–212. [Google Scholar] [CrossRef]
  28. Frechette, S.P. Model Based Enterprise for Manufacturing. In Proceedings of the 44th CIRP International Conference on Manufacturing Systems, Madison WI, USA, 1–3 June 2011. [Google Scholar]
  29. Ding, L.; Dai, S.; Mu, P. Point cloud measurements-uncertainty calculation on spatial-feature based registration. Sens. Rev. 2019, 39, 129–136. [Google Scholar] [CrossRef]
  30. Senin, N.; Catalucci, S.; Moretti, M.; Leach, R.K. Statistical point cloud model to investigate measurement uncertainty in coordinate metrology. Precis. Eng. 2021, 70, 44–62. [Google Scholar] [CrossRef]
  31. Yang, Y.; Jin, Y.J.; Price, M.P.; Abdelal, G.; Colm, H.; Maropoulos, P. Investigation of point cloud registration uncertainty for gap measurement of aircraft wing assembly. In Proceedings of the 2021 IEEE 8th International Workshop on Metrology for AeroSpace (MetroAeroSpace), Virtual Conference, Italy, 23–25 June 2021. [Google Scholar]
  32. Zhang, K.; Bi, W.; Fu, X. A New Method of Point-Clouds Accurate Measurement and Reconstruction. Int. J. Database Theory Appl. 2014, 7, 81–94. [Google Scholar] [CrossRef]
  33. Forbes, A. Uncertainties associated with position, size and shape for point cloud data. J. Phys. Conf. Ser. 2018, 1065, 142023. [Google Scholar] [CrossRef]
  34. Mohammadikaji, M.; Bergmann, S.; Irgenfried, S.; Beyerer, J.; Dachsbacher, C.; Worn, H. A framework for uncertainty propagation in 3D shape measurement using laser triangulation. In Proceedings of the 2016 IEEE International Instrumentation and Measurement Technology Conference Proceedings, Taipei, China, 23–26 May 2016. [Google Scholar] [CrossRef]
  35. Zhao, Y.; Cheng, Y.; Xu, Q. Uncertainty Modeling and Evaluation of Contour Measurement by Structured Light Scanner. Meas. Sci. Technol. 2022, 33, 095018. [Google Scholar] [CrossRef]
  36. Mahmud, M.; Joannic, D.; Roy, M.; Isheil, A.; Fontaine, J.-F. 3D part inspection path planning of a laser scanner with control on the uncertainty. Comput. Aided Des. 2011, 43, 345–355. [Google Scholar] [CrossRef]
  37. Feng, H.-Y.; Liu, Y.; Xi, F. Analysis of digitizing errors of a laser scanning system. Precis. Eng. 2001, 25, 185–191. [Google Scholar] [CrossRef]
  38. Xi, F.; Liu, Y.; Feng, H.-Y. Error compensation for three-dimensional line laser scanning data. Int. J. Adv. Manuf. Technol. 2001, 18, 211–216. [Google Scholar] [CrossRef]
  39. Dupuis, J.; Kuhlmann, H. High-precision surface inspection: Uncertainty evaluation within an accuracy range of 15μm with triangulation-based laser line scanners. J. Appl. Geod. 2014, 8, 109–118. [Google Scholar] [CrossRef]
  40. Mendricky, R. Determination of measurement accuracy of optical 3D scanners. MM Sci. J. 2016, 2016, 1565–1572. [Google Scholar] [CrossRef]
  41. Mendricky, R. Analysis of measurement accuracy of contactless 3D optical scanners. MM Sci. J. 2015, 2015, 711–716. [Google Scholar] [CrossRef]
  42. Mendricky, R. Aspects affecting accuracy of optical 3d digitization. MM Sci. J. 2018, 2018, 2267–2275. [Google Scholar] [CrossRef]
  43. Acko, B.; Klobucar, R. Metrological Approach for Testing Performance of Optical 3D Measurements Systems; Springer International Publishing: Berlin/Heidelberg, Germany, 2019. [Google Scholar] [CrossRef]
  44. Guidi, G.; Russo, M.; Magrassi, G.; Bordegoni, M. Performance evaluation of triangulation based range sensors. Sensors 2010, 10, 7192–7215. [Google Scholar] [CrossRef]
  45. Van Gestel, N.; Cuypers, S.; Bleys, P.; Kruth, J.-P. A performance evaluation test for laser line scanners on CMMs. Opt. Lasers Eng. 2009, 47, 336–342. [Google Scholar] [CrossRef]
  46. ISO/TS 15530-3:2004; Geometrical Product Specifications (GPS)—Coordinate Measuring Machines (CMM): Technique for Determining the Uncertainty of Measurement—Part 3: Use of Calibrated Workpieces or Standards. ISO: Geneva, Switzerland, 2004. Available online: https://www.iso.org/standard/38695.html (accessed on 21 July 2022).
  47. ISO/TS 15530-4:2008; Geometrical Product Specifications (GPS)—Coordinate Measuring Machines (CMM): Technique for Determining the Uncertainty of Measurement—Part 4: Evaluating Task-Specific Measurement Uncertainty Using Simulation. ISO: Geneva, Switzerland, 2008. Available online: https://www.iso.org/standard/38696.html (accessed on 21 July 2022).
  48. Heiβelmann, D.; Franke, M.; Rost, K.; Wendt, K.; Kistner, T.; Schwehn, C. Determination of measurement uncertainty by Monte Carlo simulation. In Advanced Mathematical and Computational Tools in Metrology and Testing XI; Series on Advances in Mathematics for Applied Sciences; World Scientific Publishing: Singapore, 2018; Volume 89, pp. 192–202. [Google Scholar] [CrossRef]
  49. Trenk, M.; Franke, M.; Schwenke, H.; KG, F. The “Virtual CMM” a software tool for uncertainty evaluation–practical application in an accredited calibration lab. Proc. ASPE Uncertain. Anal. Meas. Des. 2004, 6, 68–75. [Google Scholar]
  50. Wilhelm, R.; Hocken, R.; Schwenke, H. Task specific uncertainty in coordinate measurement. CIRP Ann.-Manuf. Technol. 2001, 50, 553–563. [Google Scholar] [CrossRef]
  51. Vlaeyen, M.; Haitjema, H.; Dewulf, W. Digital twin of an optical measurement system. Sensors 2021, 21, 6638. [Google Scholar] [CrossRef]
  52. Stojadinovic, S.M.; Zivanovic, S.; Slavkovic, N.; Durakbasa, N.M. Digital measurement twin for CMM inspection based on step-NC. Int. J. Comput. Integr. Manuf. 2021, 34, 1327–1347. [Google Scholar] [CrossRef]
  53. Ríos, J.; Staudter, G.; Weber, M.; Anderl, R. Enabling the digital twin: A review of the modelling of measurement uncertainty on data transfer standards and its relationship with data from tests. Int. J. Prod. Lifecycle Manag. 2020, 12, 226–249. [Google Scholar] [CrossRef]
  54. Zuo, C.; Qian, J.; Feng, S.; Yin, W.; Li, Y.; Fan, P.; Han, J.; Qian, K.; Chen, Q. Deep learning in optical metrology: A review. Light Sci. Appl. 2022, 11, 39. [Google Scholar] [CrossRef]
  55. Vallejo, M.; de la Espriella, C.; Gómez-Santamaría, J.A.; Ramírez-Barrera, A.F.; Delgado-Trejos, E. Soft metrology based on machine learning: A review. Meas. Sci. Technol. 2019, 31, 032001. [Google Scholar] [CrossRef]
  56. Choi, J.E.; Hong, S.J. Machine learning-based virtual metrology on film thickness in amorphous carbon layer deposition process. Meas. Sens. 2021, 16, 100046. [Google Scholar] [CrossRef]
  57. ISO 10303-242; Industrial Automation Systems and Integration-Product Data Representation and Exchange-Part 242: Application Protocol: Managed Model-Based 3D Engineering. ISO: Geneva, Switzerland, 2014. Available online: https://www.iso.org/standard/57620.html (accessed on 21 July 2022).
  58. ASME Y14.41-2012; Digital Product Definition Data Practices. 2012. An American National Standard. The American Society of Mechanical Engineers: Fairfield, NJ, USA, 2012. Available online: http://www.asme.org (accessed on 21 July 2022).
  59. ISO 16792; Technical Product Documentation–Digital Product Definition Data Practices. ISO: Geneva, Switzerland, 2006. Available online: https://www.iso.org/standard/31065.html (accessed on 21 July 2022).
  60. Camba, J.D.; Contero, M. Assessing the impact of geometric design intent annotations on parametric model alteration activities. Comput. Ind. 2015, 71, 35–45. [Google Scholar] [CrossRef] [Green Version]
  61. Nyffenegger, F.; Ríos, J.; Rivest, L.; Bouras, A. (Eds.) Proceedings of the 17th IFIP WG 5.1 International Conference, PLM 2020, Rapperswil, Switzerland, 5–8 July 2020; Springer: Berlin/Heidelberg, Germany, 2020; p. 594. [Google Scholar] [CrossRef]
  62. Liu, R.; Duan, G.-J.; Liu, J. A framework for model-based integrated inspection. Int. J. Adv. Manuf. Technol. 2019, 103, 3643–3665. [Google Scholar] [CrossRef]
  63. Albuquerque, V.A.; Liou, F.W.; Mitchell, O.R. Inspection point placement and path planning algorithms for automatic CMM inspection. Int. J. Comput. Integr. Manuf. 2000, 13, 107–120. [Google Scholar] [CrossRef]
  64. Ainsworth, I.; Ristic, M.; Brujic, D. CAD-based measurement path planning for free-form shapes using contact probes. Int. J. Adv. Manuf. Technol. 2000, 16, 23–31. [Google Scholar] [CrossRef]
  65. Nguyen, J. MBD (Model-Based Definition). 8 February 2021. Available online: https://www.capvidia.com/blog/mbd-model-based-definition-in-the-21st-century (accessed on 21 July 2022).
  66. Jamshidi, J.; Maropoulos, P.G. Design of an Information System for Metrology Contents. In Proceedings of the 6th CIRP-Sponsored International Conference on Digital Enterprise Technology, HongKong, China, 14–16 December 2009; Volume 18, pp. 1701–1719. [Google Scholar] [CrossRef] [Green Version]
  67. Steck, R. Model-Based Product Definition Links Design and Metrology. Metrology News, 14 February 2022. Available online: https://metrology.news/model-based-product-definition-links-design-and-metrology/(accessed on 21 July 2022).
  68. ISO 1101:2017; Geometrical Product Specifications (GPS)—Geometrical Tolerancing—Tolerances of Form, Orientation, Location and Run-Out. ISO: Geneva, Switzerland, 2017. Available online: https://www.iso.org/standard/66777.html (accessed on 21 July 2022).
Figure 1. A practical approach to the ISO 15530-3 [5].
Metrology 02 00024 g001
Figure 2. The VCMM approach for coordinate measuring machines [50].
Metrology 02 00024 g002
Figure 3. The point cloud measurement uncertainty assessment workflow.
Metrology 02 00024 g003
Figure 4. The medium-size dummy part from Metrologic™ is shown: (a) the CAD model and (b) the physical part placed on the rotary table.
Metrology 02 00024 g004
Figure 5. Automatic measurement data acquisition process set-up.
Metrology 02 00024 g005
Figure 6. GD&T evaluation (real and nominal values) and representation on the CAD model.
Metrology 02 00024 g006
Figure 7. Dummy part calibration on the ZEISS UPMC 850 CARAT CMM.
Metrology 02 00024 g007
Figure 8. Task-specific uncertainty assessment based on the ZEISS CMM measurement and the ZEISS VCMM™ simulation. Example of measurement report including the VCMM outputs.
Metrology 02 00024 g008
Table 1. (up) uncertainty contributor assessment according to ISO 15530-3 technical specification.
Element IDQuantity of Evaluated FeaturesEvaluated PropertieATOS Triple Scan (Mean Values in mm)up_ Standard Deviation (mm)
Plane (ref. A)1Flatness0.0850.0090
Cylinder (E min)1Diameter 12.6640.0090
Cylinder (E max)1Diameter 12.7520.0090
Plane (ref. B)1Flatness0.1000.0080
Plane (ref. C)1Flatness0.2160.0080
Cylinder11Positioning0.0440.0030
Cylinder group 1. Min1Diameter50.7920.0070
Cylinder group 1. Max1Diameter50.8540.0070
Cylinder group 2. Min15Diameter6.3500.0100
Cylinder group 2. Max15Diameter6.5750.0100
Cylinder group 3. Min3Diameter12.6840.0050
Cylinder group 4. Min3Diameter12.7560.0050
Cylinder (ref. D)1Diameter38.1090.0020
Cylinder (ref. D)1Positioning0.0480.0080
Surface “LARGE”1Profile error0.0550.0020
Surface “SHORT”1Profile error0.1190.0170
Group 1 of cylinders1Composed positioning0.0690.0090
Group 2 of cylinders15Composed positioning0.0450.0070
Group 3 of cylinders3Composed positioning0.1010.0070
Table 2. (ucal) uncertainty contributor according to ISO 15530-4 technical specification.
Element IDQuantity of Evaluated FeaturesEvaluated PropertiesZEISS
(Ref. Values in mm)
ucal_From VCMM (in mm)
Plane (ref. A)1Flatness0.04040.0004
Cylinder (E min)1Diameter 12.6970.0005
Cylinder (E max)1Diameter 12.72360.0005
Plane (ref. B)1Flatness0.16790.0058
Plane (ref. C)1Flatness0.03980.0011
Cylinder11Positioning0.00140.0032
Cylinder group 1. Min1Diameter50.83730.0008
Cylinder group 1. Max1Diameter50.85020.0006
Cylinder group 2. Min15Diameter6.52030.0004
Cylinder group 2. Max15Diameter6.53390.0023
Cylinder group 3. Min3Diameter12.73070.0006
Cylinder group 4. Min3Diameter12.75060.0005
Cylinder (ref. D)1Diameter38.11950.0005
Cylinder (ref. D)1Positioning0.03060.0045
Surface “LARGE”1Profile error0.18150.0055
Surface “SHORT”1Profile error0.16310.0066
Group 1 of cylinders1Composed positioning0.02790.0017
Group 2 of cylinders15Composed positioning0.04480.0042
Group 3 of cylinders3Composed positioning0.10450.0043
Table 3. (ub) uncertainty contributor according to ISO 15530-3 technical specification.
Element IDQuantity of Evaluated FeaturesEvaluated PropertiesATOS Triple Scan (Mean Values in mm)ZEISS
(Ref. Values in mm)
ub_Systematic Error (mm)
Plane (ref. A)1Flatness0.0850.0404−0.0446
Cylinder (E min)1Diameter 12.66412.6970.033
Cylinder (E max)1Diameter 12.75212.7236−0.0284
Plane (ref. B)1Flatness0.10.16790.0679
Plane (ref. C)1Flatness0.2160.0398−0.1762
Cylinder11Positioning0.0440.0014−0.0426
Cylinder group 1. Min1Diameter50.79250.83730.0453
Cylinder group 1. Max1Diameter50.85450.8502−0.0035
Cylinder group 2. Min15Diameter6.356.52030.1703
Cylinder group 2. Max15Diameter6.5756.5339−0.0407
Cylinder group 3. Min3Diameter12.68412.73070.0467
Cylinder group 4. Min3Diameter12.75612.7506−0.0056
Cylinder (ref. D)1Diameter38.10938.11950.0105
Cylinder (ref. D)1Positioning0.0480.0306−0.0174
Surface “LARGE”1Profile error0.0550.18150.1265
Surface “SHORT”1Profile error0.1190.16310.0441
Group 1 of cylinders1Composed positioning0.0690.0279−0.0411
Group 2 of cylinders15Composed positioning0.0450.0448−0.0002
Group 3 of cylinders3Composed positioning0.1010.10450.0035
Table 4. (U) Expanded measurement uncertainty assessment results. Uncertainty budget.
Element IDQuantity of Evaluated FeaturesEvaluated PropertiesATOS Triple Scan (Mean Values in mm)ZEISS (Ref. Values in mm)ub_Systematic Error (mm)U_Expanded Uncertainty (k = 2 in mm)
Plane (ref. A)1Flatness0.0850.0404−0.04460.091
Cylinder (E min)1Diameter 12.66412.6970.0330.0684
Cylinder (E max)1Diameter 12.75212.7236−0.02840.0596
Plane (ref. B)1Flatness0.10.16790.06790.1372
Plane (ref. C)1Flatness0.2160.0398−0.17620.3528
Cylinder11Positioning0.0440.0014−0.04260.0856
Cylinder group 1. Min1Diameter50.79250.83730.04530.0916
Cylinder group 1. Max1Diameter50.85450.8502−0.00350.0156
Cylinder group 2. Min15Diameter6.356.52030.17030.3412
Cylinder group 2. Max15Diameter6.5756.5339−0.04070.084
Cylinder group 3. Min3Diameter12.68412.73070.04670.094
Cylinder group 4. Min3Diameter12.75612.7506−0.00560.015
Cylinder (ref. D)1Diameter38.10938.11950.01050.0214
Cylinder (ref. D)1Positioning0.0480.0306−0.01740.0394
Surface “LARGE”1Profile error0.0550.18150.12650.2532
Surface “SHORT”1Profile error0.1190.16310.04410.0954
Group 1 of cylinders1Composed positioning0.0690.0279−0.04110.0842
Group 2 of cylinders15Composed positioning0.0450.0448−0.00020.0164
Group 3 of cylinders3Composed positioning0.1010.10450.00350.0178
Publisher’s Note: MDPI stays neutral with regard to jurisdictional claims in published maps and institutional affiliations.

