
PTEN, MMP2, and NF-κB and Regulating MicroRNA-181 Aggravate Insulin Resistance and Progression of Diabetic Nephropathy: A Case-Control Study

 , , ,
, , , 
Abstract
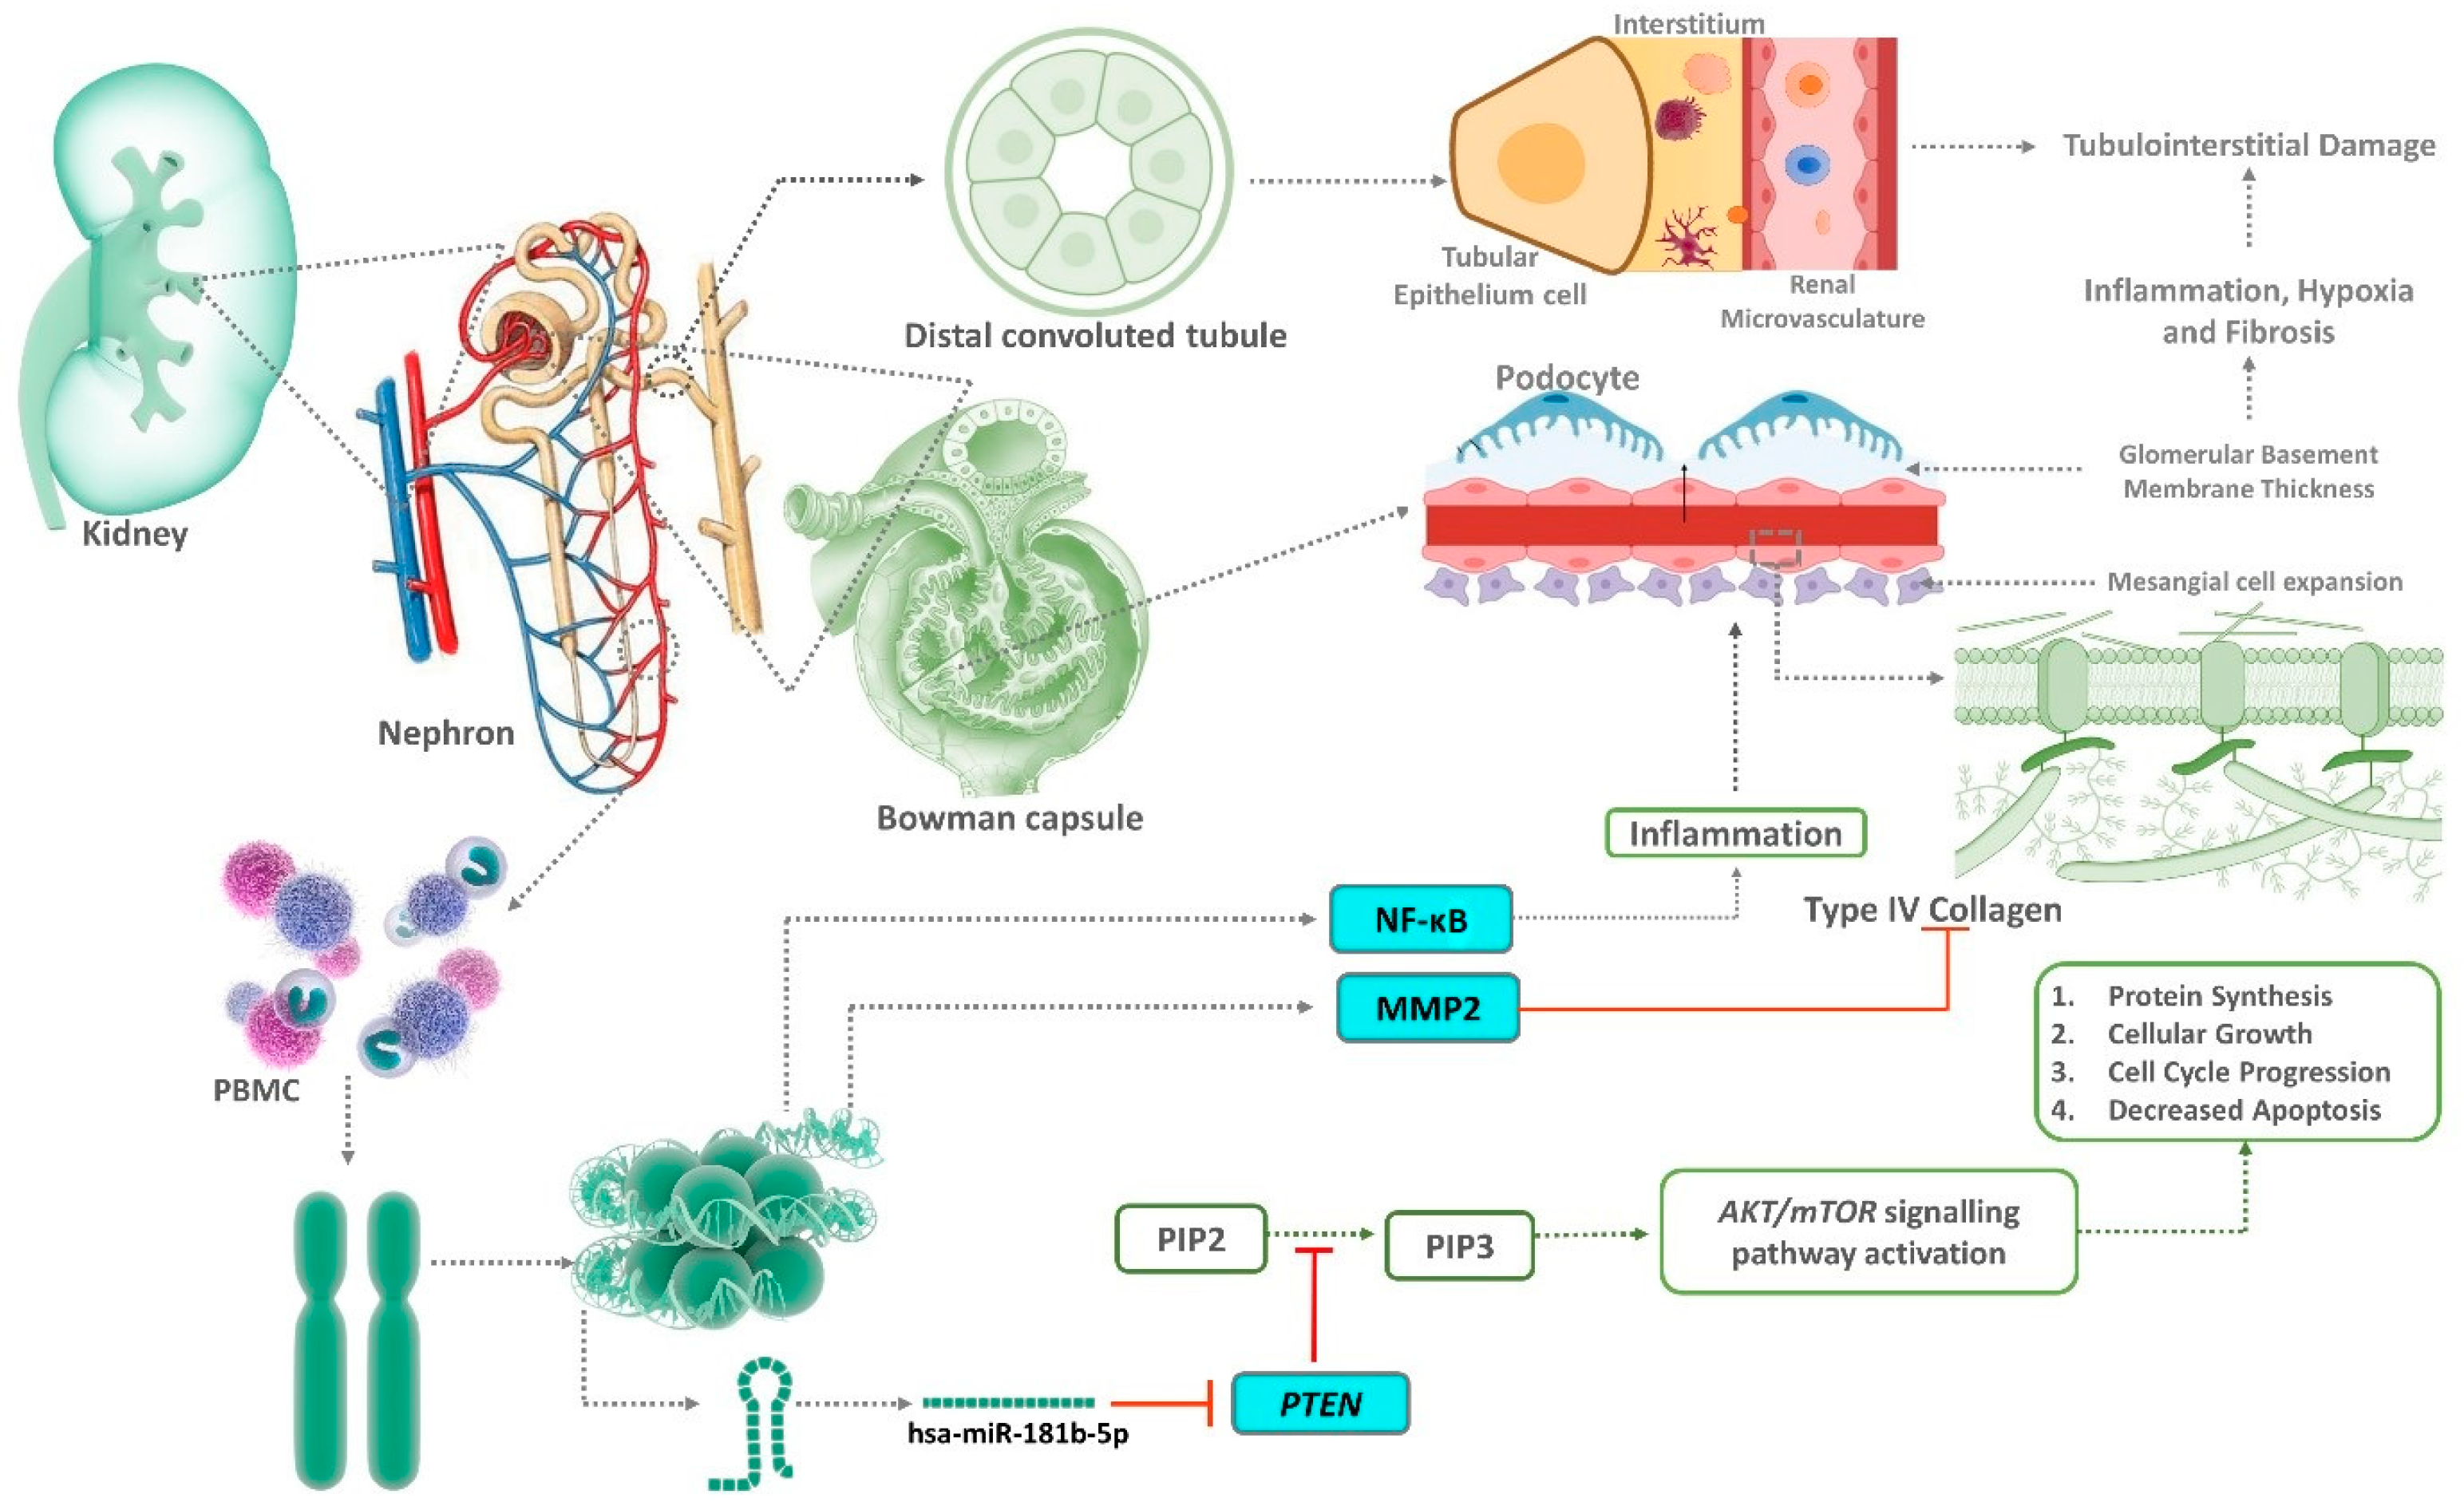
:1. Introduction
2. Materials and Methods
2.1. Study Design and Participants
2.2. Biochemical Laboratory Tests
2.3. RNA Isolation, Quantification, Reverse Transcription, and Real-Time PCR Expression
2.4. In Silico Protein–Protein Interactions and Network Constructions of PTEN, NF-ĸB, and MMP2 with Interacting Genes
2.5. Pathway Analysis and Gene Ontology (GO) Enrichment
2.6. hsa-miR-181b-5p Target Prediction, Network Construction, and Pathways Analysis
2.7. Gene Expression Profile Dataset Search Process and Inclusion and Exclusion Criteria
2.8. MicroRNAs Expression Profile Dataset Search Process and Inclusion and Exclusion Criteria
2.9. Statistical Analysis
3. Results
3.1. Anthropometric Characteristics of the Study Population
3.2. Clinical Characteristics of the Study Population
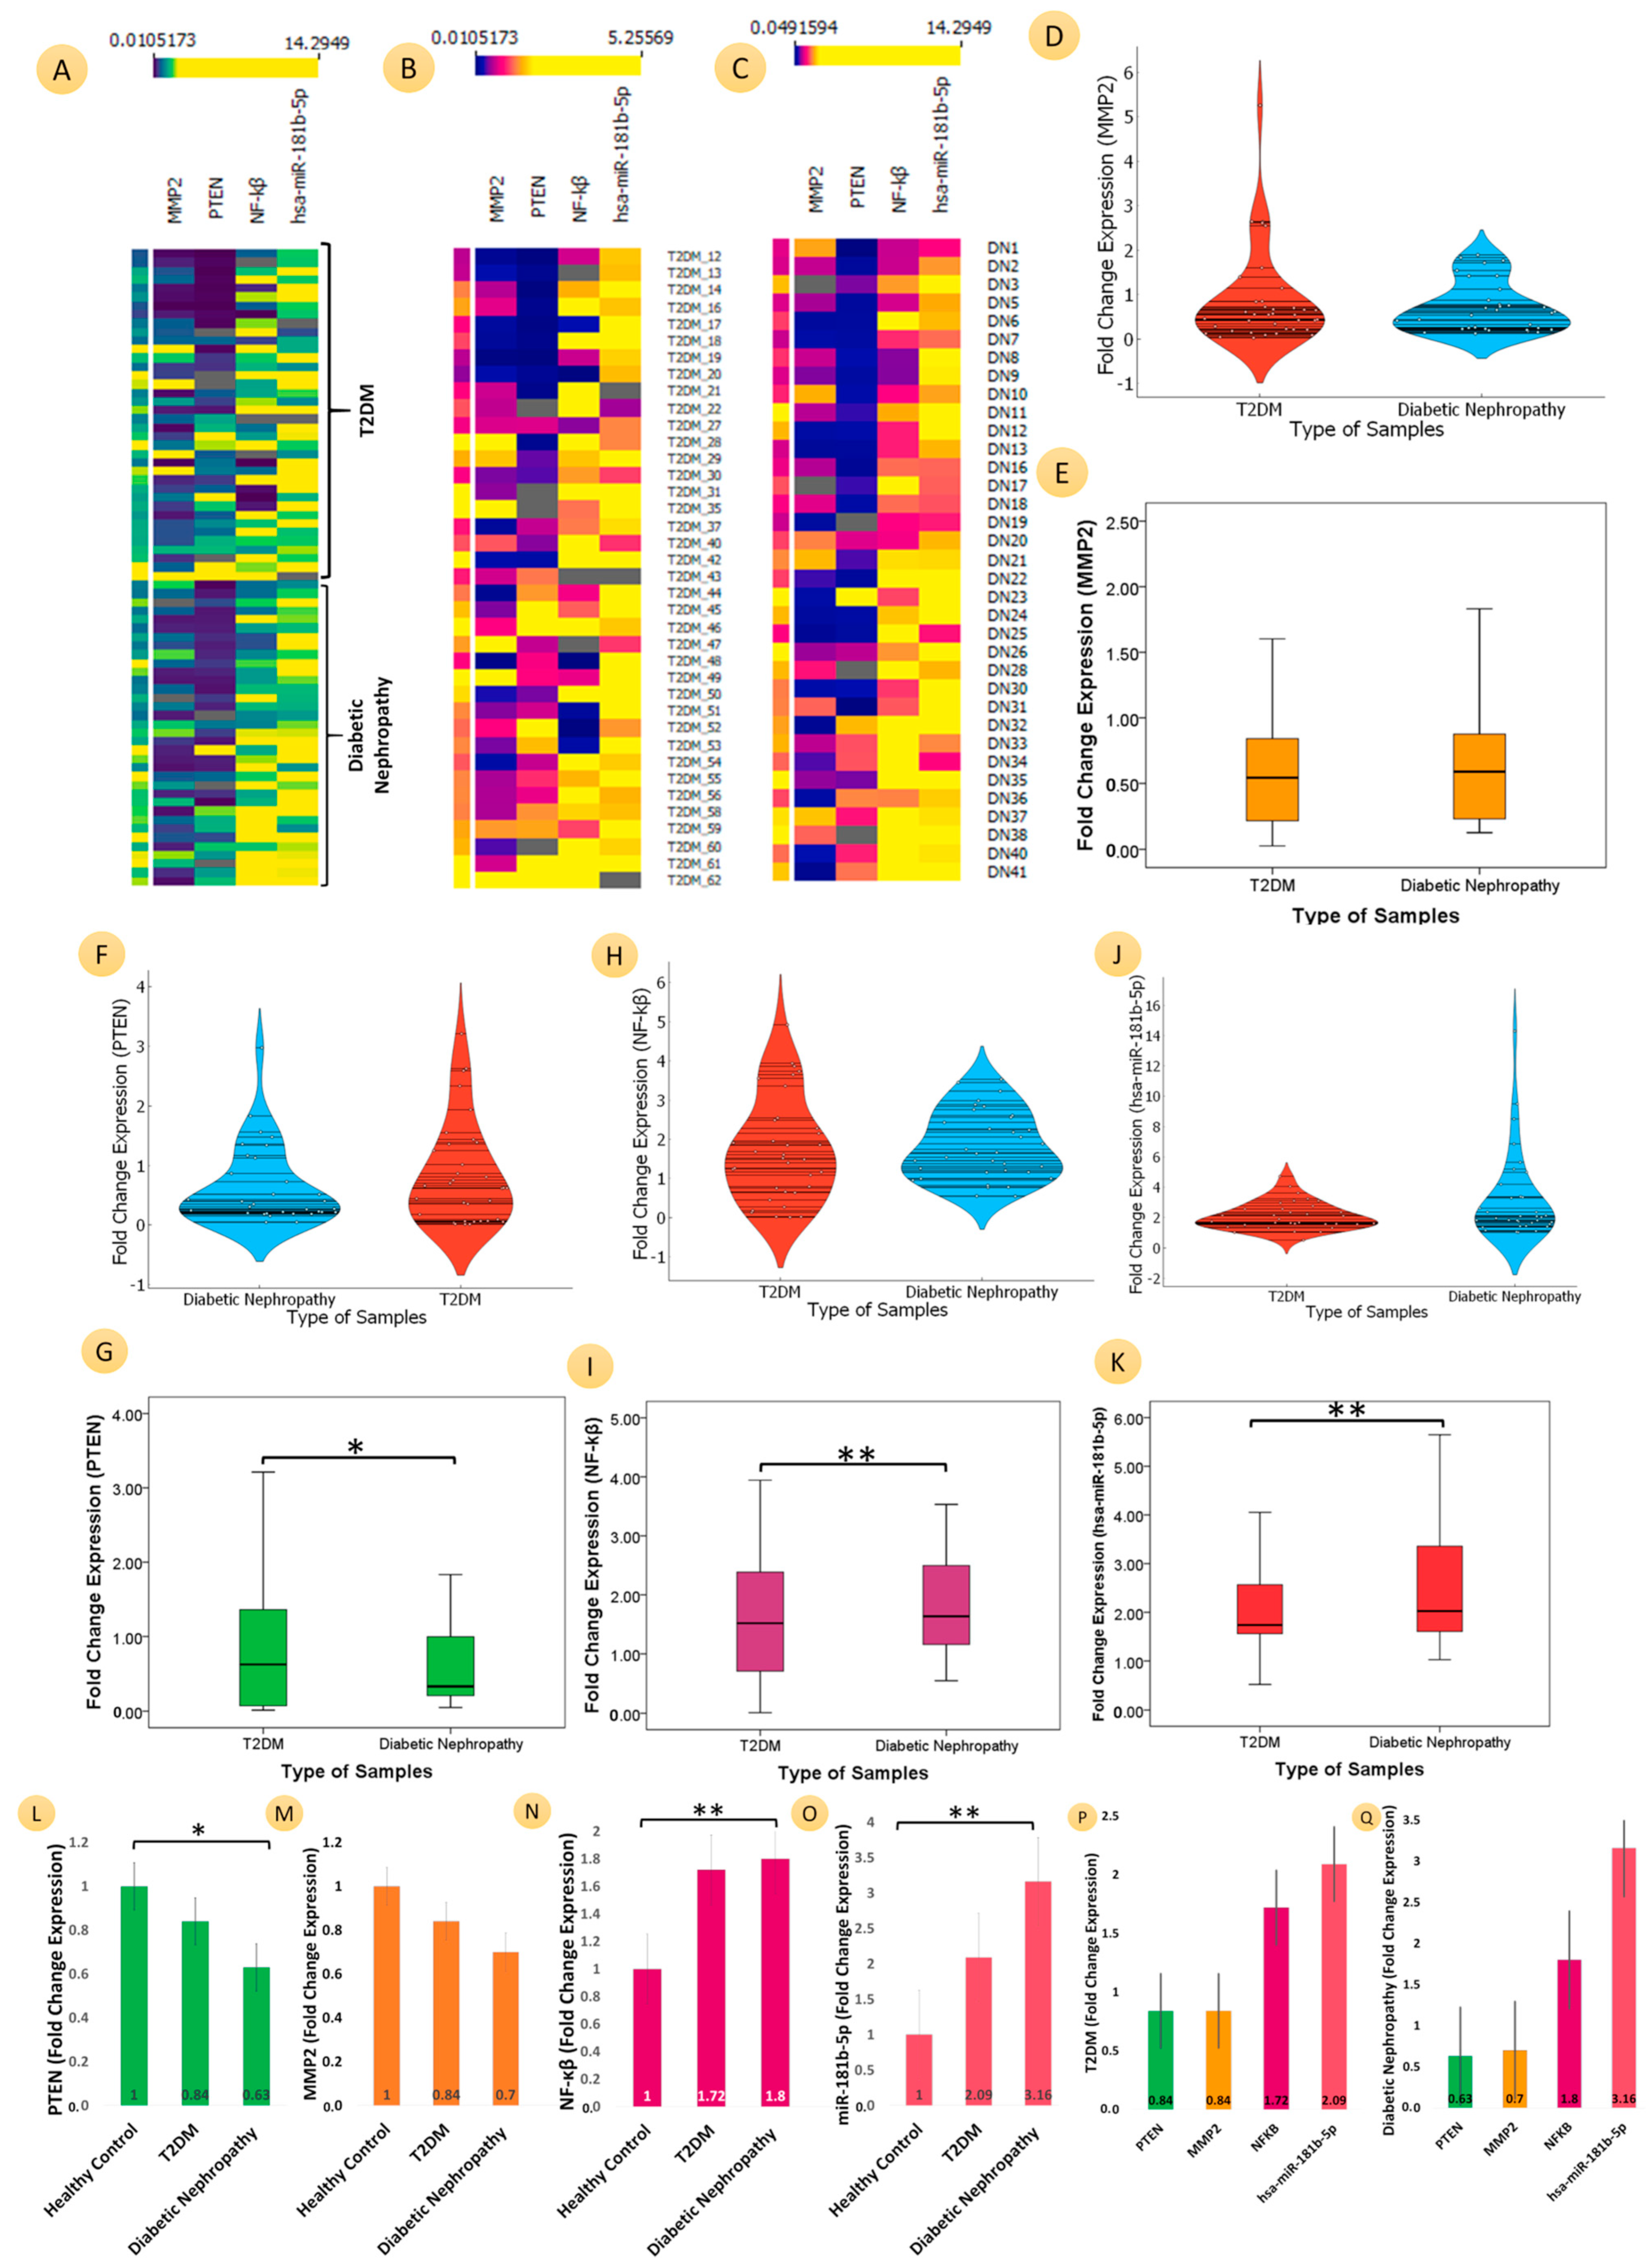
3.3. Comparative Analyses of the mRNA Expression of Three Genes (PTEN, MMP2, and NF-ĸB) and MicroRNA-181b-p for T2DM, DN, and HC
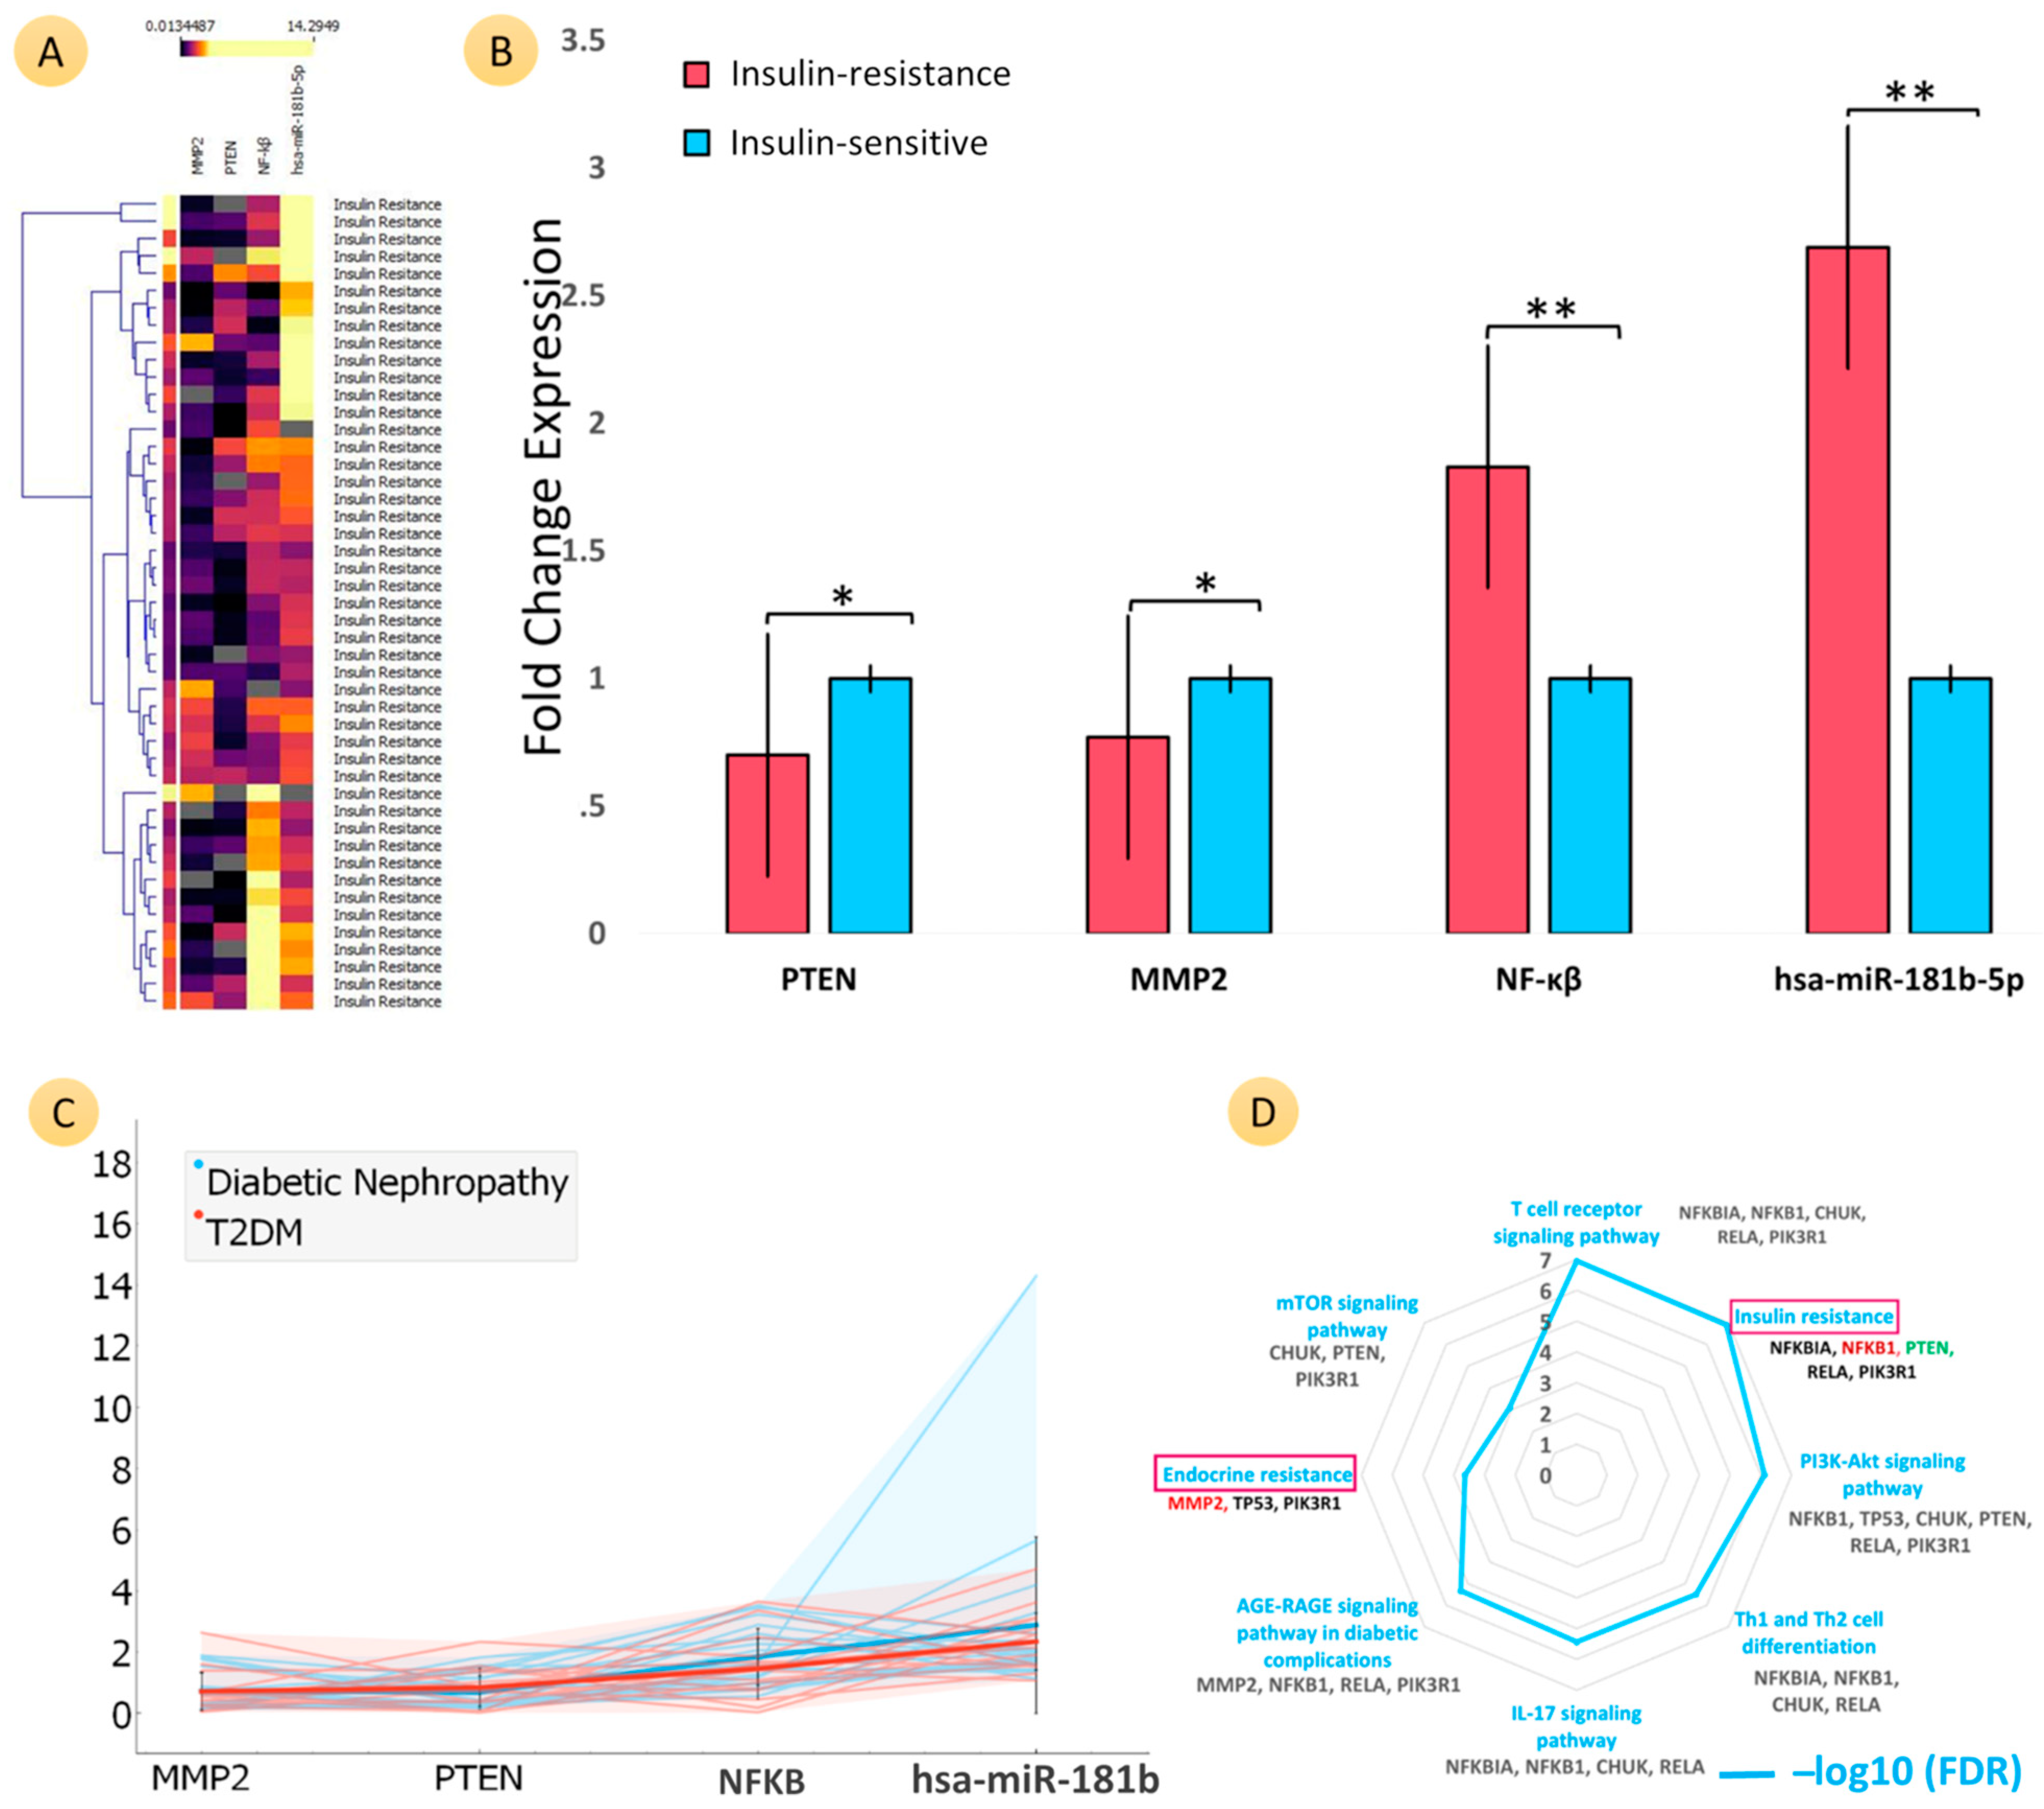
3.4. Comparative Analyses of the mRNA Expression of Three Genes (PTEN, MMP2, and NF-ĸB) and MicroRNA-181b-5p in Patients with Insulin Resistance
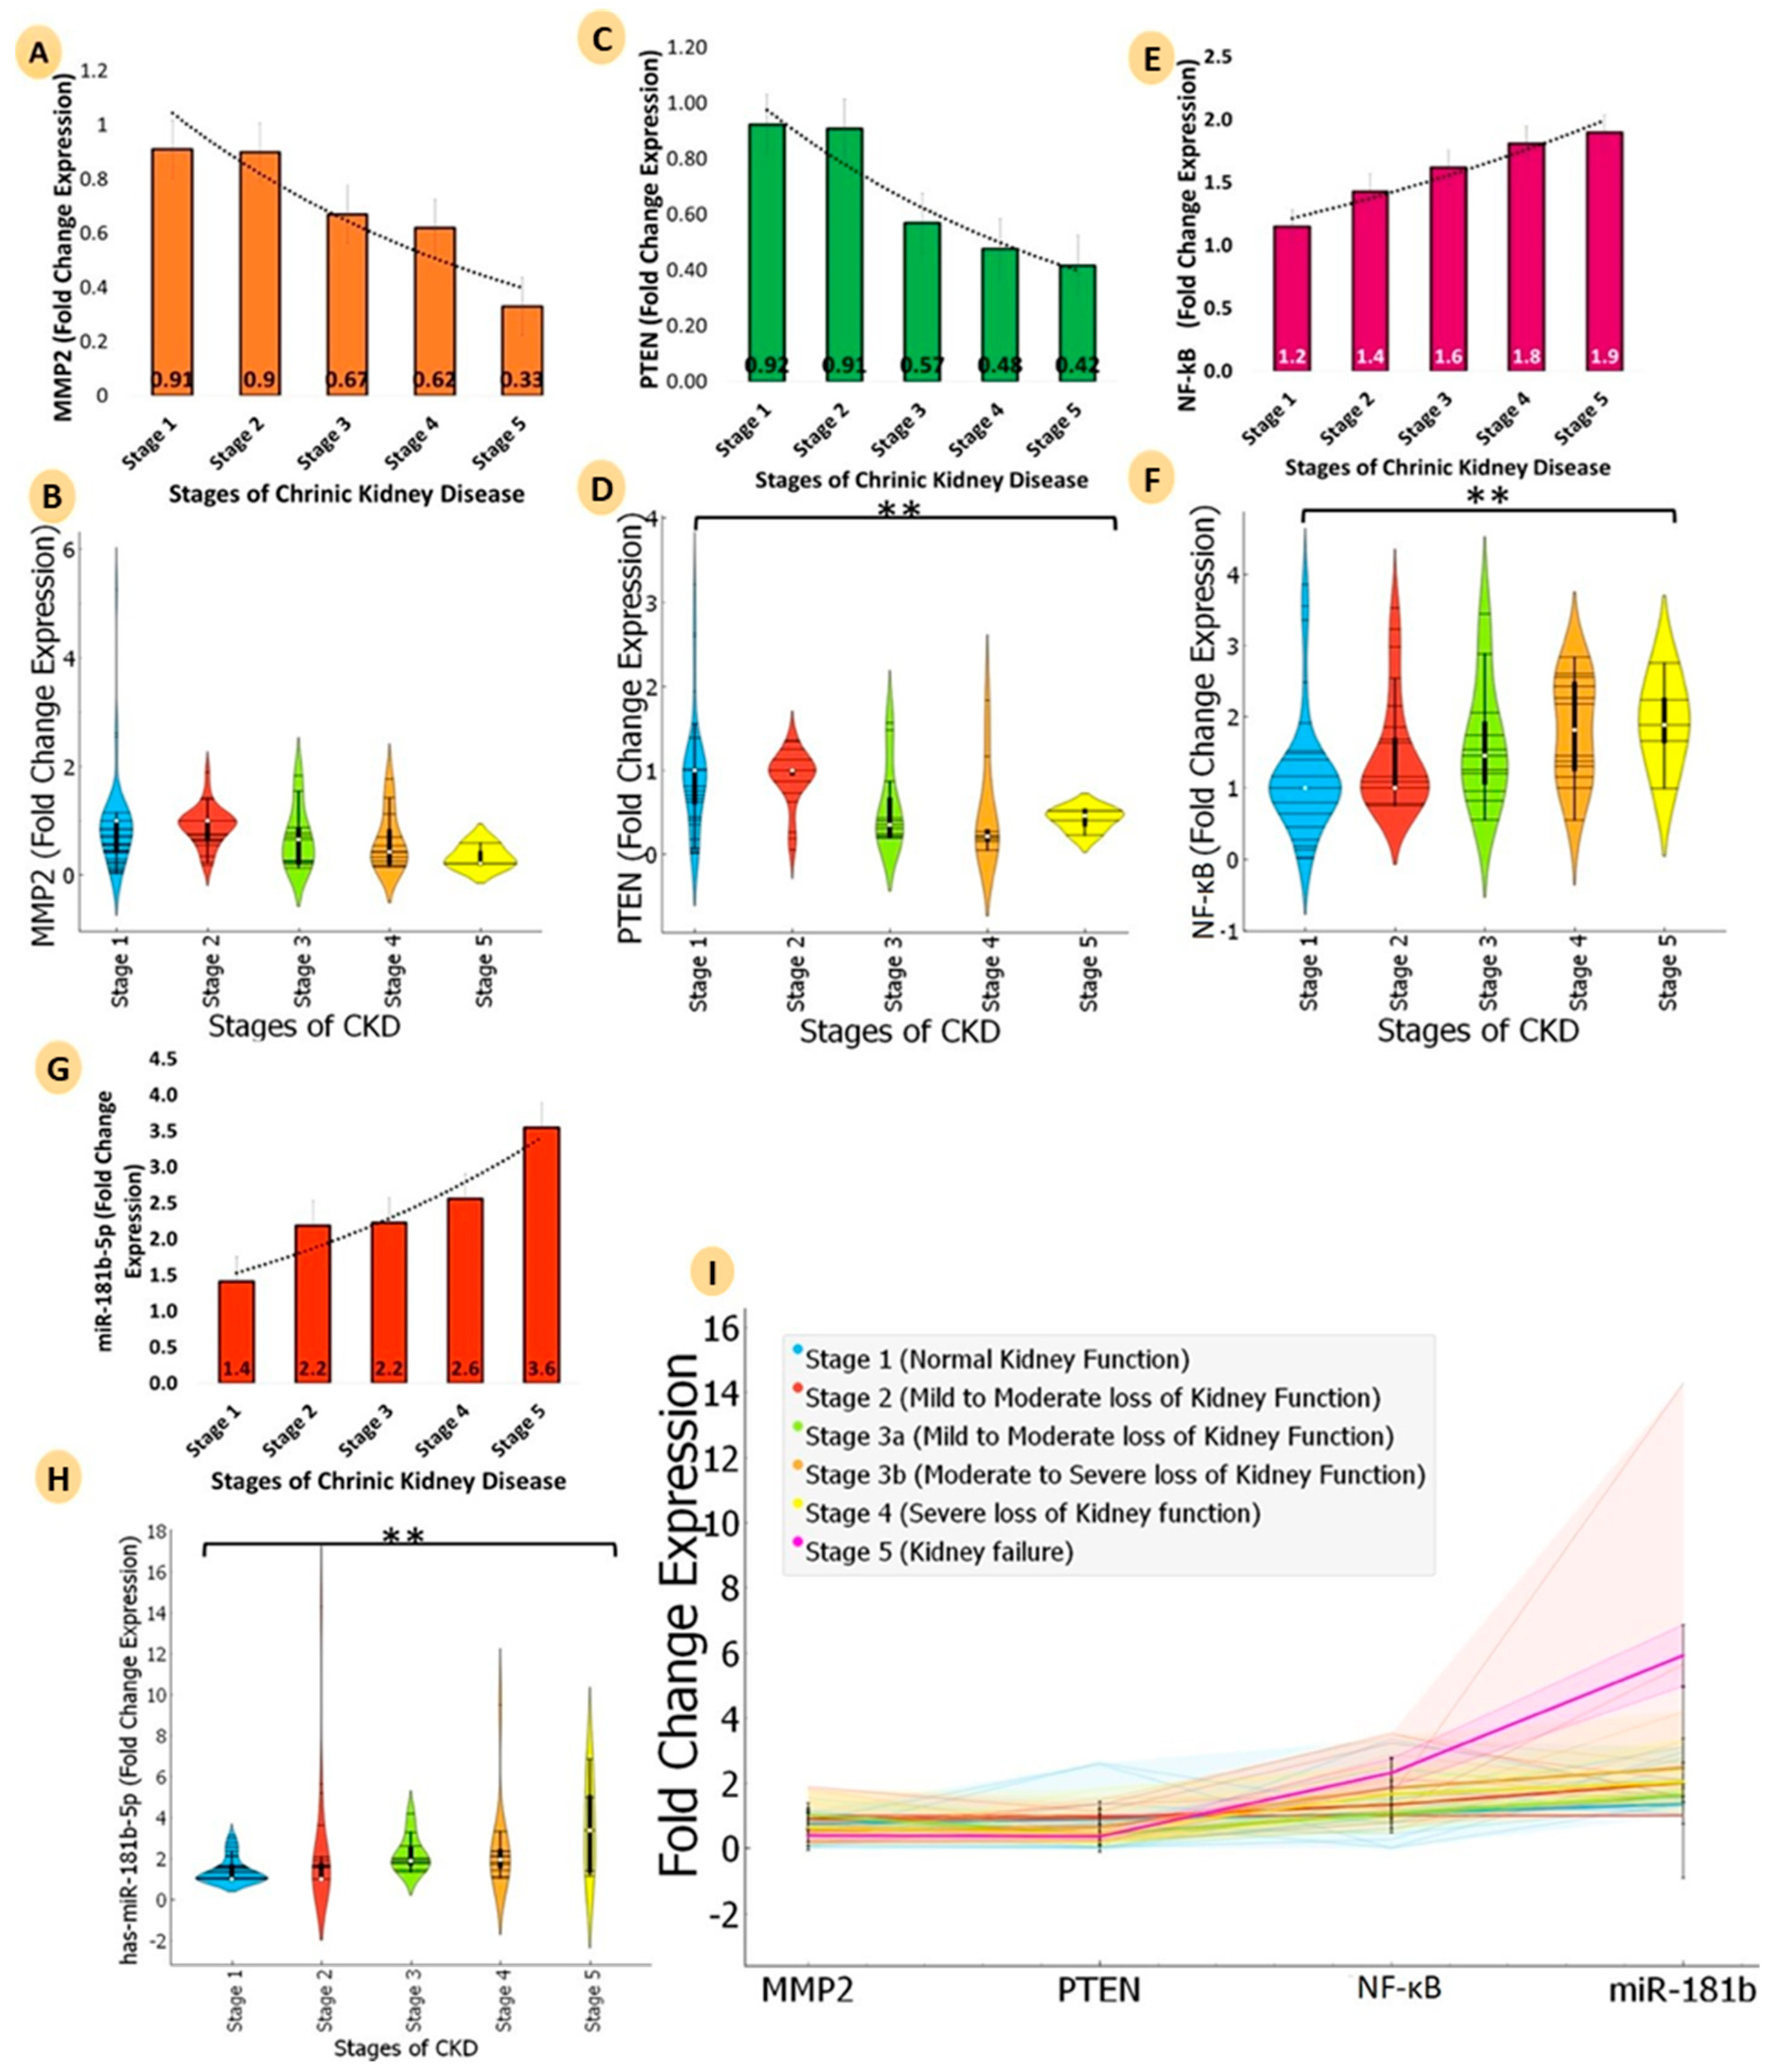
3.5. Comparative Analyses of mRNA Expression of Three Genes (PTEN, MMP2, and NF-ĸB) and MicroRNA-181b-5p for Five Stages of Chronic Kidney Disease (CKD)
3.6. Network Construction, Gene Ontology, and Interatomic Validation from Similar MicroRNA and Gene Expression Omnibus Datasets
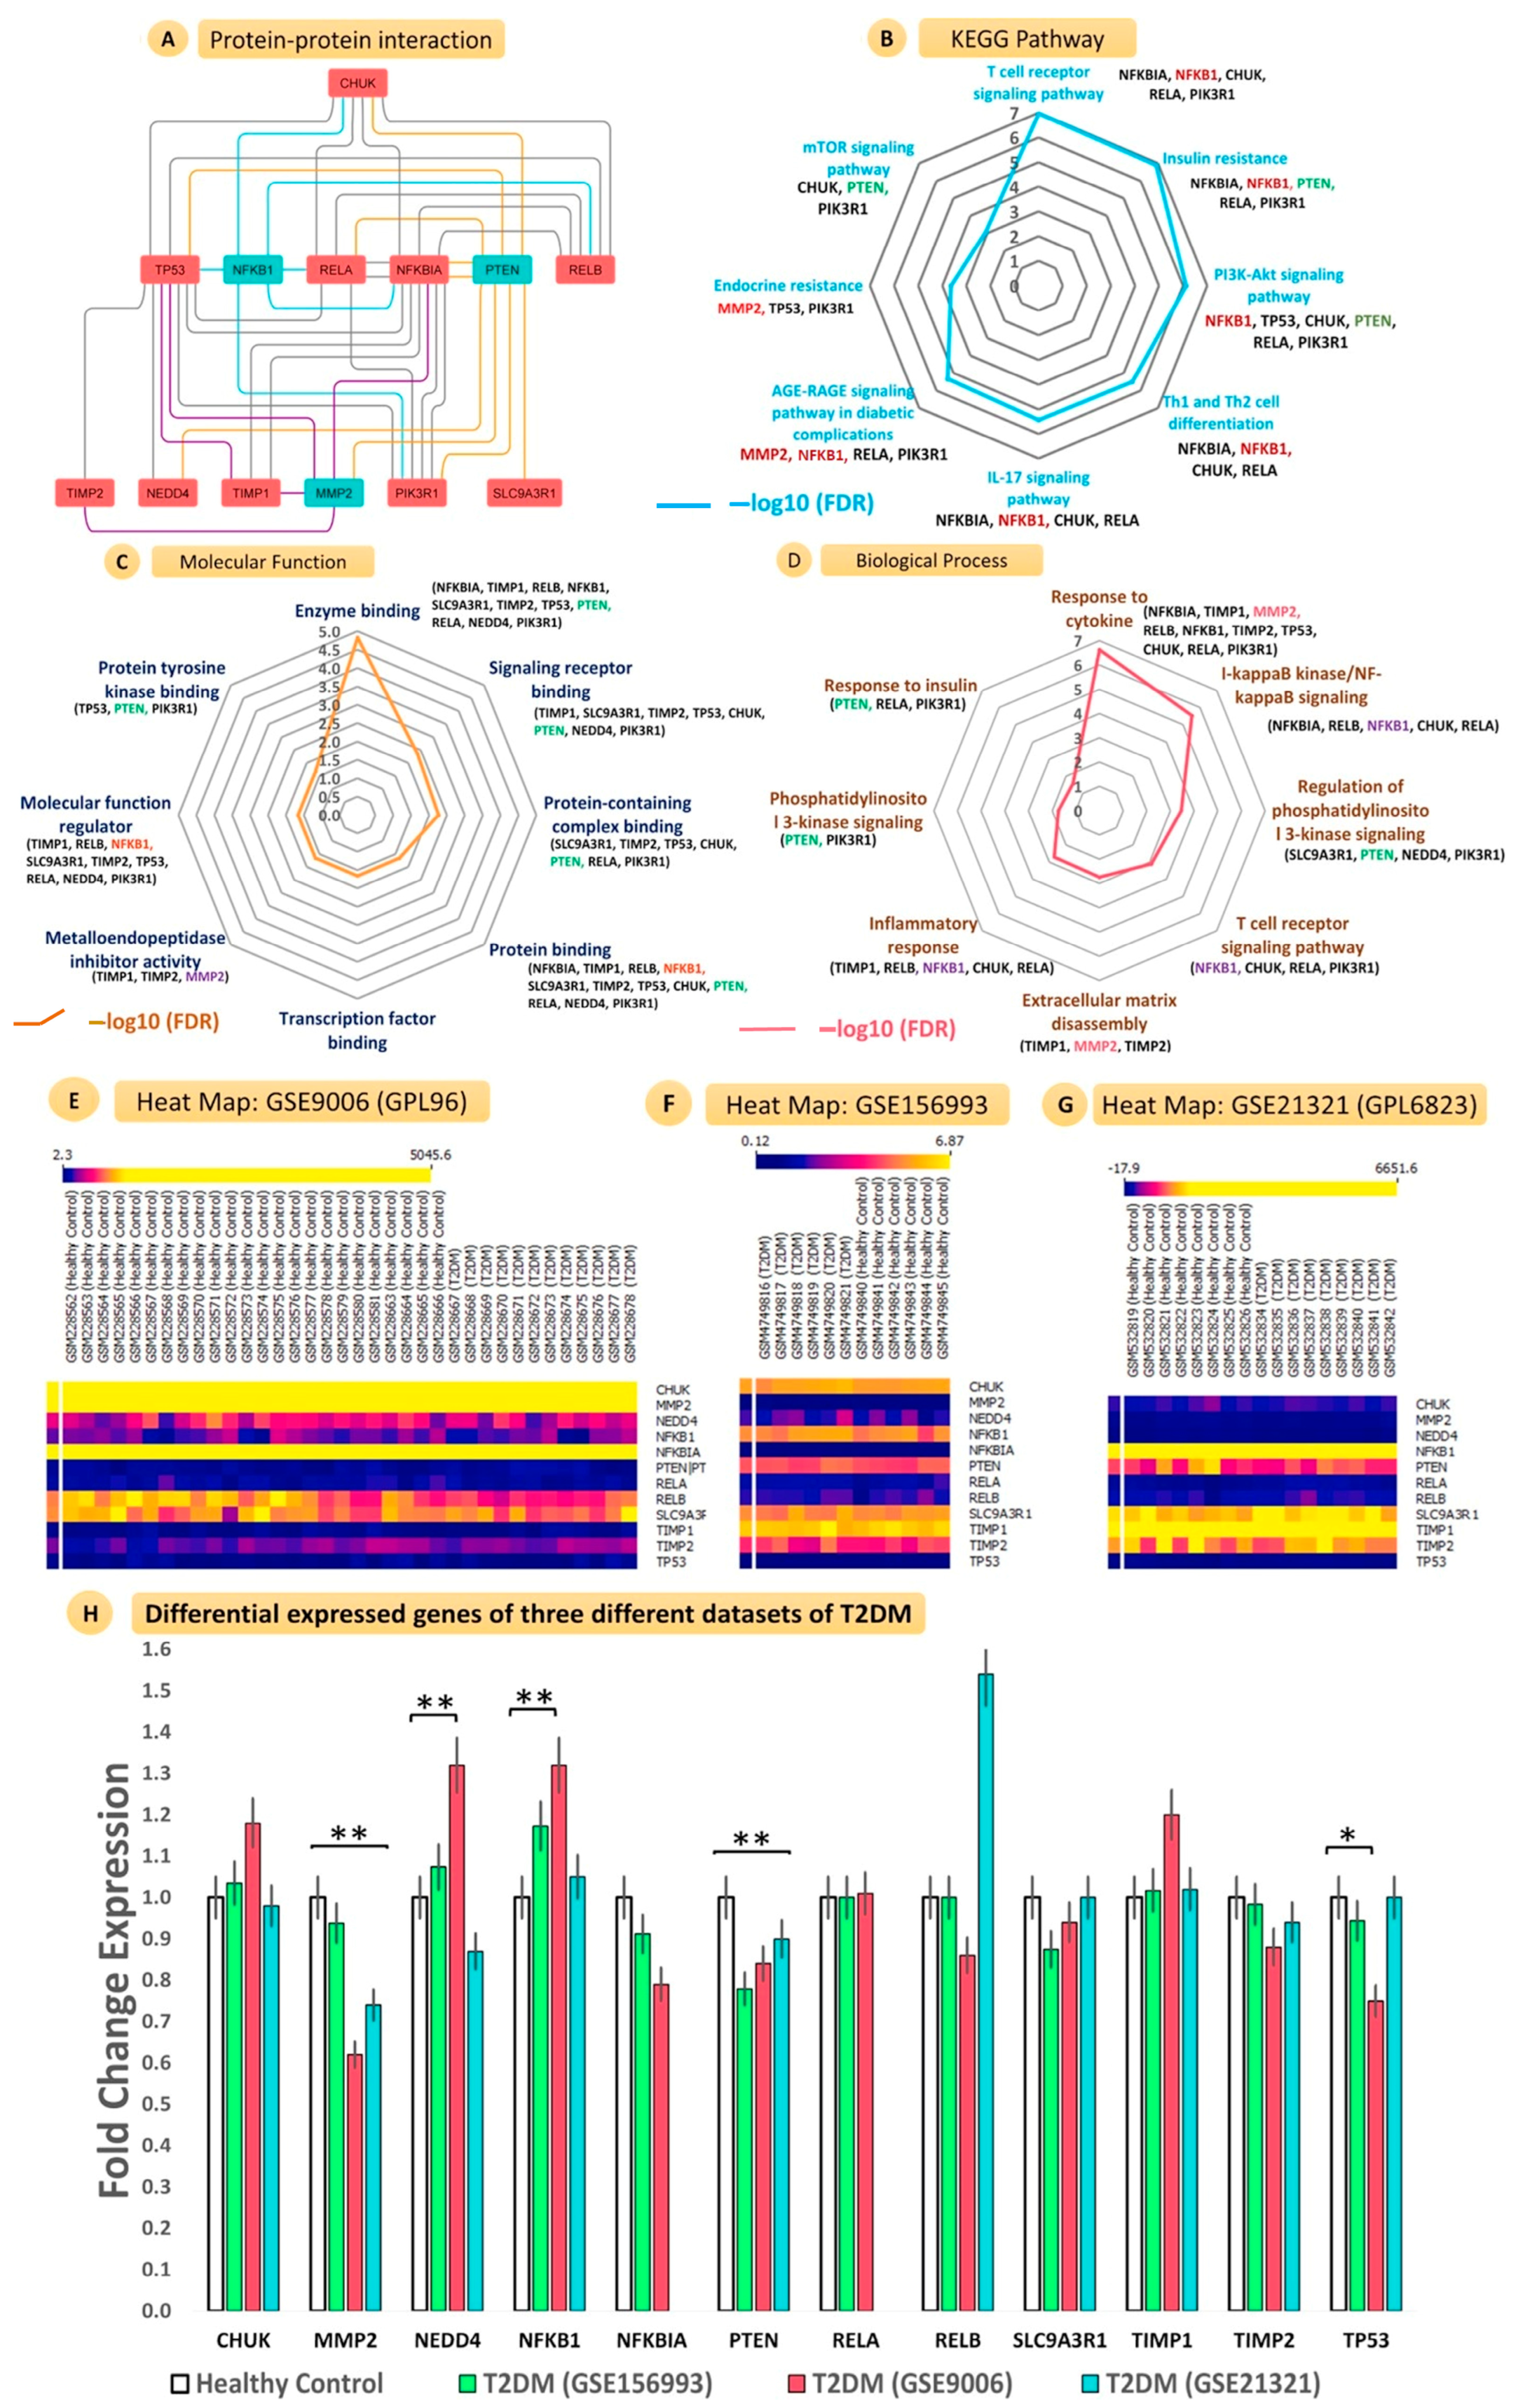
3.6.1. Construction of Protein–Protein Interaction Network with PTEN, NF-ĸB, and MMP2 and Interacting Genes
3.6.2. KEGG Pathway Enrichment Analysis
3.6.3. Gene Ontology Analysis
3.6.4. Validation of Gene Expression Profiles from GEO Datasets
3.6.5. Target Prediction of hsa-miR-181b-5p and Construction of miRNA Regulatory Networks
3.6.6. Regulation of hsa-miR-181b-5p for KEGG and Reactome Pathway Enrichment
3.6.7. Validation of hsa-miR-181b-5p Expression Profile from GEO Datasets
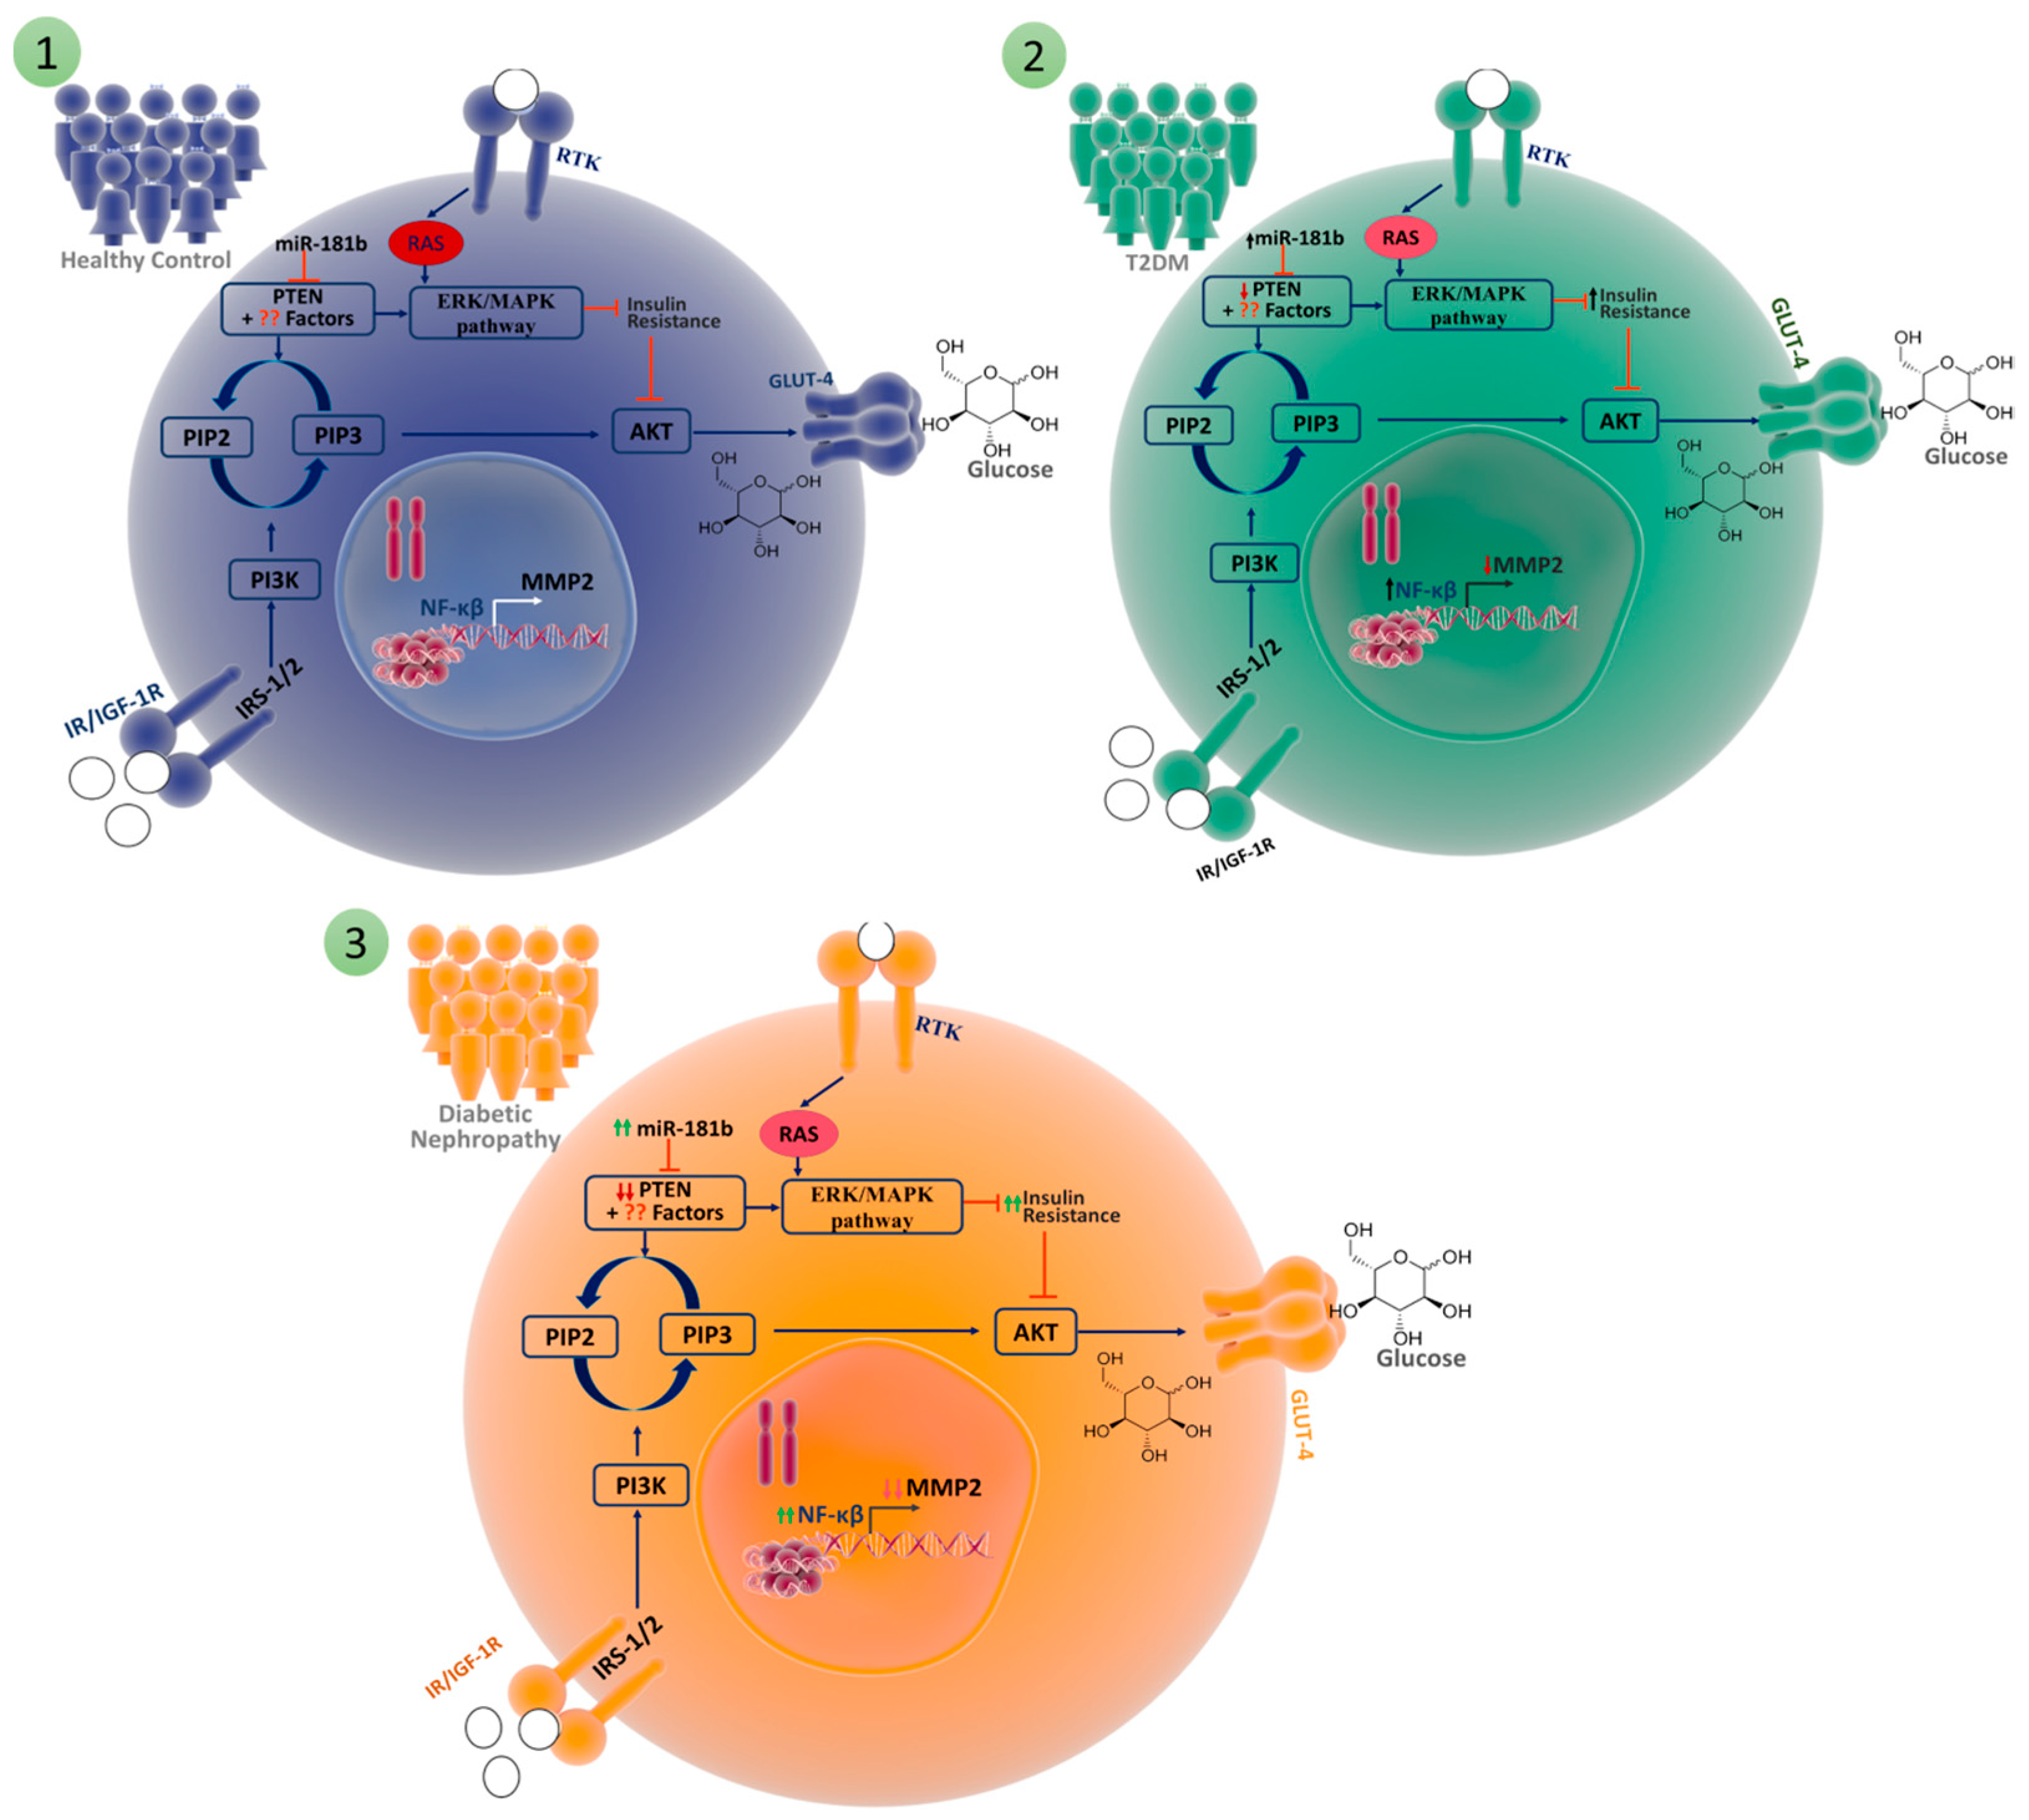
4. Discussion
5. Conclusions
Supplementary Materials
Author Contributions
Funding
Institutional Review Board Statement
Informed Consent Statement
Data Availability Statement
Acknowledgments
Conflicts of Interest
References
- Lim, A. Diabetic Nephropathy—Complications and Treatment. Int. J. Nephrol. Renov. Dis. 2014, 7, 361–381. [Google Scholar] [CrossRef] [Green Version]
- Susztak, K.; Böttinger, E.; Novetsky, A.; Liang, D.; Zhu, Y.; Ciccone, E.; Wu, D.; Dunn, S.; McCue, P.; Sharma, K. Molecular Profiling of Diabetic Mouse Kidney Reveals Novel Genes Linked to Glomerular Disease. Diabetes 2004, 53, 784–794. [Google Scholar] [CrossRef] [PubMed] [Green Version]
- Lokman, F.E.; Seman, N.A.; al-Safi Ismail, A.; Yaacob, N.A.; Mustafa, N.; Khir, A.S.M.; Hussein, Z.; Wan Mohamud, W.N. Gene Expression Profiling in Ethnic Malays with Type 2 Diabetes Mellitus, with and without Diabetic Nephropathy. J. Nephrol. 2011, 24, 778–789. [Google Scholar] [CrossRef]
- Fan, Y.; Yi, Z.; D’Agati, V.D.; Sun, Z.; Zhong, F.; Zhang, W.; Wen, J.; Zhou, T.; Li, Z.; He, L.; et al. Comparison of Kidney Transcriptomic Profiles of Early and Advanced Diabetic Nephropathy Reveals Potential New Mechanisms for Disease Progression. Diabetes 2019, 68, 2301–2314. [Google Scholar] [CrossRef] [Green Version]
- Wang, J.; Wang, G.; Liang, Y.; Zhou, X. Expression Profiling and Clinical Significance of Plasma MicroRNAs in Diabetic Nephropathy. J. Diabetes Res. 2019, 2019, 5204394. [Google Scholar] [CrossRef] [PubMed]
- Khokhar, M.; Roy, D.; Modi, A.; Agarwal, R.; Yadav, D.; Purohit, P.; Sharma, P. Perspectives on the Role of PTEN in Diabetic Nephropathy: An Update. Crit. Rev. Clin. Lab. Sci. 2020, 57, 470–483. [Google Scholar] [CrossRef]
- Khokhar, M.; Roy, D.; Bajpai, N.K.; Bohra, G.K.; Yadav, D.; Sharma, P.; Purohit, P. Metformin Mediates MicroRNA-21 Regulated Circulating Matrix Metalloproteinase-9 in Diabetic Nephropathy: An in-Silico and Clinical Study. Arch. Physiol. Biochem. 2021, 1–11. [Google Scholar] [CrossRef]
- Roy, D.; Modi, A.; Khokar, M.; Sankanagoudar, S.; Yadav, D.; Sharma, S.; Purohit, P.; Sharma, P. MicroRNA 21 Emerging Role in Diabetic Complications: A Critical Update. Curr. Diabetes Rev. 2021, 17, 122–135. [Google Scholar] [CrossRef]
- Liu, J.; Xing, Y.; Rong, L. MiR-181 Regulates Cisplatin-Resistant Non-Small Cell Lung Cancer via Downregulation of Autophagy through the PTEN/PI3K/AKT Pathway. Oncol. Rep. 2018, 39, 1631–1639. [Google Scholar] [CrossRef] [Green Version]
- Li, Y.; Zhang, D.-W.; Lin, D.-Q.; Cao, L.-Q. Peroxisome Proliferator-Activated Receptor-γ Inhibits Pancreatic Cancer Cell Invasion and Metastasis via Regulating MMP-2 Expression through PTEN. Mol. Med. Rep. 2015, 12, 6255–6260. [Google Scholar] [CrossRef] [Green Version]
- Szklarczyk, D.; Gable, A.L.; Lyon, D.; Junge, A.; Wyder, S.; Huerta-Cepas, J.; Simonovic, M.; Doncheva, N.T.; Morris, J.H.; Bork, P.; et al. STRING V11: Protein–Protein Association Networks with Increased Coverage, Supporting Functional Discovery in Genome-Wide Experimental Datasets. Nucleic Acids Res. 2019, 47, D607–D613. [Google Scholar] [CrossRef] [Green Version]
- Otasek, D.; Morris, J.H.; Bouças, J.; Pico, A.R.; Demchak, B. Cytoscape Automation: Empowering Workflow-Based Network Analysis. Genome Biol. 2019, 20, 185. [Google Scholar] [CrossRef] [Green Version]
- Fan, Y.; Habib, M.; Xia, J. Xeno-MiRNet: A Comprehensive Database and Analytics Platform to Explore Xeno-MiRNAs and Their Potential Targets. PeerJ 2018, 6, e5650. [Google Scholar] [CrossRef] [PubMed]
- Licursi, V.; Conte, F.; Fiscon, G.; Paci, P. MIENTURNET: An Interactive Web Tool for MicroRNA-Target Enrichment and Network-Based Analysis. BMC Bioinform. 2019, 20, 545. [Google Scholar] [CrossRef] [Green Version]
- Kaizer, E.C.; Glaser, C.L.; Chaussabel, D.; Banchereau, J.; Pascual, V.; White, P.C. Gene Expression in Peripheral Blood Mononuclear Cells from Children with Diabetes. J. Clin. Endocrinol. Metab. 2007, 92, 3705–3711. [Google Scholar] [CrossRef] [Green Version]
- Karolina, D.S.; Armugam, A.; Tavintharan, S.; Wong, M.T.K.; Lim, S.C.; Sum, C.F.; Jeyaseelan, K. MicroRNA 144 Impairs Insulin Signaling by Inhibiting the Expression of Insulin Receptor Substrate 1 in Type 2 Diabetes Mellitus. PLoS ONE 2011, 6, e22839. [Google Scholar] [CrossRef]
- Conserva, F.; Barozzino, M.; Pesce, F.; Divella, C.; Oranger, A.; Papale, M.; Sallustio, F.; Simone, S.; Laviola, L.; Giorgino, F.; et al. Urinary MiRNA-27b-3p and MiRNA-1228-3p Correlate with the Progression of Kidney Fibrosis in Diabetic Nephropathy. Sci. Rep. 2019, 9, 11357. [Google Scholar] [CrossRef] [Green Version]
- Yashpal, S.; Mk, G.; Nikhil, T.; Kumar, M.R. A Study of Insulin Resistance by HOMA-IR and Its Cut-off Value to Identify Metabolic Syndrome in Urban Indian Adolescents. J. Clin. Res. Pediatr. Endocrinol. 2013, 5, 245–251. [Google Scholar] [CrossRef] [PubMed]
- Wang, B.; Li, W.; Guo, K.; Xiao, Y.; Wang, Y.; Fan, J. MiR-181b Promotes Hepatic Stellate Cells Proliferation by Targeting P27 and Is Elevated in the Serum of Cirrhosis Patients. Biochem. Biophys. Res. Commun. 2012, 421, 4–8. [Google Scholar] [CrossRef]
- Zheng, J.; Wu, C.; Xu, Z.; Xia, P.; Dong, P.; Chen, B.; Yu, F. Hepatic Stellate Cell Is Activated by MicroRNA-181b via PTEN/Akt Pathway. Mol. Cell. Biochem. 2015, 398, 1–9. [Google Scholar] [CrossRef] [PubMed]
- Williams, A.; Henao-Mejia, J.; Harman, C.C.D.; Flavell, R.A. MiR-181 and Metabolic Regulation in the Immune System. Cold Spring Harb. Symp. Quant. Biol. 2013, 78, 223–230. [Google Scholar] [CrossRef] [Green Version]
- Henao-Mejia, J.; Williams, A.; Goff, L.A.; Staron, M.; Licona-Limón, P.; Kaech, S.M.; Nakayama, M.; Rinn, J.L.; Flavell, R.A. The MicroRNA MiR-181 Is a Critical Cellular Metabolic Rheostat Essential for NKT Cell Ontogenesis and Lymphocyte Development and Homeostasis. Immunity 2013, 38, 984–997. [Google Scholar] [CrossRef] [PubMed] [Green Version]
- Bera, A.; Das, F.; Ghosh-Choudhury, N.; Mariappan, M.M.; Kasinath, B.S.; Ghosh Choudhury, G. Reciprocal Regulation of MiR-214 and PTEN by High Glucose Regulates Renal Glomerular Mesangial and Proximal Tubular Epithelial Cell Hypertrophy and Matrix Expansion. Am. J. Physiol.-Cell Physiol. 2017, 313, C430–C447. [Google Scholar] [CrossRef] [Green Version]
- McClelland, A.D.; Herman-Edelstein, M.; Komers, R.; Jha, J.C.; Winbanks, C.E.; Hagiwara, S.; Gregorevic, P.; Kantharidis, P.; Cooper, M.E. MiR-21 Promotes Renal Fibrosis in Diabetic Nephropathy by Targeting PTEN and SMAD7. Clin. Sci. 2015, 129, 1237–1249. [Google Scholar] [CrossRef] [PubMed]
- Nagano, M.; Fukami, K.; Yamagishi, S.; Ueda, S.; Kaida, Y.; Matsumoto, T.; Yoshimura, J.; Hazama, T.; Takamiya, Y.; Kusumoto, T.; et al. Circulating Matrix Metalloproteinase-2 Is an Independent Correlate of Proteinuria in Patients with Chronic Kidney Disease. Am. J. Nephrol. 2009, 29, 109–115. [Google Scholar] [CrossRef] [PubMed]
- Cheng, Z.; Limbu, M.; Wang, Z.; Liu, J.; Liu, L.; Zhang, X.; Chen, P.; Liu, B. MMP-2 and 9 in Chronic Kidney Disease. Int. J. Mol. Sci. 2017, 18, 776. [Google Scholar] [CrossRef] [Green Version]
- Williams, A.S.; Kang, L.; Wasserman, D.H. The Extracellular Matrix and Insulin Resistance. Trends Endocrinol. Metab. 2015, 26, 357–366. [Google Scholar] [CrossRef] [Green Version]
- Miksztowicz, V.; Morales, C.; Zago, V.; Friedman, S.; Schreier, L.; Berg, G. Effect of Insulin-Resistance on Circulating and Adipose Tissue MMP-2 and MMP-9 Activity in Rats Fed a Sucrose-Rich Diet. Nutr. Metab. Cardiovasc. Dis. 2014, 24, 294–300. [Google Scholar] [CrossRef]
- Lewandowski, K.C.; Banach, E.; Bieńkiewicz, M.; Lewiński, A. Matrix Metalloproteinases in Type 2 Diabetes and Non-Diabetic Controls: Effects of Short-Term and Chronic Hyperglycaemia. Arch. Med. Sci. 2011, 2, 294–303. [Google Scholar] [CrossRef]
- Suryavanshi, S.V.; Kulkarni, Y.A. NF-Κβ: A Potential Target in the Management of Vascular Complications of Diabetes. Front. Pharmacol. 2017, 8, 798. [Google Scholar] [CrossRef] [Green Version]
- Austin, R.L.; Rune, A.; Bouzakri, K.; Zierath, J.R.; Krook, A. SiRNA-Mediated Reduction of Inhibitor of Nuclear Factor-ΚB Kinase Prevents Tumor Necrosis Factor-α–Induced Insulin Resistance in Human Skeletal Muscle. Diabetes 2008, 57, 2066–2073. [Google Scholar] [CrossRef] [PubMed] [Green Version]
- Foresto-Neto, O.; Albino, A.H.; Arias, S.C.A.; Faustino, V.D.; Zambom, F.F.F.; Cenedeze, M.A.; Elias, R.M.; Malheiros, D.M.A.C.; Camara, N.O.S.; Fujihara, C.K.; et al. NF-ΚB System Is Chronically Activated and Promotes Glomerular Injury in Experimental Type 1 Diabetic Kidney Disease. Front. Physiol. 2020, 11, 84. [Google Scholar] [CrossRef] [PubMed]
- Chen, G.; Fan, X.; Zheng, X.; Jin, Y.; Liu, Y.; Liu, S. Human Umbilical Cord-Derived Mesenchymal Stem Cells Ameliorate Insulin Resistance via PTEN-Mediated Crosstalk between the PI3K/Akt and Erk/MAPKs Signaling Pathways in the Skeletal Muscles of Db/Db Mice. Stem Cell Res. Ther. 2020, 11, 401. [Google Scholar] [CrossRef] [PubMed]


Disclaimer/Publisher’s Note: The statements, opinions and data contained in all publications are solely those of the individual author(s) and contributor(s) and not of MDPI and/or the editor(s). MDPI and/or the editor(s) disclaim responsibility for any injury to people or property resulting from any ideas, methods, instructions or products referred to in the content. |
© 2023 by the authors. Licensee MDPI, Basel, Switzerland. This article is an open access article distributed under the terms and conditions of the Creative Commons Attribution (CC BY) license (https://creativecommons.org/licenses/by/4.0/).
Share and Cite
Khokhar, M.; Purohit, P.; Tomo, S.; Agarwal, R.G.; Gadwal, A.; Bajpai, N.K.; Bohra, G.K.; Shukla, R.K. PTEN, MMP2, and NF-κB and Regulating MicroRNA-181 Aggravate Insulin Resistance and Progression of Diabetic Nephropathy: A Case-Control Study. Kidney Dial. 2023, 3, 121-138. https://doi.org/10.3390/kidneydial3010011
Khokhar M, Purohit P, Tomo S, Agarwal RG, Gadwal A, Bajpai NK, Bohra GK, Shukla RK. PTEN, MMP2, and NF-κB and Regulating MicroRNA-181 Aggravate Insulin Resistance and Progression of Diabetic Nephropathy: A Case-Control Study. Kidney and Dialysis. 2023; 3(1):121-138. https://doi.org/10.3390/kidneydial3010011
Chicago/Turabian StyleKhokhar, Manoj, Purvi Purohit, Sojit Tomo, Riddhi G. Agarwal, Ashita Gadwal, Nitin Kumar Bajpai, Gopal Krishna Bohra, and Ravindra Kumar Shukla. 2023. "PTEN, MMP2, and NF-κB and Regulating MicroRNA-181 Aggravate Insulin Resistance and Progression of Diabetic Nephropathy: A Case-Control Study" Kidney and Dialysis 3, no. 1: 121-138. https://doi.org/10.3390/kidneydial3010011