1. Introduction
The severe acute respiratory syndrome coronavirus-2 (SARS-CoV-2) was first reported in Wuhan City, Hubei province, China, on 31 December 2019, following an investigation of a cluster of adults with pneumonia of unexplained etiology. A local seafood market and wet animal market were identified as potential epicenters for the outbreak. The SARS-CoV-2 virus underwent full-length genomic sequencing and was found to be 96% identical to a bat coronavirus and also shared 79.6% sequence identity with SARS-CoV [
1]. Community spread of the virus occurred via exposure to droplets or direct contact with symptomatic and asymptomatic individuals [
2]. The virus gradually spread throughout China before being transmitted globally. It was eventually declared a worldwide pandemic by the World Health Organization (WHO) on 11 March 2020 [
3]. The term COVID-19 is used for the clinical disease caused by the novel coronavirus [
3,
4].
Polymerase chain reaction (PCR) performed on respiratory secretions is the test of choice to make the diagnosis of COVID-19. However, PCR was initially expensive and a scarce resource. Thus, early in the pandemic, PCR was largely reserved for symptomatic persons or individuals with known exposure. Many people, especially children, with SARS-CoV-2 infections who were asymptomatic or had mild symptoms were not tested. This led to a consensus among experts that PCR was inadequate in identifying the true prevalence of SARS-CoV-2 infections. An alternative form of testing was needed to better identify individuals who were asymptomatic, who had only mild symptoms, or were previously infected but tested negative by PCR after viral clearance. It was also postulated that these patients could be potential donors of convalescent plasma, which was theorized to be a life-saving therapy. Unfortunately, meta-analyses have shown that convalescent plasma is not an optimal treatment choice for COVID-19 [
5,
6].
Infection with SARS-CoV-2 produces both cell-mediated and humoral immune response, with production of antibodies against the spike (S) proteins and the nucleocapsid (N) protein. Studies in 2020 demonstrated that at >14 days after the onset of symptoms, anti-N showed 100% sensitivity and specificity, and anti-S was 91% and 100%, respectively [
7]. Early in the COVID-19 pandemic, vaccines targeting SARS-CoV-2 were directed against the spike protein, making the anti-S antibody a useful surrogate for immunity against COVID-19, but less useful for determining prior infection in the setting of prior vaccination.
Serologic antibody testing was first used in the epidemiological tracing of contacts to PCR-positive individuals to establish links between cluster outbreaks for the novel coronavirus in Singapore [
2]. Antibody-based testing directed against spike (S) and nucleocapsid (N) protein of the novel coronavirus are the main immunogens studied as markers of exposure and recovery from the infection [
8]. The 3 antibody classes studied against these immunogens are IgG, IgM, and IgA. In infected persons, antibodies against N-protein were detected as early as the fourth day of illness and persisted for at least 30 days [
9]. In another study, the cumulative seropositive rate using total antibody levels reached 50% on the eleventh day and 100% on day 39 from the onset of illness [
10].
West Virginia was a unique state in the early stages of the COVID-19 pandemic, as it was the last in the nation to have a PCR-positive case of SARS-CoV-2. Social distancing measures were well in place before there was increased disease circulation. With serologic testing, this study team intended to estimate the prevalence in West Virginia of infection in close contacts of known positive cases.
2. Materials and Methods
2.1. Study Population and Setting
This was a single-center, cross-sectional study conducted from 13 August 2020 to 10 August 2021. Potential index cases were identified in the WVU Health Systems database by searching for patients who had tested positive for SARS-CoV-2 between 20 March 2020 and 15 May 2021. All index case participants were surveyed to identify household or close contacts.
2.2. Inclusion and Exclusion Criteria
To be included in this study, a patient had to either: (1) have a positive SARS-CoV-2 PCR test in the WVU Health System within the last 12-months, or (2) qualify as a household or close contact. The index case was defined as the first PCR-positive subject in a household. A household contact included anyone living in the home of an index case within 2 weeks of the diagnosis. Close contacts were defined as any other person who was ≤6 feet from an index case for ≥1 h in the 2 weeks prior to the index cases’ diagnosis. Household contacts and close contacts were identified by surveying index cases who were agreeable to the study; all index cases, household contacts, and close contacts provided age-appropriate consent or assent. Exclusion criteria included prior SARS-CoV-2 antibody testing, refusal to provide consent or assent, participants who were deceased, or those who did not meet the inclusion criteria for being a close contact or household contact. All household contacts and close contacts were considered to be “exposed” to the index case.
2.3. Data Collection and Serologic Testing
Included individuals were surveyed for high-risk SARS-CoV-2 chronic conditions and for symptoms related to a SARS-CoV-2 infection. High-risk conditions included in this survey were hypertension, diabetes mellitus, cystic fibrosis, asthma, cardiac disease, and obesity. Symptoms that were included in the survey included fatigue, anorexia, anosmia, ageusia, conjunctivitis, eye discharge, rash, rhinorrhea, cough, sore throat, diarrhea, abdominal pain, and vomiting.
All patients underwent serologic testing for IgG against N-protein utilizing the Abbott ARCHITECT i2000 SR immunoassay analyzer. N-Protein is positive in true infection but not vaccination due to vaccinations being directed towards S-Protein [
7]. Specimens underwent incubation with microparticle beads coated with SARS-CoV-2 nucleocapsid antigen followed by a wash step. A chemiluminescent reporter-tagged reagent antibody was then incubated with the specimen and was followed by a second wash. An oxidizing reagent was then added to generate a chemiluminescent signal. Raw data in relative light units (RLU) were then compared to an assay calibrator, and an index (signal-to-cutoff ratio) was generated. An index result < 1.40 (for IgG) was considered non-reactive or negative and ≥1.40 (for IgG) was considered reactive or positive.
Statistical Analysis: Categorical variables are presented as frequency and percentages, and continuous variables as means and standard deviations (SD). Sensitivity, specificity, positive predictive value (PPV), and negative predictive value (NPV) were calculated using standard definitions [
11]. For calculating sensitivity and specificity, PCR positive and seropositive cases were considered true positive. The Chi-square test was performed for all bivariate associations. Alpha was set to 0.05. All data were analyzed using SAS.
3. Results
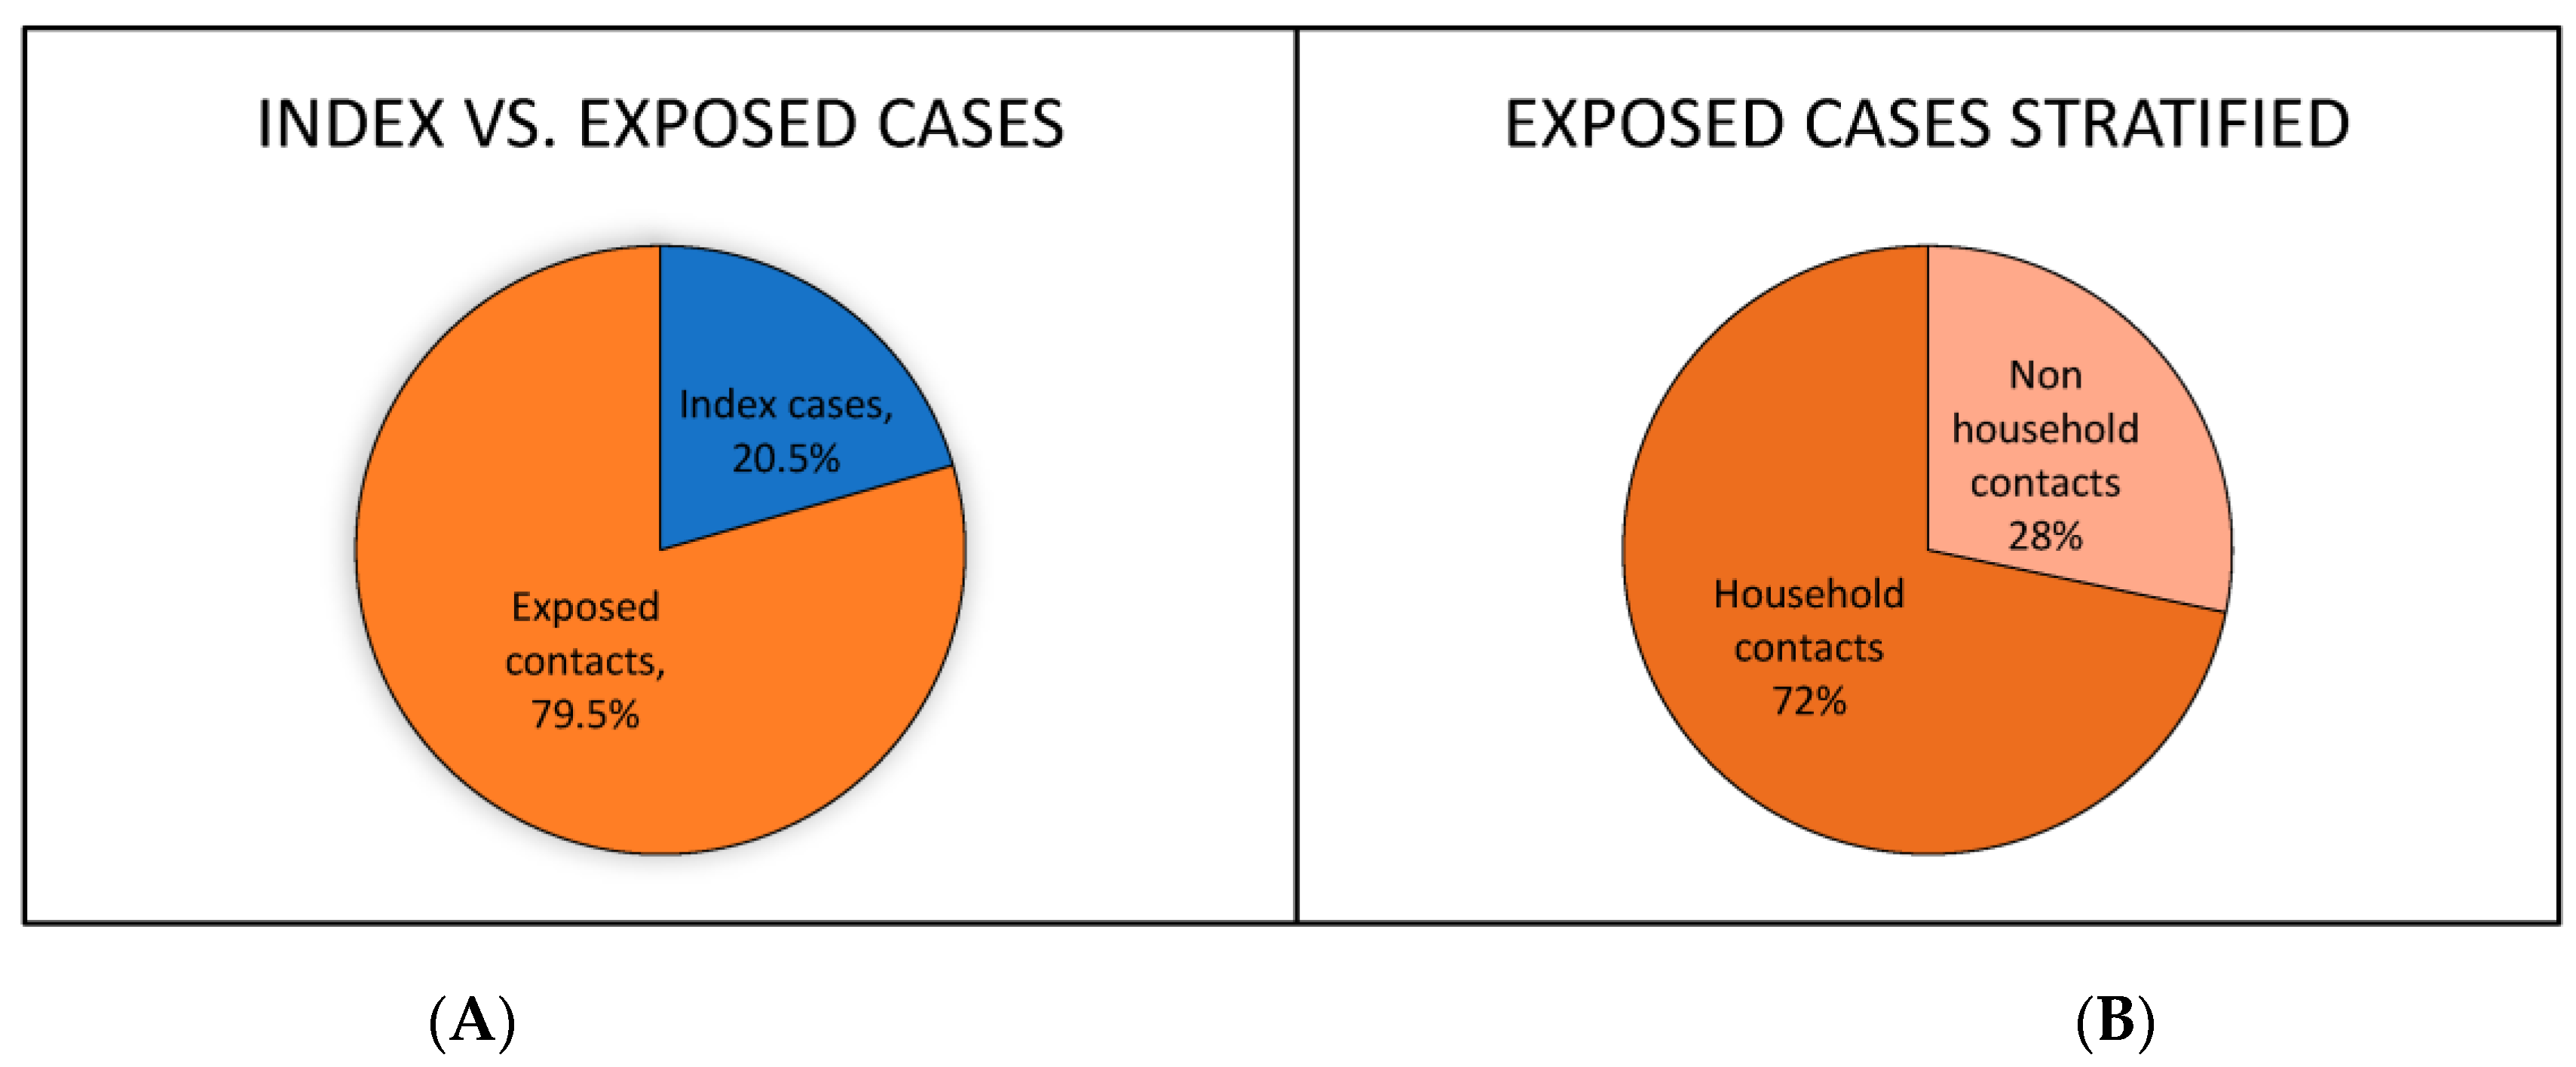
One hundred and thirteen participants were recruited during the study period. A majority of the participants were from Monongalia County, WV (44.6%), and Berkeley County, WV (46.4%); ages ranged from 2 y.o. to 77 y.o. (mean of 41 y.o.). The study population comprised 20.5% index cases and 79.5% exposed contacts (
Figure 1A).
Exposed contacts were further divided into 72% household contacts and 28% non-household contacts (
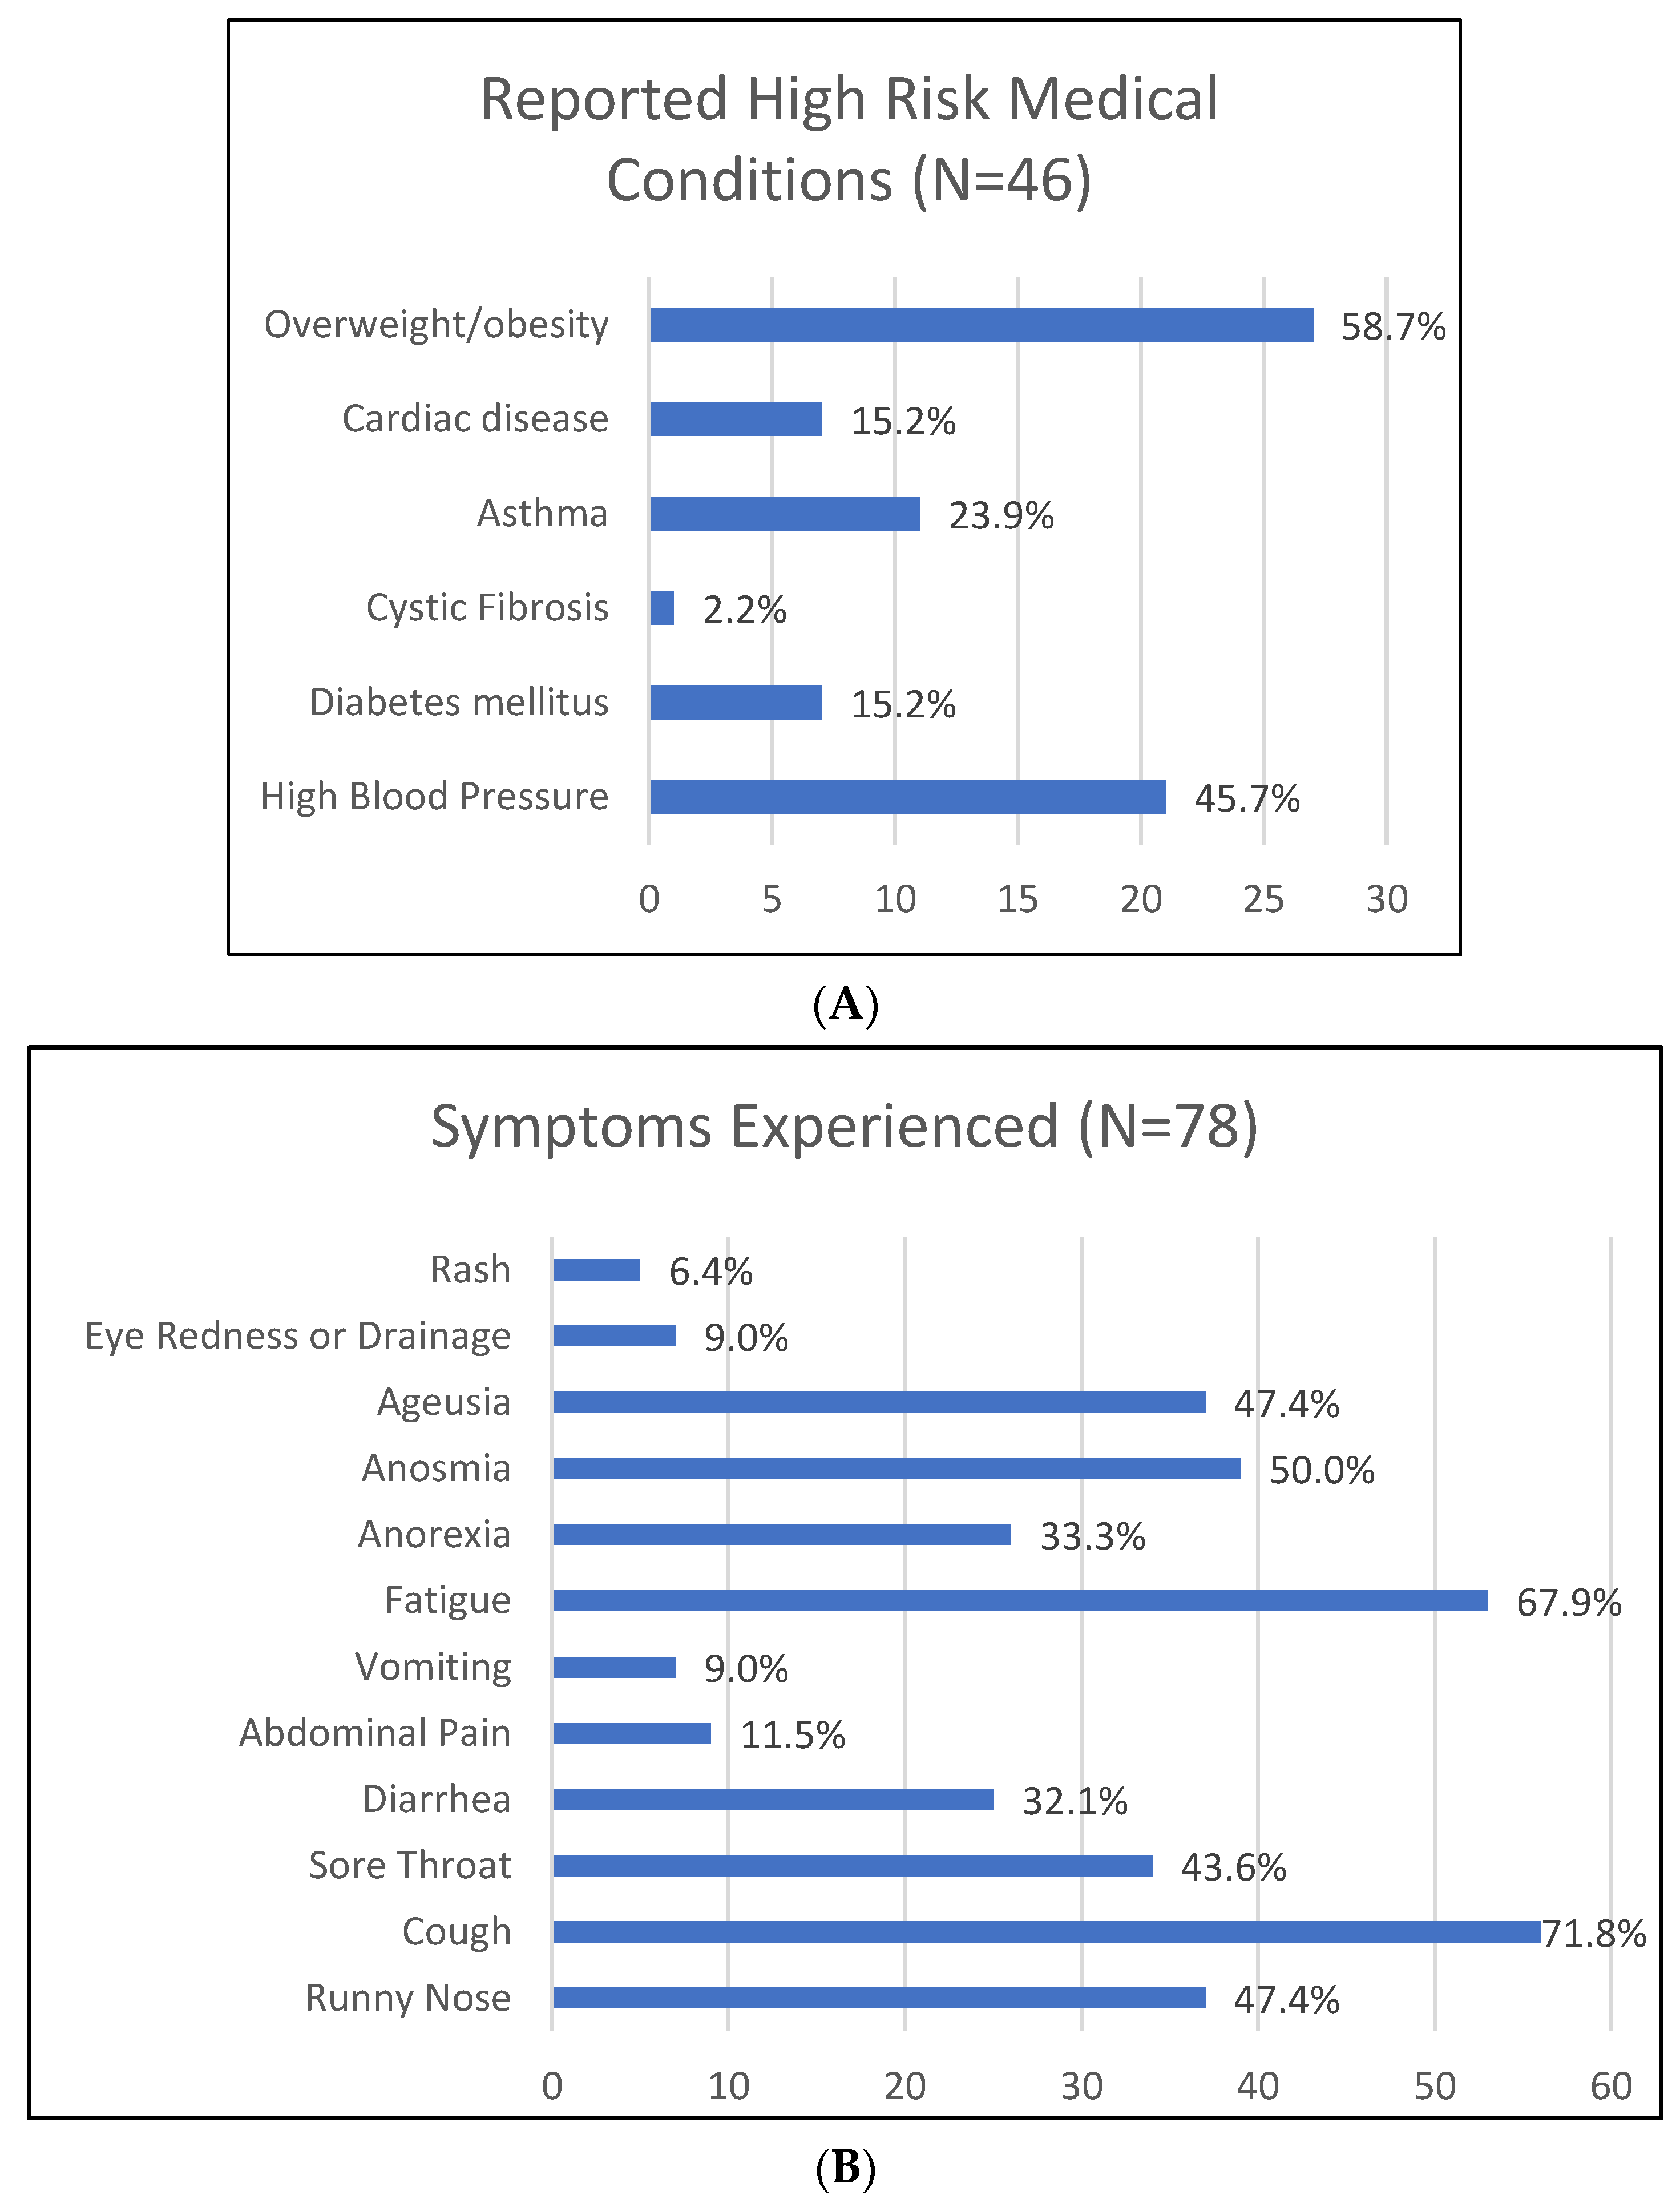
Figure 1B). A significant minority (40.9%) of participants reported a chronic condition that qualified them as high risk for complications related to SARS-CoV-2 infection. The most frequently reported conditions were obesity and hypertension at 24.0% and 18.7%, respectively (
Figure 2A).
Thirty percent of exposed contacts (household and non-household contacts) had never experienced symptoms of a SARS-CoV-2 infection; among those who did report symptoms, the most prevalent were cough (71.8%), fatigue (67.9%), anosmia (50%), and ageusia (47.4%) (
Figure 2B).
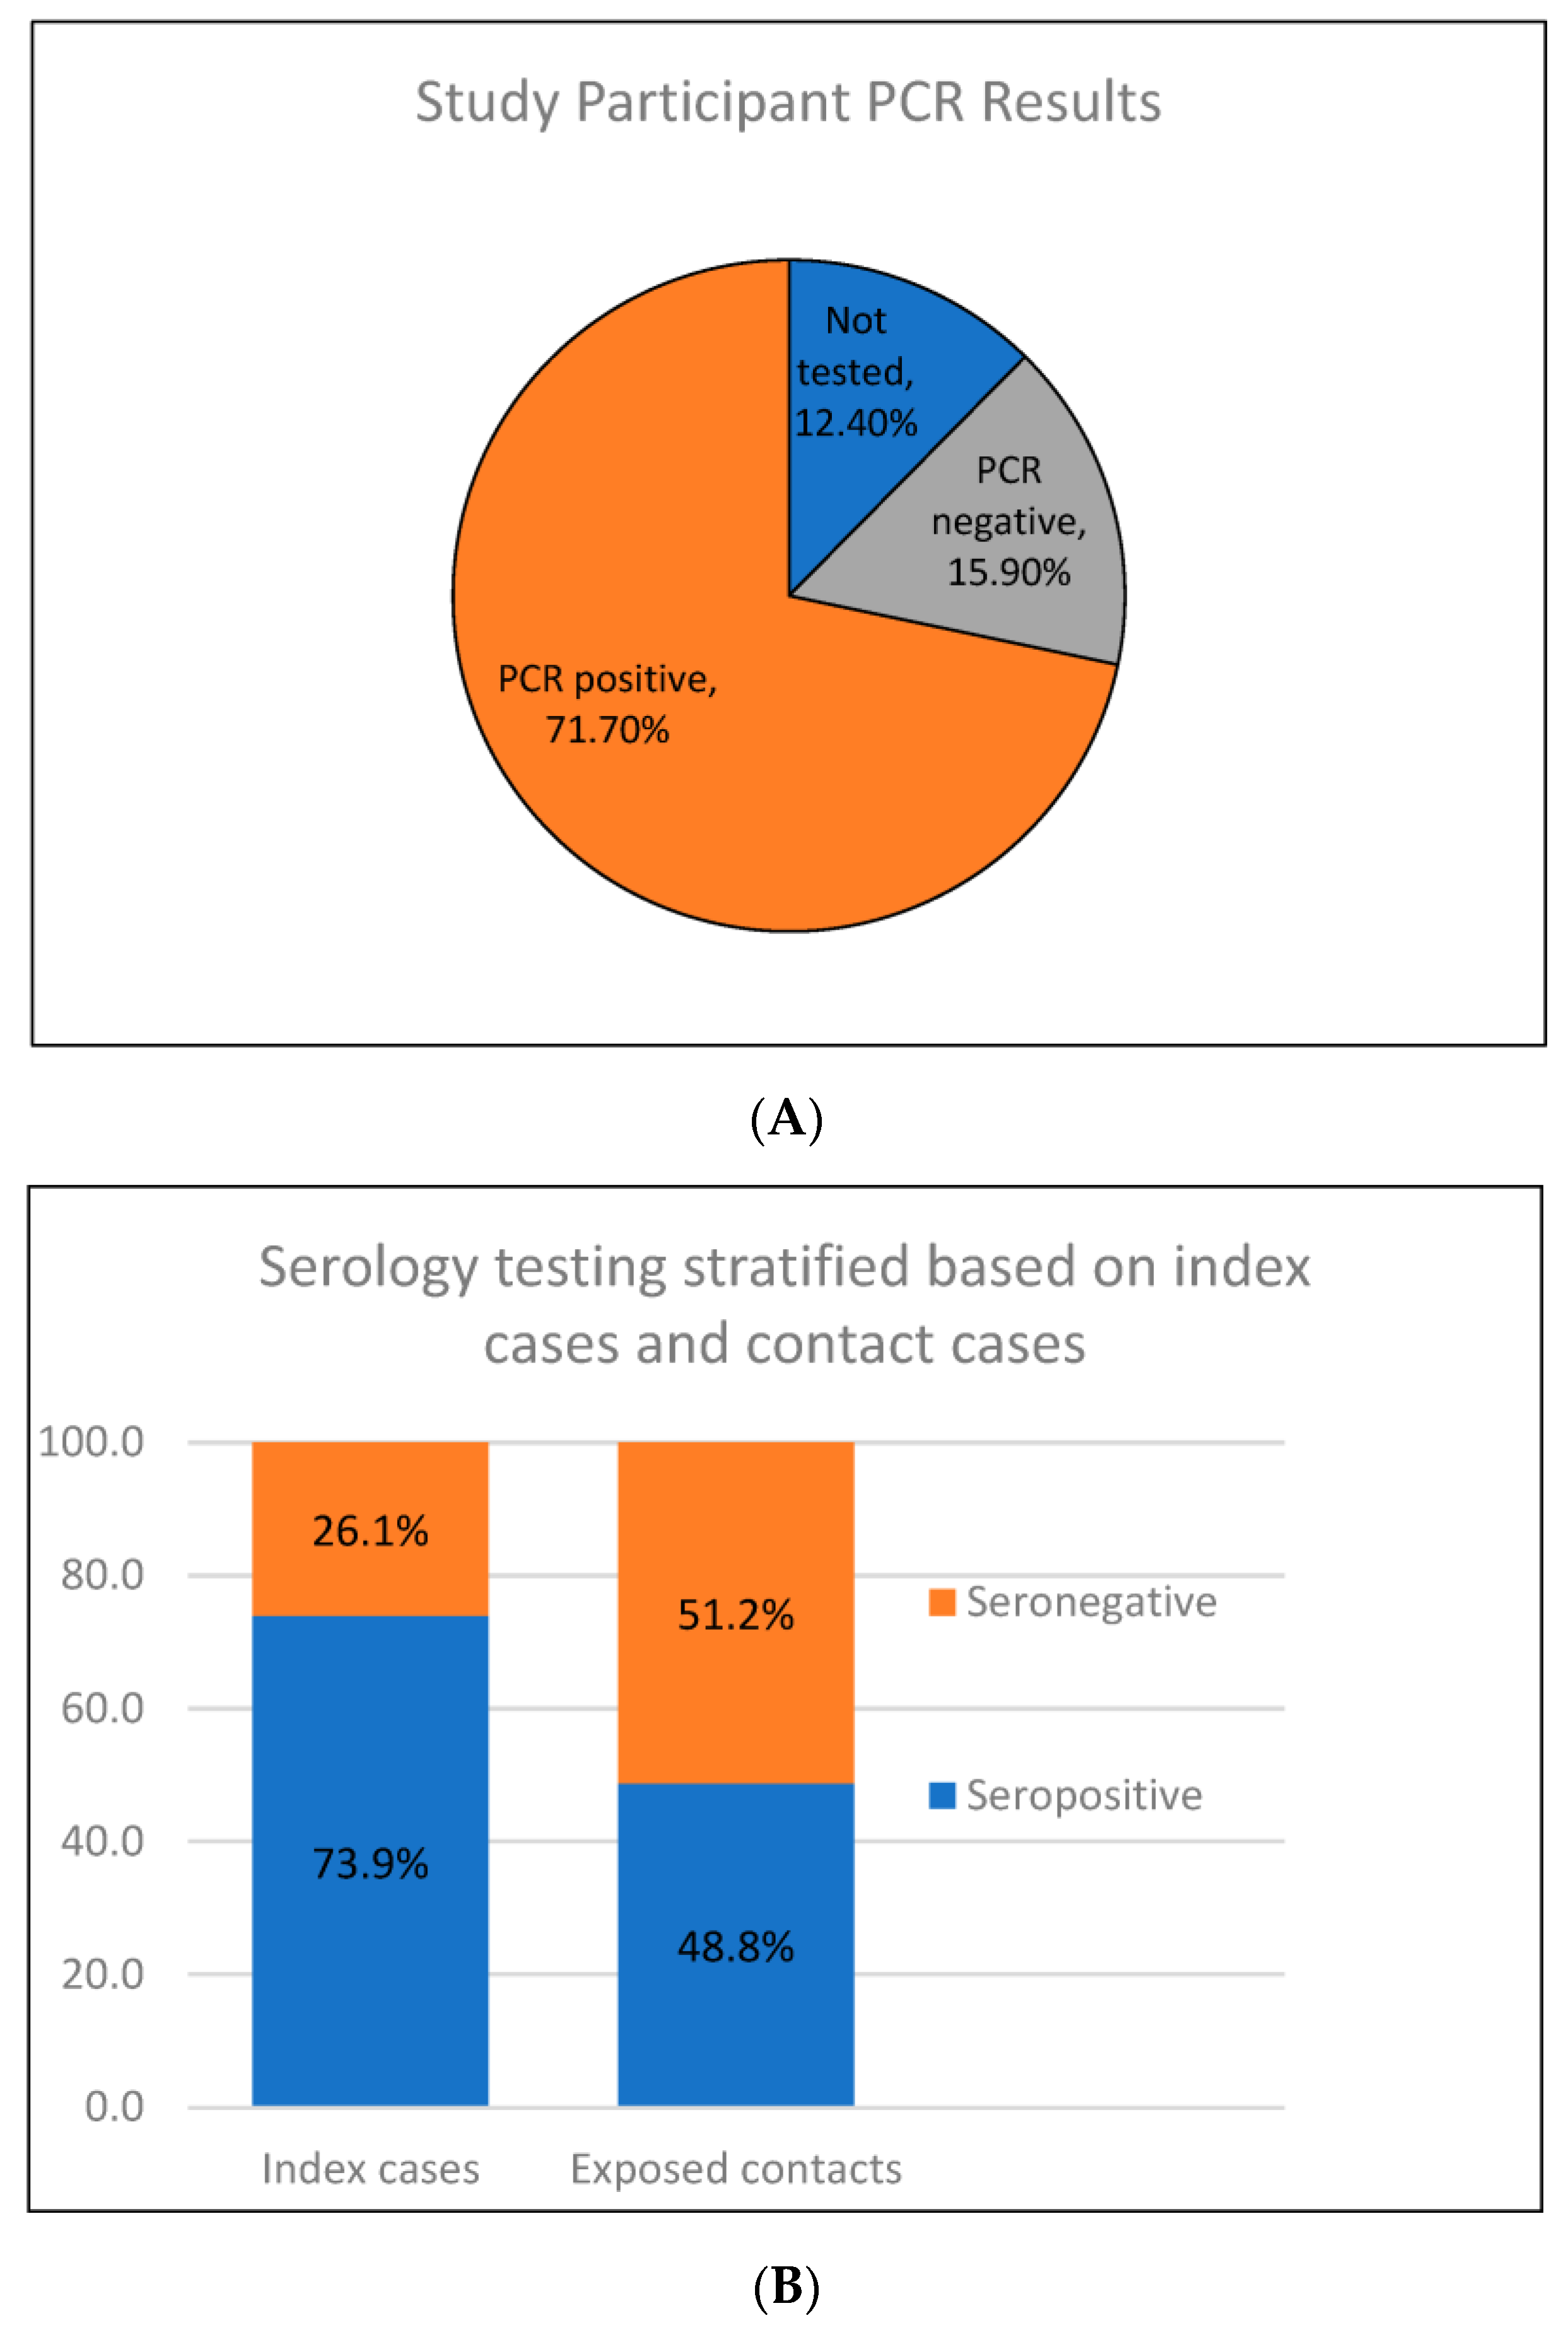
When evaluating the history of SARS-CoV-2 testing in contacts, 71.7% previously had a PCR-positive SARS-CoV-2 infection; 15.9% had been tested but PCR negative and the remaining 12.4% had never been tested (
Figure 3A). Serologic testing was 65.0% sensitive and 78.9% specific, with a positive predictive value (PPV) of 92.9% and a negative predictive value (NPV) of 34.9%. Broadly, 50.4% of all participants were seropositive and 49.6% of participants were seronegative (
Figure 3B).
When further stratified, 73.9% of index cases were seropositive vs. 48.8% of contacts (
p = 0.01) (
Figure 3B). The study team also identified 1 seropositive contact that had never been PCR tested and four that were PCR-negative previously, indicating previously unrecognized infections with seroconversion. When comparing household to non-household contacts, there was no statistical significance in seropositivity at 53.1% vs. 43.8%, respectively (
p = 0.04).
4. Discussion
Serologic testing for IgG against N-protein had a relatively low sensitivity (65.0%) and specificity (78.9%). The PPV was 92.9% but there was a low NPV (34.9%). Sensitivity and specificity may have been low compared to other published data for a variety of reasons. The subjects tested were likely first-time COVID-19 infections, which may evoke a less robust antibody response than repeat infections.
One study showed that anti-N IgG antibody levels wane with time, particularly in asymptomatic patients. In total, 90.7% of this study’s subjects who had pneumonia were seropositive at 3 months, but IgG seropositivity waned to 62.3% at 6 months and 36.7% at 9 months. In asymptomatic patients, 86.7% of subjects were seropositive at 3 months, but this waned to 32.4% at 6 months and then 19.6% at 3 months [
12]. The lag time between PCR and serologic testing in our study ranged from 3 months to 7 months which may have had some effect on discordance between PCR and serologic testing.
We could identify no studies of anti-N IgG seropositivity in immunodeficient patients after a SARS-CoV-2 infection. However, the COVID-19 Vaccination in the Immunocompromised Study (COVICS) and SARS-CoV-2 Vaccine Responses in Individuals with Antibody Deficiency (COV-AD) study support the hypothesis that there is a suppressed humoral response to SARS-CoV-2 vaccination in immunodeficient patients in the absence of a known history of COVID-19 infection [
13,
14]. These data suggest that immunodeficient patients have a poor humoral response to the SARS-CoV-2 spike proteins, which may suggest suppressed anti-N IgG seroconversion in the setting of true infection.
This study highlights the importance of serology in addition to PCR in identifying the true disease burden of SARS-CoV-2 in a population. The study team identified 5 subjects who were seropositive but had previously either tested negative by PCR or had not been tested for SARS-CoV-2. These represent SARS-CoV-2 infections that were otherwise unrecognized. This is despite the low sensitivity and specificity of the test, which, if improved, may detect a larger volume of previously unrecognized infections.
The seropositive rates of household contacts and non-household contacts were also similar, proposing that this study’s criteria for identifying high-risk contacts can be utilized for future studies. Despite the anti-N IgG seroconversion rate of 48% in close contacts, this assay may be useful in identifying post-COVID-19 infection in those patients who had been previously vaccinated and are being evaluated for long-term post-COVID-19 syndromes.
The data herein are further supported by the estimated overall prevalence of the disease from August 2020 to August 2021 (4.9–9.0%, per the CDC) [
15]. This further suggests that seropositivity in the study’s close-contact population was likely related to exposure to an index case rather than being due to an infection acquired elsewhere in the community. The study’s limitations include the small sample size as well as participants’ subjective reporting of the level of contact to an index case that likely led to some degree of recall bias. The time between initial PCR testing and serologic testing (3 to 7 months) may have also led to discordant results, but this is considered less likely given the narrow range of months between PCR and serology.
West Virginia was the latest of the states to be affected by the pandemic, and it is likely that all of the index cases had experienced their first infection with SARS-CoV-2. It is possible that with repeat infection, the N-protein antibody may increase or be sustained for a longer duration.
5. Conclusions
This study supports the use of IgG testing against N-protein of SARS-CoV-2 virus for identifying subjects who have had a mild or asymptomatic SARS-CoV-2 infection. This may help identify the true burden of disease in a region. Based on prior studies, the optimal time to test patients is approximately 3 months from the initial exposure to maximize the number of true infections captured before IgG seropositivity begins to wane [
12]. More than half of all identified close contacts were seropositive and there was no significant difference in SARS-CoV-2 seropositivity among household contacts vs. non-household contacts.
Author Contributions
Conceptualization, S.G., K.M. and M.W.; methodology, S.G., K.M. and M.W.; software, A.U.; validation, A.U., S.G., C.W. and G.K.; formal analysis, A.U.; investigation, S.G., K.M. and M.W.; data curation, S.G.; writing—original draft preparation, C.W. and G.K.; writing—review and editing, S.G., K.M. and M.W.; visualization, G.K.; supervision, S.G. and M.W.; funding acquisition, S.G., K.M. and M.W. All authors have read and agreed to the published version of the manuscript.
Funding
This research was funded by a pilot grant through the West Virginia Clinical & Translational Science Institute (WVCTSI) Idea CTR support—NIH/NIGMS Award Number 5U54GM104942-03.
Institutional Review Board Statement
The study was conducted in accordance with the Declaration of Helsinki and approved by the Institutional Review Board of West Virginia University (WVU) (Protocol number #2005011955).
Informed Consent Statement
Informed consent was obtained from all subjects involved in the study. All adult participants (≥18 y.o.) provided written consent, and all pediatric participants (≤17 y.o.) provided written assent along with written consent from a parent or guardian.
Data Availability Statement
The data presented in this study are available on request from the corresponding author. The data are not publicly available due to our data not being in a public dataset or online.
Conflicts of Interest
The authors declare no conflict of interest. The funders had no role in the design of the study; in the collection, analyses, or interpretation of data; in the writing of the manuscript; or in the decision to publish the results.
References
- Zhou, P.; Yang, X.-L.; Wang, X.-G.; Hu, B.; Zhang, L.; Zhang, W.; Si, H.-R.; Zhu, Y.; Li, B.; Huang, C.-L.; et al. A pneumonia outbreak associated with a new coronavirus of probable bat origin. Nature 2020, 579, 270–273. [Google Scholar] [CrossRef]
- Chan, J.F.; Yuan, S.; Kok, K.H.; To, K.K.; Chu, H.; Yang, J.; Xing, F.; Liu, J.; Yip, C.C.; Poon, R.W.; et al. A familial cluster of pneumonia associated with the 2019 novel coronavirus indicating person-to-person transmission: A study of a family cluster. Lancet 2020, 395, 514–523. [Google Scholar] [CrossRef]
- World Health Organization. WHO Director-General’s Opening Remarks at the Media Briefing on COVID-19—11 March 2020. Available online: https://www.who.int/director-general/speeches/detail/who-director-general-s-opening-remarks-at-the-media-briefing-on-covid-19---11-march-2020 (accessed on 7 November 2022).
- World Health Organization. Coronavirus Disease 2019 (COVID-19) Situation Report—67. Available online: https://www.who.int/docs/default-source/coronaviruse/situation-reports/20200327-sitrep-67-covid-19.pdf (accessed on 7 November 2022).
- Qian, Z.; Zhang, Z.; Ma, H.; Shao, S.; Kang, H.; Tong, Z. The efficiency of convalescent plasma in COVID-19 patients: A systematic review and meta-analysis of randomized controlled clinical trials. Front. Immunol. 2022, 13, 964398. [Google Scholar] [CrossRef] [PubMed]
- Lee, H.J.; Lee, J.H.; Cho, Y.; Ngoc, L.T.N.; Lee, Y.C. Efficacy and Safety of COVID-19 Treatment Using Convalescent Plasma Transfusion: Updated Systematic Review and Meta-Analysis of Randomized Controlled Trials. Int. J. Environ. Res. Public Health 2022, 19, 10622. [Google Scholar] [CrossRef] [PubMed]
- Burbelo, P.D.; Riedo, F.X.; Morishima, C.; Rawlings, S.; Smith, D.; Das, S.; Strich, J.R.; Chertow, D.S.; Davey, R.T.; Cohen, J.I. Sensitivity in Detection of Antibodies to Nucleocapsid and Spike Proteins of Severe Acute Respiratory Syndrome Coronavirus 2 in Patients with Coronavirus Disease 2019. J. Infect. Dis. 2020, 222, 206–213. [Google Scholar] [CrossRef] [PubMed]
- Okba, N.M.A.; Müller, M.A.; Li, W.; Wang, C.; GeurtsvanKessel, C.H.; Corman, V.M.; Lamers, M.M.; Sikkema, R.S.; De Bruin, E.; Chandler, F.D.; et al. Severe Acute Respiratory Syndrome Coronavirus 2-Specific Antibody Responses in Coronavirus Disease Patients. Emerg. Infect. Dis. 2020, 26, 1478–1488. [Google Scholar] [CrossRef] [PubMed]
- Xiang, F.; Wang, X.; He, X.; Peng, Z.; Yang, B.; Zhang, J.; Zhou, Q.; Ye, H.; Ma, Y.; Li, H.; et al. Antibody Detection and Dynamic Characteristics in Patients with Coronavirus Disease 2019. Clin. Infect. Dis. 2020, 71, 1930–1934. [Google Scholar] [CrossRef] [PubMed]
- Zhao, J.; Yuan, Q.; Wang, H.; Liu, W.; Liao, X.; Su, Y.; Wang, X.; Yuan, J.; Li, T.; Li, J.; et al. Antibody Responses to SARS-CoV-2 in Patients with Novel Coronavirus Disease 2019. Clin. Infect. Dis. 2020, 71, 2027–2034. [Google Scholar] [CrossRef] [PubMed]
- Trevethan, R. Sensitivity, Specificity, and Predictive Values: Foundations, Pliabilities, and Pitfalls in Research and Practice. Front. Public Health 2017, 5, 307. [Google Scholar] [CrossRef]
- Chansaenroj, J.; Yorsaeng, R.; Posuwan, N.; Puenpa, J.; Wanlapakorn, N.; Sudhinaraset, N.; Sripramote, M.; Chalongviriyalert, P.; Jirajariyavej, S.; Kiatpanabhikul, P.; et al. Long-term specific IgG response to SARS-CoV-2 nucleocapsid protein in recovered COVID-19 patients. Sci. Rep. 2021, 11, 23216. [Google Scholar] [CrossRef] [PubMed]
- Shields, A.M.; Faustini, S.E.; Hill, H.J.; Al-Taei, S.; Tanner, C.; Ashford, F.; Workman, S.; Moreira, F.; Verma, N.; Wagg, H.; et al. SARS-CoV-2 Vaccine Responses in Individuals with Antibody Deficiency: Findings from the COV-AD Study. J. Clin. Immunol. 2022, 42, 923–934. [Google Scholar] [CrossRef] [PubMed]
- Haidar, G.; Agha, M.; Bilderback, A.; Lukanski, A.; Linstrum, K.; Troyan, R.; Rothenberger, S.; McMahon, D.K.; Crandall, M.D.; Sobolewksi, M.D.; et al. Prospective Evaluation of Coronavirus Disease 2019 (COVID-19) Vaccine Responses Across a Broad Spectrum of Immunocompromising Conditions: The COVID-19 Vaccination in the Immunocompromised Study (COVICS). Clin. Infect. Dis. 2022, 75, e630–e644. [Google Scholar] [CrossRef]
- Centers for Disease Control and Prevention. CDC Covid Data Tracker. Available online: https://covid.cdc.gov/covid-data-tracker/#national-lab (accessed on 7 November 2022).
| Disclaimer/Publisher’s Note: The statements, opinions and data contained in all publications are solely those of the individual author(s) and contributor(s) and not of MDPI and/or the editor(s). MDPI and/or the editor(s) disclaim responsibility for any injury to people or property resulting from any ideas, methods, instructions or products referred to in the content. |
© 2023 by the authors. Licensee MDPI, Basel, Switzerland. This article is an open access article distributed under the terms and conditions of the Creative Commons Attribution (CC BY) license (https://creativecommons.org/licenses/by/4.0/).

 ,
, 


