

Population-Based Model of the Fraction of Incidental COVID-19 Hospitalizations during the Omicron BA.1 Wave in the United States


Abstract
:1. Introduction
2. Materials and Methods
2.1. Defining the Fraction of Incidental COVID Hospitalizations,
2.2. Rendering , the Fraction of Incidental Hospitalizations, as a Function of Observables
2.3. Rendering , the Prevalence of COVID-19, as a Function of Observables
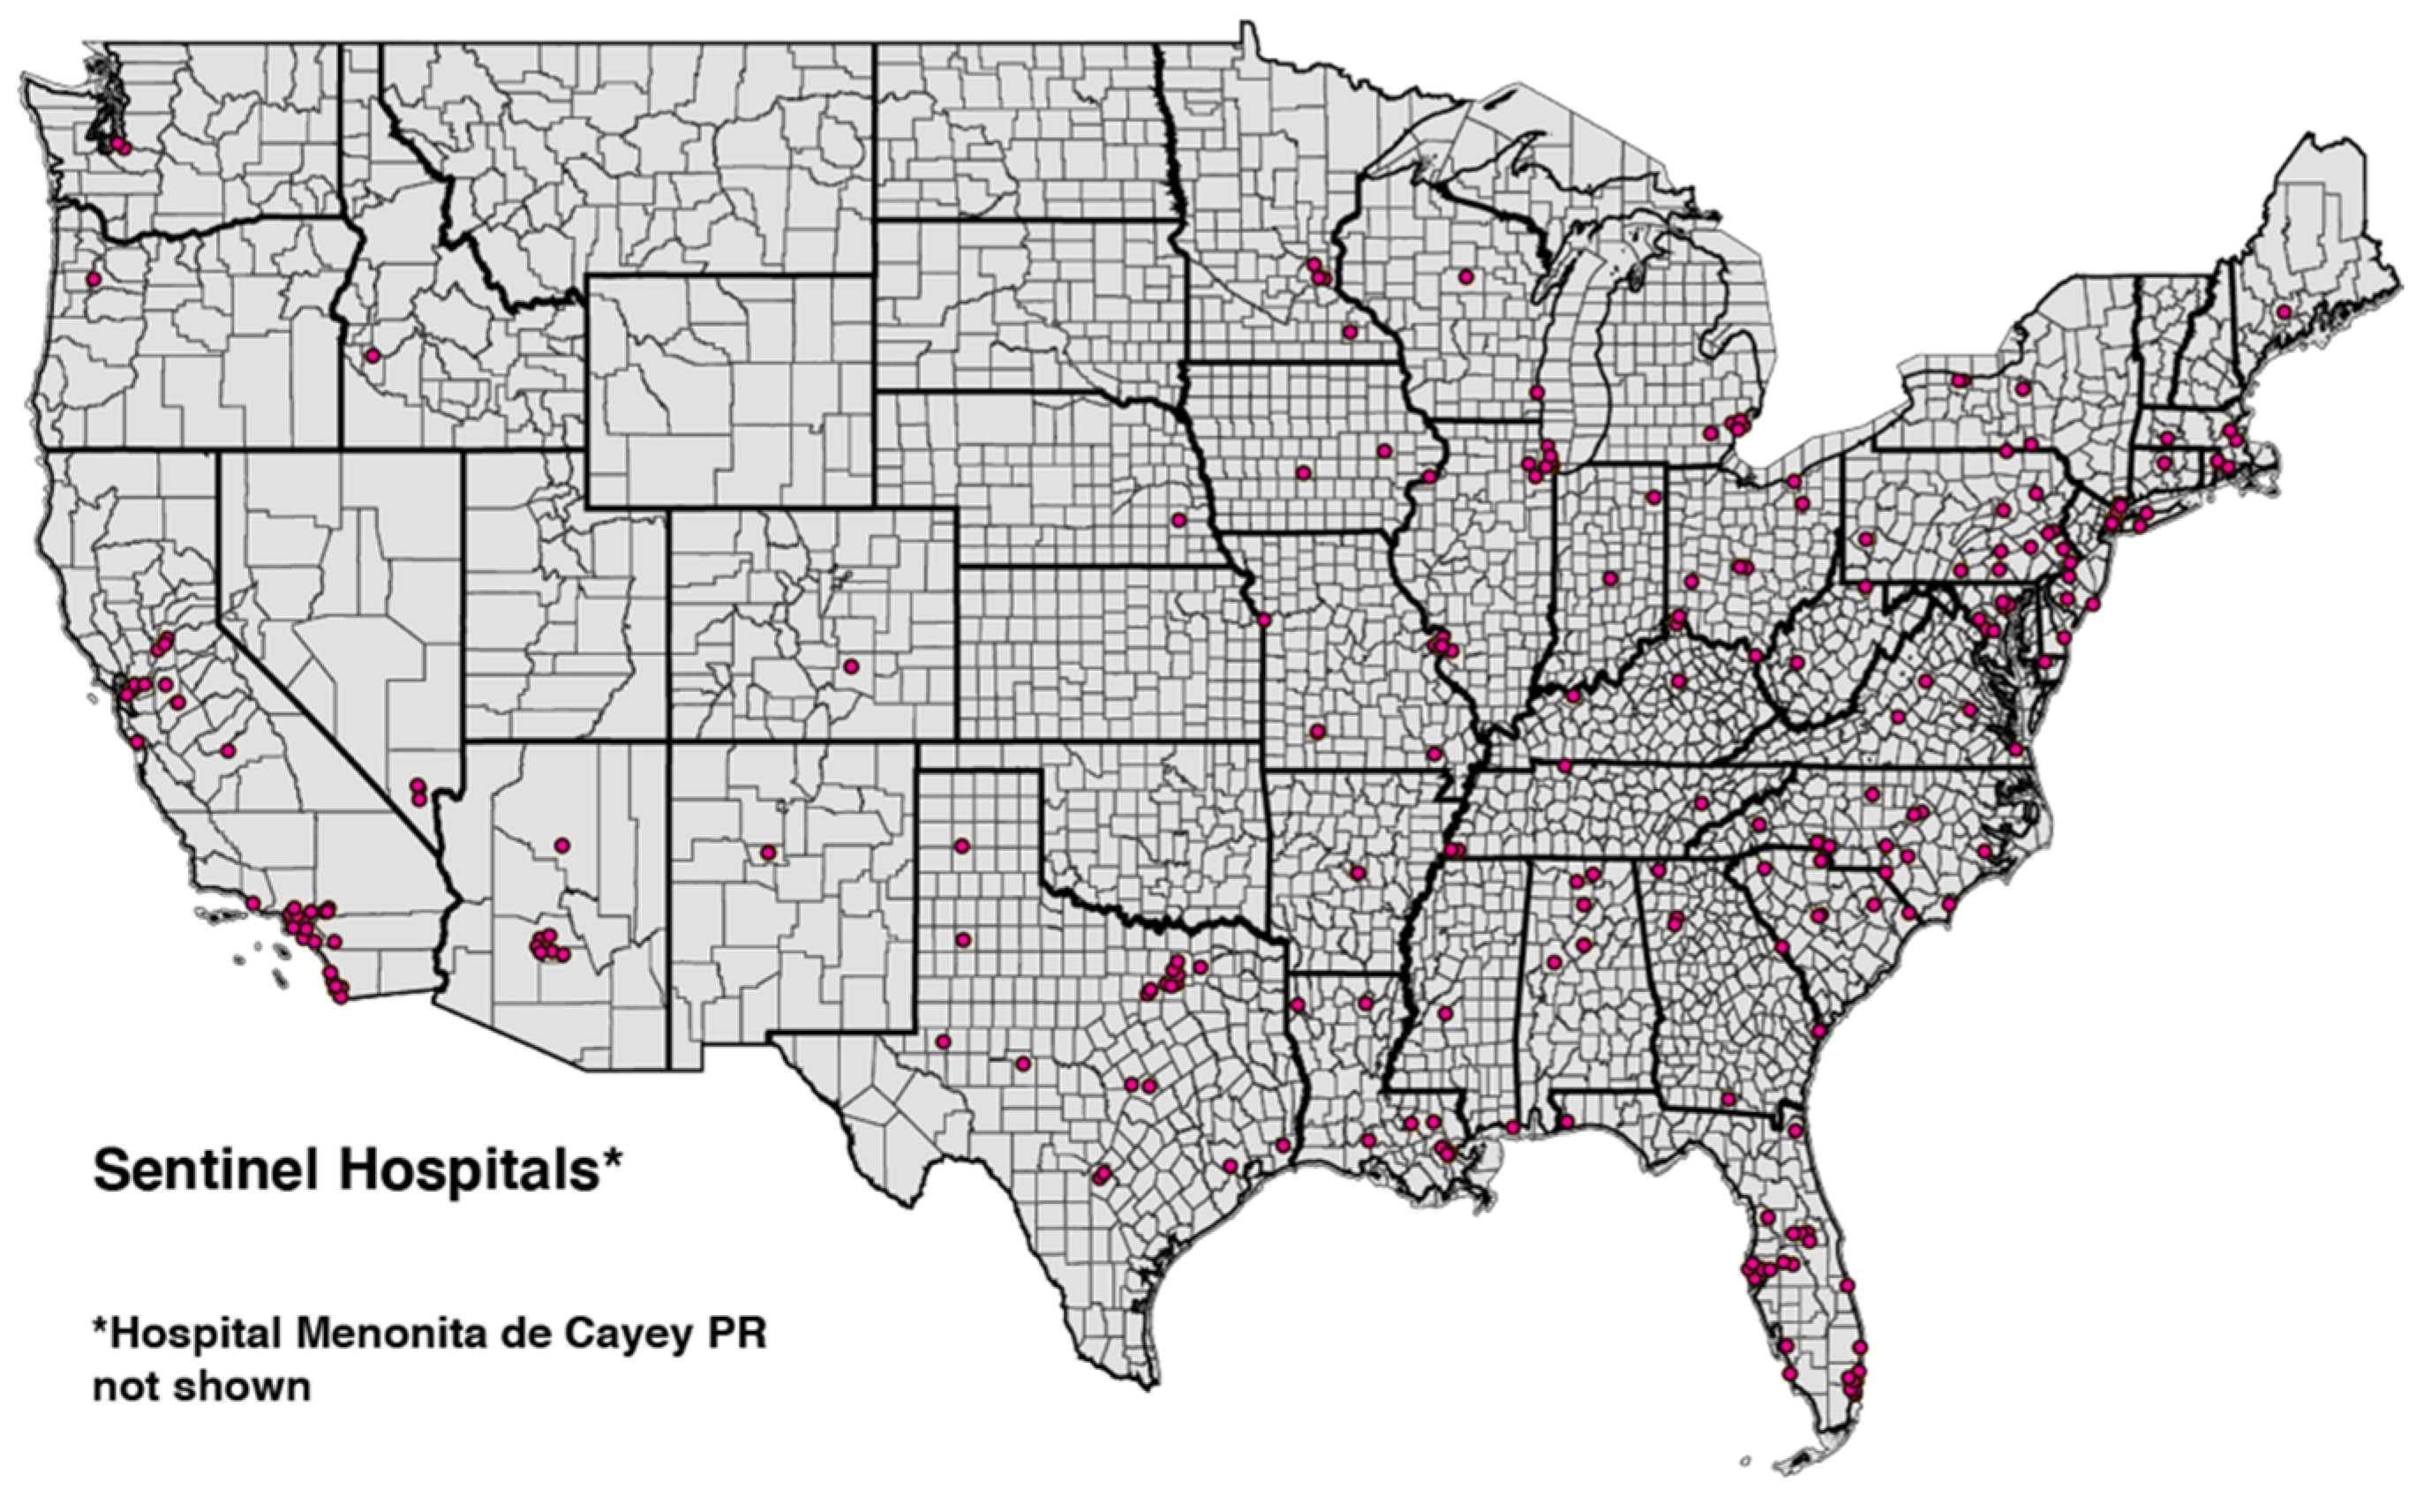
2.4. Data: Cohort of 250 High-COVID-Volume Hospitals
- inpatient_beds_used_7_day_avg, defined as “Average of total number of staffed inpatient beds that are occupied reported during the 7-day period”.
- total_adult_patients_hospitalized_confirmed_covid_7_day_avg, defined as “Average number of patients currently hospitalized in an adult inpatient bed who have laboratory-confirmed COVID-19, including those in observation beds. This average includes patients who have both laboratory-confirmed COVID-19 and laboratory-confirmed influenza”.
- total_pediatric_patients_hospitalized_confirmed_and_suspected_covid_7_day_avg, defined as “Average number of patients currently hospitalized in a pediatric inpatient bed, including NICU, PICU, newborn, and nursery, who are suspected or laboratory-confirmed-positive for COVID-19. This average includes those in observation beds reported in the 7-day period”.
2.5. Estimating , the Fraction of Hospitalized Patients Who Are COVID-Positive
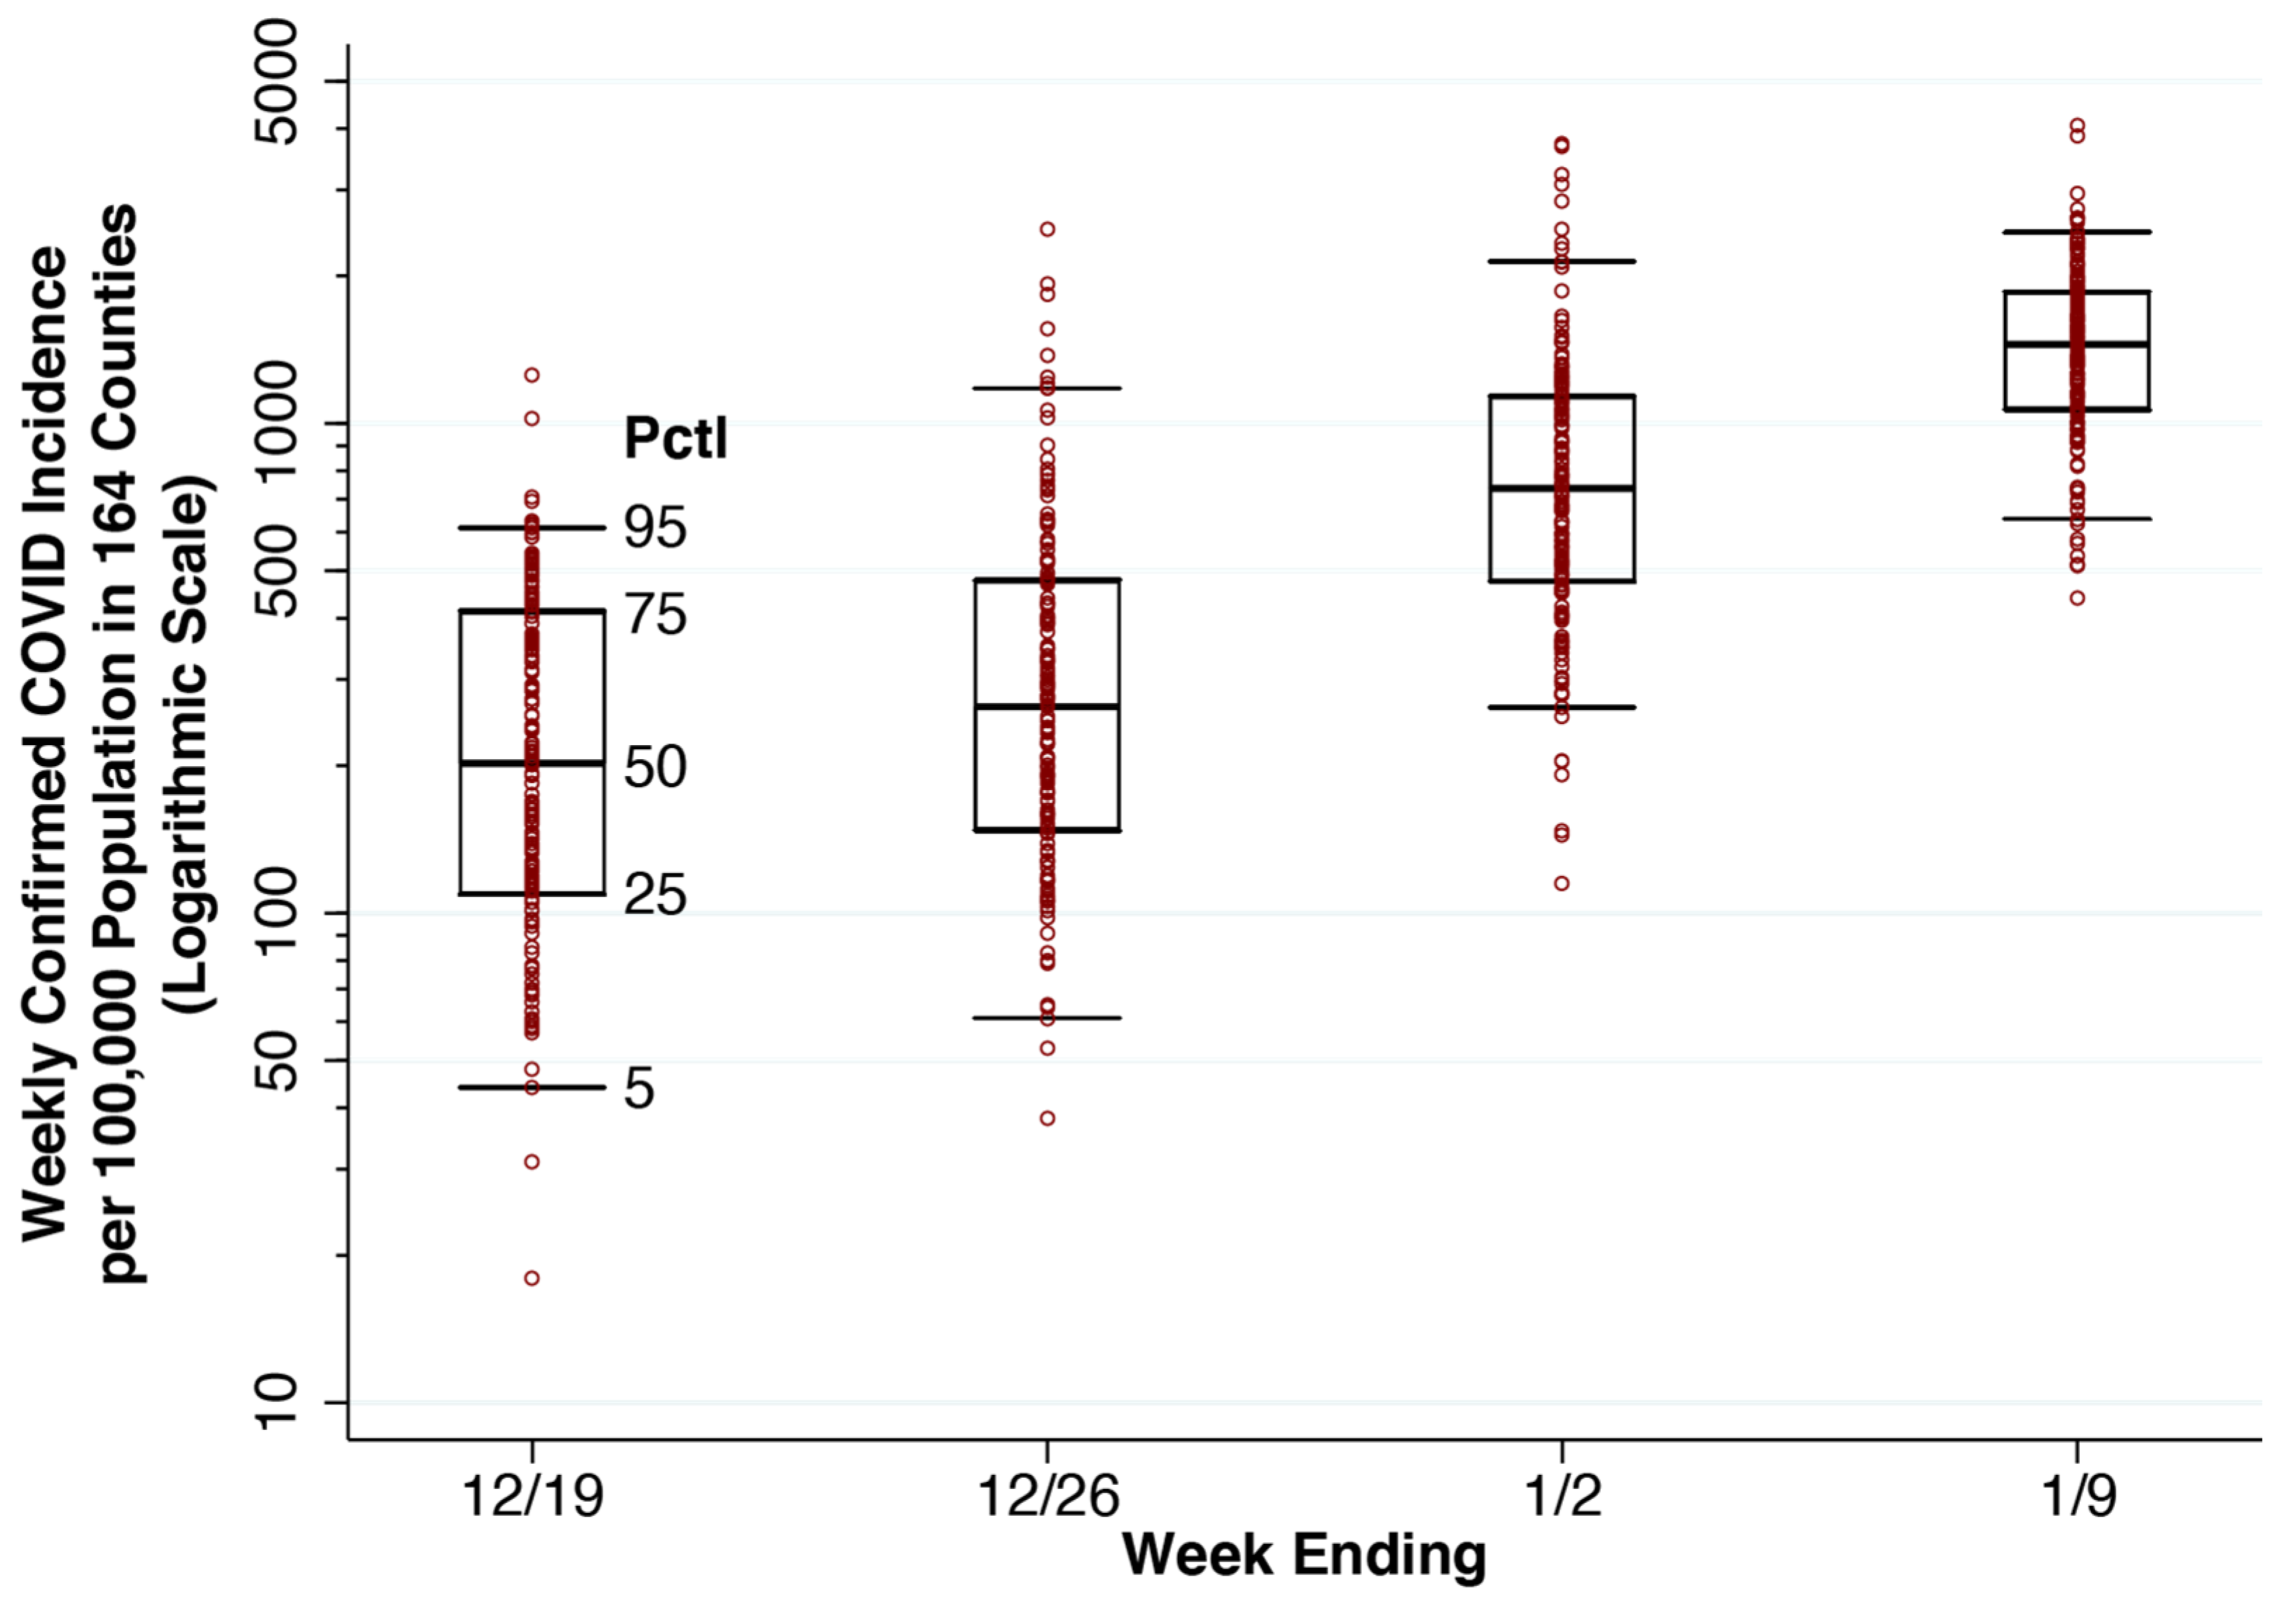
2.6. Data: Confirmed COVID Incidence in 164 Counties
2.7. Estimating the Exponential Rate of Increase in COVID Incidence, , and Reported COVID Incidence,
2.8. Estimating the Fraction of COVID-19 Cases Reported, , and Actual COVID-19 Incidence,
2.9. Estimating q, the Proportion Hospitalized
2.10. Aggregate and County-Specific Estimates of the Fraction of Incidental Hospitalizations,
3. Results
3.1. Aggregate Fraction of Hospitalized Patients Who Are COVID-19-Positive,

3.2. Growth Rate of COVID-19 Incidence, 164 Counties


3.3. Actual COVID-19 Incidence and Prevalence, 164 Counties
3.4. Estimated Fraction of Incidental Hospitalizations
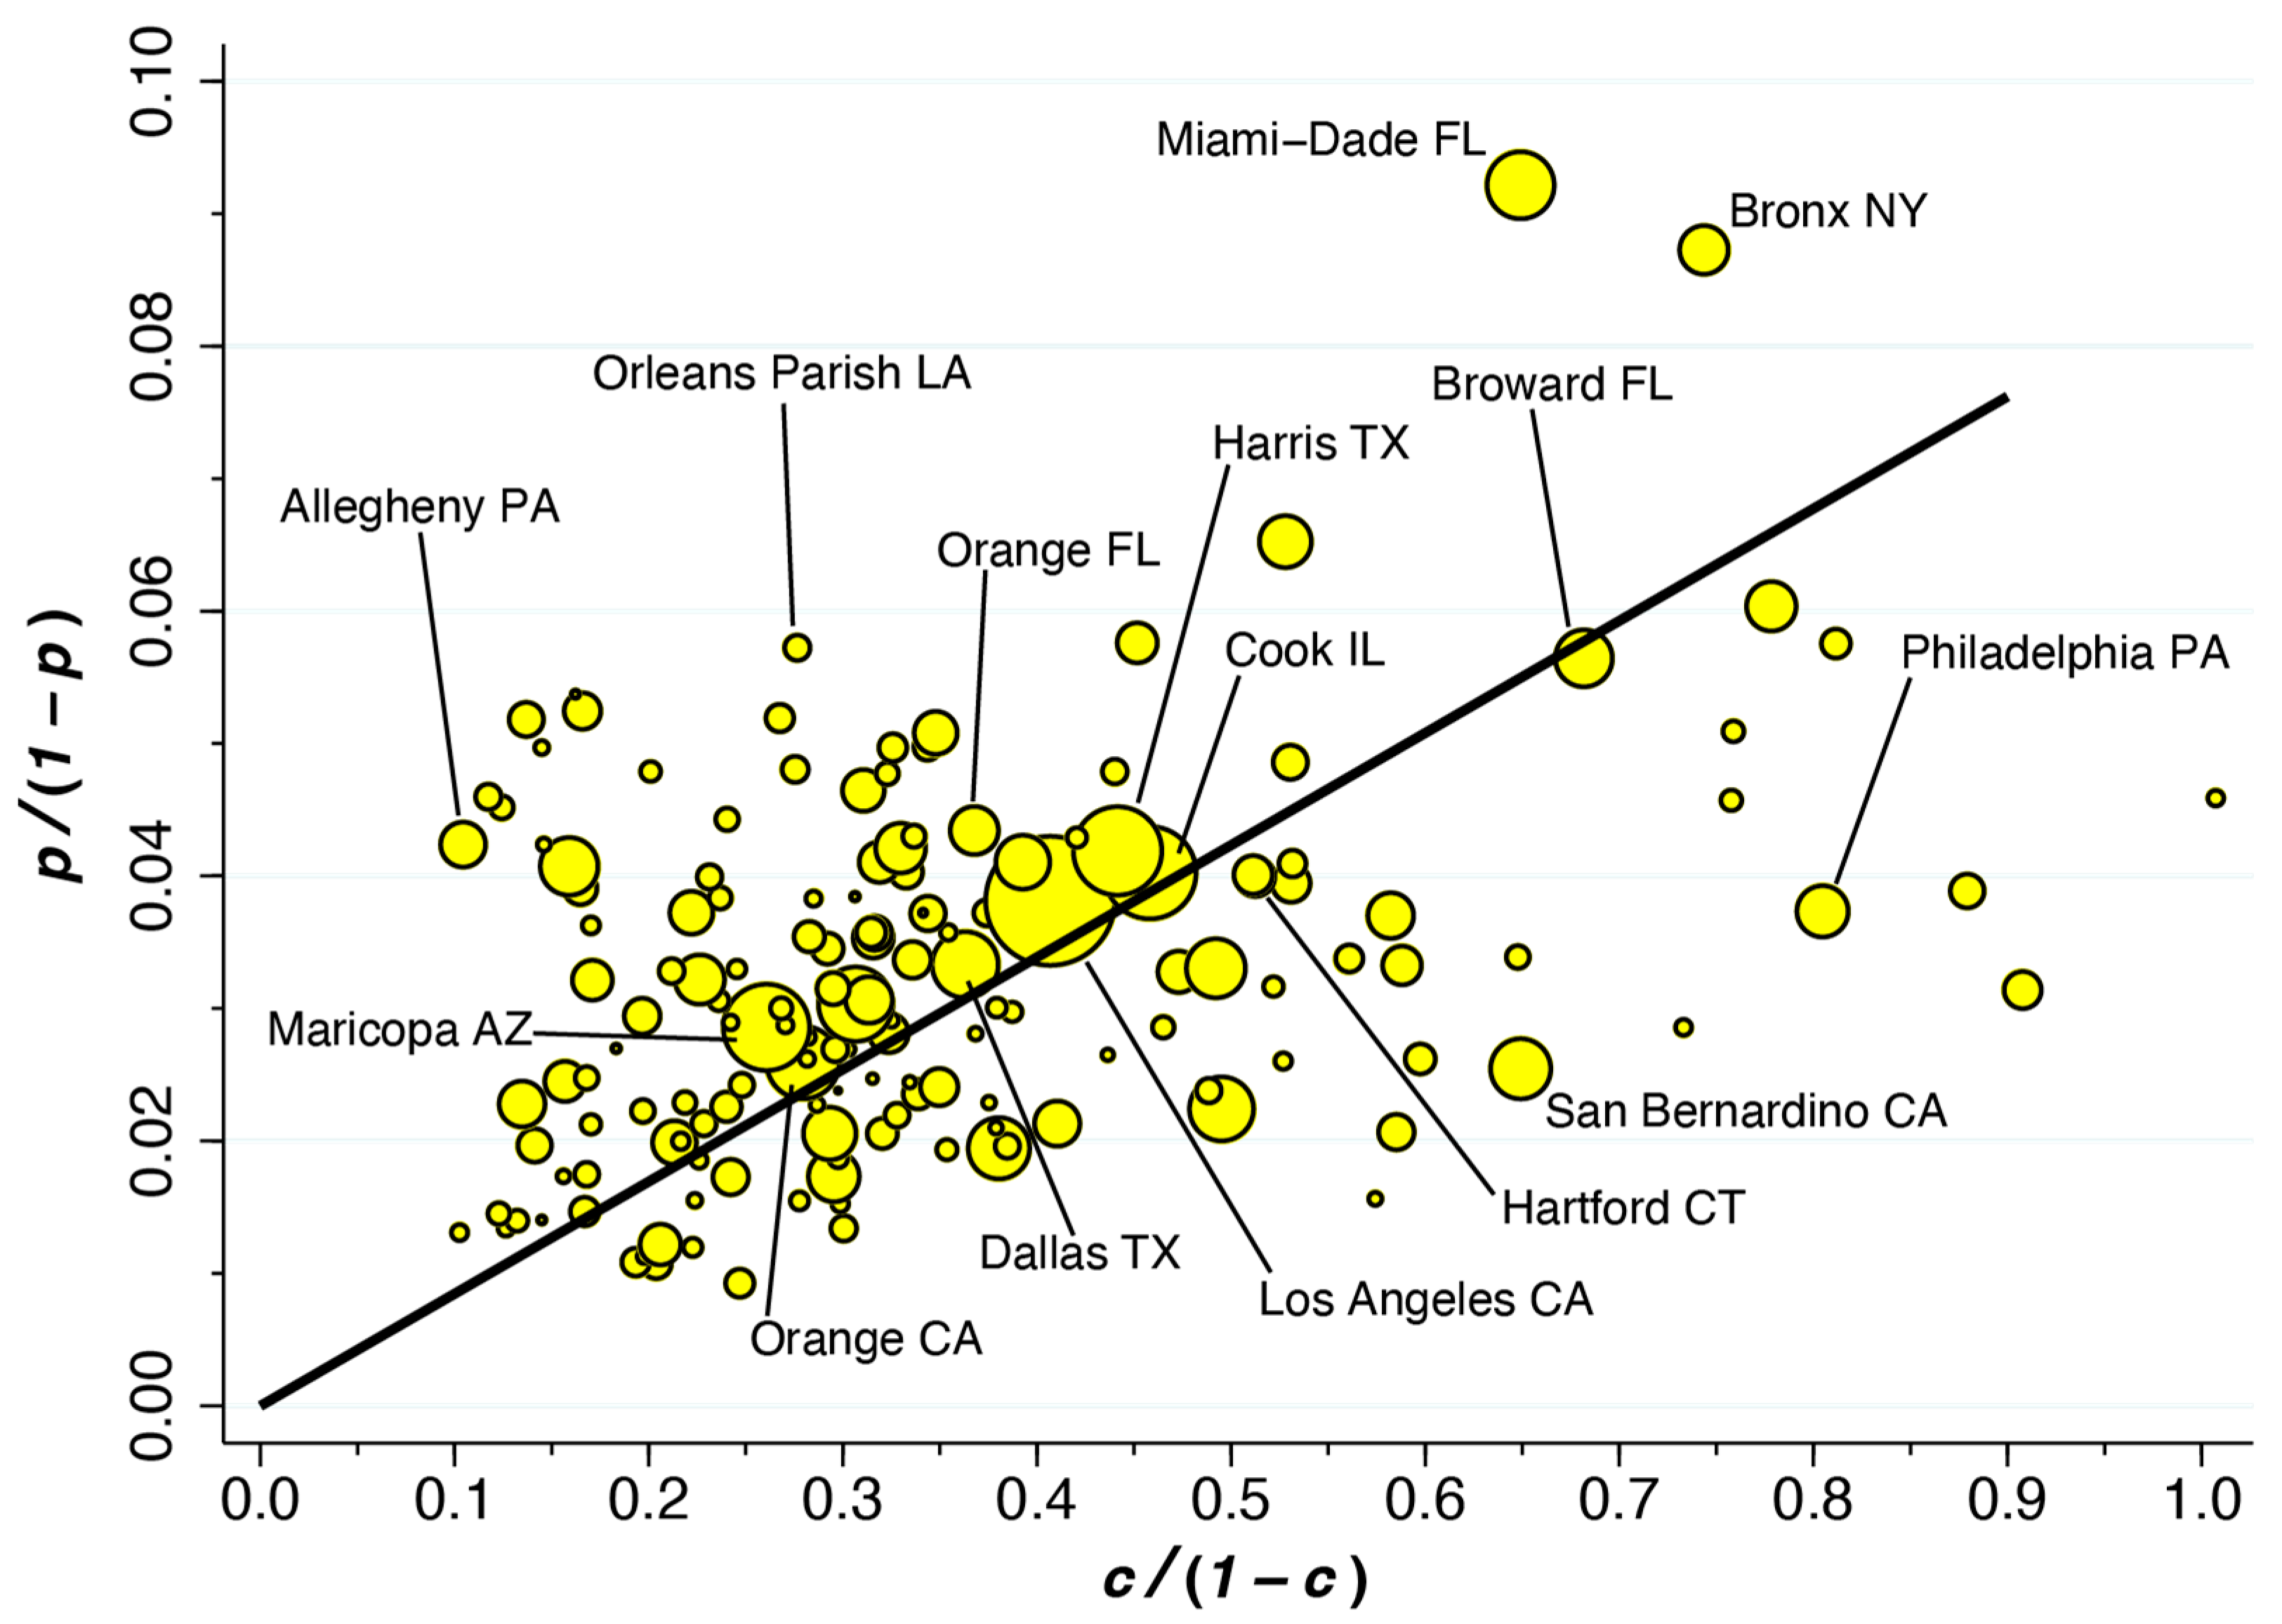
3.5. Variability of the Fraction of Incidental Hospitalizations, , across Counties
4. Discussion
4.1. Limitations
4.2. Fraction of Reported COVID-19 Cases, , as a Principal Source of Uncertainty
4.3. Equality of Hospitalization Rates as a Critical Assumption
4.4. Reliability of the Estimate of from UK Data
4.5. Variability of across Counties
4.6. Extensions
4.7. Policy Implications
5. Conclusions
Supplementary Materials
Funding
Institutional Review Board Statement
Informed Consent Statement
Data Availability Statement
Acknowledgments
Conflicts of Interest
Abbreviations
| IHME | Institute for Health Metrics and Evaluation |
| CDC | U.S. Centers for Disease Control and Prevention |
| HHS | U.S. Department of Health and Human Services |
| PCR | Polymerase Chain Reaction |
References
- Johns Hopkins University. United States. Data Timeline: Daily COVID-19 Hospitalizations; Johns Hopkins Coronavirus Resource Center. Available online: https://coronavirus.jhu.edu/region/united-states (accessed on 15 June 2022).
- Murray, S.G.; Croci, R.; Wachter, R.M. Is a Patient Hospitalized ‘with’ COVID or ‘for’ COVID? It Can Be Hard to Tell; Washington Post. Available online: https://www.washingtonpost.com/outlook/2022/01/07/hospitalization-covid-statistics-incidental/ (accessed on 7 January 2022).
- Jackson Health System. Jackson Health System Hospitals Currently Have 564 Patients Who Have Tested Positive for COVID-19 (Tweet). Twitter.com. Available online: https://twitter.com/JacksonHealth/status/1481268904970358790 (accessed on 12 January 2022).
- New York Governor. Governor Hochul Updates New Yorkers on State’s Progress Combating COVID-19 Press Release. Available online: https://www.governor.ny.gov/news/governor-hochul-updates-new-yorkers-states-progress-combating-covid-19-131 (accessed on 7 January 2022).
- Garrett, N.; Tapley, A.; Andriesen, J.; Seocharan, I.; Fisher, L.H.; Bunts, L.; Espy, N.; Wallis, C.L.; Randhawa, A.K.; Miner, M.D.; et al. High Asymptomatic Carriage With the Omicron Variant in South Africa. Clin. Infect. Dis. 2022, 75, e289–e292. [Google Scholar] [CrossRef]
- Mayr, E. Cause and effect in biology. Science 1961, 134, 1501–1506. [Google Scholar] [CrossRef]
- Massachusetts Department of Public Health. COVID-19 Hospitalizations (Powerpoint Presentation); Commonwealth of Massachusetts, Executive Office of Health and Human Services. Available online: https://www.mass.gov/doc/incidental-covid-19-report-january-25-2022/download (accessed on 25 January 2022).
- U.S. National Institutes of Health. Therapeutic Management of Hospitalized Adults with COVID-19; NIH COVID-19 Treatment Guidelines. Available online: https://www.covid19treatmentguidelines.nih.gov/management/clinical-management/hospitalized-adults--therapeutic-management/ (accessed on 24 February 2022).
- Chen, F.; Hao, L.; Zhu, S.; Yang, X.; Shi, W.; Zheng, K.; Wang, T.; Chen, H. Potential Adverse Effects of Dexamethasone Therapy on COVID-19 Patients: Review and Recommendations. Infect. Dis. Ther. 2021, 10, 1907–1931. [Google Scholar] [CrossRef]
- Klann, J.G.; Strasser, Z.H.; Hutch, M.R.; Kennedy, C.J.; Marwaha, J.S.; Morris, M.; Samayamuthu, M.J.; Pfaff, A.C.; Estiri, H.; South, A.M.; et al. Distinguishing Admissions Specifically for COVID-19 from Incidental SARS-CoV-2 Admissions: National Retrospective Electronic Health Record Study. J. Med. Internet Res. 2022, 24, e37931. [Google Scholar] [CrossRef]
- Legrand, M.; Bell, S.; Forni, L.; Joannidis, M.; Koyner, J.L.; Liu, K.; Cantaluppi, V. Pathophysiology of COVID-19-associated acute kidney injury. Nat. Rev. Nephrol. 2021, 17, 751–764. [Google Scholar] [CrossRef] [PubMed]
- Landstra, C.P.; de Koning, E.J.P. COVID-19 and Diabetes: Understanding the Interrelationship and Risks for a Severe Course. Front. Endocrinol. 2021, 12, 649525. [Google Scholar] [CrossRef] [PubMed]
- Ahmed, M.Z.; Khakwani, M.; Venkatadasari, I.; Horgan, C.; Giles, H.; Jobanputra, S.; Lokare, A.; Ewing, J.; Paneesha, S.; Murthy, V. Thrombocytopenia as an initial manifestation of COVID-19; case series and literature review. Br. J. Haematol. 2020, 189, 1057–1058. [Google Scholar] [CrossRef] [PubMed]
- Voor In ‘t Holt, A.F.; Haanappel, C.P.; Rahamat-Langendoen, J.; Molenkamp, R.; van Nood, E.; Van den Toorn, L.M.; Peeters, R.P.; van Rossum, A.M.C.; Severin, J.A. Admissions to a large tertiary care hospital and Omicron BA.1 and BA.2 SARS-CoV-2 PCR positivity: Primary, contributing, or incidental COVID-19. Int. J. Infect. Dis. 2022, 122, 665–668. [Google Scholar] [CrossRef]
- Thayer, J.; Hirz, K.W.; Sandberg, N.; Berg, D.V.; Miller, A.R.; Posner, X.; Dalecki, A. A Bright Side: Hospitalizations for COVID-19 Might Be Overcounted, Especially Among Kids; Epic Research. Available online: https://epicresearch.org/articles/a-bright-side-hospitalizations-for-covid-19-might-be-overcounted-especially-among-kids (accessed on 4 May 2022).
- U.S. Food & Drug Administration. Coronavirus (COVID-19) Update: FDA Authorizes First Oral Antiviral for Treatment of COVID-19. Available online: https://www.fda.gov/news-events/press-announcements/coronavirus-covid-19-update-fda-authorizes-first-oral-antiviral-treatment-covid-19 (accessed on 22 December 2021).
- Spitz, M.R.; Wu, X.; Mills, G. Integrative epidemiology: From risk assessment to outcome prediction. J. Clin. Oncol. 2005, 23, 267–275. [Google Scholar] [CrossRef]
- Spitz, M.R.; Caporaso, N.E.; Sellers, T.A. Integrative cancer epidemiology—The next generation. Cancer Discov. 2012, 2, 1087–1090. [Google Scholar] [CrossRef]
- U.S. Centers for Disease Control and Prevenetion. COVID Data Tracker: Variant Proportions. Available online: https://covid.cdc.gov/covid-data-tracker/#variant-proportions (accessed on 20 January 2022).
- Alho, J.M. On prevalence, incidence, and duration in general stable populations. Biometrics 1992, 48, 587–592. [Google Scholar] [CrossRef] [PubMed]
- Noh, J.; Danuser, G. Estimation of the fraction of COVID-19 infected people in U.S. states and countries worldwide. PLoS ONE 2021, 16, e0246772. [Google Scholar] [CrossRef] [PubMed]
- Havers, F.P.; Reed, C.; Lim, T.; Montgomery, J.M.; Klena, J.D.; Hall, A.J.; Thornburg, N.J. Seroprevalence of Antibodies to SARS-CoV-2 in Six Sites in the United States, March 23-May 3, 2020; MedRxiv. Available online: https://www.medrxiv.org/content/10.1101/2020.06.25.20140384v1 (accessed on 26 June 2020).
- Moghadas, S.M.; Fitzpatrick, M.C.; Sah, P.; Pandey, A.; Shoukat, A.; Singer, B.H.; Galvani, A.P. The implications of silent transmission for the control of COVID-19 outbreaks. Proc. Natl. Acad. Sci. USA 2020, 117, 17513–17515. [Google Scholar] [CrossRef] [PubMed]
- Harris, J.E. Critical Role of the Subways in the Initial Spread of SARS-CoV-2 in New York City. Front. Public Health 2021, 9, 754767. [Google Scholar] [CrossRef]
- Harris, J.E. Los Angeles County SARS-CoV-2 Epidemic: Critical Role of Multi-generational Intra-household Transmission. J. Bioecon. 2021, 23, 55–83. [Google Scholar] [CrossRef]
- U.S. Department of Health and Human Services. COVID-19 Reported Patient Impact and Hospital Capacity by Facility; HealthData.gov. Available online: https://healthdata.gov/Hospital/COVID-19-Reported-Patient-Impact-and-Hospital-Capa/anag-cw7u (accessed on 17 January 2022).
- White House COVID-19 Team. COVID-19 Community Profile Report; HealthData.gov, Excel Files for 12/20/2021, 12/27/2021, 1/3/2022, 1/10/2022. Available online: https://healthdata.gov/Health/COVID-19-Community-Profile-Report/gqxm-d9w9, (accessed on 1 October 2022).
- Institute for Health Metrics and Evaluation (IHME). COVID-19 Results Briefing: United States of America, January 8. Available online: https://www.healthdata.org/sites/default/files/files/102_briefing_United_States_of_America_3.pdf (accessed on 17 January 2022).
- UK Health Security Agency. SARS-CoV-2 variants of concern and variants under investigation in England—Technical briefing: Update on Hospitalisation and Vaccine Effectiveness for Omicron VOC-21NOV-01 (B.1.1.529). Available online: https://assets.publishing.service.gov.uk/government/uploads/system/uploads/attachment_data/file/1045619/Technical-Briefing-31-Dec-2021-Omicron_severity_update.pdf (accessed on 31 December 2021).
- U.S. Centers for Disease Control and Prevenetion. Ending Isolation and Precautions for People with COVID-19: Interim Guidance. Available online: https://www.cdc.gov/coronavirus/2019-ncov/hcp/duration-isolation.html (accessed on 14 January 2022).
- Patel, L.G.; Peck, T.; Starr, M.R.; Ammar, M.J.; Khan, M.A.; Yonekawa, Y.; Klufas, M.A.; Regillo, C.D.; Ho, A.C.; Xu, D. Clinical Presentation of Rhegmatogenous Retinal Detachment during the COVID-19 Pandemic: A Historical Cohort Study. Ophthalmology 2021, 128, 686–692. [Google Scholar] [CrossRef]
- Harris, J.E. COVID-19 Incidence and Hospitalization During the Delta Surge Were Inversely Related to Vaccination Coverage Among the Most Populous U.S. Counties. Health Policy Technol. 2021, 11, 100583. [Google Scholar] [CrossRef]
- Christensen, P.A.; Olsen, R.J.; Long, W.; Snehal, R.; Davis, J.J.; Saavedra, M.O.; Reppond, K.; Shyer, M.N.; Cambric, J.; Gadd, R.; et al. Signals of Significantly Increased Vaccine Breakthrough, Decreased Hospitalization Rates, and Less Severe Disease in Patients with COVID-19 Caused by the Omicron Variant of SARS-CoV-2 in Houston, Texas; medRxiv. Available online: https://www.medrxiv.org/content/10.1101/2021.12.30.21268560v3 (accessed on 12 January 2022).
- Grimm, C.A.; Hospitals Reported That the COVID-19 Pandemic Has Significantly Strained Health Care Delivery (Report in Brief OEI-09-21-00140) U.S. Department of Health and Human Services, Office of the Inspector General. Available online: https://oig.hhs.gov/oei/reports/OEI-09-21-00140.pdf (accessed on 12 April 2023).
- Office of the Assistant Secretary for Policy and Evaluation. Mpact of the COVID-19 Pandemic on the Hospital and Outpatient Clinician Workforce: Challenges and Policy Responses (Issue Brief No. HP-2022-13); U.S. Department of Health and Human Services. Available online: https://aspe.hhs.gov/sites/default/files/documents/9cc72124abd9ea25d58a22c7692dccb6/aspe-covid-workforce-report.pdf (accessed on 12 April 2023).
- Janke, A.T.; Mei, H.; Rothenberg, C.; Becher, R.D.; Lin, Z.; Venkatesh, A.K. Analysis of Hospital Resource Availability and COVID-19 Mortality Across the United States. J. Hosp. Med. 2021, 16, 211–214. [Google Scholar] [CrossRef]
- Fox, S.J.; Lachmann, M.; Tec, M.; Pasco, R.; Woody, S.; Du, Z.; Wang, X.; Ingle, T.A.; Javan, E.; Dahan, M.; et al. Real-time pandemic surveillance using hospital admissions and mobility data. Proc. Natl. Acad. Sci. USA 2022, 119. [Google Scholar] [CrossRef]
- Anesi, G.L.; Kerlin, M.P. The impact of resource limitations on care delivery and outcomes: Routine variation, the coronavirus disease 2019 pandemic, and persistent shortage. Curr. Opin. Crit. Care 2021, 27, 513–519. [Google Scholar] [CrossRef]
- DeMartino, J.K.; Swallow, E.; Goldschmidt, D.; Yang, K.; Viola, M.; Radtke, T.; Kirson, N. Direct health care costs associated with COVID-19 in the United States. J. Manag. Care Spec. Pharm. 2022, 28, 936–947. [Google Scholar] [CrossRef] [PubMed]
- French, G.; Hulse, M.; Nguyen, D.; Sobotka, K.; Webster, K.; Corman, J.; Aboagye-Nyame, B.; Dion, M.; Johnson, M.; Zalinger, B.; et al. Impact of Hospital Strain on Excess Deaths during the COVID-19 Pandemic—United States, July 2020–July 2021. MMWR Morb. Mortal Wkly. Rep. 2021, 70, 1613–1616. [Google Scholar] [CrossRef] [PubMed]
- Havers, F.P.; Pham, H.; Taylor, C.A.; Whitaker, M.; Patel, K.; Anglin, O.; Kambhampati, A.K.; Milucky, J.; Zell, E.; Moline, H.L.; et al. COVID-19-Associated Hospitalizations Among Vaccinated and Unvaccinated Adults 18 Years or Older in 13 US States, January 2021 to April 2022. JAMA Intern. Med. 2022, 182, 1071–1081. [Google Scholar] [CrossRef] [PubMed]
- Wang, X.; Ren, R.; Kattan, M.W.; Jehi, L.; Cheng, Z.; Fang, K. Public Health Interventions’ Effect on Hospital Use in Patients With COVID-19: Comparative Study. JMIR Public Health Surveill. 2020, 6, e25174. [Google Scholar] [CrossRef]


| Symbol | Definition |
|---|---|
| Prevalence of COVID-19 | |
| Fraction of all hospitalized patients who are COVID-19-positive | |
| Proportion of all infected individuals who are hospitalized because of their COVID-19 illness | |
| Fraction of incidental hospitalizations, |
| Symbol | Definition |
|---|---|
| Reported COVID incidence | |
| Exponential rate of increase in COVID incidence | |
| Fraction of COVID cases reported | |
| Actual COVID incidence, = | |
| Inverse of the mean duration of SARS-CoV-2 infection | |
| Prevalence of COVID, |
| Symbol | Definition | Source | Estimate * |
|---|---|---|---|
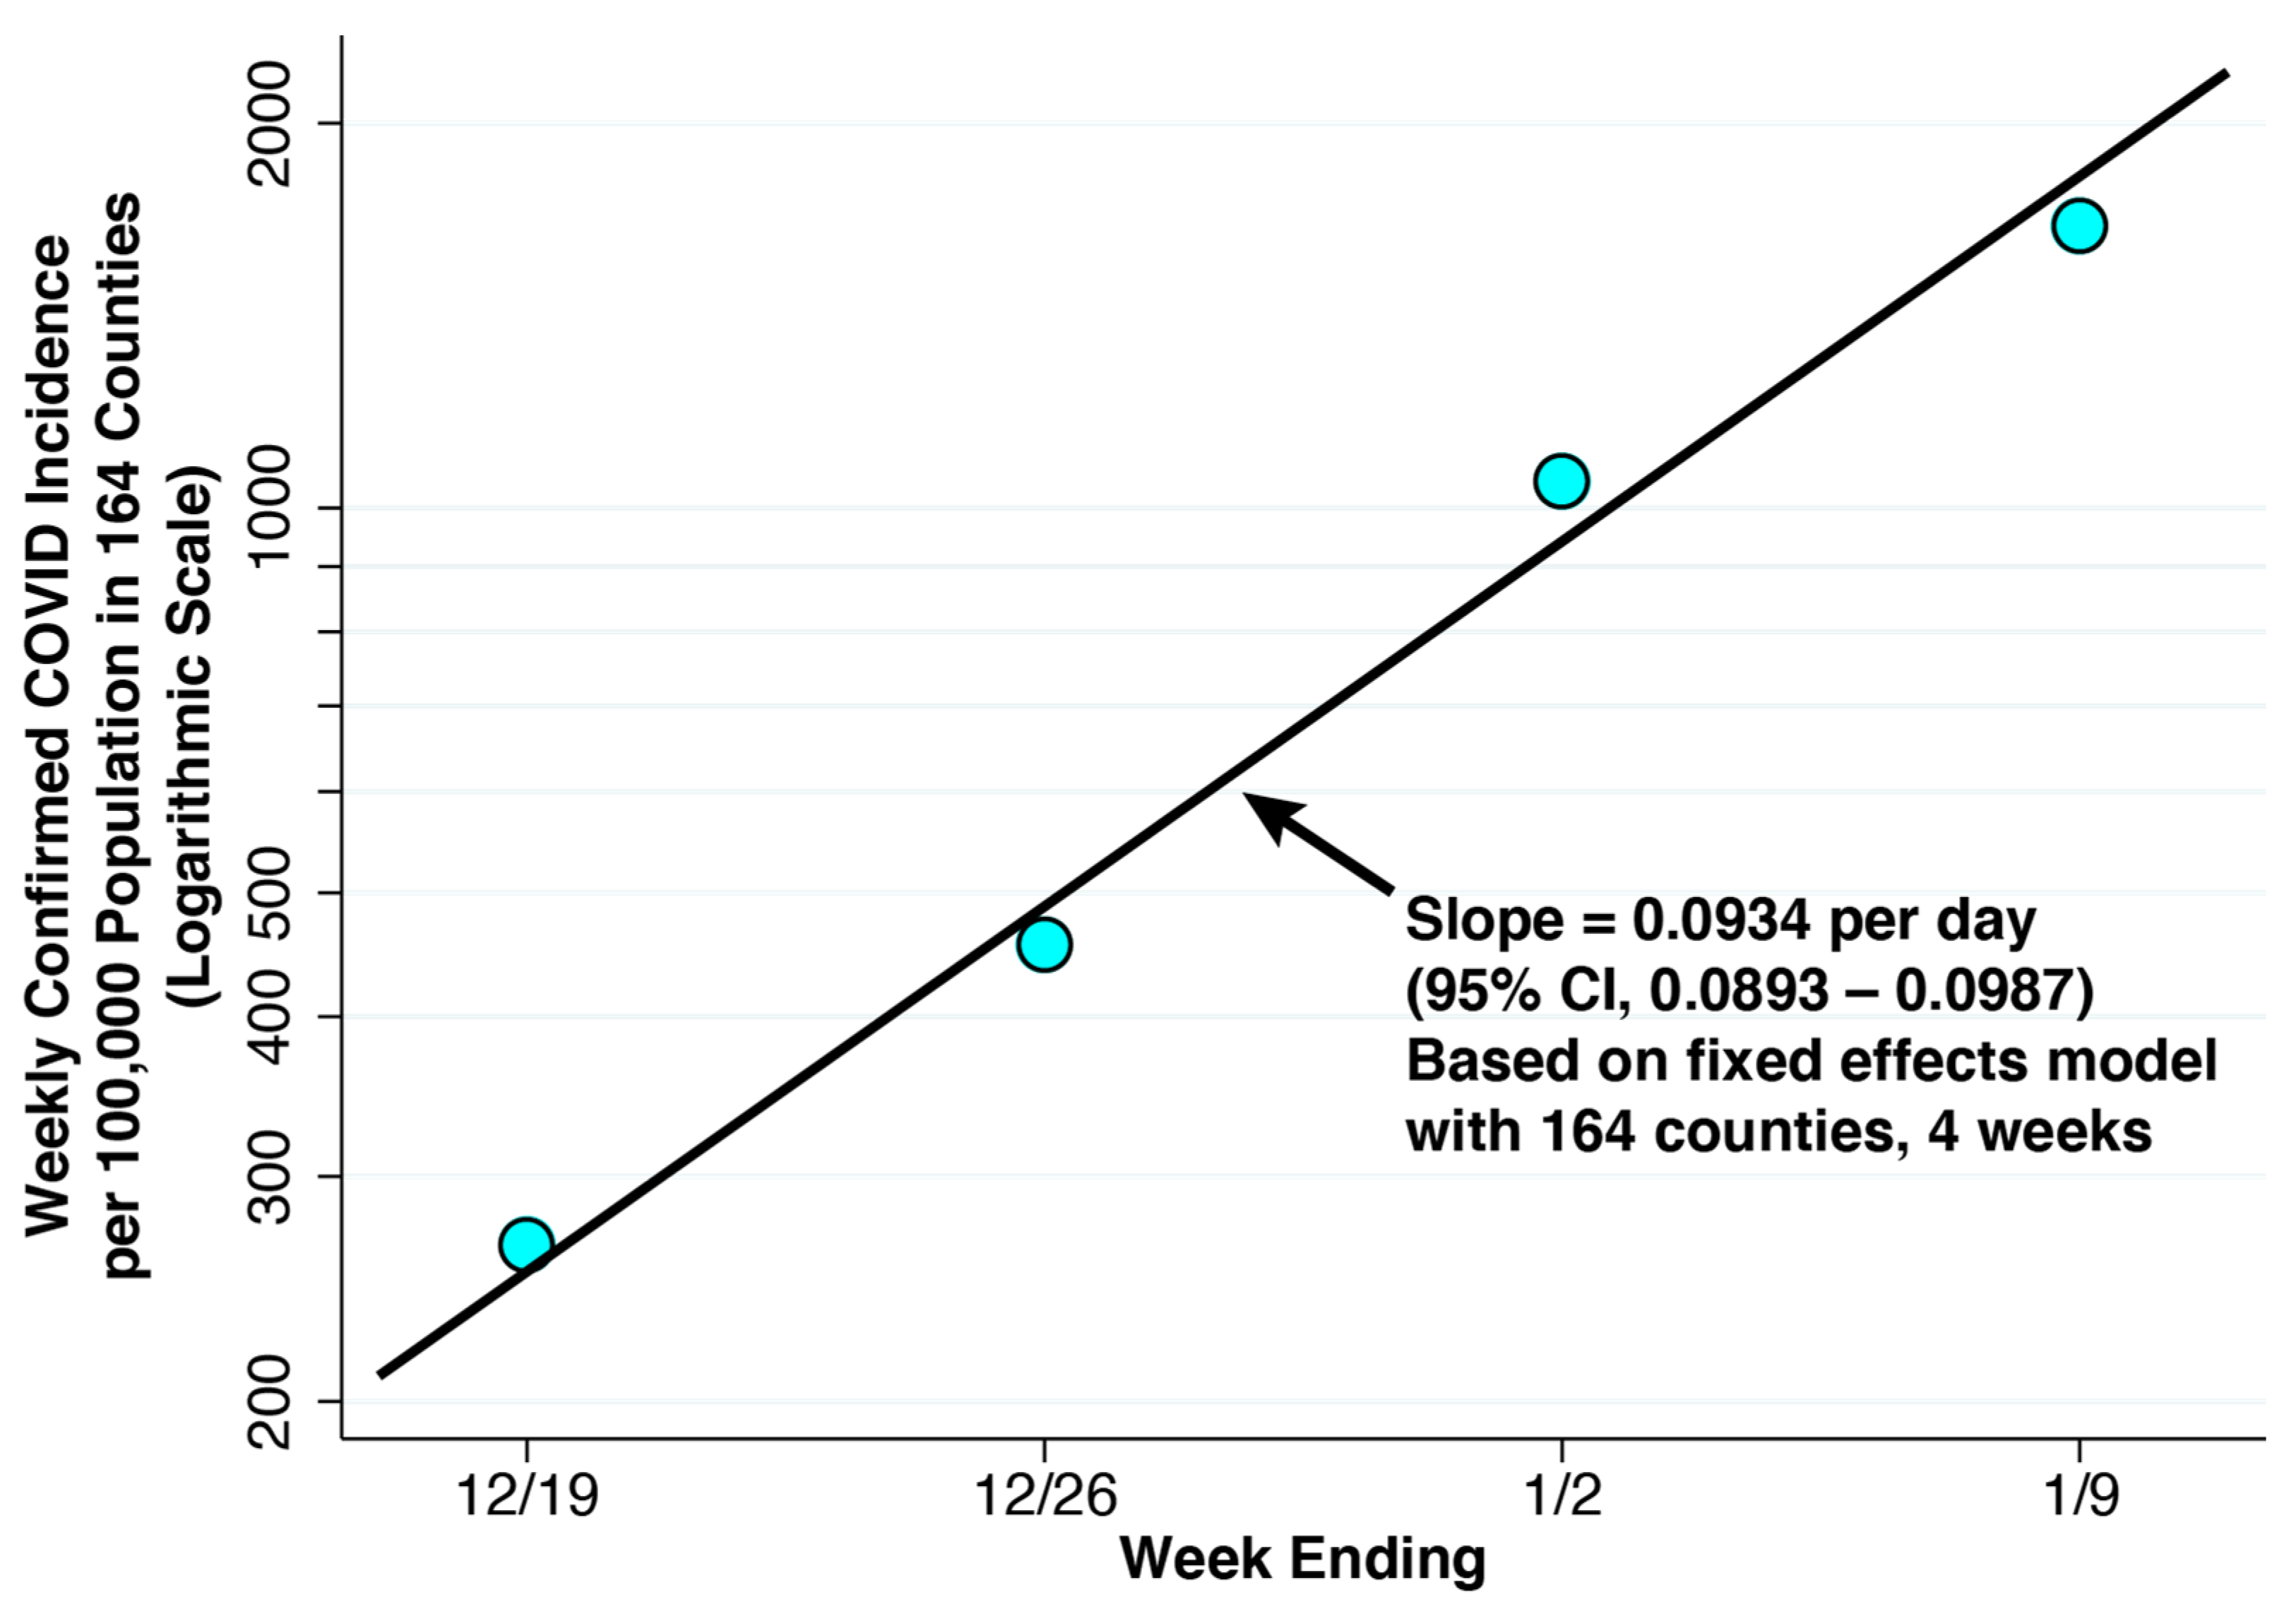
| Reported COVID-19 incidence | Community Profile Reports [27], Figure 3 | 237.6 per 100,000 population per day | |
| Exponential rate of increase in COVID-19 incidence | Community Profile Reports [27], Equation (5) | 0.0934 per day | |
| Fraction of COVID-19 cases reported | IHME Report [28] | 0.25 | |
| Actual COVID-19 incidence | Equation (4) | 950.4 per 100,000 population per day | |
| Inverse of the mean duration of SARS-CoV-2 infection (days) | CDC [30]. | 0.182 | |
| Prevalence of COVID-19 | Equation (3) | 0.0345 | |
| Proportion of all infected individuals who are hospitalized because of their COVID-19 illness | UK Health Security Agency [29] | 0.006 | |
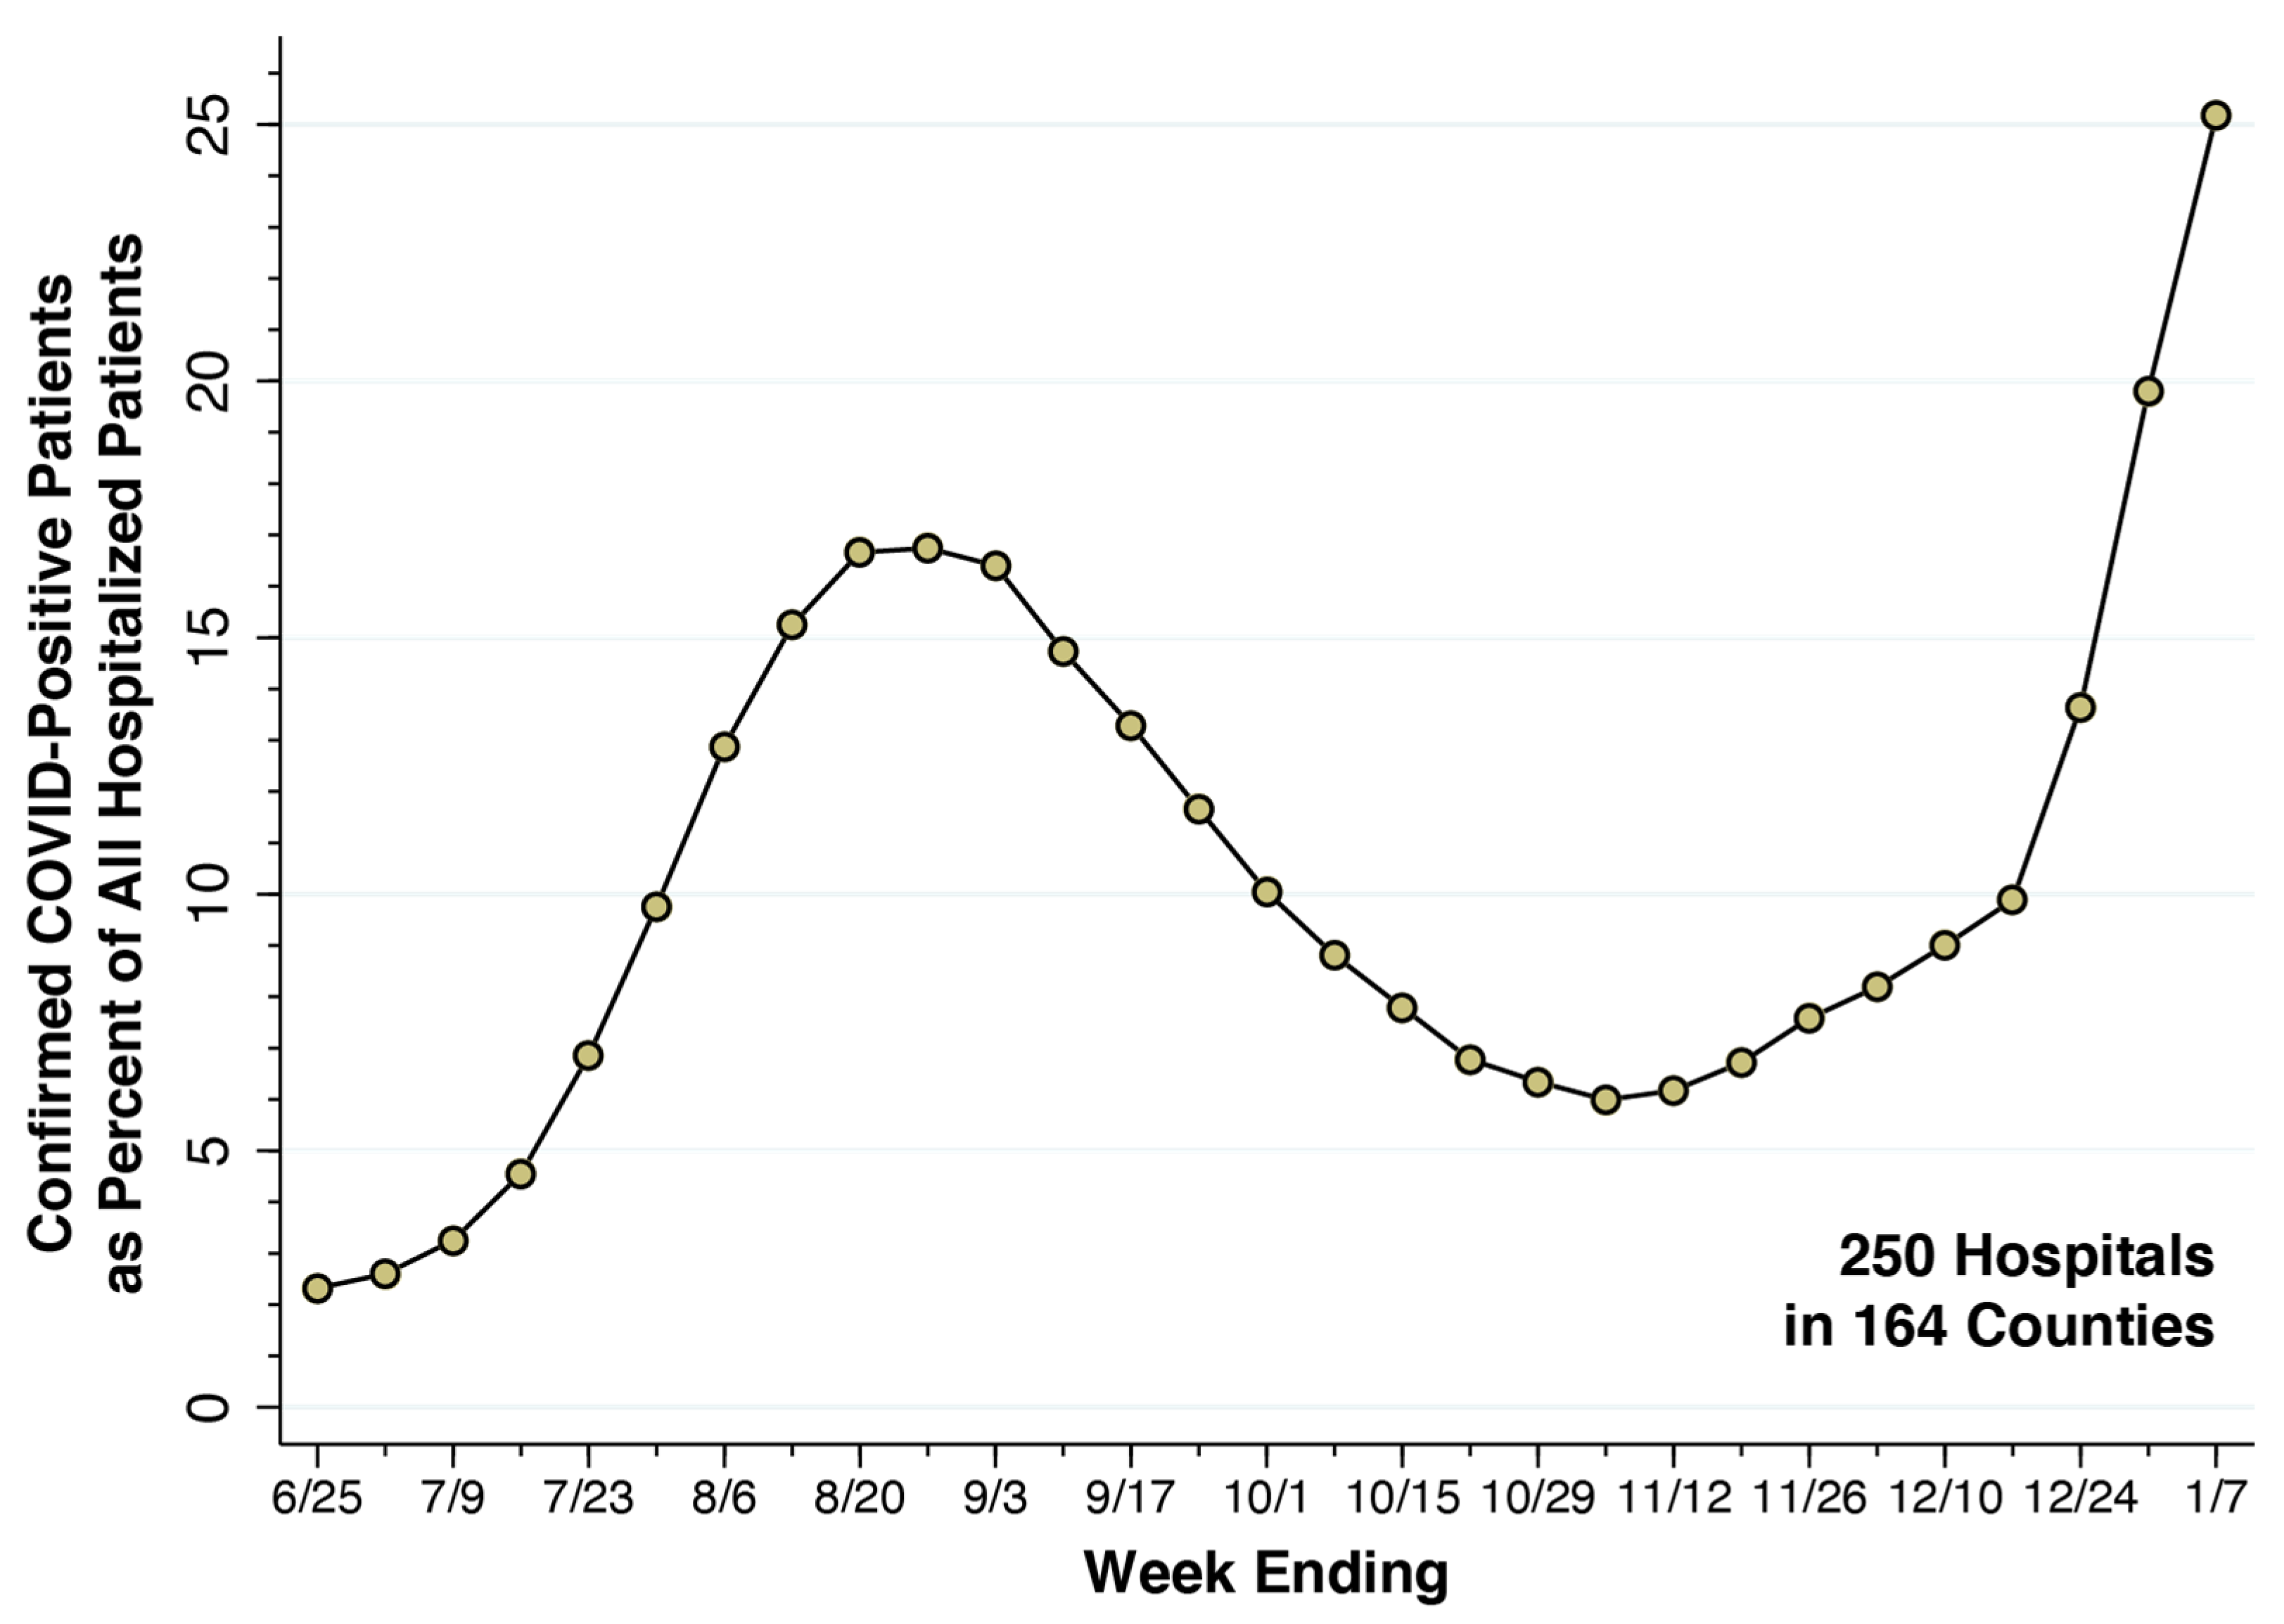
| Fraction of hospitalized patients who are COVID-19-positive | HHS [26], Figure 2 | 0.2517 | |
| Fraction of incidental hospitalizations | Equation (2) | 0.106 |
Disclaimer/Publisher’s Note: The statements, opinions and data contained in all publications are solely those of the individual author(s) and contributor(s) and not of MDPI and/or the editor(s). MDPI and/or the editor(s) disclaim responsibility for any injury to people or property resulting from any ideas, methods, instructions or products referred to in the content. |
© 2023 by the author. Licensee MDPI, Basel, Switzerland. This article is an open access article distributed under the terms and conditions of the Creative Commons Attribution (CC BY) license (https://creativecommons.org/licenses/by/4.0/).
Share and Cite
Harris, J.E. Population-Based Model of the Fraction of Incidental COVID-19 Hospitalizations during the Omicron BA.1 Wave in the United States. COVID 2023, 3, 728-743. https://doi.org/10.3390/covid3050054
Harris JE. Population-Based Model of the Fraction of Incidental COVID-19 Hospitalizations during the Omicron BA.1 Wave in the United States. COVID. 2023; 3(5):728-743. https://doi.org/10.3390/covid3050054
Chicago/Turabian StyleHarris, Jeffrey E. 2023. "Population-Based Model of the Fraction of Incidental COVID-19 Hospitalizations during the Omicron BA.1 Wave in the United States" COVID 3, no. 5: 728-743. https://doi.org/10.3390/covid3050054