
It Didn’t Go Away: The Political and Social Determinants of COVID-19 Mortality Rates across Counties in the United States

Abstract
:1. Introduction
1.1. The Socio-Demographic Gradient of COVID-19
1.2. Political Views and the Political Environment
2. Materials and Methods
3. Results
4. Discussion
Author Contributions
Funding
Institutional Review Board Statement
Informed Consent Statement
Data Availability Statement
Conflicts of Interest
References
- Wolfe, D.; Dale, D. ‘It’s Going to Disappear’: A Timeline of Trump’s Claims That Covid-19 Will Vanish. CNN, 31 October 2020. [Google Scholar]
- Rask, K.; O’Malley, E.; Druss, B. Impact of socioeconomic, behavioral and clinical risk factors on mortality. J. Public Health 2009, 31, 231–238. [Google Scholar] [CrossRef]
- Lantz, P.M.; Golberstein, E.; House, J.S.; Morenoff, J. Socioeconomic and behavioral risk factors for mortality in a national 19-year prospective study of U.S. adults. Soc. Sci. Med. 2010, 70, 1558–1566. [Google Scholar] [CrossRef] [Green Version]
- Rogers, R.G.; Hummer, R.A.; Nam, C.B.; Peters, K. Demographic, Socioeconomic, and Behavioral Factors Affecting Ethnic Mortality by Cause. Soc. Forces 1996, 74, 1419–1438. [Google Scholar] [CrossRef]
- Oronce, C.I.A.; Scannell, C.A.; Kawachi, I.; Tsugawa, Y. Association Between State-Level Income Inequality and COVID-19 Cases and Mortality in the USA. J. Gen. Intern. Med. 2020, 35, 2791–2793. [Google Scholar] [CrossRef] [PubMed]
- Liao, T.F.; De Maio, F. Association of Social and Economic Inequality with Coronavirus Disease 2019 Incidence and Mortality Across US Counties. JAMA Netw. Open 2021, 4, e2034578. [Google Scholar] [CrossRef]
- Rifat, S.A.A.; Liu, W. One year into the pandemic: The impacts of social vulnerability on COVID-19 outcomes and urban–rural differences in the conterminous United States. Int. J. Environ. Health Res. 2022, 32, 2601–2619. [Google Scholar] [CrossRef] [PubMed]
- Tai, D.B.G.; Shah, A.; Doubeni, C.A.; Sia, I.G.; Wieland, M.L. The Disproportionate Impact of COVID-19 on Racial and Ethnic Minorities in the United States. Clin. Infect. Dis. 2021, 72, 703–706. [Google Scholar] [CrossRef]
- Perry, S.L.; Whitehead, A.L.; Grubbs, J.B. Culture Wars and COVID-19 Conduct: Christian Nationalism, Religiosity, and Americans’ Behavior During the Coronavirus Pandemic. J. Sci. Study Relig. 2020, 59, 405–416. [Google Scholar] [CrossRef]
- Bambra, C.; Riordan, R.; Ford, J.; Matthews, F. The COVID-19 pandemic and health inequalities. J. Epidemiol. Community Health 2020, 74, 964. [Google Scholar] [CrossRef]
- Krieger, N. ENOUGH: COVID-19, Structural Racism, Police Brutality, Plutocracy, Climate Change—And Time for Health Justice, Democratic Governance, and an Equitable, Sustainable Future. Am. J. Public Health 2020, 110, 1620–1623. [Google Scholar] [CrossRef]
- Sepulveda, E.R.; Brooker, A.-S. Income inequality and COVID-19 mortality: Age-stratified analysis of 22 OECD countries. SSM Popul. Health 2021, 16, 100904. [Google Scholar] [CrossRef]
- Tan, A.X.; Hinman, J.A.; Abdel Magid, H.S.; Nelson, L.M.; Odden, M.C. Association Between Income Inequality and County-Level COVID-19 Cases and Deaths in the US. JAMA Netw. Open 2021, 4, e218799. [Google Scholar] [CrossRef] [PubMed]
- Dasgupta, S.; Bowen, V.B.; Leidner, A.; Fletcher, K.; Musial, T.; Rose, C.; Cha, A.; Kang, G.; Dirlikov, E.; Pevzner, E.; et al. Association Between Social Vulnerability and a County’s Risk for Becoming a COVID-19 Hotspot—United States, 1 June–25 July 2020. MMWR Morb. Mortal. Wkly. Rep. 2020, 69, 1535–1541. [Google Scholar] [CrossRef] [PubMed]
- Khazanchi, R.; Beiter, E.R.; Gondi, S.; Beckman, A.L.; Bilinski, A.; Ganguli, I. County-Level Association of Social Vulnerability with COVID-19 Cases and Deaths in the USA. J. Gen. Intern. Med. 2020, 35, 2784–2787. [Google Scholar] [CrossRef]
- Wrigley-Field, E.; Garcia, S.; Leider, J.P.; Van Riper, D. COVID-19 Mortality at The Neighborhood Level: Racial And Ethnic Inequalities Deepened In Minnesota In 2020. Health Aff. 2021, 40, 1644–1653. [Google Scholar] [CrossRef]
- Freese, K.E.; Vega, A.; Lawrence, J.J.; Documet, P.I. Social Vulnerability Is Associated with Risk of COVID-19 Related Mortality in U.S. Counties with Confirmed Cases. J. Health Care Poor Underserved 2021, 32, 245–257. [Google Scholar] [CrossRef]
- Biggs, E.N.; Maloney, P.M.; Rung, A.L.; Peters, E.S.; Robinson, W.T. The Relationship Between Social Vulnerability and COVID-19 Incidence Among Louisiana Census Tracts. Front. Public Health 2021, 8, 617976. [Google Scholar] [CrossRef]
- Gaynor, T.S.; Wilson, M.E. Social Vulnerability and Equity: The Disproportionate Impact of COVID-19. Public Adm. Rev. 2020, 80, 832–838. [Google Scholar] [CrossRef]
- Kim, S.J.; Bostwick, W. Social Vulnerability and Racial Inequality in COVID-19 Deaths in Chicago. Health Educ. Behav. 2020, 47, 509–513. [Google Scholar] [CrossRef]
- Karaye, I.M.; Horney, J.A. The Impact of Social Vulnerability on COVID-19 in the U.S.: An Analysis of Spatially Varying Relationships. Am. J. Prev. Med. 2020, 59, 317–325. [Google Scholar] [CrossRef] [PubMed]
- Bilal, U.; Tabb, L.P.; Barber, S.; Diez Roux, A.V. Spatial Inequities in COVID-19 Testing, Positivity, Confirmed Cases, and Mortality in 3 U.S. Cities. Ann. Intern. Med. 2021, 174, 936–944. [Google Scholar] [CrossRef]
- Garcia, M.A.; Homan, P.A.; García, C.; Brown, T.H. The Color of COVID-19: Structural Racism and the Disproportionate Impact of the Pandemic on Older Black and Latinx Adults. J. Gerontol. Ser. B 2021, 76, e75–e80. [Google Scholar] [CrossRef] [PubMed]
- Laster Pirtle, W.N. Racial Capitalism: A Fundamental Cause of Novel Coronavirus (COVID-19) Pandemic Inequities in the United States. Health Educ. Behav. 2020, 47, 504–508. [Google Scholar] [CrossRef]
- Wrigley-Field, E. US racial inequality may be as deadly as COVID-19. Proc. Natl. Acad. Sci. USA 2020, 117, 21854–21856. [Google Scholar] [CrossRef]
- Khanijahani, A.; Tomassoni, L. Socioeconomic and Racial Segregation and COVID-19: Concentrated Disadvantage and Black Concentration in Association with COVID-19 Deaths in the USA. J. Racial Ethn. Health Disparities 2022, 9, 367–375. [Google Scholar] [CrossRef]
- Laurencin, C.T.; Wu, Z.H.; Grady, J.J.; Wu, R.; Walker, J.M. Changes in COVID-19-Associated Deaths During a Year Among Blacks and Hispanics Compared to Whites in the State of Connecticut. J. Racial Ethn. Health Disparities 2022, 9, 2049–2055. [Google Scholar] [CrossRef] [PubMed]
- Marrett, C.B. Racial Disparities and COVID-19: The Social Context. J. Racial Ethn. Health Disparities 2021, 8, 794–797. [Google Scholar] [CrossRef] [PubMed]
- Mude, W.; Oguoma, V.M.; Nyanhanda, T.; Mwanri, L.; Njue, C. Racial disparities in COVID-19 pandemic cases, hospitalisations, and deaths: A systematic review and meta-analysis. J. Glob. Health 2021, 11, 05015. [Google Scholar] [CrossRef]
- Bassett, M.T.; Chen, J.T.; Krieger, N. Variation in racial/ethnic disparities in COVID-19 mortality by age in the United States: A cross-sectional study. PLoS Med. 2020, 17, e1003402. [Google Scholar] [CrossRef]
- Acosta, A.M.; Garg, S.; Pham, H.; Whitaker, M.; Anglin, O.; O’Halloran, A.; Milucky, J.; Patel, K.; Taylor, C.; Wortham, J.; et al. Racial and Ethnic Disparities in Rates of COVID-19–Associated Hospitalization, Intensive Care Unit Admission, and In-Hospital Death in the United States from March 2020 to February 2021. JAMA Netw. Open 2021, 4, e2130479. [Google Scholar] [CrossRef]
- Cordes, J.; Castro, M.C. Spatial analysis of COVID-19 clusters and contextual factors in New York City. Spat. Spatiotemporal Epidemiol. 2020, 34, 100355. [Google Scholar] [CrossRef]
- Feldman, J.M.; Bassett, M.T. Variation in COVID-19 Mortality in the US by Race and Ethnicity and Educational Attainment. JAMA Netw. Open 2021, 4, e2135967. [Google Scholar] [CrossRef]
- Wadhera, R.K.; Wadhera, P.; Gaba, P.; Figueroa, J.F.; Joynt Maddox, K.E.; Yeh, R.W.; Shen, C. Variation in COVID-19 Hospitalizations and Deaths Across New York City Boroughs. JAMA 2020, 323, 2192–2195. [Google Scholar] [CrossRef]
- Anderson, K.F.; Lopez, A.; Simburger, D. Racial/Ethnic Residential Segregation and the First Wave of SARS-CoV-2 Infection Rates: A Spatial Analysis of Four U.S. Cities. Sociol. Perspect. 2021, 64, 804–830. [Google Scholar] [CrossRef]
- Anderson, K.F.; Ray-Warren, D. Racial-Ethnic Residential Clustering and Early COVID-19 Vaccine Allocations in Five Urban Texas Counties. J. Health Soc. Behav. 2022, 63, 472–490. [Google Scholar] [CrossRef]
- Benfer, E.A.; Vlahov, D.; Long, M.Y.; Walker-Wells, E.; Pottenger, J.L.; Gonsalves, G.; Keene, D.E. Eviction, Health Inequity, and the Spread of COVID-19: Housing Policy as a Primary Pandemic Mitigation Strategy. J. Urban Health 2021, 98, 1–12. [Google Scholar] [CrossRef] [PubMed]
- Jones, A.; Grigsby-Toussaint, D.S. Housing stability and the residential context of the COVID-19 pandemic. Cities Health 2021, 5, S159–S161. [Google Scholar] [CrossRef]
- Kamis, C.; Stolte, A.; West, J.S.; Fishman, S.H.; Brown, T.; Brown, T.; Farmer, H.R. Overcrowding and COVID-19 mortality across U.S. counties: Are disparities growing over time? SSM Popul. Health 2021, 15, 100845. [Google Scholar] [CrossRef]
- Do, D.P.; Frank, R. The Diverging Impacts of Segregation on Obesity Risk by Nativity and Neighborhood Poverty Among Hispanic Americans. J. Racial Ethn. Health Disparities 2020, 7, 1214–1224. [Google Scholar] [CrossRef]
- McCormack, G.; Avery, C.; Spitzer, A.K.-L.; Chandra, A. Economic Vulnerability of Households with Essential Workers. JAMA 2020, 324, 388–390. [Google Scholar] [CrossRef]
- Chen, H.-F.; Karim, S.A. Relationship between political partisanship and COVID-19 deaths: Future implications for public health. J. Public Health 2022, 44, 716–723. [Google Scholar] [CrossRef]
- Neelon, B.; Mutiso, F.; Mueller, N.T.; Pearce, J.L.; Benjamin-Neelon, S.E. Associations Between Governor Political Affiliation and COVID-19 Cases, Deaths, and Testing in the U.S. Am. J. Prev. Med. 2021, 61, 115–119. [Google Scholar] [CrossRef]
- Robertson, L.S. Association of COVID-19 mortality with politics and on-demand testing in 217 U.S. counties. BMC Public Health 2021, 21, 2203. [Google Scholar] [CrossRef] [PubMed]
- Gao, J.; Radford, B.J. Death by political party: The relationship between COVID-19 deaths and political party affiliation in the United States. World Med. Health Policy 2021, 13, 224–249. [Google Scholar] [CrossRef] [PubMed]
- Grossman, G.; Kim, S.; Rexer, J.M.; Thirumurthy, H. Political partisanship influences behavioral responses to governors’ recommendations for COVID-19 prevention in the United States. Proc. Natl. Acad. Sci. USA 2020, 117, 24144–24153. [Google Scholar] [CrossRef] [PubMed]
- Sehgal, N.J.; Yue, D.; Pope, E.; Wang, R.H.; Roby, D.H. The Association Between COVID-19 Mortality and The County-Level Partisan Divide In The United States. Health Aff. 2022, 41, 853–863. [Google Scholar] [CrossRef]
- Yamey, G.; Gonsalves, G. Donald Trump: A political determinant of covid-19. BMJ 2020, 369, m1643. [Google Scholar] [CrossRef] [Green Version]
- Gonzalez, K.E.; James, R.; Bjorklund, E.T.; Hill, T.D. Conservatism and infrequent mask usage: A study of US counties during the novel coronavirus (COVID-19) pandemic. Soc. Sci. Q. 2021, 102, 2368–2382. [Google Scholar] [CrossRef] [PubMed]
- Howard, M.C. Are face masks a partisan issue during the COVID-19 pandemic? Differentiating political ideology and political party affiliation. Int. J. Psychol. 2022, 57, 153–160. [Google Scholar] [CrossRef]
- Hsiehchen, D.; Espinoza, M.; Slovic, P. Political partisanship and mobility restriction during the COVID-19 pandemic. Public Health 2020, 187, 111–114. [Google Scholar] [CrossRef]
- Kemmelmeier, M.; Jami, W.A. Mask Wearing as Cultural Behavior: An Investigation Across 45 U.S. States During the COVID-19 Pandemic. Front. Psychol. 2021, 12, 648692. [Google Scholar] [CrossRef]
- Huang, Q.; Jackson, S.; Derakhshan, S.; Lee, L.; Pham, E.; Jackson, A.; Cutter, S.L. Urban-rural differences in COVID-19 exposures and outcomes in the South: A preliminary analysis of South Carolina. PLoS ONE 2021, 16, e0246548. [Google Scholar] [CrossRef]
- USAFacts. Detailed Methodology and Sources: COVID-19 Data. 2020. Available online: https://usafacts.org/articles/detailed-methodology-covid-19-data/ (accessed on 3 December 2021).
- MIT Election Data and Science Lab. County Presidential Election Returns 2000–2020. 2018. Available online: https://electionlab.mit.edu/data (accessed on 20 July 2021).
- Grammich, C.; Hadaway, K.; Houseal, R.; Jones, D.; Krindatch, A.; Stanley, R.; Taylor, R. U.S. Religion Census Religious Congregations and Membership Study, 2010 (County File). 2018. Available online: https://www.usreligioncensus.org/images/2010_US_Religion_Census_Introduction.pdf (accessed on 20 July 2021).
- Dynata, The New York Times. Mask-Wearing Survey Data. 2020. Available online: https://github.com/nytimes/covid-19-data/blob/master/mask-use/README.md (accessed on 20 July 2021).
- Killeen, B.D.; Wu, J.Y.; Shah, K.; Zapaishchykova, A.; Nikutta, P.; Tamhane, A.; Chakraborty, S.; Wei, J.; Gao, T.; Thies, M.; et al. A County-Level Dataset for Informing the United States’ Response to COVID-19. arXiv 2020, arXiv:2004.00756. [Google Scholar]
- Anselin, L. Local Indicators of Spatial Association—LISA. Geogr. Anal. 1995, 27, 93–115. [Google Scholar] [CrossRef]
- Anselin, L.; Florax, R.J.G.M.; Rey, S.J. Advances in Spatial Econometrics: Methodology, Tools and Applications; Springer: Berlin/Heidelberg, Germany, 2004. [Google Scholar]
- Kelejian, H.H.; Prucha, I.R. Specification and estimation of spatial autoregressive models with autoregressive and heteroskedastic disturbances. J. Econom. 2010, 157, 53–67. [Google Scholar] [CrossRef] [Green Version]
- CDC. Underlying Cause of Death, 1999–2020. Available online: https://wonder.cdc.gov/controller/saved/D76/D266F024 (accessed on 22 April 2021).
- Kim, Y. The Causal Structure of Suppressor Variables. J. Educ. Behav. Stat. 2019, 44, 367–389. [Google Scholar] [CrossRef]
- Barmania, S.; Reiss, M.J. Health promotion perspectives on the COVID-19 pandemic: The importance of religion. Glob. Health Promot. 2020, 28, 15–22. [Google Scholar] [CrossRef] [PubMed]
- Dein, S.; Loewenthal, K.; Lewis, C.A.; Pargament, K.I. COVID-19, mental health and religion: An agenda for future research. Ment. Health Relig. Cult. 2020, 23, 1–9. [Google Scholar] [CrossRef]
- DeFranza, D.; Lindow, M.; Harrison, K.; Mishra, A.; Mishra, H. Religion and reactance to COVID-19 mitigation guidelines. Am. Psychol. 2021, 76, 744–754. [Google Scholar] [CrossRef]
- Wildman, W.J.; Bulbulia, J.; Sosis, R.; Schjoedt, U. Religion and the COVID-19 pandemic. Relig. Brain Behav. 2020, 10, 115–117. [Google Scholar] [CrossRef] [Green Version]
- Vermeer, P.; Kregting, J. Religion and the Transmission of COVID-19 in The Netherlands. Religions 2020, 11, 393. [Google Scholar] [CrossRef]
- Perry, S.L.; Whitehead, A.L.; Grubbs, J.B. Save the Economy, Liberty, and Yourself: Christian Nationalism and Americans’ Views on Government COVID-19 Restrictions. Sociol. Relig. 2020, 82, 426–446. [Google Scholar] [CrossRef]


| Variable Name | Description and Source |
|---|---|
| Outcome | |
| COVID-19 death rate | Cumulative deaths per 100,000 as of 1 December 2021 (USAFacts) |
| Socio-economic traits | |
| Gini index | Gini index of income inequality (2014–2018 ACS 5-year estimates) |
| Median household income | Estimate of median household income, 2018 (U.S. Census Bureau) |
| % Bachelor’s | Percent of adults with a bachelor’s degree or higher, 2014–2018 (U.S. Census Bureau) |
| Rural | Rural-urban Continuum Code, 2013 (USDA ERS) |
| Population composition | |
| Population (ln) | Natural logarithm of population size (USAFacts) |
| Population density | Land area density for population as per 2010 census (U.S. Census Bureau) |
| % Black | Black or African American share of population, 2014–2018 (U.S. Census Bureau) |
| % Hispanic | Hispanic share of population, 2014–2018 (U.S. Census Bureau) |
| % Age > 85 | Share of population with age above 85, 2014–2018 (U.S. Census Bureau) |
| Ideology | |
| % Trump vote | Share of population voting for Trump in the 2020 presidential elections (MIT Election Data and Science Lab) |
| % Evangelical | Evangelical Protestant; rates of adherence per 1000 population, 2010 (Grammich et al., 2018 [56]) |
| Health | |
| Death rate 2014–2019 | Age-adjusted deaths per 100,000 population, 2014–2019 (CDC) |
| Health behavior | |
| Mask usage | % Always or frequently wearing a mask (The New York Times and Dynata 2020) |
| Healthcare | |
| % Uninsured | Share of population with no health insurance coverage (2014–2018 ACS 5-year estimates) |
| Primary care physician rate | Active Primary Care Physicians per 100,000 Population, 2018, state-level (AAMC) |
| ICU beds | Number of ICU beds per county, 2018–19 (Kaiser Family Foundation) |
| N | Mean | SD | Min. | Max. | |
|---|---|---|---|---|---|
| COVID-19 death rate | 3023 | 286.78 | 134.88 | 0.00 | 1008.35 |
| Gini index | 3023 | 0.45 | 0.04 | 0.34 | 0.71 |
| Median HH income | 3023 | 52,710.64 | 13,877.21 | 25,385.00 | 140,382.00 |
| % Bachelor’s + | 3023 | 21.55 | 9.46 | 5.40 | 78.50 |
| Rural | 3023 | 4.89 | 2.66 | 1.00 | 9.00 |
| Population (ln) | 3023 | 10.38 | 1.41 | 6.98 | 16.12 |
| Population density | 3023 | 265.93 | 1748.60 | 0.50 | 69,468.40 |
| % Black | 3023 | 0.10 | 0.15 | 0.00 | 0.86 |
| % Hispanic | 3023 | 0.10 | 0.14 | 0.01 | 0.96 |
| % Age > 85 | 3023 | 2.37 | 0.83 | 0.55 | 7.54 |
| % Trump vote | 3023 | 64.60 | 15.91 | 8.73 | 93.08 |
| % Evangelical | 3023 | 23.32 | 16.04 | 0.00 | 130.87 |
| Death rate 2014–2019 | 3023 | 821.98 | 144.54 | 266.20 | 1590.20 |
| Mask usage | 3023 | 0.72 | 0.13 | 0.25 | 0.99 |
| % Uninsured | 3023 | 9.52 | 4.90 | 1.37 | 40.91 |
| PCP rate | 3023 | 87.75 | 12.08 | 65.30 | 134.30 |
| ICU beds | 3023 | 24.60 | 85.94 | 0.00 | 2126.00 |
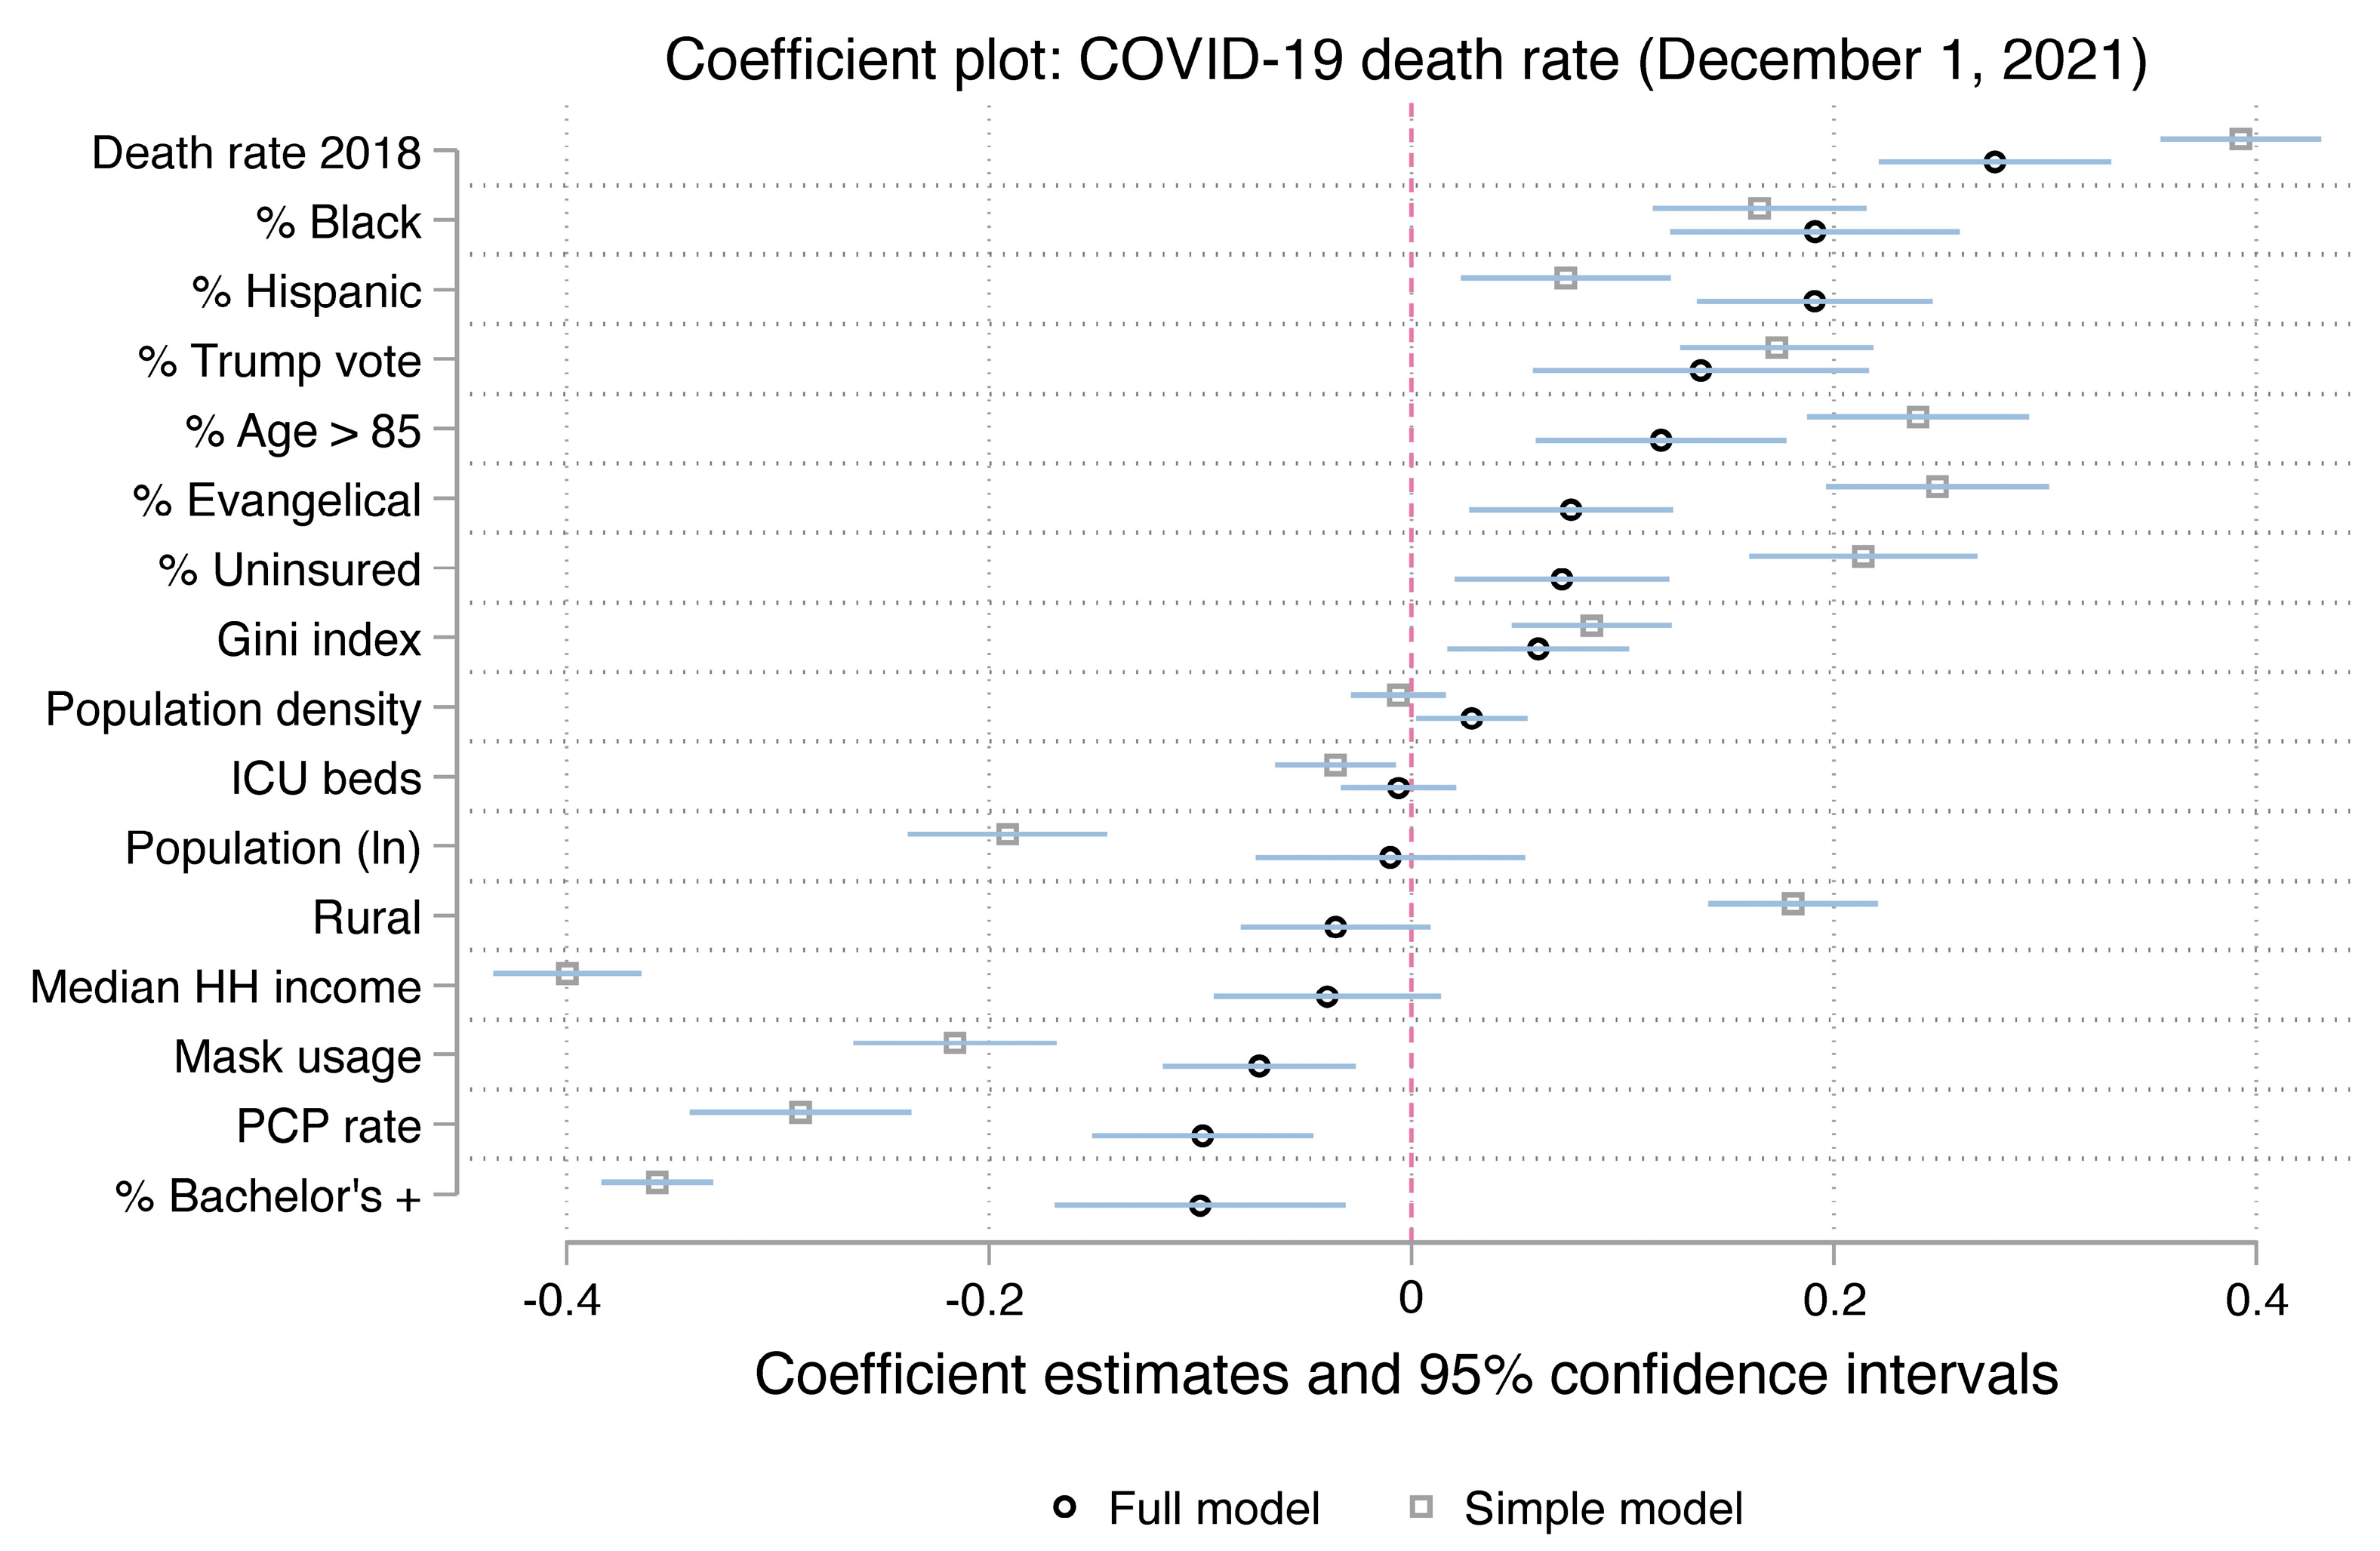
| Variable | Coefficient | SE | Z | 95% CI |
|---|---|---|---|---|
| Gini index | 0.040 * | 0.020 | 1.984 | (0.000, 0.080) |
| Median household income | 0.037 | 0.025 | 1.508 | (−0.011, 0.086) |
| % Bachelor’s + | −0.089 ** | 0.033 | −2.704 | (−0.153, −0.024) |
| Rural | −0.001 | 0.021 | −0.025 | (−0.042, 0.040) |
| Population (ln) | 0.015 | 0.029 | 0.494 | (−0.043, 0.072) |
| Population density | 0.029 * | 0.012 | 2.426 | (0.006, 0.053) |
| % Black | 0.163 *** | 0.032 | 5.038 | (0.099, 0.226) |
| % Hispanic | 0.183 *** | 0.027 | 6.811 | (0.131, 0.236) |
| % Age > 85 | 0.321 *** | 0.027 | 12.002 | (0.269, 0.374) |
| % Trump vote | 0.146 *** | 0.037 | 3.953 | (0.073, 0.218) |
| % Evangelical | 0.041 | 0.024 | 1.708 | (−0.006, 0.087) |
| Death rate 2014–2019 | 0.379 *** | 0.030 | 12.663 | (0.320, 0.438) |
| Mask usage | −0.011 | 0.022 | −0.508 | (−0.055, 0.032) |
| % Uninsured | 0.053 * | 0.026 | 2.065 | (0.003, 0.103) |
| PCP rate | −0.099 *** | 0.025 | −3.892 | (−0.149, −0.049) |
| ICU beds | −0.008 | 0.015 | −0.586 | (−0.037, 0.020) |
| Constant | 0.011 | 0.026 | 0.440 | (−0.039, 0.062) |
| Lambda | 0.522 *** | 0.023 | 23.102 | (0.478, 0.567) |
| N | 3023 | |||
| Pseudo R-squared | 0.4371 |
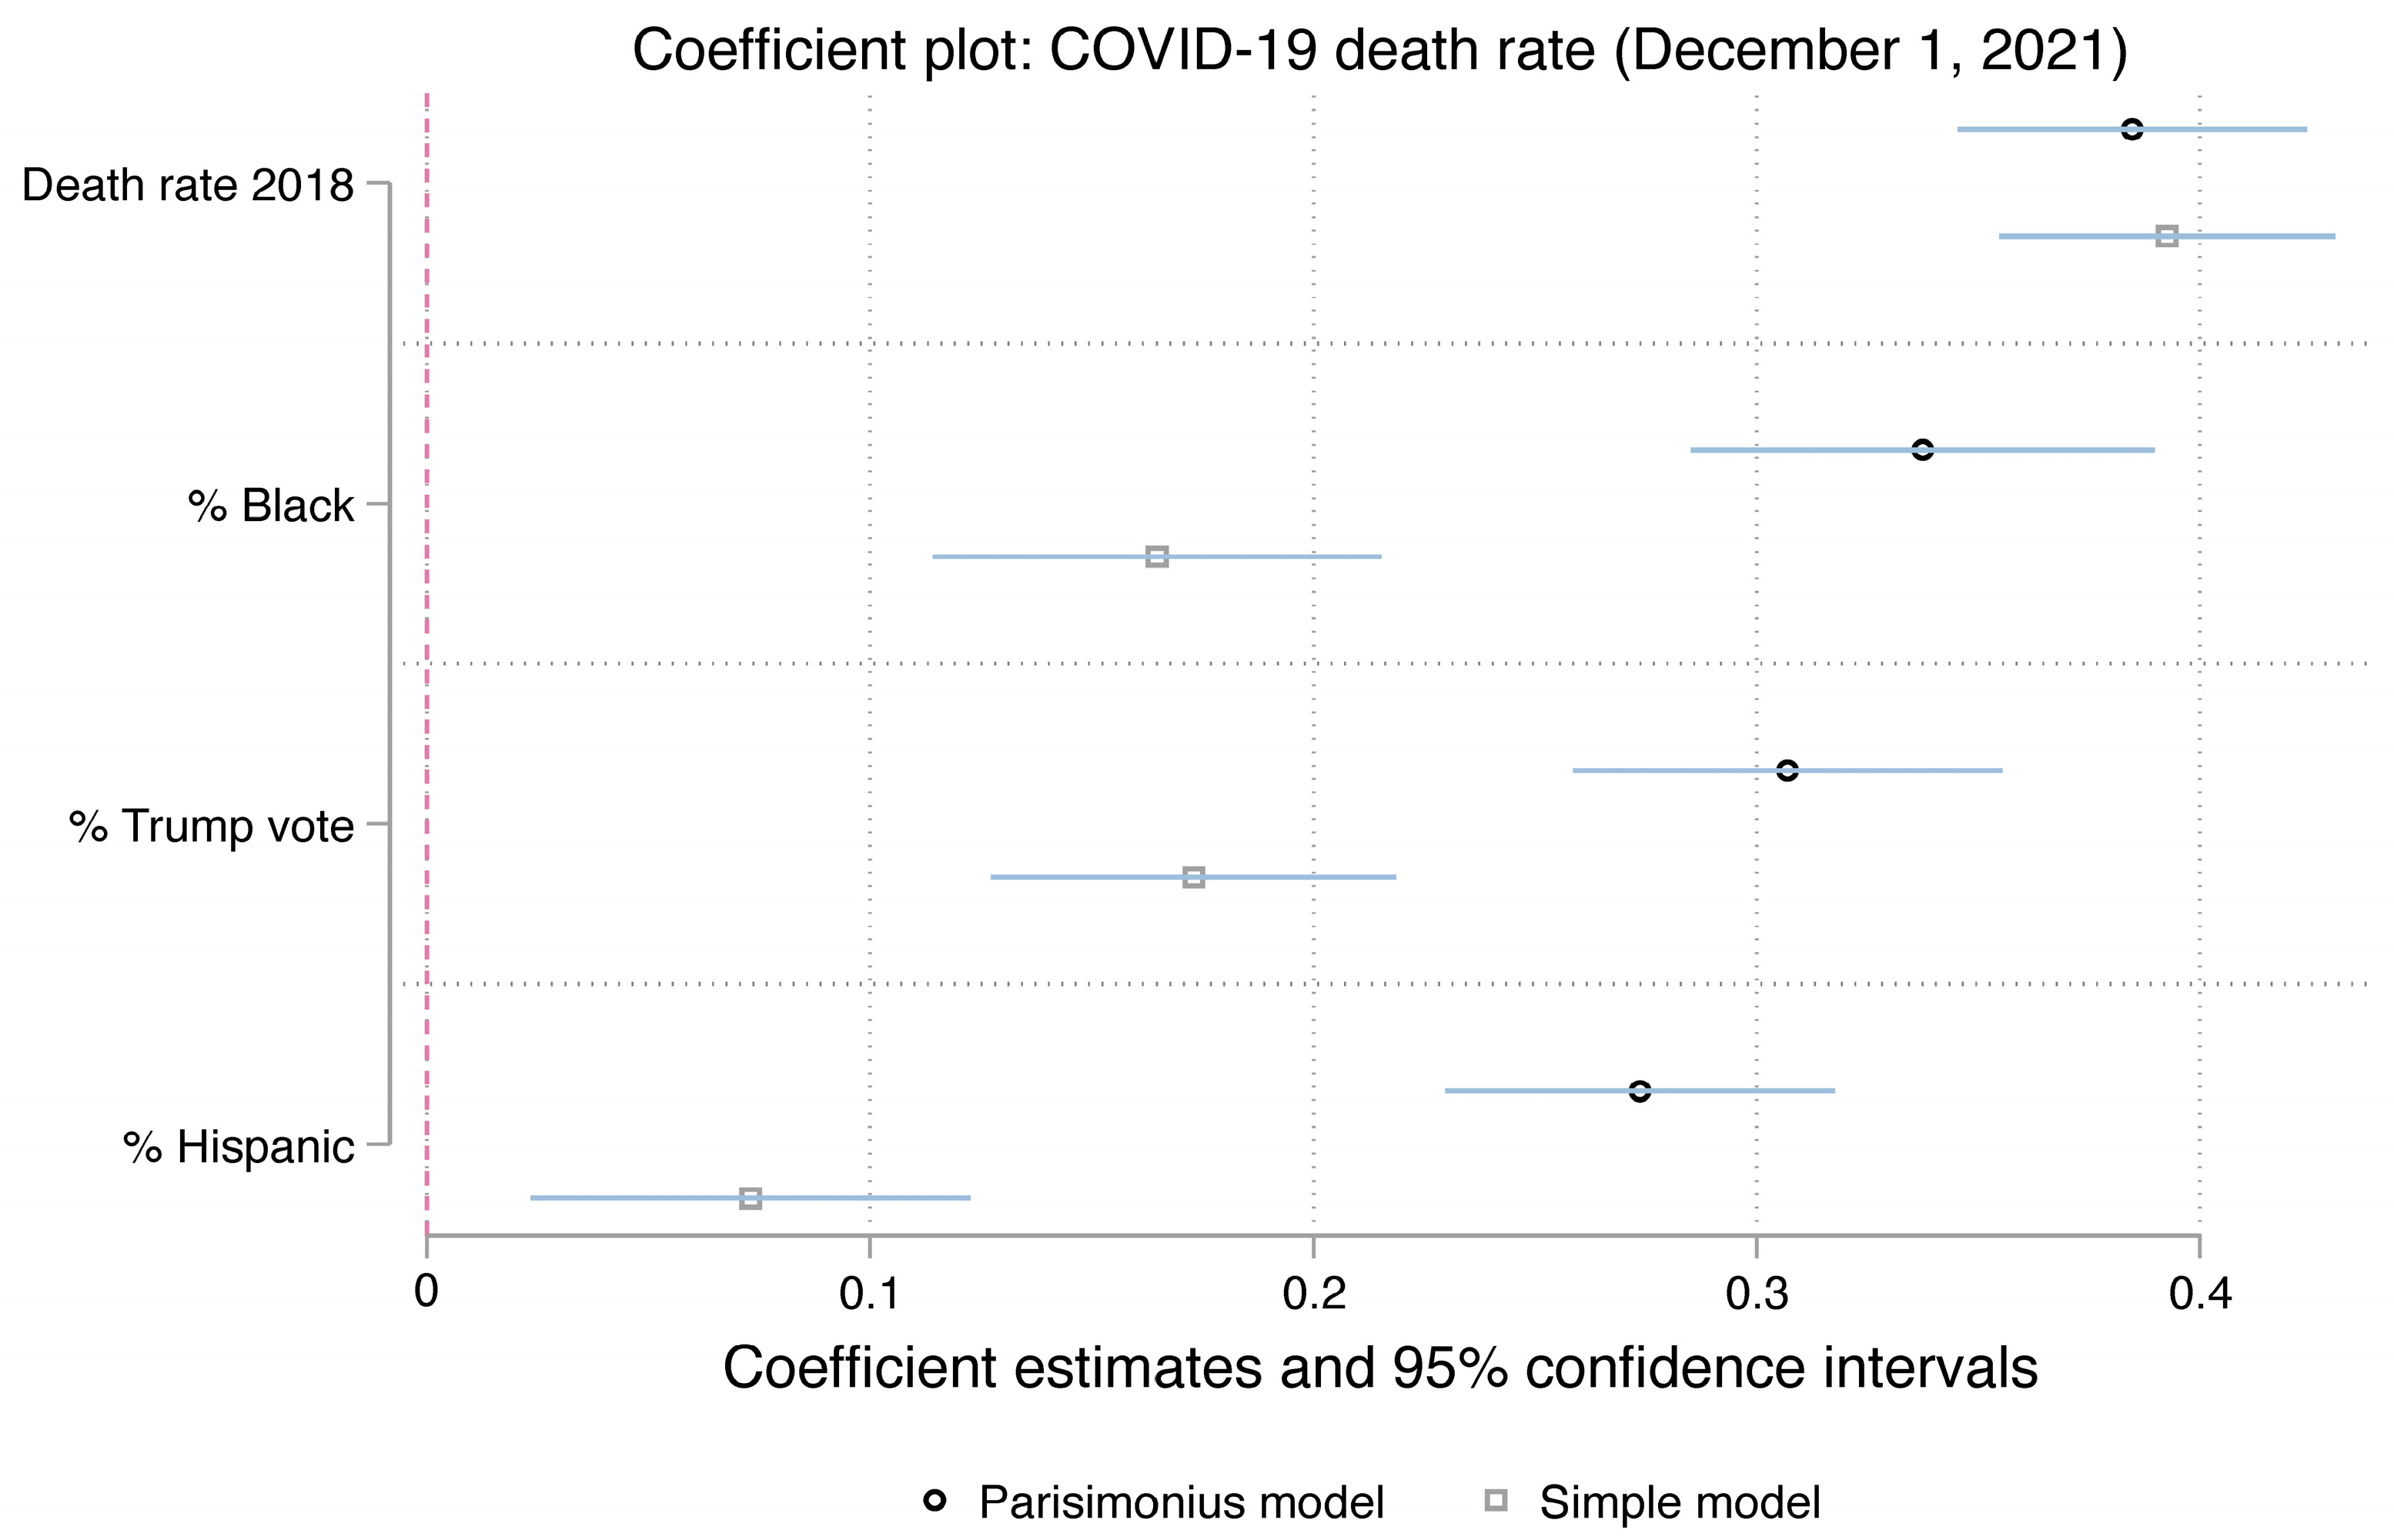
| Variable | Coefficient | SE | Z | 95% CI |
|---|---|---|---|---|
| % Black | 0.251 *** | 0.031 | 8.129 | (0.190, 0.311) |
| % Hispanic | 0.171 *** | 0.023 | 7.294 | (0.125, 0.217) |
| % Trump vote | 0.304 *** | 0.024 | 12.697 | (0.257, 0.351) |
| Death rate 2014–2019 | 0.374 *** | 0.025 | 15.198 | (0.325, 0.422) |
| Constant | 0.007 | 0.028 | 0.250 | (−0.047, 0.061) |
| Lambda | 0.541 *** | 0.021 | 25.672 | (0.500, 0.582) |
| N | 3023 | |||
| Pseudo R-squared | 0.3492 |
Disclaimer/Publisher’s Note: The statements, opinions and data contained in all publications are solely those of the individual author(s) and contributor(s) and not of MDPI and/or the editor(s). MDPI and/or the editor(s) disclaim responsibility for any injury to people or property resulting from any ideas, methods, instructions or products referred to in the content. |
© 2023 by the authors. Licensee MDPI, Basel, Switzerland. This article is an open access article distributed under the terms and conditions of the Creative Commons Attribution (CC BY) license (https://creativecommons.org/licenses/by/4.0/).
Share and Cite
Rambotti, S.; Wolski, C.; Anderson, K.F. It Didn’t Go Away: The Political and Social Determinants of COVID-19 Mortality Rates across Counties in the United States. COVID 2023, 3, 370-380. https://doi.org/10.3390/covid3030027
Rambotti S, Wolski C, Anderson KF. It Didn’t Go Away: The Political and Social Determinants of COVID-19 Mortality Rates across Counties in the United States. COVID. 2023; 3(3):370-380. https://doi.org/10.3390/covid3030027
Chicago/Turabian StyleRambotti, Simone, Caroline Wolski, and Kathryn Freeman Anderson. 2023. "It Didn’t Go Away: The Political and Social Determinants of COVID-19 Mortality Rates across Counties in the United States" COVID 3, no. 3: 370-380. https://doi.org/10.3390/covid3030027