
The Construction of the “Older Worker”

1
Wilhelm Wundt Institute of Psychology, Leipzig University, 04109 Leipzig, Germany
2
Department of Psychology, Saint Louis University, St. Louis, MO 63103, USA
*
Author to whom correspondence should be addressed.
Merits 2023, 3(1), 115-130; https://doi.org/10.3390/merits3010007
Submission received: 30 October 2022
/
Revised: 11 January 2023
/
Accepted: 13 January 2023
/
Published: 17 January 2023
Abstract
:The notion of the “older worker” is frequently used in the organizational literature, in organizational practice, and in society, but so far, no research has investigated why people consider someone to be an older worker at a certain age. In the qualitative part of this study, we examined potential reasons for considering workers to be “older” at a certain age. In the quantitative part of this study, we investigated demographic characteristics (i.e., age, sex, education), job characteristics (i.e., job level, typical age in a job), and beliefs (i.e., perceived remaining time at work, motivation to continue working after retirement, positive and negative age stereotypes) as predictors of people’s conceptions of “older worker age”.” Data were provided by 269 employees from various jobs and organizations. The mean age at which participants considered someone to be an “older worker” was approximately 55 years. The most frequently stated reasons for considering workers to be “older” at a certain age were retirement age and age-related decline. Results of a regression analysis showed that participants’ age, sex, and perceived remaining time predicted “older worker age”. These findings provide first insights into the psychological construction of the “older worker”.
1. Introduction
Chronological age is undoubtedly one of the most-important social categories people use to understand themselves and others [1,2,3,4]. Thus, it is not surprising that the notion of the “older worker” is frequently used in the organizational literature, in everyday organizational practice, as well as in broader societal discourse and legislation [5,6]. For example, in the United States, the Age Discrimination in Employment Act (ADEA) of 1967 defines older workers as those 40 years of age or older [7]. Organizational scholars have used the same or similar cut-offs to define “older workers” (e.g., 45, 50, or 55 years), and almost always, it is acknowledged that these cut-offs are relatively arbitrary [8,9]. In contrast to earlier life stages such as childhood and adolescence, which involve unique physiological events such as dentition and puberty, adult development is a continuous process [10,11]. In addition, most age-related, normative (i.e., typical) biological and cultural processes, such as declines in cognitive functioning and health, gains in knowledge, experience, and status, as well as changes in personality and motives occur gradually across the lifespan [12,13]. One notable exception is the transition to retirement, which in most Western countries typically occurs around the ages of 60 or 65 years [14,15]. As scholars have noted, most retirement policies and benefits are inherently linked to age [4].
While biological aging is an inevitable process that is largely beyond human control, aging in the work and organizational context is subject to social–psychological constructions by which workers and other organizational stakeholders attempt to make sense of different ages and the aging process. People’s conceptions of who is classified as an “old person” or “older worker” may be influenced by, and may have important implications for, their individual attitudes, interpersonal processes, and the allocation of material and immaterial benefits in organizations and broader society [16]. For example, someone who considers 40 years to be the “older worker age” may think differently about their own aging, work, and retirement than someone who considers 60 years to be the “older worker age”. In addition, research on social identities in the workplace suggests that workers’ conceptions of “older worker age” may influence how they interact with co-workers of their own and of different ages [17,18]. For instance, research showed that workers between the ages of 50 and 59 years, who categorized themselves as “older workers”, had more negative attitudes toward work (i.e., stronger desire to retire early and stronger inclinations towards intergenerational competition) than workers who did not perceive themselves as “older” [19]. Other scholars have argued more broadly that the segmentation of the lifespan and the creation of relatively arbitrary age groups represent “a favorite way of dividing up social problems”, including the decision about the allocation of services, benefits, and burdens to people based on their age [20] (p. 200).
Despite the pervasiveness of the “older worker” concept in organizations and broader society, no research has so far investigated at what specific age people consider a worker to be an “older worker” and their reasons for their endorsement of a certain “older worker age”. This is surprising, given that researchers have proposed that formal and informal structuring of the lifespan into distinct age categories is more likely to occur in economic settings than in other life settings (e.g., family [4]). In addition, anecdotal evidence suggests that most people, when asked, are able to specify their idea of the “older worker age”. The first goal of our study is to contribute to the literature by identifying potential reasons for considering workers to be “older” at a certain age using qualitative methods. The second goal is to examine workers’ demographic characteristics, job characteristics, and individual beliefs as predictors of their conceptions of “older worker age” using quantitative methods. To achieve these goals, we conducted a mixed-method study with 269 workers from various jobs and organizations based on theories from social and organizational psychology, as well as the lifespan and gerontology literature. For the purpose of this study, “older worker age” is defined as a person’s conceptualization of the chronological age when “younger” or “middle-aged workers” become “older workers”. In the following sections, research on people’s conceptualizations of “old age” is reviewed, potential predictors of “older worker age” are described, and the methods and results of our study designed to test the hypotheses are presented and discussed.
2. Age Considered to Be “Old”
Similar to “older worker age”, several different national and international conventions exist for classifying people as “old” or “older” in general. These broad age-related classifications are oftentimes supplemented with more clearly specified age cut-offs or age ranges because they have policy implications [21]. For example, the United Nations define “older persons” as those aged 60 years or older [22]. Similarly, the World Health Organization states that “Most developed world countries have accepted the chronological age of 65 years as a definition of ‘elderly’ or older person... While this definition is somewhat arbitrary, it is many times associated with the age at which one can begin to receive pension benefits” [23](no page available). In contrast to the lack of research on “older worker age”, researchers in sociology, lifespan psychology, and gerontology have previously examined at which ages, and why, people consider someone to be “old” or “older” [4,10].
Extant studies have used one of two methods to construct a “mental map of the life cycle” [24] (p. 35). One possibility is to ask participants to divide individuals’ lifetime from birth to death into distinct age categories, such as “young”, “middle-aged” and “old” [25,26]. Another possibility is to present participants with distinct age categories and to ask them to indicate age parameters that they associate with these categories, such as typical ages or age ranges. For example, a study asked participants for their ideas of the specific ages at which “young”, “middle-aged”, “old”, and “aged” begin [27]. One of the findings of this research was that there was a positive relationship between participants’ perceived onset of “older” age categories and their own age.
Other early research also found that older people perceived the onset of “old age” to be later than younger people [28,29]. Similarly, a study presented participants with questions on the “Onset of Adult Phases” [30]. The results showed that older community volunteers perceived the onset of “middle age” and “old age” to be later than young undergraduate students. In addition, participants’ sex was related to their conceptions of “old age”, such that female participants indicated later onsets for “middle-age” and “old age” than male participants.
Two studies conducted in Nigeria examined conceptions of “old age” in two samples of younger people between 18 and 35 years and older people between 55 and 99 years [31,32]. On average, younger participants perceived the onset of “old age” to be approximately 73 years for men and 64 years for women. Older participants perceived “old age” to start at approximately 77 years for men and 64 years for women. Younger participants associated both positive events (e.g., having children and grandchildren, more leisure time, giving advice to young people) and negative events (e.g., chronic illness, nearness of death, widowhood, loneliness) with being old [31]. Additionally, when asked about signs that suggest that a person is old, participants indicated decreased vigor and economic productivity among men, and menopause among women [31]. Consistently, a study conducted in Japan found that younger participants perceived “old age” to begin earlier in the life course than older participants [33]. Finally, a more recent study on conceptions of “old age” also found that people’s perceptions of the onset of “old age” are positively related to their own age [34].
Although these previous studies have expanded our understanding of people’s conceptualizations of different age categories and some of the underlying reasons for these social–psychological age constructions, one of their limitations is that they did not investigate conceptualizations of “old” and “older” ages in different life spheres, such as in the work and organizational context. Another limitation of these studies is that they did not examine predictor variables other than participants’ own age and sex. In the following two sections, these shortcomings are addressed by discussing (a) several potential reasons for conceptualizing a specific age to be “older worker age” and (b) a variety of potentially relevant demographic and job characteristics, and individual beliefs as predictors of specific “older worker ages”.
3. Reasons for Conceptualizing a Specific Age to Be “Older Worker Age”
The qualitative part of this study aimed at identifying workers’ reasons for conceptualizing a certain age to indicate “older worker age”. While some people might intuitively choose a certain “older worker age” (or may not be able to articulate their specific reasons), others may consciously rely on widely-known facts about aging as well as psychologically, socially, and culturally constructed meanings of age. Reasons for considering a worker to be “older” at a certain age might include facts and ideas about:
- (a)
- (b)
- (c)
- (d)
It is likely that additional reasons for nominating certain “older worker ages” exist, but we assumed that the reasons outlined above are among the most important ones.
4. Predictors of “Older Worker Age”
4.1. Demographic and Job Characteristics
In the quantitative part of our study, consistent with previous research, we expected that conceptions of “older worker age” are positively related to the age of the person who is asked, such that older people will nominate higher “older worker ages” than younger people. A possible explanation for this hypothesis may be that terms such as “old” and “older worker” carry a negative connotation for many people, including people at higher ages, due to widely-held negative stereotypes about “older people” and “older workers” [43,44,45,46,47]. For example, the stereotype that work performance declines with age is still common, even though meta-analytic evidence has suggested that this stereotype is generally unfounded [48,49]. As people grow older, they might increasingly reject the idea of themselves as being “older”, because they do not perceive a decline in performance and other stereotypical limitations attributed to “older workers” for themselves. Indeed, research from the field of lifespan psychology has shown that older adults still perceive many opportunities in their remaining lives, despite of limitations in selected areas such as physical health [50]. Thus, with increasing age, people are likely to shift their conceptualizations of “older worker age” to later segments of the working lifespan. This theoretical reasoning is consistent with previous studies on “general old age” (i.e., conceptualizations of “old age” outside the work and organizational context [27,28,29,30,31,32,33,34]). These studies unanimously found positive associations between people’s conceptualizations of “general old age” and their own age.
Hypothesis 1.
Workers’ own age is positively related to their conceptualization of “older worker age”, such that older workers indicate a later onset than younger workers.
It is furthermore expected that workers’ sex is related to their conceptualizations of “older worker age”. Consistent with findings on sex differences with regard to ideas about general “old age”, it is hypothesized that women will indicate later onsets for “older worker age” than men [30]. This assumption follows previous suggestions in the anthropological literature that the social–psychological meaning of the aging process and different age categories varies by sex [51]. A possible explanation for the expected sex difference with regard to “older worker age” may be that men’s life expectancy is generally lower than women’s—approximately 5-6 years on a global scale [52]. Men might consider themselves “older workers” earlier in their working lives than women, because they have generally less time left to live. In addition, men are more likely to work in physically demanding jobs than women, thus their work ability declines more strongly with increasing age [53].
Hypothesis 2.
Workers’ sex is related to their conceptualization of “older worker age”, such that men will indicate an earlier onset than women.
Scholars have suggested that experiences of aging are associated with people’s social status as indicated by, for instance, education and job status [4]. These authors also pointed out that researchers have so far neglected the investigation of relationships between social status and constructions of age and aging. In this study, it is expected that higher levels of education and higher job status are linked to later perceived onsets of “older worker age”, whereas lower levels of education and job status go hand in hand with earlier conceptualizations of “older worker age”. One explanation for these hypotheses may be that highly educated individuals and those in high status jobs have more material, social, and psychological resources (e.g., professional knowledge) to continue working after retirement or to find bridge employment [41,54]. Thus, these individuals might consider themselves “older workers” at later career stages than their less educated counterparts and those who work in less prestigious jobs.
Hypothesis 3.
Workers’ level of education is positively related to their conceptualization of “older worker age”, such that workers with a higher level of education indicate a later onset than workers with a lower level of education.
Hypothesis 4.
Workers’ job status is positively related to their conceptualization of “older worker age”, such that workers with a higher job status indicate a later onset than workers with a lower job status.
It can further be expected that workers base their conceptualization of “older worker age” on the typical age of workers in their current job [55]. For example, a software designer might observe that most of their co-workers are in their late 20s or early 30s and thus conclude that a 40-year-old is an “older worker” in this profession. In contrast, a librarian might work primarily together with relatively older individuals (including older volunteer workers) and therefore conclude that 60 or 70 years represents an appropriate age to consider someone to be an “older worker”. No empirical research has so far examined this assumption.
Hypothesis 5.
The typical age in workers’ jobs is positively related to their conceptualization of “older worker age”, such that workers in jobs with a higher typical age indicate a later onset than workers in a job with a lower typical age.
4.2. Individual Beliefs
In addition to demographic and job characteristics, it is expected that certain individual beliefs are related to people’s conceptualizations of “older worker age”. Specifically, it can be argued that workers’ perceived remaining time at work and their motivation to continue working after retirement are positively associated with their ideas of “older worker age”. The concept of perceived remaining time was adapted from the lifespan literature to the work and organizational context to describe workers’ attitudes or beliefs regarding how much time they have left before they stop working [42,56]. The concept of motivation to continue work after retirement has received increased attention in the literature on work, aging, and retirement, and refers to people’s favorable attitude to engage in paid or unpaid work after their formal retirement age [57,58].
We argue that the more expansive people’s perceived remaining time at work and the more favorable their motivation to continue working after retirement (independent of their age), the later they consider someone to be an “older worker”. In contrast, when people’s perceived remaining time at work is limited and their motivation to continue work after retirement is low (again independent of their age), the earlier they should consider someone to be an “older worker”. The rationale for these hypotheses is similar to the rationale provided for the assumed relationship between workers’ age and “older worker age” based on the age stereotypes literature. When a worker perceives having a lot of time left in the work context and is motivated to extend their working lifespan, they are more likely to reject the idea that they might be considered an “older worker” in the near future and thus nominate a later “older work age”. In contrast, when a worker perceives having limited time left at work and is not motivated to work beyond their formal retirement age, they should be more comfortable with indicating an earlier “older worker age”.
Hypothesis 6.
Workers’ perceived remaining time at work is positively related to their conceptualization of “older worker age”, such that workers with more perceived remaining time at work indicate a later onset than workers with less perceived remaining time at work.
Hypothesis 7.
Workers’ motivation to continue working after retirement is positively related to their conceptualization of “older worker age”, such that workers with higher motivation to continue working indicate a later onset than workers with lower motivation to continue working.
Based on work in the lifespan psychology literature that has examined the influence of age stereotypes on individuals’ self-perceptions of aging, it is further expected that workers’ age stereotypes are associated with their conceptualizations of “older worker age” [59,60]. Research on age stereotypes suggests that stereotypes about older workers can be both positive and negative, and that these two dimensions are not necessarily interrelated [61,62]. For example, older workers in general may be perceived as experienced, mature, and reliable, but at the same time also as inflexible, unable to learn, and slow. It is assumed that the more positive age stereotypes a worker holds, the later their nominated “older worker age”. In contrast, negative age stereotypes should be negatively associated with the onset of “older worker age”.
A potential reason for these assumptions may be found in people’s association with the term “older worker”. People with generally more positive attitudes about age and the aging process might perceive the term to be rather negative, and therefore should be inclined to delay the onset of “older worker age” as long as possible. In contrast, people with more negative attitudes toward age and aging might more readily accept the term “older worker”, and should be more willing to accept the idea of labeling a worker in their 30s or 40s to be “older”. However, so far no empirical research has tested these assumptions.
Providing theoretical support for our assumptions, labeling theory proposes that people who face age stereotypes are likely to internalize (or assimilate) the content of the stereotypes into their self-evaluations and evaluations of others [63]. This phenomenon is also known as the contamination or infusion hypothesis [64]. Indeed, empirical research suggests that priming positive or negative age stereotypes leads to stereotype-consistent behaviors [65,66] and beliefs about aging [67,68].
Hypothesis 8.
Workers’ positive age stereotypes are positively related to their conceptualization of “older worker age”, such that workers with more positive age stereotypes indicate a later onset than workers with less positive age stereotypes.
Hypothesis 9.
Workers’ negative age stereotypes are negatively related to their conceptualization of “older worker age”, such that workers with more negative age stereotypes indicate an earlier onset than workers with less negative age stereotypes.
5. Methods
5.1. Participants and Procedure
Data for the present study were provided by 269 employed participants residing in the United States. One hundred and forty participants (52%) were female and 129 (48%) were male. Ages ranged between 18 and 64 years (M = 33.93, = 11.28). In terms of highest level of education achieved, four participants (1.5%) indicated some high school, 41 (15.2%) had a high school degree, 82 (30.5%) indicated some college, 104 (38.7%) had completed an undergraduate degree, and 38 (14.1%) had completed a postgraduate degree. Participants’ average job tenure was 5.87 years ( = 6.71), and on average participants worked for 37.75 h per week ( = 11.66). Job descriptions included accountant, assembly line worker, attorney, bookkeeper, cashier, computer technician, construction worker, cook, customer service, dental hygienist, engineer, firefighter, graphic designer, human resources manager, IT consultant, lawyer, librarian, military, massage therapist, musician, physician, registered nurse, sales associate, teacher, window cleaner, and writer.
Participants were recruited using the popular crowdsourcing website Amazon’s Mechanical Turk (MTurk). Participants received $0.50 U.S. dollars for their participation in the study. The use of MTurk to collect high-quality survey and qualitative data in a fast and inexpensive way has been recommended by researchers [69,70]. For example, a study showed that data obtained using MTurk are at least as reliable as data obtained using traditional methods and that MTurk workers are generally more diverse than student samples [69].
5.2. Measures
5.2.1. “Older Worker Age” and Reasons for Indicating a Certain Age
Participants were presented with the question, “At what age do you consider someone to be an ‘older worker’?” and were asked to enter an age. Participants responses ranged between 30 and 75 years (M = 55.40, = 8.94). After they had responded to the first question, participants were additionally asked to state in writing, in an open question format, why they chose a certain age.
5.2.2. Demographic and Job Characteristics
Participants’ age was measured in years since birth. Participants also indicated their sex (1 = male, 2 = female), and highest level of education achieved (1 = some high school, 2 = high school degree, 3 = some college, 4 = undergraduate degree, 5 = postgraduate degree). Job status was measured with a single question [71]. Specifically, participants were asked to indicate their job level in their organization on a ladder with seven rungs, with the top rung representing workers who are at the top of the organizational chart, and the bottom rung representing employees in entry-level positions.
Typical age in a job was derived using a three-step procedure. First, participants were asked for their current job description (for examples, please see Participants section). In the next step, a separate sample of 50 participants was recruited using MTurk. These participants were presented with the 269 job descriptions in random order and asked to assign a typical age of workers to each job description. Finally, the typical age in a job for each of the 269 participants was computed by averaging the 50 ages indicated for each job description. Typical ages ranged from 20.94 years (fast food restaurant worker) to 44.36 years (director of operations), with an average typical age across job descriptions of 34.31 years ( = 4.29). Additional examples of job descriptions and typical ages include server (25.70 years), swim coach (30.36 years), registered nurse (35.04 years), and librarian (40.08 years).
5.2.3. Individual Beliefs
All ratings for the individual beliefs items were provided on five-point Likert scales ranging from 1 (strongly disagree) to 5 (strongly agree). Perceived remaining time at work was measured with three items adapted from a general future time perspective scale [42,72]. The items are “Most of my occupational life lies ahead of me”, “My occupational future seems infinite to me”, and “As I get older, I begin to experience time in my occupational future as limited” (reverse coded). Cronbach’s for the scale was 0.79. Motivation to continue working after retirement was measured with three items [57]. The items are “Barring unforeseen circumstances, I would remain working as long as possible”, “If I were completely free to choose, I would prefer to continue working after my retirement age”, and “I expect to continue working as long as possible after my retirement age.” Cronbach’s for this scale was 0.92.
Positive and negative age stereotypes were measured with 11 items [43]. Participants were instructed to rate whether older people in general can be described by a number of positive and negative adjectives. Example adjectives included in the positive age stereotypes scale are “experienced”, “knowledgeable”, and “practical”. Example adjectives included in the negative age stereotypes scale are “forgetful”, “inflexible”, and “tired”. Cronbach’s s were 0.84 for the positive age stereotypes scale, and 0.88 for the negative age stereotypes scale.
5.3. Open Science Practices
In service of openness and transparency, all data, code, and outputs supporting the result presented here have been made available in an online appendix via the open science framework (OSF): https://osf.io/48v6r/ (accessed on 28 October 2022).
6. Results
6.1. Qualitative Part of Study
The reasons provided by participants were read by two independent experts in the area of aging at work, who subsequently generated two separate lists of themes for coding participants’ reasons. The experts discussed these lists and agreed on a final list of 12 themes and one “other” category. In the next step, each of the 269 reasons provided by participants were coded independently by the two experts by assigning the 12 themes (or “other”) to each reason. Importantly, multiple themes could be assigned to each reason, and the number of themes assigned to reasons ranged between one and four. Example responses, grouped by “older worker age” bands (e.g., 30–39 years), are provided in Table 1. The purpose of this table is to illustrate common explanations or example reasons provided by participants for different “bands” of “older worker ages”.
The reason “retirement age” (contained in 101 reasons, 37.3%) was assigned to a response when participants explained that a certain “older worker age” was close to or at the typical retirement age. The reason “retirement planning” (19; 7%) was assigned when participants indicated that at a certain “older worker age” people would start thinking about or planning for their retirement. The reasons “career stability” (13; 4.8%) and “career opportunities” (13; 4.8%) were assigned when participants mentioned that at a certain “older worker age” people would enter a more stable phase of their working lives or that there was a lack of new work and career possibilities at a certain “older worker age”, respectively.
The reasons “decline” (59; 21.8%) and “experience” (21; 7.7%) were assigned by the experts when participants explained that certain age-related losses in functioning or gains in knowledge, skills, and abilities, respectively, would occur at a certain “older worker age”. “Profession” (12; 4.4%) was assigned when participants indicated that a certain “older worker age” was specific for a certain occupation or job type, and “intuition” (24; 8.9%) was assigned when participants wrote that they chose a certain “older worker age” based on their gut feelings.
The reason “society” (14; 5.2%) was assigned when participants mentioned certain societal norms and expectations related to “older worker age”, and the reason “legal” (12; 4.4%) was assigned when participants explained that workers would be eligible for memberships (e.g., AARP) or benefits (e.g., senior citizen discounts) at a certain “older worker age”.
The reason “relative age” (25; 9.2%) was assigned when participants justified their choice of a certain “older worker age” with the relative distance from their own current age. The reason “time left” (26; 9.6%) was assigned when participants mentioned that a certain “older worker age” implied that workers would have only a certain amount of time left on the job. Finally, the “other” category was assigned only seven times (2.6%).
The inter-rater reliability for each category was estimated using Krippendorff’s coefficient, a standard reliability measure for coding data [73]. As can be seen in Table 2, Krippendorff’s coefficients ranged between 0.73 to 0.89, indicating satisfactory to good reliabilities. Coding disagreements were discussed by the two experts until agreement was reached. Table 2 shows the frequencies and proportions of the final codings in each category. In summary, the most frequently stated reasons for considering workers to be “older” at a certain age were retirement age and age-related decline.
6.2. Quantitative Part of Study
For descriptive statistics and correlations among observed substantive variables, see Table 3 and Table 4.
“Older worker age” was significantly (p < 0.05) and positively related to participants’ age ( = 0.304), providing preliminary support for Hypothesis 1. In addition, the significant correlation between “older worker age” and sex in Table 4 indicates that women indicated higher “older worker ages” than men, providing preliminary support for Hypothesis 2. “Older worker age” was also positively correlated with participants’ motivation to continue working after retirement ( = 0.163) and negatively correlated with negative age stereotypes ( = −0.176), indicating preliminary support for Hypotheses 7 and 9. On a bivariate level, “older worker age” was not significantly correlated with education, job status, typical age in a job, perceived remaining time at work, and positive age stereotypes (see Table 4).
The hypotheses were tested using linear regression analysis (Table 5). Demographic and job characteristics as well as individual beliefs were entered simultaneously in a regression equation predicting “older worker age”. Hypothesis 1 states that workers’ own age is positively related to their conceptualization of “older worker age”. The upper part of Table 5 shows that workers’ age positively and significantly predicted “older worker age” (B = 0.277, p < 0.001). Thus, Hypothesis 1 was supported. Hypothesis 2 states that workers’ sex is related to their conceptualization of “older worker age”, such that men will indicate an earlier onset than women. In support of Hypothesis 2, sex had a positive and significant effect on “older worker age” (B = 4.427, p < 0.001), indicating that men nominated earlier “older worker ages” than women. Hypothesis 2 was therefore also supported. According to Hypotheses 3, 4, and 5, education, job status, and typical age in a job are positively related to “older worker age”. These hypotheses were not supported, as “older worker age” was not significantly predicted by education (B = −0.396, not significant [ns]), job status (B = −0.321, ns), and typical age in a job (B = 0.159, ns).
The lower part of Table 5 shows the regression effects of individual beliefs on “older worker age”. Consistent with Hypothesis 6, perceived remaining time positively and significantly predicted “older worker age” after controlling for the other predictor variables (B = 1.650, p < 0.05). Hypotheses 7, 8 and 9 were not supported, as “older worker age” was not significantly predicted by motivation to continue working (B = 0.867, ns), positive age stereotypes (B = 0.170, ns) and negative age stereotypes (B = −0.978, ns).
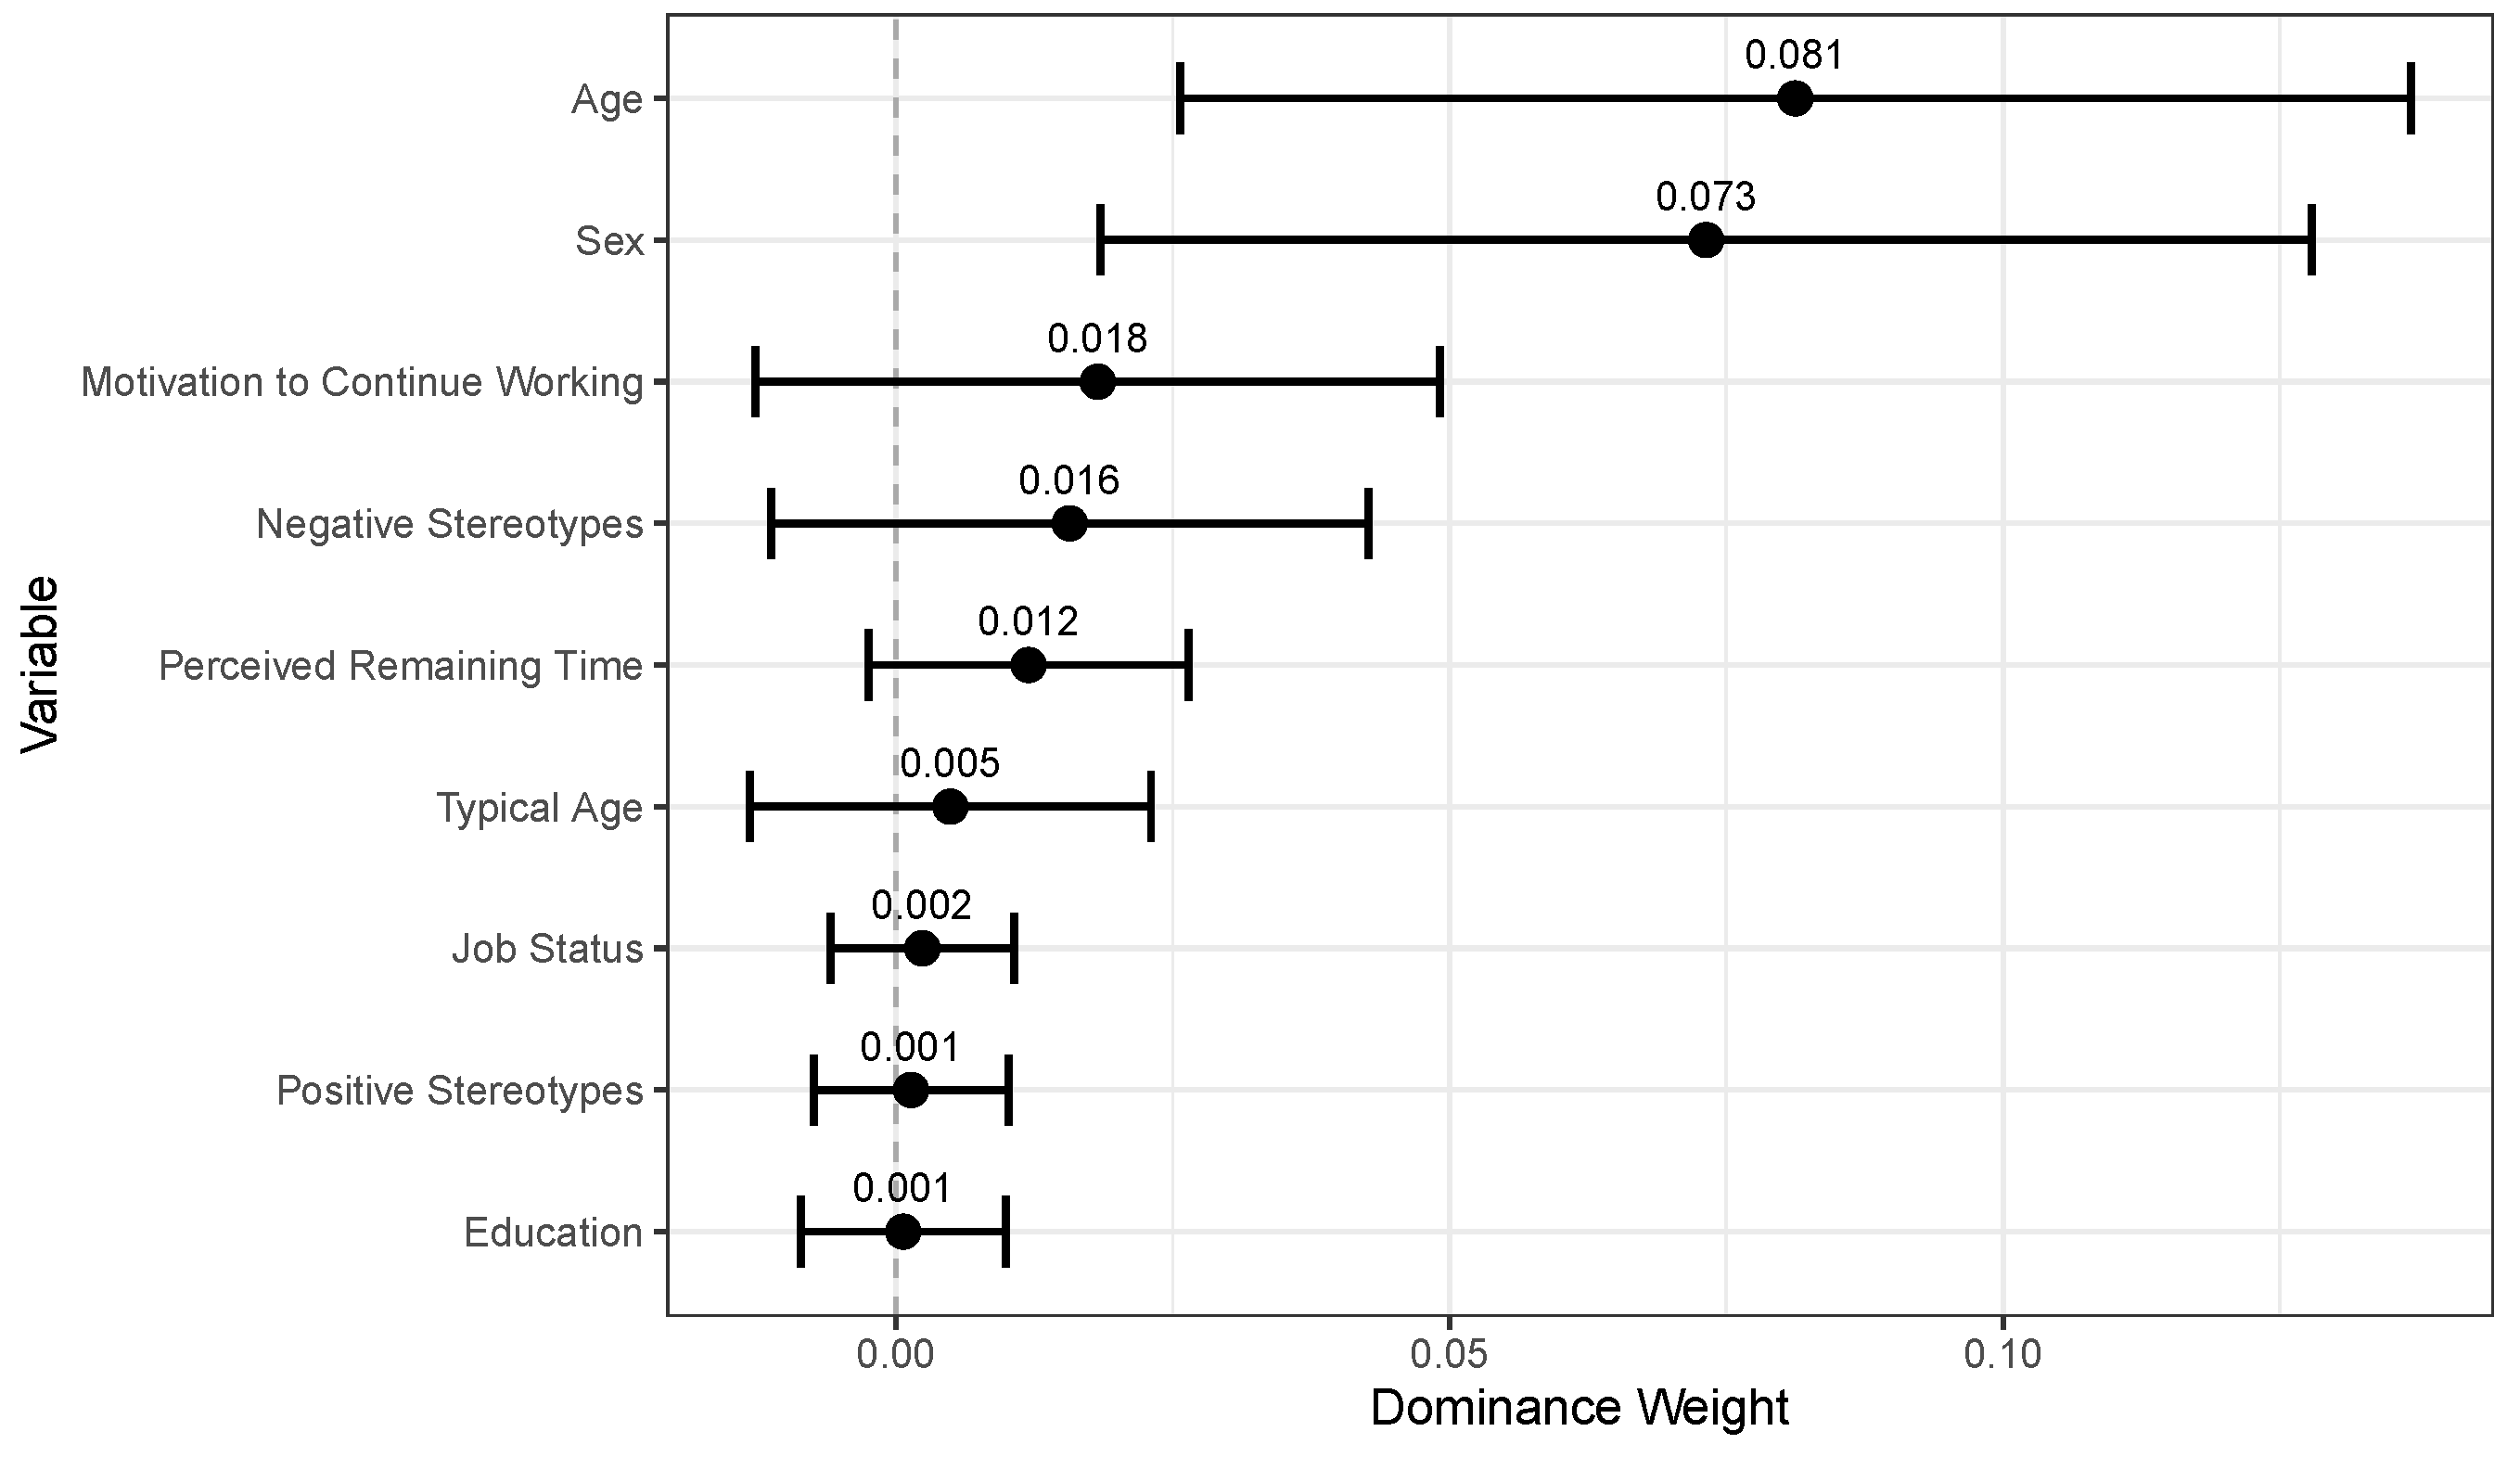
We also followed up this regression analysis with a dominance analysis (see Figure 1), which decomposes the model into unique contributions expressed in terms of dominance weights (DW). From this analysis, only age ( = 0.081) and sex ( = 0.073) contributed uniquely to the variance explained in older worker age.
7. Discussion
The concept of the “older worker” is frequently used in the organizational literature, in organizational practice, and in broader society; yet no research has so far examined variation in and predictors of people’s conceptualizations of “older worker age”—that is, people’s ideas of the chronological age when “younger” or “middle-aged workers” become “older workers”. Several studies in lifespan psychology and gerontology have been conducted over the past decades on people’s subjective understanding of when “old age” begins; however, these studies did not examine other predictors of “old age” than participants’ own age and sex. Thus, the current study aimed to contribute to the literature by identifying various reasons for indicating a certain “older worker age”, and by investigating demographic and job characteristics as well as individual beliefs as predictors of people’s perceived onset of “older worker age”.
The results based on a sample of 269 workers showed that participants’ provided “older worker ages” between 30 and 75 years, with a mean value of approximately 55 years. While 55 years may certainly constitute a plausible “older worker age”, the broad variety in responses was unexpected. The qualitative explanations provided by participants for why they indicated a certain “older worker age” were interesting in this regard, as they suggest that the vast majority of participants, no matter what their chosen “older worker age”, had certain reasons for considering a worker “old” at a certain age (see Table 1). By far the most popular category of reasons provided was “retirement age” (included in 37.3% of reasons provided), followed by age-related decline (21.8%). Other reasons, including career stability and lack of career opportunities, experience, type of profession, societal norms and expectations, legal reasons, relative age, time left, and intuition, were only mentioned in less than 10% of all reasons provided. This suggests that retirement age and age-related decline are prominent and easily accessible themes when thinking about “older workers”, whereas other themes are less salient. To some extent, this result is also reflected in the organizational and aging literature, which feature retirement [14,15,41,74,75] and actual or stereotypical age-related decline as prominent research topics [47,76,77].
The quantitative analysis showed that participants’ age and sex predicted “older worker age”, such that older and female participants indicated later onsets of “older worker age”. While these findings are consistent with much previous research on conceptualizations of general “old age” [27,28,29,30,31,32,33,34], the underlying reasons for these links are less clear. In the current study, it was argued that the term “older worker” carries a negative connotation due to stereotypes typically associated with older ages in the work context [47], and that participants therefore deliberately delay the onset of “older worker age” as they age themselves. In addition, it was argued that men have more physically demanding jobs that lead to more rapid detrimental aging in terms of functional decline and lower work ability; they also have generally shorter life expectancies than women, and might therefore nominate earlier onsets of “older worker age” than women. While the current findings are consistent with these potential explanations, future work in this area needs to test their actual viability to explain the observed effects.
The results also showed that one individual belief positively predicted “older worker age”. Specifically, participants’ with higher levels of perceived remaining time at work indicated later onsets of “older worker age”. The explanation for these findings could be similar to the explanation for the relationship between age and “older worker age”: workers who, independent of their own age, feel that they have a lot of time left in the work context may be more likely to reject the idea of an early onset of “older worker age” compared to workers who intend to stop working in the near future. Again, this rationale is based on the notion that the term “older worker” carries a negative connotation that brings negative age stereotypes to people’s awareness. Future research needs to test whether these associations with the term “older worker” indeed mediate the associations found in this study.
Finally, several hypotheses on demographic and job characteristics as well as individual beliefs were not supported using the current dataset. Education, job level, typical age in a given job, and age stereotypes did not predict the onset of “older worker age”. This either suggests that workers’ social status, their “age context” on the job, and their personal attitudes about older workers are not as influential in terms of conceptualizations of “older worker age” as expected, or that the methods of this study were limited and therefore were not able to uncover the theorized relationships.
Limitations and Directions for Future Research
This study has a number of limitations that need to be addressed in future work on this topic. The first limitation is that the cross-sectional data did not allow conclusions about causality or explanations for longitudinal changes in the study variables. While “older worker age” was treated as the criterion variable, and workers’ characteristics and beliefs were treated as predictors in the regression analysis, it may also be possible that workers’ conceptualizations of “older worker age” influence their beliefs over time. Experimental and longitudinal studies are needed to examine this possibility. The current study nevertheless contributes to the literature on the construction of age and “older workers” in organizations, as it represents the first attempt to investigate workers’ conceptualizations of “older worker age” and its correlates.
Another potential limitation concerns the nature of the sample used in this study. Workers recruited through online crowdsourcing might differ in their demographic and job characteristics, attitudes, and ideas about “older worker age” from other worker populations. The characteristics of the present sample could have systematically influenced the relationships found. Thus, it is important that other studies replicate the current findings, including the mean and variation in the “older worker age” variable as well as the reasons generated by participants, using other, possibly more heterogeneous samples. However, some concerns about sampling may be unfounded as some research on crowdsourced participants indicates that workers recruited online do not differ from nationally representative samples in many regards [70,78].
A related issue concerns potential historical and cultural influences on “older worker age” that could not be considered in the current study. These influences may be driven, in part, by changes in life expectancies over time and differences in life expectancies across countries. For example, a 40-year-old may have been generally considered an “older worker” in the late 19th century, whereas in most contemporary Western countries (including the setting of the current study), many workers do not consider people between the ages of 40 to 50 years to be “older workers”. In addition, the meaning and construction of age, aging, and “old” may vary substantially across cultures. For example, researchers showed that chronological age is a more salient psychological and social category in modern industrialized countries, whereas categorizations based on age were less meaningful to participants in developing, less industrialized countries [79,80].
A final limitation is the lack of previous theory with regard to the concept of “older worker age”. While this study attempted to draw on extant research from lifespan psychology and gerontology that has investigated people’s conceptualizations of general “old age”, the literature in that area is also relatively sparse and in some instances possibly outdated. Future efforts in terms of theory building should also consider additional influences on “older worker age” that were neglected in the current study, including workers’ personal and work histories, frequency of exposure to workers from different ages, and satisfaction with their own aging process. For example, it may be possible that satisfaction with one’s own aging is associated with a later perceived onset of “older worker age”.
8. Conclusions
This study contributes to the organizational and aging literature by providing the first attempt to gain a better understanding of the social–psychological construction of the “older worker”. The “typical older worker” appears to be approximately 55 years; yet, there is substantial variability in people’s ideas about the timing of the transition to being “older”. The results showed that people’s age and sex and their beliefs about their work-related future predicted the onset of “older worker” age.
Author Contributions
Conceptualization: H.Z.; data curation: H.Z.; formal analysis: H.Z. and C.W.R.; funding acquisition: H.Z.; investigation: H.Z.; methodology: H.Z. and C.W.R.; project administration: H.Z.; resources: H.Z.; Software: H.Z. and C.W.R.; supervision: H.Z.; validation: H.Z. and C.W.R.; visualization: C.W.R.; writing—original draft: H.Z.; writing—review and editing: H.Z. and C.W.R. All authors have read and agreed to the published version of the manuscript.
Funding
This research received no external funding.
Institutional Review Board Statement
The study was conducted in accordance with the Declaration of Helsinki, and approved by The University of Queensland Behavioural & Social Sciences Ethical Review Committee; Project Title: Psychological Resources for Successful Ageing; Approval Number: 2012001248.
Informed Consent Statement
Informed consent was obtained from all subjects involved in the study.
Data Availability Statement
Data are available here: https://osf.io/48v6r/ (accessed on 28 October 2022).
Conflicts of Interest
The authors declare no conflict of interest.
Abbreviations
The following abbreviations are used in this manuscript:
| ADEA | Age Discrimination in Employment Act |
References
- Bengtson, V.L.; Gans, D.; Putney, N.M.; Silverstein, M. Handbook of Theories of Aging; Springer: New York, NY, USA, 2009. [Google Scholar]
- Birren, J.E.; Schaie, K.W. Handbook of the Psychology of Aging, 6th ed.; Elsevier: Burlington, MA, USA, 2006. [Google Scholar]
- Schwall, A.R. Defining age and using age-relevant constructs. In The Oxford Handbook of Work and Aging; Hedge, J.W., Borman, W.C., Eds.; Oxford University Press: New York, NY, USA, 2012; pp. 169–186. [Google Scholar] [CrossRef]
- Settersten, R.A.; Mayer, K.U. The measurement of age, age structuring, and the life course. Annu. Rev. Sociol. 1997, 23, 233–261. [Google Scholar] [CrossRef] [Green Version]
- Cleveland, J.N.; Hanscom, M. What is old at work? Moving past chronological age. In The Palgrave Handbook of Age Diversity and Work; Parry, E., McCarthy, J., Eds.; Palgrave Macmillan: London, UK, 2017; pp. 17–46. [Google Scholar]
- McCarthy, J.; Heraty, N.; Cross, C.; Cleveland, J.N. Who is considered an ‘older worker’? Extending our conceptualisation of ‘older’ from an organisational decision maker perspective. Hum. Resour. Manag. J. 2014, 24, 374–393. [Google Scholar] [CrossRef] [Green Version]
- US Equal Employment Opportunity Commission (EEOC). 2022. Available online: http://www.eeoc.gov/laws/statutes/adea.cfm (accessed on 1 January 2023).
- Bennington, L.; Tharenou, P. Older workers: Myths, evidence and implications for Australian managers. Asia Pac. J. Hum. Resour. 1996, 34, 63–76. [Google Scholar] [CrossRef]
- Zacher, H. Older job seekers’ job search intensity: The interplay of proactive personality, age, and occupational future time perspective. Ageing Soc. 2013, 33, 1139–1166. [Google Scholar] [CrossRef]
- Roebuck, J. When does “old age” begin? The evolution of the English definition. J. Soc. Hist. 1979, 12, 416–428. [Google Scholar] [CrossRef]
- Zacher, H.; Froidevaux, A. Life stage, lifespan, and life course perspectives on vocational behavior and development: A theoretical framework, review, and research agenda. J. Vocat. Behav. 2021, 126, 103476. [Google Scholar] [CrossRef]
- Baltes, P.B.; Staudinger, U.M.; Lindenberger, U. Lifespan psychology: Theory and application to intellectual functioning. Annu. Rev. Psychol. 1999, 50, 471–507. [Google Scholar] [CrossRef] [Green Version]
- Kanfer, R.; Ackerman, P.L. Aging, adult development, and work motivation. Acad. Manag. Rev. 2004, 29, 440–458. [Google Scholar] [CrossRef]
- Shultz, K.S.; Wang, M. Psychological perspectives on the changing nature of retirement. Am. Psychol. 2011, 66, 170–179. [Google Scholar] [CrossRef]
- Wang, M. The Oxford Handbook of Retirement; Oxford University Press: New York, NY, USA, 2012. [Google Scholar]
- Higgs, P. Citizenship and old age: The end of the road? Ageing Soc. 1995, 15, 535–550. [Google Scholar] [CrossRef] [Green Version]
- Henry, H.; Zacher, H.; Desmette, D. Reducing age bias and turnover intentions by enhancing intergenerational contact quality in the workplace: The role of opportunities for generativity and development. Work. Aging Retire. 2015, 1, 243–253. [Google Scholar] [CrossRef]
- Hogg, M.A.; Terry, D.J. Social identity and self-categorization processes in organizational contexts. Acad. Manag. Rev. 2000, 25, 121–140. [Google Scholar] [CrossRef]
- Desmette, D.; Gaillard, M. When a “worker” becomes an “older worker”: The effects of age-related social identity on attitudes towards retirement and work. Career Dev. Int. 2008, 13, 168–185. [Google Scholar] [CrossRef] [Green Version]
- Mayer, K.U.; Schoepflin, U. The state and the life course. Annu. Rev. Sociol. 1989, 15, 187–209. [Google Scholar] [CrossRef]
- Cain, L.D. Aging and the law. In Handbook of Aging and the Social Sciences; Binstock, R.H., Shanas, E., Eds.; Van Nostrand Reinhold: New York, NY, USA, 1976; pp. 342–368. [Google Scholar]
- Nations, U. World Economic and Social Survey: Development in an Ageing World; United Nations Department of Economic and Social Affairs: New York, NY, USA, 2007. [Google Scholar]
- World Health Organization. 2012. Available online: http://www.who.int/healthinfo/survey/ageingdefnolder/en/index.html (accessed on 1 January 2023).
- Neugarten, B.L.; Hagestad, G.O. Age and the life course. In Handbook of Aging and the Social Sciences; Binstock, R.H., Shanas, E., Eds.; Van Nostrand Reinhold: New York, NY, USA, 1976; pp. 35–55. [Google Scholar]
- Infurna, F.J.; Gerstorf, D.; Lachman, M.E. Midlife in the 2020s: Opportunities and challenges. Am. Psychol. 2020, 75, 470–485. [Google Scholar] [CrossRef]
- Lachman, M.E.; Teshale, S.; Agrigoroaei, S. Midlife as a pivotal period in the life course: Balancing growth and decline at the crossroads of youth and old age. Int. J. Behav. Dev. 2015, 39, 20–31. [Google Scholar] [CrossRef] [Green Version]
- Cameron, P. Age parameters of young adult, middle-aged, old, and aged. J. Gerontol. 1969, 24, 201–202. [Google Scholar] [CrossRef]
- Tuckman, J.; Lorge, I. “When aging begins” and stereotypes about aging. J. Gerontol. 1953, 8, 489–492. [Google Scholar] [CrossRef]
- Blau, Z.S. Changes in status and age identification. Am. Sociol. Rev. 1956, 21, 198–203. [Google Scholar] [CrossRef]
- Drevenstedt, J. Perceptions of onsets of young adulthood, middle age, and old age. J. Gerontol. 1976, 31, 53–57. [Google Scholar] [CrossRef]
- Togonu-Bickersteth, F. Chronological definitions and expectations of old age among young adults in Nigeria. J. Aging Stud. 1987, 1, 113–124. [Google Scholar] [CrossRef] [PubMed]
- Togonu-Bickersteth, F. Perception of old age among Yoruba aged. J. Comp. Fam. Stud. 1988, 19, 113–122. [Google Scholar] [CrossRef]
- Hori, S. Beginning of old age in Japan and age norms in adulthood. Educ. Gerontol. Int. Q. 1994, 20, 439–451. [Google Scholar] [CrossRef]
- Unsworth, K.L.; McKee, K.J.; Mulligan, C. When does old age begin? The role of attitudes in age parameter placement. Soc. Psychol. Rev. 2001, 3, 5–15. [Google Scholar]
- Salthouse, T.A. Mental exercise and mental aging: Evaluating the validity of the “use it or lose it” hypothesis. Perspect. Psychol. Sci. 2006, 1, 68–87. [Google Scholar] [CrossRef]
- Ackerman, P.L.; Rolfhus, E.L. The locus of adult intelligence: Knowledge, abilities, and nonability traits. Psychol. Aging 1999, 14, 314–330. [Google Scholar] [CrossRef]
- Grossmann, I.; Na, J.; Varnum, M.E.W.; Park, D.C.; Kitayama, S.; Nisbett, R.E. Reasoning about social conflicts improves into old age. Proc. Natl. Acad. Sci. USA 2010, 107, 7246–7250. [Google Scholar] [CrossRef] [Green Version]
- Feldman, D.; Ng, T. Careers: Mobility, embeddedness, and success. J. Manag. 2007, 33, 350. [Google Scholar] [CrossRef] [Green Version]
- Maurer, T.J. Career-relevant learning and development, worker age, and beliefs about self-efficacy for development. J. Manag. 2001, 27, 123–140. [Google Scholar] [CrossRef]
- Zacher, H.; Frese, M. Maintaining a focus on opportunities at work: The interplay between age, job complexity, and the use of selection, optimization, and compensation strategies. J. Organ. Behav. 2011, 32, 291–318. [Google Scholar] [CrossRef]
- Wang, M.; Shultz, K. Employee retirement: A review and recommendations for future investigation. J. Manag. 2010, 36, 172–206. [Google Scholar] [CrossRef]
- Zacher, H.; Frese, M. Remaining time and opportunities at work: Relationships between age, work characteristics, and occupational future time perspective. Psychol. Aging 2009, 24, 487–493. [Google Scholar] [CrossRef] [PubMed] [Green Version]
- Chasteen, A.L.; Schwarz, N.; Park, D.C. The activation of aging stereotypes in younger and older adults. J. Gerontol. Ser. B Psychol. Sci. Soc. Sci. 2002, 57, P540–P547. [Google Scholar] [CrossRef] [PubMed] [Green Version]
- Chiu, W.C.K.; Chan, A.W.; Snape, E.; Redman, T. Age stereotypes and discriminatory attitudes towards older workers: An East-West comparison. Hum. Relations 2001, 54, 629–661. [Google Scholar] [CrossRef] [Green Version]
- Hassell, B.L.; Perrewe, P.L. An examination of beliefs about older workers: Do stereotypes still exist? J. Organ. Behav. 1995, 16, 457–468. [Google Scholar] [CrossRef]
- Kite, M.E.; Stockdale, G.D.; Whitley, B.E.; Johnson, B.T. Attitudes toward younger and older adults: An updated meta-analytic review. J. Soc. Issues 2005, 61, 241–266. [Google Scholar] [CrossRef]
- Posthuma, R.A.; Campion, M.A. Age stereotypes in the workplace: Common stereotypes, moderators, and future research directions. J. Manag. 2009, 35, 158–188. [Google Scholar] [CrossRef] [Green Version]
- Ng, T.W.H.; Feldman, D.C. The relationship of age to ten dimensions of job performance. J. Appl. Psychol. 2008, 93, 392–423. [Google Scholar] [CrossRef] [Green Version]
- Ng, T.W.H.; Feldman, D.C. Evaluating six common stereotypes about older workers with meta-analytical data. Pers. Psychol. 2012, 65, 821–858. [Google Scholar] [CrossRef]
- Cate, R.A.; John, O.P. Testing models of the structure and development of future time perspective: Maintaining a focus on opportunities in middle age. Psychol. Aging 2007, 22, 186–201. [Google Scholar] [CrossRef]
- Hagestad, G.O. Trends and dilemmas in life course research: An international perspective. In Theoretical Advanced in Life Course Research; Heinz, W.R., Ed.; Deutscher Studien Verlag: Weinheim, Germany, 1991; pp. 23–57. [Google Scholar]
- Oeppen, J.; Vaupel, J.W. Broken limits to life expectancy. Science 2002, 296, 1029–1031. [Google Scholar] [CrossRef] [PubMed] [Green Version]
- Ilmarinen, J.; Tuomi, K.; Klockars, M. Changes in the work ability of active employees over an 11-year period. Scand. J. Work. Environ. Health 1997, 23, 49–57. Available online: http://www.jstor.org/stable/40966691 (accessed on 1 January 2023). [PubMed]
- Wang, M.; Zhan, Y.; Liu, S.; Shultz, K. Antecedents of bridge employment: A longitudinal investigation. J. Appl. Psychol. 2008, 93, 818. [Google Scholar] [CrossRef] [PubMed]
- Reeves, M.D.; Fritzsche, B.A.; Marcus, J.; Smith, N.A.; Ng, Y.L. “Beware the young doctor and the old barber”: Development and validation of a job age-type spectrum. J. Vocat. Behav. 2021, 129, 103616. [Google Scholar] [CrossRef]
- Carstensen, L.L.; Isaacowitz, D.M.; Charles, S.T. Taking time seriously: A theory of socioemotional selectivity. Am. Psychol. 1999, 54, 165–181. [Google Scholar] [CrossRef]
- Armstrong-Stassen, M. Organisational practices and the post-retirement employment experience of older workers. Hum. Res. Mgmt. J. 2008, 18, 36–53. [Google Scholar] [CrossRef]
- Weiss, M.; Weiss, D.; Zacher, H. All set in stone? How and why essentialist beliefs about aging affect employees’ motivation to continue working beyond retirement age. J. Organ. Behav. 2022, 43, 1446–1461. [Google Scholar] [CrossRef]
- Kotter-Grühn, D.; Hess, T.M. The impact of age stereotypes on self-perceptions of aging across the adult lifespan. J. Gerontol. Ser. B Psychol. Sci. Soc. Sci. 2012, 67, 563–571. [Google Scholar] [CrossRef] [Green Version]
- Weiss, D.; Weiss, M. Beyond chronological age: Alternative age constructs and their implications in the work context. In Age and Work: Advances in Theory, Methods, and Practice; Zacher, H., Rudolph, C.W., Eds.; Routledge: New York, NY, USA, 2022. [Google Scholar]
- Bal, A.C.; Reiss, A.E.B.; Rudolph, C.W.; Baltes, B.B. Examining positive and negative perceptions of older workers: A meta-analysis. J. Gerontol. Ser. B Psychol. Sci. Soc. Sci. 2011, 66, 687–698. [Google Scholar] [CrossRef] [Green Version]
- Palmore, E.B. Ageism: Negative and Positive, 2nd ed.; Springer: New York, NY, USA, 1999. [Google Scholar]
- Pinquart, M. Good news about the effects of bad old-age stereotypes. Exp. Aging Res. 2002, 28, 317–336. [Google Scholar] [CrossRef]
- Rothermund, K. Effects of age stereotypes on self-views and adaptation. The Adaptive Self: Personal Continuity and Intentional Self-Development; Hogrefe & Huber Publishers: Boston, MA, USA, 2005; pp. 223–242. [Google Scholar]
- Hess, T.M.; Hinson, J.T.; Statham, J.A. Explicit and implicit stereotype activation effects on memory: Do age and awareness moderate the impact of priming? Psychol. Aging 2004, 19, 495. [Google Scholar] [CrossRef] [PubMed]
- Levy, B. Improving memory in old age through implicit self-stereotyping. J. Personal. Soc. Psychol. 1996, 71, 1092. [Google Scholar] [CrossRef] [PubMed]
- Eibach, R.P.; Mock, S.E.; Courtney, E.A. Having a “senior moment”: Induced aging phenomenology, subjective age, and susceptibility to ageist stereotypes. J. Exp. Soc. Psychol. 2010, 46, 643–649. [Google Scholar] [CrossRef]
- Hess, T.M.; Hinson, J.T. Age-related variation in the influences of aging stereotypes on memory in adulthood. Psychol. Aging 2006, 21, 621. [Google Scholar] [CrossRef] [Green Version]
- Buhrmester, M.; Kwang, T.; Gosling, S.D. Amazon’s Mechanical Turk: A new source of inexpensive, yet high-quality, data? Perspect. Psychol. Sci. 2011, 6, 3–5. [Google Scholar] [CrossRef]
- Mason, W.; Suri, S. Conducting behavioral research on Amazon’s Mechanical Turk. Behav. Res. Methods 2011, 44, 1–23. [Google Scholar] [CrossRef]
- von Hippel, C.; Kalokerinos, E.K.; Henry, J.D. Stereotype threat among older employees: Relationships with job attitudes and turnover intentions. Psychol. Aging 2013, 28, 17–27. [Google Scholar] [CrossRef]
- Carstensen, L.L.; Lang, F.R. Future Time Perspective (FTP) Scale. 1996. Available online: https://lifespan.stanford.edu/projects/future-time-perspective-ftp-scale (accessed on 1 January 2023).
- Hayes, A.F.; Krippendorff, K. Answering the call for a standard reliability measure for coding data. Commun. Methods Meas. 2007, 1, 77–89. [Google Scholar] [CrossRef]
- Beehr, T.A. The process of retirement: A review and recommendations for future investigation. Pers. Psychol. 1986, 39, 31–55. [Google Scholar] [CrossRef]
- Dychtwald, K.; Erickson, T.; Morison, B. It’s time to retire retirement. Public Policy Aging Rep. 2004, 14, 1–28. [Google Scholar] [CrossRef]
- Baltes, P.B. Theoretical propositions of life-span developmental psychology: On the dynamics between growth and decline. Dev. Psychol. 1987, 23, 611–626. [Google Scholar] [CrossRef]
- Kubeck, J.E.; Delp, N.D.; Haslett, T.K.; McDaniel, M.A. Does job-related training performance decline with age? Psychol. Aging 1996, 11, 92–107. [Google Scholar] [CrossRef] [PubMed]
- Behrend, T.S.; Sharek, D.J.; Meade, A.W.; Wiebe, E.N. The viability of crowdsourcing for survey research. Behav. Res. Methods 2011, 43, 800–813. [Google Scholar] [CrossRef] [PubMed]
- Ikels, C.; Keith, J.; Dickerson-Putman, J.; Draper, P.; Fry, C.L.; Glascock, A.P.; Harpending, H. Perceptions of the adult life course: A cross-cultural analysis. Ageing Soc. 1992, 12, 49–84. [Google Scholar] [CrossRef]
- Keith, J.; Fry, C.L.; Glascock, A.P.; Ikels, C.; Dickerson-Putman, J.; Harpending, H.C. The Aging Experience: Diversity and Commonality across Cultures; Sage: Newbury Park, CA, USA, 1994. [Google Scholar] [CrossRef]
Figure 1.
Summary of Dominance Analysis. Error Bars Represent Bootstrap 95% Confidence Intervals.


Table 1.
Example Reasons Provided by Participants for Indicating a Certain Older Worker Age.
| Older Worker Age | Examples Reasons (Categories) |
|---|---|
| 30–39 (n = 9) | “I feel like before you turn this age you’re working in mainly part-time, quick-buck jobs. Around this age people find themselves and begin their career that will last them their lifetime.” (career stability) |
| “I consider someone who is 35 years old in my current position to be an ‘older worker.’ Due to the nature of the hospitality industry, it’s quite common to recruit young workers typically around the age of 18–22. For the front desk, youth and beauty are qualities that are cherished… This is a position where I feel age and experience are not beneficial. Thus, I feel anyone that is at least the age of 35 is an older worker.” (profession) | |
| 40–49 (n = 34) | “I believe that once you reach 40, you reach a point of maturity where you understand the workplace better. In my opinion, an older worker is someone who can impart knowledge to younger ones.” (experience) |
| “I chose the age of 40 because the Age Discrimination in Employment Act (ADEA) forbids employment discrimination against anyone who is at least 40 years old in the United States. Thus, that is the age that I would use to define an older worker.” (legal) | |
| “That is the age when the body starts wearing down and medical problems are rising.” (decline) | |
| 50–59 (n = 111) | “At age 50, you are starting to think about retirement and making sure that you are financially stable for retirement.” (retirement planning) |
| “I don’t know, I just think that this is the age to call someone an older worker.” (intuition) | |
| “At age 50 it would be very difficult to change jobs or find a better job. It would be near impossible to switch careers.” (career opportunities) | |
| “I work in Education and the older you are, the more knowledge you have. It’s only an asset here.” (profession, experience) | |
| “Because you have fewer years ahead of you than you do behind you.” (time left) | |
| “At this age, you begin to slow down physically and mentally. You can still keep up with younger workers, but it gets harder and harder.” (decline) | |
| “55 years is older in the workforce even though many continue to work past that age. As I get older I realize my perception of this age will probably change.” (society, relative age) | |
| “Because it is the age where one can join AARP.” (legal) | |
| 60–69 (n = 95) | “It seems most people retire by then so if they are still there after that then it seems like they are old since most people aren’t working after 60.” (retirement age) |
| “Since 65 is the usual age for retirement in the USA, I would consider anyone beneath that age to be an average or normal worker. Anyone over that would be an older than typical worker.” (retirement age) | |
| “Because once you get to this age, your memory, endurance, energy levels, and physical abilities deteriorate.” (decline) | |
| “They have an expansive experience base and if employed with the same company have a wealth of knowledge that can be passed onto younger generations.” (experience) | |
| “I chose this age, because it’s my age range, and I have just recently begun to FEEL like an older worker.” (relative age) | |
| 70–75 (n = 20) | “Because at that age most people do not have as much energy as they used to, so they would have a hard time working full-time.” (decline) |
| “In my occupational life, I have met and worked with business owners, and others who are 60+ and just as viable and relevant as those who have just graduated from university. Most plan to retire somewhere around 70 years of age.” (retirement age) | |
| “I’m 57 but look and feel fifteen years younger. So I don’t think of someone as ‘old’ until they reach their seventies.” (relative age) |
Note. Complete responses available upon request.
Table 2.
Inter-Rater Reliability, Frequency, and Proportion of Reasons.
| Reason | Krippendorff’s | Frequency | Percent |
|---|---|---|---|
| Retirement age | 0.89 | 101 | 37.30% |
| Retirement planning | 0.80 | 19 | 7.00% |
| Career stability | 0.81 | 13 | 4.80% |
| Career opportunities | 0.73 | 13 | 4.80% |
| Decline | 0.80 | 59 | 21.80% |
| Experience | 0.84 | 21 | 7.70% |
| Profession | 0.83 | 12 | 4.40% |
| Intuition | 0.83 | 24 | 8.90% |
| Society | 0.79 | 14 | 5.20% |
| Legal | 0.76 | 12 | 4.40% |
| Relative age | 0.76 | 25 | 9.20% |
| Time left | 0.75 | 26 | 9.60% |
| Other | 0.76 | 7 | 2.60% |
Table 3.
Descriptive Statistics.
| Mean | SD | Median | Min | Max. | |
|---|---|---|---|---|---|
| Older Worker Age | 55 | 30 | 75 | ||
| Age | 31 | 18 | 64 | ||
| Sex | 2 | 1 | 2 | ||
| Education | 4 | 1 | 5 | ||
| Job Status | 4 | 1 | 7 | ||
| Typical Age | |||||
| Perc. Rem. Time | 1 | 5 | |||
| Motivation to Continue Working | 1 | 5 | |||
| Pos. Stereotypes | 2 | 5 | |||
| Neg. Stereotypes | 3 | 1 |
Table 4.
Correlations Among Observed Variables.
| Variable | 1. | 2. | 3. | 4. | 5. | 6. | 7. | 8. | 9. | 10. |
|---|---|---|---|---|---|---|---|---|---|---|
| 1. Older Worker Age | - | |||||||||
| 2. Age | 0.304 | - | ||||||||
| 3. Sex | 0.303 | 0.157 | - | |||||||
| 4. Education | 0.027 | 0.099 | 0.068 | - | ||||||
| 5. Job Status | 0.076 | 0.234 | 0.047 | 0.008 | - | |||||
| 6. Typical Age | 0.086 | 0.204 | 0.005 | 0.240 | 0.336 | - | ||||
| 7. Perc. Rem. Time | −0.020 | −0.559 | −0.058 | −0.041 | −0.052 | −0.161 | 0.790 | |||
| 8. Continue Working | 0.163 | 0.055 | 0.054 | −0.018 | 0.239 | −0.001 | 0.132 | 0.920 | ||
| 9. Pos. Stereotypes | 0.045 | −0.063 | 0.010 | −0.077 | −0.025 | −0.130 | 0.243 | 0.050 | 0.840 | |
| 10. Neg. Stereotypes | −0.176 | −0.208 | −0.137 | −0.144 | −0.026 | 0.020 | 0.031 | −0.106 | −0.144 | 0.880 |
Note. Coefficient (α) reliability estimates appear in the diagonal. Correlations (rxy) ≥ |−0.130| are p < 0.05. Correlations are based on the full sample of n = 269 considered here.
Table 5.
Results of Regression Analysis Predicting “Older Worker Age”.
| Dependent Variable: | |
|---|---|
| Older Worker Age | |
| Age | 0.277 *** |
| [0.057] | |
| Sex | 4.427 *** |
| [1.007] | |
| Education | −0.396 |
| [0.538] | |
| Job Status | −0.321 |
| [0.322] | |
| Typical Age | 0.159 |
| [0.129] | |
| Perc. Rem. Time | 1.650 * |
| [0.638] | |
| Motivation to Continue Working | 0.867 |
| [0.450] | |
| Pos. Stereotypes | 0.170 |
| [1.039] | |
| Neg. Stereotypes | −0.978 |
| [0.810] | |
| Constant | 30.498 *** |
| [7.576] | |
| Observations | 269 |
| R | 0.210 |
| Adjusted R | 0.182 |
| Residual Std. Error | 8.080 (df = 259) |
| F Statistic | 7.635 *** (df = 9, 259) |
Note. * p < 0.05; *** p < 0.001.
Disclaimer/Publisher’s Note: The statements, opinions and data contained in all publications are solely those of the individual author(s) and contributor(s) and not of MDPI and/or the editor(s). MDPI and/or the editor(s) disclaim responsibility for any injury to people or property resulting from any ideas, methods, instructions or products referred to in the content. |
© 2023 by the authors. Licensee MDPI, Basel, Switzerland. This article is an open access article distributed under the terms and conditions of the Creative Commons Attribution (CC BY) license (https://creativecommons.org/licenses/by/4.0/).
Share and Cite
MDPI and ACS Style
Zacher, H.; Rudolph, C.W. The Construction of the “Older Worker”. Merits 2023, 3, 115-130. https://doi.org/10.3390/merits3010007
AMA Style
Zacher H, Rudolph CW. The Construction of the “Older Worker”. Merits. 2023; 3(1):115-130. https://doi.org/10.3390/merits3010007
Chicago/Turabian StyleZacher, Hannes, and Cort W. Rudolph. 2023. "The Construction of the “Older Worker”" Merits 3, no. 1: 115-130. https://doi.org/10.3390/merits3010007