

Pressure-Driven Sample Flow through an Electrospun Membrane Increases the Analyte Adsorption
 , , and
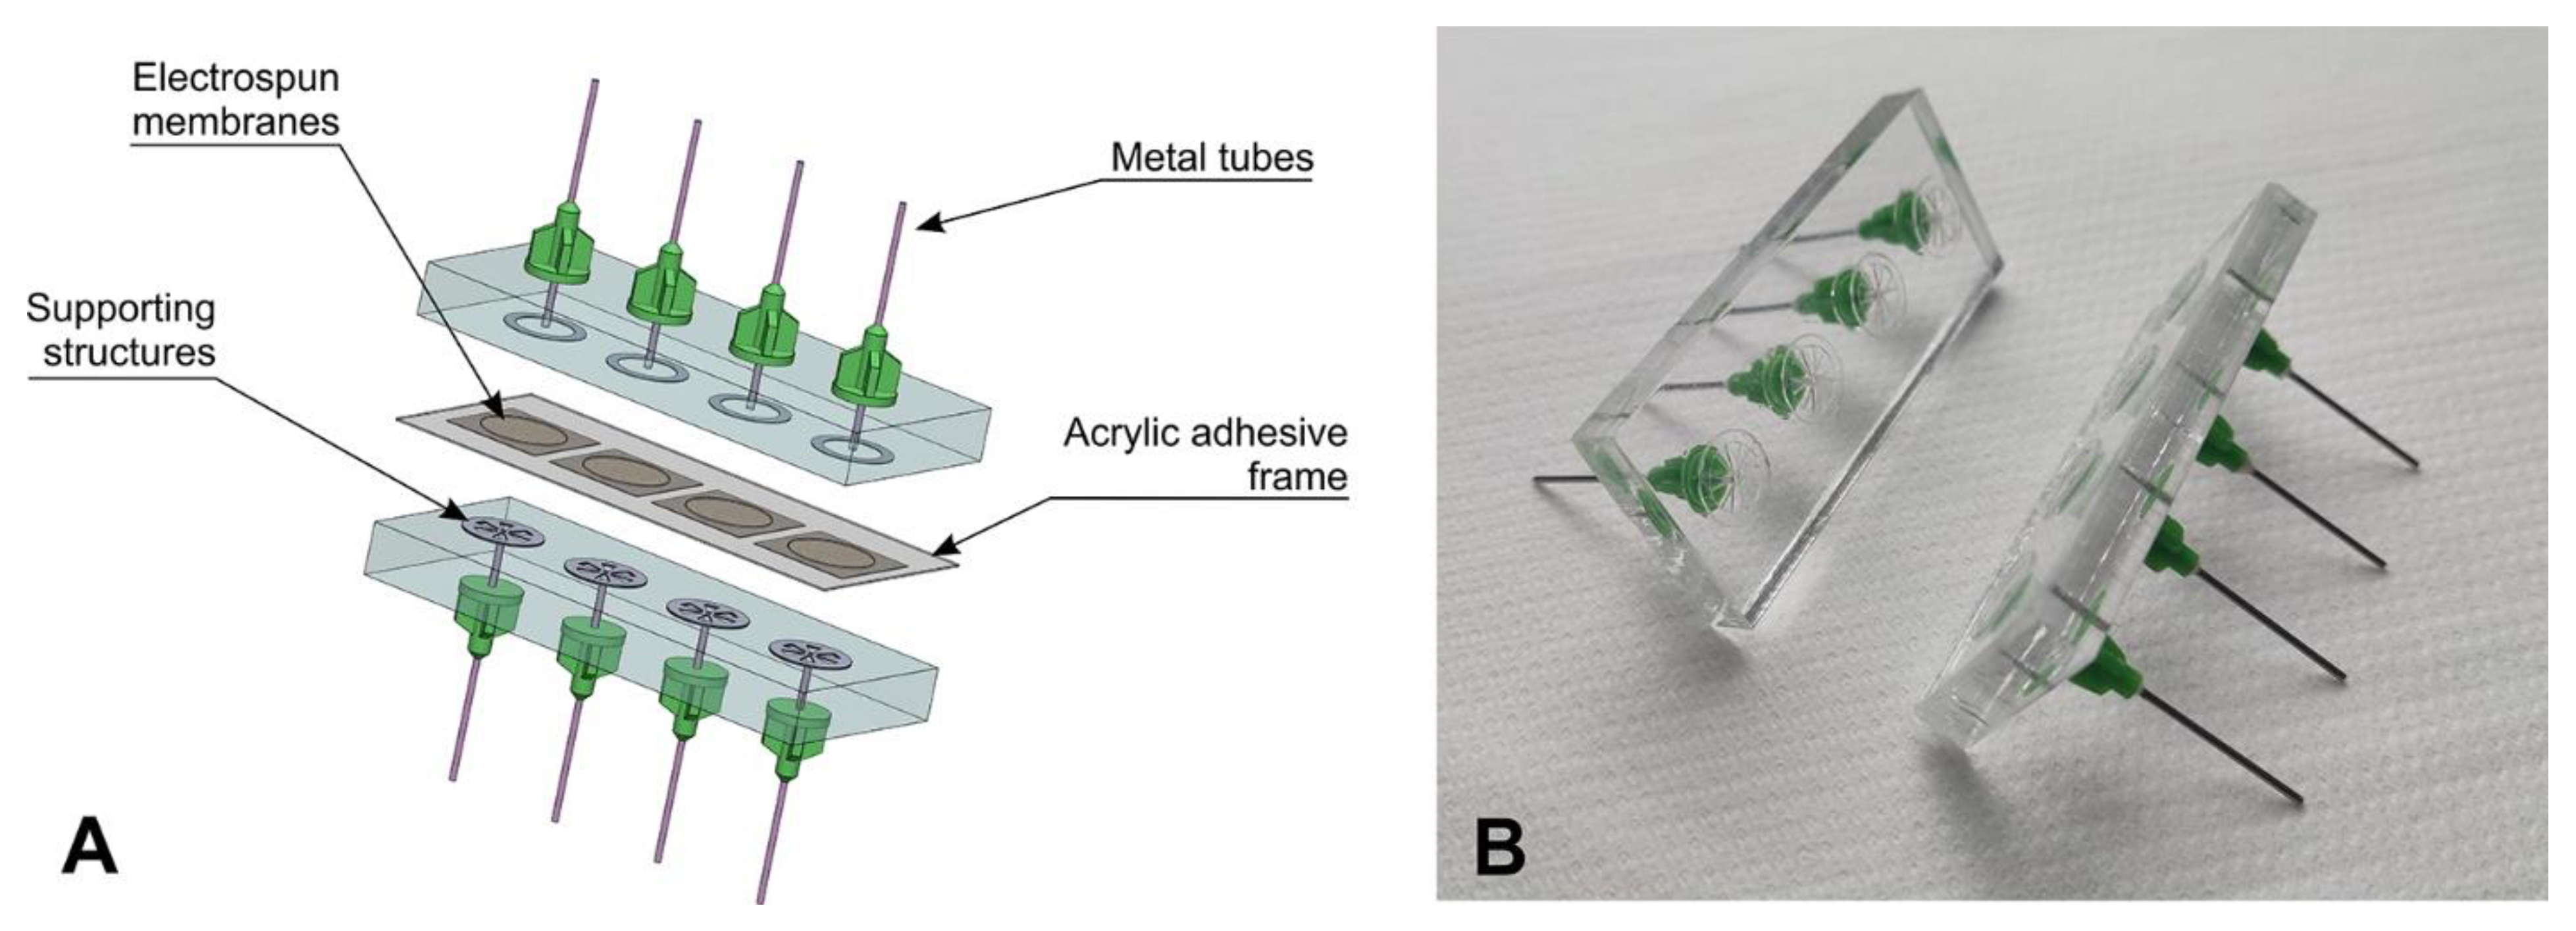
Abstract
:1. Introduction
2. Materials and Methods
2.1. Preparation of the Membranes
2.2. Characterization of the Membranes
2.3. Design of the Custom Flow-through Device
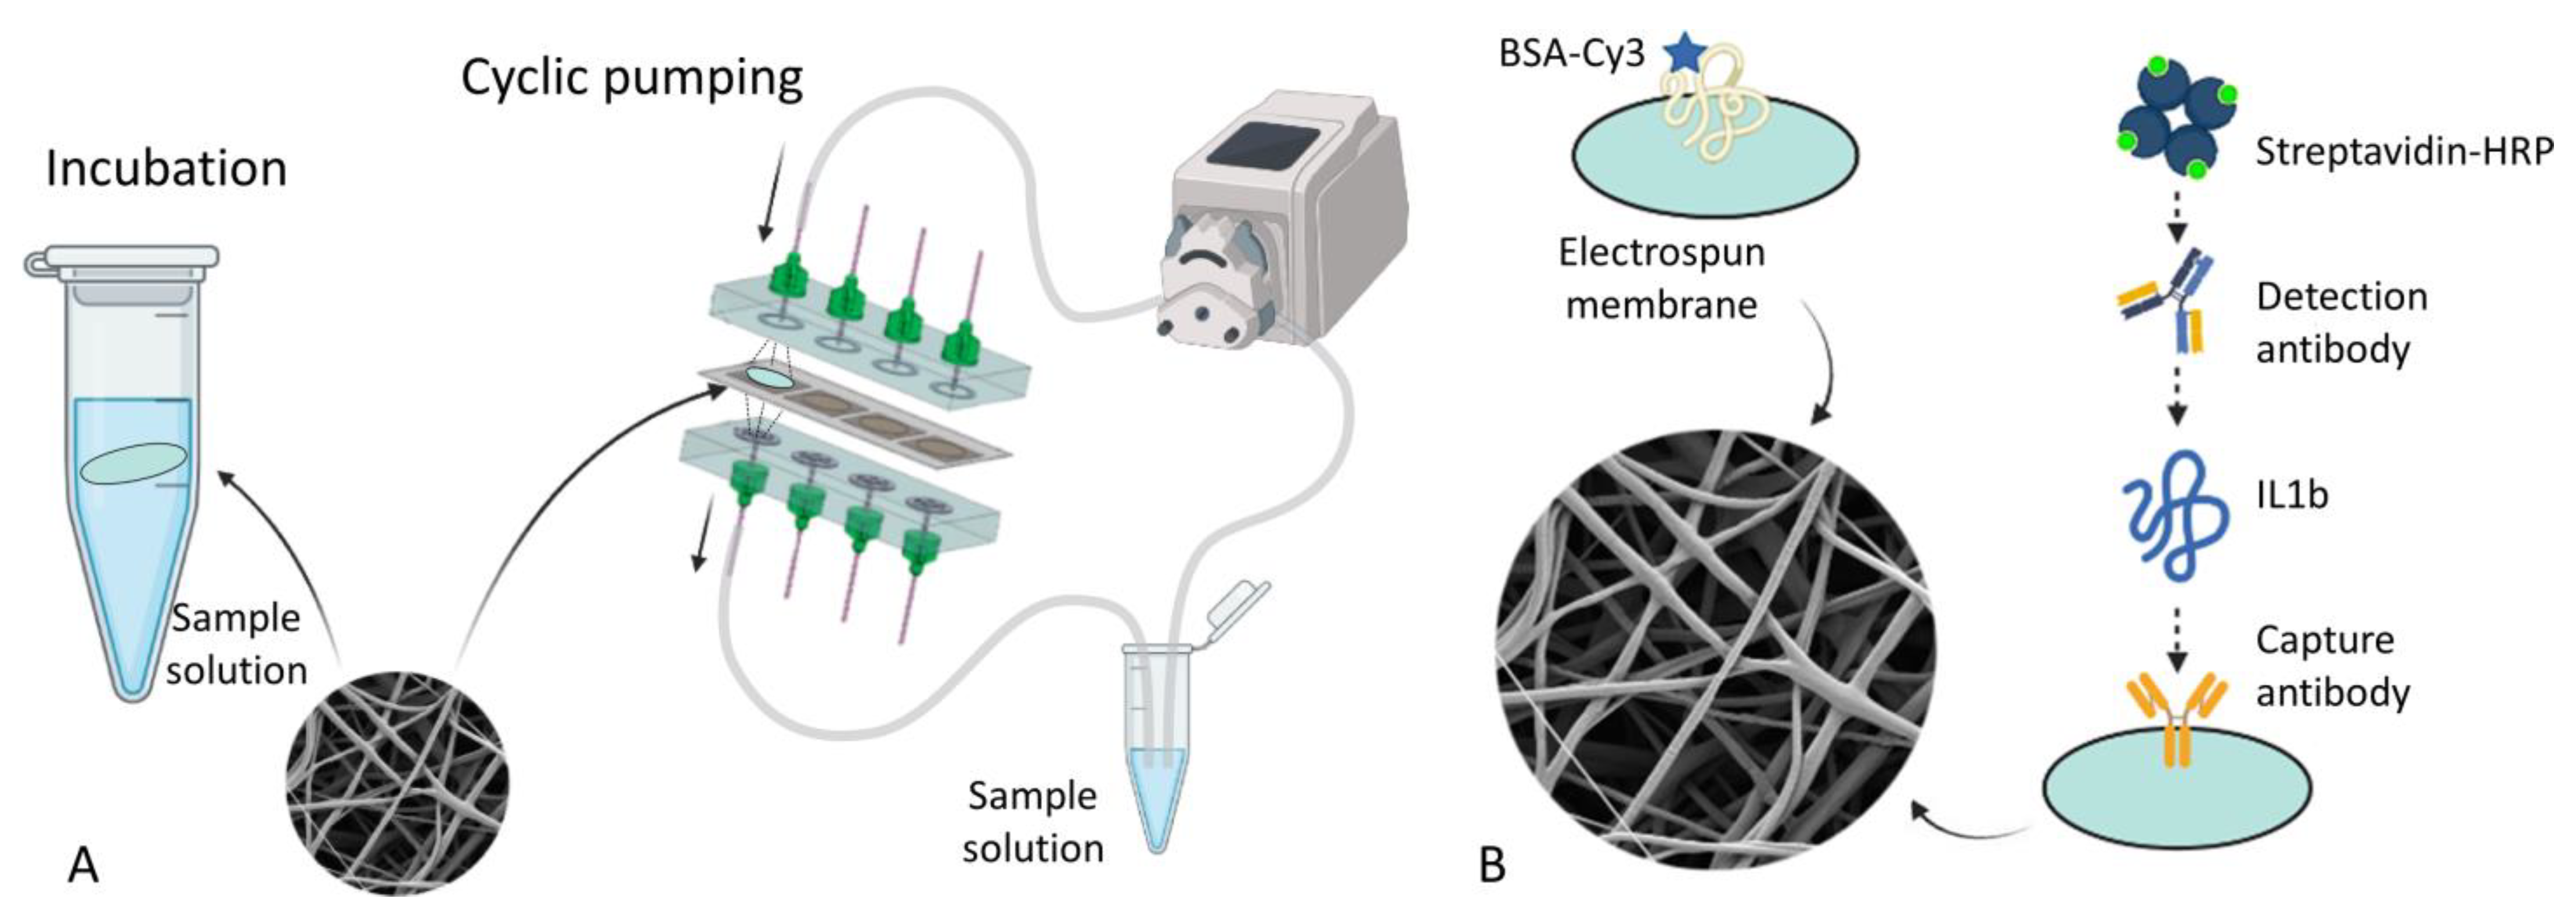
2.4. Measurements of the BSA Adsorption
2.5. Measurements of IL1b Binding
3. Results and Discussion
3.1. Concept of the Experiment
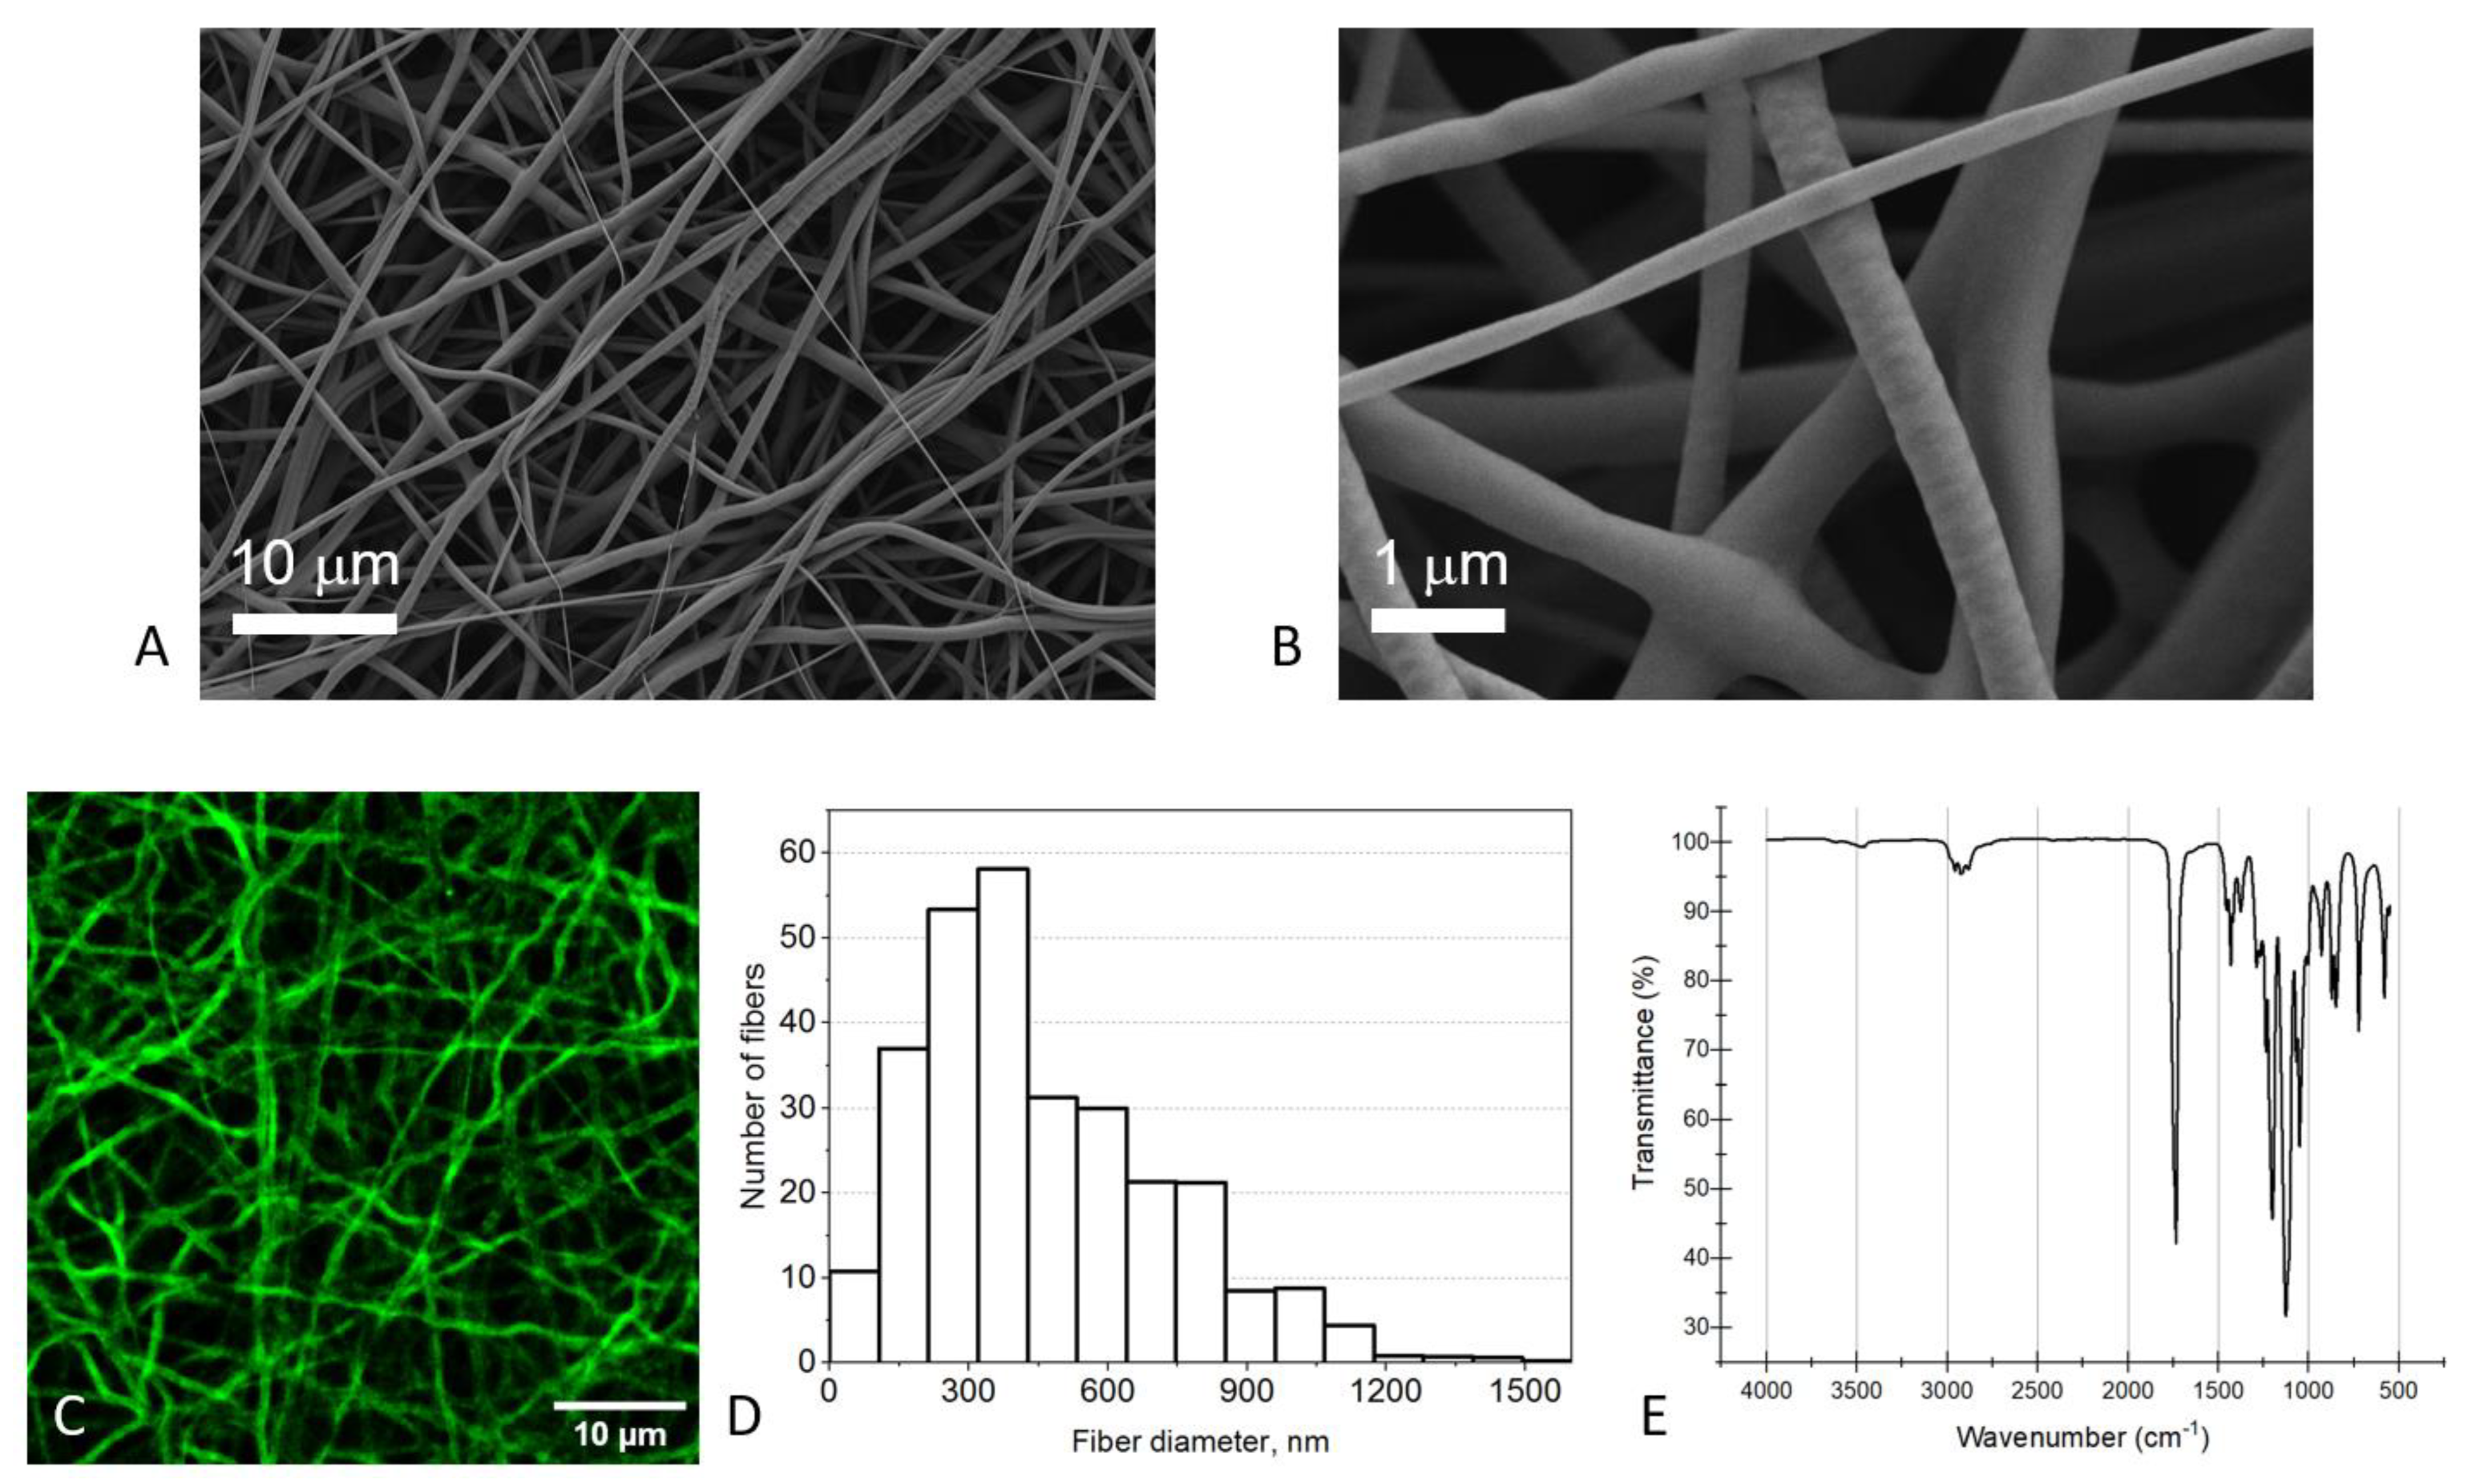
3.2. Membrane Characterization
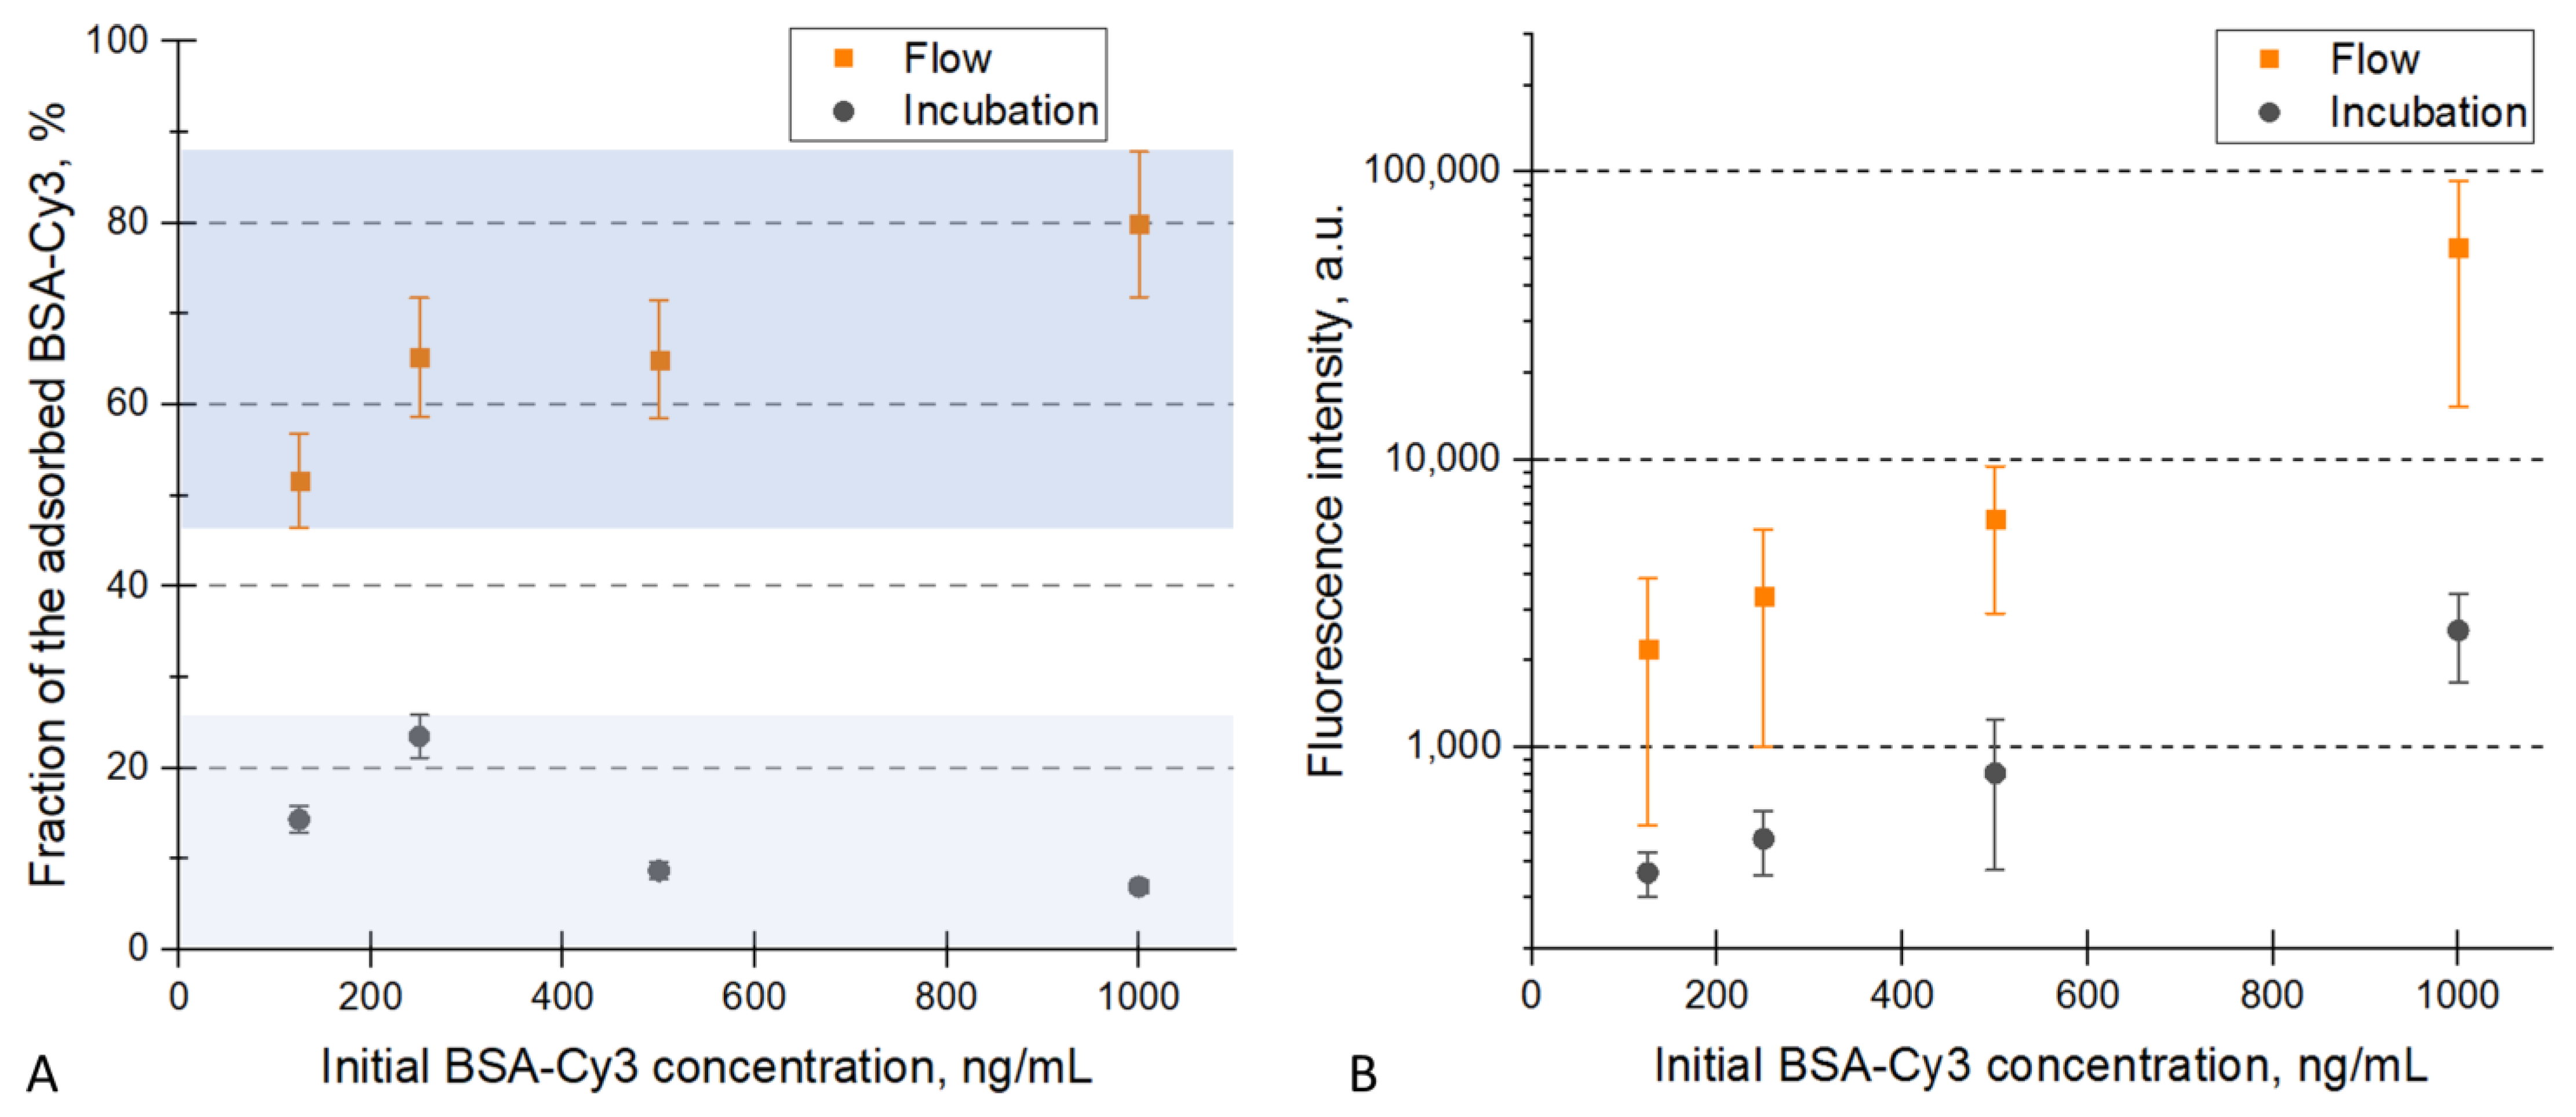
3.3. Measurements of Non-Specific Adsorption
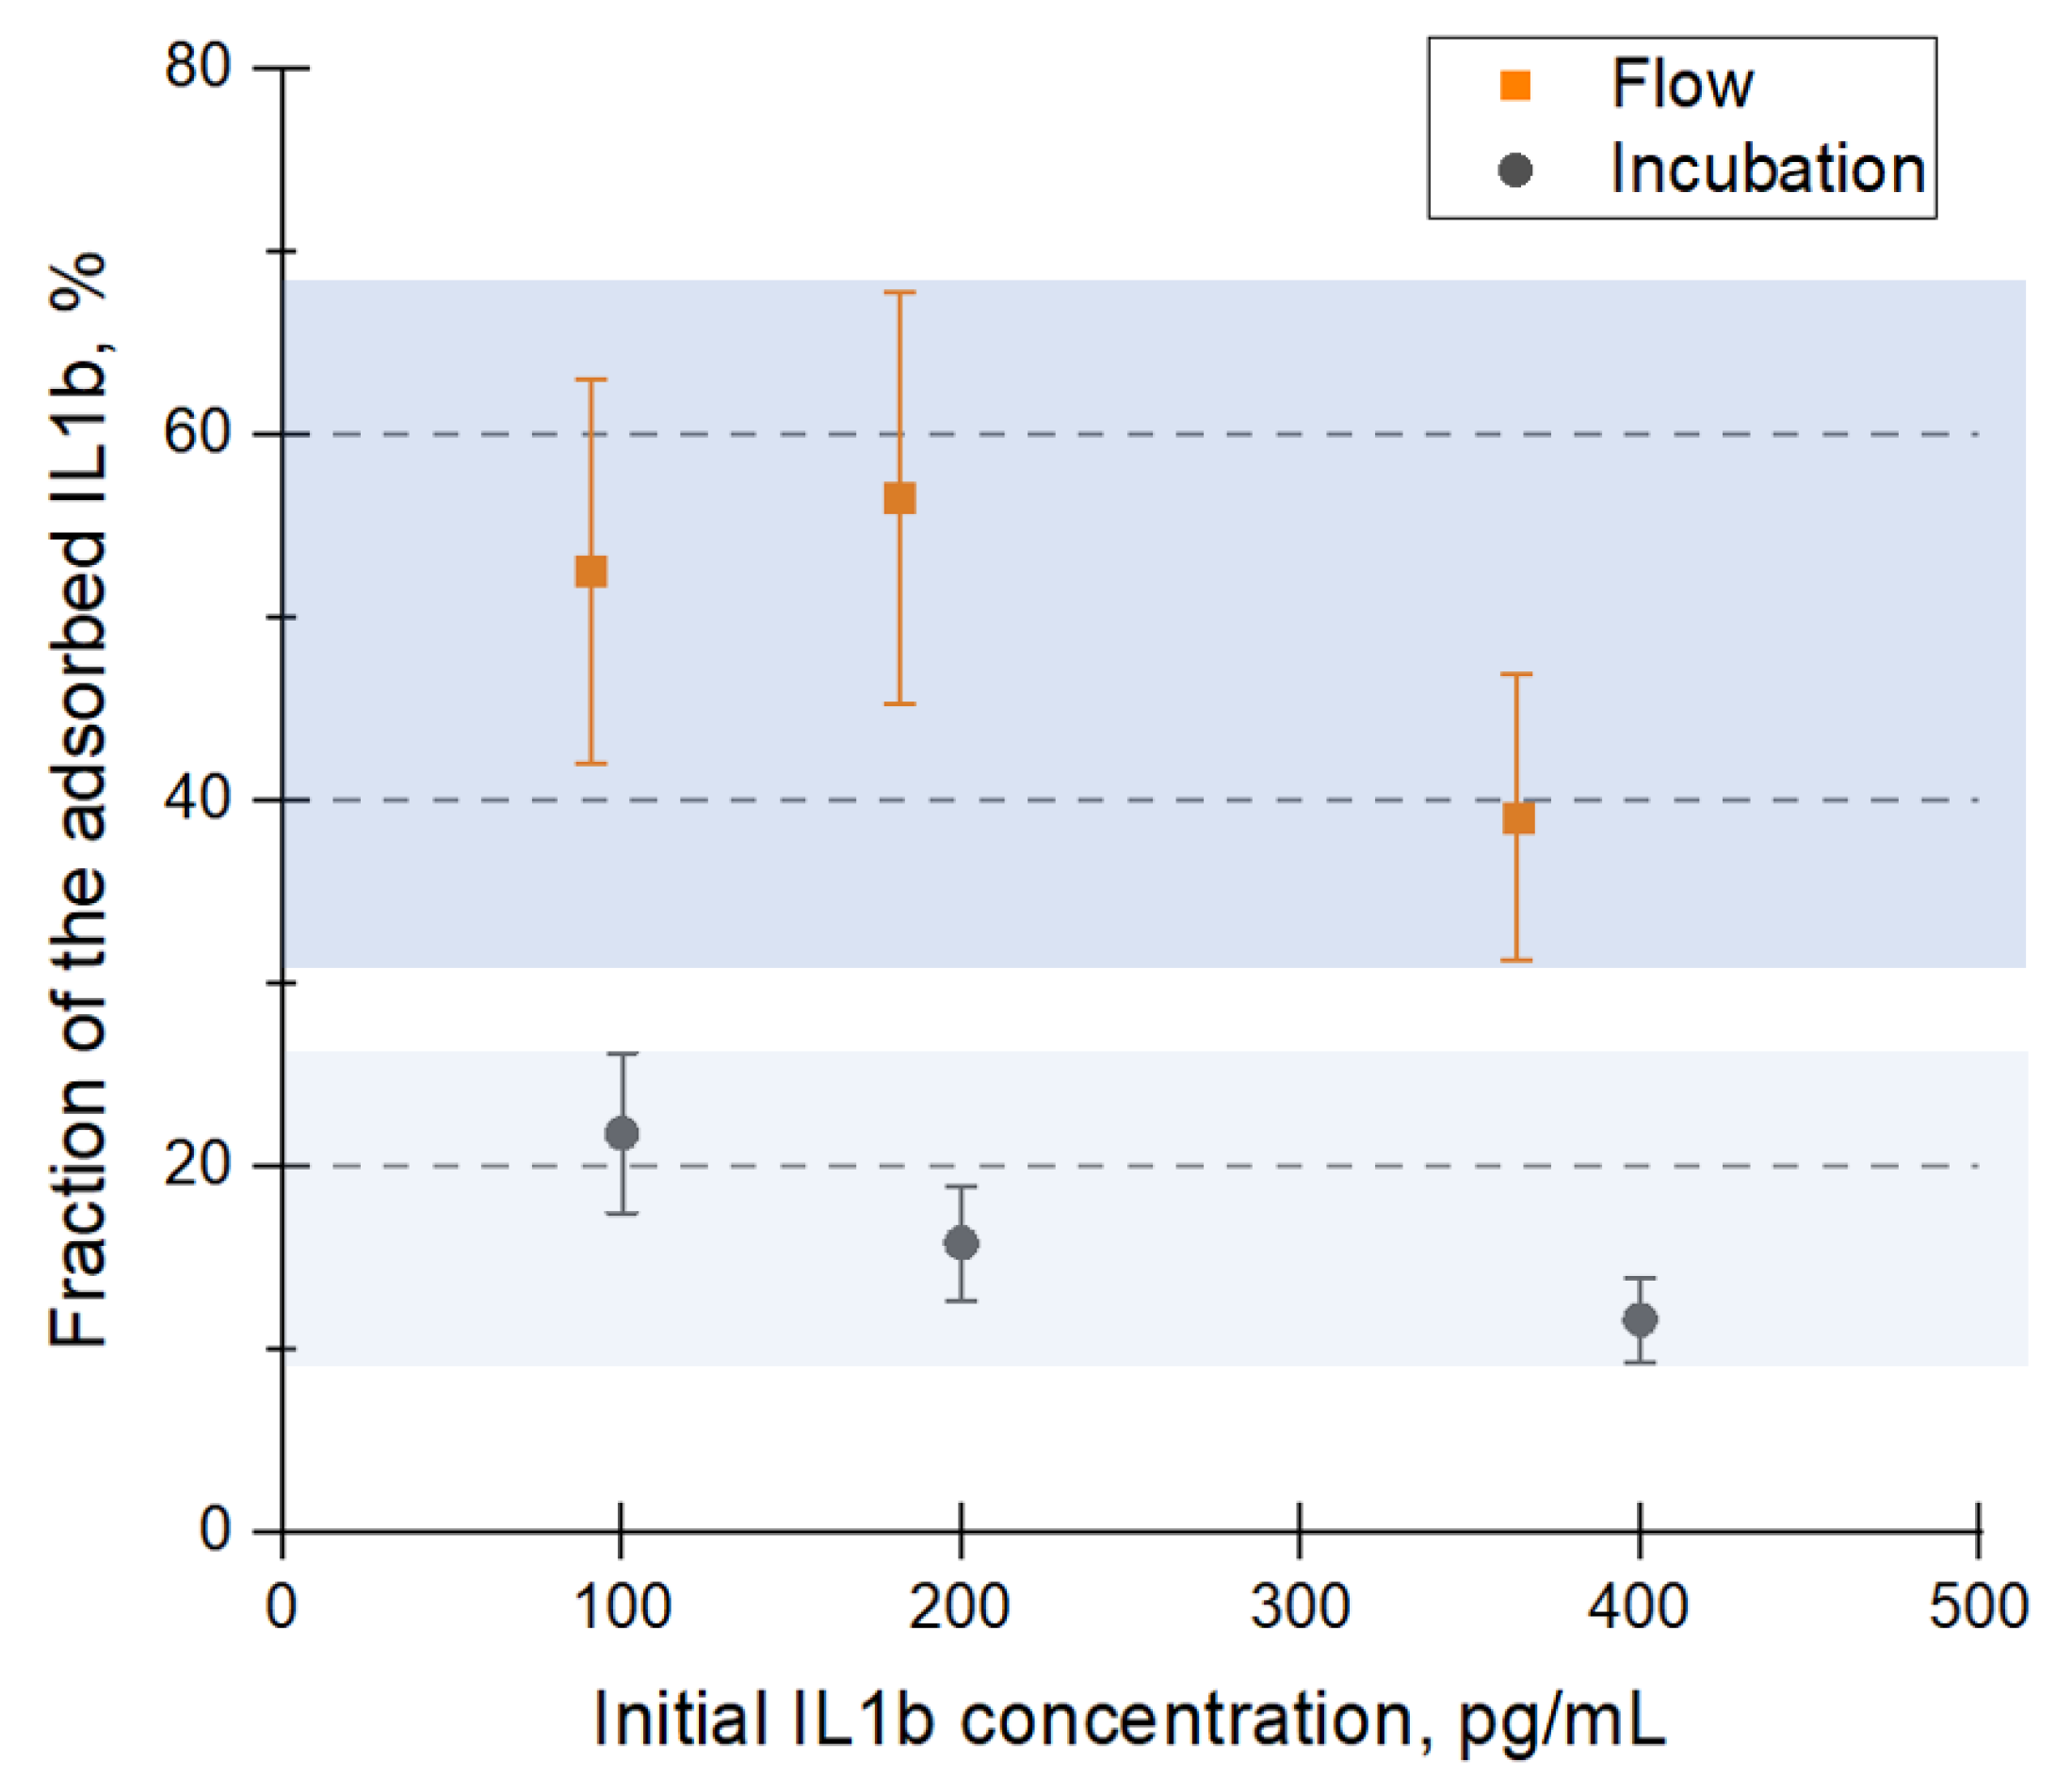
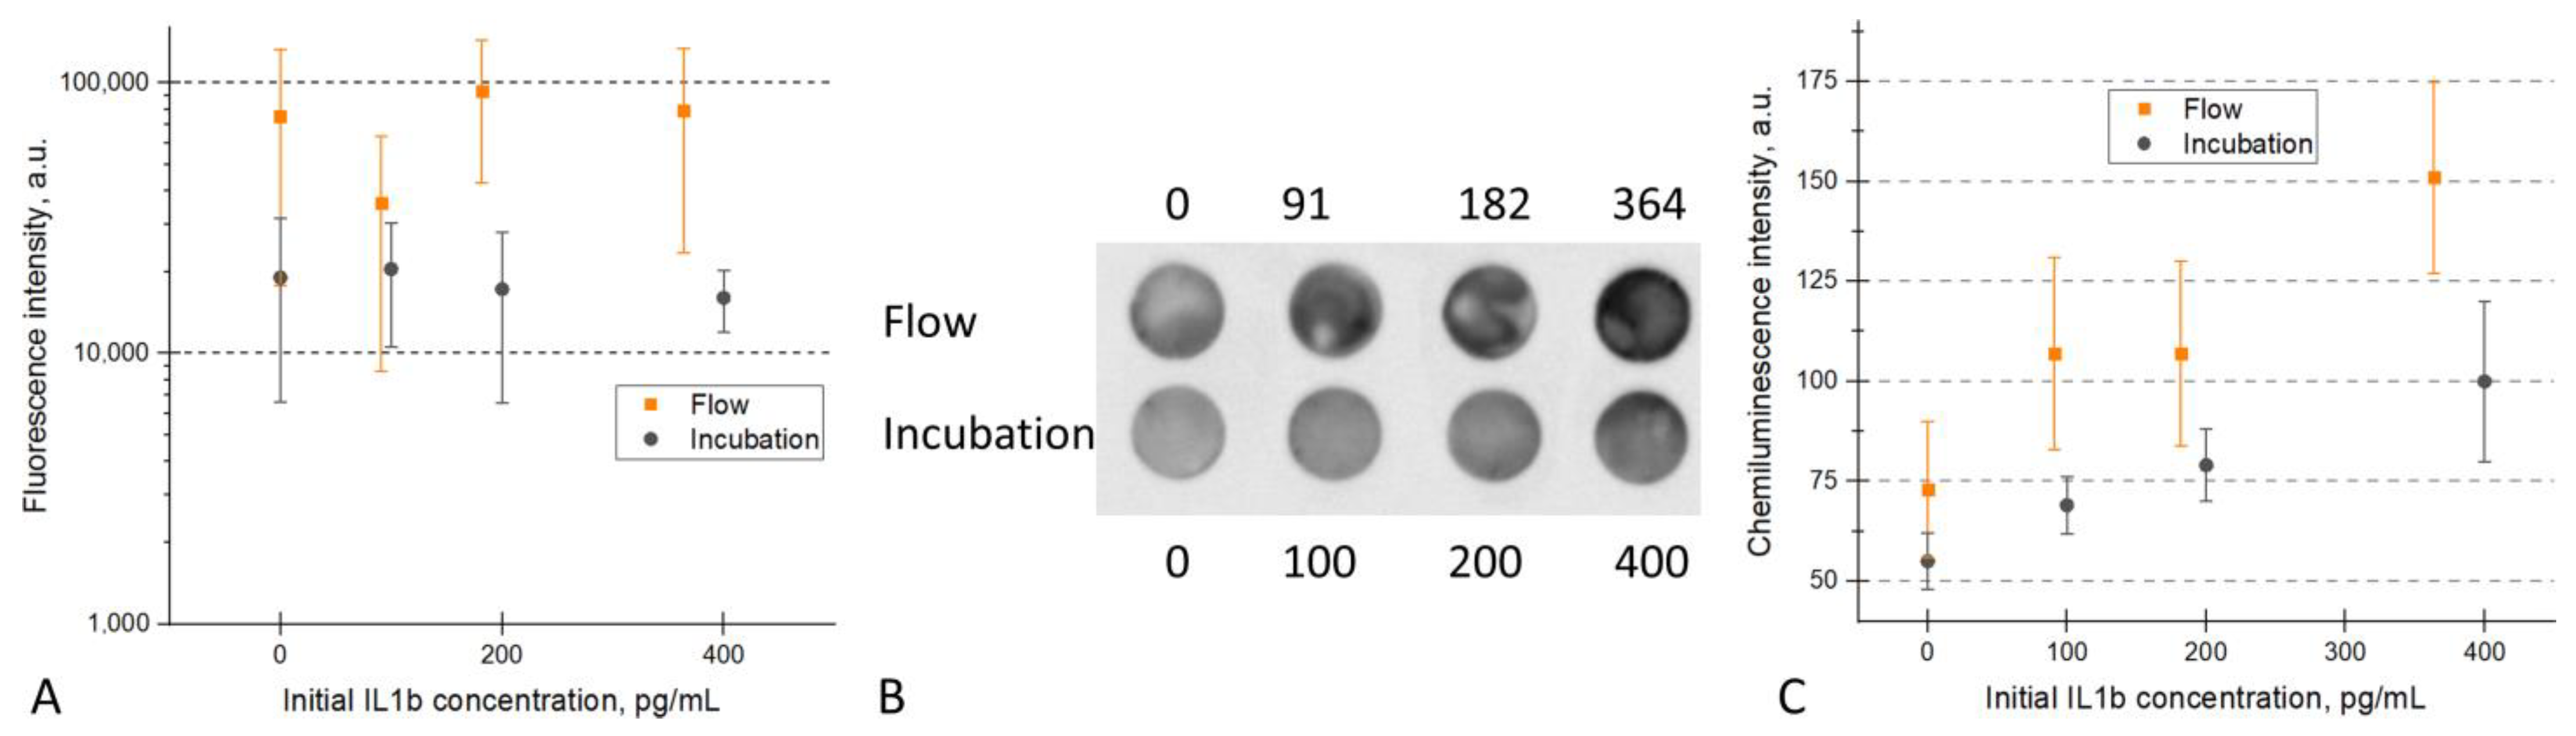
3.4. Measurements of Specific Binding
4. Conclusions
Supplementary Materials
Author Contributions
Funding
Institutional Review Board Statement
Informed Consent Statement
Data Availability Statement
Acknowledgments
Conflicts of Interest
References
- Khan, W.S.; Asmatulu, R.; Ceylan, M.; Jabbarnia, A. Recent progress on conventional and non-conventional electrospinning processes. Fibers Polym. 2013, 14, 1235–1247. [Google Scholar] [CrossRef]
- Singha, K.; Maity, S.; Singha, M.; Paul, P.; Gon, D.P. Effects of Fiber Diameter Distribution of Nonwoven Fabrics on its Properties. Int. J. Text. Sci. 2012, 1, 7–14. [Google Scholar]
- Luo, C.J.; Stoyanov, S.D.; Stride, E.; Pelan, E.; Edirisinghe, M. Electrospinning versus fibre production methods: From specifics to technological convergence. Chem. Soc. Rev. 2012, 41, 4708–4735. [Google Scholar] [CrossRef]
- Širc, J.; Hobzova, R.; Kostina, N.; Munzarová, M.; Juklíčková, M.; Lhotka, M.; Kubinová, Š.; Zajícová, A.; Michálek, J. Morphological characterization of nanofibers: Methods and application in practice. J. Nanomater. 2012, 2012, 1–14. [Google Scholar] [CrossRef]
- Omollo, E.; Zhang, C.; Mwasiagi, J.I.; Ncube, S. Electrospinning cellulose acetate nanofibers and a study of their possible use in high-efficiency filtration. J. Ind. Text. 2016, 45, 716–729. [Google Scholar] [CrossRef]
- Pavlova, E.; Maslakova, A.; Prusakov, K.; Bagrov, D. Optical sensors based on electrospun membranes—Principles, applications, and prospects for chemistry and biology. New J. Chem. 2022, 46, 8356–8380. [Google Scholar] [CrossRef]
- Asmatulu, R.; Veisi, Z.; Uddin, M.N.; Mahapatro, A. Highly Sensitive and Reliable Electrospun Polyaniline Nanofiber Based Biosensor as a Robust Platform for COX-2 Enzyme Detections. Fibers Polym. 2019, 20, 966–974. [Google Scholar] [CrossRef]
- Mikheev, A.Y.; Kanev, I.L.; Morozova, T.Y.; Morozov, V.N. Water-soluble filters from ultra-thin polyvinylpirrolidone nanofibers. J. Memb. Sci. 2013, 448, 151–159. [Google Scholar] [CrossRef]
- Vladimirsky, M.A.; Shipina, L.K.; Makeeva, E.S.; Alyapkina, Y.S.; Mikheev, A.Y.; Morozov, V.N. Application of water-soluble nanofilters for collection of airborne Mycobacterium tuberculosis DNA in hospital wards. J. Hosp. Infect. 2016, 93, 100–104. [Google Scholar] [CrossRef]
- Hoy, C.F.O.; Kushiro, K.; Yamaoka, Y.; Ryo, A.; Takai, M. Rapid multiplex microfiber-based immunoassay for anti-MERS-CoV antibody detection. Sens. Bio-Sens. Res. 2019, 26, 100304. [Google Scholar] [CrossRef]
- Hoy, C.F.O.; Kushiro, K.; Takai, M. Fabrication and assessment of an electrospun polymeric microfiber-based platform under bulk flow conditions with rapid and efficient antigen capture. Analyst 2018, 143, 865–873. [Google Scholar] [CrossRef]
- Hersey, J.S.; Meller, A.; Grinstaff, M.W. Functionalized Nanofiber Meshes Enhance Immunosorbent Assays. Anal. Chem. 2015, 87, 11863–11870. [Google Scholar] [CrossRef]
- Squires, T.M.; Messinger, R.J.; Manalis, S.R. Making it stick: Convection, reaction and diffusion in surface-based biosensors. Nat. Biotechnol. 2008, 26, 417–426. [Google Scholar] [CrossRef]
- Frutiger, A.; Tanno, A.; Hwu, S.; Tiefenauer, R.F.; Vörös, J.; Nakatsuka, N. Nonspecific Binding—Fundamental Concepts and Consequences for Biosensing Applications. Chem. Rev. 2021, 121, 8095–8160. [Google Scholar] [CrossRef]
- Ke, W.; Li, X.; Miao, M.; Liu, B.; Zhang, X.; Liu, T. Fabrication and Properties of Electrospun and Electrosprayed Polyethylene Glycol/Polylactic Acid (PEG/PLA) Films. Coatings 2021, 11, 790. [Google Scholar] [CrossRef]
- Yew, C.; Azari, P.; Choi, J.; Muhamad, F.; Pingguan-Murphy, B. Electrospun Polycaprolactone Nanofibers as a Reaction Membrane for Lateral Flow Assay. Polymers 2018, 10, 1387. [Google Scholar] [CrossRef]
- Fetz, A.E.; Fantaziu, C.A.; Smith, R.A.; Radic, M.Z.; Bowlin, G.L. Surface Area to Volume Ratio of Electrospun Polydioxanone Templates Regulates the Adsorption of Soluble Proteins from Human Serum. Bioengineering 2019, 6, 78. [Google Scholar] [CrossRef]
- Mikhutkin, A.A.; Kamyshinsky, R.A.; Tenchurin, T.K.; Shepelev, D.; Orekhov, A.S.; Grigoriev, T.E.; Mamaguashvili, V.G.; Chvalun, S.N.; Vasiliev, A.L. Towards Tissue Engineering: 3D Study of Polyamide-6 Scaffolds. Bionanoscience 2018, 8, 511–521. [Google Scholar] [CrossRef]
- Loskot, J.; Jezbera, D.; Bezrouk, A.; Doležal, R.; Andrýs, R.; Francová, V.; Miškář, D.; Fučíková, A.M. Raman spectroscopy as a novel method for the characterization of polydioxanone medical stents biodegradation. Materials 2021, 14, 5462. [Google Scholar] [CrossRef]
- Jin, C.; Liang, B.; Li, J.; Li, F. Biodegradation Behaviors of Poly(p-dioxanone) in Different Environment Media. J. Polym. Environ. 2013, 21, 1088–1099. [Google Scholar] [CrossRef]
- Zheng, Y.; Zhou, J.; Du, F.; Bao, Y.; Shan, G.; Zhang, L.; Dong, H.; Pan, P. Formation of Mesomorphic Polymorph, Thermal-Induced Phase Transition, and Crystalline Structure-Dependent Degradable and Mechanical Properties of Poly(p-dioxanone). Cryst. Growth Des. 2019, 19, 166–176. [Google Scholar] [CrossRef]
- Merlot, A.M.; Kalinowski, D.S.; Richardson, D.R. Unraveling the mysteries of serum albumin—More than just a serum protein. Front. Physiol. 2014, 5, 299. [Google Scholar] [CrossRef] [PubMed]
- Wang, J.; Kang, Q.S.; Lv, X.G.; Song, J.; Zhan, N.; Dong, W.G.; Huang, W.H. Simple patterned nanofiber scaffolds and its enhanced performance in immunoassay. PLoS ONE 2013, 8, e82888. [Google Scholar] [CrossRef] [PubMed]
- Mahmoudifard, M.; Vossoughi, M.; Soleimani, M. Different types of electrospun nanofibers and their effect on microfluidic-based immunoassay. Polym. Adv. Technol. 2019, 30, 973–982. [Google Scholar] [CrossRef]
- Lee, S.J.; Tatavarty, R.; Gu, M.B. Electrospun polystyrene-poly(styrene-co-maleic anhydride) nanofiber as a new aptasensor platform. Biosens. Bioelectron. 2012, 38, 302–307. [Google Scholar] [CrossRef]
- Yun, B.J.; Kwon, J.E.; Lee, K.; Koh, W.G. Highly sensitive metal-enhanced fluorescence biosensor prepared on electrospun fibers decorated with silica-coated silver nanoparticles. Sens. Actuators B Chem. 2019, 284, 140–147. [Google Scholar] [CrossRef]
- Lee, Y.; Lee, H.J.; Son, K.J.; Koh, W.-G. Fabrication of hydrogel-micropatterned nanofibers for highly sensitive microarray-based immunosensors having additional enzyme-based sensing capability. J. Mater. Chem. 2011, 21, 4476. [Google Scholar] [CrossRef]
- Wu, D.; Han, D.; Steckl, A.J. Immunoassay on Free-Standing Electrospun Membranes. ACS Appl. Mater. Interfaces 2010, 2, 252–258. [Google Scholar] [CrossRef]
- Gopal, R.; Kaur, S.; Ma, Z.; Chan, C.; Ramakrishna, S.; Matsuura, T. Electrospun nanofibrous filtration membrane. J. Memb. Sci. 2006, 281, 581–586. [Google Scholar] [CrossRef]
- Aussawasathien, D.; Teerawattananon, C.; Vongachariya, A. Separation of micron to sub-micron particles from water: Electrospun nylon-6 nanofibrous membranes as pre-filters. J. Memb. Sci. 2008, 315, 11–19. [Google Scholar] [CrossRef]
- Suaste-Gómez, E.; Rodríguez-Roldán, G.; Pérez-Solis, I.; Torres-Huerta, A.; Cruz-Cruz, C.; Tapia-Ramírez, J. Electrospinning Polylactic Acid Polymer Membranes as Biological Sieve for Yeast and Bacteria. Mater. Sci. Appl. 2022, 13, 389–400. [Google Scholar]
- Isık, T.; Demir, M.M. Medical Waste Treatment via Waste Electrospinning of PS. Fibers Polym. 2018, 19, 767–774. [Google Scholar] [CrossRef]
- Kaneko, N.; Kurata, M.; Yamamoto, T.; Morikawa, S.; Masumoto, J. The role of interleukin-1 in general pathology. Inflamm. Regen. 2019, 39, 1–16. [Google Scholar] [CrossRef]
- Eaton, S.L.; Hurtado, M.L.; Oldknow, K.J.; Graham, L.C.; Marchant, T.W.; Gillingwater, T.H.; Farquharson, C.; Wishart, T.M. A Guide to Modern Quantitative Fluorescent Western Blotting with Troubleshooting Strategies. J. Vis. Exp. 2014, 93, e52099. [Google Scholar] [CrossRef]
- Reddig, A.; Roggenbuck, D.; Reinhold, D. Comparison of different immunoassays for γH2AX quantification. J. Lab. Precis. Med. 2018, 3, 80. [Google Scholar] [CrossRef]
- Hashemi, S.A.; Bahrani, S.; Mousavi, S.M.; Omidifar, N.; Behbahan, N.G.G.; Arjmand, M.; Lankarani, K.B.; Moghadami, M.; Firoozsani, M. Antibody mounting capability of 1D/2D carbonaceous nanomaterials toward rapid-specific detection of SARS-CoV-2. Talanta 2022, 239, 123113. [Google Scholar] [CrossRef]
- Hashemi, S.A.; Bahrani, S.; Mousavi, S.M.; Omidifar, N.; Behbahan, N.G.G.; Arjmand, M.; Ramakrishna, S.; Lankarani, K.B.; Moghadami, M.; Shokripour, M.; et al. Ultra-precise label-free nanosensor based on integrated graphene with Au nanostars toward direct detection of IgG antibodies of SARS-CoV-2 in blood. J. Electroanal. Chem. 2021, 894, 115341. [Google Scholar] [CrossRef]


Disclaimer/Publisher’s Note: The statements, opinions and data contained in all publications are solely those of the individual author(s) and contributor(s) and not of MDPI and/or the editor(s). MDPI and/or the editor(s) disclaim responsibility for any injury to people or property resulting from any ideas, methods, instructions or products referred to in the content. |
© 2023 by the authors. Licensee MDPI, Basel, Switzerland. This article is an open access article distributed under the terms and conditions of the Creative Commons Attribution (CC BY) license (https://creativecommons.org/licenses/by/4.0/).
Share and Cite
Maslakova, A.; Prusakov, K.; Sidorova, A.; Pavlova, E.; Ramonova, A.; Bagrov, D. Pressure-Driven Sample Flow through an Electrospun Membrane Increases the Analyte Adsorption. Micro 2023, 3, 566-577. https://doi.org/10.3390/micro3020038
Maslakova A, Prusakov K, Sidorova A, Pavlova E, Ramonova A, Bagrov D. Pressure-Driven Sample Flow through an Electrospun Membrane Increases the Analyte Adsorption. Micro. 2023; 3(2):566-577. https://doi.org/10.3390/micro3020038
Chicago/Turabian StyleMaslakova, Aitsana, Kirill Prusakov, Anastasia Sidorova, Elizaveta Pavlova, Alla Ramonova, and Dmitry Bagrov. 2023. "Pressure-Driven Sample Flow through an Electrospun Membrane Increases the Analyte Adsorption" Micro 3, no. 2: 566-577. https://doi.org/10.3390/micro3020038