Article

Tensile Behavior of [0/90]7 Hemp/Elium Biocomposites after Water Aging: In-Situ Micro-CT Testing and Numerical Analysis

by
Quentin Drouhet
,
Fabienne Touchard
* and
Laurence Chocinski-Arnault
Institut Pprime, CNRS-ISAE-ENSMA-Université de Poitiers UPR 3346, Département de Physique et Mécanique des Matériaux, 1 Avenue Clément Ader, 86360 Chasseneuil-du-Poitou, France
*
Author to whom correspondence should be addressed.
Micro 2023, 3(2), 496-509; https://doi.org/10.3390/micro3020033
Submission received: 16 March 2023 / Revised: 18 April 2023 / Accepted: 27 April 2023 / Published: 2 May 2023

Abstract

:
This paper aims to study the tensile behavior of a woven [0/90]7 hemp/Elium composite after three different conditionings: “Ambient storage”, “Saturated at 60 °C” and “15 wet/dry cycles”. Instrumented repeated progressive tensile loading tests were carried out and showed an unexpected increase in the secant modulus for the aged samples at the end of the test. An in-situ micro-CT tensile test was then performed on a “15 wet/dry cycles” aged sample. The analysis of the tomographic images showed the damage development with interfacial debonding and matrix cracks in the specimen volume, and also the decrease in the curvature radius of the warp yarns during tensile loading facilitated by the plasticization of the resin. Finite element calculations were thus performed and demonstrated that the increase in the modulus is directly linked to the straightening of warp yarns, showing that the evolution of the modulus on a macroscopic scale can be explained by the deformations of the yarns on a microscopic level. These results allow us to better understand the mechanical behavior and the damage mechanisms that occur in biocomposites during tensile testing after water aging.

1. Introduction

Biocomposites are increasingly developed for different fields such as energy, transport, and sports facilities industry [1,2,3]. Indeed, the climate emergency is prompting some companies to dispense with traditionally used composites such as glass/epoxy ones and to use natural fibers as reinforcements [4,5,6]. To compete with glass-reinforced composites and to be more environmentally friendly, the use of hemp-reinforced biocomposites is an interesting alternative [7,8]. One of the advantages of the cultivation of hemp is that it is possible to use all parts of the plant: seeds for the agri-food industry, shives for the building sector, and short or long fibers for textile and composite materials industries [9,10]. Biocomposites made of continuous natural reinforcements and thermoset matrices exhibit high mechanical properties [11,12,13,14,15,16,17,18]. However, thermoset resins are not recyclable. Thus, in this study, the biocomposites tested are made of hemp-woven fabrics and a thermoplastic polymer. The chosen matrix, named Elium 188 and produced by the company Arkema, is a liquid methylmethacrylate based polymer, which can be thermoformed and recycled [19,20].
One of the major issues in the use of biocomposites is their long-term performance for outdoor applications. Indeed, during its service life, a structural composite part can be affected by humidity and temperature variations. Natural fibers have a hydrophilic behavior, which can have consequences on the fiber/matrix interfacial adhesion [21]. Several studies have shown that the water uptake in natural fiber-reinforced composites has an adverse effect on rigidity and strength [22,23,24,25,26] and some of them have focused on the influence of the water temperature on the absorption properties [27,28]. Malloum et al. studied the influence of water immersion time on two cross-ply laminates ([0/90]s and [+45/−45]s) of flax/Greenpoxy composite. They showed that Young’s modulus of composites decreases up to 26% for [0/90]s specimens and 45% for [+45/−45]s ones after 30 days of aging [29]. Wet/dry cycles have also been studied by some authors to reproduce the variation of humidity and temperature on flax fiber-reinforced composites [30,31,32]. For example, Mak and Fam worked on unidirectional flax-reinforced epoxy laminates subjected to twelve wet/dry cycles composed of 23 days of immersion in distilled room temperature water followed by 5 days in an oven at 60 °C. They showed a loss in tensile properties of the studied composites with a reduction of 12% in strength and 19% in Young’s modulus [30].
In this paper, two different aging conditions were carried out on [0/90]7 hemp/Elium samples and compared with the ambient storage: immersion in water until saturation and wet/dry cycling. To estimate their influence on the mechanical performances of the biocomposite, the evolution of the tensile modulus was analyzed by performing repeated progressive tensile loading tests. This type of mechanical test consists in cyclically loading a sample while increasing the stress until failure. It allows us to extract from the stress-strain curve the secant modulus for each cycle. Initially developed for carbon fiber reinforced composites by Lemaitre [33], it was then applied in some studies to determine the modulus evolution in plant-reinforced composites [18,34]. In this study, in addition to the repeated progressive loading tests, an in-situ micro-computed tomography (micro-CT) tensile test was also performed. This test allowed us to investigate the microstructural phenomena occurring during tensile loading in the volume of the sample. Few studies deal with the use of X-ray micro-CT on plant fiber composites. For example, Madra et al. [35] worked on the measurement of orientation and dimension of short fibers in composites and Perrier [21] used micro-CT to quantify damage in a woven hemp/epoxy composite. However, to the best of the authors’ knowledge, there are no published works concerning in-situ micro-CT tests on plant fiber composite. The novelty of this work also lies in the fact that this experimental investigation was completed with a finite element calculation to simulate the tensile behavior of the woven hemp/Elium composite. In literature, different numerical models have been developed for plant fiber composites [36,37,38]. The specificity of the model proposed in this work is that it takes into account the influence of the yarn undulation in the woven biocomposite.
After presenting the tested material and the aging conditions, this paper will describe the experimental and numerical procedures. Then, results obtained with the repeated progressive loading tests will be discussed thanks to the in-situ micro-CT tensile test and the finite element modeling with the aim to analyze the evolution of the tensile modulus of the studied biocomposite samples.

2. Materials and Methods

2.1. Tested Material

In this study, biocomposites made of seven plain-woven plies of hemp fabrics with an areal weight of 290 ± 10 g/m2 are used. The matrix is a thermoplastic polymer named Elium 188 developed by the company Arkema. The vacuum infusion process was applied to manufacture the biocomposite plates. After manufacturing, samples were cut from the plates into rectangular specimens with the following overall dimensions: 140 mm in length, 20 mm in width and 4 mm in thickness. The orientation of the warp yarns is parallel to the tensile axis in order to obtain [0/90]7 hemp/Elium samples. The properties of the raw materials are summarized in Table 1. The fiber volume fraction of samples was determined by geometry and weight measurements and is equal to 39.7 ± 1.6%.

2.2. Aging Conditions

Two different aging conditions were carried out on the [0/90]7 specimens to determine their influence on the evolution of the tensile modulus during mechanical tests. To compare with the aging conditions, the “Ambient storage” is used as the reference state. It consists of the storage of the samples at room temperature and humidity: 21 ± 2 °C and 48 ± 5% of relative humidity. The first aging condition is named “Saturated at 60 °C”: samples are immersed in water at 60 °C until reaching the maximum water uptake (12 days). The second aging condition, called “15 wet/dry cycles”, consists of immersing samples in water at 60 °C for 12 days and drying them for 2 days at 40 °C, fifteen times successively.

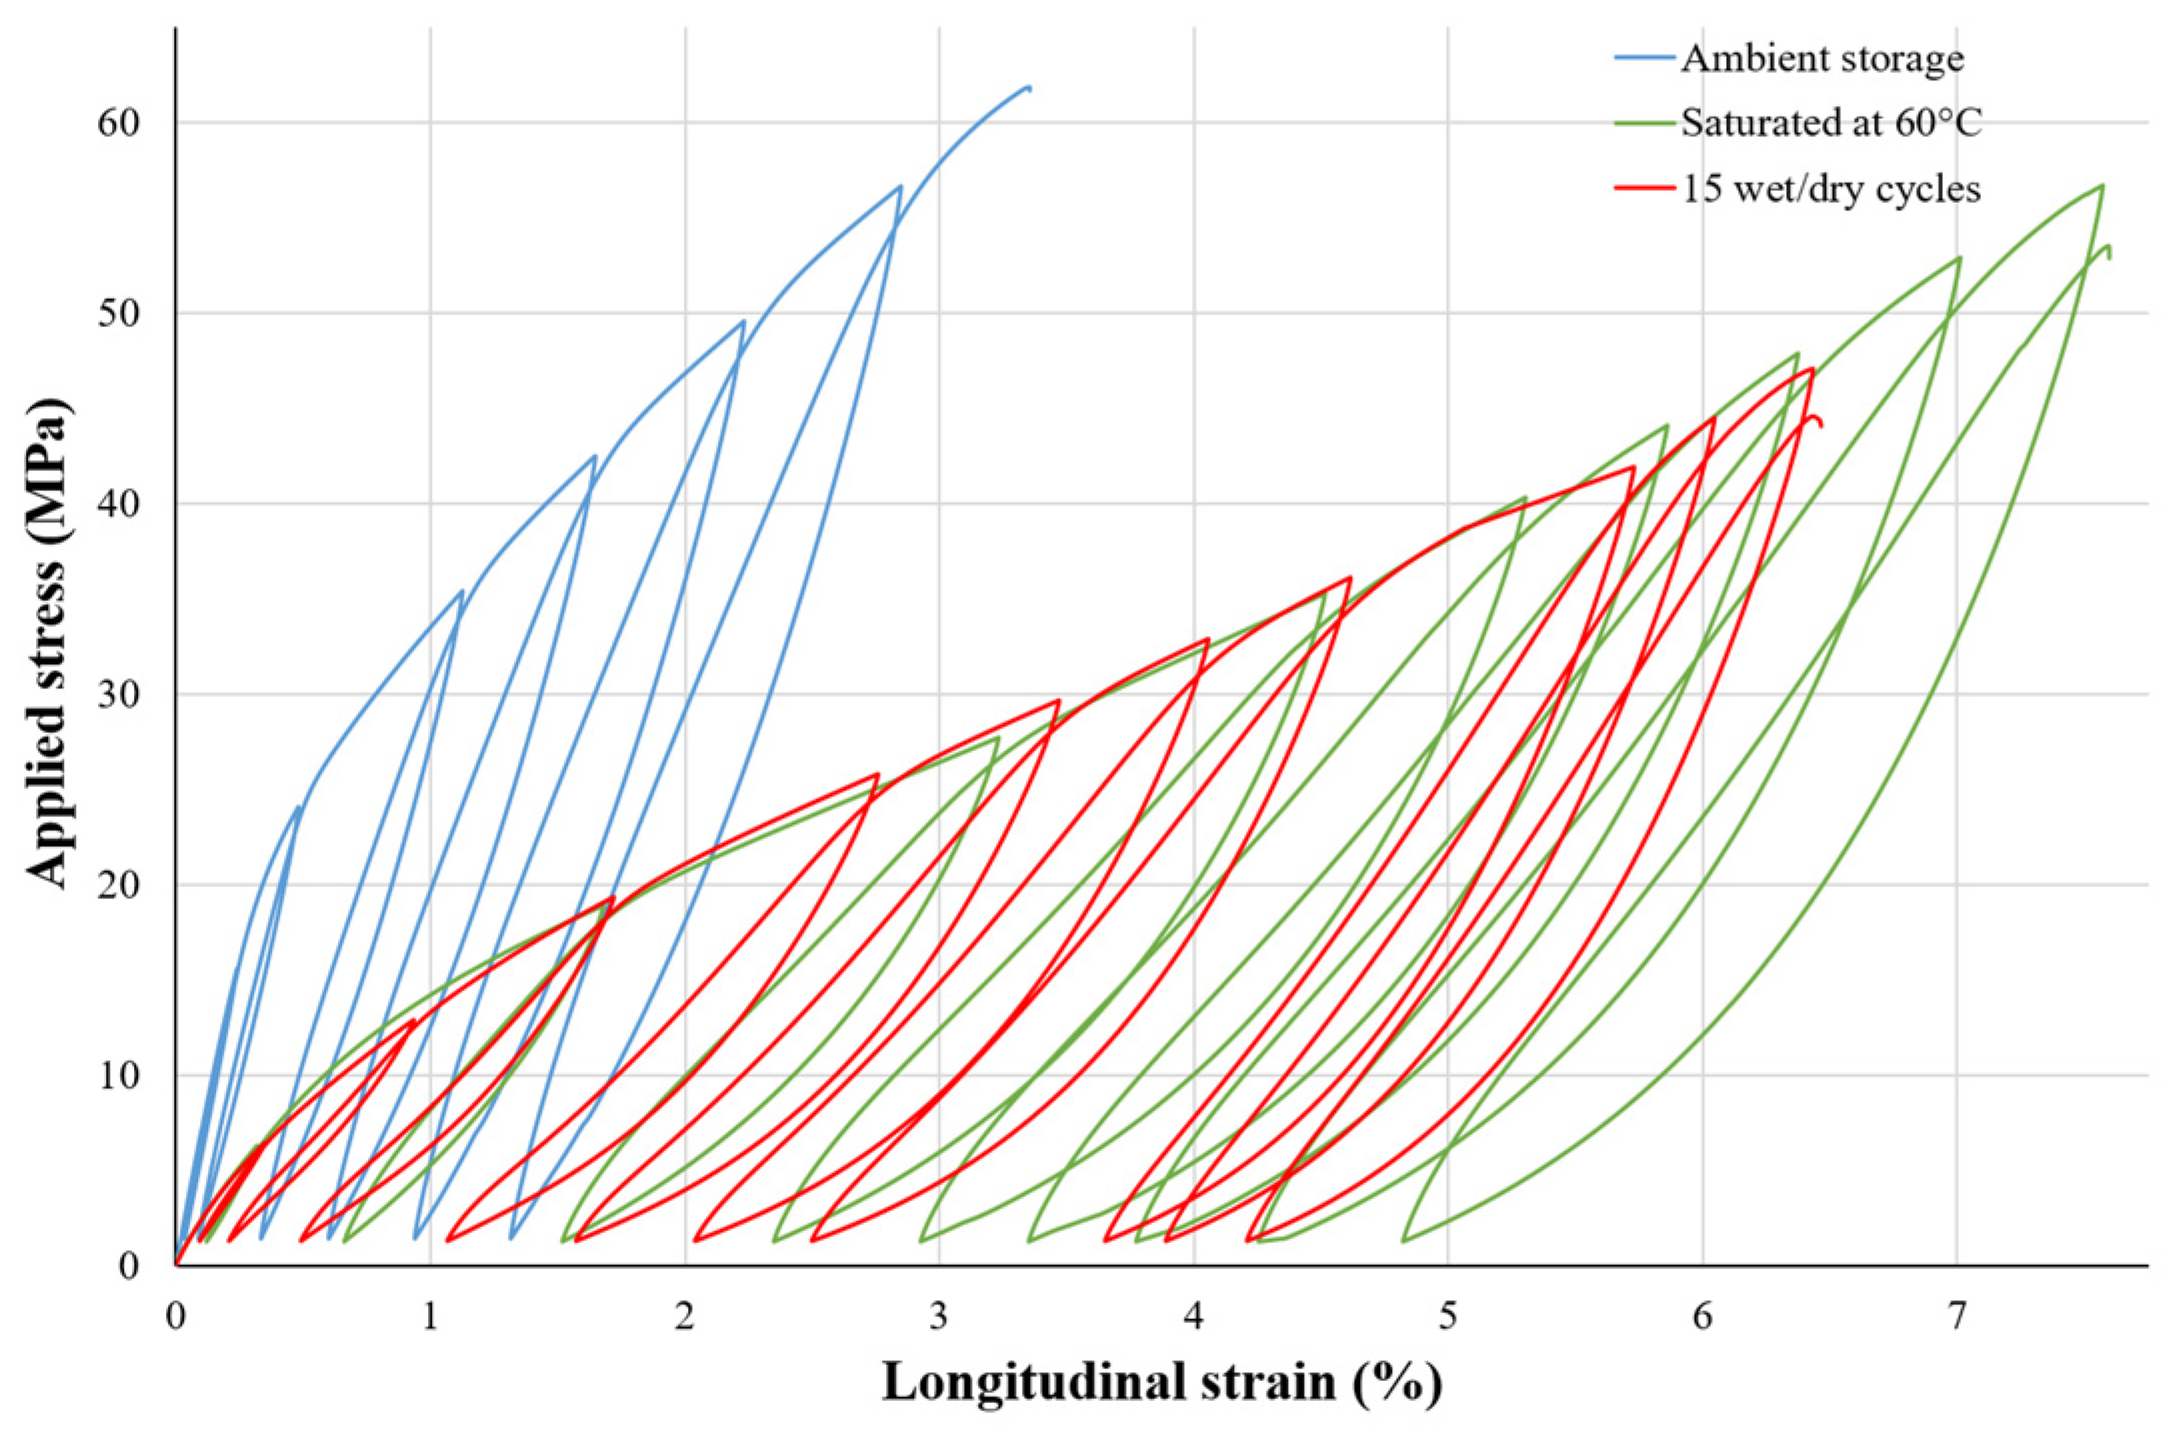
2.3. Ex-Situ Repeated Progressive Tensile Loading

Tensile tests were carried out on the biocomposites after the “Ambient storage” and after the two previously described aging conditions. To analyze the modulus evolution during mechanical testing, repeated progressive tensile loading was applied. Tests were performed using an Instron 5982 machine, with a crosshead speed of 0.5 mm/min. As opposed to in-situ micro-CT tests, these experiments will be referred to as ex-situ tests. The axial strain was measured by a 12.5 mm gauge length extensometer and the transverse strain was determined with a biaxial extensometer. To take into account the dimension variations after the different aging conditions, the cross-section of the samples was measured just before each mechanical test. The tensile properties of the samples were determined following ASTM D 3039. Repeated progressive tensile tests allow us to determine the secant modulus at each loading-unloading cycle (Figure 1). Thus, it makes it possible to determine the evolution of the secant modulus as a function of the applied stress. For this purpose, a k-factor was defined (Equation (1)):
k = Eσi/E0

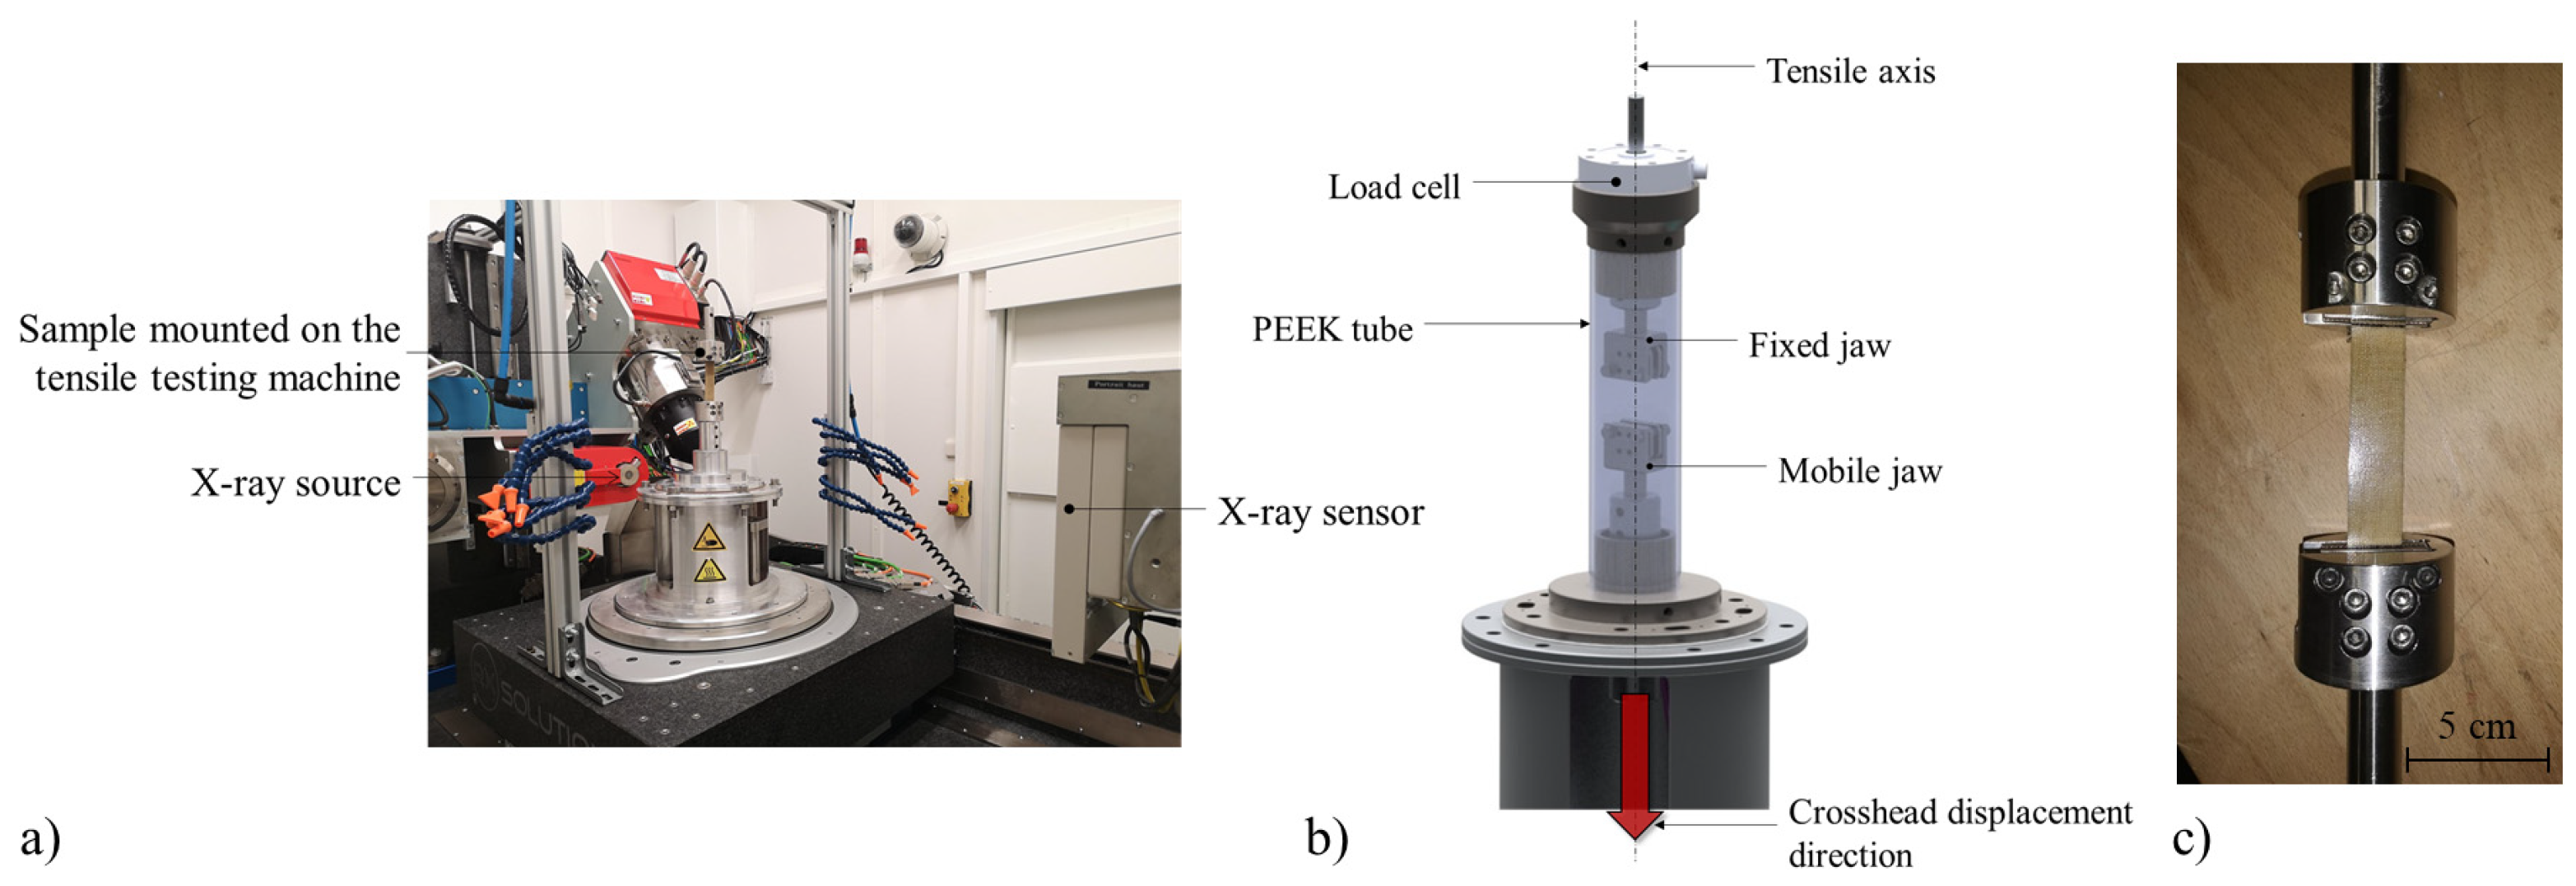
2.4. In-Situ Micro-CT Tensile Test

Micro-CT scans were performed using an UltraTom CT scanner developed by the company RX Solutions (France). A Hamamatsu micro focus sealed X-ray tube operates at an amperage range of 0–500 µA and a voltage range of 20–150 kV with a maximum power of 75 W. In this work, a power equal to 15 W was used, with a voltage of 60 kV and an amperage of 250 µA. Images were recorded with a voxel resolution of 15 µm. The dimensions of the scanned zone were 20 mm in width and 4 mm in thickness (total cross-section of the sample), and 15 mm in length. In order to perform in-situ tensile tests in the micro-CT, a specific machine called MUTTOM was developed in our laboratory (Figure 2a,b). This in-situ machine allows to perform micro-CT scans on loaded samples [42]. In the upper part of this machine, a 25 kN load cell is assembled with a fixed jaw. A linear actuator allows the crosshead to move downwards and the mobile jaw is assembled to it. Thanks to a PEEK tube, the loadings are directly transmitted to the sample. In this study, an in-situ X-ray microtomography tensile test was performed on a [0/90]7 hemp/Elium sample (Figure 2c). The test was made with a crosshead speed of 0.5 mm/min as for the ex-situ test. It has to be noticed that the rotation axis of the tomograph is the same as the tensile loading axis of the testing machine.

2.5. Image Processing

For the in-situ tested sample, image segmentation was carried out on the 3D reconstructed volumes with the free image processing software Fiji to quantify the damage. An artificial intelligence-based plugin called Trainable Weka Segmentation 3D was used [43]. It combines machine learning algorithms, data analysis, and visualization tools. This plugin allows for the segmenting of n material phases from a stack of images into n classes. It is trainable because it learns from the user, who can select several known areas and assign them to the corresponding class. Then the plugin compares each pixel in the image stack with the user’s training data and assigns each pixel to the most likely class. In this study, three phases were distinguished in the material: matrix, hemp fibers and damage. For better efficiency, the plugin learning procedure was based on four training features: mean, variance, median, and structure.
Due to the large size of the tomographic images, segmentation was performed by using the supercomputer facilities at the Mésocentre de calcul SPIN hosted by the University of Poitiers.

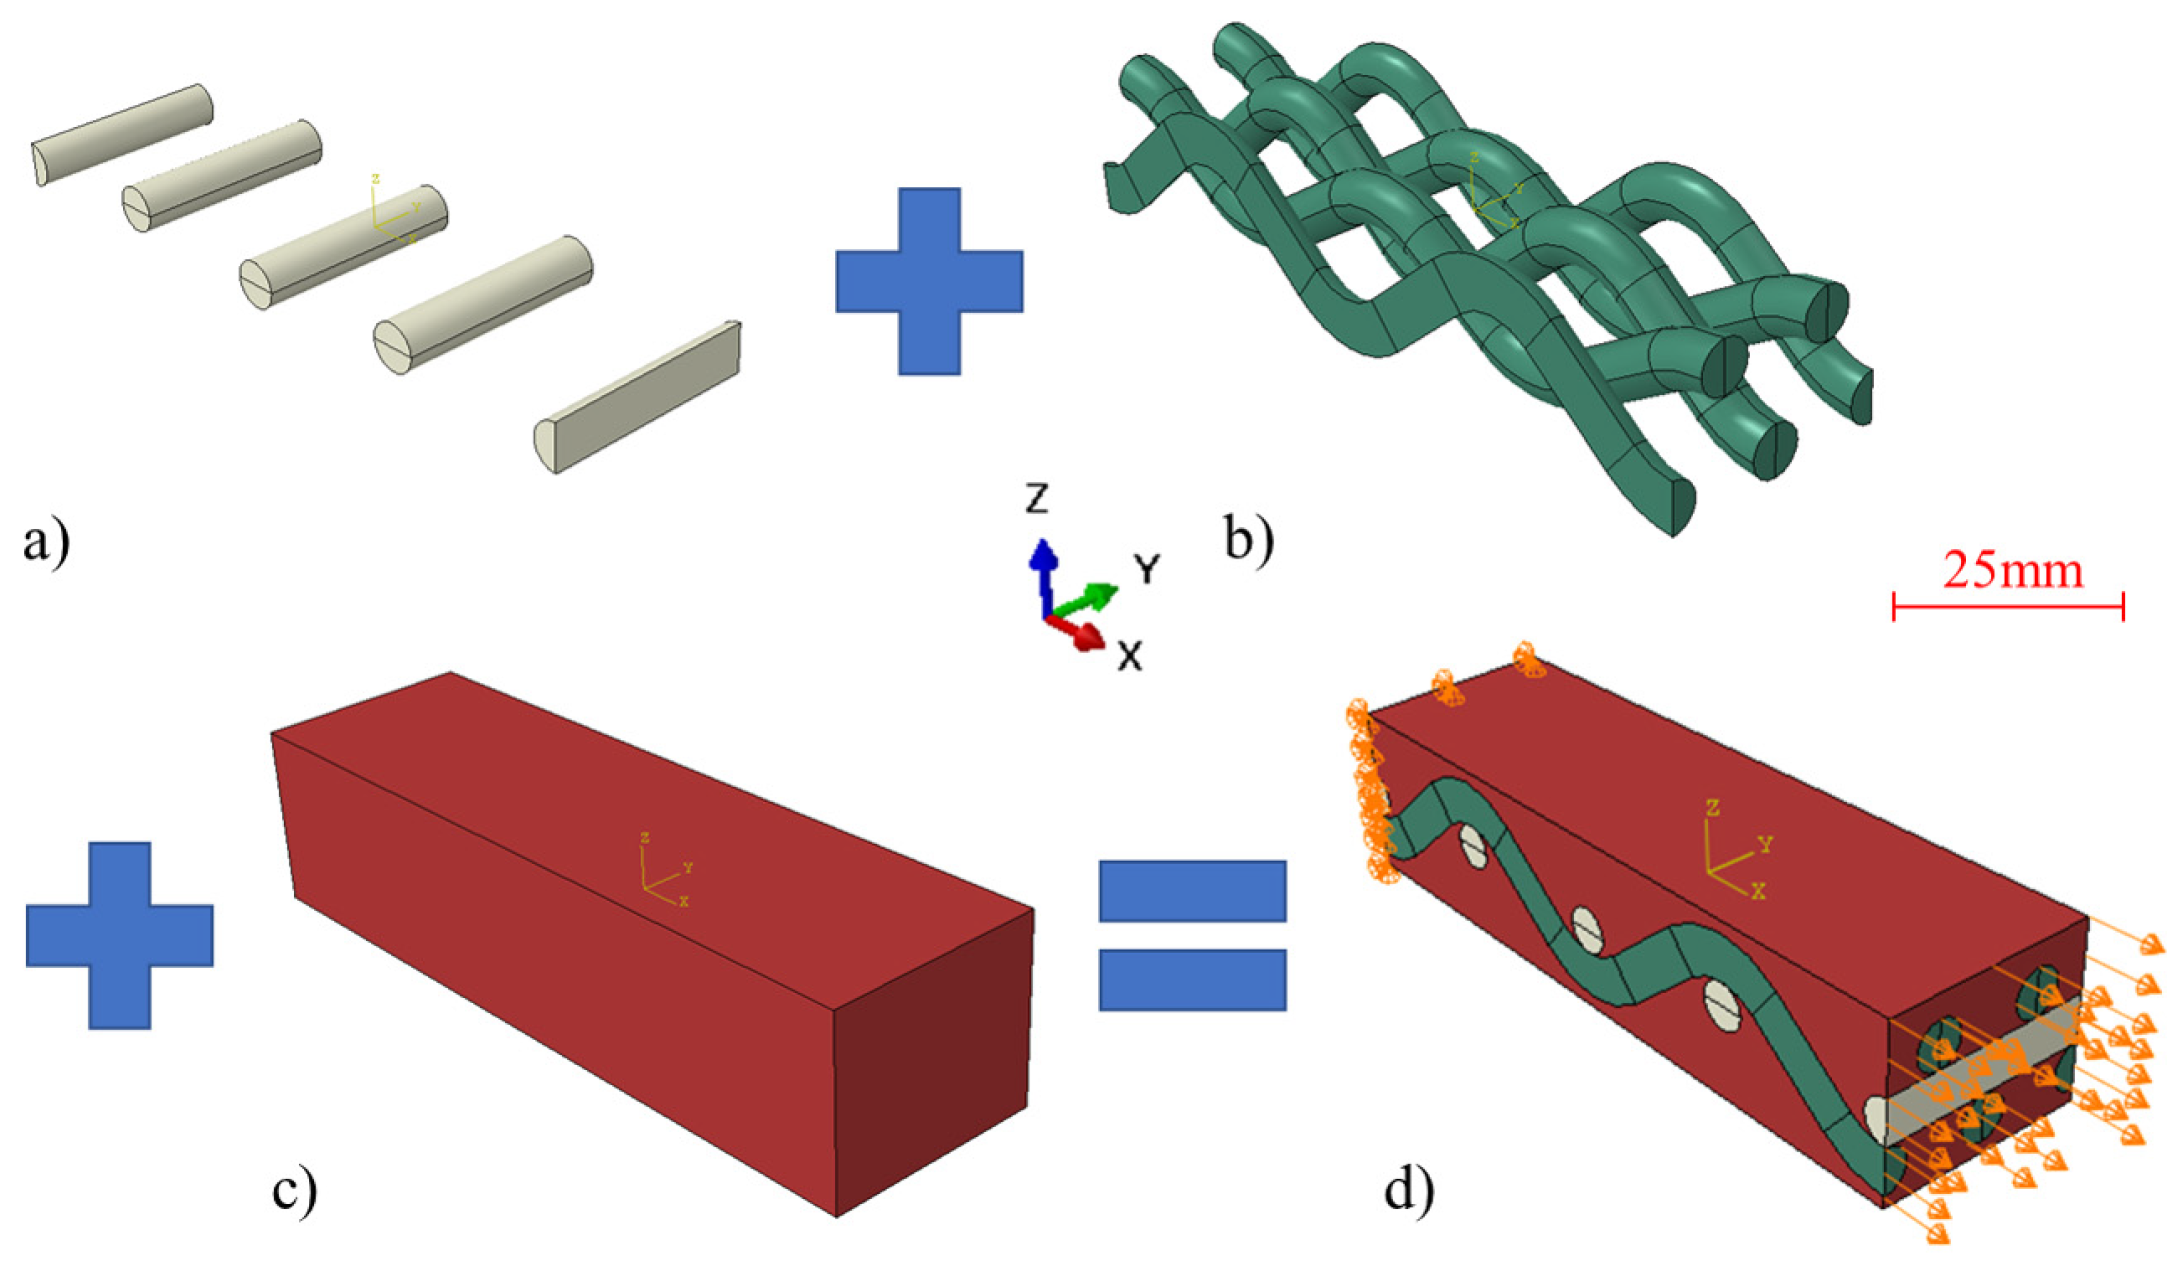
2.6. Finite Element Calculation

A finite element analysis of the tensile behavior of the studied composite was carried out using the software ABAQUS. The 3D numerical model was developed to represent a portion of the woven composite, including warp and weft hemp yarns into the polymer matrix (Figure 3). Each yarn was considered as a homogeneous circular solid cylinder of constant diameter. The warp yarns were drawn with the experimentally measured curvatures. For simplicity’s sake, the weft yarns, which are submitted to transverse loading, were assumed to be straight and all interfaces were considered to be perfect. The resulting fiber volume fraction was about 27%. An elastic isotropic behavior was assigned to the materials. The Young’s modulus of the matrix was experimentally determined after the aging of “15 wet/dry cycles”, in order to be in the same condition as for the tested composite. The Young’s modulus of the warp yarns was taken equal to the longitudinal value given in Table 1 (23,000 MPa) and that of the weft yarns equal to the respective transverse value (1264 MPa). About 150,000 quadratic tetrahedral elements of type C3D10 were used to describe the volume. Regarding the boundary conditions (Figure 3d), the displacements in the three directions were set to zero at one end and a displacement of 0.02 mm was applied along the tensile X-axis at the other end.

3. Results and Discussion

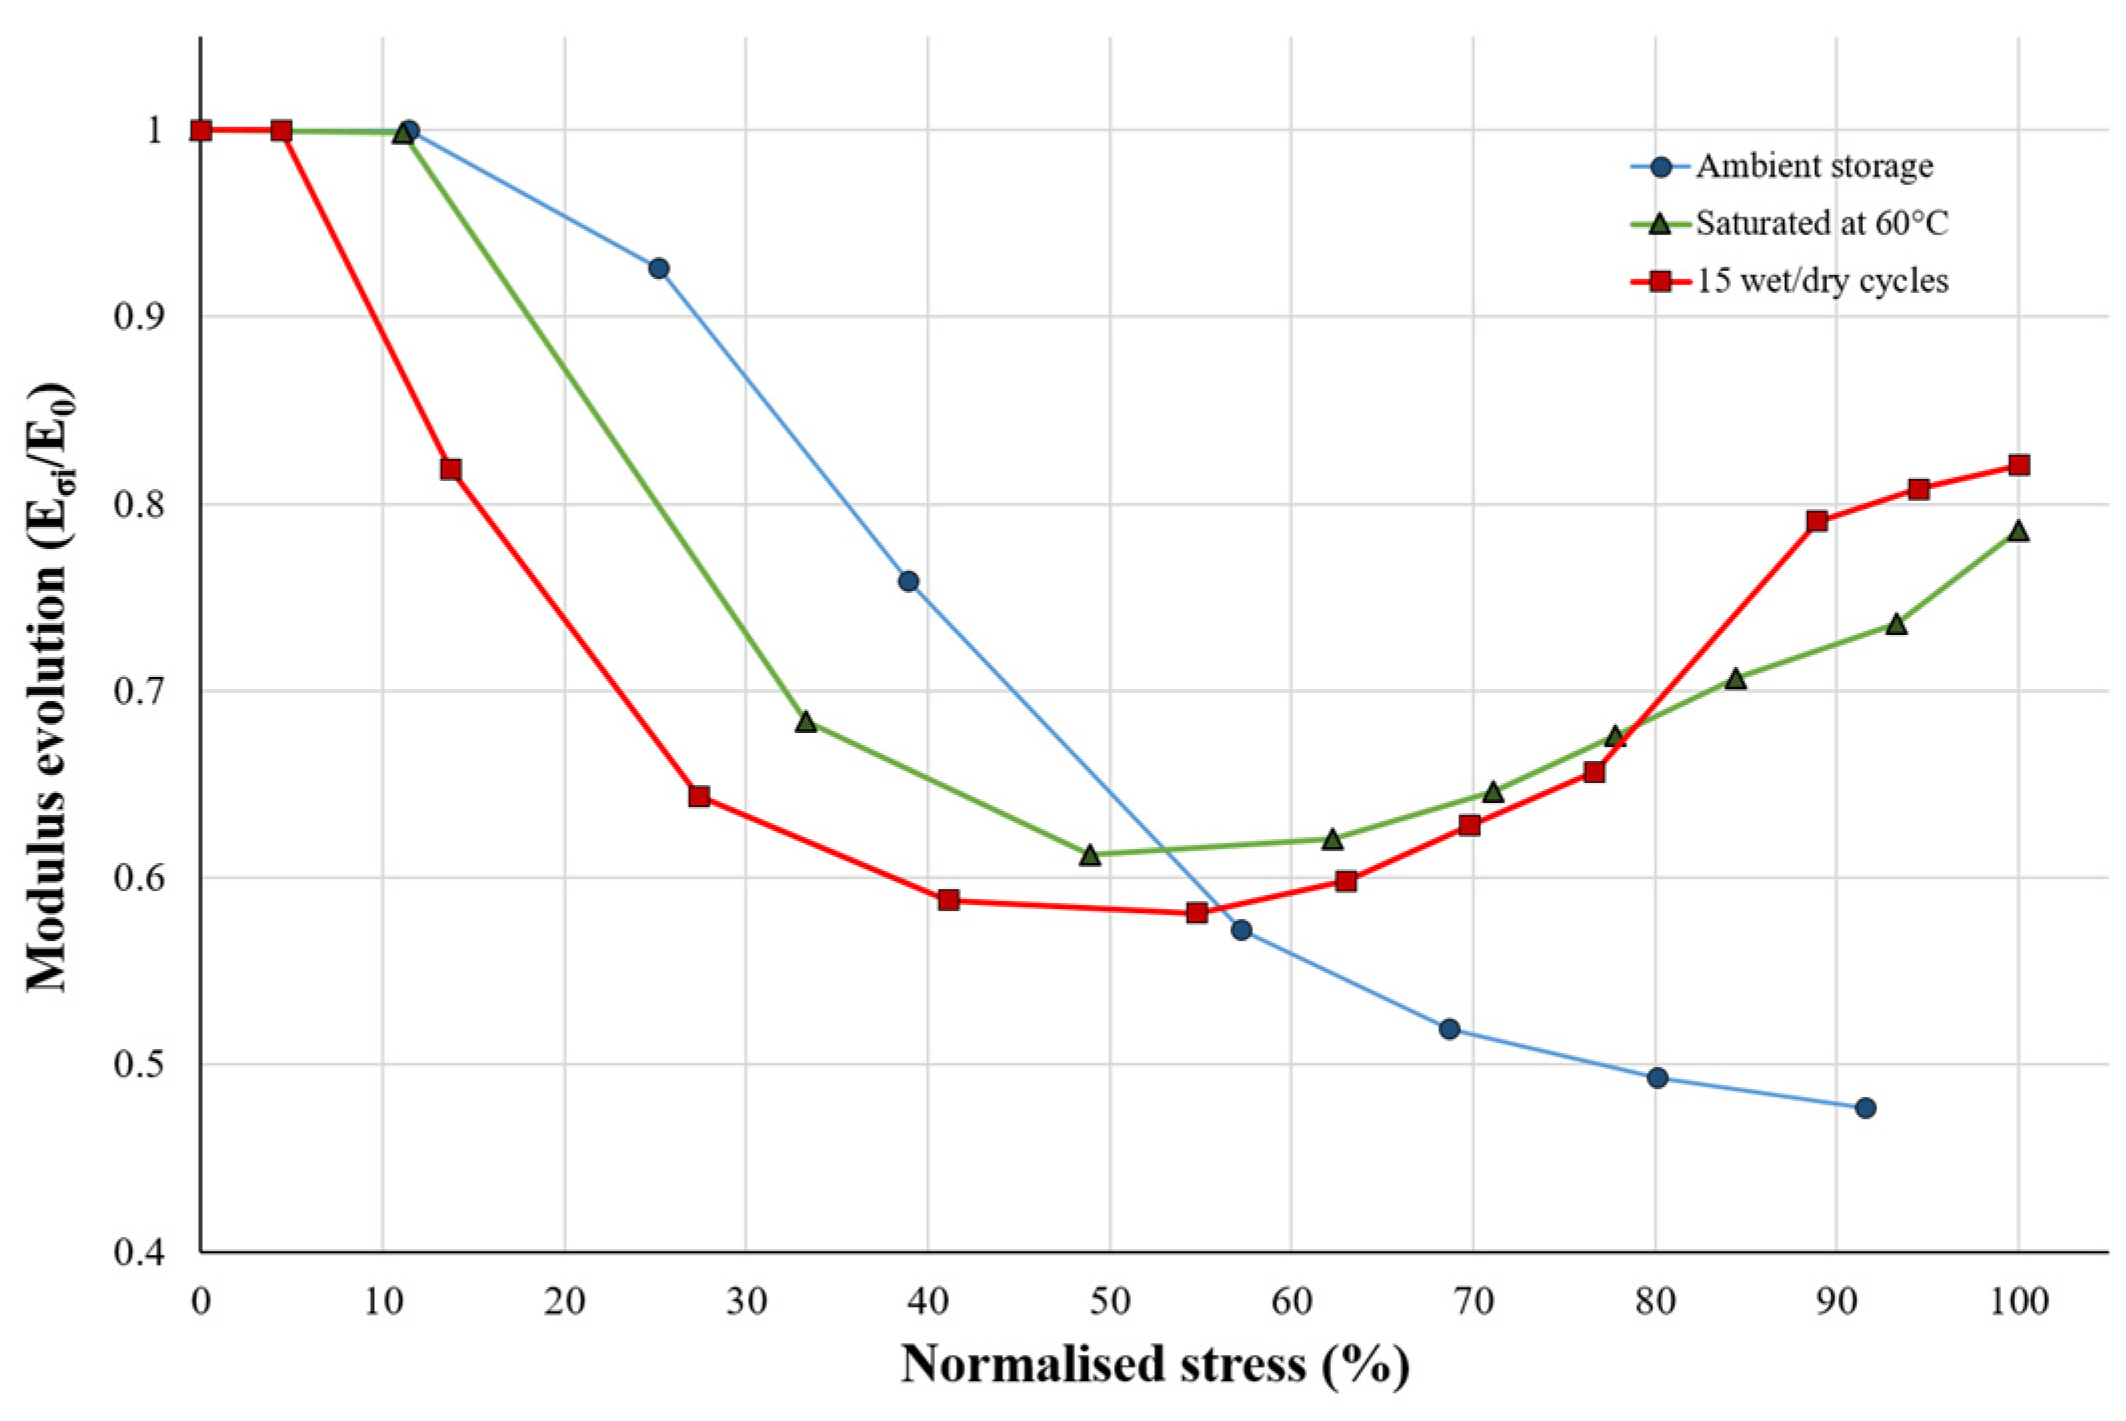
3.1. Modulus Evolution

Repeated progressive loading tests were carried out to characterize the mechanical properties of [0/90]7 hemp/Elium samples for the “Ambient storage”, “Saturated at 60 °C” and “15 wet/dry cycles” conditionings (Figure 4). The different stress levels applied during the ex-situ repeated progressive loading tests were chosen so that the evolution of the secant modulus is described from the elastic domain to the failure of the sample.
Figure 4 shows significant changes in the mechanical behavior of the studied biocomposite after water aging. The “Ambient storage” curve shows a classic stress-strain evolution with a change of slope after the linear elastic part. Both aging conditions show a drop in elastic properties. Moreover, a hardening of the stress-strain curves for “Saturated at 60 °C” and “15 wet/dry cycles” conditionings can be observed near the sample failure. The values of the initial Young’s modulus, the ultimate tensile stress, and the maximum strain for each conditioning are presented in Table 2. A very significant decrease of about 70% in the initial Young’s modulus value is observed when comparing the two aging conditions with the ambient storage. This significant decrease is in accordance with the literature [18,34] and confirms the high sensitivity of biocomposites to moisture. Concerning ultimate stresses, the value reached for the “Saturated at 60 °C” condition is almost similar to that obtained for the “Ambient storage” condition. However, after “15 wet/dry cycles”, the ultimate stress drops by 24% in comparison with the ambient storage. This result shows that the succession of wet/dry cycles degrades the mechanical performance of the material more severely than the water saturation at 60 °C. Whatever the aging condition, the maximum axial strain is multiplied by about two in comparison with the “Ambient storage”, due to the plasticization of the material and the multiplication of damage.
Figure 5 presents, for each configuration, the evolution of the k-factor representing the evolution of the secant modulus during the cyclic tensile loading, as defined in Equation (1). The two first points of each curve correspond to the initial Young’s modulus in the linear part of the stress-strain curve divided by itself (i.e., equal to 1). Figure 5 shows that for “Ambient storage”, as the test progresses, the modulus gradually decreases until the sample breaks. This trend of decreasing secant modulus is a well-known phenomenon observed in composite materials under ambient conditions, which can be explained by the progressive development of damage during tensile loading [18,34]. For “Saturated at 60 °C” and “15 wet/dry cycles” conditions, the modulus drop appears earlier than for “Ambient storage” and continues until about 50% of the ultimate stresses, leading to a greater drop than for the “Ambient storage” at the same stress level (Figure 5). This can be linked to the degradation of the material due to aging [21]. Then, for the two aging conditions, a sudden and unexpected increase in the modulus is observed. This is also visible in Figure 4, with the straightening of the hysteresis loops at the end of the test. This phenomenon appears at an applied stress of 30 MPa for the “Saturated at 60 °C” condition and 24 MPa for the “15 wet/dry cycles” one. This increase in modulus is totally counter-intuitive since the material should be more and more damaged as the applied load rises and therefore less and less rigid. How can it be explained that the modulus increases at the end of the tensile test? In order to understand the cause of this phenomenon, an in-situ tensile test under micro-CT was performed. As the modulus increase is more pronounced for the “15 wet/dry cycles” aging condition, this type of sample was chosen for the in-situ test.

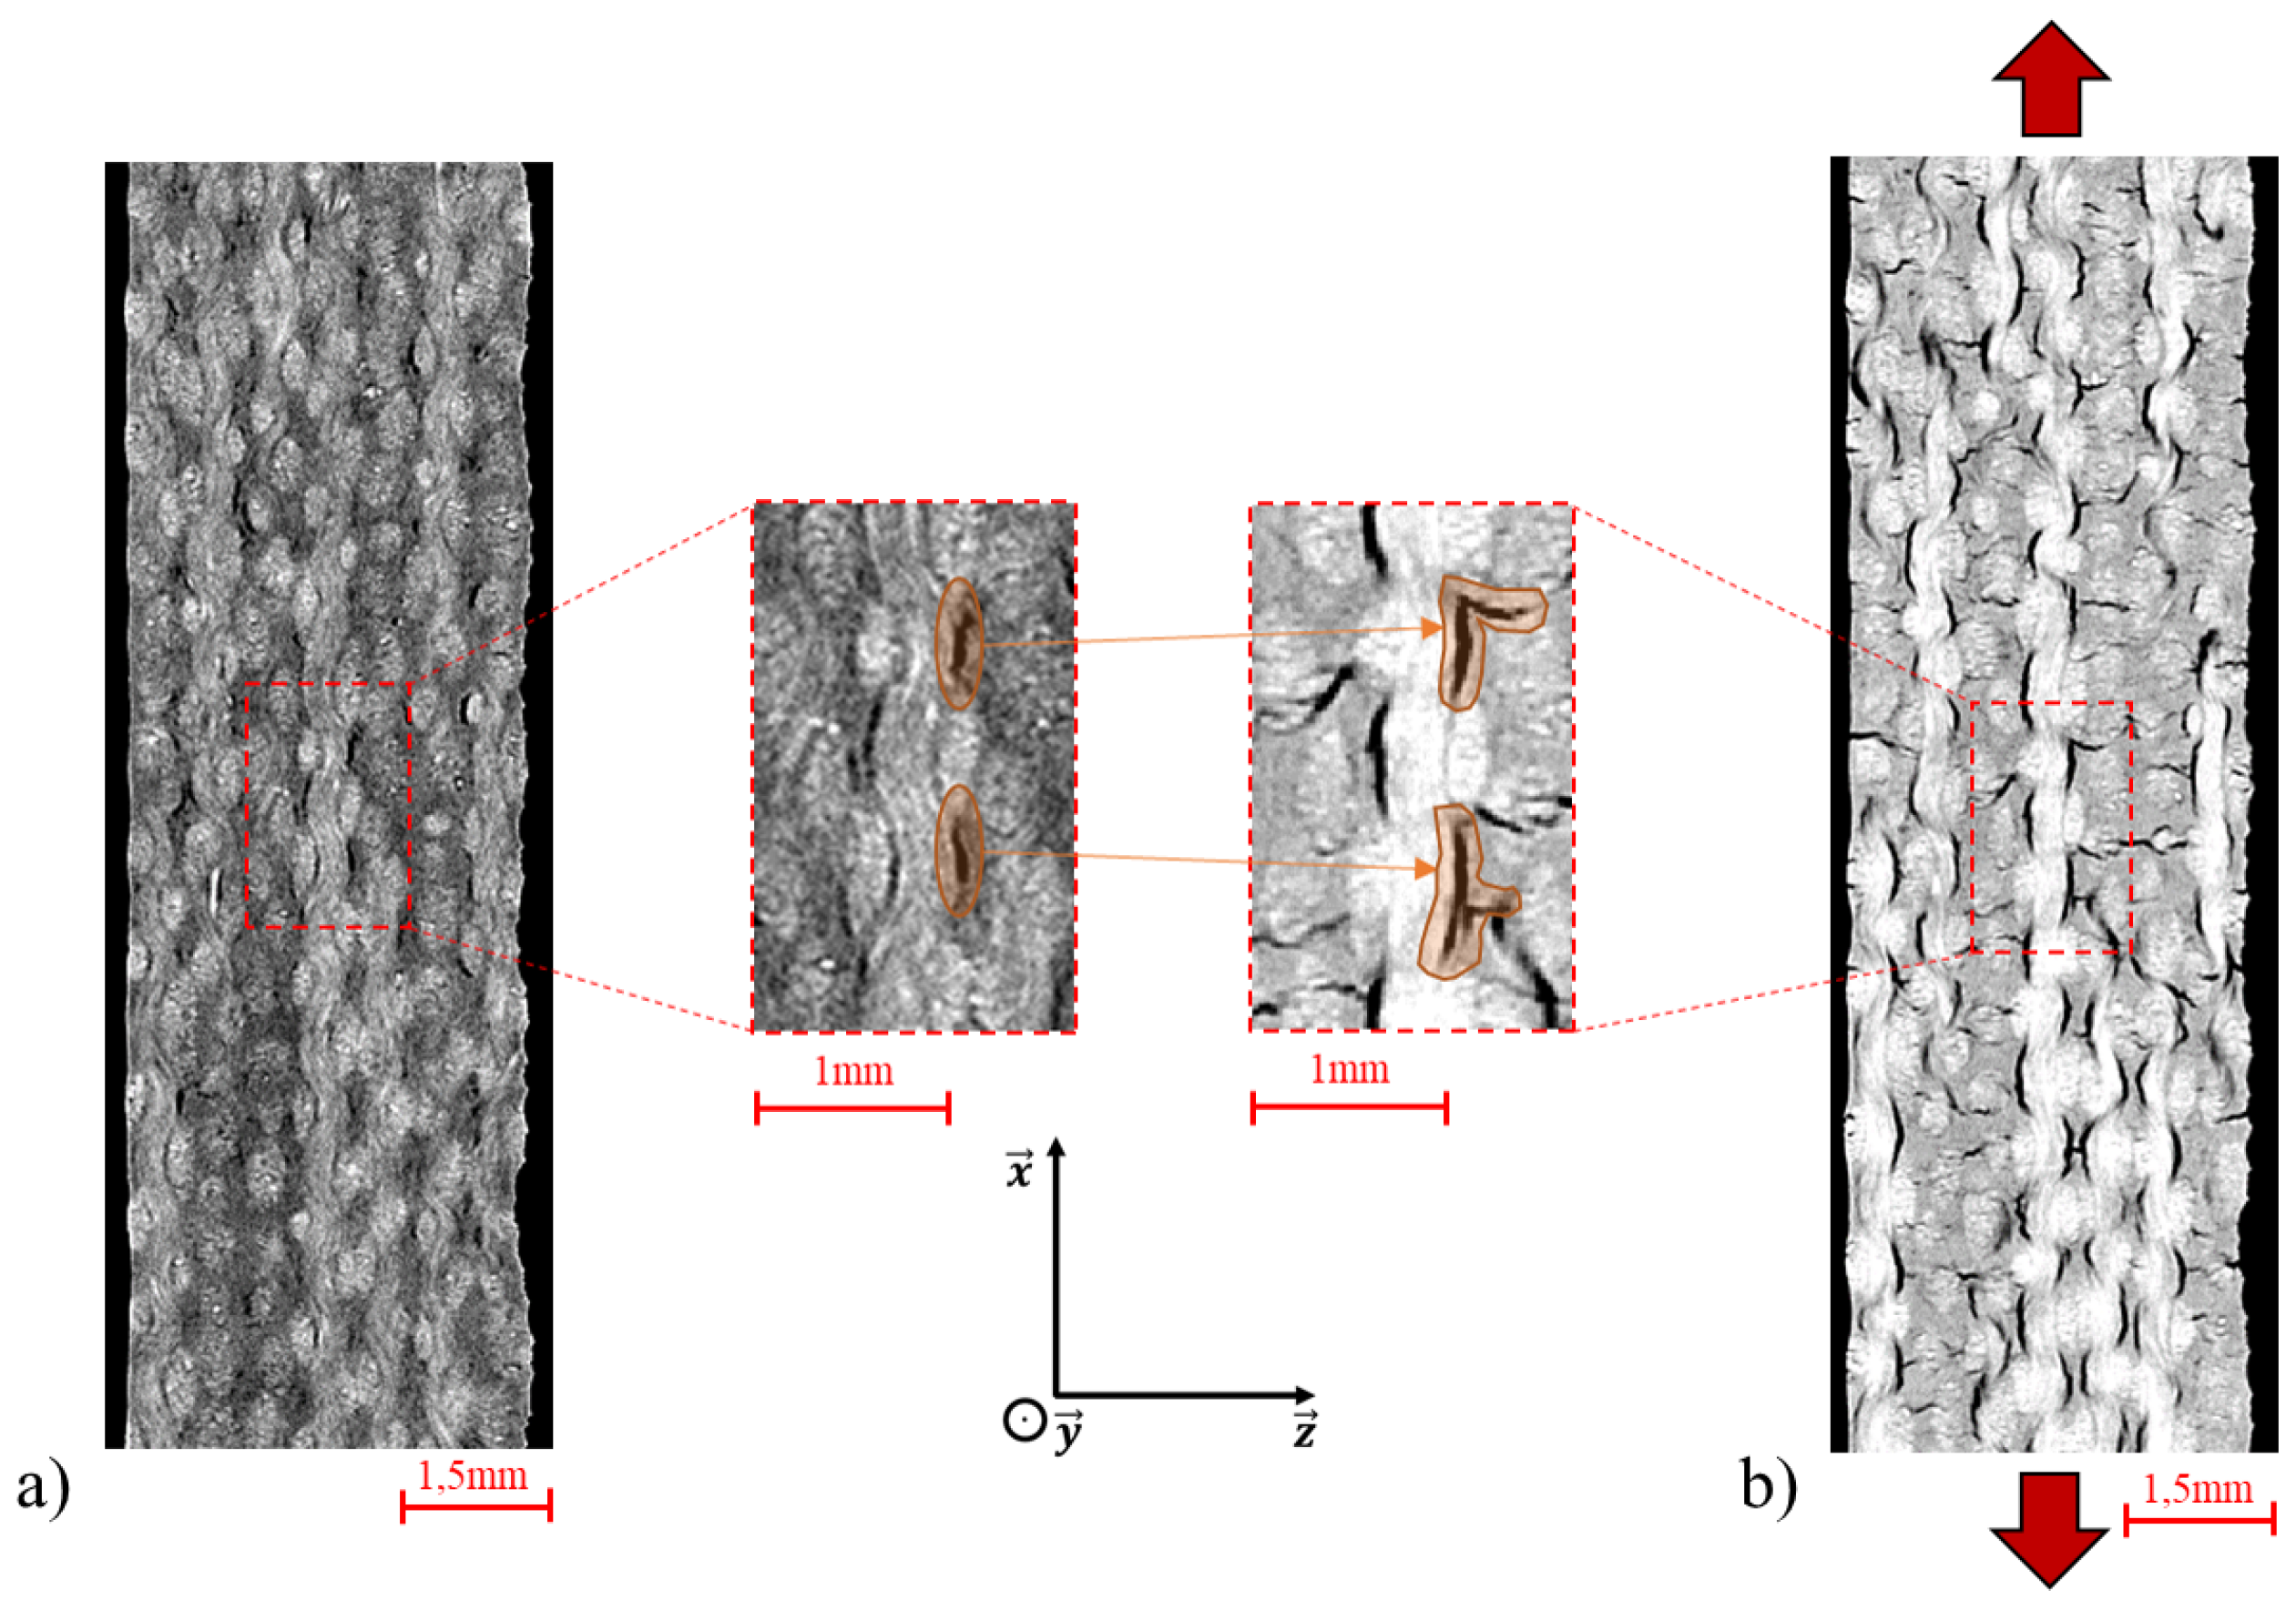
3.2. In-Situ Tensile Test

An in-situ tensile test under micro-CT was performed on a [0/90]7 hemp/Elium sample after an aging of “15 wet/dry cycles”. One loading-unloading cycle was performed under the micro-CT system. The maximum applied stress was chosen to be in the increasing part of the modulus evolution curve (Figure 5). Therefore, three micro-CT acquisitions were carried out during the in-situ tensile test, one at each following state:
  • before loading: the sample was mounted on the in-situ tensile testing machine and the displacement of the crosshead was held at zero,
  • loaded: the sample was loaded and when the applied stress reached 80% of the ultimate stress (37.6 MPa in accordance with Table 2), the displacement of the crosshead was blocked,
  • unloaded: the sample was unloaded and when the applied stress was close to zero, the displacement of the crosshead was blocked.
From one state to another, it was possible to recognize in micro-CT images some particular points in the material, such as porosity or a small defect. By measuring the distance between these specific points and comparing it with the initial value in the micro-CT images recorded before loading, it was possible to determine the strains along the length of the specimen, which corresponds to the loading direction (X-axis). For measuring strains along the Y-axis, the width variation was determined between the different states of the micro-CT images. The total and residual strain values obtained for the loaded and unloaded states respectively are given in Table 3 and compared with the measurements realized during the ex-situ test by using a bi-axial extensometer. It can be seen that, in the Y direction, strain values are quite similar between in-situ and ex-situ results, both being measured by the width variation. Residual strain values reach almost 50% of the total strain values. In the X direction, strains measured during the in-situ test are a little higher than the ones measured during the ex-situ test. This could be explained by the fact that, for the in-situ test, measurements were performed in the scanned zone of the sample, which is smaller than the extensometer gauge length. The strain values obtained for the ex-situ test are therefore more averaged values than the ones determined for the in-situ test.
After the last micro-CT scan, a monotonic tensile test was carried out on the [0/90]7 hemp/Elium sample used for the in-situ test. The maximum stress reached was equal to 47.7 MPa, which is almost the same value as the one obtained during ex-situ tests (47.1 MPa, see Table 2).

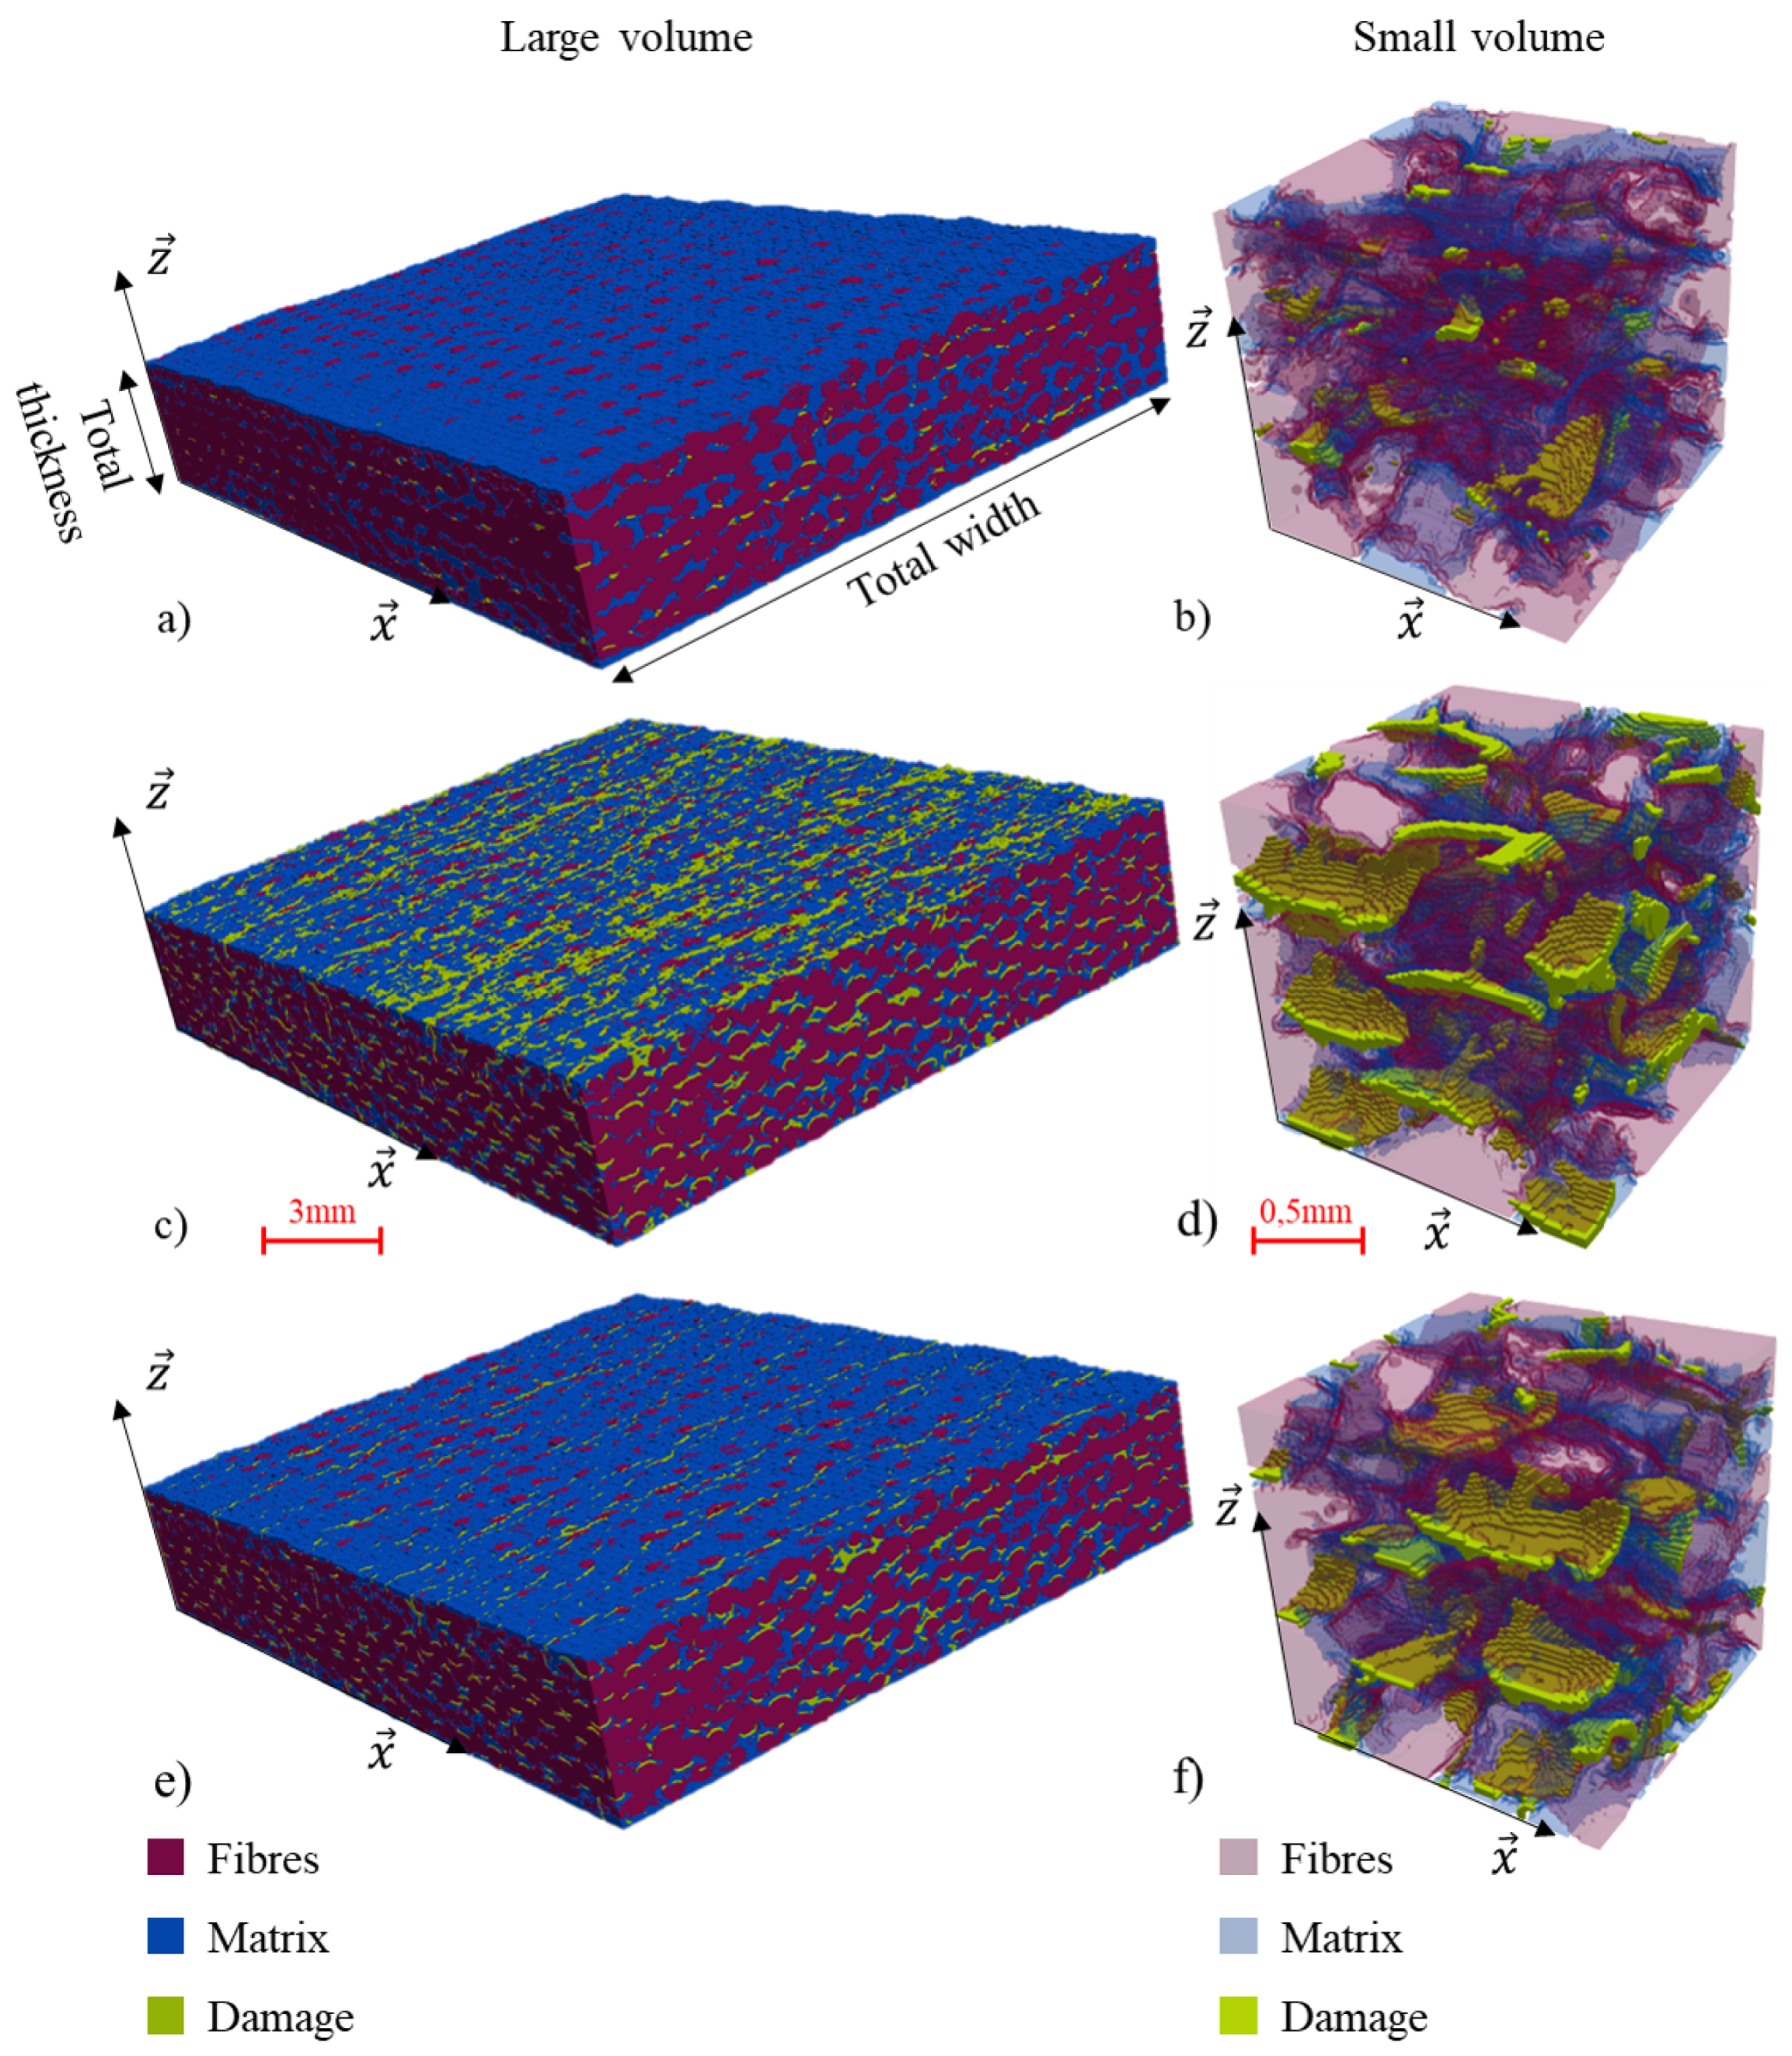
3.3. Damage Quantification

To analyze the damage mechanisms during the in-situ tensile test, the tomographic images recorded at each state were segmented, as described in Section 2.5. It allowed us to visualize and quantify the damage volume in the specimen. Figure 6 shows the results obtained after the 3D segmentations for the in-situ tested sample before loading (Figure 6a), loaded at 80% of the ultimate stress (Figure 6b), and unloaded (Figure 6c). Two different magnifications are presented. The large volume is constituted of more than 500 million voxels. It covers the total width and the total thickness of the tested specimen and allows for the study of the distribution of the damage in the sample. The small volume is constituted of about 1 million voxels and allows us to analyze the precise location of the damage in the composite. The X-axis represents the loading direction and Z-axis is along the thickness of the sample.
The first observation in Figure 6 is that there is very little porosity due to the composite manufacture but there is already some damage in the sample before the in-situ tensile test (Figure 6a). This is due to the 15 wet/dry cycles the sample was subjected to. This severe aging creates its own damage, without the need for mechanical loading, due to the difference in the swelling and shrinking coefficients of the hemp yarns and the polymer matrix [44]. The corresponding damage is therefore localized at the yarn/matrix interface (Figure 6b). Then, when the sample is loaded, this type of interfacial damage is more developed as shown inside the small volume (Figure 6d). Moreover, a second type of damage is also visible on the top and bottom surfaces of the sample (Figure 6c). This damage is distributed perpendicularly to the tensile axis and corresponds mostly with matrix cracks. It is clearly created by the applied mechanical loading. When the specimen is unloaded, the observed damage significantly decreases (Figure 6e,f) but remains higher than before loading (Figure 6a,b). Indeed, matrix cracks and debonding did not disappear but their size decreases because of the elastic recovery. They are therefore no longer visible with the micro-CT resolution used (15 microns). MatLab post-processing of the segmented images allowed to count the number of voxels corresponding to the damage. By dividing it by the total number of voxels, it was thus possible to determine the damage ratio for each state of the in-situ micro-CT test. Results are given in Table 4. The slight differences in the damage ratio between small and large volumes show that the small volume is quite representative of the whole specimen. If the initial damage ratio, due to the fifteen wet/dry cycles, is about 2%, it reaches almost 9% when the sample is loaded at 80% of the ultimate stress. After unloading, the damage ratio decreases to about 7%, which is consistent with the observations (Figure 6).

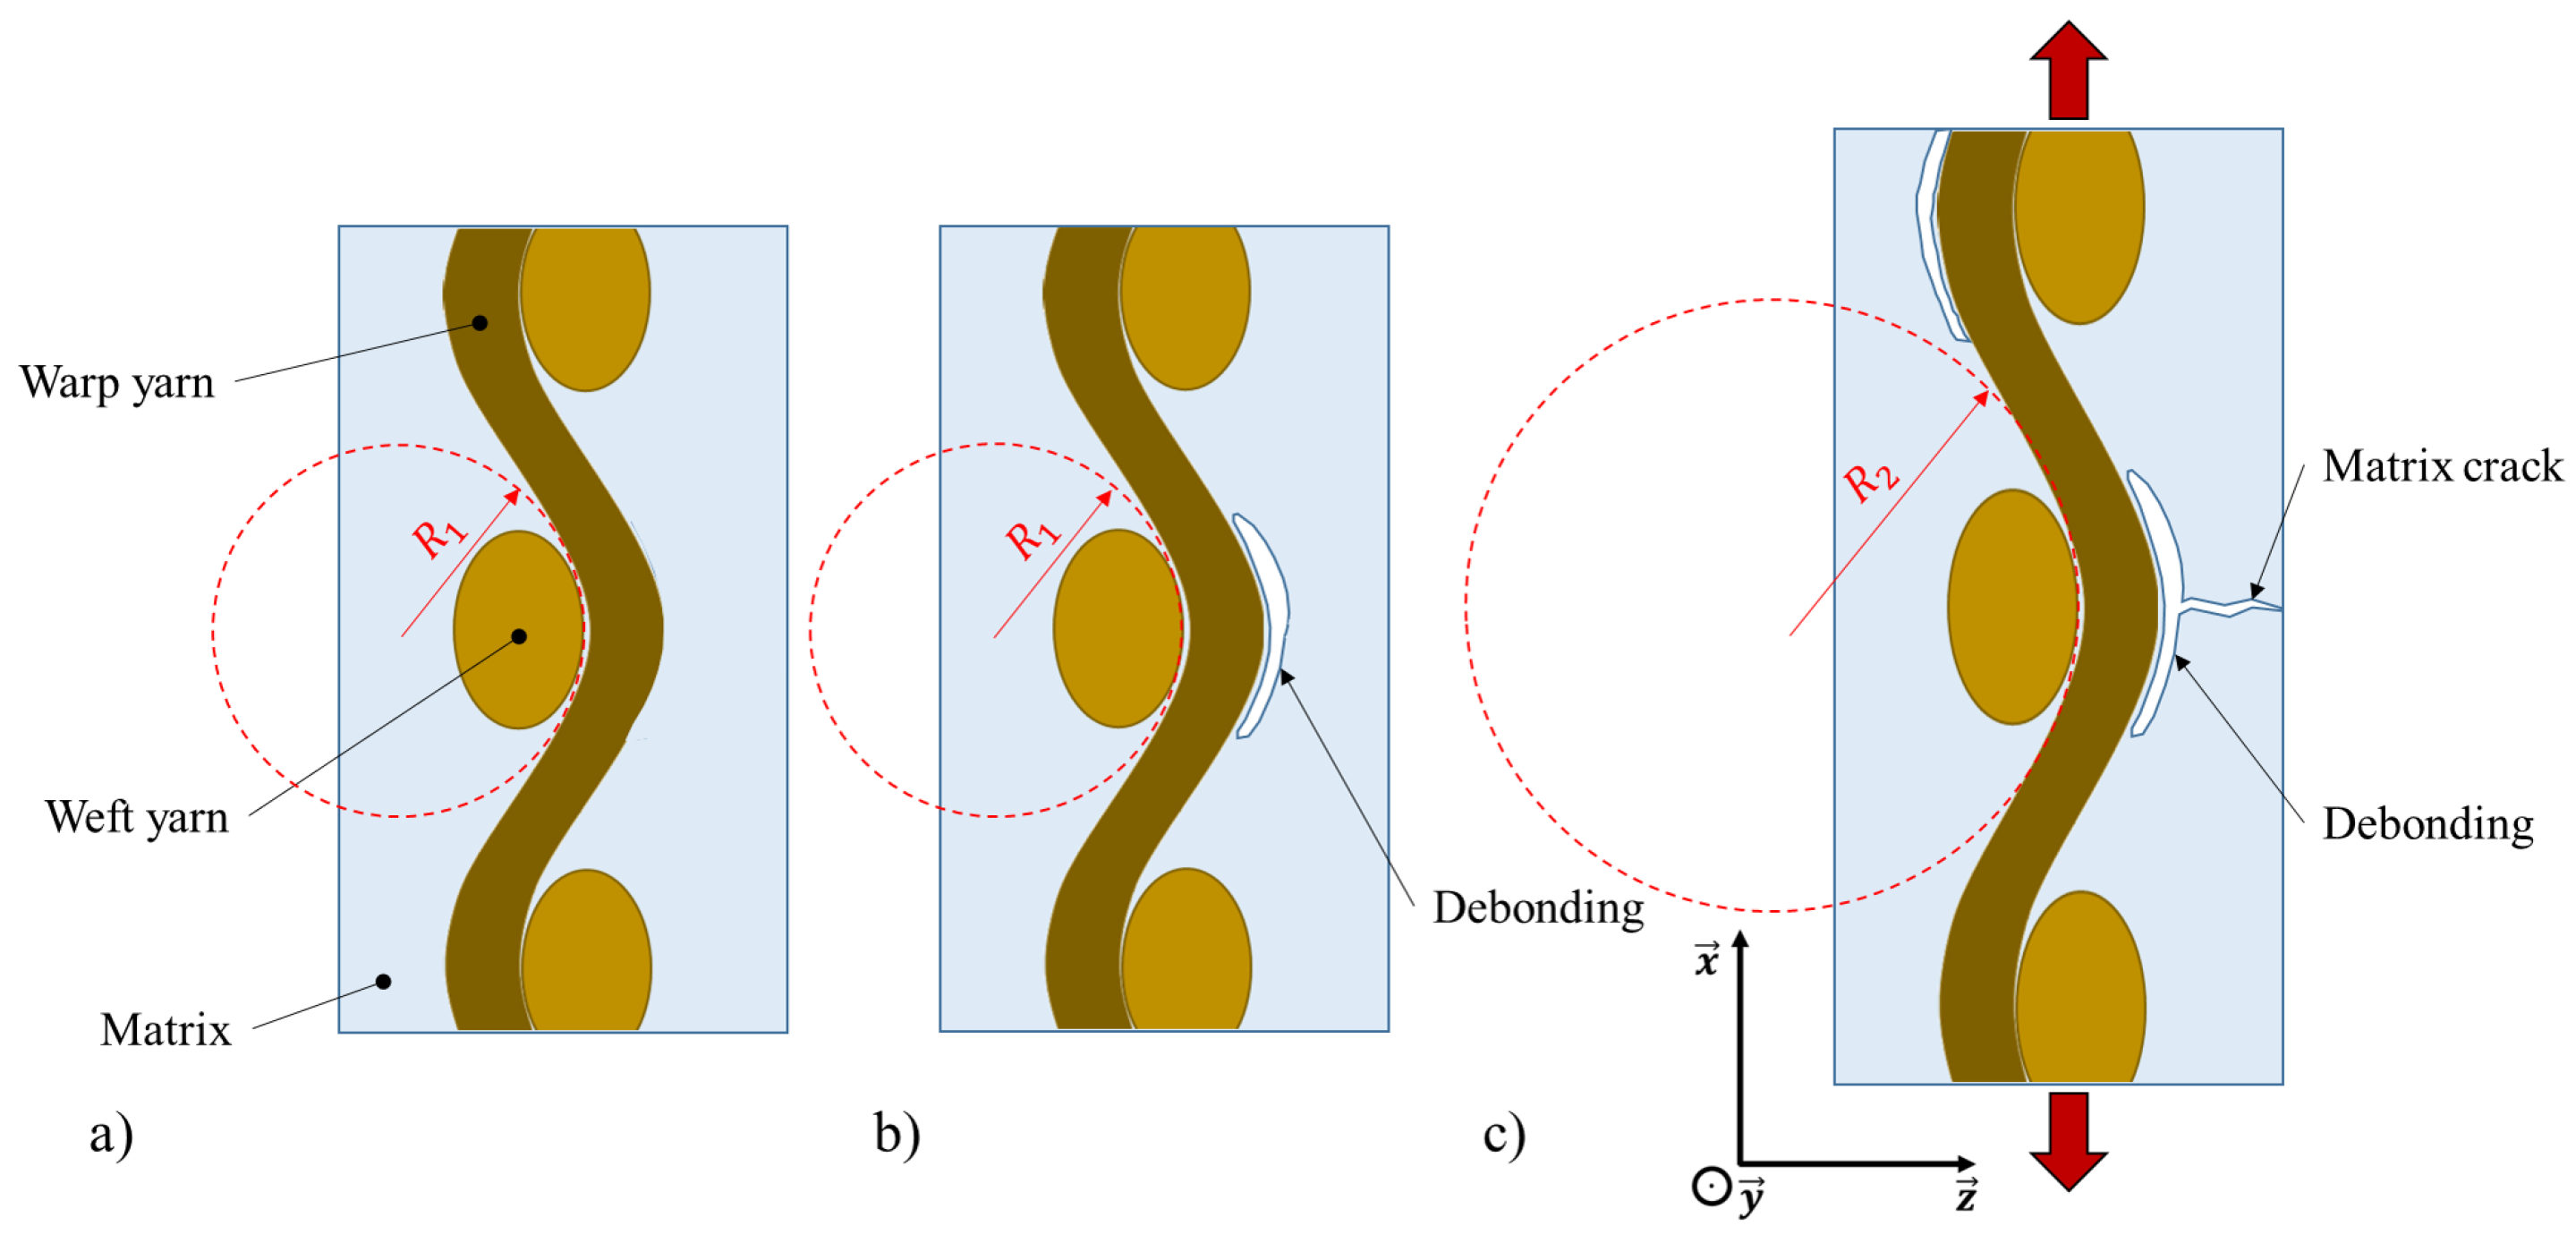
3.4. Evolution of the Curvature Radius of the Yarns

3.4.1. Micro-CT Analysis

Figure 7 shows examples of micro-CT images in the plane (X,Z), taken at mid-thickness of the in-situ tested sample. The first image has been obtained before loading (Figure 7a) and the second one under loading at 80% of the ultimate stress (Figure 7b). Both zooms in Figure 7 show the same area, before and under loading. As described in Section 3.3, some damage due to the fifteen wet/dry cycles is already visible before loading (Figure 7a). This damage is located around the yarns, at the yarn/matrix interface. When the sample is loaded in tension, some of the debonding extends and leads to matrix cracks. Moreover, some other interfacial damage also appears (Figure 7b).
Figure 7 also shows the pronounced waviness of the hemp yarns in the warp direction (along the X-axis). Several curvature radii of the yarns were measured on the micro-CT images, before loading (R1) and under loading (R2). It was observed that the curvature radius is multiplied by two between the unloaded and the loaded states; from about 0.5 mm to 1.0 mm. Figure 8 provides a schematic explanation of the damage and the curvature radius evolution in the tested composite. Before loading and aging, the curvature radius of the warp yarns is equal to R1 and there is no damage (Figure 8a). After the fifteen wet/dry cycles, some debonding at the yarn/matrix interfaces appear and the curvature radius is unchanged (Figure 8b). When the “15 wet/dry cycles” sample is subjected to a tensile loading up to 80% of the ultimate stress, the damage is far more developed, with both debonding and matrix cracks (Figure 8c). The significant development of damage explains the decrease in the modulus observed during ex-situ tensile tests up to about 50% of ultimate stress (Figure 5). Figure 8c also shows the significant increase in the curvature radius of the warp yarns (R2). On another scale, Placet et al. [45] demonstrated that the re-alignment of microfibrils leads to the increase in the modulus of a single hemp fiber during tensile testing. Can this explanation be transposed to the composite scale? Is the straightening of the warp yarns the cause of the increase in the modulus of the woven composite? In order to answer this question, a 3D numerical model of the tested composite was created.

3.4.2. Finite Element Calculations

The finite element model described in Section 2.6 was developed in order to evaluate the influence of the curvature radius of the warp yarns on Young’s modulus of a small volume of [0/90]7 hemp/Elium sample. Therefore, two different geometries were created: one with the curvature radius R1, measured before loading, and one with the curvature radius R2, measured under loading. Figure 9 presents a longitudinal section of the modeled volume for each of the geometries. It shows the transverse strain fields (εyy) calculated in the two cases for a displacement of 0.02 mm applied at one end of the sample.
It can be seen in Figure 9 that, apart from the warp yarns themselves, the maximum strain values are systematically localized at the yarn/matrix interfaces; just in the curvature zones (see black circles in Figure 9). These locations correspond exactly with the observations of damage in micro-CT images during the in-situ tensile test (Figure 7 and Figure 8). It explains the formation of debonding in these particular zones. To determine the Young’s modulus value of the modeled material, the reaction forces of all the nodes of the displaced surface were summed and divided by the associated area (Figure 10). The obtained values for both geometries are given in Table 5.
As expected, because of the assumptions made in the finite element modeling, the values of the calculated Young’s modulus are different from those obtained experimentally (Table 2). However, a very interesting point is that increasing the value of the curvature radius of the warp yarns allows the value of the Young’s modulus to increase by about 9%. It corresponds with the increase measured during ex-situ tensile test between 50% and 80% of the ultimate stress for the “15 wet/dry cycles” specimen (Figure 5). This allows to conclude that the straightening of warp yarns during tensile loading is indeed responsible for the increase in the modulus of woven plies biocomposites. It is thus possible to propose an explanation for the modulus evolution observed during ex-situ tensile testing (Figure 5). For the aged specimens, at the beginning of the tensile test, i.e., for an applied stress inferior to about 50% of the ultimate stress, the deformation level is not high enough to lead to the straightening of the yarns. Therefore, the damage development, as observed in micro-CT analysis (Figure 6), reduces the modulus value. When the applied stress is higher than 50% of the ultimate stress, the phenomenon of yarn straightening becomes more significant than the damage development, leading to an increase in the modulus (Figure 5).

4. Conclusions

In this study, the influence of different aging conditions on the evolution of the secant modulus was studied for a woven [0/90]7 hemp/Elium biocomposite. Repeated progressive loading tests instrumented with extensometers were carried out on the studied material for three different conditionings: “Ambient storage”, “Saturated at 60 °C” and “15 wet/dry cycles”. For the two water aging conditions, samples showed an increase in their secant modulus after reaching about 50% of their ultimate stress, while the ambient stored sample showed a continuous decrease in its modulus. Further investigations were then carried out to understand this phenomenon. A specific mechanical testing machine was used in order to perform an in-situ micro-CT tensile test on a [0/90]7 “15 wet/dry cycles” aged sample. Three tomographic acquisitions were realized on this sample: before loading, loaded at 80% of its ultimate stress, and unloaded. The reconstructed volumes were segmented thanks to an artificial intelligence-based algorithm and the damage ratio was quantified at each state. Results showed that the water absorption fatigue led to about 2% of damage. Then, at 80% of the ultimate stress, the damage ratio reached almost 9%, before decreasing to 7% when the sample was unloaded. Moreover, an in-depth analysis of micro-CT images showed that, for “15 wet/dry cycles” aged samples, besides the damage development with interfacial debonding and matrix cracks, the curvature radius of the warp yarns increased during the tensile loading. Finite element calculations were thus performed on a portion of the composite, taking into account the different radii of curvature measured. The results showed an increase in Young’s modulus when the warp yarns straightened. It demonstrates that the evolution of the modulus in a woven biocomposite subjected to tensile loading is a competition between the damage development, which leads to the modulus decrease, and the warp yarn straightening, corresponding to a modulus increase. This study, by combining experimental results from in-situ micro-CT testing with finite element modeling, allows a better understanding of the complex mechanical behavior of biocomposites after water aging.

Author Contributions

Investigation, writing—original draft preparation, visualization, Q.D.; writing—review and editing, supervision, F.T. and L.C.-A. All authors have read and agreed to the published version of the manuscript.

Funding

This work was partially funded by the French Government program “Investissements d’Avenir” (EQUIPEX GAP, reference ANR-11-EQPX-0018) and by the CPER FEDER project of Région Nouvelle Aquitaine. It pertains to the French Government program “Investissements d’Avenir” (EUR INTREE, reference ANR-18-EURE-0010).

Data Availability Statement

Not available.

Acknowledgments

The authors thank Damien Marchand, David Mellier, and Zakariya Kassou for their contribution to this work. The authors also thank Arkema for the manufacture of the Elium-based composites.

Conflicts of Interest

The authors declare no conflict of interest. The funders had no role in the design of the study; in the collection, analyses, or interpretation of data; in the writing of the manuscript; or in the decision to publish the results.

References

  1. Vijayan, R.; Krishnamoorthy, A. Review On Natural Fiber Reinforced Composites. Mater. Today Proc. 2019, 16, 897–906. [Google Scholar] [CrossRef]
  2. Li, M.; Pu, Y.; Thomas, V.M.; Yoo, C.G.; Ozcan, S.; Deng, Y.; Nelson, K.; Ragauskas, A.J. Recent advancements of plant-based natural fiber–reinforced composites and their applications. Compos. Part B Eng. 2020, 200, 108254. [Google Scholar] [CrossRef]
  3. Zwawi, M. A Review on Natural Fiber Bio-Composites, Surface Modifications and Applications. Molecules 2021, 26, 404. [Google Scholar] [CrossRef] [PubMed]
  4. Faruk, O.; Bledzki, A.K.; Fink, H.-P.; Sain, M. Biocomposites reinforced with natural fibers: 2000–2010. Prog. Polym. Sci. 2012, 37, 1552–1596. [Google Scholar] [CrossRef]
  5. Koronis, G.; Silva, A.; Fontul, M. Green composites: A review of adequate materials for automotive applications. Compos. Part B Eng. 2013, 44, 120–127. [Google Scholar] [CrossRef]
  6. La Mantia, F.P.; Morreale, M. Green composites: A brief review. Compos. Part A Appl. Sci. Manuf. 2011, 42, 579–588. [Google Scholar] [CrossRef]
  7. Madsen, B.; Hoffmeyer, P.; Thomsen, A.B.; Lilholt, H. Hemp yarn reinforced composites–I. Yarn characteristics. Compos. Part A Appl. Sci. Manuf. 2007, 38, 2194–2203. [Google Scholar] [CrossRef]
  8. Manaia, J.P.; Manaia, A.T.; Rodriges, L. Industrial Hemp Fibers: An Overview. Fibers 2019, 7, 106. [Google Scholar] [CrossRef]
  9. Horne, M.R.L. Bast fibres: Hemp cultivation and production. In Handbook of Natural Fibres; Elsevier: Amsterdam, The Netherlands, 2012; pp. 114–145. [Google Scholar] [CrossRef]
  10. Lotfi, A.; Li, H.; Dao, D.V.; Prusty, G. Natural fiber–reinforced composites: A review on material, manufacturing, and machinability. J. Thermoplast. Compos. Mater. 2021, 34, 238–284. [Google Scholar] [CrossRef]
  11. Bensadoun, F.; Vallons, K.A.M.; Lessard, L.B.; Verpoest, I.; Van Vuure, A.W. Fatigue behaviour assessment of flax–epoxy composites. Compos. Part A Appl. Sci. Manuf. 2016, 82, 253–266. [Google Scholar] [CrossRef]
  12. Borrello, M.; Mele, M.; Campana, G.; Secchi, M. Manufacturing and characterization of hemp-reinforced epoxy composites. Polym. Compos. 2020, 41, 2316–2329. [Google Scholar] [CrossRef]
  13. de Vasconcellos, D.S.; Touchard, F.; Chocinski-Arnault, L. Tension–tension fatigue behaviour of woven hemp fibre reinforced epoxy composite: A multi-instrumented damage analysis. Int. J. Fatigue 2014, 59, 159–169. [Google Scholar] [CrossRef]
  14. El Sawi, I.; Fawaz, Z.; Zitoune, R.; Bougherara, H. An investigation of the damage mechanisms and fatigue life diagrams of flax fiber-reinforced polymer laminates. J. Mater. Sci. 2014, 49, 2338–2346. [Google Scholar] [CrossRef]
  15. Krishnasamy, P.; Rajamurugan, G.; Aravindraj, S.; Sudhagar, P.E. Vibration and Wear Characteristics of Aloevera/Flax/Hemp Woven Fiber Epoxy Composite Reinforced with Wire Mesh and BaSO4. J. Nat. Fibers 2020, 19, 2885–2901. [Google Scholar] [CrossRef]
  16. Neves, A.C.C.; Rohen, L.A.; Mantovani, D.P.; Carvalho, J.P.R.G.; Vieira, C.M.F.; Lopes, F.P.D.; Simonassi, N.T.; da Luz, F.S.; Monteiro, S.N. Comparative mechanical properties between biocomposites of Epoxy and polyester matrices reinforced by hemp fiber. J. Mater. Res. Technol. 2020, 9, 1296–1304. [Google Scholar] [CrossRef]
  17. Newman, R.H. Auto-accelerative water damage in an epoxy composite reinforced with plain-weave flax fabric. Compos. Part A Appl. Sci. Manuf. 2009, 40, 1615–1620. [Google Scholar] [CrossRef]
  18. Shah, D.U. Damage in biocomposites: Stiffness evolution of aligned plant fibre composites during monotonic and cyclic fatigue loading. Compos. Part A Appl. Sci. Manuf. 2016, 83, 160–168. [Google Scholar] [CrossRef]
  19. Allagui, S.; El Mahi, A.; Rebiere, J.-L.; Beyaoui, M.; Bouguecha, A.; Haddar, M. Effect of Recycling Cycles on the Mechanical and Damping Properties of Flax Fibre Reinforced Elium Composite: Experimental and Numerical Studies. J. Renew. Mater. 2021, 9, 695–721. [Google Scholar] [CrossRef]
  20. Khalili, P.; Blinzler, B.; Kádár, R.; Blomqvist, P.; Sandinge, A.; Bisschop, R.; Liu, X. Ramie fabric Elium® composites with flame retardant coating: Flammability, smoke, viscoelastic and mechanical properties. Compos. Part A Appl. Sci. Manuf. 2020, 137, 105986. [Google Scholar] [CrossRef]
  21. Perrier, A.; Touchard, F.; Chocinski-Arnault, L.; Mellier, D. Quantitative analysis by micro-CT of damage during tensile test in a woven hemp/epoxy composite after water ageing. Compos. Part A Appl. Sci. Manuf. 2017, 102, 18–27. [Google Scholar] [CrossRef]
  22. Kesentini, Z.; El Mahi, A.; Rebiere, J.L.; El Guerjouma, R.; Beyaoui, M.; Haddar, M. Static and Fatigue Tensile Behavior and Damage Mechanisms Analysis in Aged Flax Fiber/PLA Composite. Int. J. Appl. Mech. 2022, 14, 2250080. [Google Scholar] [CrossRef]
  23. Al-Maharma, A.; Al-Huniti, N. Critical Review of the Parameters Affecting the Effectiveness of Moisture Absorption Treatments Used for Natural Composites. J. Compos. Sci. 2019, 3, 27. [Google Scholar] [CrossRef]
  24. Chilali, A.; Zouari, W.; Assarar, M.; Kebir, H.; Ayad, R. Effect of water ageing on the load-unload cyclic behaviour of flax fibre-reinforced thermoplastic and thermosetting composites. Compos. Struct. 2018, 183, 309–319. [Google Scholar] [CrossRef]
  25. Maslinda, A.B.; Abdul Majid, M.S.; Ridzuan, M.J.M.; Afendi, M.; Gibson, A.G. Effect of water absorption on the mechanical properties of hybrid interwoven cellulosic-cellulosic fibre reinforced epoxy composites. Compos. Struct. 2017, 167, 227–237. [Google Scholar] [CrossRef]
  26. Muñoz, E.; García-Manrique, J.A. Water Absorption Behaviour and Its Effect on the Mechanical Properties of Flax Fibre Reinforced Bioepoxy Composites. Int. J. Polym. Sci. 2015, 2015, 390275. [Google Scholar] [CrossRef]
  27. Sala, B.; Gabrion, X.; Trivaudey, F.; Guicheret-Retel, V.; Placet, V. Influence of the stress level and hygrothermal conditions on the creep/recovery behaviour of high-grade flax and hemp fibre reinforced GreenPoxy matrix composites. Compos. Part A Appl. Sci. Manuf. 2021, 141, 106204. [Google Scholar] [CrossRef]
  28. Drouhet, Q.; Touchard, F.; Chocinski-Arnault, L. Influence of Hygrothermal Aging on Mechanical Properties and Damage Mechanisms of Hemp-Reinforced Biocomposites. J. Nat. Fibers 2022, 19, 15404–15421. [Google Scholar] [CrossRef]
  29. Malloum, A.; Mahi, A.E.; Idriss, M. The effects of water ageing on the tensile static and fatigue behaviors of greenpoxy–flax fiber composites. J. Compos. Mater. 2019, 53, 2927–2939. [Google Scholar] [CrossRef]
  30. Mak, K.; Fam, A. The effect of wet-dry cycles on tensile properties of unidirectional flax fiber reinforced polymers. Compos. Part B Eng. 2020, 183, 107645. [Google Scholar] [CrossRef]
  31. Cadu, T.; Van Schoors, L.; Sicot, O.; Moscardelli, S.; Divet, L.; Fontaine, S. Cyclic hygrothermal ageing of flax fibers’ bundles and unidirectional flax/epoxy composite. Are bio-based reinforced composites so sensitive? Ind. Crops Prod. 2019, 141, 111730. [Google Scholar] [CrossRef]
  32. Ludovic, F. Etude du Vieillissement Hygrothermique des Composites Renforcés de Fibres Naturelles: Approche Experimentale et Modélisation. Ph.D. Thesis, Université de Lorraine, Nancy, France, 2018. [Google Scholar]
  33. Lemaitre, J. A Continuous Damage Mechanics Model for Ductile Fracture. J. Eng. Mater. Technol. 1985, 107, 83–89. [Google Scholar] [CrossRef]
  34. Richard, F.; Poilâne, C.; Yang, H.; Gehring, F.; Renner, E. A viscoelastoplastic stiffening model for plant fibre unidirectional reinforced composite behaviour under monotonic and cyclic tensile loading. Compos. Sci. Technol. 2018, 167, 396–403. [Google Scholar] [CrossRef]
  35. Madra, A.; Adrien, J.; Breitkopf, P.; Maire, E.; Trochu, F. A clustering method for analysis of morphology of short natural fibers in composites based on X-ray microtomography. Compos. Part A Appl. Sci. Manuf. 2017, 102, 184–195. [Google Scholar] [CrossRef]
  36. Xiong, X.; Shen, S.Z.; Hua, L.; Liu, J.Z.; Li, X.; Wan, X.; Miao, M. Finite element models of natural fibers and their composites: A review. J. Reinf. Plast. Compos. 2018, 37, 617–635. [Google Scholar] [CrossRef]
  37. Daoud, H.; Rebière, J.-L.; Makni, A.; Taktak, M.; El Mahi, A.; Haddar, M. Numerical and Experimental Characterization of the Dynamic Properties of Flax Fiber Reinforced Composites. Int. J. Appl. Mech. 2016, 8, 1650068. [Google Scholar] [CrossRef]
  38. Xu, J.; Lomov, S.V.; Verpoest, I.; Daggumati, S.; VAN Paepegem, W.; Degrieck, J.; Olave, M. A progressive damage model of textile composites on meso-scale using finite element method: Static damage analysis. J. Compos. Mater. 2014, 48, 3091–3109. [Google Scholar] [CrossRef]
  39. Cheung, H.; Ho, M.; Lau, K.; Cardona, F.; Hui, D. Natural fibre-reinforced composites for bioengineering and environmental engineering applications. Compos. Part B Eng. 2009, 40, 655–663. [Google Scholar] [CrossRef]
  40. Perrier, A.; Ecault, R.; Touchard, F.; Urriza, M.V.; Baillargeat, J.; Chocinski-Arnault, L.; Boustie, M. Towards the development of laser shock test for mechanical characterisation of fibre/matrix interface in eco-composites. Polym. Test. 2015, 44, 125–134. [Google Scholar] [CrossRef]
  41. Kazemi, M.E.; Shanmugam, L.; Lu, D.; Wang, X.; Wang, B.; Yang, J. Mechanical properties and failure modes of hybrid fiber reinforced polymer composites with a novel liquid thermoplastic resin, Elium®. Compos. Part A Appl. Sci. Manuf. 2019, 125, 105523. [Google Scholar] [CrossRef]
  42. Orenes Balaciart, S.; Pannier, Y.; Gigliotti, M.; Mellier, D.; Guigon, C. Effect of Temperature on Damage Onset in Three-Dimensional (3D) Woven Organic Matrix Composites for Aero-Engines Application. In Proceedings of the European Conference on Composites Materials (ECCM20), Lausanne, Suisse, 26–30 June 2022. [Google Scholar]
  43. ImageJ Docs. Trainable Weka Segmentation. Trainable Weka Segmentation n.d. Available online: https://imagej.net/plugins/tws/ (accessed on 24 May 2022).
  44. Perrier, A.; Touchard, F.; Chocinski-Arnault, L.; Mellier, D. Influence of water on damage and mechanical behaviour of single hemp yarn composites. Polym. Test. 2017, 57, 17–25. [Google Scholar] [CrossRef]
  45. Placet, V.; Cissé, O.; Lamine Boubakar, M. Nonlinear tensile behaviour of elementary hemp fibres. Part I: Investigation of the possible origins using repeated progressive loading with in situ microscopic observations. Compos. Part A Appl. Sci. Manuf. 2014, 56, 319–327. [Google Scholar] [CrossRef]
Figure 1. Stress-strain schematic curve (solid blue line) of a repeated progressive tensile loading test and method of determination of the secant moduli Eσi, identified by the dotted lines.
Micro 03 00033 g001
Figure 2. (a) Picture of the tensile device for in-situ micro-CT acquisitions. (b) Scheme of the MUTTOM tensile testing machine. (c) The [0/90]7 hemp/Elium sample gripped in the tensile testing machine jaws.
Micro 03 00033 g002
Figure 3. Principle of the assembly of the numerical model: (a) weft yarns, (b) warp yarns, (c) polymer matrix, (d) portion of [0/90] hemp/Elium composite with boundary conditions.
Micro 03 00033 g003
Figure 4. Tensile stress-strain curves of [0/90]7 hemp/Elium samples for “Ambient storage”, “Saturated at 60 °C” and “15 wet/dry cycles” conditionings.
Micro 03 00033 g004
Figure 5. Evolutions of the tensile modulus versus the applied stress measured on [0/90]7 hemp/Elium samples for the three conditionings.
Micro 03 00033 g005
Figure 6. 3D segmentation for large and small volumes of the in-situ micro-CT tested hemp/Elium sample (a,b) before loading, (c,d) loaded at 37.6 MPa and (e,f) unloaded.
Micro 03 00033 g006
Figure 7. Micro-CT images and zooms of the aged [0/90]7 hemp/Elium sample tested in situ (a) before loading and (b) loaded at 36.7 MPa.
Micro 03 00033 g007
Figure 8. Schemes of the evolution of damage and of the curvature radius of warp yarns (a) before loading and aging, (b) after “15 wet/dry cycles” and before loading, (c) after “15 wet/dry cycles” and under loading.
Micro 03 00033 g008
Figure 9. Transverse strains (εyy) in a portion of the [0/90] hemp/Elium sample calculated by finite element modeling for (a) initial curvature radius (R1) and (b) curvature radius measured under loading (R2).
Micro 03 00033 g009
Figure 10. Nodes considered for calculating the Young’s modulus value of the simulated material using Reaction Force in the tensile loading direction.
Micro 03 00033 g010
Table 1. Properties of raw materials.
MaterialDensity (g·cm−3)Young’s Modulus (MPa)Ultimate Stress (MPa)References
LongitudinalTransverse
Hemp yarn1.4823,0001264601[39,40]
Elium 1881.01330076[41]
Table 2. Initial Young’s modulus, ultimate stress, and maximum strain values of [0/90]7 hemp/Elium samples for “Ambient storage”, “Saturated at 60 °C” and “15 wet/dry cycles” conditionings.
Mechanical PropertiesAmbient StorageSaturated at 60 °C15 Wet/Dry Cycles
Initial Young’s modulus (MPa)7323 ± 3682428 ± 1252392 ± 179
Ultimate stress (MPa)61.8 ± 5.056.7 ± 2.847.1 ± 2.4
Maximum strain (%)3.4 ± 1.07.6 ± 0.96.5 ± 0.4
Table 3. Total and residual strains along the X-axis and Y-axis measured during the in-situ and ex-situ tensile tests for an applied stress of 80% of the ultimate stress for [0/90]7 hemp/Elium after aging of “15 wet/dry cycles”.
X-AxisY-Axis
In-SituEx-SituIn-SituEx-Situ
Loaded state: total strain (%)5.38 ± 0.074.98 ± 0.1−1.10 ± 0.13−1.11 ± 0.10
Unloaded state: residual strain (%)3.70 ± 0.212.40 ± 0.25−0.51 ± 0.05−0.50 ± 0.05
Table 4. Damage quantification for large and small volumes determined from in-situ micro-CT tested samples.
Damage Quantification (%)
Large Volume
(1620 mm3 = 5 × 10⁸ Voxels)
Small Volume
(3.38 mm3 = 1 × 10⁶ Voxels)
Before loading2.02.4
Loaded at 37.6 MPa8.98.5
Unloaded6.06.7
Table 5. Comparison of Young’s modulus values calculated by finite element modeling in function of the curvature radius of the warp yarns.
Model Geometry with R1Model Geometry with R2Deviation (%)
Curvature radius (mm)0.51.0100
Young’s modulus (MPa)513755778.6
Disclaimer/Publisher’s Note: The statements, opinions and data contained in all publications are solely those of the individual author(s) and contributor(s) and not of MDPI and/or the editor(s). MDPI and/or the editor(s) disclaim responsibility for any injury to people or property resulting from any ideas, methods, instructions or products referred to in the content.

