Article

Effect of Functionalized CdSSe Quantum Dots in the CYP450 Activity of HEPG2 Cells

by
Luis Alamo-Nole
* and
Jury Cruz-Hernandez
Natural Sciences Department, Pontifical Catholic University of Puerto Rico, Ponce, PR 00717, USA
*
Author to whom correspondence should be addressed.
Micro 2023, 3(2), 391-403; https://doi.org/10.3390/micro3020027
Submission received: 17 February 2023 / Revised: 6 March 2023 / Accepted: 15 March 2023 / Published: 3 April 2023

Abstract

:
Quantum dots (QDs) have different properties: high electron density, magnetic moment, phosphorescence, photoluminescence (fluorescence), and strong optical absorption. The layer or ligands on the QDs surface has a vital role because they allow the stabilization and practical uses on different matrixes. Ligand exchange is a commonly carried out methodology to incorporate functional groups that alter the solubility, introduce electron transfer partners, integrate biological receptors, or improve the properties of the QDs surface. CdSSe QDs were synthesized using a microwave system using thioglycolic acid (TGA) as a sulfur source and cover agent. The TGA ligand was interchanged with cysteine (Cys), glutamic acid (GA), glutathione (GTO), glutaraldehyde (GLT), and lysine (Lys). The viability and response of the CYP1A1, CYP1A2, and CYP3A4 isoenzymes were directly measured in HEP-G2 cells after exposure to CdSSe-TGA, CdSSe-Cys, CdSSe-GA, CdSSe-GTO, CdSSe-GLT, and CdSSe-Lys. CdSSe and CdSSe-GTO (10 mg/L) decrease viability by around 65%. The response of the cytochrome isoenzymes is based on the organic ligand on the surface of the CdSSe QDs. Changes in CYP 1A1 could be related to carcinogenic xenobiotics. Fluorescence microscopy shows CdSSe QDs on and inside HEPG2 cells. The results confirm that apoptosis and necrosis are the principal mechanisms of decreased viability.

1. Introduction

Quantum dots (QDs) are nanoparticles with 1–10 nm diameters. Depending on their composition, properties include high electron density, magnetic moment, phosphorescence, photoluminescence (fluorescence), and strong optical absorption. QDs have excellent optical properties, such as narrow emission and wide excitation bands in the visible spectrum, and exhibit quantum confinement of excitons [1]. They have excellent resistance to chemical degradation, high quantum fluorescence yield, and photodegradation. The optical properties can lead to various applications, from solar cells to LED lights. Quantum dots have been used in biotechnology, catalysis, electronics, photo-electronics, magnets, quantum computing [2]. They also have been used against bacterial and viruses [3].
Dermal contact, ingestion, and inhalation are the frequent routes of exposure to nanomaterials. When the nanomaterials are ingested, they are delivered into the gastrointestinal (GI) tract. Inhalation results in trapped nanoparticles in the mucus and trans-located into the GI tract. The acidic environment can broken-down the material generating toxic compounds. Translocation of QDs across intestinal epithelial cells to blood circulation may result in transport to and uptake by organs like the brain, liver, kidney, spleen, and bone marrow [4]. Oxidative stress induction by reactive oxygen species is the principal mechanism of the cytotoxicity of QDs [5]. It has been suggested that the quantum confinement effect could further lead to cytotoxicity because QDs within specific diameters may have a similar size to certain cellular components and proteins, bypassing natural mechanical barriers [6]. In addition, QDs, due to their small crystal sizes, can cross cell membranes. Small nanoparticles have been reported to be highly carcinogenic [7]. Physicochemical properties such as size, charge, core composition, and stability of the outer surface are the factors that determine QDs toxicity. Internalization strategies such as coating QDs with cationic ligands, transferrin, and cell-penetrating peptides can produce endocytosis-based delivery [5,8].
Cadmium sulfide/selenide (CdSSe) QDs are semiconductors with band-gap energy and fluorescence emission within the visible spectrum that can be modulated by controlling their crystal size. Previous research suggests that the toxicity of QDs depends on different properties such as size, chemical composition, and surface coating components [9]. Without the presence of coating agents, the cytotoxicity of the CdSSe core can be correlated with the liberation of toxic metals, free ions (Cd2+), due to deterioration of QDs lattice caused by oxidation or under low pH [9,10].
Cadmium-based nanoparticles have an inorganic core and organic shell [6]. The organic shell or surface ligand is vital in synthesizing, stabilizing, and practical uses in different matrixes [11]. The ligands stabilize chemical, optical, and electronic properties [11,12]. For example, long chains of fatty acids help to avoid crystal growth, solubility in organic solvents, and passivation of the uncoordinated atoms on the surface of the QDs [13]. Despite these advantages, long-chain ligands are unsuitable for many applications and can be exchanged for another ligand, which can vary the chain length, solubility, and weight. Cadmium has been shown to bind to the thiol group of glutathione, causing its depletion in cells [14]. In addition, cadmium ions bind to sulfhydryl groups of mitochondrial proteins and cause injury [15].
The process of exchanging the native ligand for new ligands is called ligand exchange. In this process, the original ligand is desorbed, and the selected ligand is bonded to the surface of the QDs. Ligand exchange is commonly carried out to incorporate functional groups that alter the solubility of the QD, improve the exposure of the surface of the QDs, integrate biological receptors, and introduce electron transfer partners [13]. In addition, the QDs surface is frequently modified to enable intracellular delivery and attach targeting biomolecules (i.e., antibodies) [1]. In the exchange of ligands, a negatively charged X-type ligand binds to the cadmium atoms on the surface of the QDs [12].
On the other hand, the L-type ligands are neutral and linked to the QDs as Lewis bases by donating a pair of electrons. Therefore, l-type ligands can only replace native L-type ligands; similarly, X-type ligands can only be replaced by X-type ligands. The specific exchange occurs to maintain the charge balance [12].
In this research, the CdSSe-TGA cover was interchanged with small organic molecules, and their effect on the viability and activity of the CYP1A1, CYP1A2, and CYP3A4 isoenzymes of HEPG2 cells was evaluated. The results confirm that the CYP-isoenzymes activity changes with the organic covers on CdSSe QDs.

2. Materials and Methods

2.1. Synthesis of CdSSe QDs

Thioglycolic acid (TGA) was mixed with cadmium sulfate solution in an alkaline medium to allow the Cd-complex formation and avoid the generation of oxides. TGA is the stabilizer, sulfur source, and capping agent. The solution pH was lowered to 6.2, and the reduced selenide solution was added to the reaction mixture (selenium powder was reduced with sulfite to produce Se−2). The pH was set at 6.8, and the reaction mixture was transferred into a Teflon™ vessel (CEM Corporation, Matthews, NC, USA). The solution was introduced in a MARS 6 Microwave system (CEM Corporation, Matthews, NC, USA), and the synthesis was performed at 150 °C for 45 min (30 min of ramping time and 15 min of hold time).
The QDs suspension was precipitated with 2-propanol and centrifuged for 15 min. Next, the pellet was washed with 2-propanol and centrifuged for 5 min. Finally, the pellet was reconstituted in deionized water.

2.2. Functionalization of CdSSe QDs

Ligand exchange was performed using cysteine, glutamic acid, glutaraldehyde, glutathione, and lysine. Synthesized CdSSe QDs covered with thioglycolic acid (original nanoparticle) were added to a centrifuge tube (1000 mg/L final concentration). Phosphate-buffered saline (PBS) was added to stabilize the pH to 7.0. A 0.5 mL aliquot of 50% glutaraldehyde solution was added for functionalization with glutaraldehyde. (2.5% final concentration). The mixture was shaken in a Rotamix™ (ATR Biotech, Laurel, MD, USA) at 30 rpm and 25 °C for 24 h. The QDs were recovered by precipitation and centrifugation with 2-propanol. The QDs covered with glutaraldehyde (CdSSe-GLT) were resuspended in deionized water.
The same procedure was used for the other ligands, maintaining the ligand concentration of 2.5% and 1000 ppm of CdSSe QDs in PBS. All QDs were recovered and resuspended in deionized water and labeled CdSSe-Cys (cysteine), CdSSe-GA (glutamic acid), CdSSe-GTO (glutathione), and CdSSe-Lys (lysine). The dry weight was calculated by adding 1.00 mL of each QDs in a previously weight vial (in triplicates) and dried in the oven for 24 h. Then, the vials were placed in a desiccator for 15 min and weighed to obtain the QDs concentration (mg/L).

2.3. Characterization of QDs

The QDs were optically characterized using a UV-VIS 1800 spectrophotometer (Shimadzu, Columbia, MD, USA) and a spectrofluorometer RF 6000 (Shimadzu, Columbia, MD, USA). The ligands (functional groups) on the CdSSe QDs surface were analyzed with an FT-IR Cary 630 (Agilent Technologies, Santa Clara, CA, USA). The structural characterization was evaluated using high-resolution transmission electron microscopy (HRTEM) on a JEM-ARM200CF (JEOL, Tokyo, Japan).

2.4. HEP-G2 Cells Culture

The human liver cancer line (HEP-G2) was grown according to the supplier’s protocol. The cells were cultured in Eagle’s Minimum Essential Medium (EMEM), supplemented with 10% fetal bovine serum and gentamicin, and incubated in a 5% of CO2 and 95% humidity environment at 37 °C in a Forma Steri-Cycle CO2 Incubator (Thermo Scientific, Waltham, MA, USA).

2.5. Cell Viability

The CellTiter-Glo® (Promega, Madison, WI, USA) Luminescent Cell Viability Assay is a homogeneous method to determine the number of viable cells in culture. The homogeneous assay procedure involves adding a single reagent (CellTiter-Glo® Reagent, G7571 Promega, Madison, WI, USA) directly to cells cultured in 96-multiwell plates. After cell lysis, the luminescent signal is proportional to the amount of ATP present and the number of viable cells in the media.
The viability of the HEP-G2 cells exposed to CdSSe QDs with different concentrations and ligands was evaluated using the described kit. 96-well plates were seeded with 100 µL media at 104 cells and incubated for 24 h to allow the attaching of the cells. Media with the specific concentration (0.001 to 10 mg/L) of each QDs with different covers was added to each well (all experiments were done five to six times). After 24 h, 100 µL of the CellTiter-Glo® Reagent was added to each well, and the contents were mixed for 2 min on an orbital shaker to induce cell lysis. The plate was incubated at room temperature for 10 min to stabilize the luminescent signal. The luminescence was recorded using a Fluoroskan Ascent FL (Thermo Scientific, Waltham, MA, USA). Cd+2 (ions solution) was used for comparative purposes.
Additionally, a RealTime-Glo™ (Promega, Madison, WI, USA) Annexin V Apoptosis and Necrosis kit (JA1012 Promega) was used to monitor the apoptosis (phosphatidylserine on the outer layer of the cell) and the necrosis processes (release of the DNA to media). In 96-well plates, HEP-G2 cells (106 cells/mL), CdSSe QDs (2.5 mg/L), and Cd+2 (2.5 mg/L) were mixed with the detection reagent and incubated for 72 h. Luminescence signals (apoptosis) and fluorescence (necrosis, 485 nm of excitation, and 525–530 nm of emission) were monitored.

2.6. Activity of Cytochrome P450 Isoenzymes

The CYP1A1 (Luciferin -CEE, V8752, Promega, Madison, WI, USA), CYP1A2 (Luciferin-1A2, V8422), and CYP3A4 (Luciferin-PFBE, V8902) enzyme kits gave good luminescence signals with the HEPG2 cells, and they were selected to ensure reliable results. 96-well plates were seeded with 100 µL of media with 106 HEP-G2 cells, and the plates were incubated for 24 h. Media with 5.0 mg/L of CdSSe-Cys, CdSSe GA, CdSSe-GTO, CdSSe-GLT, CdSSe-Lys, and CdSSe QDs (TGA) were added to each well (all experiments were done five to six times) and incubated 24 h. The same procedure was repeated for additional 24 h to allow the production or inhibition of the specific isoenzymes. The same procedure was done using omeprazole and rifampicin as inductors. I was performed to evaluate if the QDs generate interferences in the induction process.
After 48 h, the media was exchanged with fresh media or buffer (based on the isoenzyme) containing the CYP substrates: Luciferin-CEE (1A1 isoenzyme), luciferin-1A2 (1A2 isoenzyme), and luciferin-PFBE (CYP 3A4 isoenzyme). After two to six hours (based on the isoenzyme), the luciferin detection reagent was added. Then, the luminescence was recorded using a Fluoroskan Ascent FL (Thermo Scientific, Waltham, MA, USA).

2.7. Statistical Analysis

A One-Way ANOVA in an IBM SPSS statistical program was used to determine any statistically significant differences among the interest groups with a significance level of 0.95%. In addition, the one-way ANOVA was used to determine differences in the viability assays among cells and cells exposed to unfunctionalized and functionalized QDs. Also, it was used to determine differences in the response of CYP isoenzymes among the cells and cells exposed to different QDs concentrations with and without inductors.

3. Results

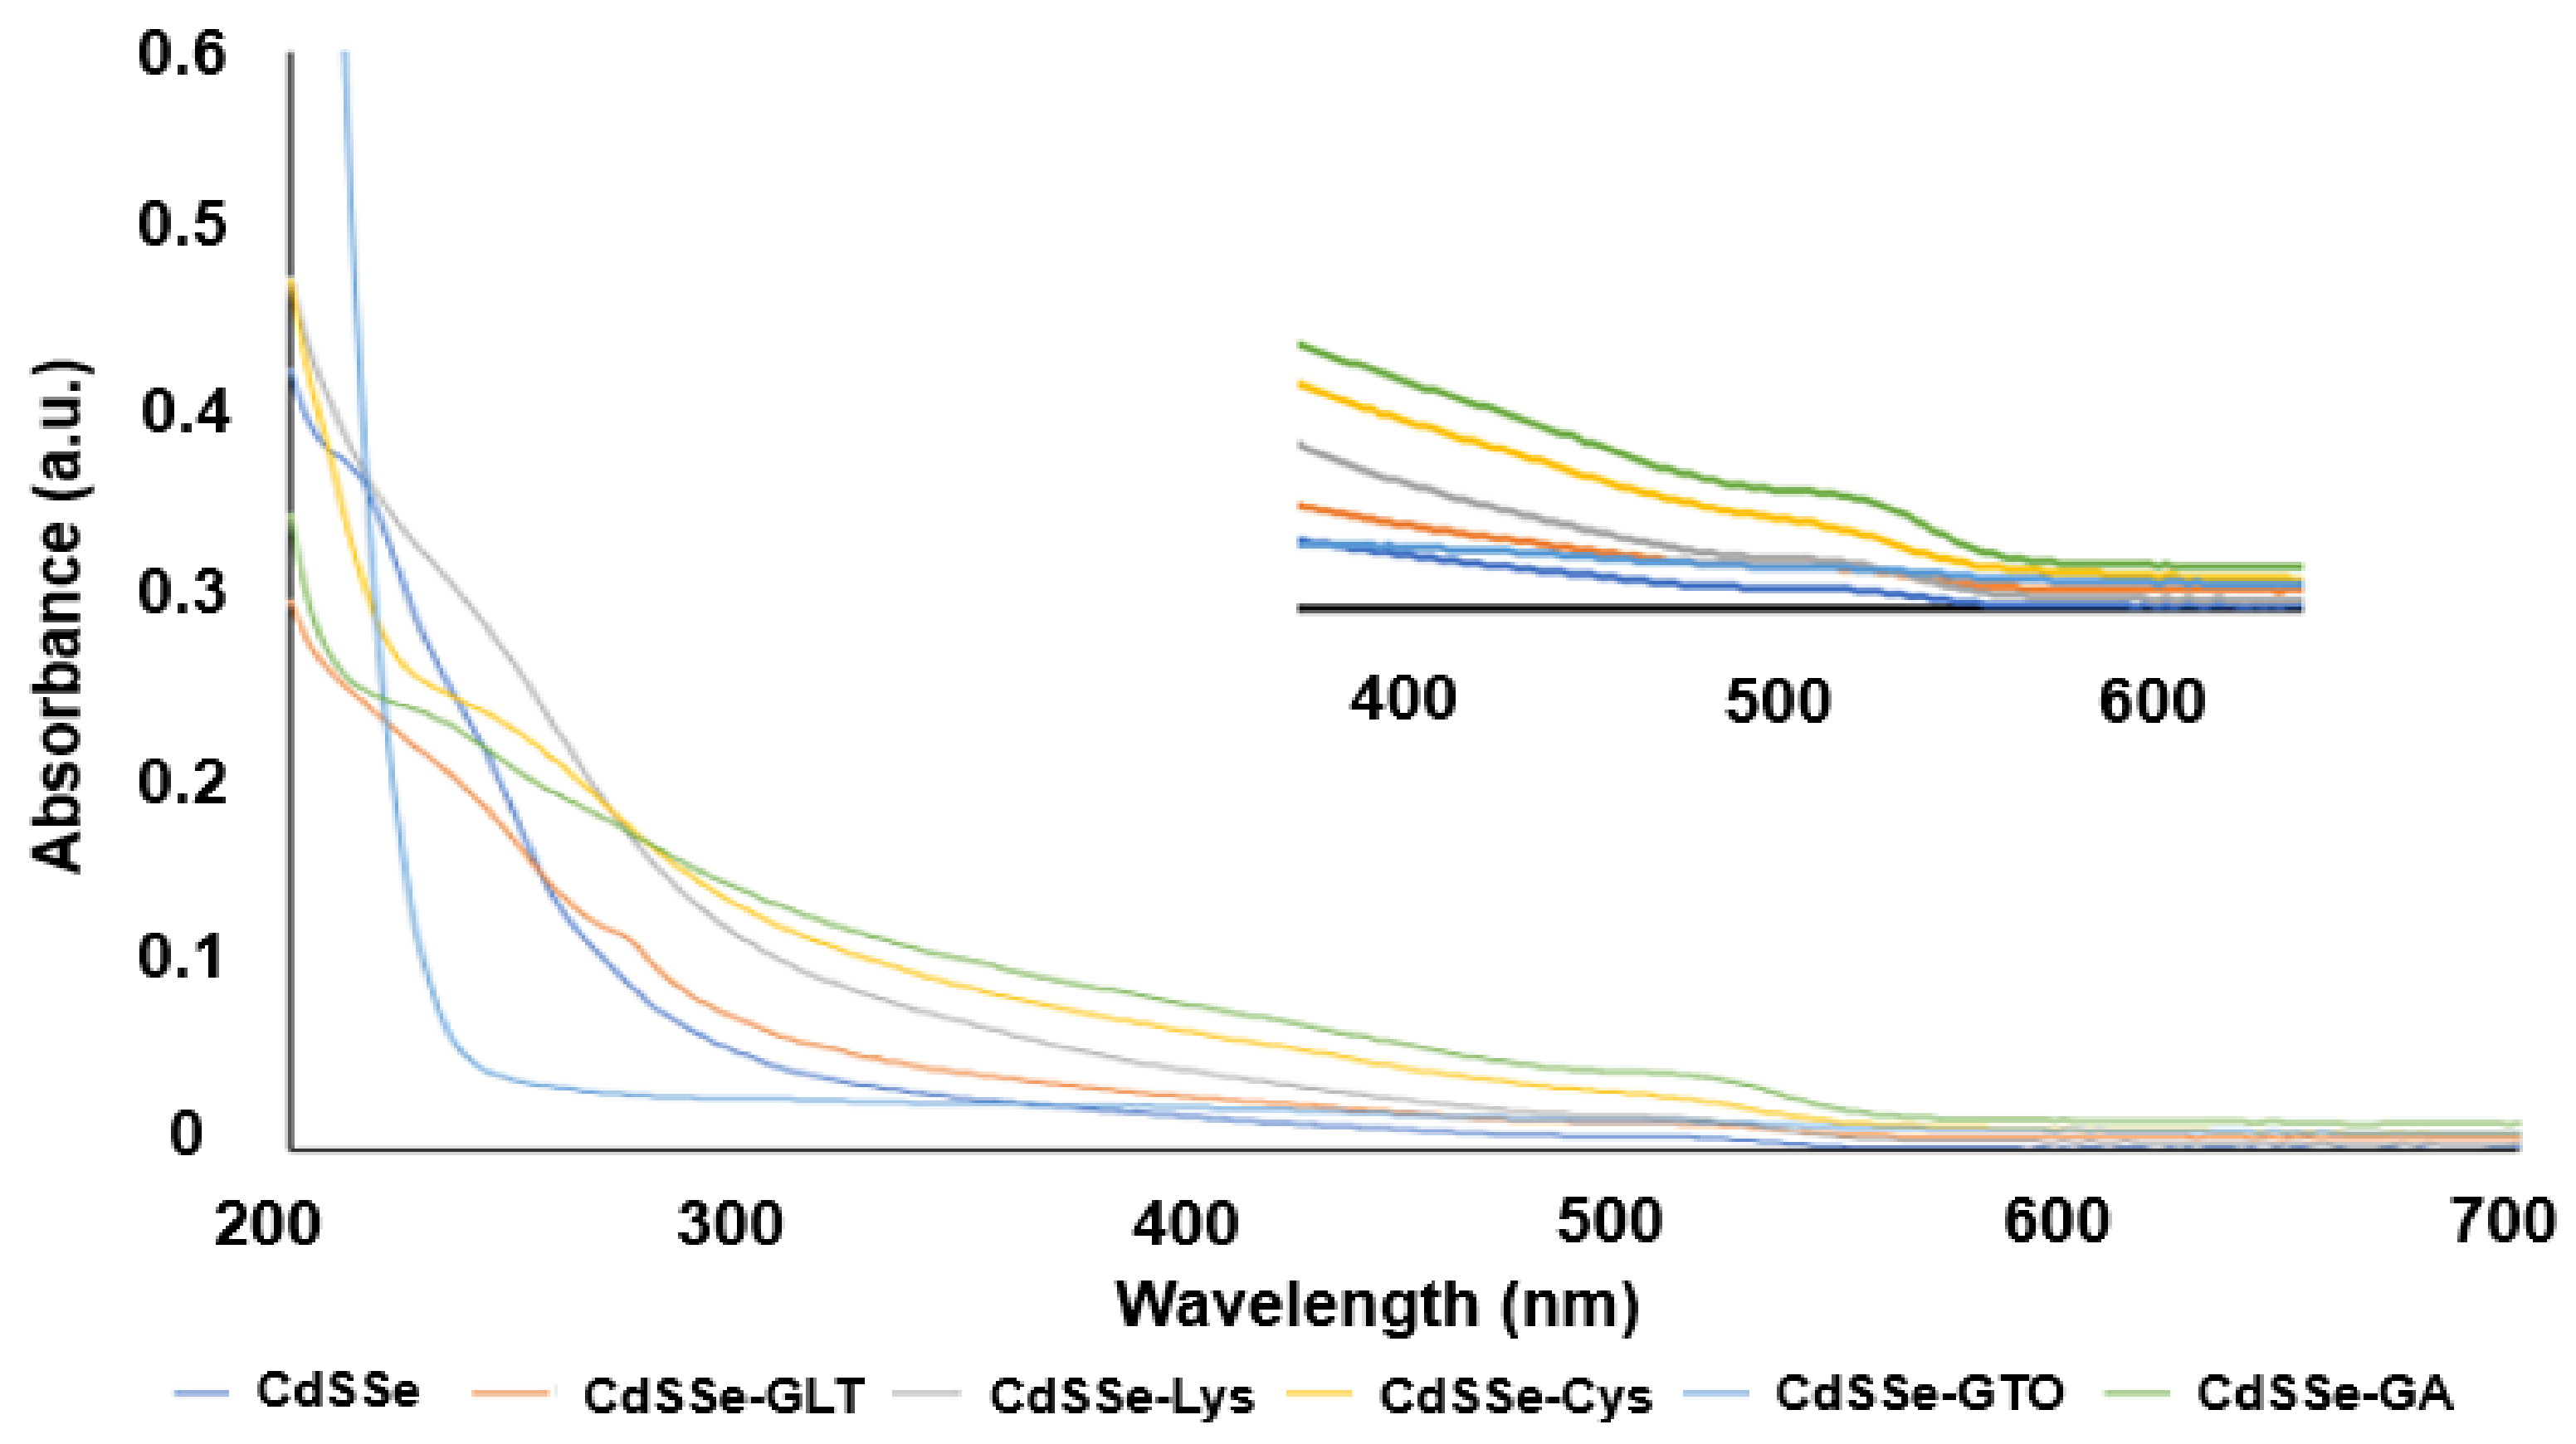
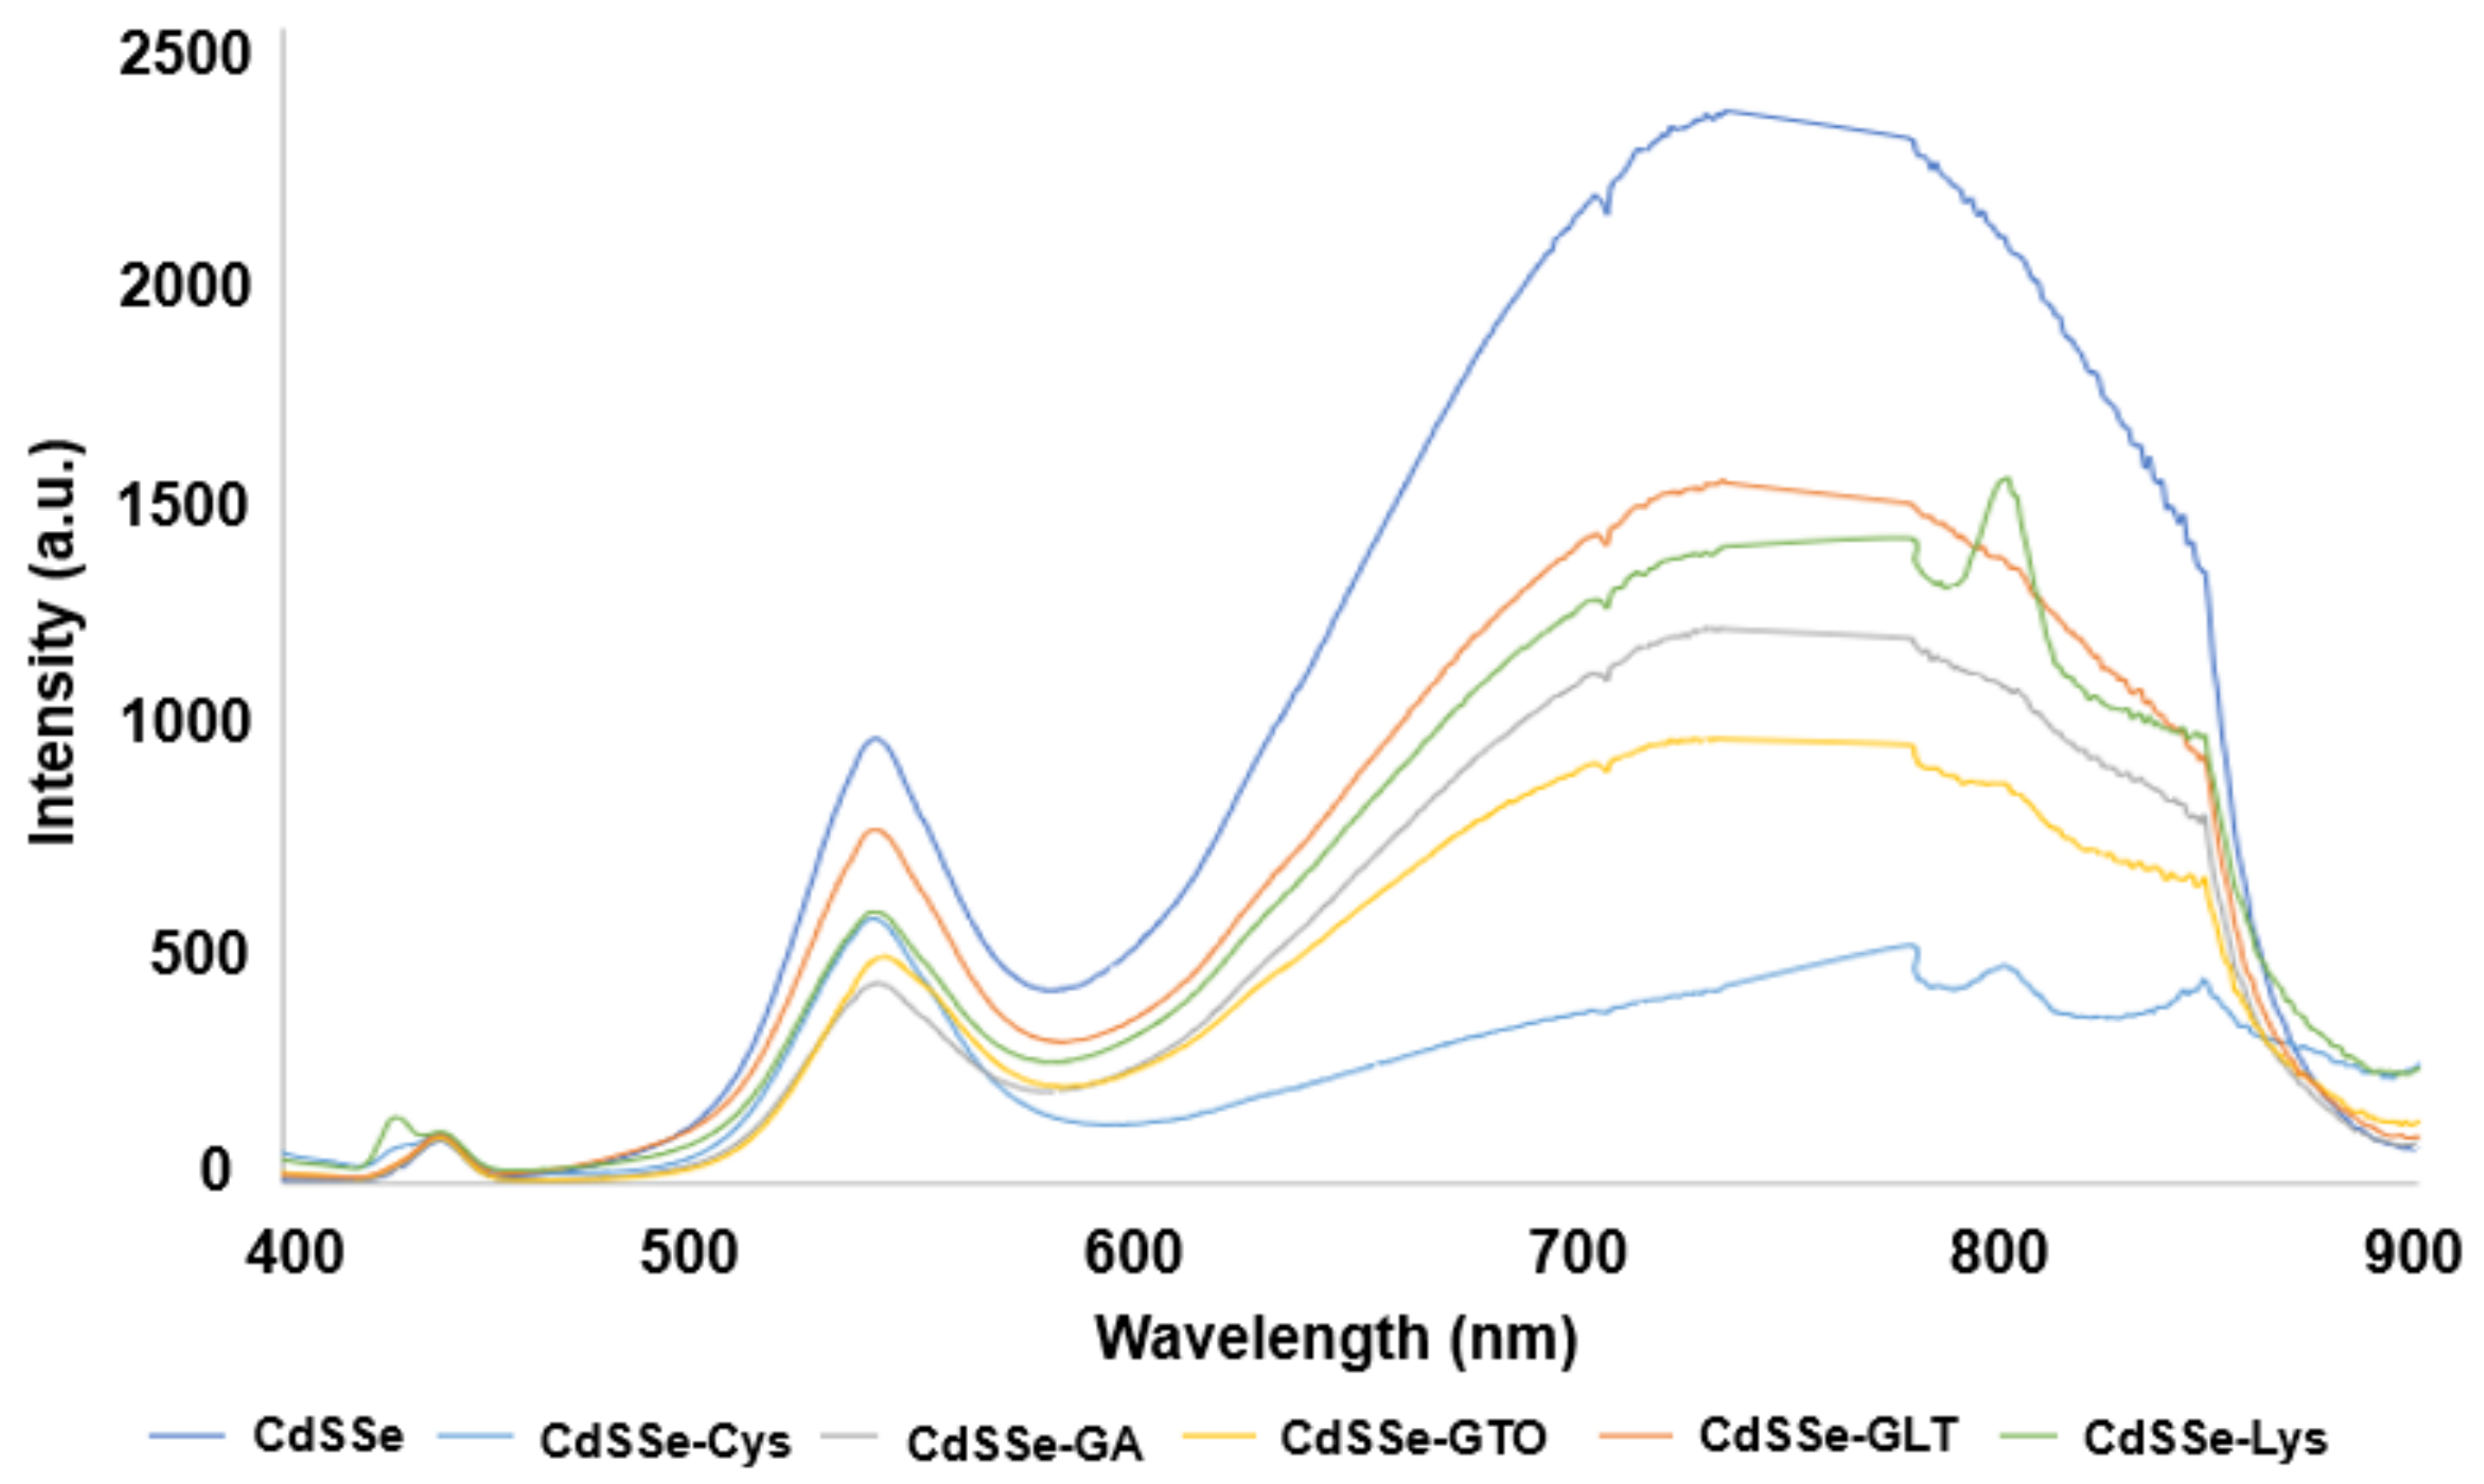
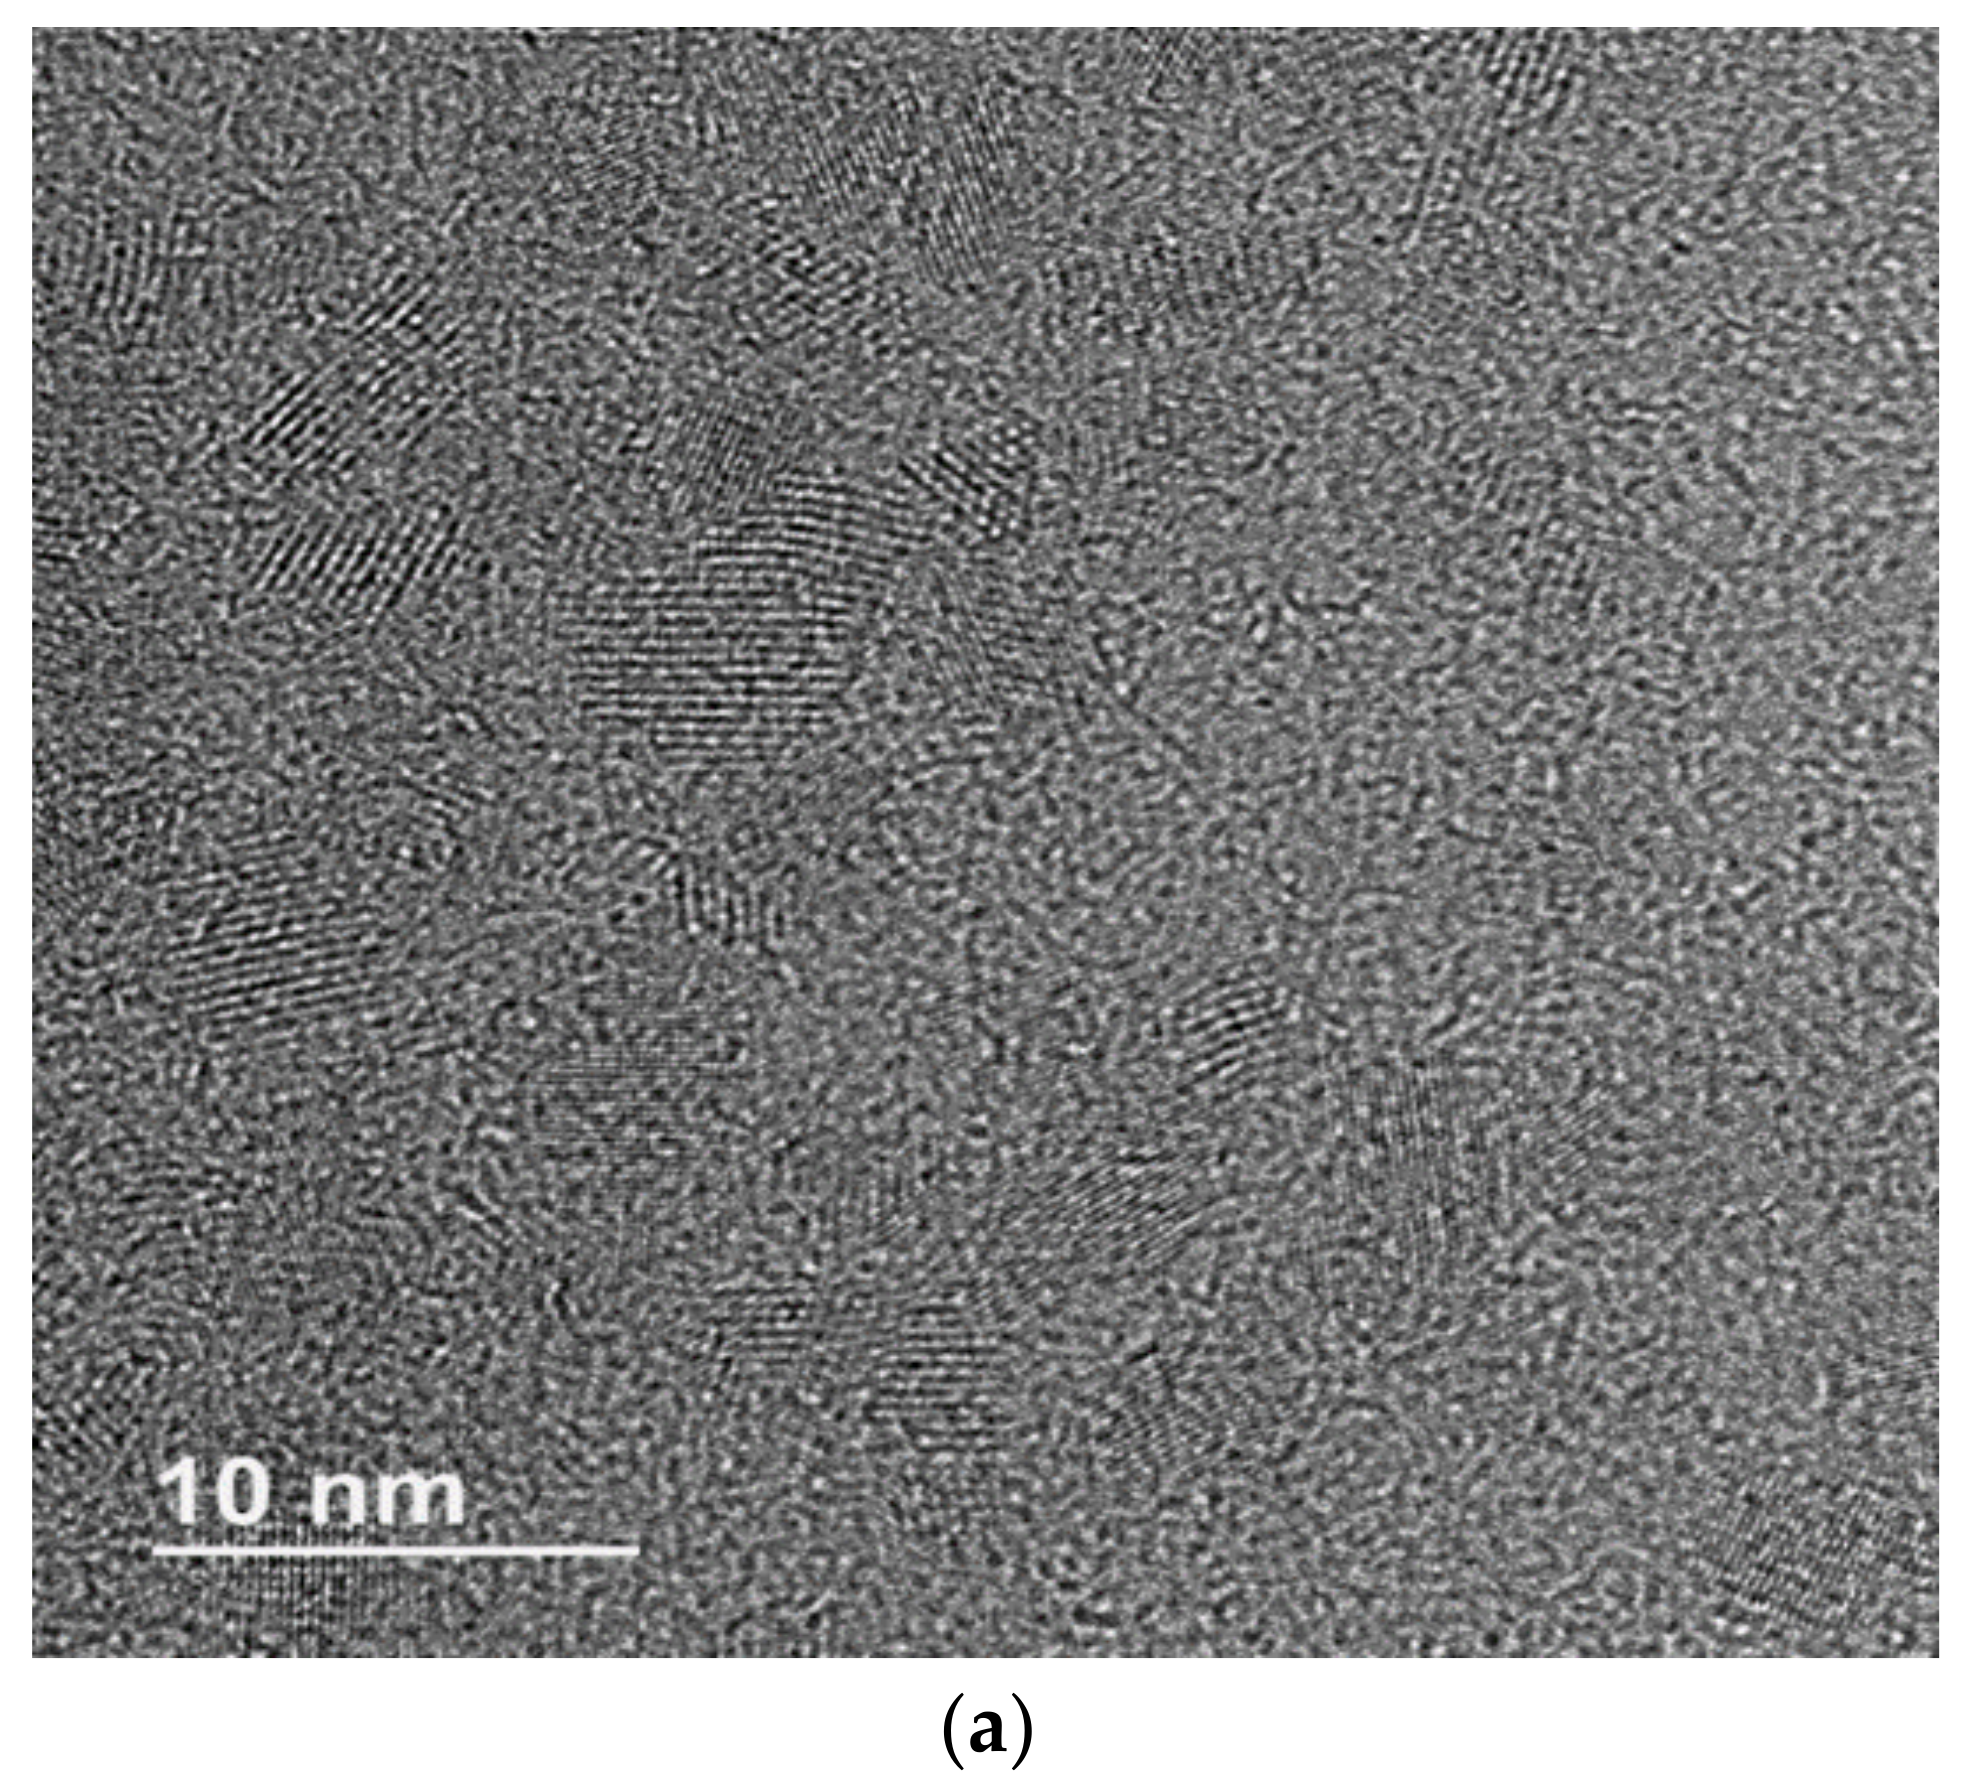
3.1. Characterization of Functionalized and Non-Functionalized CdSSe QDs

The optical characterization by absorption and emission spectroscopy is essential for the applications of these nanomaterials. The absorption spectrum can give the position of the exciton. The exciton is due to the electronic transition from the valence band’s upper level to the conduction band’s lower level [16,17]. There was a typical absorption peak for all QDs at ~520 nm (Figure 1, inserted). This absorption ensures that these nanomaterials can absorb photons at visible wavelengths. The original CdSSe QDs with TGA ligand has a second absorption peak at 216 nm (Figure 1). The same peak was red-shifted at 260, 236, 276, and 230 nm for the CdSSe-Cys, CdSSe-GA, CdSSe-GLT, and CdSSe-Lys QDs, respectively. The peak was not observed for CdSSe-GTO because the electronic transitions of the π and n electrons of the functional ligand groups generate absorption bands in the same UV region. Glutathione is the largest ligand, almost three times the other ligands. As we discuss below in the IR characterization, the TGA should be linked to the CdSSe core through the carboxylic and thiol groups, probably due to the small size of the ligand. The cysteine also has the same groups of TGA, and it can be linked to the QDs for the carboxylic and thiol group (small ligands). Glutaraldehyde is a small ligand and can be linked to the CdSSe core by the two aldehyde groups. These two ligands have the largest red shift compared to TGA. Lysine and glutamic acid are the largest amino acids, and the IR suggested that only a carboxylic group links them to the CdSSe core generating the smallest red shift. The results suggest a reordering in the CdSSe surface after ligand exchange, and the exciton is slightly affected by the ligand size [10,12,13].
The CdSSe QDs synthesized by microwave irradiation at 150 °C have an emission spectrum with a principal fluorescence peak centered at 540 nm and a significant crystal defect between 650 and 850 nm (Figure 2). The emission peak indicates energy released during the electron recombination in the conduction band and the hole in the valence band [16]. In our lab, we produce CdSSe QDs with defects that show more photodegradation capacity related to reactive oxygen species production. For that reason, QDs with a significant defect were selected. Comparing the emission wavelengths of the functionalized and non-functionalized CdSSe QDs, there were no drastic changes in the principal emission peak at 540 nm. The main difference after functionalization is in the crystal defect; the decrease in the intensity (ratio between 540 and 750 peaks) suggests changes on the crystal surface [18]. Apparently, during the removal of the TGA, there was a reorder of the unit cells, and then the new ligands were attached. There is a relation between the absorption and emission spectrum. The largest ligands (aspartic acid and lysine) produce the smallest red shift and the smallest reduction in the defects on the CdSSe. The cysteine that generates the largest red shift produces the most considerable reduction of the defects. The change in the pattern of glutaraldehyde can be due to its reactivity producing the highest reorder on the CdSSe surface [19].
The changes on the surface suggested by the UV-Vis and fluorescence spectrum did not modify the crystal sizes Figure 3. HR-TEM confirms the nanometric size of the CdSSe QDs with and without functionalization. Energy-dispersive X-ray spectroscopy of CdSSe QDs functionalized, and non-functionalized confirms the composition of Cd, S, and Se.
Figure 4 shows the infrared spectra for the CdSSe QDs and the functionalized QDs. Each figure (a to f) show the pure ligand (blue lines) spectrum and the ligand on the surface of the CdSSe QDs (orange lines). Figure 4a shows the thioglycolic acid with three bands: the S-H (thiol) at ~2640 cm−1, the C=O (carbonyl) at ~1650 cm−1, and C-O at ~1550 cm−1. The missing of the thiol band, the shift (to the right) of the carbonyl, and the intensifying of the C-O band indicate that TGA is linked to the CdSSe surface by the thiol and the carboxylic group. Figure 4b shows four bands of the cysteine: the NH2 (amine) at ~2850 cm−1, S-H (thiol) at ~2640 cm−1, the C=O (carbonyl) at ~1700 cm−1, and the C-O at 1500 cm−1. The missing of the thiol, the carbonyl shift, and the intensifying of the C-O indicate the same link to the CdSSe QDs like TGA. Figure 4c shows three bands for the glutamic acid: the NH2 (amine) at ~2950 cm−1, the C=O (carbonyl) at ~1650 cm−1, and the C-O at 1500 cm−1. The carbonyl shift and the intensifying of the C-O indicate a link to the CdSSe through the carboxylic acids. The presence of a weak band at ~2950 cm−1 of the NH2 in the functionalized QDs confirms the ligand exchange. Figure 4d shows the bands for the principal groups of glutathione. The spectrum of glutathione on the CdSSe QDs shows that bands of the amines (~2950 cm−1) did not change, the band of the thiol (~2300 cm−1) is missing, and there are shifts and increase in the intensities of the bands C=O and C-O (1500–1250 cm−1) indicating the same link pattern. For glutaraldehyde (Figure 4e), the OH band (~3150 cm−1) is characteristic of this compound in aqueous samples. The two bands of the C-O at ~1650 shift and increase, showing the link through the carbonyl groups. Figure 4f shows three bands for lysine: the amines at ~2900 cm−1, the carbonyl, and C-O between 1400 and 1550 cm−1. The shift of the C=O and C-O bands indicates the link through the carboxylic, and the presence of the amines confirms the ligand exchange.

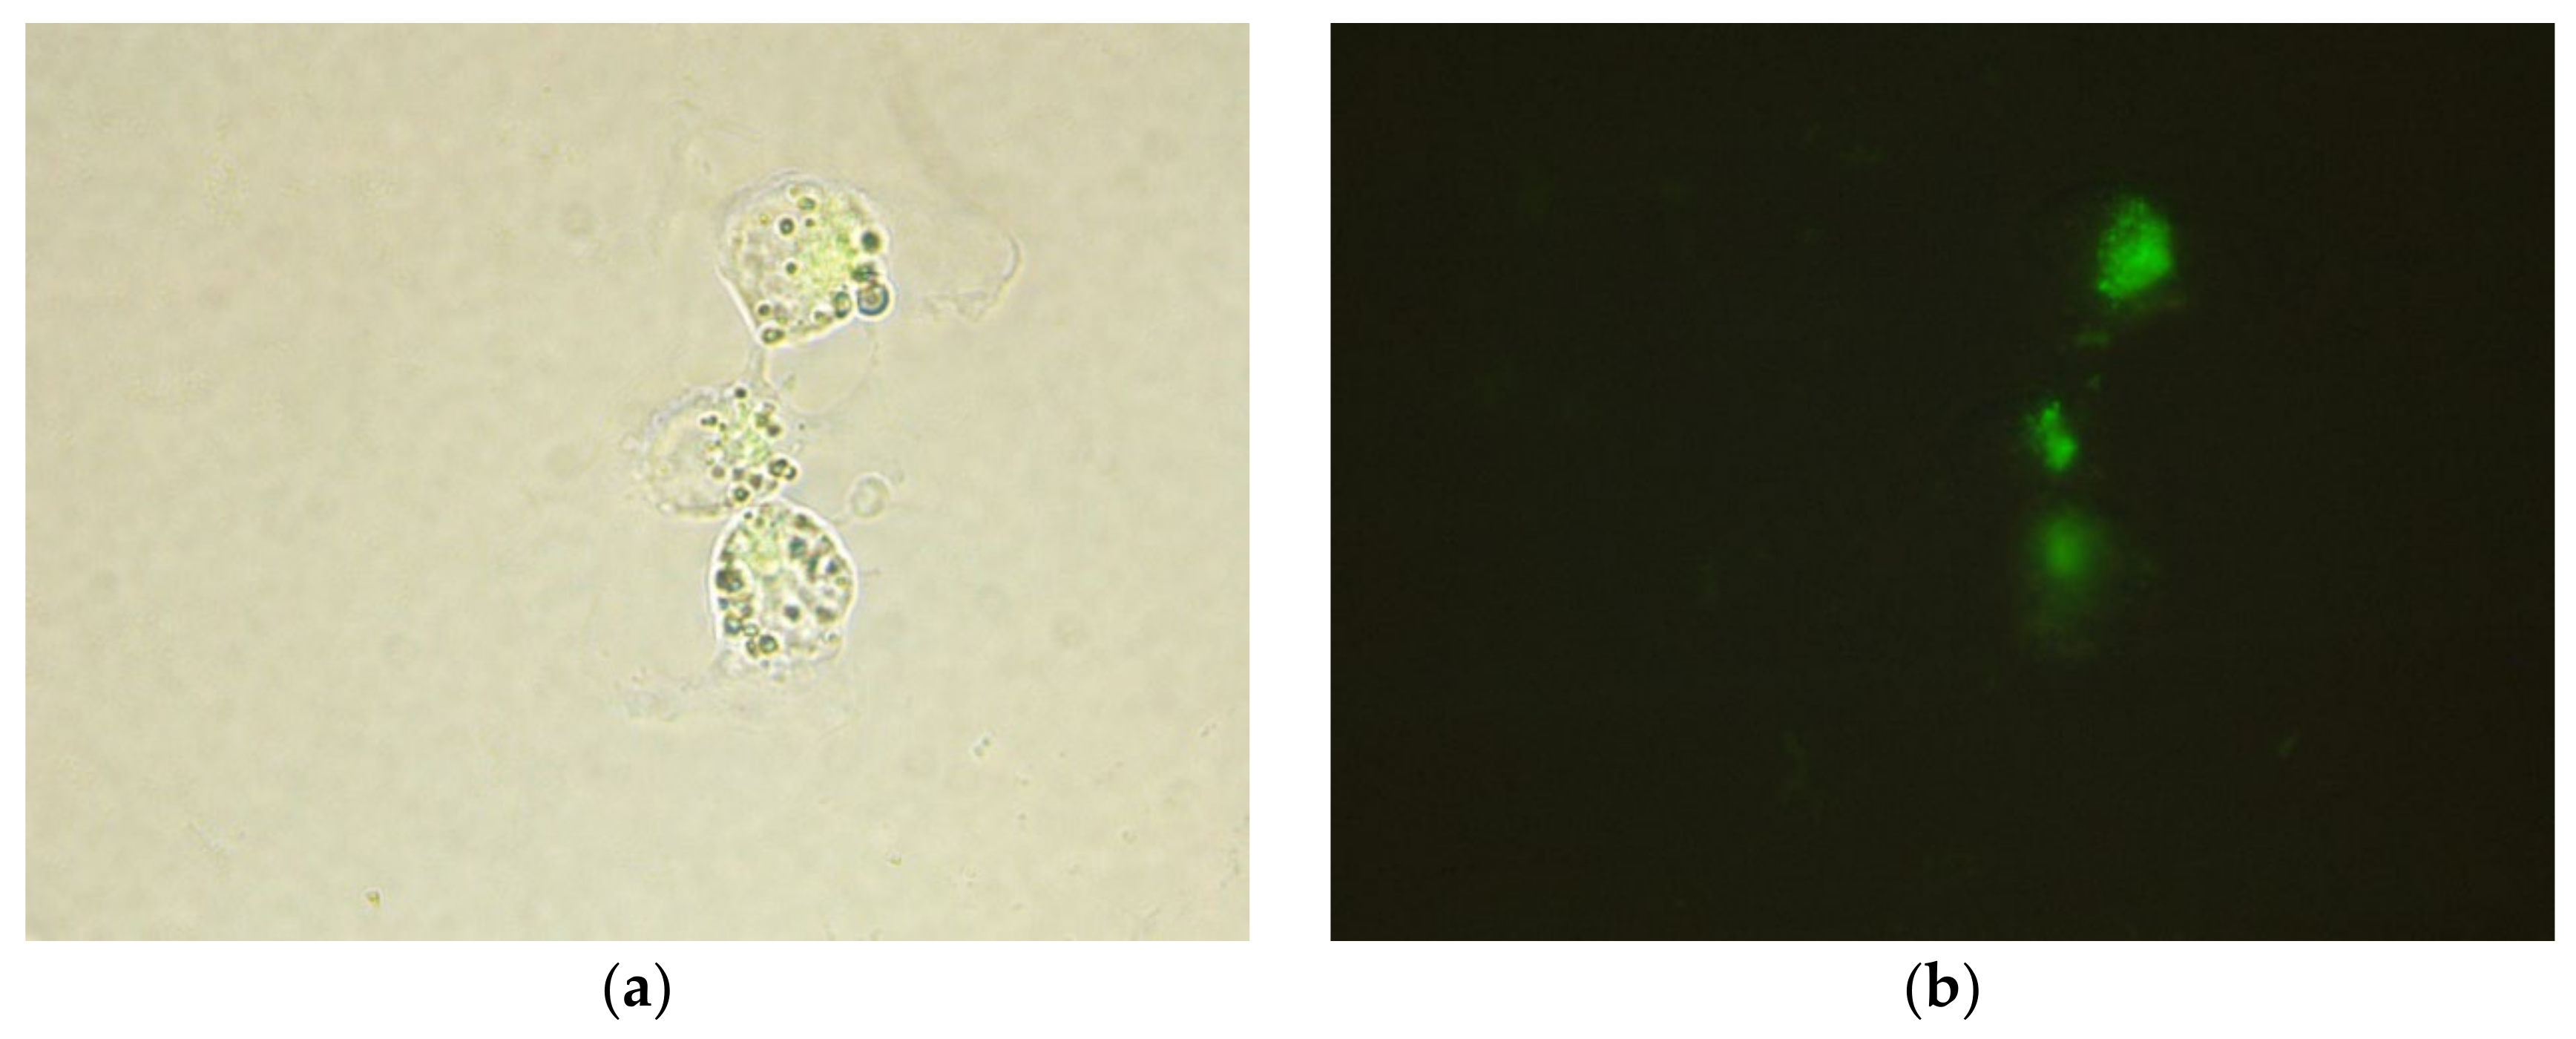
3.2. Microscopic Analysis of the HEP-G2 Cells

Figure 5 shows the HEP-G2 cells after 4 h of exposure to non-functionalized CdSSe QDs. Figure 5a shows a slight fluorescence that is increased with the intensity of the excitation wavelength and in the dark (Figure 5b) (BX43 microscope with fluorescence, Olympus, Tokyo, Japan). The HEPG2 cells fixed in a coverslip (with no treatment) generated that the cells were not completely adherent and had their characteristic form. The intensity and blur of the fluorescence suggest that the QDs are on the surface and inside of the cells. The same patterns were observed for the QDs with the interchanged ligands.

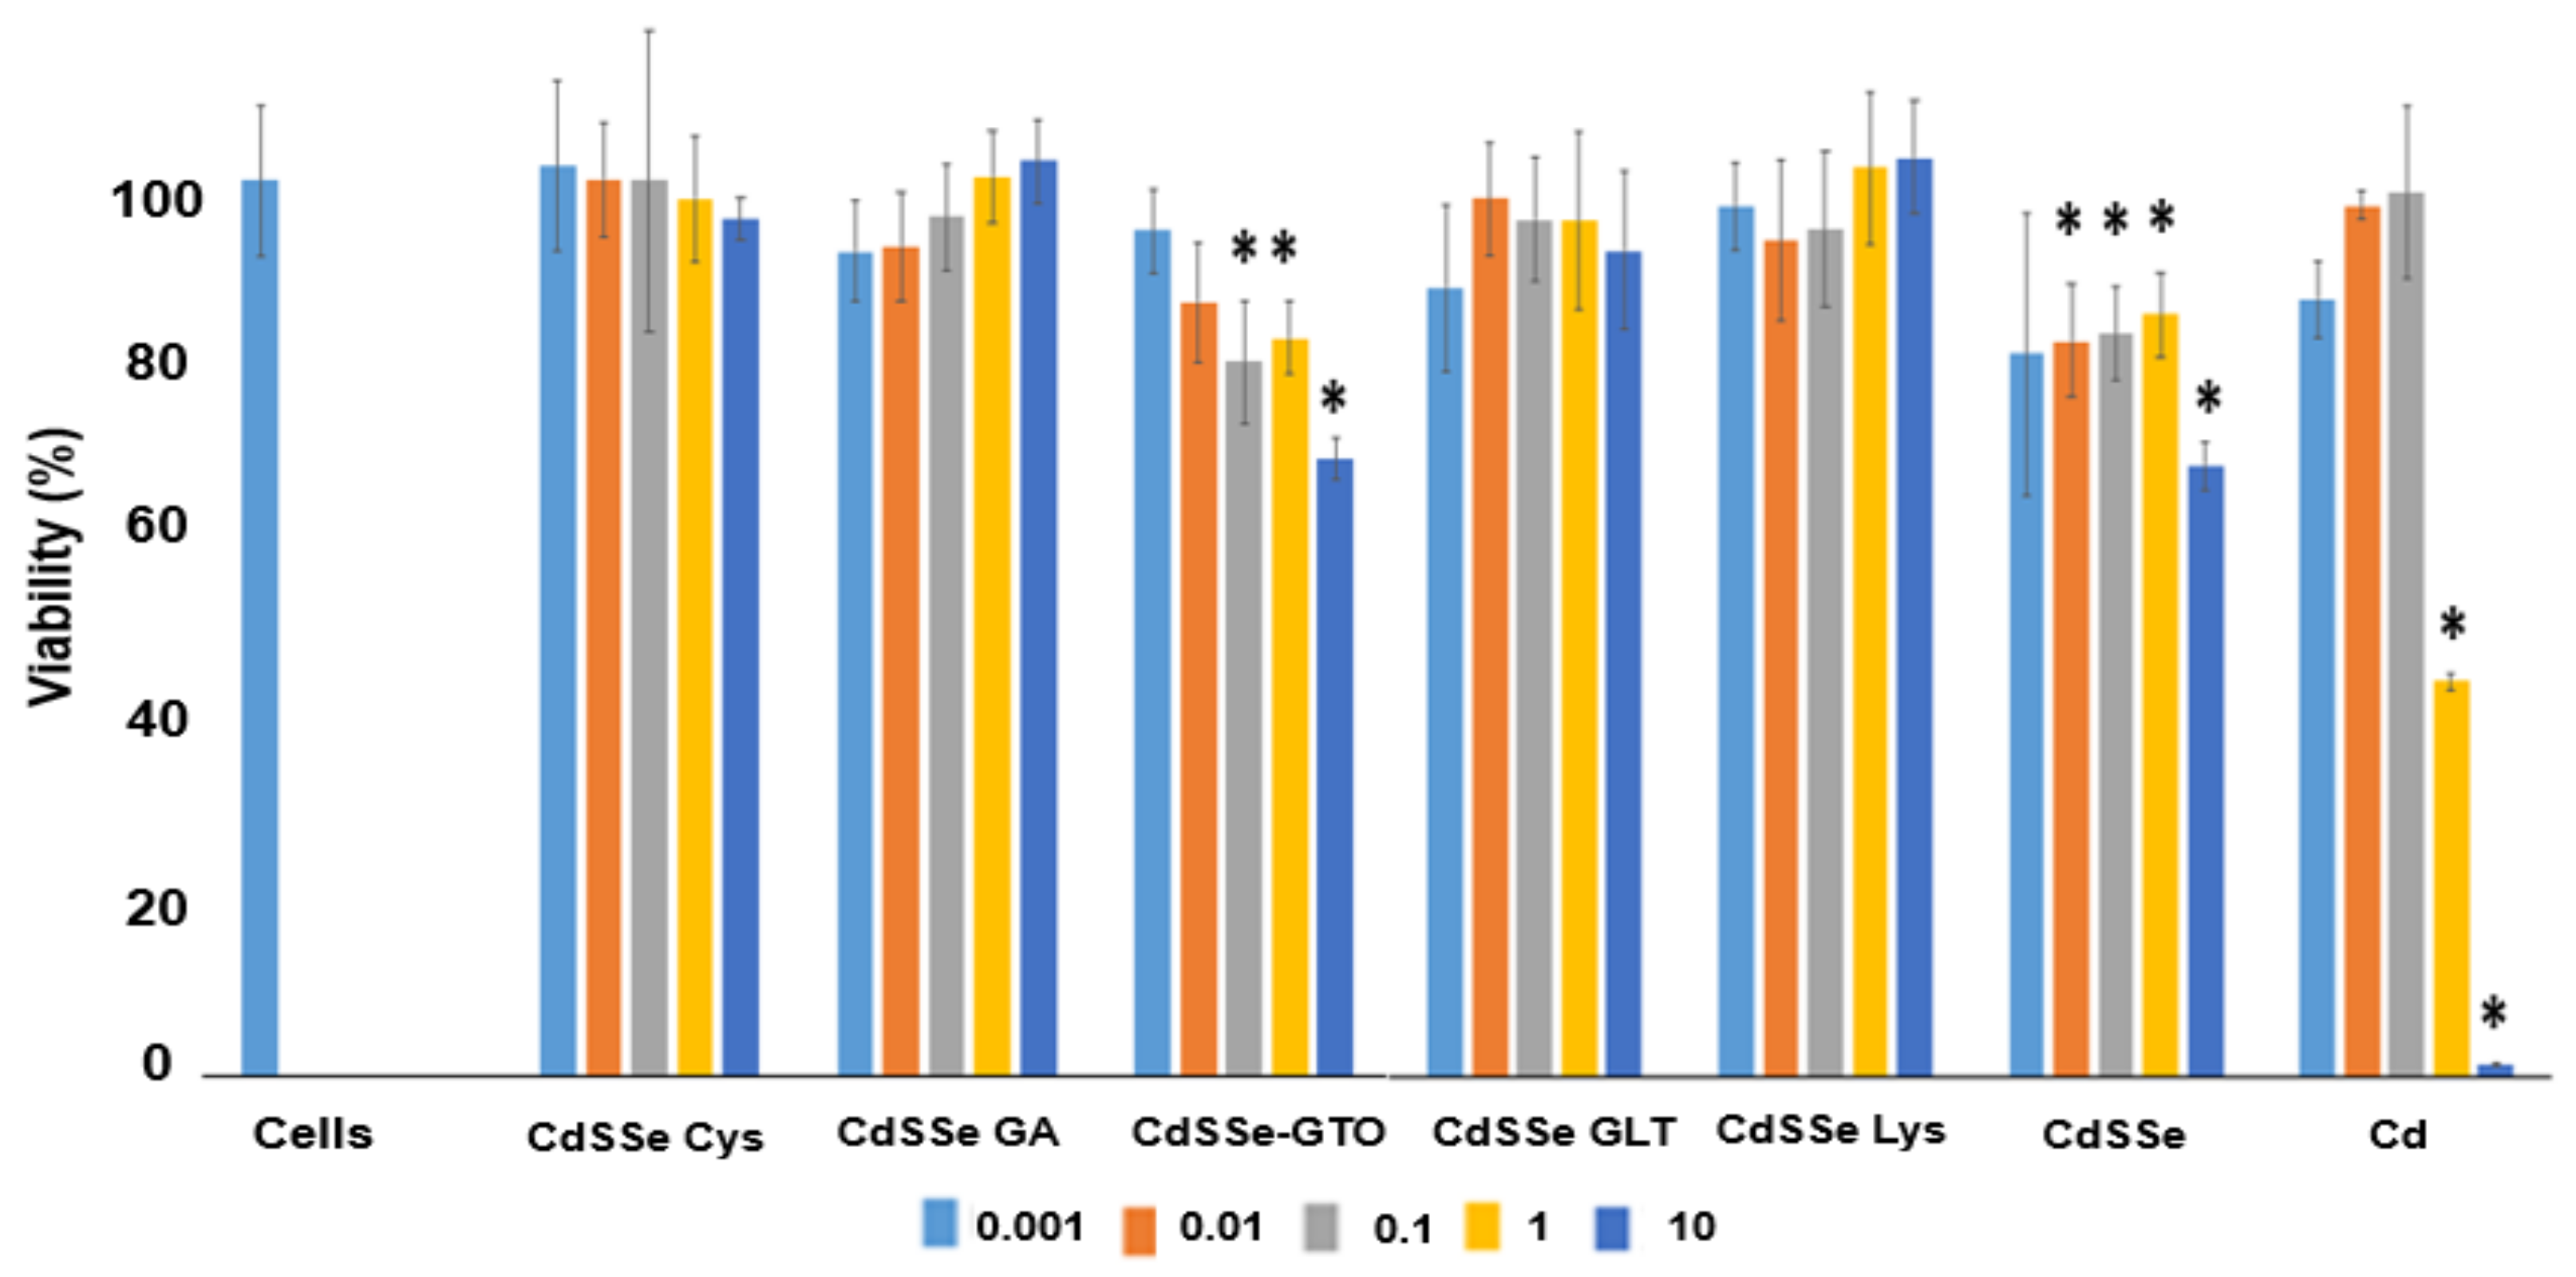
3.3. HEPG2 Cell Viability

The viability of the HEPG2 cells exposed to functionalized and non-functionalized CdSSe and a Cd+2 solution is shown in Figure 6. CdSSe-Cys, CdSSe-GA, CdSSe-GLT, and CdSSe-Lys QDs do not affect viability during the first 24 h. CdSSe-GTO QDs have almost the same toxicity as the original CdSSe QDs covered with TGA. The loss of viability is based on the QDs concentrations. High concentrations cause a high loss in viability [20]. Cd+2 is the most cytotoxic compound; there is a decrease in viability at concentrations of ~1 mg/L. After 24 h of exposure, it is expected that the CdSSe QDs functionalized and non-functionalized start to degrade, and the release of the cadmium ions should increase their toxicity. Changes in the pH due to the pH in different compartments are responsible for the long-term toxicity of nanomaterials [5,21,22]. Glutathione is a tripeptide composed of three amino acids (cysteine, glutamic acid, and glycine) and is the most abundant thiol compound in the cytoplasm [23]. Glutathione is an antioxidant, a detoxifying agent, and a free radical scavenger. As a typical compound inside the cells, the CdSSe-GTO can be translocated more easily inside cells, increasing their toxicity.
Figure 7 shows that apoptosis and necrosis processes are responsible for the CdSSe QDs (TGA) and cadmium toxicity. The gap between the apoptosis and necrosis process for CdSSe QDs is 8 h. Also, these results confirm a negligible effect on viability in the first 24 h, and the necrosis process starts around 32 h. In contrast, the apoptosis effect of the Cd+2 starts at ~10 h, and there is a 22 h gap until the necrosis process starts [4,24]. These results confirm the decrease of the viable cells at 24 h (Figure 6). The plots for blank cells confirm that there are other processes different from apoptosis or necrosis in their death (information by the manufacturer). Apoptosis of cells has been observed for other nanoparticles [25].

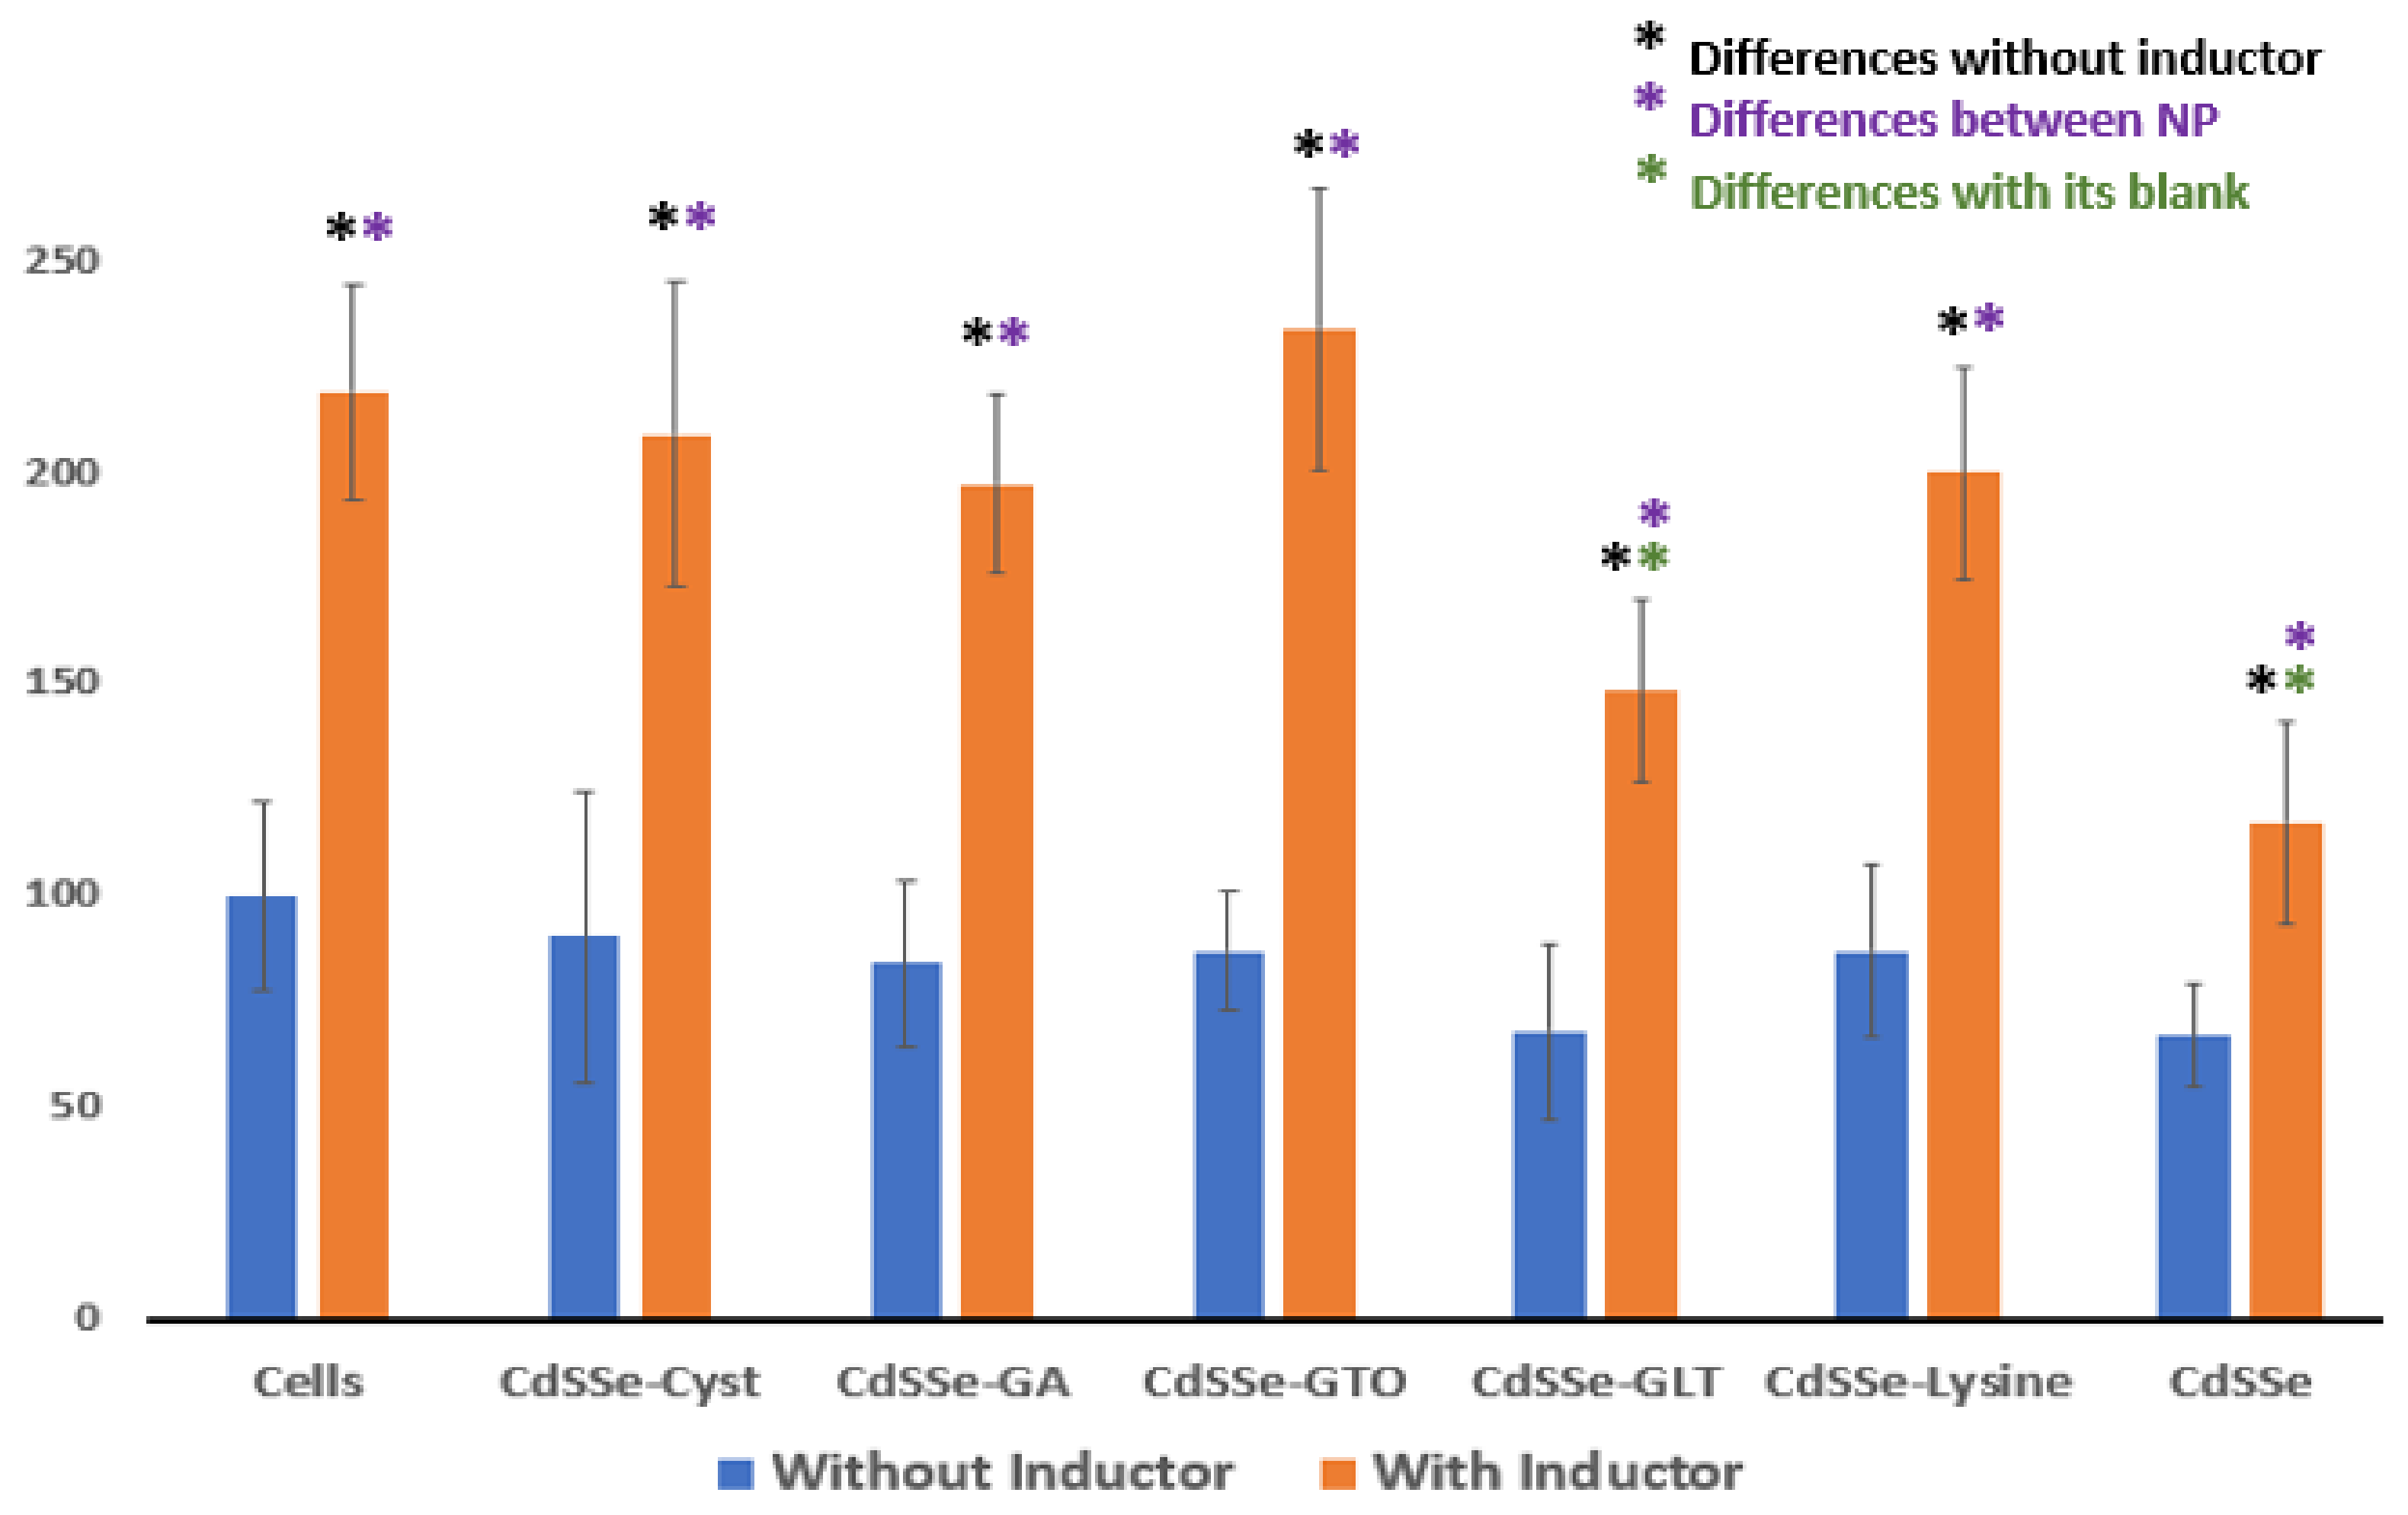
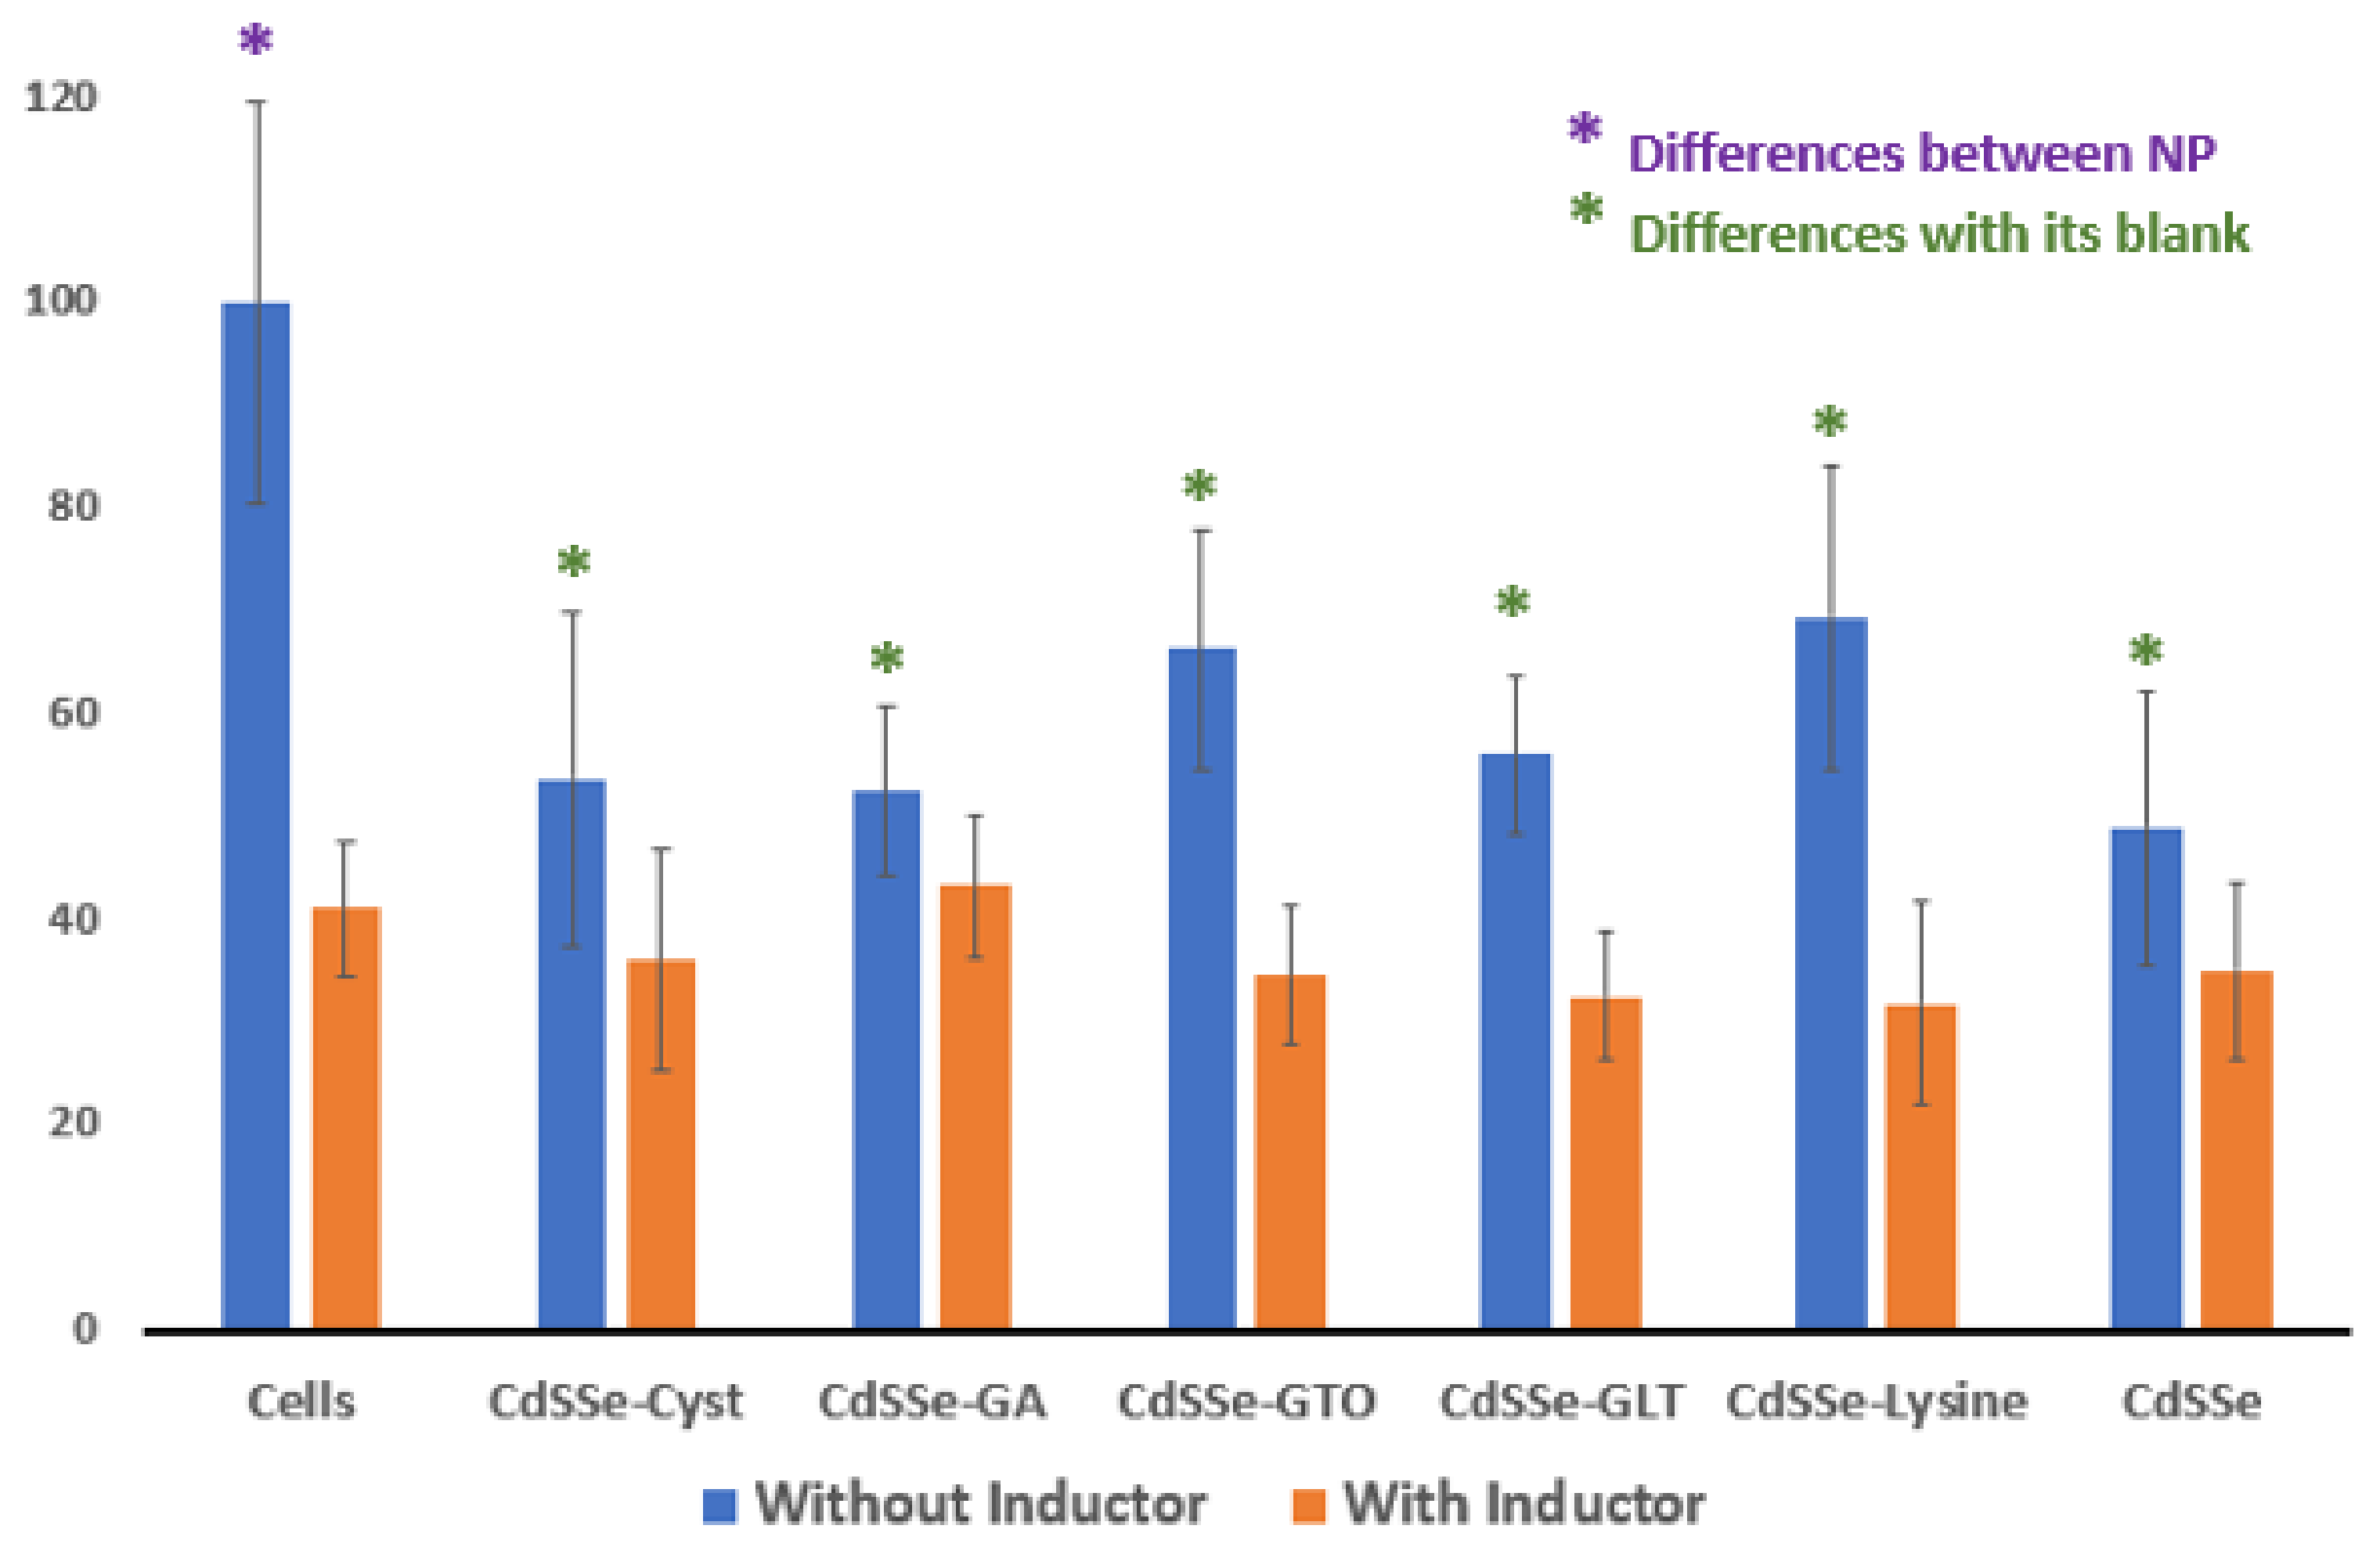
3.4. Response of the CYP-450 Isoenzymes

The activity of the CYP1A1 of HEPG2 cells (Figure 8) was measured with and without an inductor (Omeprazole) in the presence of the functionalized and non-functionalized CdSSe QDs. The response of the isoenzyme without inductor in the presence of CdsSe (TGA), CdSSe-Cys, CdSSe-GA, CdSSe-GTO, CdSSe-GLT, and CdSSe-Lys QDs shows no statistical differences (Figure 8). In the presence of the inductor, there was six times increase in the activity for all CdSSe QDs, suggesting a good response by the HEP-G2 cells. The CdSSe QDs covered with cysteine, glutathione, and lysine do not change the enzymatic activity. These ligands are natural compounds inside cells and should not be recognized as xenobiotics.
On the other hand, CdSSe QDs covered with thioglycolic acid and glutaraldehyde decrease the activity of the CYP 1A1, indicating they are recognized as xenobiotics and interfere with the activity of the isoenzyme. Glutamic acid is one of the ligands attached to the CdSSe core by one carboxylic group exposing the other carboxylic residue. The CdSSe core surrounded by carboxylic interferes with the activity of this isoenzyme. The ligands that generate modifications in the CYP 1A1 response have been reported to be carcinogenic xenobiotics [26].
A similar pattern was observed for the CYP 1A2 isoenzyme (Figure 9). There were no differences among all CdSSe QDs. In this case, all cell ligands (cysteine, glutamic acid, glutathione, and lysine) do not interfere with the enzymatic activity. However, CdSSe is covered with thioglycolic acid, and glutaraldehyde decreases the enzyme’s activity. Some authors suggest that the activity of these complex enzymatic changes with the organic residues on the surface of nanoparticles [9].
Although the manufacturer proposes rifampicin as an inductor for the CYP 3A4 isoenzyme, there were no changes in the activity with the inductor for any CdSSe QDs and blank cells (Figure 10). All CdSSe QDs, functionalized and non-functionalized, interfere with the activity of this isoenzyme (without an inductor). The induction or inhibition is commonly related to the production of the enzyme by feedback signals [27,28]. Or, the compounds can act as competitive inhibitors for the active sites on the enzymes [28]. But, QDs can interfere directly with enzymatic activity. In the QDs, the electron/hole pair can produce ROS or interfere with the movement of electrons during the enzyme activity. The electron can be donated, or the hole can take an electron during the redox activity of the enzymes. In both cases, the flux of electrons is disturbed, decreasing the capacity of the isoenzyme to degrade the luciferin-PFTBE substrate.

4. Conclusions

Although the composition and crystal size are the principal parameters to change the optical and structural properties of the QDs, the ligands on the surface are the key for practical uses for many industrial and medical applications. Therefore, it is crucial for medical applications and environmental concerns to understand how these ligands influence the toxicity and response of detoxifying systems such as the cytochrome P450.
The FT-IR analysis confirmed that the thioglycolic residues on the original CdSSe QDs were interchanged by cysteine, glutamic acid, glutathione, glutaraldehyde, and lysine. And their interaction with HEPG2 cells was confirmed by fluorescence microscopy. The apoptosis followed by necrosis is responsible for the observed cytotoxicity. CdSSe-TGA and CdSSe-GLT affected all three isoenzymes. And all CdSSe QDs with different ligands affected the activity of the CYP3A4. Although competitive inhibition is an option, the interference of the electron/hole pair (on the surface of the CdSSe QDs) in the electron flux for the redox reaction of the CYP system is possible.

Author Contributions

Conceptualization, L.A.-N.; Funding acquisition, L.A.-N.; Methodology, J.C.-H.; Resources, L.A.-N.; Supervision, L.A.-N.; Writing—original draft, L.A.-N.; Writing—review & editing, L.A.-N. All authors have read and agreed to the published version of the manuscript.

Funding

The research reported in this publication was supported by an Institutional Development Award (IDeA) from the National Institute of General Medical Sciences of the National Institutes of Health under grant number P20 GM103475-19. However, the content is solely the authors’ responsibility and does not necessarily represent the official views of the National Institutes of Health.

Institutional Review Board Statement

Not applicable.

Informed Consent Statement

Not applicable.

Data Availability Statement

The datasets generated during the current study are available from the corresponding author upon reasonable request.

Acknowledgments

TEM work was performed at the National High Magnetic Field Laboratory, supported by National Science Foundation Cooperative Agreement No. DMR-1644779 and the State of Florida. The authors thank Monica Arroyo for editing the manuscript.

Conflicts of Interest

The authors declare no conflict of interest.

References

  1. Sun, C.; Cao, Z.; Wu, M.; Lu, C. Intracellular Tracking of Single Native Molecules with Electroporation-Delivered Quantum Dots. Anal. Chem. 2014, 86, 11403–11409. [Google Scholar] [CrossRef] [PubMed]
  2. Nguyen, K.C.; Willmore, W.G.; Tayabali, A.F. Cadmium telluride quantum dots cause oxidative stress leading to extrinsic and intrinsic apoptosis in hepatocellular carcinoma HepG2 cells. Toxicology 2013, 306, 114–123. [Google Scholar] [CrossRef] [PubMed]
  3. Goharshadi, E.K.; Goharshadi, K.; Moghayedi, M. The use of nanotechnology in the fight against viruses: A critical review. Coord. Chem. Rev. 2022, 464, 214559. [Google Scholar] [CrossRef]
  4. Wang, L.; Nagesha, D.K.; Selvarasah, S.; Dokmeci, M.R.; Carrier, R.L. Toxicity of CdSe Nanoparticles in Caco-2 Cell Cultures. J. Nanobiotechnology 2008, 6, 11. [Google Scholar] [CrossRef] [PubMed] [Green Version]
  5. Luo, Y.-H.; Wu, S.-B.; Wei, Y.-H.; Chen, Y.-C.; Tsai, M.-H.; Ho, C.-C.; Lin, S.-Y.; Yang, C.-S.; Lin, P. Cadmium-Based Quantum Dot Induced Autophagy Formation for Cell Survival via Oxidative Stress. Chem. Res. Toxicol. 2013, 26, 662–673. [Google Scholar] [CrossRef]
  6. Zheng, W.; Xu, Y.-M.; Wu, D.-D.; Yao, Y.; Liang, Z.-L.; Tan, H.W.; Lau, A.T.Y. Acute and chronic cadmium telluride quantum dots-exposed human bronchial epithelial cells: The effects of particle sizes on their cytotoxicity and carcinogenicity. Biochem. Biophys. Res. Commun. 2018, 495, 899–903. [Google Scholar] [CrossRef]
  7. Semashko, V.V.; Pudovkin, M.S.; Cefalas, A.-C.; Zelenikhin, P.V.; Gavriil, V.E.; Nizamutdinov, A.S.; Kollia, Z.; Ferraro, A.; Sarantopoulou, E. Tiny Rare-Earth Fluoride Nanoparticles Activate Tumour Cell Growth via Electrical Polar Interactions. Nanoscale Res. Lett. 2018, 13, 370. [Google Scholar] [CrossRef]
  8. Sharifi, S.; Behzadi, S.; Laurent, S.; Forrest, M.L.; Stroeve, P.; Mahmoudi, M. Toxicity of nanomaterials. Chem. Soc. Rev. 2012, 41, 2323–2343. [Google Scholar] [CrossRef] [Green Version]
  9. Chen, N.; He, Y.; Su, Y.; Li, X.; Huang, Q.; Wang, H.; Zhang, X.; Tai, R.; Fan, C. The cytotoxicity of cadmium-based quantum dots. Biomaterials 2012, 33, 1238–1244. [Google Scholar] [CrossRef]
  10. Zhang, F.; Yi, D.; Sun, H.; Zhang, H. Cadmium-based quantum dots: Preparation, surface modification, and applications. J. Nanosci. Nanotechnol. 2014, 14, 1409–1424. [Google Scholar] [CrossRef]
  11. Dai, M.-Q.; Yung, L.-Y.L. Ethylenediamine-Assisted Ligand Exchange and Phase Transfer of Oleophilic Quantum Dots: Stripping of Original Ligands and Preservation of Photoluminescence. Chem. Mater. 2013, 25, 2193–2201. [Google Scholar] [CrossRef]
  12. Munro, A.M.; Chandler, C.; Garling, M.; Chai, D.; Popovich, V.; Lystrom, L.; Kilina, S. Phenyldithiocarbamate Ligands Decompose During Nanocrystal Ligand Exchange. J. Phys. Chem. C 2016, 120, 29455–29462. [Google Scholar] [CrossRef]
  13. Knauf, R.R.; Lennox, J.C.; Dempsey, J.L. Quantifying Ligand Exchange Reactions at CdSe Nanocrystal Surfaces. Chem. Mater. 2016, 28, 4762–4770. [Google Scholar] [CrossRef]
  14. Nguyen, K.; Willmore, W.G.; Tayabali, A.F. Cadmium Telluride Quantum Dots Cause Oxidative Stress Leading to Extrinsic and Intrinsic Apoptosis in Hepatocellular Carcinoma HepG2 Cells. Free Radic. Biol. Med. 2012, 53, S139. [Google Scholar] [CrossRef]
  15. Chen, X.; Zhang, C.; Tan, L.; Wang, J. Toxicity of Co nanoparticles on three species of marine microalgae. Environ. Pollut. 2018, 236, 454–461. [Google Scholar] [CrossRef]
  16. Zhai, C.; Zhang, H.; Du, N.; Chen, B.; Huang, H.; Wu, Y.; Yang, D. One-Pot Synthesis of Biocompatible CdSe/CdS Quantum Dots and Their Applications as Fluorescent Biological Labels. Nanoscale Res. Lett. 2010, 6, 31. [Google Scholar] [CrossRef] [Green Version]
  17. Kodriano, Y.; Schmidgall, E.R.; Benny, Y.; Gershoni, D. Optical control of single excitons in semiconductor quantum dots. Semicond. Sci. Technol. 2014, 29, 53001. [Google Scholar] [CrossRef]
  18. Mrad, R.; Poggi, M.; Ben Chaâbane, R.; Negrerie, M. Role of surface defects in colloidal cadmium selenide (CdSe) nanocrystals in the specificity of fluorescence quenching by metal cations. J. Colloid Interface Sci. 2020, 571, 368–377. [Google Scholar] [CrossRef]
  19. Migneault, I.; Dartiguenave, C.; Bertrand, M.J.; Waldron, K.C. Glutaraldehyde: Behavior in aqueous solution, reaction with proteins, and application to enzyme crosslinking. Biotechniques 2004, 37, 790–796, 798–802. [Google Scholar] [CrossRef]
  20. Sotomayor, C.G.; Groothof, D.; Vodegel, J.J.; Eisenga, M.F.; Knobbe, T.J.; IJmker, J.; Lammerts, R.G.M.; de Borst, M.H.; Berger, S.P.; Nolte, I.M.; et al. Plasma cadmium is associated with increased risk of long-term kidney graft failure. Kidney Int. 2021, 99, 1213–1224. [Google Scholar] [CrossRef]
  21. Derfus, A.M.; Chan, W.C.W.; Bhatia, S.N. Probing the Cytotoxicity of Semiconductor Quantum Dots. Nano Lett. 2004, 4, 11–18. [Google Scholar] [CrossRef] [PubMed] [Green Version]
  22. Liu, Z.Q.; Li, H.L.; Zeng, X.J.; Lu, C.; Fu, J.Y.; Guo, L.J.; Kimani, W.M.; Yan, H.L.; He, Z.Y.; Hao, H.Q.; et al. Coupling phytoremediation of cadmium-contaminated soil with safe crop production based on a sorghum farming system. J. Clean. Prod. 2020, 275, 123002. [Google Scholar] [CrossRef]
  23. Ock, K.; Jeon, W.I.; Ganbold, E.O.; Kim, M.; Park, J.; Seo, J.H.; Cho, K.; Joo, S.-W.; Lee, S.Y. Real-time monitoring of glutathione-triggered thiopurine anticancer drug release in live cells investigated by surface-enhanced Raman scattering. Anal. Chem. 2012, 84, 2172–2178. [Google Scholar] [CrossRef] [PubMed]
  24. Messner, B.; Türkcan, A.; Ploner, C.; Laufer, G.; Bernhard, D. Cadmium overkill: Autophagy, apoptosis and necrosis signalling in endothelial cells exposed to cadmium. Cell. Mol. Life Sci. 2016, 73, 1699–1713. [Google Scholar] [CrossRef] [Green Version]
  25. Zhou, G.; Liu, J.; Li, X.; Sang, Y.; Zhang, Y.; Gao, L.; Wang, J.; Yu, Y.; Ge, W.; Sun, Z.; et al. Silica nanoparticles inducing the apoptosis via microRNA-450b-3p targeting MTCH2 in mice and spermatocyte cell. Environ. Pollut. 2021, 277, 116771. [Google Scholar] [CrossRef]
  26. Kwon, Y.-J.; Shin, S.; Chun, Y.-J. Biological roles of cytochrome P450 1A1, 1A2, and 1B1 enzymes. Arch. Pharmacal Res. 2021, 44, 63–83. [Google Scholar] [CrossRef]
  27. Zhang, L.; Gan, J.; Ke, C.; Liu, X.; Zhao, J.; You, L.; Yu, J.; Wu, H. Identification and expression profile of a new cytochrome P450 isoform (CYP414A1) in the hepatopancreas of Venerupis (Ruditapes) philippinarum exposed to benzo[a]pyrene, cadmium and copper. Environ. Toxicol. Pharmacol. 2012, 33, 85–91. [Google Scholar] [CrossRef]
  28. Boonprasert, K.; Satarug, S.; Morais, C.; Gobe, G.C.; Johnson, D.W.; Na-Bangchang, K.; Vesey, D.A. The stress response of human proximal tubule cells to cadmium involves up-regulation of haemoxygenase 1 and metallothionein but not cytochrome P450 enzymes. Toxicol. Lett. 2016, 249, 5–14. [Google Scholar] [CrossRef] [Green Version]
Figure 1. UV-VIS absorption spectra of functionalized and non-functionalized CdSSe QDs.
Micro 03 00027 g001
Figure 2. Fluorescence spectra of functionalized and non-functionalized CdSSe QDs. The excitation wavelength was 380 nm.
Micro 03 00027 g002
Figure 3. HR-TEM images of the (a) CdSSe, (b) CdSSe-GTO and (c) CdSSe GLT QDs.
Micro 03 00027 g003aMicro 03 00027 g003b
Figure 4. FT-IR spectra of the functionalized and non-functionalized CdSSe QDs. Blue spectra are the pure ligands. Orange spectra are the ligands on the QDs surface. Y-axis has been removed for comparison purposes. The changes in the spectra (compared to TGA) and the presence of the characteristic bands for each pure ligand on the surface of QDs confirmed the ligand exchange (functionalization).
Micro 03 00027 g004
Figure 5. Fluorescence microscopic images of HEP-G2 cells exposed to 10 mg/L of CdSSe QDs covered with TGA (40×). (a) low light and (b) dark. Excitation wavelength 365 nm (50 nm) and emission above 450 nm.
Micro 03 00027 g005
Figure 6. Viability (%) of HEPG2 cells exposed to functionalized and non-functionalized CdSSe QDs, and cadmium solution at concentrations between 0.001 and 10 mg/L for 24 h. * Statistical difference.
Micro 03 00027 g006
Figure 7. Luminescence (apoptosis) and fluorescence (necrosis) of HEPG2 cells exposed to CdSSe QDs (TGA ligand) and Cd+2 (2.0 mg/L). Fluorescence was recorded using 485 nm of excitation and 525–530 nm of emission.
Micro 03 00027 g007
Figure 8. Response of the CYP 1A1 (luciferin-CEE substrate) isoenzymes of HEPG2 cells exposure to functionalized and non-functionalized CdSSe QDs.
Micro 03 00027 g008
Figure 9. Response of the CYP 1A2 (luciferin-1A2 substrate) isoenzymes of HEPG2 cells exposure to functionalized and non-functionalized CdSSe QDs.
Micro 03 00027 g009
Figure 10. Response of the CYP 3A4 (luciferin-PFTBE substrate) isoenzymes of HEPG2 cells exposure to functionalized and non-functionalized CdSSe QDs.
Micro 03 00027 g010
Disclaimer/Publisher’s Note: The statements, opinions and data contained in all publications are solely those of the individual author(s) and contributor(s) and not of MDPI and/or the editor(s). MDPI and/or the editor(s) disclaim responsibility for any injury to people or property resulting from any ideas, methods, instructions or products referred to in the content.

