1. Introduction
Chloroquine, widely used as a malaria drug, exhibits many therapeutic mechanisms of action, including immunostimulatory effects, that may be beneficial in treating various diseases [
1]. For example, chloroquine can block endocytosis, interrupt autophagy, and modulate antitumor immune responses [
2,
3,
4]. However, some patients who receive chloroquine (or its derivative hydroxychloroquine) exhibit adverse side effects, such as cardiotoxicity and retinopathy [
5].
To mitigate some of these side effects, nanomedicine may provide potential solutions by using liposomes as drug carriers to take advantage of their associated pharmacokinetics and pharmacodynamics [
6]. Liposome formulations have been developed for various applications, including vaccines, diagnostic imaging, and gene therapy [
7,
8,
9,
10,
11]. Here, we report on the fabrication and characterization of liposomes encapsulating chloroquine.
Previous reports demonstrated the feasibility of encapsulating chloroquine within liposomes for malaria and cancer treatment. However, these reports rely on combinations of involved procedures for liposome fabrication, such as transmembrane pH-gradients, probe tip sonication, dialysis, and ultracentrifugation [
12,
13,
14]. Furthermore, chloroquine liposomes have been shown to act upon immune cells therapeutically, but the acute cytotoxicity in macrophages has not been fully assessed and systematically compared to free chloroquine [
15]. We report here a robust extrusion procedure for efficiently synthesizing chloroquine encapsulating liposomes with diameters of ~100 nm and further evaluate drug release kinetics and acute cytotoxicity in model macrophages.
2. Materials and Methods
Preparation of Chloroquine Encapsulating Liposomes. For liposome preparation, DSPC (1,2-distearoyl-sn-glycero-3-phosphocholine, Avanti Polar Lipids Inc., Birmingham, AL, USA), Cholesterol(Avanti Polar Lipids Inc., Birmingham, AL, USA), and Methoxy-PEG2kDa-DSPE (Laysan Bio Inc., Arab, AL, USA) were mixed with chloroform at 10 mg/mL at a molar ratio of 3.8:2.6:1.0 (DSPC):(Cholesterol):(Methoxy-PEG
2kDa-DSPE) and then transferred into a 5-mL round-bottom flask. The chloroform was evaporated using a rotary evaporator to form a thin film of dried lipid mixture. Next, 500 µL of 1x PBS containing 40 mg/mL of chloroquine phosphate (Sigma-Aldrich, St. Louis, MO, USA) and adjusted to 60 °C was added to the 5-mL round-bottom flask to cover the dried lipid film. The tip of the 5-mL round bottom flask was then immersed in a water bath at 60 °C and agitated by hand via shaking in circular motions for 1 min. The tip of the flask was then immersed in a sonicating bath (Branson Ultrasonic Cleaner, Emerson, ST. Louis, MO, USA) for 1 min. The steps were repeated two times to fully resuspend the dried lipid film in the PBS/chloroquine mixture, forming polydisperse multilamellar lipid vesicles. This polydisperse mixture of lipid vesicles was then extruded using the Avanti Polar Lipids Mini Extruder set (Avanti Polar Lipids Inc., Birmingham, AL, USA. The extruder block was set on the hotplate (70 °C) to warm up, while the Mini Extruder itself was assembled following the manufacturer’s instructions with a polycarbonate membrane (100-nm, Avanti Polar Lipids Inc., Birmingham, AL, USA) prewetted in 1x PBS. The mixture of multilamellar lipid vesicles was then transferred from the 5 mL round-bottom flask into a 1 mL gas-tight syringe. The syringe was inserted into one end of the Mini Extruder, with an empty syringe (1 mL) in the other end. The Mini Extruder was then placed into the pre-warmed heating block (70 °C) and left for 10 min to equilibrate. The mixture of multilamellar lipid vesicles was then passed through the extruder into the other syringe. The extrusion process was completed after 21 passages. After the extrusion process, the solution was noticeably clearer than at the beginning due to the formation of monodisperse liposomes with an average diameter of 100 nm. The syringe containing the extruded liposome solution was then removed from the extruder. The liposome solution was transferred into a 1.5 mL microcentrifuge tube. The chemical structures of the lipids used for liposome synthesis, as well as the structure of chloroquine, are shown in
Figure S1.
Purification of Chloroquine Encapsulating Liposomes. For chloroquine liposome purification, the previously extruded liposome dispersion volume was measured and transferred into a 100 kDa centrifugal filter-0.5 mL (Amicon Ultra, MilliporeSigma, Burlington, MA, USA) and spun at 14,000× g for 20 min. The supernatant volume was measured and placed in a 1.5 mL tube. The wash’s supernatant chloroquine concentration was measured using UV-Vis analysis (absorption peak at 343 nm). The volume of supernatant removed from the previous wash was added back to the liposome solution using 1x PBS, and then the washing and measuring steps were repeated until the concentration of chloroquine in the supernatant was around 2 mM (about six washes). Next, a size exclusion purification column (Illustra NAP-5, GE Healthcare, Chicago, IL, USA) was set up on a support stand and prepared following the manufacturer’s instructions. The previously filtered liposome solution was passed through the size exclusion column and collected in a 50-mL tube. The collected liposome solution volume was around 1.5 mL, which required the liposomes to be isolated using another 100 kDa centrifugal filter-0.5 mL (Amicon Ultra, MilliporeSigma, Burlington, MA, USA). The isolation process took three spins at 14,000× g for 20 min. A final wash was completed by placing an amount of 1x PBS that returned the liposome solution to its original volume and spinning it in the filter one more time. Lastly, 1x PBS was added to the filtered liposome dispersion, bringing its volume to the initial volume of ~1.5 mL.
Dynamic Light Scattering and Cryogenic Transmission Electron Microscopy (Cryo TEM). A Malvern ZetaSizer Nano ZS was used for dynamic light scattering and zeta potential measurements (
Figure S2). For DLS, standard 1.5-mL PMMA cuvettes were used to measure liposomes hydrodynamic diameter in 1x PBS. For measuring zeta potential, disposable folded Malvern capillary cells (DTS 1070, Malvern, Cambridge, MA, USA) were used. To perform cryogenic transmission electron microscopy, C-Flat multihole copper grids were glow discharged using the GloQube Plus to hydrophilize the carbon film. The Leica EM GP Plunge Freezer (Leica Microsystems, Deerfield, IL, USA) was prepared by adding liquid nitrogen, liquid ethane, and water to the designated chambers until full. The system is then left alone until the liquid nitrogen chamber has reached −180 °C and the humidity has reached 99%. A grid is then attached to the plunge freezer using forceps, and 3 µL of the sample is applied to form a thin convex droplet. The droplet is blotted off by the Leica system once on the front and twice on the back for one second each: the grid is blotted on the back to force the sample through the grid holes. Following the plunging of the sample into the liquid ethane chamber, the grid is transferred into the grid holder in preparation for imaging. The grid samples prepared using cryo plunge freezing were imaged using a JEOL TEM 2010-F Field Emission Microscope (Peabody, MA, USA) operated at 200 kV. The images were captured with a Direct Electron DE-12 camera (San Diego, CA, USA). Liposome diameters and bilayer thicknesses were assessed using ImageJ (v1.53q, National Institutes of Health, Bethesda, MD, USA).
Chloroquine Liposomal Encapsulation via HPLC. All chloroquine samples were run on Alltima HP C18 Hi-Load analytical column 4.6 × 250 mm (Avantor, Radnor Township, PA, USA) with an Agilent 1260 Infinity II HPLC system (Santa Clara, CA, USA). The mobile phase consisted of HPLC-grade two phases: A) nanopure water with 0.01% triethylamine adjusted to pH 3.0 with phosphoric acid and B) acetonitrile. The flow rate was 2 mL/min. The detection wavelengths were set at 343 nm and 280 nm. The method that was used proceeded for the first 5 min with a 100% aqueous phase. After 5 min, the device was programmed to ramp up to 100% organic phase until 50 min had elapsed. Five minutes later, the aqueous phase was reestablished and equilibrated for an additional 5 min. Before HPLC analysis, chloroquine liposome dispersions were diluted 10-fold by taking an aliquot of 100 µL of chloroquine liposomes and adding that into 900 µL of 10% Triton X-100 to lyse the liposomes and release all chloroquine followed by brief sonication. Accounting for the dilution factor, we calculated the encapsulated chloroquine within liposomes based on the slope of a chloroquine standard curve in 10% Triton-X. At 13.6 min, a sharp peak eluted at 343 nm, which was determined to be chloroquine.
Chloroquine Liposomal Encapsulation via UV-Vis Spectrophotometry. Chloroquine encapsulation of the prepared and sized liposomes was determined by a lysing process using 10% Triton X-100 solution, similar to the method used for HPLC analysis. Prior to UV-Vis spectrophotometry analysis, chloroquine liposome mixtures were diluted by taking a 25 µL aliquot of the chloroquine liposome solution and adding that to 975 µL of 10% Triton X-100 in a 1.5-mL microcentrifuge tube. The tube was then agitated for 5 min using sonication. From this diluted lysed mixture, a sample of 100 µL of the lysed liposomes was then taken, and the chloroquine concentration encapsulated in the liposomes was measured using UV-Vis spectrophotometry analysis in a semi-micro quartz cuvette (absorbance peak of chloroquine at 343 nm,
Figure S3) on an Agilent Cary 5000 UV-Vis-NIR spectrophotometer (Santa Clara, CA, USA). A calibration curve based on various chloroquine concentrations was generated to obtain the molar decadic extinction coefficient of chloroquine, which was applied to determine the concentrations of chloroquine in lysed liposomes accounting for the dilution factor and using Beer Lambert’s law. Additional Methods & Materials are available in the
Supporting Information.
3. Results and Discussion
Chloroquine encapsulating liposomes were synthesized via hydration of a dried lipid film with chloroquine dissolved in 1x PBS. Based on previous reports, we used a lipid composition consisting of DSPC: cholesterol: mPEG2kDa-DSPE with a 3.8:2.6:1.0 molar (see
Figure S1 for chemical structures) [
11]. We used a robust extrusion process to obtain uniform liposomes with diameters of ~100 nm. To remove unencapsulated chloroquine, the liposomes were washed extensively using a multistep centrifugation filtering process followed by size exclusion chromatography. As a control group, we prepared liposomes without chloroquine to effectively encapsulate 1x PBS aqueous buffer.
Dynamic light scattering (DLS) was used to measure liposomes’ hydrodynamic diameter (HDD) with and without chloroquine. Liposomes without chloroquine had an average HDD of 115 nm. In comparison, chloroquine-liposomes had an average HDD of 105 nm, each with polydispersity indexes (PDI) below 0.1, indicating narrow liposome size distribution and colloidal stability (
Figure S2). The zeta potential of the methoxy-terminated poly(ethylene glycol) PEG-modified liposomes was near neutral (
Figure S2).
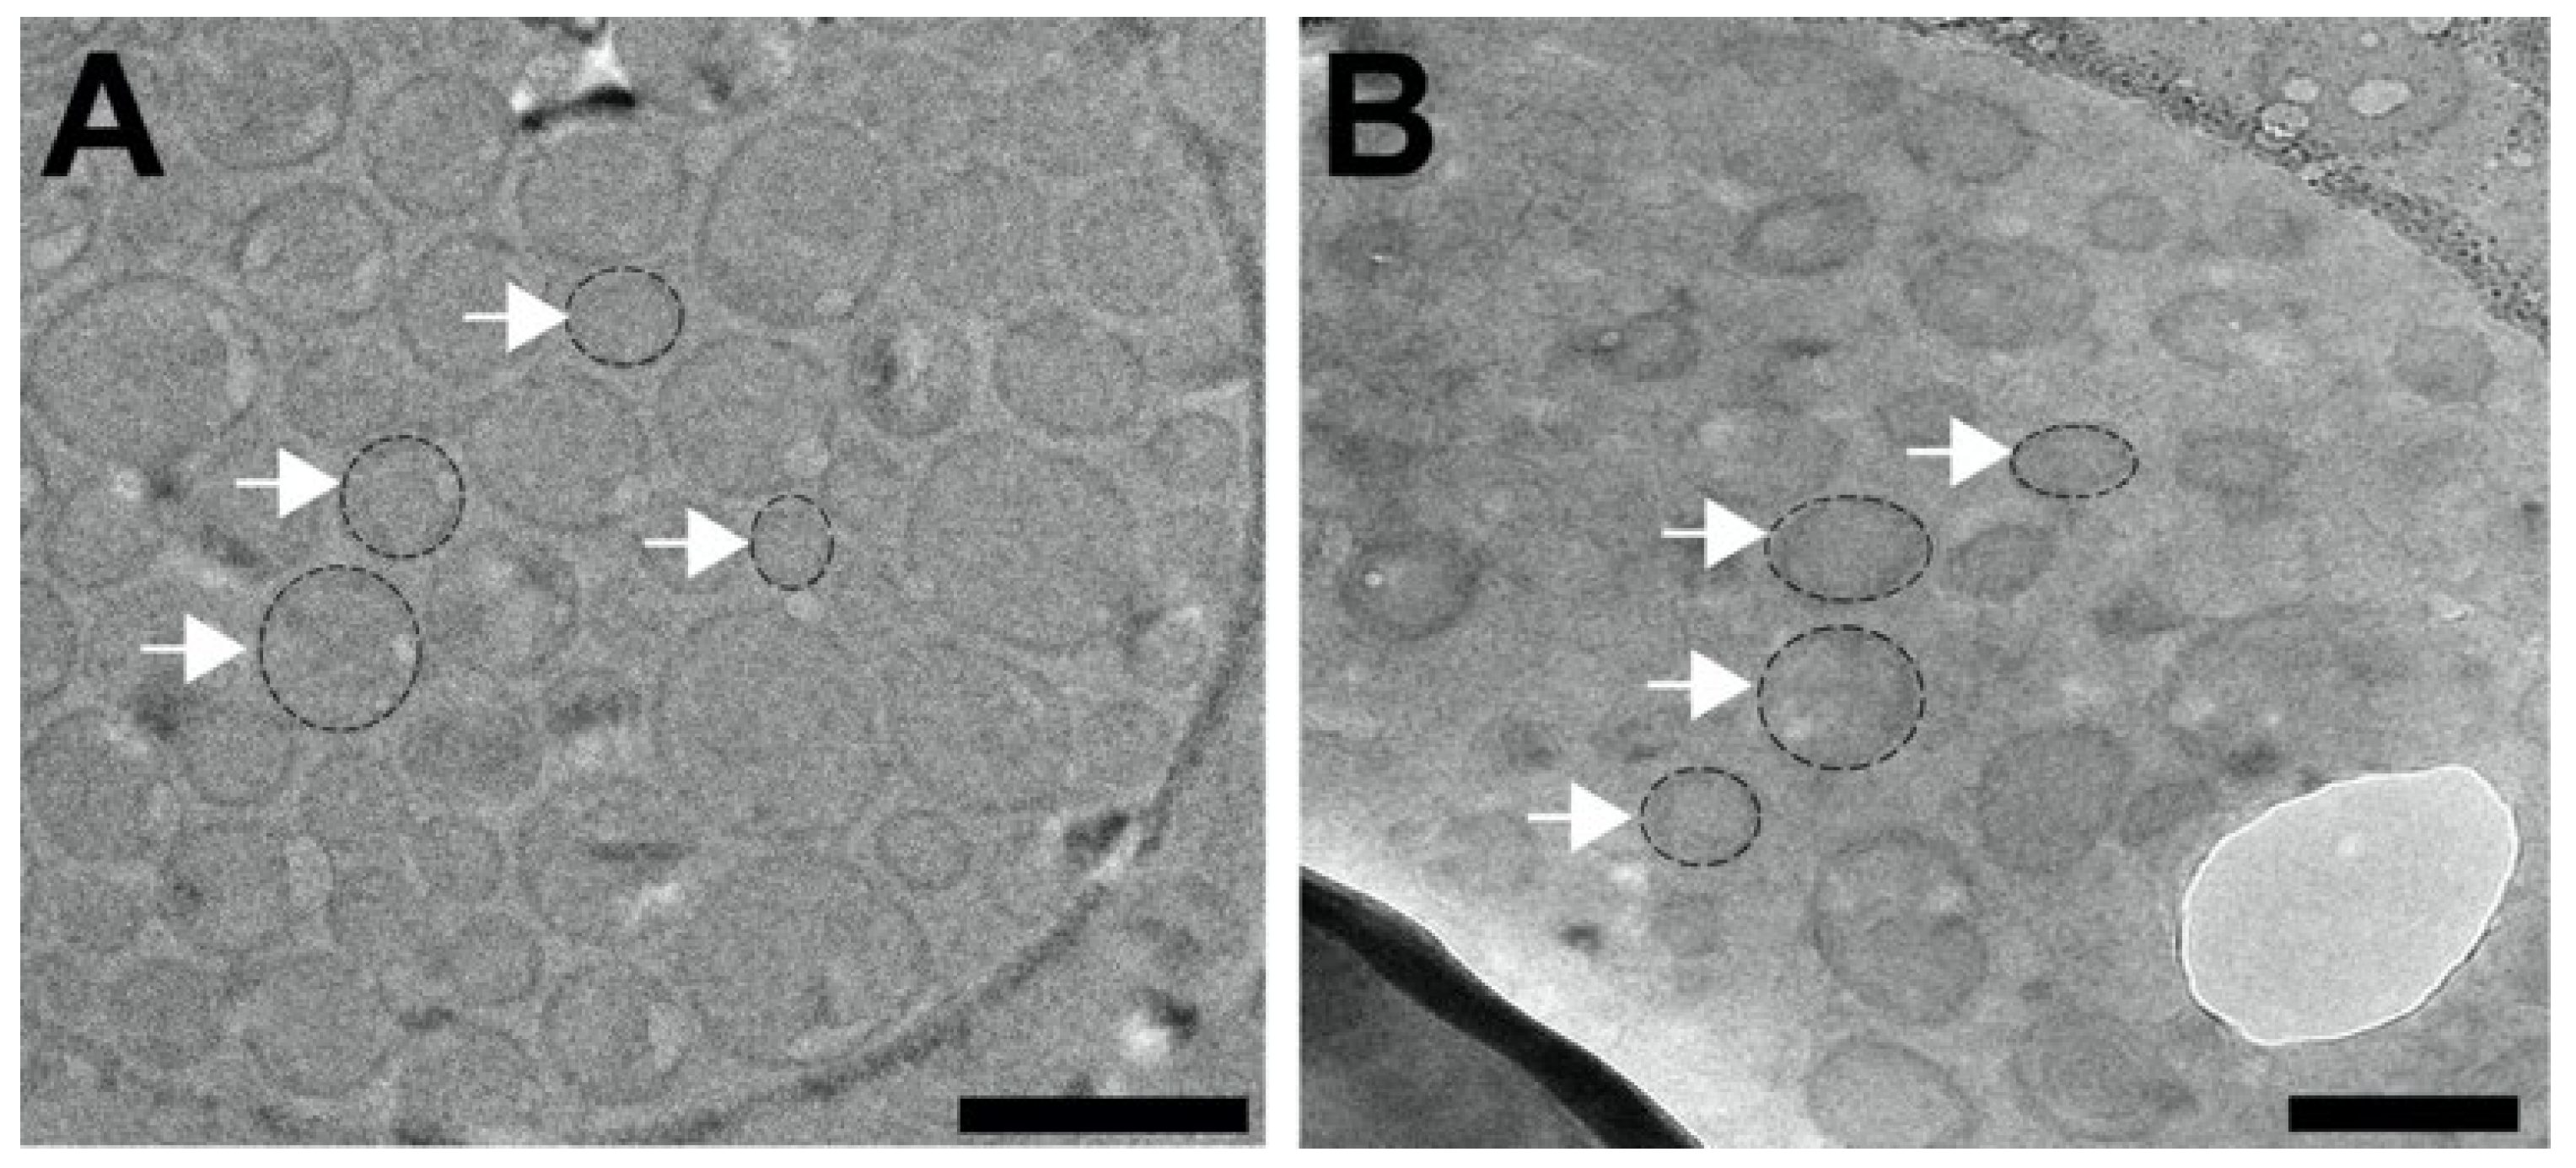
To corroborate the DLS findings, cryogenic transmission electron microscopy (Cryo-EM) was employed (
Figure 1). Cryo-plunging of aqueous liposome dispersions in liquid ethane (melting point −188 °C) vitrifies the liposomes, which preserves morphology and eliminates potential structural changes that may arise with methods that involve negative staining, drying, or other procedures commonly used in conventional TEM. Cryo-EM imaging confirmed that liposomes were unilamellar vesicles with narrow size distribution (
Figure 1). Using ImageJ, we determined that liposomes without chloroquine were, on average, 115 nm in diameter (
n = 113), while liposomes encapsulating chloroquine exhibited an average diameter of 103 nm (
n = 113). Our Cryo-EM results were in close agreement with the observed HDD results obtained by DLS. From our Cryo-EM studies, we collected additional quantitative information about the liposome structure. In liposomes without chloroquine, the unilamellar lipid bilayer was measured to be 10 ± 2 nm in width, while the lipid bilayer of chloroquine liposomes exhibited 10 ± 3 nm in width. These results indicate that chloroquine encapsulation did not alter the thickness and structure of the unilamellar lipid bilayer surrounding the vesicles (
Figure 1).
After confirming liposome size and structure, we determined how much chloroquine was encapsulated in liposomes. First, liposomal lipid bilayer membranes were disrupted with the non-ionic surfactant Triton X-100 followed by brief sonication. Upon addition of Triton X-100 to the liposomes, nanoparticle light scattering peaks were undetectable on DLS, indicating efficient liposome lysis and release of chloroquine content (data not shown). The concentration of chloroquine in the diluted lysed liposome Triton X-100 mixture was determined via analytical reverse-phase high-performance liquid chromatography (HPLC) and compared to a chloroquine standard curve comprising different concentrations. Using an organic-aqueous gradient, HPLC efficiently separated chloroquine, Triton X-100, and the lipid components to quantify the chloroquine content. Based on the lipid molar ratios and the liposome membrane thickness described above, we estimated that the total number of liposomes was ~1.9 × 10
14 per mL. We then calculated that each liposome encapsulated, on average, ~2.7 × 10
−15 mol of chloroquine based on three independently prepared liposome batches. These findings were corroborated by a second quantitative method. Briefly, we first determined chloroquine’s molar decadic extinction coefficient at 343 nm to be 16,514 M
−1cm
−1 (
Figure S3). Then, we used UV-Vis spectrophotometry to determine the chloroquine content in diluted lysed liposome samples and calculated the corresponding chloroquine content based on the Beer-Lambert relationship. We determined that, on average, ~2.4 × 10
−15 mol of chloroquine were encapsulated on a per liposome basis, which was in close agreement with the HPLC results.
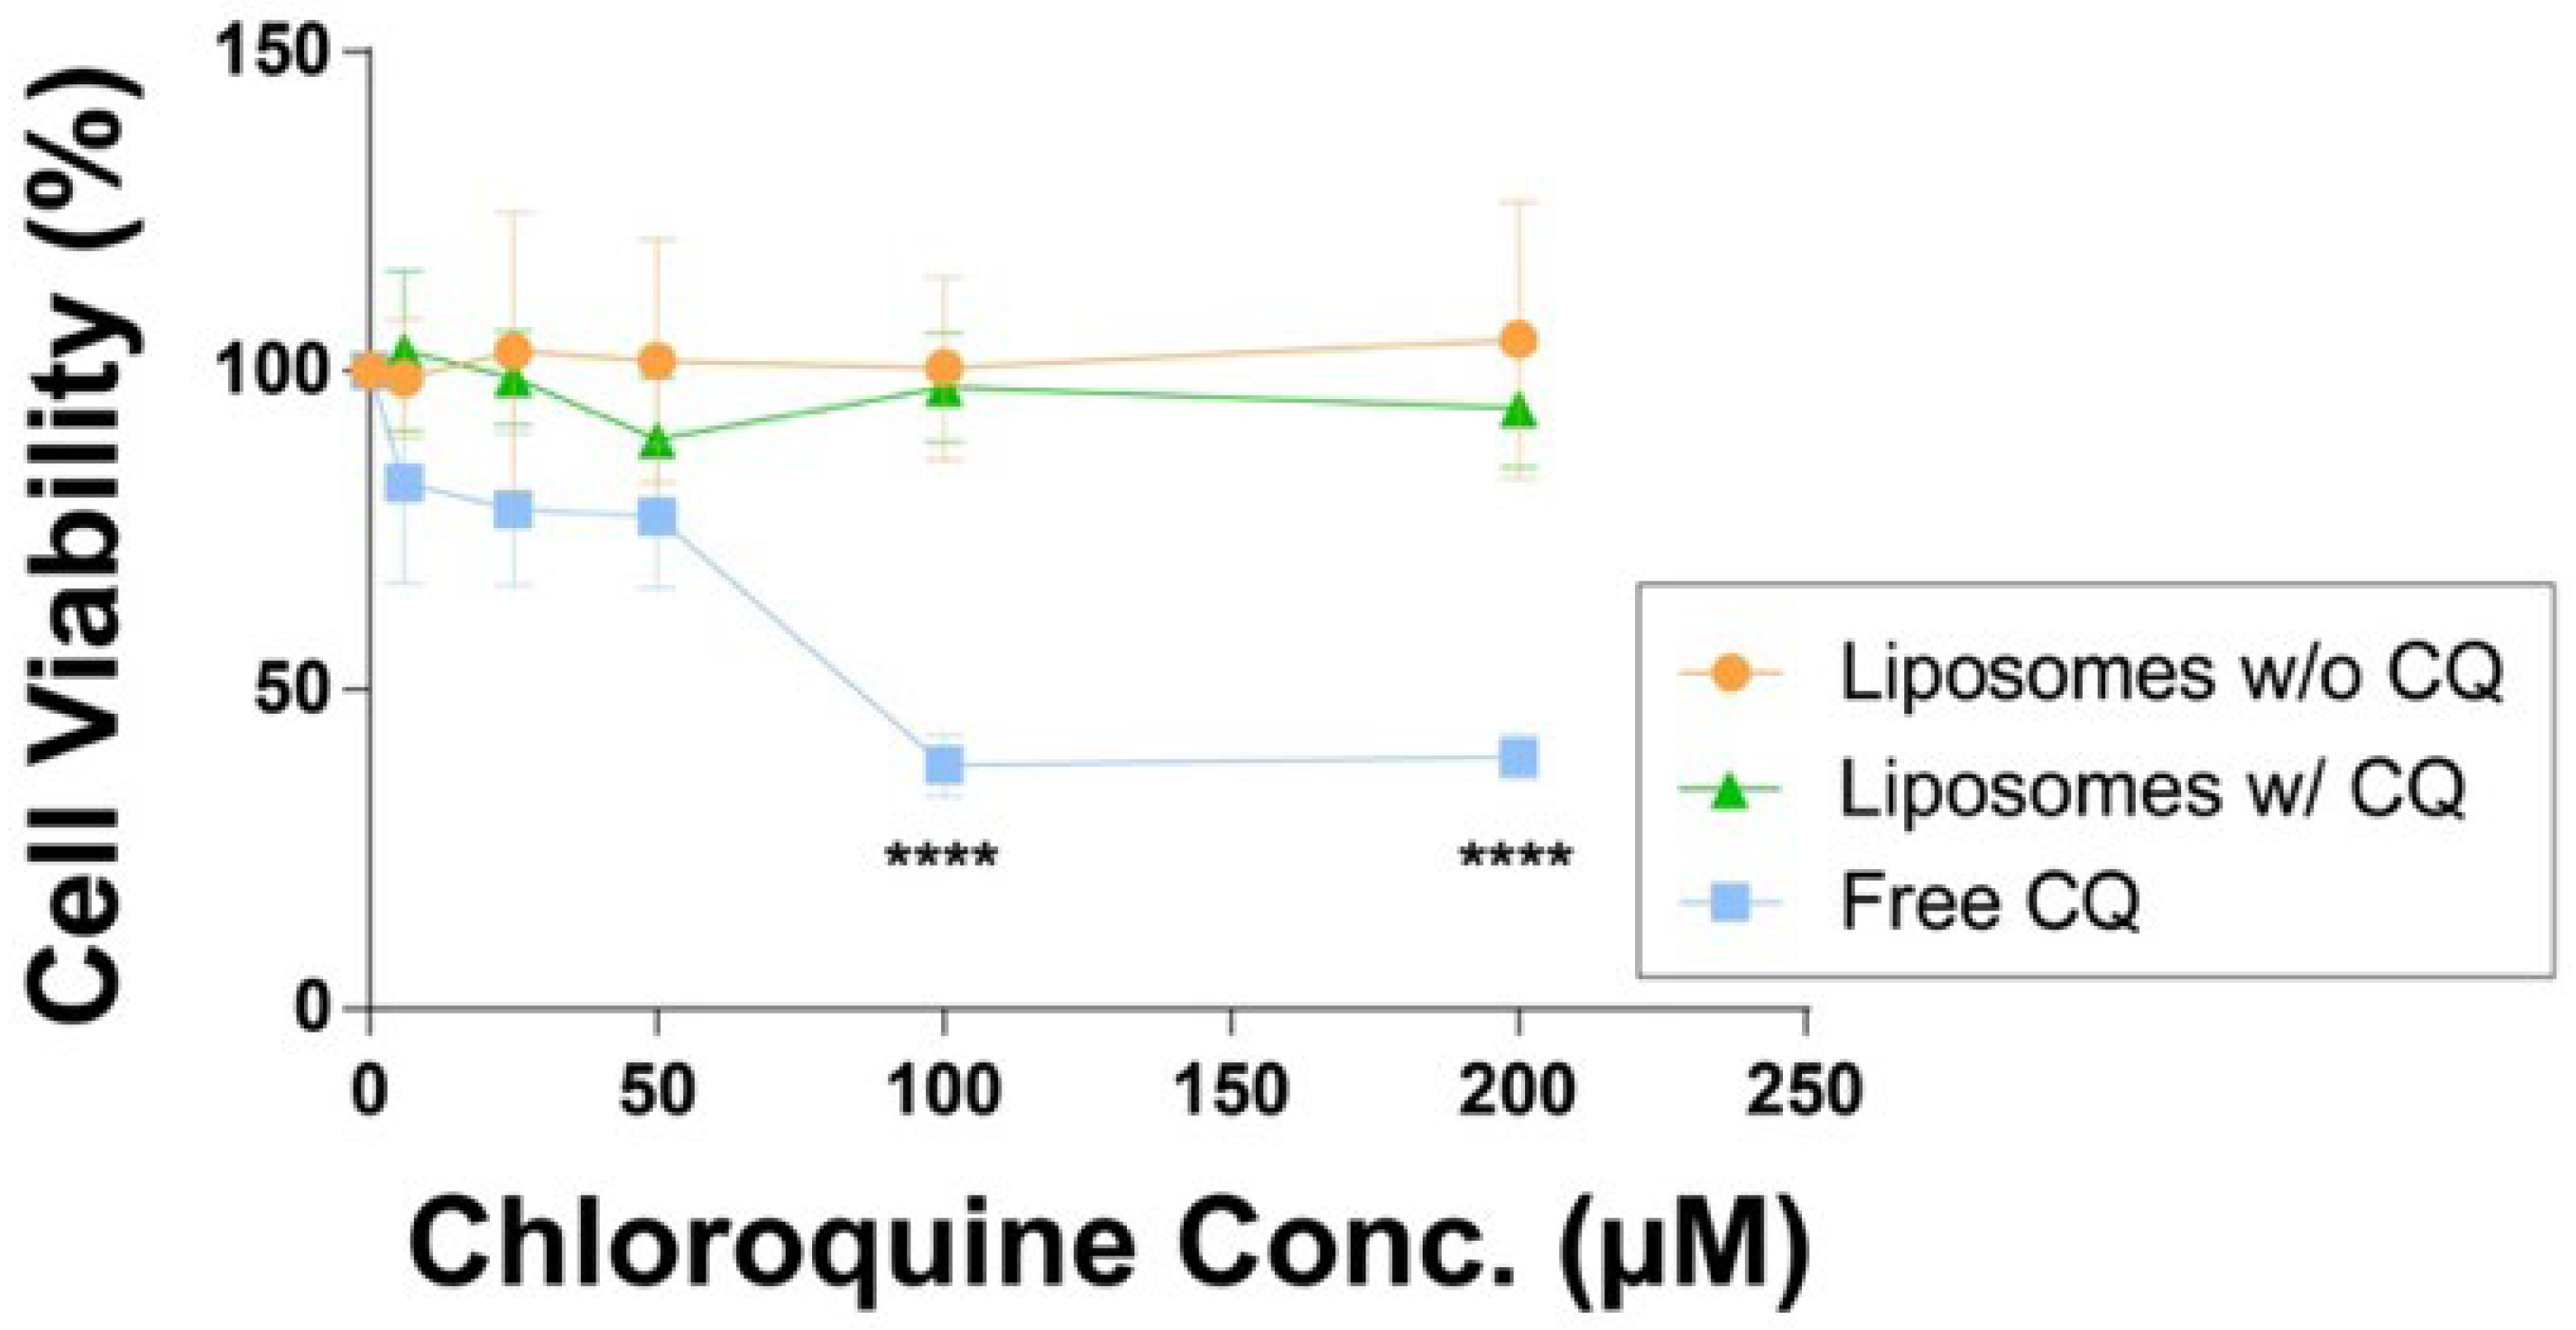
After the liposome physicochemical properties and chloroquine content were characterized, we evaluated the associated acute cytotoxicity in cell culture using model murine macrophages (RAW 264.7, ATCC, Manassas, VA, USA). The results were then compared to two control groups that used free unencapsulated chloroquine at equivalent drug concentrations and liposomes without chloroquine to determine the potential cytotoxicity of the liposome lipid composition. As shown in
Figure 2, free chloroquine showed a significant (
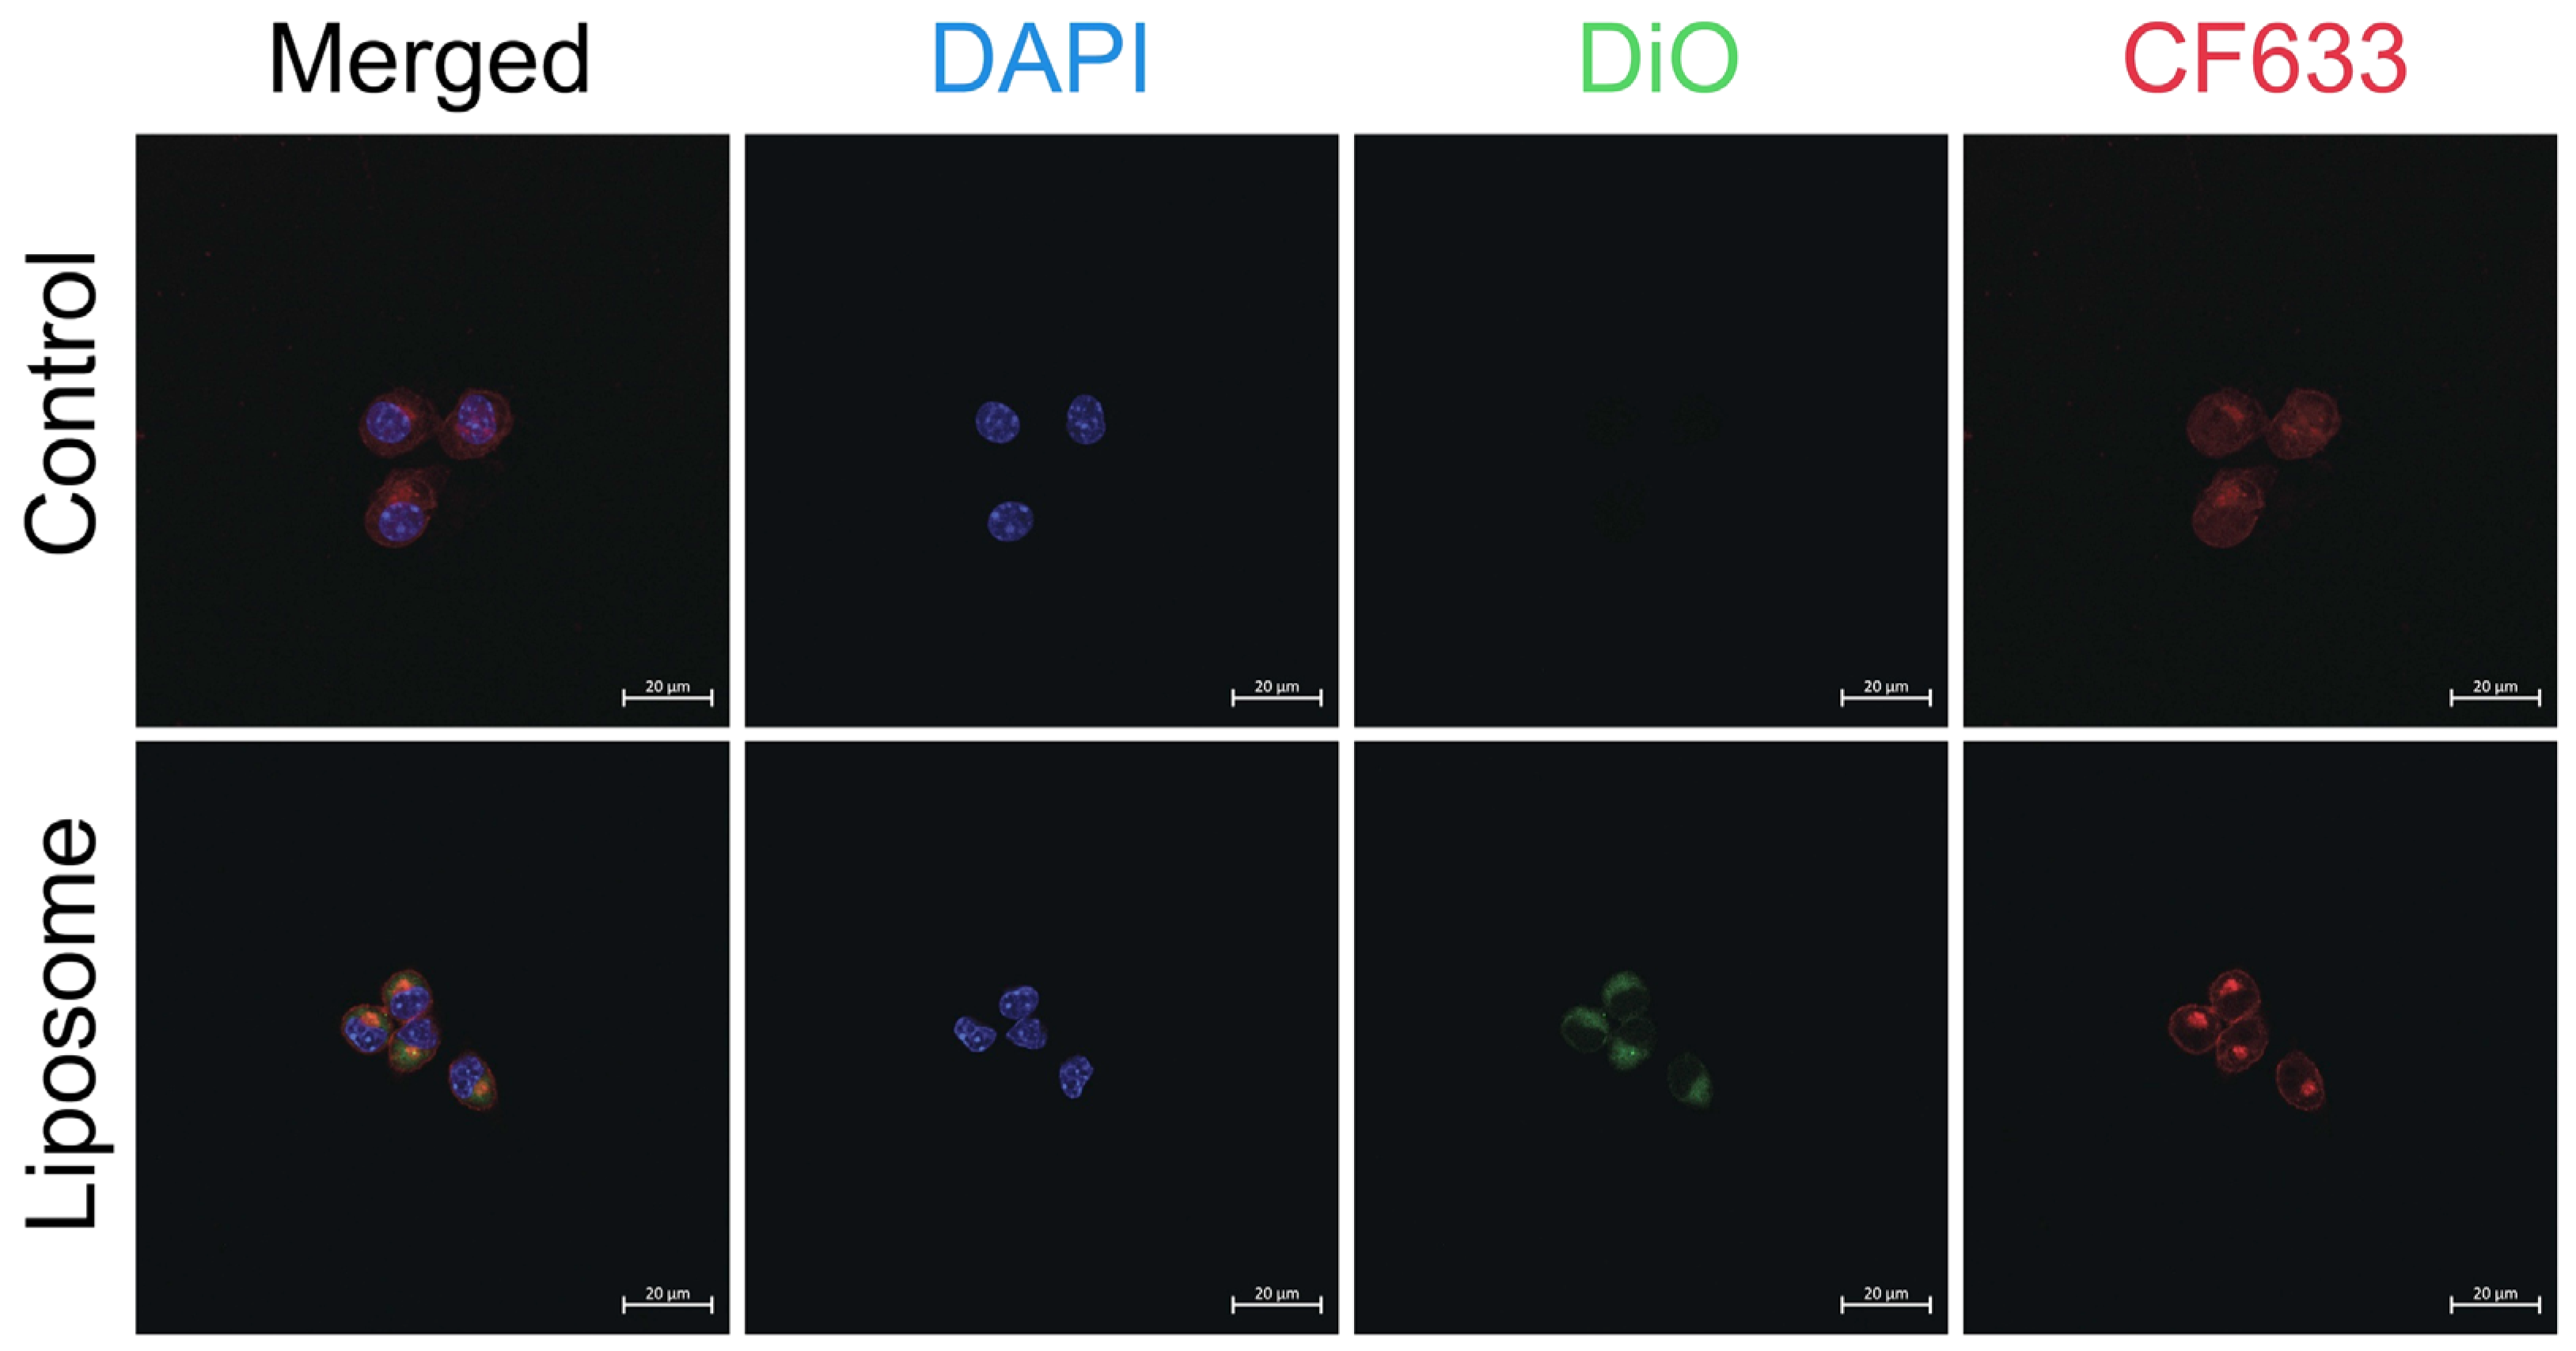
p < 0.0001) reduction in cell viability of ~70% at concentrations of 100 µM and 200 µM compared to liposomal formulations at equivalent chloroquine concentrations. The intracellular uptake of liposomes is demonstrated in
Figure 3 using confocal laser scanning microscopy.
Based on these cell viability data, we determined the half maximal inhibitory concentration (IC
50) for free unencapsulated chloroquine to be ~57 µM (
Figure S4). In contrast, chloroquine encapsulated in liposomes did not exhibit a significant reduction in cell viability (>90% for all tested conditions). In addition, no statistically significant differences in cell viability were observed between liposomes without and with chloroquine at any tested concentration. These findings demonstrate that the acute cytotoxic potential of chloroquine can be effectively mitigated upon liposomal encapsulation. Moreover, our results showed that free unencapsulated chloroquine could reduce macrophage viability substantially within 8 h at 100 µM (
Figure 2). Macrophages are a critical component in innate immunity and act as a first line of defense against pathogens and recruit other lymphocytes to the site of infection [
16,
17,
18]. As demonstrated in our study, liposomes prevented acute cytotoxicity of chloroquine compared to our control group (free chloroquine). This result indicates that therapeutic chloroquine doses may be delivered more safely to macrophages through liposomes.
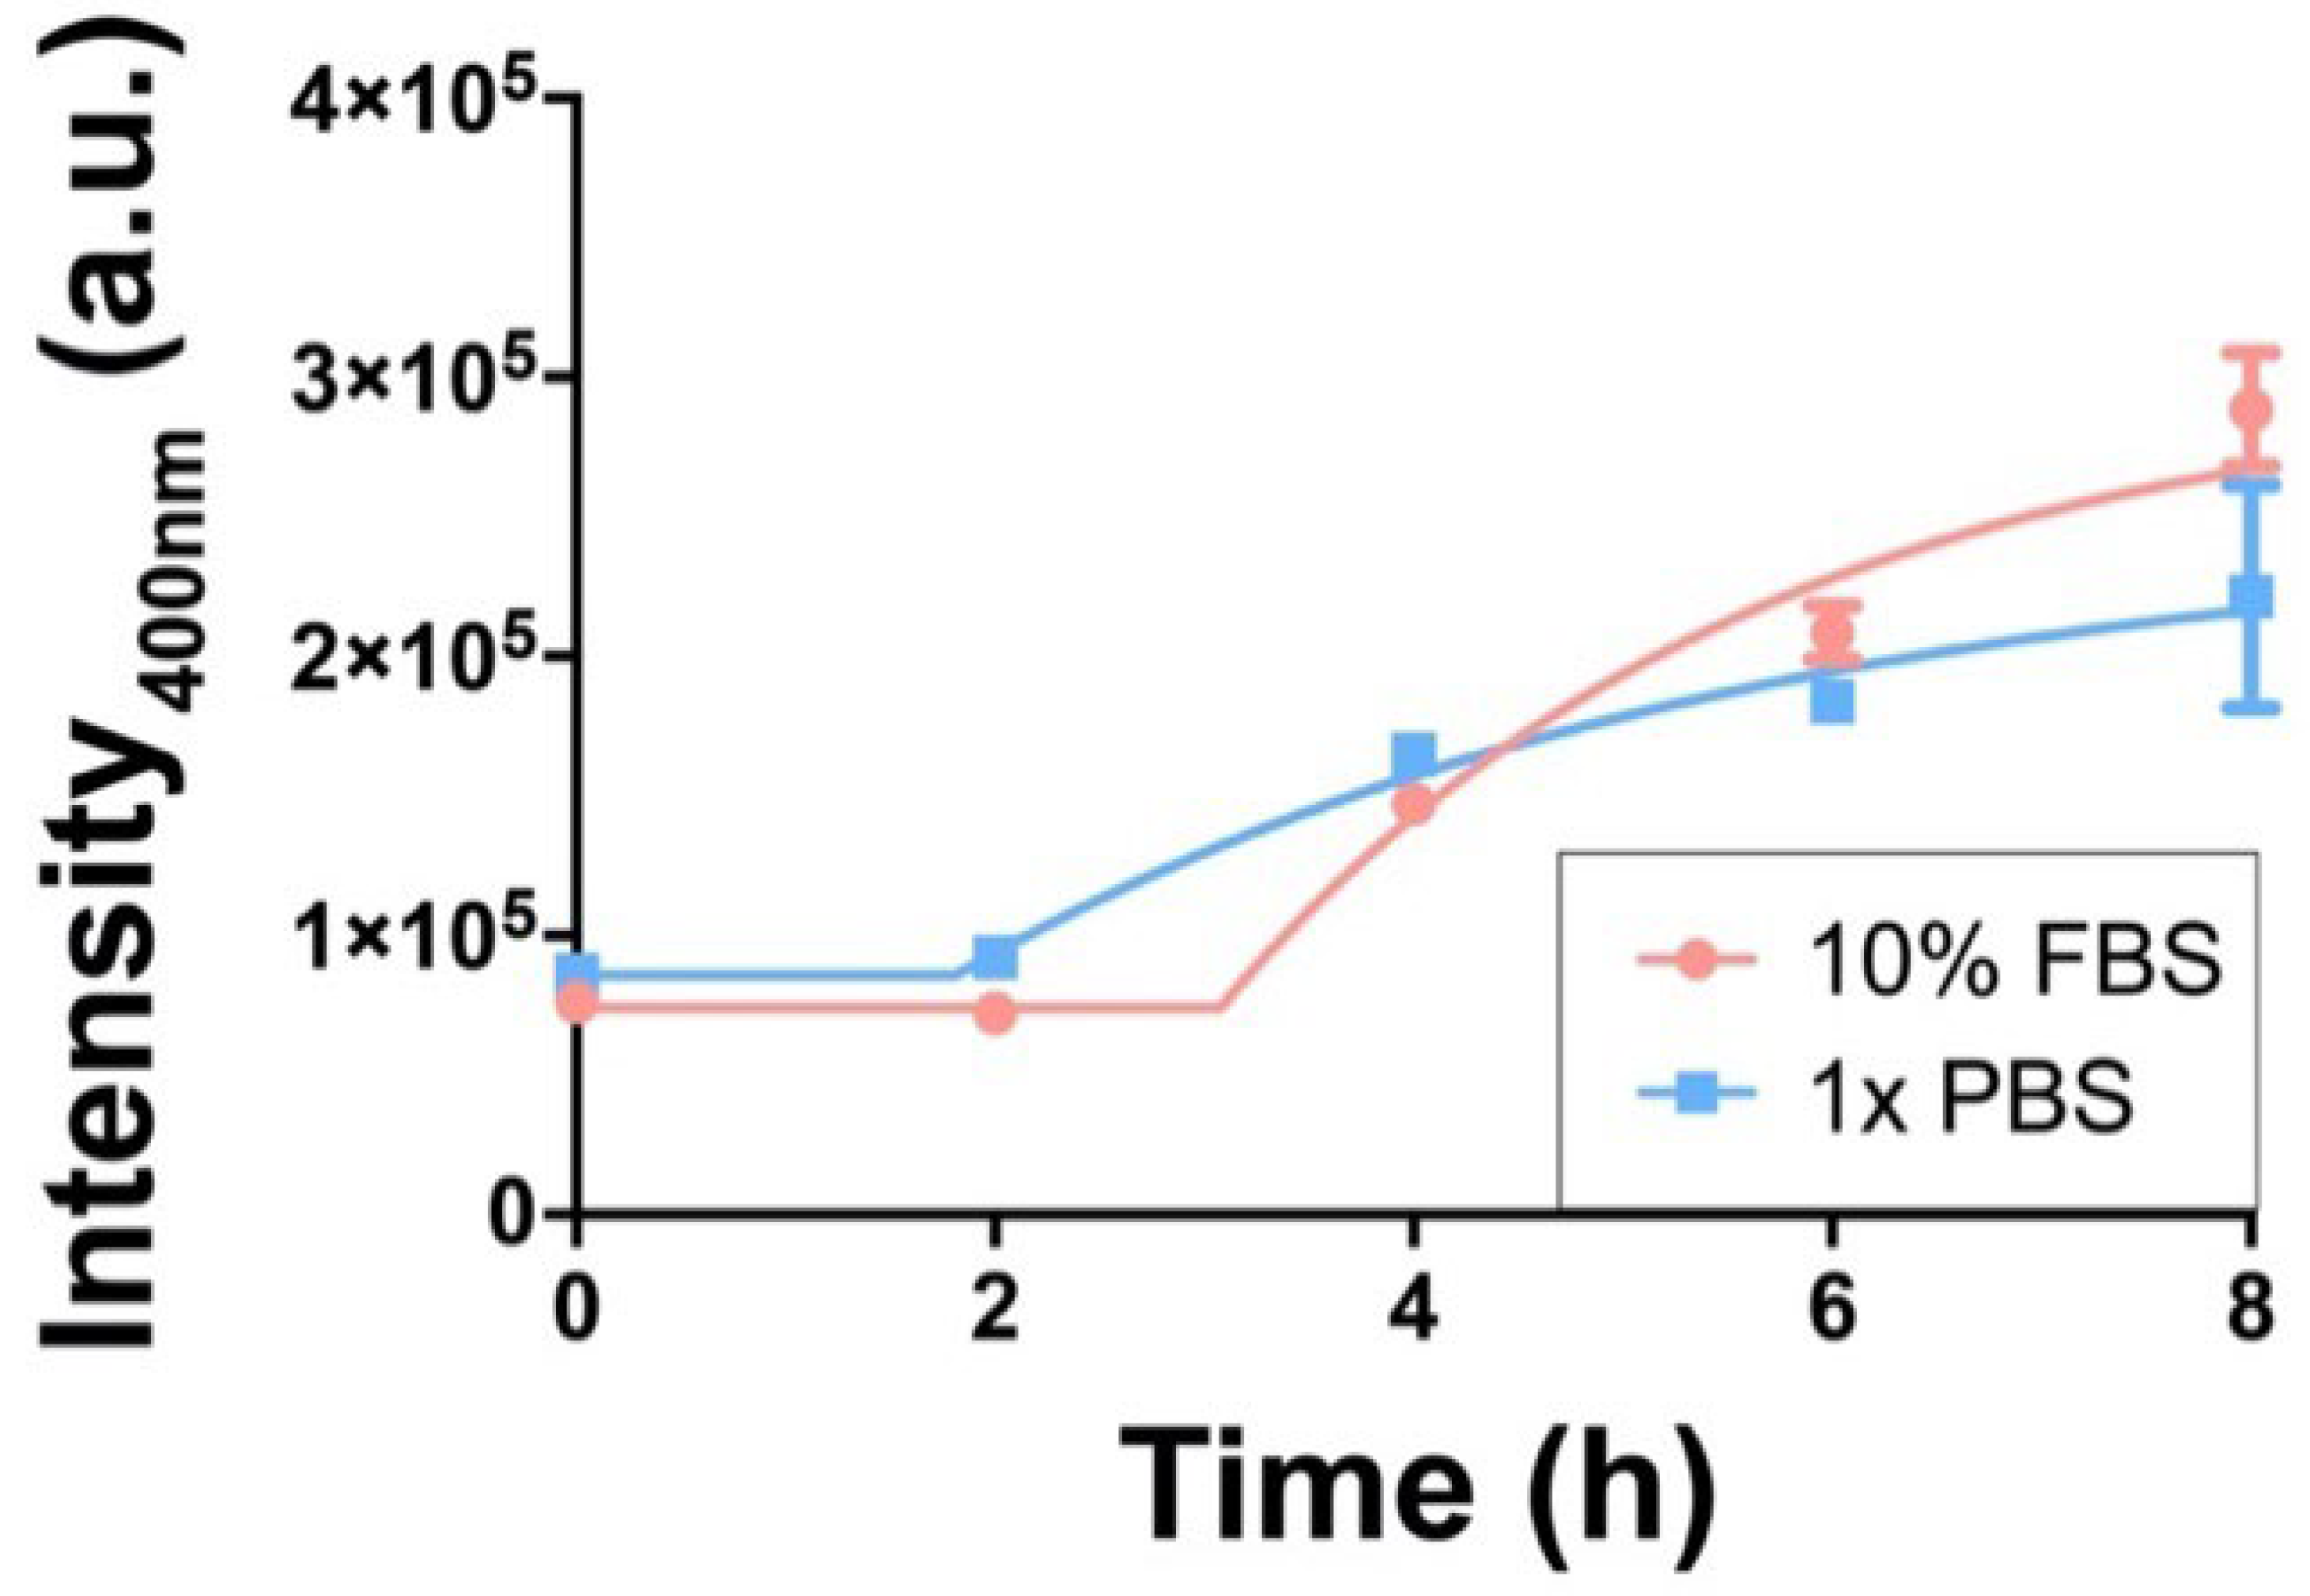
Given the observed superior cell viability levels for macrophages during liposomal chloroquine exposure, we wondered about the potential mechanism. We hypothesized that chloroquine release from liposomes was slow, resulting in safer cellular drug delivery over time compared to free chloroquine, which may diffuse rapidly across cellular membranes to cause cytotoxic effects. To test this hypothesis, we quantified the chloroquine release kinetics from liposomes based on a fluorescence spectroscopy in vitro assay at 37 °C to mimic physiological conditions. Chloroquine encapsulating liposomes were dispersed in two physiologically relevant aqueous buffers that are commonly used in cell culture studies: (i) 1x PBS, and (ii) 1x PBS containing 10% FBS (fetal bovine serum). Free chloroquine is a strongly fluorescent compound due to the quinine molecular structure (ex. 320 nm/em. 400 nm;
Figure S5) [
19,
20,
21]. Our spectroscopic studies indicated that chloroquine fluorescence was quenched upon liposome encapsulation. This finding is likely due to self-quenching, given the high local chloroquine concentration within liposomes. However, upon release of chloroquine from liposomes, we detected an increase in fluorescence intensity, likely due to reduced fluorescence self-quenching. Based on these photophysical observations, we tracked the chloroquine release kinetics from liposomes by measuring chloroquine fluorescence intensity over time (
Figure 4).
As shown in
Figure 4, chloroquine release from liposomes was fitted with a pseudo-first-order release model (see SI). Accounting for the stable signal during the first 2 h, the time constants (τ) were calculated to be 2.6 h and 3.8 h for chloroquine liposomes in 10% FBS and 1x PBS, respectively. After 8 h, the fluorescence signals for both groups (w/and
w/
o FBS) were nearly identical. The observed differences in curve shapes and release time constants (τ) may indicate that protein adsorption onto liposome surfaces and other liposome-protein interactions could play potential roles in chloroquine release. Our kinetics results demonstrate that liposomes slowly released chloroquine over time under physiologically relevant conditions. These slowed and controlled drug release findings may explain the superior cell viability levels of liposomal chloroquine in RAW264.7 macrophages that we observed in
Figure 2. The increase in fluorescence intensity over time (as well as other reports of chloroquine encapsulated within nanoparticles) demonstrate that chloroquine’s molecular structure was not compromised within liposomes, indicating the biological activity (and likely the therapeutic potential) of chloroquine was retained upon liposome encapsulation and release [
22,
23,
24].


