Article

Density, Excess Molar Volume and Vapor–Liquid Equilibrium Measurements at 101.3 kPa for Binary Mixtures Containing Ethyl Acetate and a Branched Alkane: Experimental Data and Modeling

1
CNAM, 2 rue Conté, 75003 Paris, France
2
Université Paris-Saclay, INRAE, AgroParisTech, UMR SayFood, 91120 Palaiseau, France
*
Author to whom correspondence should be addressed.
Liquids 2023, 3(2), 187-202; https://doi.org/10.3390/liquids3020014
Submission received: 21 February 2023 / Revised: 27 March 2023 / Accepted: 4 April 2023 / Published: 11 April 2023

Abstract

:
Vapor–liquid equilibrium (VLE) and density data for binary systems of branched alkanes + ethyl acetate are scarce in the literature. In this study, the binary mixtures 3-methylpentane + ethyl acetate and 2,3-dimethylbutane + ethyl acetate were investigated. Density measurements at atmospheric pressure were performed using a vibrating tube density meter at 293.15, 298.15 and 303.15 K. Large and positive excess molar volumes were calculated and correlated using a Redlich–Kister-type equation. Isobaric VLE data at 101.3 kPa were obtained using a Gillespie-type recirculation ebulliometer. Equilibrium compositions were determined indirectly from density measurements. The experimental data were checked for consistency by means of the Fredenslund test and the Wisniak (L-W) test and were then successfully correlated using the NRTL model. The newly studied binary systems display high deviations from ideality and minimum boiling azeotropes, the coordinates of which are reported in this work.

Graphical Abstract

1. Introduction

Ethyl acetate is a common solvent and diluent used in many sectors for the production of lacquers, synthetic resins for surface coatings [1], adhesives and perfumes [2]. It is also used as a solvent for the decaffeination of coffee beans. In recent years, ethyl acetate has been mentioned as an interesting potential additive in gasoline [2,3,4]. Indeed, ethyl acetate presents advantages such as a relatively low toxicity, a moderate production cost and a high oxygen content that enhances the octane number of diesel blends [2]. Moreover, the addition of ethyl acetate does not significantly modify the vapor pressure of gasoline [5]. The search for alternative additives is an important issue to reduce diesel engine emissions and fossil fuel consumption. In this context, it is essential to improve the thermodynamic understanding, particularly the vapor–liquid equilibrium (VLE) and volumetric properties, of non-ideal mixtures containing oxygenates, n-paraffins and iso-paraffins [5]. Indeed, gasoline contains substantial proportions of branched C5 and C6 paraffins [3]. Despite the vast amount of such experimental data currently available, a lack of data can be noticed for certain kinds of mixtures.
For example, binary systems consisting of short-chain esters + linear alkanes were extensively studied in the past [6,7,8,9,10,11,12,13,14,15,16], but few VLE data are available for binary systems containing ethyl acetate and a branched alkane. To our knowledge, ethyl acetate + 2,2,4-trimethylpentane is the only system belonging to this family for which the phase equilibrium was previously investigated [17,18]. The situation is slightly better for the densities of systems of ethyl acetate + branched saturated hydrocarbons. The densities of the binary system ethyl acetate + 2,2,4-trimethylpentane were reported at 298.15 K [18,19] and 303.15 K [20], while the excess molar volumes of four binary ethyl acetate + branched light alkanes were published at 298.15 K [21].
The aim of this work is to report new experimental densities and isobaric VLE data (at P = 101.3 kPa) for the two following binary systems: 3-methylpentane + ethyl acetate and 2,3-dimethylbutane + ethyl acetate. The binary system hexane + ethyl acetate, which was repeatedly investigated in the past [6,7,10,22,23,24,25], was also measured beforehand for comparison and validation of the apparatus and of the experimental technique employed in this study.

2. Experimental Section

2.1. Material and Pure Component Properties

The source and the purity stated by the manufacturers of the chemicals employed are summarized in Table 1. After receipt, the pure components were analyzed by gas chromatography. Since no significant impurities were found, they were used without further purification.
Before use, the pure compounds were boiled to remove dissolved gases and stored hermetically. The water content of the components was measured by Karl-Fischer titrations before the density and VLE measurements. Low moisture contents were found. To confirm the quality of the chemicals received, the normal boiling temperature and density at 298.15 K and ambient pressure (P = 101 kPa) were measured and compared with literature values. The results of these measurements and the respective comparisons are given in Table 2, showing good agreement with previously published values. Other density comparisons at 293.15 K and 303.15 K are provided in the Supplementary Materials (Table S1).

2.2. Density Measurement Apparatus and Method

The densities of the pure components and mixtures were measured at atmospheric pressure (P = 101 ± 3 kPa) using a vibrating tube density meter (DMA 4500 M, Anton Paar, Graz, Austria) at 293.15 K, 298.15 K and 303.15 K with a standard uncertainty u(Tρ meas) = 0.03 K. The equipment was regularly calibrated using pure and degassed water and dry air during the measurement campaign. The device is also inspected and calibrated yearly by the manufacturer. For the measured density, a resolution of (±0.00001) g·cm−3 is displayed by the instrument, whereas the standard uncertainty is estimated to be u(ρ) = 0.00005 g·cm−3. It must be noted that this standard uncertainty is only valid for low-viscosity fluids measured at moderate temperatures [31].
Binary mixtures of known compositions were gravimetrically prepared using a precision balance (Metler Toledo, model ML204, Columbus, OH, USA) with a standard uncertainty of 0.0001 g. Pure compounds were stored and kept at a low temperature during weighing, and the least volatile component of the studied binary was always charged first to restrict evaporation during mixture preparation. Mixtures were prepared in glass vials with appropriate volumes to minimize the gaseous space between the liquid and the stopper. Density measurements were taken promptly after mixture preparation and homogenization.
The experimental method described above was employed in previous work to measure the density of the ethanol–water binary system [32].

2.3. VLE Measurement Equipment

Isobaric vapor–liquid equilibrium measurements for pure components and mixtures were performed using a recirculation ebulliometer (Labodest VLE 602, ILUDEST, Waldbüttelbrunn, Germany) equipped with a Cottrell pump. This type of equipment is routinely employed for low-pressure VLE measurements and extensively described in the literature [32,33,34,35,36].
Briefly, the device comprises a mixing chamber linked to a boiler, an equilibrium chamber (the “Cottrell Pump”) and a separation chamber. It allows the measurement of isobaric VLE data from 5 kPa to 400 kPa. The pressure stability in the experimental device is ensured by using injections of pure nitrogen (molar fraction purity >0.9999) and a vacuum pump regulated by a pressure controller. A precision pressure transmitter Wika (model P-30) was used with a standard uncertainty u(P) = 0.1 kPa. The equilibrium temperature was measured by a Pt-100 platinum probe with a standard uncertainty u(T) = 0.05 K.
To check the accuracy of the apparatus, the vapor pressures of the four components involved in this study were measured from 50 kPa to 101.3 kPa with a step of 5 kPa. Experimental vapor pressure data were then compared to previously published data and correlated with the Antoine equation. The Antoine coefficients are provided in the Supplementary Materials (Table S2). Before each measurement campaign (pure compound or binary mixture), the device was rinsed and dried under vacuum (~5 kPa) for one hour to prevent contamination.
For the VLE measurements of the mixtures, the compositions of the liquid and condensed vapor phases collected from the ebulliometer were obtained indirectly from density measurements at 298.15 K using a polynomial fit of the previously measured density–composition data. For each binary system studied, 21 density measurements were used to establish the calibration curve between the density and the composition of the mixture. The coefficients of the polynomial density–composition functions employed are presented in the Supplementary Materials (Table S3). Moreover, several additional binary mixtures of known composition were prepared and measured to determine the uncertainty of the composition obtained using the calibration curve.
As an example, the calibration curve analysis for the binary system hexane (1)–EA (2) is presented in the Supplementary Materials (Figure S1). A standard uncertainty u(x1) = u(y1) = 0.001 was estimated for the studied binary systems.

2.4. Density at 298.15 K and VLE of the Hexane (1)–Ethyl Acetate (2) System

The binary system hexane (1)–EA (2), which was investigated several times in the past [6,7,10,22,23,24,25], was measured beforehand for the comparison and validation of the experimental technique. The density of the system hexane (1)–EA (2) was measured at 298.15 K over the whole composition range. Excess molar volumes V E at 298.15 K were calculated by the following expression:
V E = x 1 M 1 + x 2 M 2 ρ m x 1 M 1 ρ 1 + x 2 M 2 ρ 2
where x 1 and x 2 are the mole fractions of the mixture, M 1 , M 2 and ρ 1 , ρ 2 are, respectively, the molar masses and the densities of the pure components, and ρ m is the density of the mixture. The densities and excess molar volumes of the binary system at 298.15 K measured in this study are reported in the next section (see Table 3) and are plotted in Figure 1 with previously published values.
Figure 1 clearly illustrates good agreement between the data measured in this work and previously published data, particularly for our excess molar volumes and those published by Fernández and co-workers [10]. The isobaric VLE of the binary system hexane (1)–EA (2) at 101.3 kPa was also measured for comparison with literature data. The experimental VLE data (T, x1, y1) measured in this work at P = 101.3 kPa are given in the Section 3 and are plotted in Figure 2 for comparison with previously published data.
Figure 2 indicates reasonable agreement between the different data sets. The experimental data measured in this work were used to calculate the azeotropic coordinates of the binary system. The azeotropic point was found to be located at x1az = 0.655 and Taz = 338.05 K, which is quite consistent with the values reported by Acosta et al. [6] (x1az = 0.657 and Taz = 338.0 K) and Fernández et al. [10] (x1az = 0.661 and Taz = 338.15 K). After this validation step, the binary systems 3-methylpentane + EA and 2,3-dimethylbutane + EA were investigated.

3. Experimental Results and Discussion

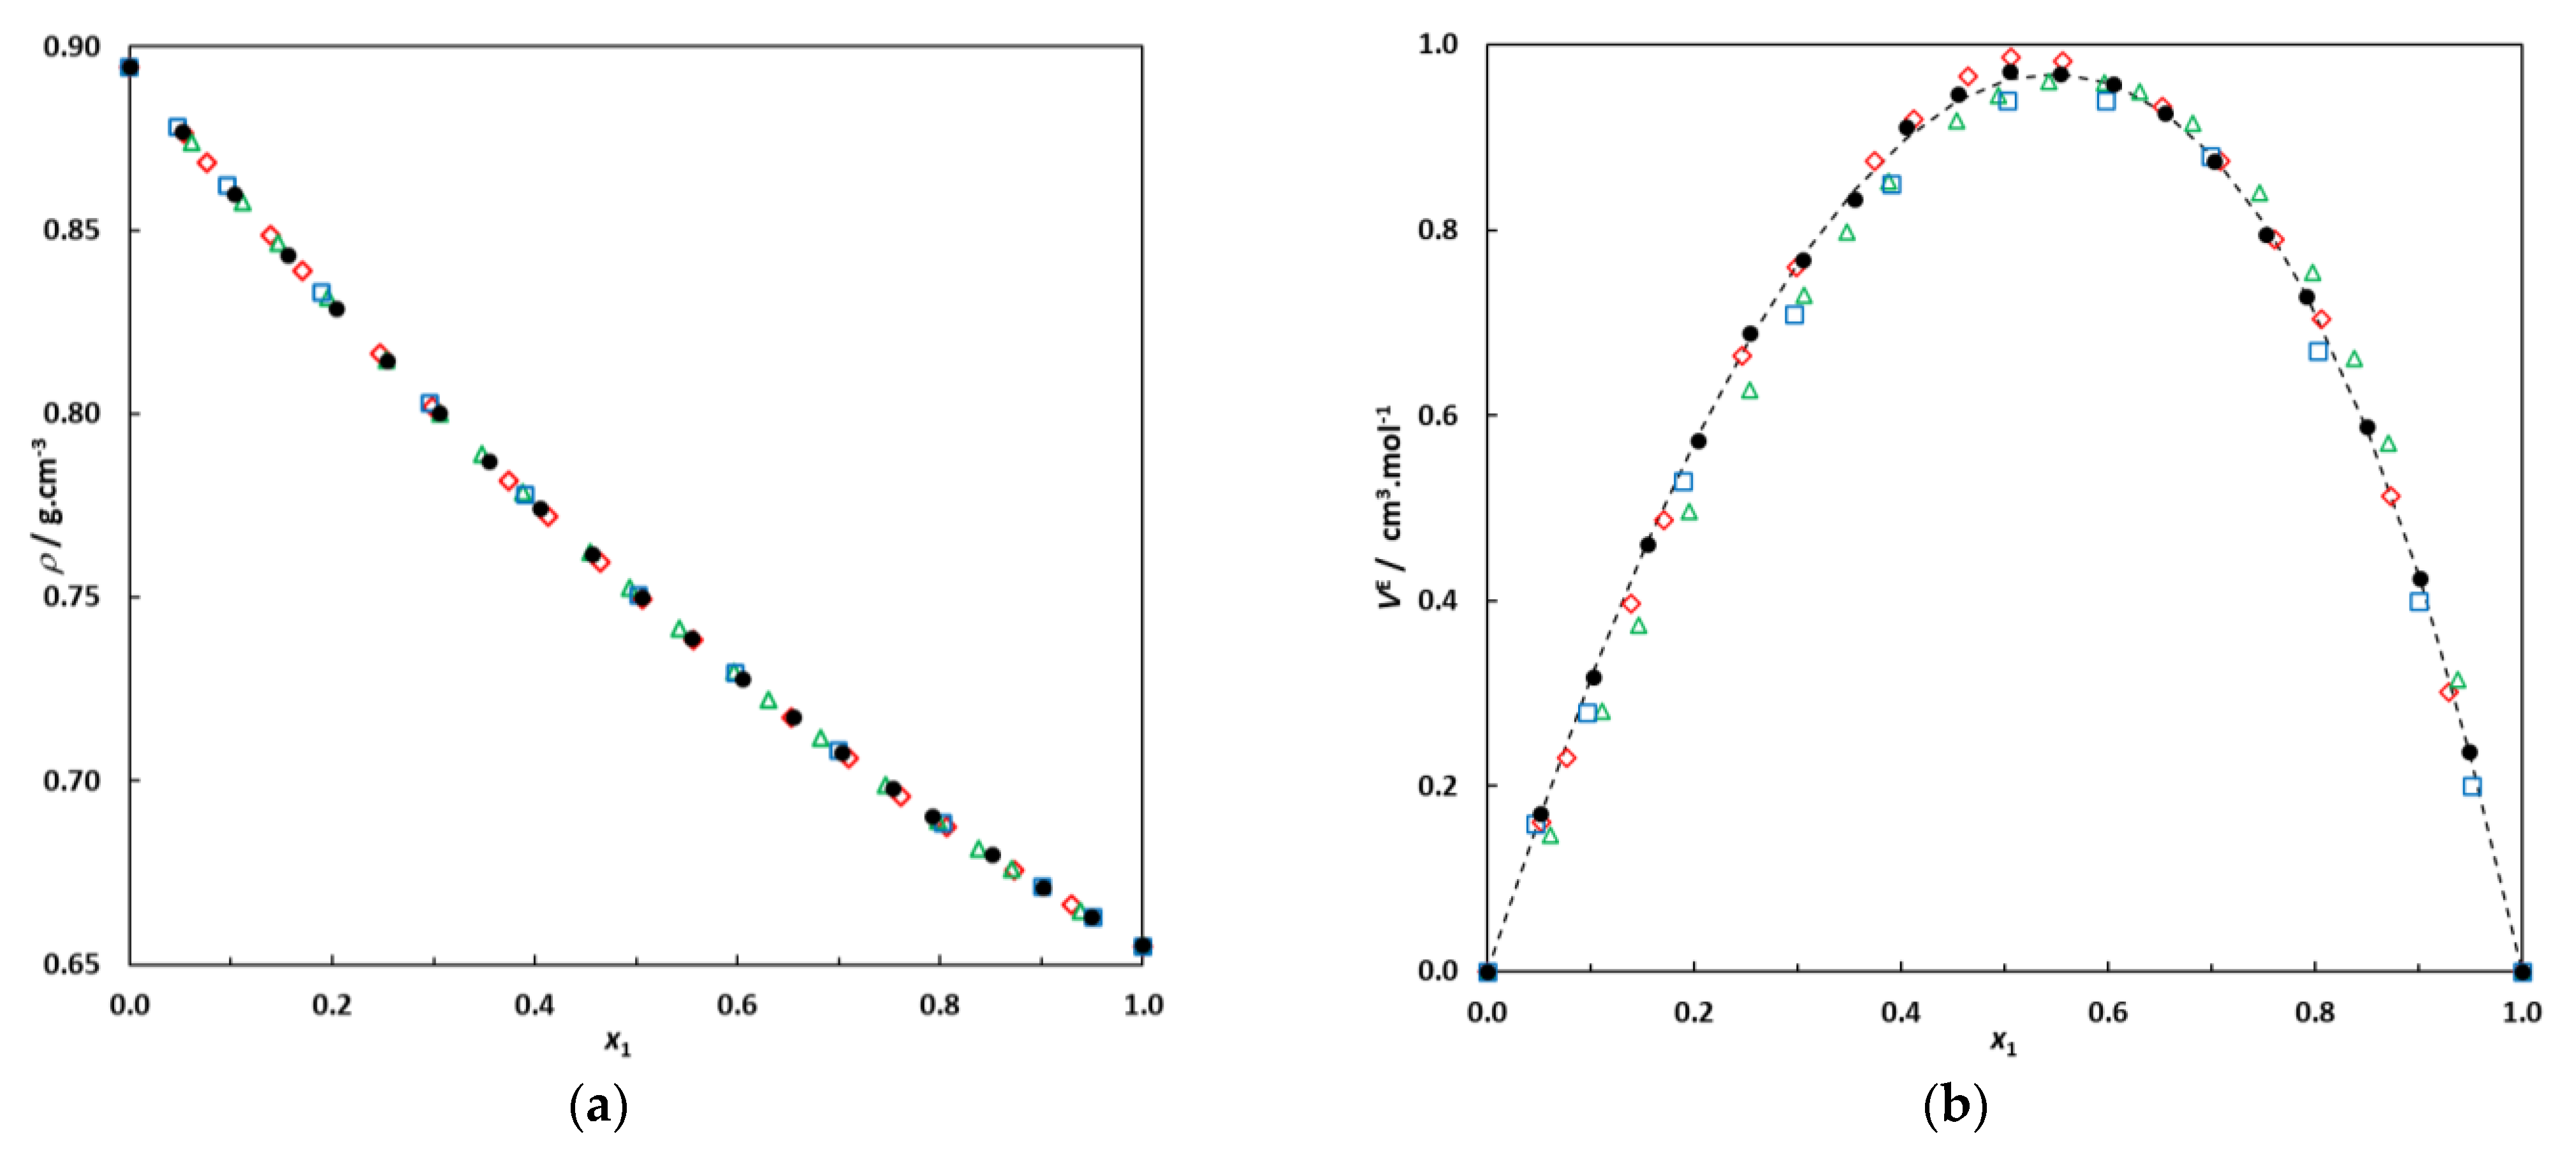
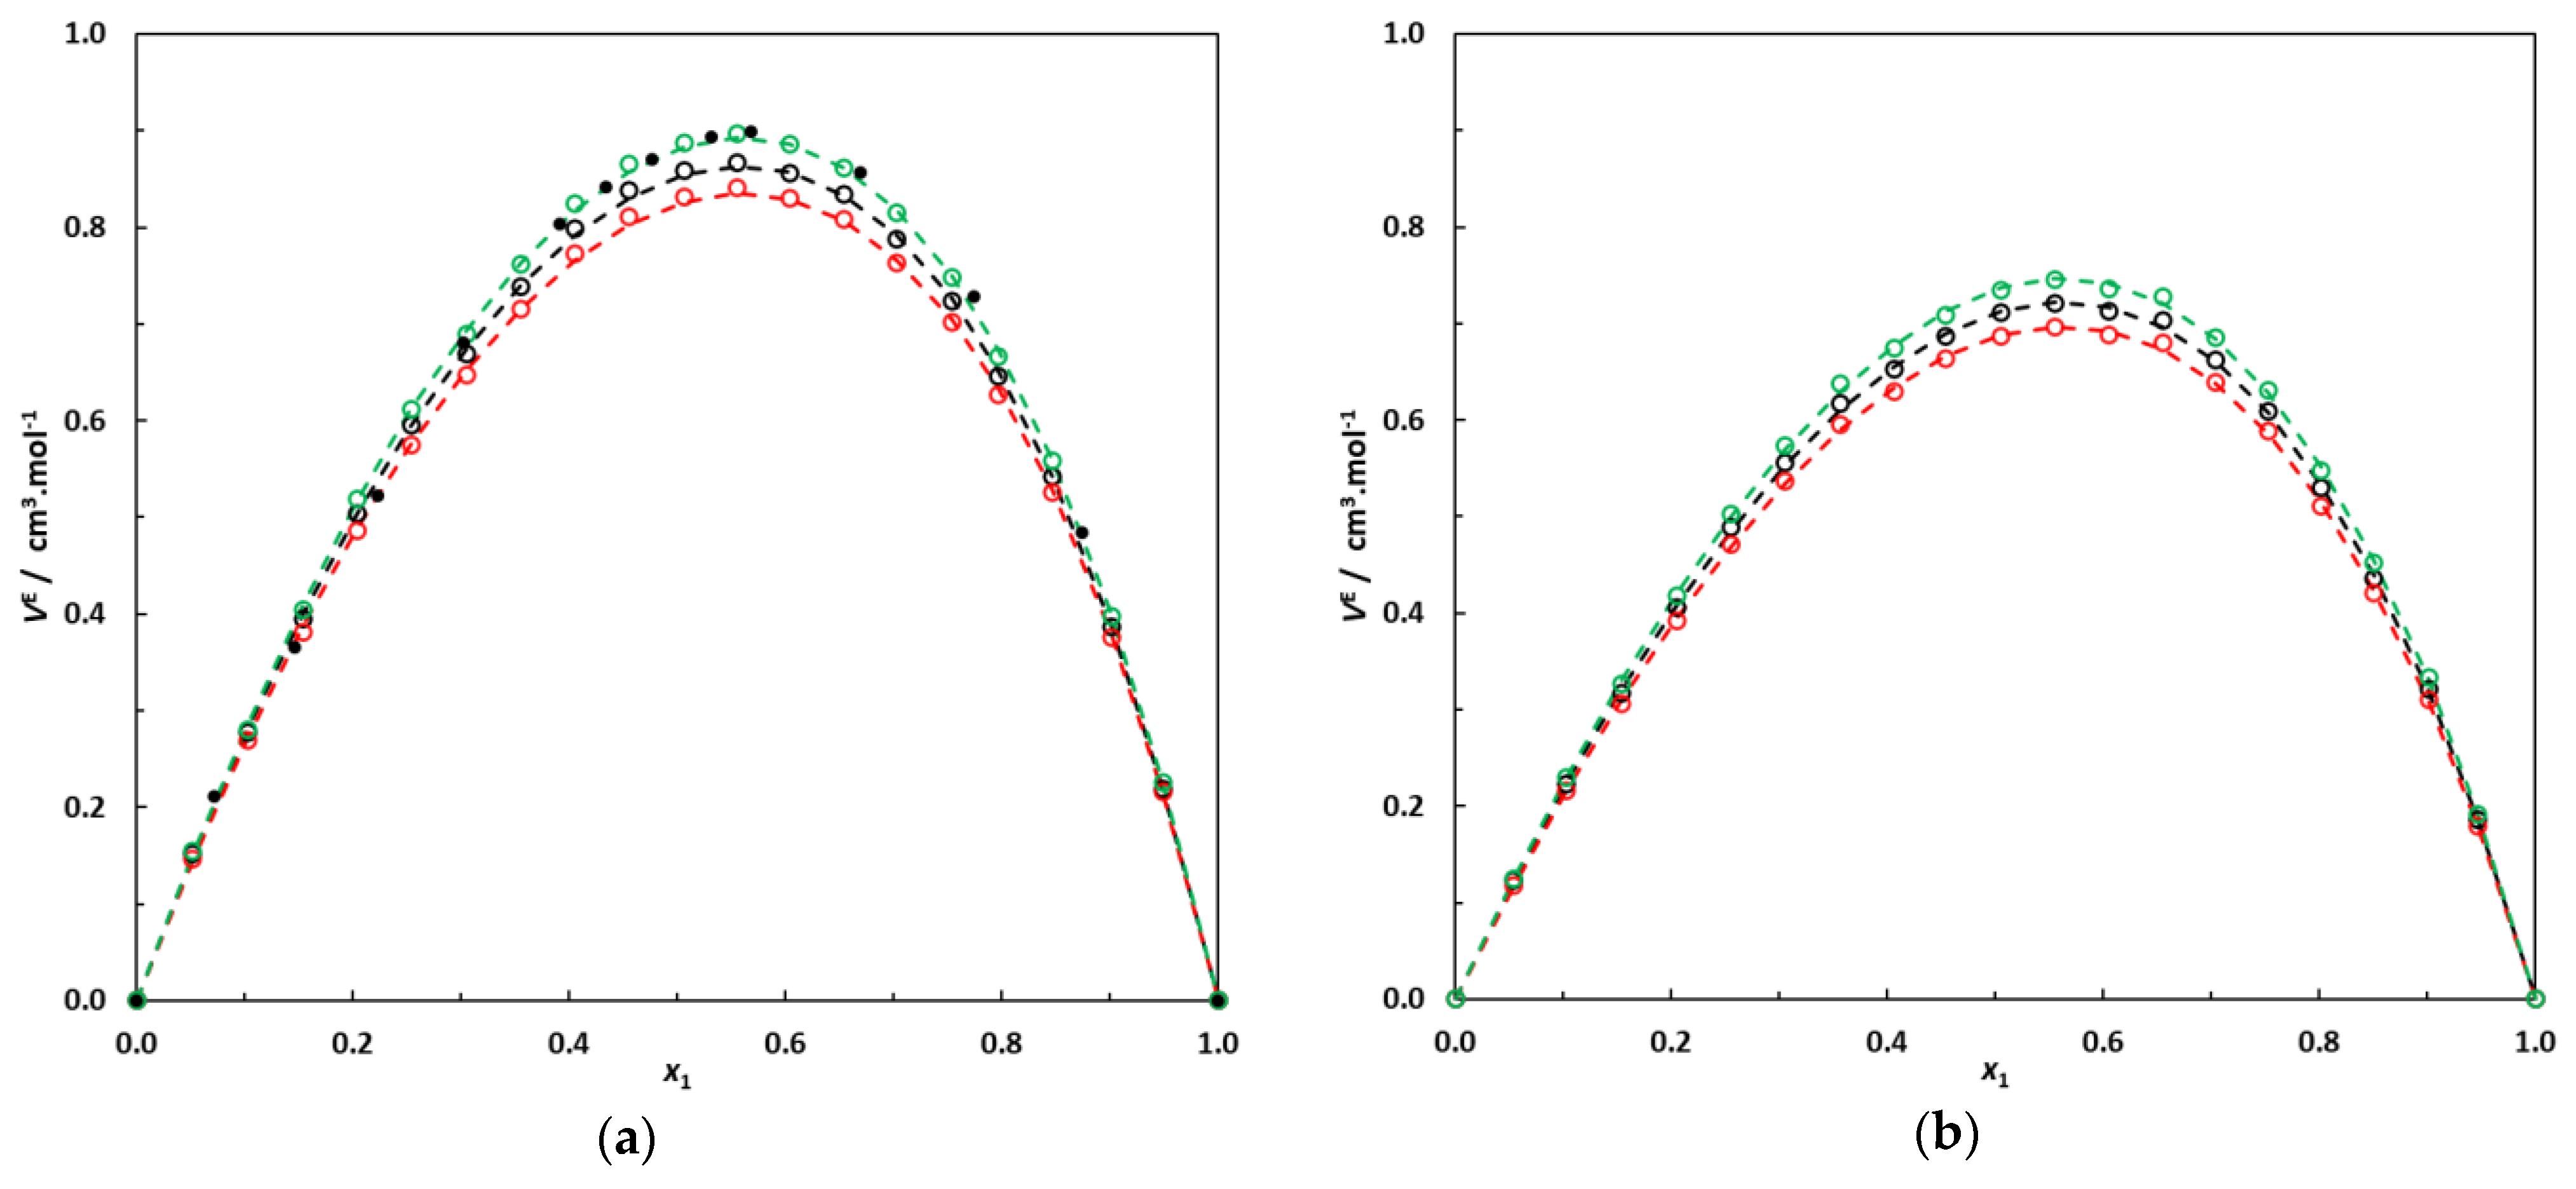
3.1. Density and Excess Molar Volumes

Table 3 reports the density measurements and excess molar volumes calculated using Equation (1) at 298.15 K for hexane (1)–EA (2) mixtures. Table 4 presents the densities and excess molar volumes of the binary system 3-methylpentane (1)–EA (2) at 293.15, 298.15 and 303.15 K, whereas Table 5 shows the densities and excess molar volumes of the binary system 2,3-dimethylbutane (1)–EA (2) at the same temperatures.
Excess molar volumes at constant temperature obtained from density measurements were correlated with the following Redlich–Kister-type function:
V E x 1 1 x 1 = a 0 + a 1 2 x 1 1 + a 2 2 x 1 1 2 + a 3 2 x 1 1 3
Table 6 summarizes the corresponding values of the coefficient a i for the three binary systems at each temperature, and Figures S2–S4 represent the corresponding residual distributions of the excess molar volumes.
The excess molar volumes of the binary systems 3-methylpentane + EA and 2,3-dimethylbutane + EA from 293.15 K to 303.15 K are plotted in Figure 3, along with the correlation curves.
In Figure 3, it can be noted that the binary systems containing branched alkanes + EA present pronounced positive excess molar volumes, with a maximum value of VE near an alkane molar fraction of 0.55. These observations are consistent with previous studies dealing with linear alkanes + short-chain esters [10,11,12,13,14] or branched alkanes + EA [18,19,20,21].
The results obtained in this work clearly indicate that for a given saturated hydrocarbon CnH2n+2 in a mixture with EA, the excess molar volume is the maximum when carbon atoms are arranged in a single chain and decreases when EA is mixed with its isomer. Moreover, the more branched the hydrocarbon, the lower the excess molar volume of the mixture with EA. This phenomenon is clearly illustrated in Figure 4 and can probably be attributed to better interstitial accommodation when the alkane approaches a more spherical shape.

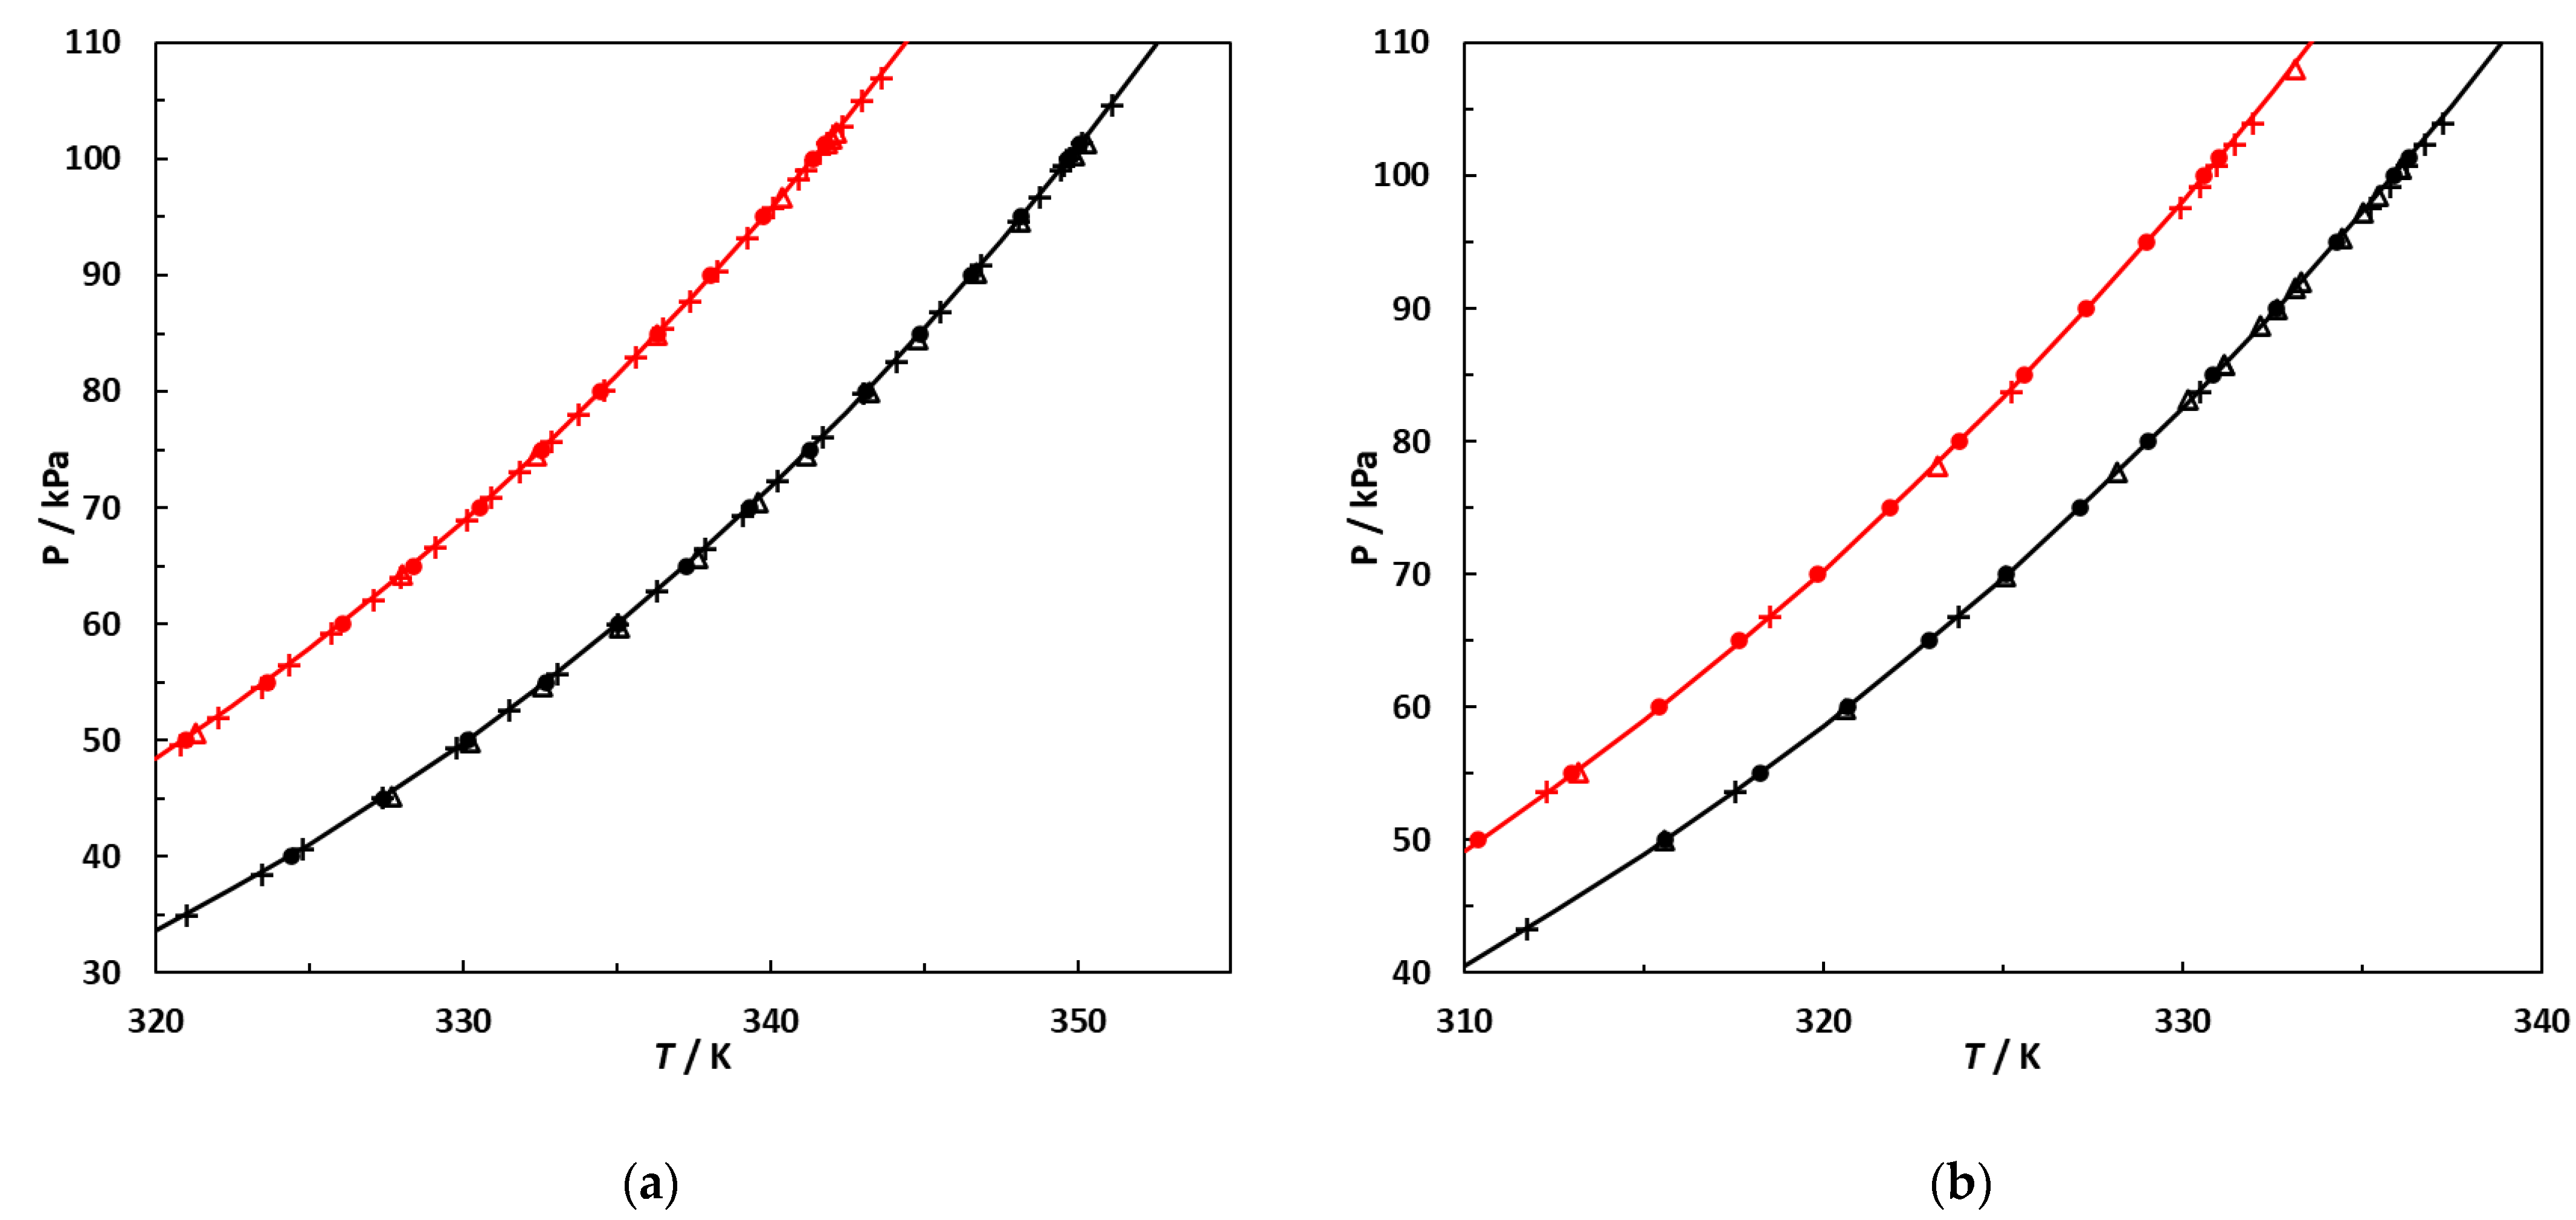
3.2. Pure Compounds’ Vapor Pressures

Before performing the VLE measurements for the mixtures, the vapor pressures of the pure components were measured using the same apparatus. The vapor pressure data are given in Table 7 and plotted in Figure 5 with values from the literature.
Figure 5 demonstrates that the vapor pressures measured in this work are in line with previously published experimental data.

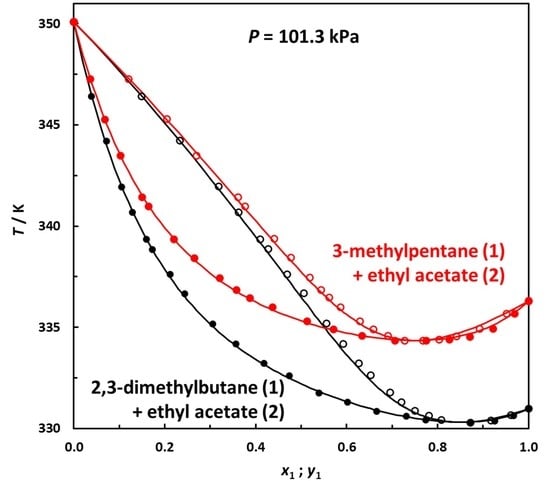
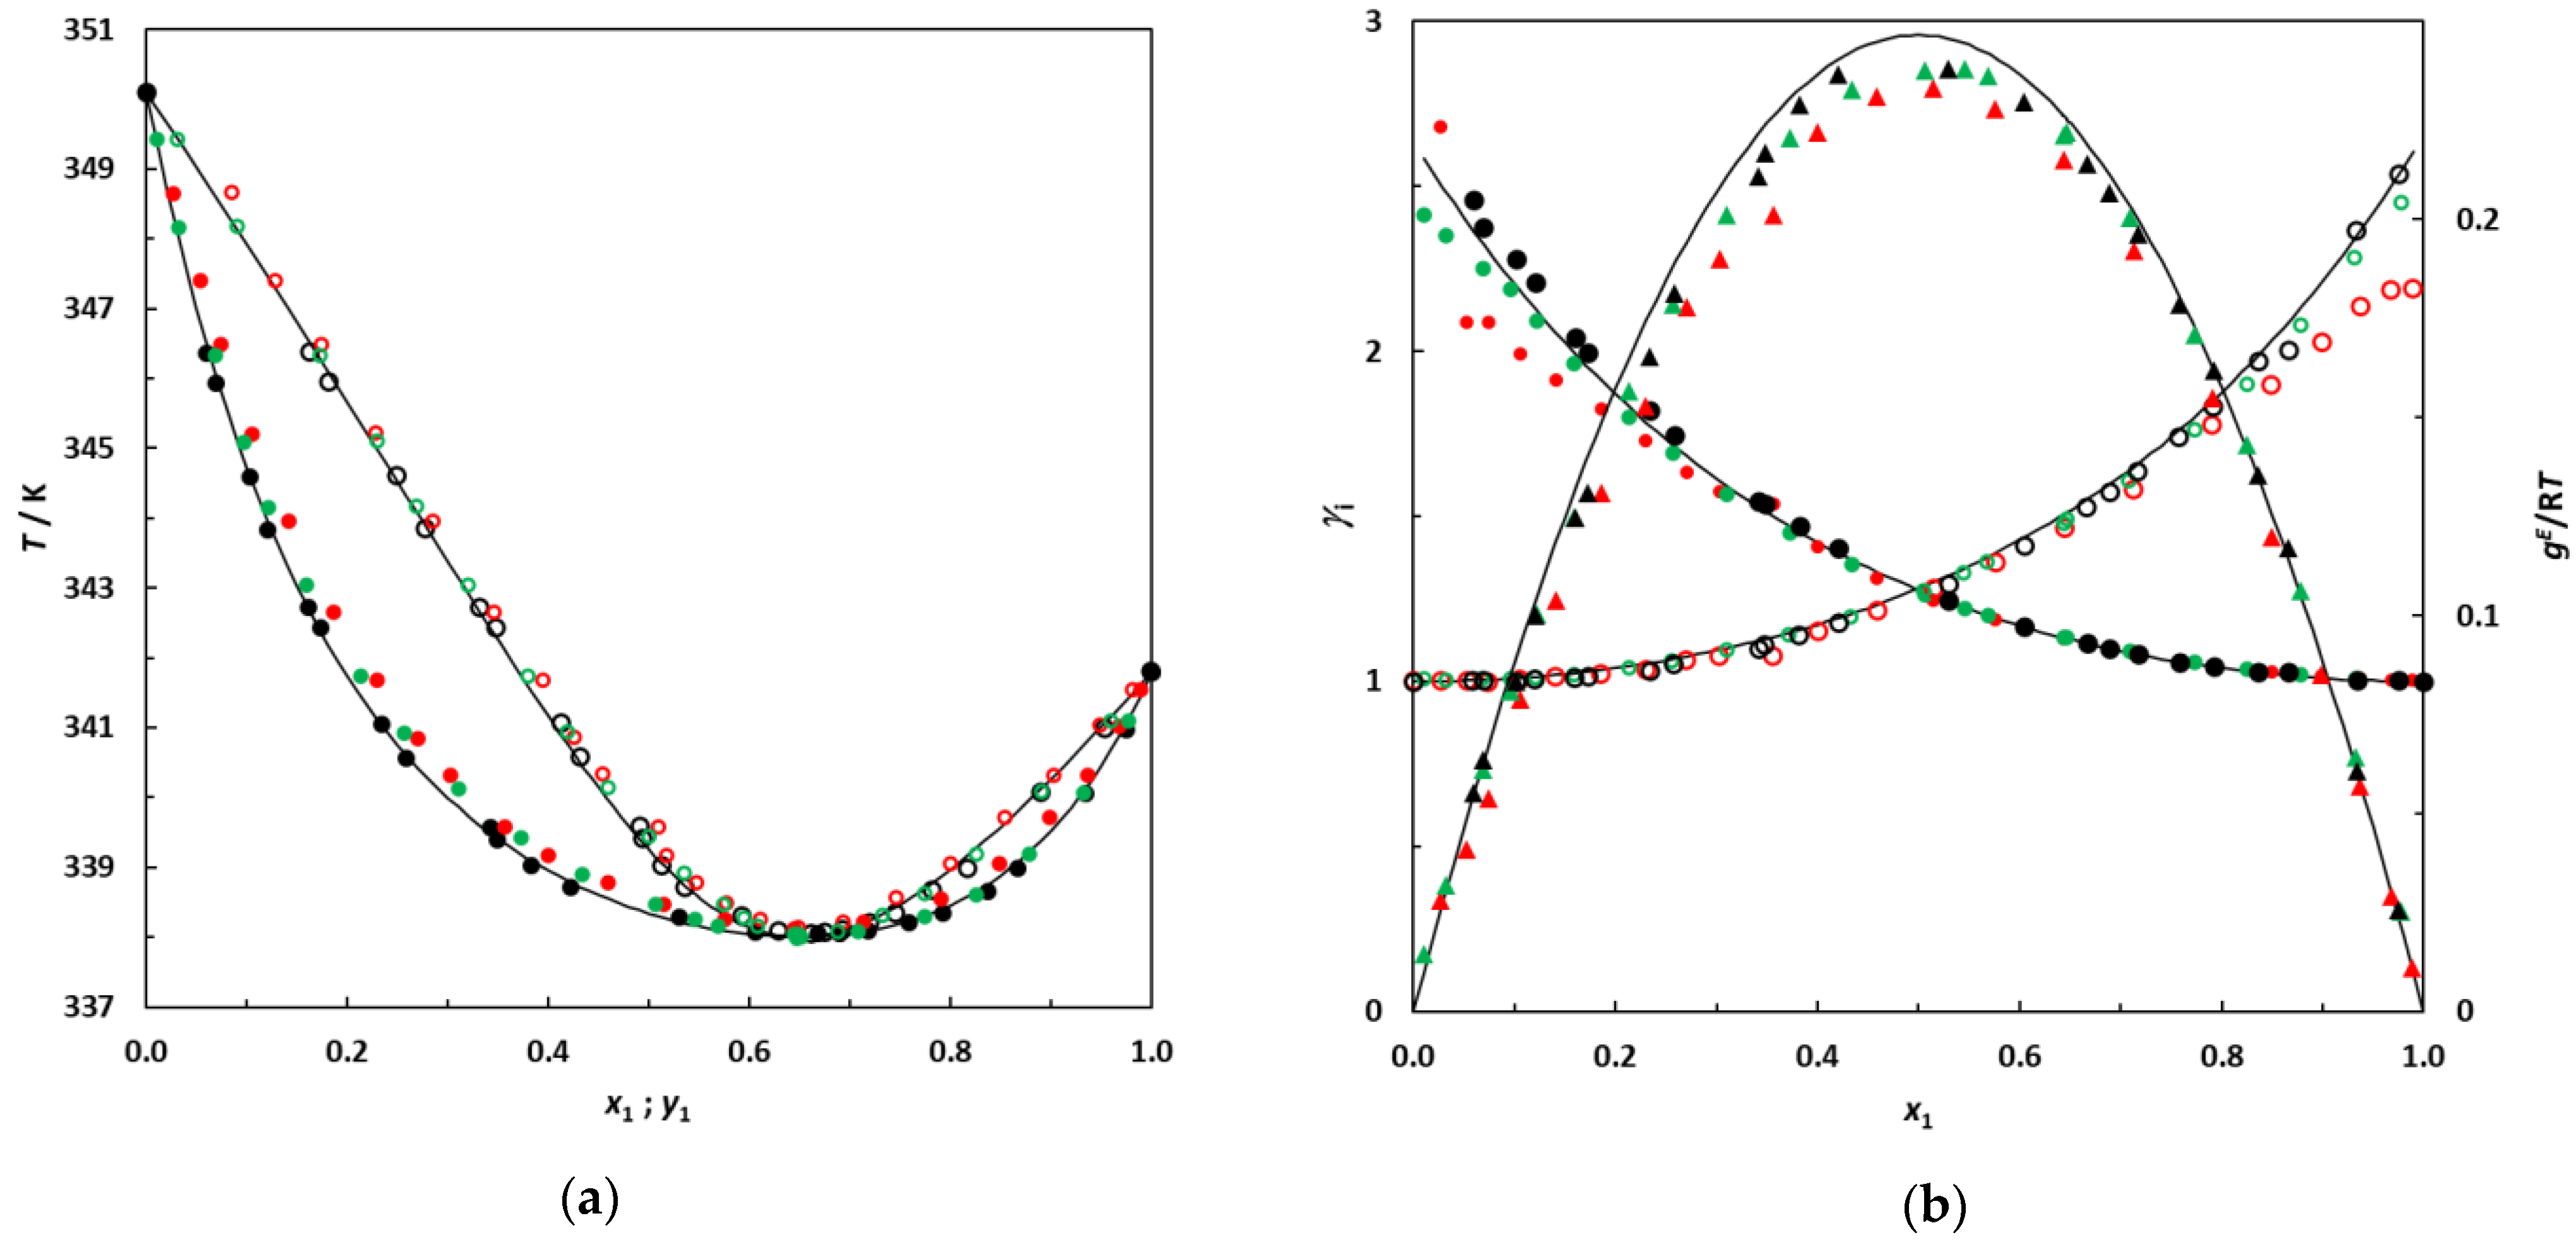
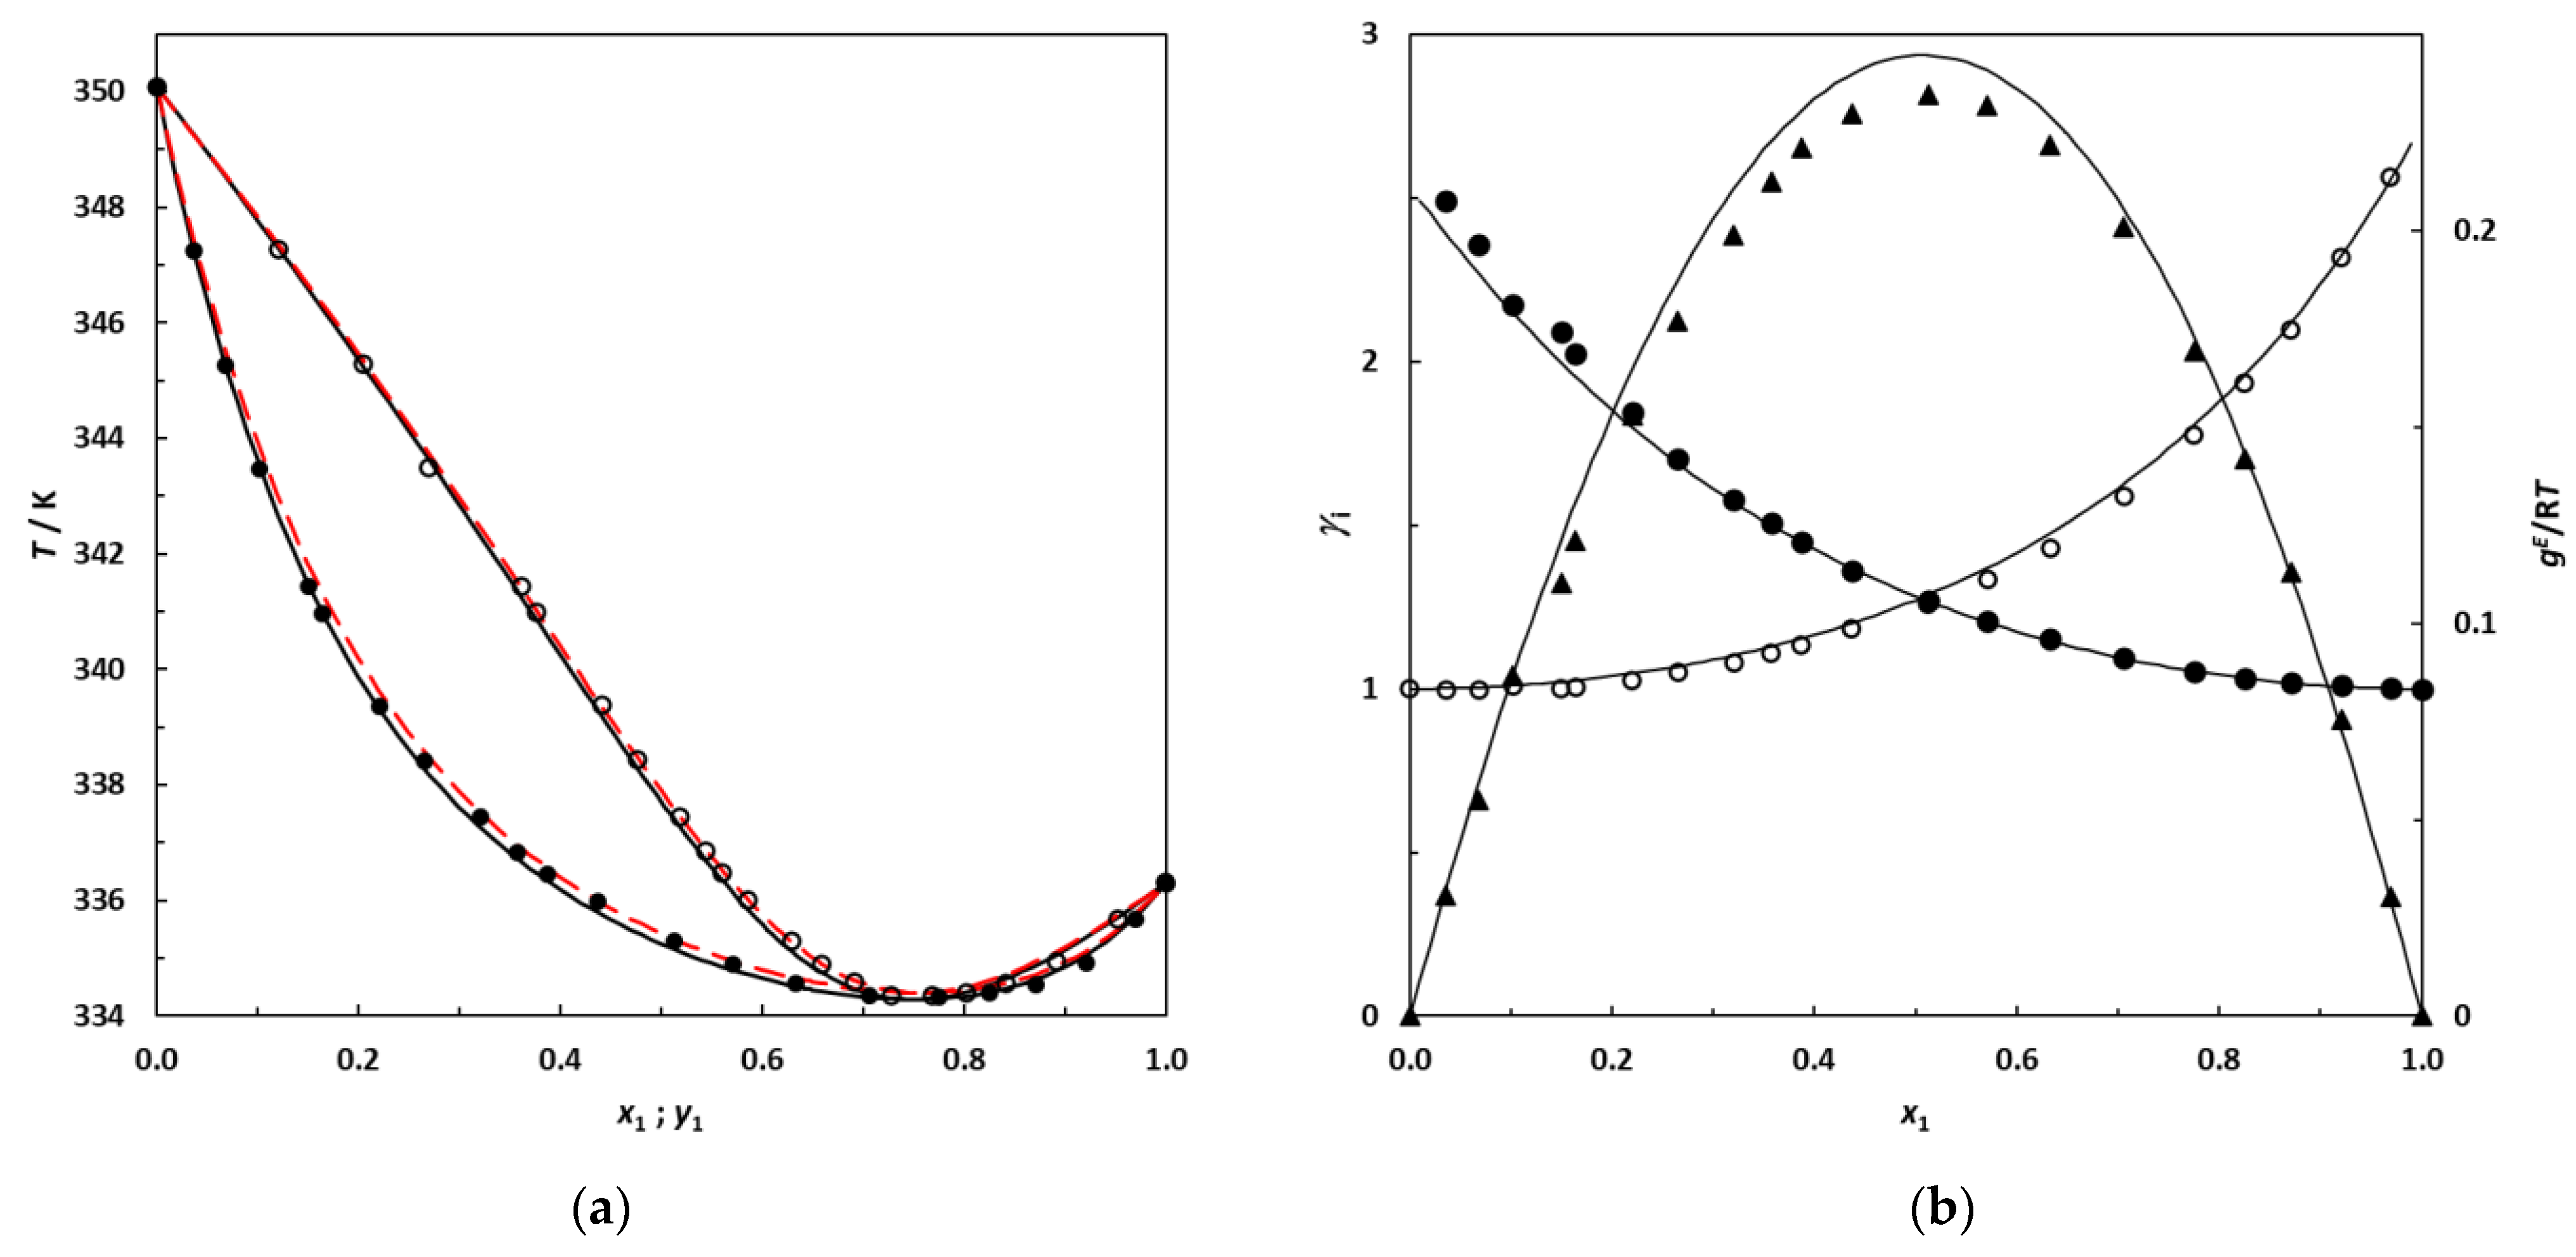
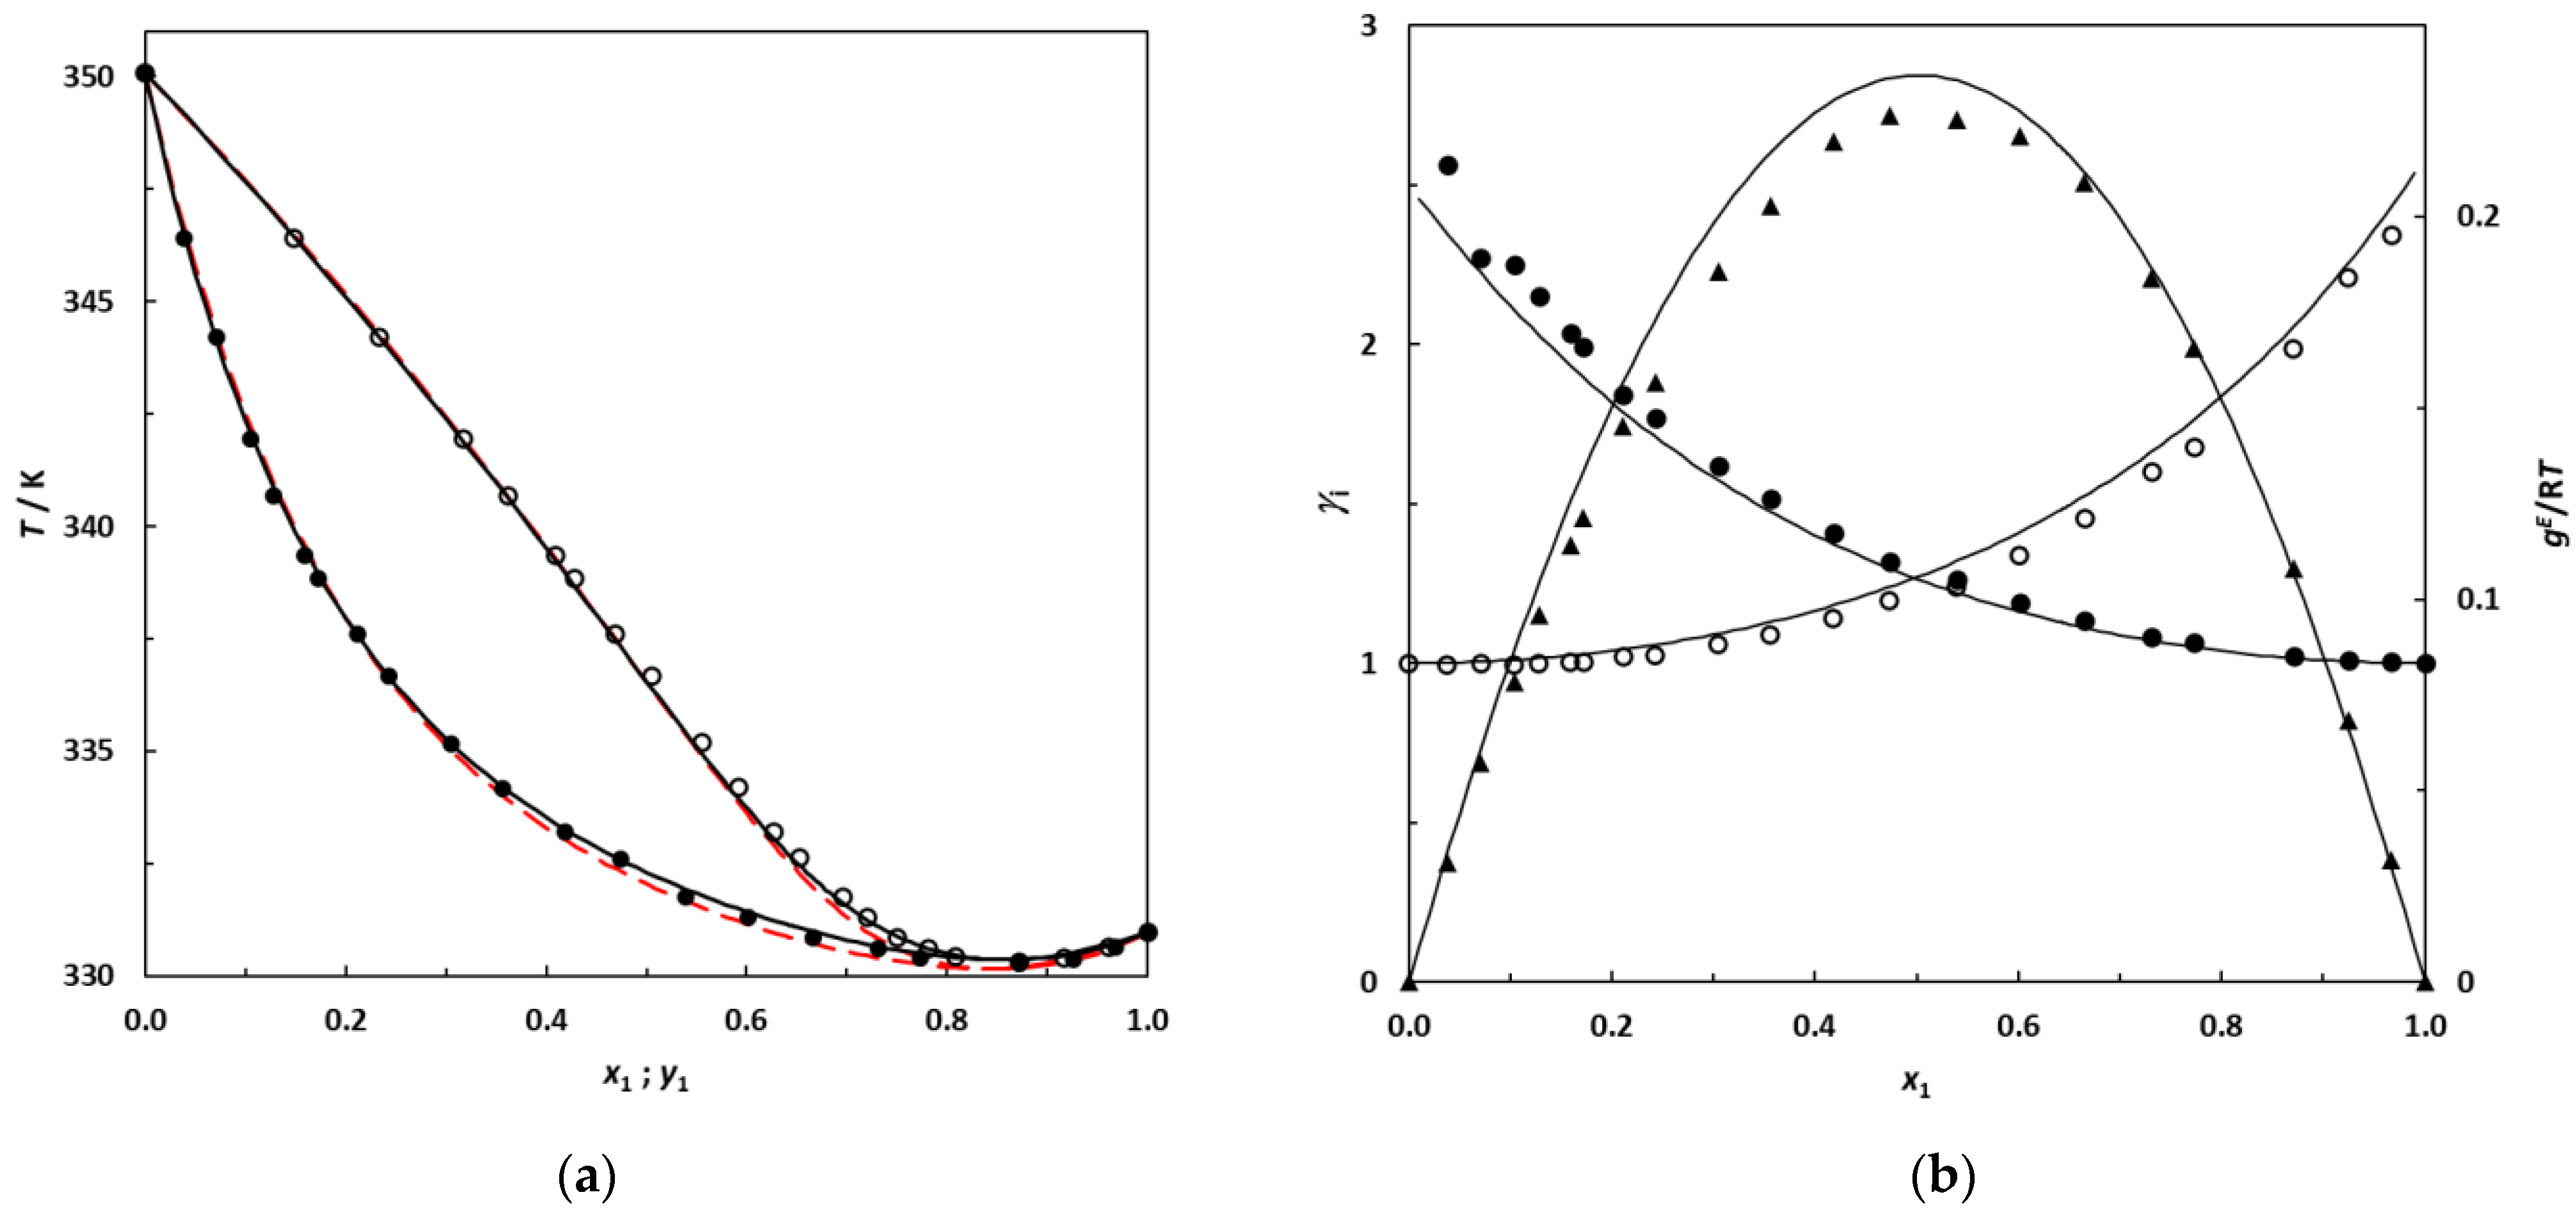
3.3. VLE Data and Consistency Checks

As mentioned previously, the accuracy of the experimental apparatus used for the VLE measurements and the suitability of the protocol were verified by remeasuring the VLE of the binary mixture hexane + EA at P = 101.3 kPa. A total of 23 VLE points were measured for this system, all of which are reported in Table 8 and plotted in Figure 2.
Taking into account the non-ideality of the vapor phase using the virial equation of state truncated after the second term, activity coefficients were calculated with
γ i = y i   P   φ i v a p x i   P i °   φ i *  
giving, for a binary system containing the pure components i and j,
γ i = y i   P x i   P i °   exp B i i v i L P P i ° + P 1 y i 2 2 B i j B i i B j j R   T  
where γ i is the activity coefficient of component i, and x i and y i are the molar compositions of component i in the liquid and vapor phases. P is the system’s total pressure, and P i ° is the saturation pressure of component i. The saturated liquid molar volumes v i L of the pure compounds were estimated with the Rackett equation [42], whereas the second virial coefficients (Bii, Bjj and Bij) were calculated from the correlation proposed by Tsonopoulos [43]. Using the calculated activity coefficients, the values of the excess Gibbs energy ( g E ) were obtained using the following expression:
g E = R T x i l n γ i
in which R is the universal gas constant, and T is the temperature.
The binary systems 3-methylpentane + EA and 2,3-dimethylbutane + EA were investigated in the same way as the binary system hexane + EA, and the experimental data acquired were treated similarly. The VLE data for the systems 3-methylpentane + EA (20 VLE data points) and 2,3-dimethylbutane + EA (20 VLE data points) are summarized in Table 9 and Table 10. They are additionally plotted in Figure 6 and Figure 7.
Consistency tests were performed on the experimental binary VLE data using two different tests: the Van Ness [44] point test modified by Fredenslund [45] and the Wisniak test (also called the L-W test) [46]. These thermodynamic consistency tests are commonly employed and are largely detailed elsewhere [32,38,47,48].
Table 11 summarizes the results of the consistency tests applied to the VLE data measured in this study. Hexane–EA and 3-methylpentane–EA both satisfy the Fredenslund test, whereas the binary system 2,3-dimethylbutane–EA obtains a result that is slightly higher than 0.01. The Wisniak test was thus additionally performed. The three data sets were validated by the L-W test with D values significantly lower than 3.
Binary mixtures of linear alkanes + EA are well known for presenting significant deviations from ideality [6,10] since they are constituted by a non-polar compound (alkane) and a polar compound (EA). Logically, the binary systems containing branched alkanes + EA studied in this paper also present large deviations from ideality. Moreover, similar to the systems hexane + EA and heptane + EA [10], the binary systems 3-methylpentane + EA and 2,3-dimethylbutane + EA exhibit a minimum boiling azeotrope at low concentrations of EA. The coordinates of the azeotrope for the studied systems derived from our experimental data are reported in Table 12.

3.4. VLE Data Correlation

The experimental VLE data were correlated using the activity coefficient model NRTL [49] with two adjustable parameters. The interaction parameters of the model were estimated using the Generalized Reduced Gradient (GRG) algorithm of the Microsoft Excel Solver add-in (with a convergence tolerance of 1 × 10⁻⁴) by minimizing the following objective function:
O F = i = 1 N 0.5 y 1 e x p y 1 c a l y 1 e x p 2 + 0.5 y 2 e x p y 2 c a l y 2 e x p 2 + T e x p T c a l T e x p 2
where N is the number of experimental points. For all binaries in this work, the non-randomness parameter α 12 of the NRTL model was set to 0.3.
The experimental results were also compared to predictions given by the modified UNIFAC (Dortmund) group contribution model [50,51]. Table 13 reports the binary interaction parameters of the NRTL model and the deviations obtained with the NRTL model and with UNIFAC predictions.
The new experimental VLE data at 101.3 kPa measured in this work for binary systems containing branched alkanes + EA are represented in Figure 6 and Figure 7 with the corresponding bubble and dew curves calculated from the NRTL model. The curves predicted by UNIFAC are also shown by red dashed lines.
Figure 6 and Figure 7 illustrate that the NRTL model provides a good description of the phase behavior of the studied systems, in which the azeotropic phenomenon is correctly reproduced. From Figure 6 and Figure 7, an increase in the gap between the boiling temperature of the pure compounds in the mixture appears to induce a shift in the azeotropic composition toward the most volatile component of the binary mixture. In future research, it would be interesting to investigate the 2,2-dimethylbutane (which is more volatile than 2,3-dimethylbutane) + EA binary system at 101.3 kPa to check for the existence of an azeotrope, since this binary is likely to be zeotropic.
Table 13 and Figure 6 and Figure 7 also highlight that the UNIFAC model is able to satisfactorily predict the phase behaviors of these systems, reaching deviations for the composition and equilibrium temperature that are relatively low for a purely predictive approach. In the absence of experimental data, this predictive model may be used with confidence for such mixtures.

Supplementary Materials

The following supporting information can be downloaded at https://www.mdpi.com/article/10.3390/liquids3020014/s1: Table S1. Comparison of the density at T = 293.15 K and 303.15 K and P = 101 kPa, ρ, of the pure components with literature values; Table S2. Coefficients of the Antoine expression employed in this work; Table S3. Coefficients of the polynomial density–composition equation; Figure S1. Calibration curve analysis of the binary system hexane (1)–ethyl acetate (2); Figure S2. Residual distribution plot for the excess molar volume of the binary system hexane (1)–ethyl acetate (2) at 298.15 K; Figure S3. Residual distribution plot for the excess molar volume of the binary system 3-methylpentane (1)–ethyl acetate (2) at 293.15 K, 298.15 K and 303.15 K; Figure S4. Residual distribution plot for the excess molar volume of the binary system 2,3-dimethylbutane (1)–ethyl acetate (2) at 293.15 K, 298.15 K and 303.15 K.

Author Contributions

Conceptualization, S.V.; methodology, S.V.; validation, V.C. and K.B.; formal analysis, S.V.; data measurements and investigation, V.C. and K.B.; resources, J.-L.H. and M.D.; writing—original draft preparation, S.V. and V.C.; writing—review and editing, S.V., J.-L.H. and M.D.; visualization, S.V.; supervision, S.V. All authors have read and agreed to the published version of the manuscript.

Funding

This research received no external funding.

Data Availability Statement

The data measured in this study are available within the article.

Conflicts of Interest

The authors declare no conflict of interest.

References

  1. Grisales Diaz, V.H.; Willis, M.J. Ethyl acetate production from dilute bioethanol with low energy intensity. J. Clean. Prod. 2022, 376, 134137. [Google Scholar] [CrossRef]
  2. Çakmak, A.; Kapusuz, M.; Ozcan, H. Experimental research on ethyl acetate as novel oxygenated fuel in the spark-ignition (SI) engine. Energy Sources Part A Recovery Util. Environ. Eff. 2023, 45, 178–193. [Google Scholar] [CrossRef]
  3. Dabbagh, H.A.; Ghobadi, F.; Ehsani, M.R.; Moradmand, M. The influence of ester additives on the properties of gasoline. Fuel 2013, 104, 216–223. [Google Scholar] [CrossRef]
  4. Musyoka, S.K.; Khalil, A.S.G.; Ookawara, S.A.; Elwardany, A.E. Effect of C4 alcohol and ester as fuel additives on diesel engine operating characteristics. Fuel 2023, 304, 127656. [Google Scholar] [CrossRef]
  5. Gaspar, D.J.; Phillips, S.D.; Polikarpov, E.; Albrecht, K.O.; Jones, S.B.; George, A.; Landera, A.; Santosa, D.M.; Howe, D.T.; Baldwin, A.G.; et al. Measuring and predicting the vapor pressure of gasoline containing oxygenates. Fuel 2019, 243, 630–644. [Google Scholar] [CrossRef]
  6. Acosta, J.; Arce, A.; Martínez-Ageitos, J.; Rodil, E.; Soto, A. Vapor-Liquid Equilibrium of the Ternary System Ethyl Acetate + Hexane + Acetone at 101.32 kPa. J. Chem. Eng. Data 2002, 47, 849–854. [Google Scholar] [CrossRef]
  7. Park, S.J.; Han, K.J.; Choi, M.J.; Gmehling, J. Isothermal vapor-liquid equilibria and excess molar volumes for the ternary mixtures containing 2-methyl pyrazine. Fluid Phase Equilib. 2002, 193, 109–121. [Google Scholar] [CrossRef]
  8. Liu, K.; Zhang, T.; Ma, Y.; Gao, J.; Xu, D.; Zhang, L.; Wang, Y. Vapour-liquid equilibrium measurements and correlation for separating azeotropic mixture (ethyl acetate + n-heptane) by extractive distillation. J. Chem. Thermodyn. 2020, 144, 106075. [Google Scholar] [CrossRef]
  9. Cripwell, J.T.; Schwarz, C.E.; Burger, A.J. Vapor-Liquid Equilibria Measurements for the Five Linear C6 Esters with n-Octane. J. Chem. Eng. Data 2016, 61, 2353–2362. [Google Scholar] [CrossRef]
  10. Fernández, L.; Pérez, E.; Ortega, J.; Canosa, J.; Wisniak, J. Measurements of the Excess Properties and Vapor-Liquid Equilibria at 101.32 kPa for mixtures of Ethyl Ethanoate + Alkanes (from C5 et C10). J. Chem. Eng. Data 2010, 55, 5519–5533. [Google Scholar] [CrossRef]
  11. Fernández, L.; Ortega, J.; Pérez, E.; Toledo, F.; Canosa, J. Multiproperty Correlation of Experimental Data of the Binaries Propyl Ethanoate + Alkanes (Pentane to Decane). New Experimental Information for Vapor-Liquid Equilibrium and Mixing Properties. J. Chem. Eng. Data 2013, 58, 686–706. [Google Scholar] [CrossRef] [Green Version]
  12. Ríos, R.; Ortega, J.; Fernández, L.; de Nuez, I.; Wisniak, J. Improvements in the Experimentation and the Representation of Thermodynamic Properties (iso-p VLE and yE) of Alkyl Propanoate + Alkane Binaries. J. Chem. Eng. Data 2014, 59, 125–142. [Google Scholar] [CrossRef] [Green Version]
  13. Ríos, R.; Ortega, J.; Fernández, L. Measurements and Correlations of the Vapor-Liquid Equilibria of Binary Mixtures and Excess Properties for Mixtures Containing an Alkyl (Methyl, Ethyl) Butanoate with an Alkane (Heptane, Nonane) at 101.3 kPa. J. Chem. Eng. Data 2012, 57, 3210–3224. [Google Scholar] [CrossRef]
  14. Pérez, E.; Ortega, J.; Fernández, L.; Wisniak, J.; Canosa, J. Contributions to the modeling and behavior of solutions containing ethanoates and hydrocarbons. New experimental data for binaries of butyl ester with alkanes (C5–C10). Fluid Phase Equilib. 2016, 412, 79–93. [Google Scholar] [CrossRef]
  15. Ortega, J.; Fernández, L.; Sosa, A.; Lorenzo, B.; Ríos, R.; Wisniak, J. New Advances in the Modeling and Verification of Experimental Information for Ester-Alkane Solutions: Application to a Batch-Distillation Case. Ind. Eng. Chem. Res. 2020, 59, 8346–8360. [Google Scholar] [CrossRef]
  16. Rios, R.; Ortega, J.; Sosa, A.; Fernández, L. Strategy for the Management of Thermodynamic Data with Application to Practical Cases of Systems Formed by Esters and Alkanes through Experimental Information, Checking-Modeling, and Simulation. Ind. Eng. Chem. Res. 2018, 57, 3410–3429. [Google Scholar] [CrossRef]
  17. Luis, P.; Wouters, C.; Sweygers, N.; Creemers, C.; Van der Bruggen, B. The potential of head-space chromatography for VLE measurements. J. Chem. Thermodyn. 2012, 49, 128–136. [Google Scholar] [CrossRef]
  18. Susial Badajoz, P.; García-Vera, D.; Marrero-Pérez, A.; Padrón-Guerra, N.; Mujica-González, T. Measurement of VLE Data by Using an Experimental Installation with Automatic Control: Modeling of Binary Systems of Methyl Acetate or Ethyl Acetate with n-Heptane or 2,2,4-Trimethylpentane at Both 0.1 and 1.5 MPa. J. Chem. Eng. Data 2019, 64, 5591–5608. [Google Scholar] [CrossRef]
  19. Pintos-Barral, M.; Bravo, R.; Roux-Desgranges, G.; Grolier, J.P.E.; Wilhelm, E. Excess molar heat capacities and excess molar volumes of (an n-alkylalkanoate + 2,2,4-trimethylpentane, or 2,2,4,4,6,8,8-heptamethylnonane) at T = 298.15 K. J. Chem. Thermodyn. 1999, 31, 1151–1164. [Google Scholar] [CrossRef]
  20. Awwad, A.M.; Jabra, K.A.; Al-Dujaili, A.H. Excess molar volumes of ethylacetate + hydrocarbons at 303.15 K: An interpretation in terms of the Prigogine-Flory-Patterson theory. Fluid Phase Equilib. 1989, 47, 95–102. [Google Scholar] [CrossRef]
  21. Ortega, J.; Toledo-Marante, F.J. Thermodynamic properties of (an ethyl ester + a branched alkane). XV. HEm and VEm values for (an ester + an alkane). J. Chem. Thermodyn. 2002, 34, 1439–1459. [Google Scholar] [CrossRef]
  22. Mohsen-Nia, M.; Modaress, H. Excess molar volume measurements of ternary mixtures [2-propanol+ethyl acetate+n-hexane] and their binary constituents at 298.15, 308.15 and 313.15 K. Phys. Chem. Liq. 2005, 43, 535–541. [Google Scholar] [CrossRef]
  23. Pereiro, A.B.; Rodríguez, A. Phase Equilibria of the Azeotropic Mixture Hexane + Ethyl Acetate with Ionic Liquids at 298.15 K. J. Chem. Eng. Data 2008, 53, 1360–1366. [Google Scholar] [CrossRef]
  24. Acosta, J.; Arce, A.; Rodil, E.; Soto, A. Densities, Speeds of Sound, Refractive Indices, and the Corresponding Changes of Mixing at 25 °C and Atmospheric Pressure for Systems Composed by Ethyl Acetate, Hexane, and Acetone. J. Chem. Eng. Data 2001, 46, 1176–1180. [Google Scholar] [CrossRef]
  25. Sastry, N.V.; Thakor, R.R.; Patel, M.C. Excess molar volumes, viscosity deviations, excess isentropic compressibilities and deviations in relative permittivities of (alkyl acetates (methyl, ethyl, butyl and isoamyl) + n-hexane, + benzene, + toluene, + (o-, m-, p-) xylenes, + (chloro-, bromo-, nitro-) benzene at temperatures from 298.15 to 313.15 K. J. Mol. Liq. 2009, 144, 13–22. [Google Scholar] [CrossRef]
  26. Loras, S.; Aucejo, A.; Muñoz, R. Phase equilibria in the systems 3-methylpentane + methylcyclohexane, diisopropyl ether + methylcyclohexane and 3-methylpentane + diisopropyl ether + methylcyclohexane at 101.3 kPa. Fluid Phase Equilib. 2002, 194–197, 957–968. [Google Scholar] [CrossRef]
  27. Kay, W.B. The Vapor Pressures and Saturated Liquid and Vapor Densities of the Isomeric Hexanes. J. Am. Chem. Soc. 1946, 68, 1336–1339. [Google Scholar] [CrossRef]
  28. Guerrero, H.; García-Mardones, M.; Pérez-Gregorio, V.; Gascón, I.; Lafuente, C. Experimental and VTPR-predicted volumetric properties of branched hexanes. Fluid Phase Equilib. 2013, 338, 141–147. [Google Scholar] [CrossRef]
  29. McConnell, C.G.; Van Winkle, M. Vapor-Liquid Equilibria in the Acetone−2,3-Dimethylbutane and Chloroform−2,3-Dimethylbutane systems. J. Chem. Eng. Data 1967, 12, 430–432. [Google Scholar] [CrossRef]
  30. García Baonza, V.; Cáceres Alonso, M.; Núñez Delgado, J. Study of the Equation of State of Liquid 2,3-Dimethylbutane at High Pressures. J. Phys. Chem. 1993, 97, 2002–2008. [Google Scholar] [CrossRef]
  31. Prokopová, O.; Blahut, A.; Čensky, M.; Součková, M.; Vinš, V. Comments on temperature calibration and uncertainty estimate of the vibrating tube densimeter operated at atmospheric pressure. J. Chem. Thermodyn. 2022, 173, 106855. [Google Scholar] [CrossRef]
  32. Zanghelini, G.; Athès, V.; Esteban-Decloux, M.; Giampaoli, P.; Vitu, S. Isobaric vapour-liquid equilibrium of α-terpineol highly diluted in hydroalcoholic mixtures at 101.3 kPa: Experimental measurements and thermodynamic modeling. J. Chem. Thermodyn. 2022, 171, 106806. [Google Scholar] [CrossRef]
  33. Zanghelini, G.; Esteban-Decloux, M.; Vitu, S.; Giampaoli, P.; Athès, V. β-Damascenone Highly Diluted in Hydroalcoholic Mixtures: Phase Equilibrium Measurements, Thermodynamic Modeling, and Simulation of a Batch Distillation. Ind. Eng. Chem. Res. 2022, 61, 18127–18137. [Google Scholar] [CrossRef]
  34. Muños-Rujas, N.; Rubio-Pérez, G.; Montero, E.A.; Aguilar, F. Isobaric Vapor-Liquid Equilibria at 50.0, 101.3, and 200.0 kPa. Density and Speed of Sound at 101.3 kPa and 298.15 K of Binary Mixtures HFE-7100 + 2-Propanol. J. Chem. Eng. Data 2020, 65, 4290–4298. [Google Scholar] [CrossRef]
  35. Ben Mahdoui, N.; Abidi, R.; Artigas, H.; Hichri, M.; Lafuente, C. Vapor-liquid equilibrium and excess properties of the binary mixtures formed by ethyl isobutyrate and n-alkanols. J. Chem. Thermodyn. 2019, 139, 105884. [Google Scholar] [CrossRef]
  36. Silva Vargas, K.; Katryniok, B.; Araque, M. Isobaric Vapor-Liquid Equilibrium Data for Six Binary Systems: Prop-2-en-1-ol (1)–Hexan-2-ol (2), Prop-2-en-1-ol (1)–Hexan-2-one (2), Hexan-2-one (1)–Hexan-2-ol (2), Prop-2-en-1-ol (1)–4-Methyl-pentan-2-ol (2), Prop-2-en-1-ol (1)–4-Methyl-pentan-2-one (2), and 4-Methyl-pentan-2-one (1)–4-Methyl-pentan-2-ol (2) at 101.32 kPa. J. Chem. Eng. Data 2021, 66, 1055–1067. [Google Scholar] [CrossRef]
  37. Ewing, M.B.; Sanchez Ochoa, J.C.S. Vapour pressures of n-hexane determined by comparative ebulliometry. J. Chem. Thermodyn. 2006, 38, 283–288. [Google Scholar] [CrossRef]
  38. Shaahmadi, F.; Thompson, C.; Burger, A.J.; Cripwell, J.T. Isobaric Vapor-Liquid Equilibria Measurements and Thermodynamic Modeling for the Systems Containing 2-Butanone, C3 Alcohols, and C4 esters: Part I—Binary Mixtures. J. Chem. Eng. Data 2022, 67, 676–688. [Google Scholar] [CrossRef]
  39. Willingham, C.B.; Taylor, W.J.; Pignocco, J.M.; Rossini, F.D. Vapor pressures and boiling points of some paraffin, alkylcyclopentane, alkylcyclohexane, and alkylbenzene hydrocarbons. J. Res. Natl. Bur. Stand. (U.S.) 1945, 35, 219–244. [Google Scholar] [CrossRef]
  40. Pavlíček, J.; Andresová, A.; Bogdanić, G.; Wichterle, I. Vapour-liquid equilibria in binary and ternary systems composed of 2,3-dimethylbutane, diisopropyl ether, and3-methyl-2-butanone at 313.15, 323.15 and 313.15 K. Fluid Phase Equilib. 2013, 344, 59–64. [Google Scholar] [CrossRef]
  41. Uusi-Kyyny, P.; Pokki, J.P.; Aittamaa, J.; Liukkonen, S. Vapor−Liquid Equilibrium for the Binary Systems of 3-Methylpentane + 2-Methyl-2-propanol at 331 K and + 2-Butanol at 331 K. J. Chem. Eng. Data 2001, 46, 754–758. [Google Scholar] [CrossRef]
  42. Rackett, H.G. Equation of state for saturated liquids. J. Chem. Eng. Data 1970, 15, 514–517. [Google Scholar] [CrossRef]
  43. Tsonopoulos, C. An Empirical Correlation of Second Virial Coefficients. AIChE J. 1974, 20, 263–272. [Google Scholar] [CrossRef]
  44. Van Ness, H.C.; Byer, S.M.; Gibbs, R.E. Vapor-Liquid Equilibrium: Part I. An Appraisal of Data Reduction Methods. AIChE J. 1973, 19, 238–244. [Google Scholar] [CrossRef]
  45. Fredenslund, A.; Gmehling, J.; Rasmussen, P. Vapor-Liquid Equilibria Using UNIFAC; Elsevier: Amsterdam, The Netherlands, 1977. [Google Scholar]
  46. Wisniak, J. A new test for the thermodynamic consistency of vapour-liquid equilibrium. Ind. Eng. Chem. Res. 1993, 32, 1531–1533. [Google Scholar] [CrossRef]
  47. Wisniak, J.; Ortega, J.; Fernández, L. A Fresh Look at the Thermodynamic Consistency of Vapour-Liquid Equilibria Data. J. Chem. Thermodyn. 2017, 105, 385–395. [Google Scholar] [CrossRef]
  48. Liu, H.; Cui, X.; Zhang, Y.; Feng, T.; Zhang, K. Isobaric Vapor-Liquid Equilibrium for the Binary and Ternary System with Isobutyl Alcohol, Isobutyl Acetate and Dimethyl Sulfoxide at 101.3 kPa. J. Chem. Eng. Data 2017, 62, 1902–1909. [Google Scholar] [CrossRef]
  49. Renon, H.; Prausnitz, J.M. Local compositions in thermodynamic excess functions for liquid mixtures. AIChE J. 1968, 14, 135–144. [Google Scholar] [CrossRef]
  50. Weidlich, U.; Gmehling, J. A modified UNIFAC model 1. Prediction of VLE, hE and γ∞. Ind. Eng. Chem. Res. 1987, 26, 1372–1381. [Google Scholar] [CrossRef]
  51. Constantinescu, D.; Gmehling, J. Further Development of Modified UNIFAC (Dortmund): Revision and Extension 6. J. Chem. Eng. Data 2016, 61, 2738–2748. [Google Scholar] [CrossRef]
Figure 1. (a) Densities of the binary system hexane (1)–EA (2) at 298.15 K; •: this work; : [10]; : [23]; Δ: [24]. (b) Excess molar volumes of the binary system hexane (1)–EA (2) at 298.15 K; •: this work; : [10]; : [23]; Δ: [24]. Dotted line: correlation curve using a Redlich–Kister expression.
Liquids 03 00014 g001
Figure 2. (a) Isobaric phase diagram for the system hexane (1)–EA (2) at 101.3 kPa; •: this work; : [10]; : [6]; filled symbols: bubble points; empty symbols: dew points. (b) Plot of the experimental activity coefficients and excess Gibbs energy as a function of hexane mole fraction for the binary system hexane (1)–EA (2) at 101.3 kPa; •: this work’s activity coefficients; : [10]; : [6]; filled symbols: γ1; empty symbols: γ2. ▲: gE/RT from this work; : [10]; : [6]. Solid lines: curves calculated using the NRTL model.
Liquids 03 00014 g002
Figure 3. (a) Excess molar volumes of the binary system 3-methylpentane (1)–EA (2) at 293.15 K, 298.15 K and 303.15 K; o: this work’s experimental data; •: data at 298.15 K from [21]. Dotted lines: correlation curves using Equation (2). (b) Excess molar volumes of the binary system 2,3-dimethylbutane (1)–EA (2) at 293.15 K, 298.15 K and 303.15 K; o: this work’s experimental data. Dotted lines: correlation curves using Equation (2).
Liquids 03 00014 g003
Figure 4. Excess molar volumes at 298.15 K of binary systems containing 6-carbon-atom alkanes + EA. Effect of the type of alkane (normal or branched) on the excess molar volume of the mixture. Hexane (1)–EA (2); 3-methylpentane (1)–EA (2); 2,3-dimethylbutane (1)–EA (2). ο: This work’s experimental data. Dotted lines: correlation curves using Equation (2) and parameters reported in Table 6.
Liquids 03 00014 g004
Figure 5. Vapor pressures, P, as a function of temperature, T, of the pure components used in this study. (a) Hexane and EA; ,•: this work; +,+: [10]; Δ: [37]; Δ: [38]. (b) 2,3-Dimethylbutane and 3-methylpentane; ,•: this work; +,+: [39]; Δ: [40]; Δ: [41]. Continuous lines: curves calculated using the Antoine equation with parameters regressed against vapor pressures measured in this work.
Liquids 03 00014 g005
Figure 6. (a) Isobaric phase diagram for the system 3-methylpentane (1)–EA (2) at 101.3 kPa; filled symbols: this work’s experimental bubble points; empty symbols: dew points. Solid lines: bubble and dew curves calculated using the NRTL model; red dashed lines: bubble and dew curves predicted using UNIFAC. (b) Plot of the experimental activity coefficients and excess Gibbs energy as a function of the 3-methylpentane mole fraction for the binary system 3-methylpentane (1)–EA (2) at 101.3 kPa; •: this work’s activity coefficients; filled symbols: γ1; empty symbols: γ2. ▲: gE/RT from this work. Solid lines: curves calculated using the NRTL model.
Liquids 03 00014 g006
Figure 7. (a) Isobaric phase diagram for the system 2,3-dimethylbutane (1)–EA (2) at 101.3 kPa; filled symbols: this work’s experimental bubble points; empty symbols: dew points. Solid lines: bubble and dew curves calculated using the NRTL model; red dashed lines: bubble and dew curves predicted using UNIFAC. (b) Plot of the experimental activity coefficients and excess Gibbs energy as a function of the 2,3-dimethylbutane mole fraction for the binary system 2,3-dimethylbutane (1)–EA (2) at 101.3 kPa; •: this work’s activity coefficients; filled symbols: γ1; empty symbols: γ2. ▲: gE/RT from this work. Solid lines: curves calculated using the NRTL model.
Liquids 03 00014 g007
Table 1. Description of the pure compounds used in this work.
CompoundCAS NumberSupplierMass Fraction Purity aMass Fraction Water Content b
Ethyl acetate (EA)141-78-6Sigma Aldrich0.9990.0008
Hexane110-54-3Merck0.9930.0008
3-Methylpentane96-14-0Sigma Aldrich0.9980.0005
2,3-Dimethylbutane79-29-8ThermoFisher Scientific0.9980.0003
a Information provided by the manufacturers. b Determined by Karl-Fischer titrations.
Table 2. Comparison of normal boiling temperature (at P = 101.3 kPa), Tb, density at T = 298.15 K and P = 101 kPa, ρ, of the pure components with literature values a.
CompoundTb/Kρ298.15K/g·cm−3
This WorkLiteratureThis WorkLiterature
Ethyl acetate (EA)350.09350.09  [6]
350.15 [10]
0.894450.89431  [6]
0.89440 [10]
Hexane341.80341.72  [6]
341.88 [10]
0.655240.65507  [6]
0.65490 [10]
3-Methylpentane336.30336.30 [26]
336.10 [27]
0.659720.65968 [21]
0.65973 [28]
2,3-Dimethylbutane330.99331.18 [27]
330.95 [29]
0.657510.65700 [28]
0.65717 [30]
a Standard uncertainties u are u(Tb) = 0.05 K, u(P) = 0.1 kPa, u(ρ) = 0.00005 g·cm−3, u(Tρ meas) = 0.03 K and u(Pρ meas) = 3 kPa.
Table 3. Experimental densities, ρ, at T = 298.15 K and P = 101 kPa, along with calculated excess molar volumes for hexane (1)–EA (2) mixtures of known molar compositions, x1 a.
x1 bρ/g·cm−3VE/cm3·mol−1x1ρ/g·cm−3VE/cm3·mol−1
0.00000.894450.0000.55460.738960.968
0.05120.876880.1710.60520.727870.958
0.10320.859910.3180.65550.717270.927
0.15570.843430.4620.70230.707800.874
0.20430.828870.5730.75290.697940.795
0.25420.814390.6890.79230.690460.729
0.30560.800250.7690.85060.679890.588
0.35470.787250.8330.90140.671130.425
0.40520.774200.9120.94960.663170.238
0.45580.761810.9471.00000.655240.000
0.50540.750090.971
a Standard uncertainties u are u(x1) = 0.0001, u(ρ) = 0.00005 g·cm−3, u(T) = 0.03 K, and u(P) = 3 kPa. b x1 is the mole fraction of hexane.
Table 4. Experimental densities, ρ, at P = 101 kPa, along with calculated excess molar volumes for the binary system 3-methylpentane (1)–EA (2) at 293.15, 298.15 and 303.15 K a.
x1 bT = 293.15 KT = 298.15 KT = 303.15 K
ρ/g·cm−3VE/cm3·mol−1ρ/g·cm−3VE/cm3·mol−1ρ/g·cm−3VE/cm3·mol−1
0.00000.900490.0000.894450.0000.888290.000
0.05190.883200.1470.877230.1520.871170.155
0.10260.867090.2690.861200.2770.855250.280
0.15390.851430.3810.845610.3940.839710.405
0.20420.836620.4870.830870.5040.825040.519
0.25460.822400.5740.816720.5950.810970.612
0.30470.808810.6470.803210.6700.797540.689
0.35540.795520.7150.790000.7390.784400.762
0.40530.782900.7720.777450.7990.771920.825
0.45510.770800.8110.765420.8390.759970.865
0.50610.758880.8320.753590.8590.748210.888
0.55530.747780.8400.742570.8660.737260.896
0.60390.737220.8310.732080.8570.726850.885
0.65420.726650.8080.721580.8340.716430.862
0.70300.716800.7630.711800.7880.706720.815
0.75370.706910.7010.701990.7230.696990.748
0.79690.698800.6270.693950.6460.689020.667
0.84620.689840.5260.685060.5420.680210.559
0.90100.680330.3750.675630.3870.670870.398
0.94910.672320.2160.667710.2190.663020.226
1.00000.664270.0000.659720.0000.655110.000
a Standard uncertainties u are u(x1) = 0.0001, u(ρ) = 0.00005 g·cm−3, u(T) = 0.03 K and u(P) = 3 kPa. b x1 is the mole fraction of 3-methylpentane.
Table 5. Experimental densities, ρ, at P = 101 kPa, along with calculated excess molar volumes for the binary system 2,3-dimethylbutane (1)–EA (2) at 293.15, 298.15 and 303.15 K a.
x1 bT = 293.15 KT = 298.15 KT = 303.15 K
ρ/g·cm−3VE/cm3·mol−1ρ/g·cm−3VE/cm3·mol−1ρ/g·cm−3VE/cm3·mol−1
0.00000.900490.0000.894450.0000.888290.000
0.05380.882680.1180.876710.1230.870650.125
0.10300.867050.2160.861160.2230.855170.229
0.15420.851420.3060.845600.3180.839690.327
0.20490.836490.3920.830740.4060.824910.418
0.25470.822330.4710.816650.4890.810900.503
0.30540.808480.5370.802880.5560.797200.573
0.35630.795060.5960.789530.6170.783920.637
0.40590.782540.6300.777080.6530.771550.674
0.45400.770740.6630.765360.6860.759900.709
0.50520.758620.6870.753310.7110.747920.735
0.55530.747180.6970.741950.7210.736630.746
0.60540.736170.6880.731010.7120.725770.736
0.65460.725650.6800.720560.7030.715390.727
0.70370.715610.6400.710590.6620.705490.686
0.75210.706030.5880.701080.6090.696050.631
0.80180.696570.5110.691690.5300.686740.548
0.85060.687590.4200.682780.4360.677900.452
0.90070.678680.3100.673950.3210.669140.333
0.94660.670850.1800.666190.1860.661460.192
1.00000.662090.0000.657510.0000.652860.000
a Standard uncertainties u are u(x1) = 0.0001, u(ρ) = 0.00005 g·cm−3, u(T) = 0.03 K and u(P) = 3 kPa. b x1 is the mole fraction of 2,3-dimethylbutane.
Table 6. Parameters of the Redlich–Kister function (see Equation (2)) for the correlation of the excess molar volume (VE/cm3·mol−1) a.
Binary SystemT/K a 0 a 1 a 2 a 3
Hexane–EA298.153.843920.670070.452320.20695
3-Methylpentane–EA293.153.295880.713860.460910.14146
3-Methylpentane–EA298.153.408590.741590.445230.09746
3-Methylpentane–EA303.153.524420.776100.412110.12022
2,3-Dimethylbutane–EA293.152.745560.670170.223930.03453
2,3-Dimethylbutane–EA298.152.843260.695010.236870.02754
2,3-Dimethylbutane–EA303.152.939390.730360.229970.03870
a Using the above coefficients in Equation (2), the unit of VE is cm3·mol−1.
Table 7. Pure components’ vapor pressures measured in this study a.
P/kPaT/K
Ethyl AcetateHexane3-Methylpentane2,3-Dimethylbutane
40.0324.42
45.0327.43
50.0330.18320.99315.58310.35
55.0332.70323.63318.21312.96
60.0335.05326.08320.65315.40
65.0337.25328.38322.92317.66
70.0339.31330.53325.08319.82
75.0341.27332.57327.12321.85
80.0343.12334.48329.03323.76
85.0344.86336.33330.85325.59
90.0346.55338.08332.61327.31
95.0348.16339.76334.28328.99
100.0349.69341.38335.89330.59
101.3350.09341.80336.30330.99
a Standard uncertainties u are u(T) = 0.05 K, u(P) = 0.1 kPa.
Table 8. Isobaric vapor–liquid equilibrium data at P = 101.3 kPa for the binary system hexane (1)–EA (2) a.
T/K x 1 y 1 γ 1 γ 2 g E / R T
350.090.0000.000 1.0000.000
346.380.0590.1632.4591.0020.055
345.950.0690.1822.3751.0040.063
344.610.1020.2492.2800.9990.083
343.850.1200.2782.2111.0050.100
342.730.1600.3322.0431.0120.125
342.440.1730.3481.9971.0140.131
341.060.2340.4131.8221.0330.165
340.580.2580.4311.7491.0510.181
339.590.3420.4911.5461.0980.211
339.410.3480.4941.5371.1090.217
339.030.3820.5131.4701.1410.229
338.720.4210.5351.4031.1760.237
338.300.5300.5921.2481.2920.238
338.090.6050.6291.1681.4100.230
338.060.6670.6621.1151.5280.214
338.070.6890.6751.1001.5730.207
338.110.7170.6921.0821.6370.196
338.210.7580.7191.0601.7420.178
338.350.7920.7451.0461.8330.162
338.670.8360.7821.0301.9690.136
338.990.8660.8171.0282.0040.117
340.070.9340.8901.0042.3650.061
340.990.9750.9541.0032.5390.026
341.801.0001.0001.000 0.000
a Standard uncertainties u are u(T) = 0.05 K, u(P) = 0.1 kPa and u(x) = u(y) = 0.001. T/K, equilibrium temperature; x 1 and y 1 , liquid phase’s and vapor phase’s hexane mole fractions, respectively; γ i , activity coefficient of component i; g E / R T , dimensionless Gibbs function.
Table 9. Isobaric vapor–liquid equilibrium data at P = 101.3 kPa for the binary system 3-methylpentane (1)–EA (2) a.
T/K x 1 y 1 γ 1 γ 2 g E / R T
350.090.0000.000 1.0000.000
347.270.0360.1212.4930.9980.031
345.280.0680.2052.3570.9960.055
343.480.1020.2702.1741.0080.087
341.440.1500.3612.0901.0000.110
340.980.1640.3772.0221.0070.121
339.370.2200.4411.8451.0240.153
338.430.2650.4771.7021.0510.177
337.450.3200.5191.5771.0810.199
336.850.3570.5441.5081.1080.212
336.470.3870.5611.4501.1340.221
336.000.4370.5861.3601.1850.230
335.300.5120.6291.2711.2570.235
334.900.5710.6591.2081.3350.232
334.580.6330.6911.1531.4320.222
334.350.7060.7281.0961.5890.201
334.340.7750.7681.0531.7740.169
334.400.8250.8031.0321.9360.142
334.550.8710.8421.0202.0990.113
334.930.9210.8921.0102.3180.075
335.680.9690.9521.0012.5650.030
336.301.0001.0001.000 0.000
a Standard uncertainties u are u(T) = 0.05 K, u(P) = 0.1 kPa and u(x) = u(y) = 0.001. T/K, equilibrium temperature; x 1 and y 1 , liquid phase’s and vapor phase’s 3-methylpentane mole fractions, respectively; γ i , activity coefficient of component i; g E / R T , dimensionless Gibbs function.
Table 10. Isobaric vapor–liquid equilibrium data at P = 101.3 kPa for the binary system 2,3-dimethylbutane (1)–EA (2) a.
T/K x 1 y 1 γ 1 γ 2 g E / R T
350.090.0000.000 1.0000.000
346.420.0380.1492.5630.9950.031
344.220.0710.2332.2720.9990.057
341.960.1040.3182.2480.9940.079
340.690.1280.3622.1520.9980.096
339.360.1590.4102.0351.0020.114
338.860.1720.4281.9911.0040.121
337.620.2110.4691.8411.0210.145
336.680.2430.5061.7711.0240.157
335.190.3050.5561.6171.0580.186
334.190.3560.5921.5181.0880.203
333.220.4180.6271.4081.1410.220
332.620.4730.6531.3191.1980.226
331.770.5390.6961.2651.2400.226
331.310.6010.7211.1911.3380.221
330.870.6650.7501.1341.4530.209
330.630.7310.7811.0821.6010.184
330.430.7730.8081.0641.6780.166
330.300.8710.8721.0231.9840.108
330.390.9250.9171.0102.2110.069
330.660.9670.9611.0042.3440.032
330.991.0001.0001.000 0.000
a Standard uncertainties u are u(T) = 0.05 K, u(P) = 0.1 kPa and u(x) = u(y) = 0.001. T/K, equilibrium temperature; x 1 and y 1 , liquid phase’s and vapor phase’s 2,3-dimethylbutane mole fractions, respectively; γ i , activity coefficient of component i; g E / R T , dimensionless Gibbs function.
Table 11. Synthesis of the consistency tests performed on the VLE data measured in this work.
CriterionFredenslund TestWisniak Test
Δy ≤ 0.01Point Test 0.92 < Li/Wi < 1.08 Area Test D ≤ 3
Hexane–EA0.0060.962 < Li/Wi < 0.9821.73 (L = 5.65; W = 5.85)
3-Methylpentane–EA0.0050.960 < Li/Wi < 0.9851.74 (L = 5.99; W = 6.20)
2,3-Dimethylbutane–EA0.0120.957 < Li/Wi < 0.9851.81 (L = 6.44; W = 6.68)
Table 12. Experimental coordinates of the azeotrope for the binary systems investigated at P = 101.3 kPa.
System x 1 , a z T a z  
Hexane (1)–EA (2)0.655338.05
3-Methylpentane (1)–EA (2)0.757334.33
2,3-Dimethylbutane (1)–EA (2)0.877330.30
Table 13. Binary interaction parameters of the NRTL model and deviations in equilibrium temperature and vapor phase molar composition using NRTL and UNIFAC models.
SystemNRTL ParametersNRTLUNIFAC
Δg12/J·mol−1 Δg21/J·mol−1 Δy ΔT/K Δy ΔT/K
Hexane (1)–EA (2)1441.51575.90.00360.060.00700.38
3-Methylpentane (1)–EA (2)1665.91302.80.00270.080.00460.16
2,3-Dimethylbutane (1)–EA (2)1342.41496.00.00790.090.00800.16
Disclaimer/Publisher’s Note: The statements, opinions and data contained in all publications are solely those of the individual author(s) and contributor(s) and not of MDPI and/or the editor(s). MDPI and/or the editor(s) disclaim responsibility for any injury to people or property resulting from any ideas, methods, instructions or products referred to in the content.

