
Density and Dynamic Viscosity of Perfluorodecalin-Added n-Hexane Mixtures: Deciphering the Role of Fluorous Liquids

Department of Chemistry, Indian Institute of Technology Delhi, Hauz Khas, New Delhi 110016, India
*
Author to whom correspondence should be addressed.
Liquids 2023, 3(1), 48-56; https://doi.org/10.3390/liquids3010005
Submission received: 21 November 2022
/
Revised: 26 December 2022
/
Accepted: 29 December 2022
/
Published: 4 January 2023
(This article belongs to the Special Issue Modeling of Liquids Behavior: Experiments, Theory and Simulations)
Abstract
:Fluorous solvents are deputed as prominent solvent systems owing to their salient features, unique physical properties, and ecological importance. In this study, the temperature- and composition-dependence of physical properties, density (ρ/g·cm−3), and dynamic viscosity (η/mPa·s), of neat perfluorodecalin (PFD) and PFD-added n-hexane mixtures with select compositions are reported. Density follows a linear decrease with temperature and a quadratic increase with the mole fraction of PFD. The sensitivity or dependence of density on temperature increases with an increase in PFD mole fraction. The temperature-dependence of the dynamic viscosity of the investigated mixtures follows the Arrhenius-type expression from which the resultant activation energy of the viscous flow (Ea,η) is determined. Interestingly, the composition-dependence of dynamic viscosity shows exponential growth with an increase in PFD mole fraction. Excess molar volumes (VE) and deviation in the logarithmic viscosities ∆(ln η) of the mixtures are calculated to highlight the presence of strong repulsive interactions between the two mixture components.
1. Introduction
The solvent media is crucial in defining chemical reactivity, molecular associations, and catalytic properties of any chemical reaction. Fluorous chemistry employing perfluorinated hydrocarbons as solvent systems opens new avenues as alternative solvent media to highly toxic, flammable, non-biodegradable, and environmentally-persistent conventional organic solvents and ionic liquids (ILs) [1,2,3,4,5]. Perfluorinated solvents are designated as “fluorous” solvents, analogous to the term aqueous, and are widely accepted as highly non-polar and solvophobic in nature. Fluorinated solvents exhibit temperature-dependent solubility with organic solvents [6,7]. This unique thermomorphic effect enables switching between heterogeneous and homogeneous phases of fluorous solvents with organic liquids and subsequent mass transfer. The unique solvophobicity of fluorous solvents enables their use in biphasic catalysis and separation techniques [8,9].
Fluorous solvents are used in numerous applications, including the synthesis of nanoparticles [10], in enzymatic and homogeneous catalysis [11], biomolecular separations, microfluidic devices, components of artificial blood, and green chemistry [12]. Cyclic perfluorinated solvents are used as substitutes for blood plasma due to their remarkable stability; capability of dissolving two biologically important gases, oxygen and carbon dioxide; and their nontoxic nature [13]. Toxicity associated with fluorous solvents, in general, is a topic of intense research [14,15]. Despite having a plethora of applications and unique properties as a solvent medium, studies including fluorous solvents are scarce. Physical properties like dynamic viscosity, density, refractive index, and surface tension play a crucial role in developing typical applications of a solvent and help expand its application potential.
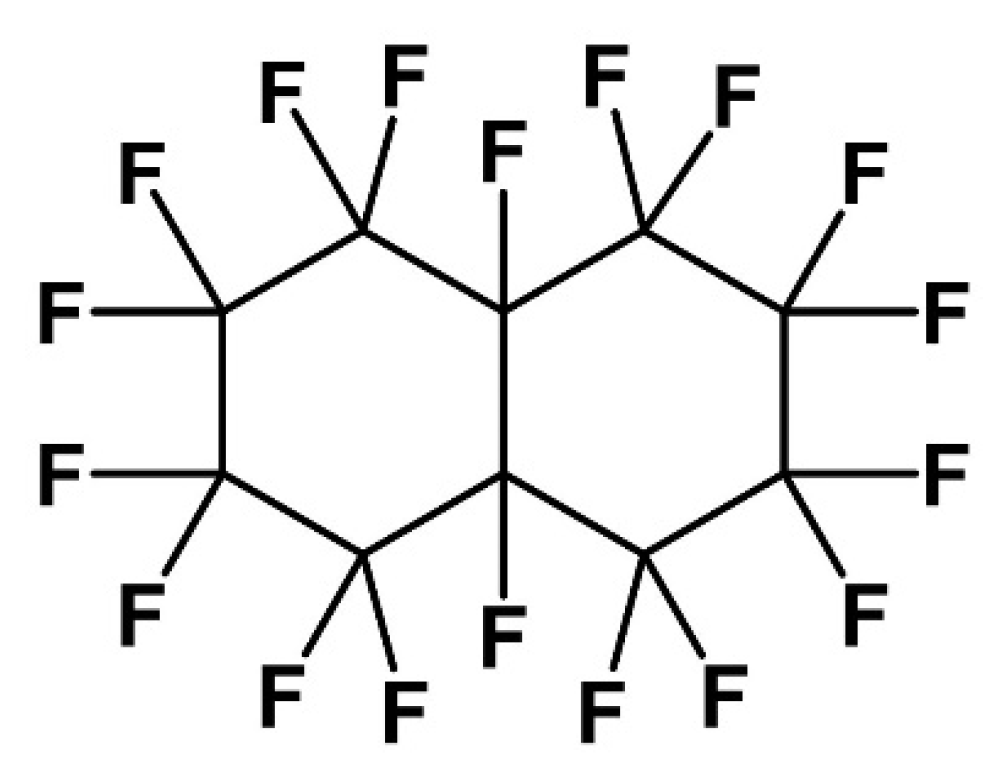
In this work, we have reported the temperature and composition dependence of two crucial thermophysical properties—density and dynamic viscosity—of a mixture consisting of a fluorous solvent shown in Figure 1, octadecafluorodecahydronaphthalene (commonly known as perfluorodecalin, PFD), and a common and popular organic solvent, n-hexane. PFD is a stable, colorless perfluorinated derivative of decalin and is chemically and biologically inert. It can exist in two isomeric forms, cis-isomer and trans-isomer. Due to its remarkable capacity to dissolve oxygen, it is used in several medical applications, including storing organs and tissues, an ingredient in fluosol, and in liquid breathing [13,16]. Interestingly, the two non-polar solvents, one hydrocarbon and one fluorocarbon, show complete miscibility at each composition investigated and at every temperature ≥288 K (standard uncertainty: u(T) = ±0.05 K). In addition, the easy tunability of the composition of two mixture components allows us to study the composition-dependence of the investigated thermophysical properties as well; consequently, molar excess properties are also evaluated.
2. Materials and Methods
The investigated mixtures were prepared by mixing PFD (>95.0% from Tokyo Chemicals Industry Co. Ltd., Tokyo, Japan) and n-hexane (≥99.0% from Sigma-Aldrich, St. Louis, Missouri, MO, USA) in their respective pre-calculated amount using a Denver Instrument balance having a precision of ±0.1 mg. Neat PFD, neat n-hexane, and three stable and homogeneous solutions having mole fraction ratio: xPFD/xHex = 0.2/0.8; 0.5/0.5; 0.8/0.2 were used for physical property determination. Densities (ρ) of the neat components, as well as of the (PFD + n-hexane) mixtures, were measured using a Mettler Toledo, DE45 delta range density meter. The density measurement with the above-mentioned density meter was based on the electromagnetically induced oscillations of a U-shaped glass tube. The standard deviations associated with the density measurement are ±0.0001 g·cm−3. The measurements were performed in a temperature range (293 to 333 K). The dynamic viscosities (η) were measured with a Peltier-based (resolution of 0.01 K and accuracy <0.05 K) automated Anton Paar microviscometer (model AMVn) having calibrated glass capillaries of different diameters (1.6, 1.8, 3.0, and 4.0 mm). This instrument is based on the rolling-ball principle, wherein a steel ball rolls down the inside of inclined, sample-filled calibrated glass capillaries. The deviation in η was ±0.001 mPa·s.
3. Results and Discussion
The two non-polar hydrocarbons, PFD and n-hexane, have an atmospheric boiling point of 415 K and 342 K, respectively. The density and dynamic viscosity of neat PFD (1.917 g·cm−3 and 5.412 mPa·s, respectively) and neat n-hexane (0.6593 g·cm−3 and 0.300 mPa·s, respectively) at 298 K are reported in the literature [17,18]. These reported values are in good agreement with our measured values (vide infra). The slight disparities in the values may be attributed to the differences in the instrumentation used, the purity of the chemicals, and the source of the compounds.
3.1. Density of PFD and (PFD + n-Hexane) Mixtures
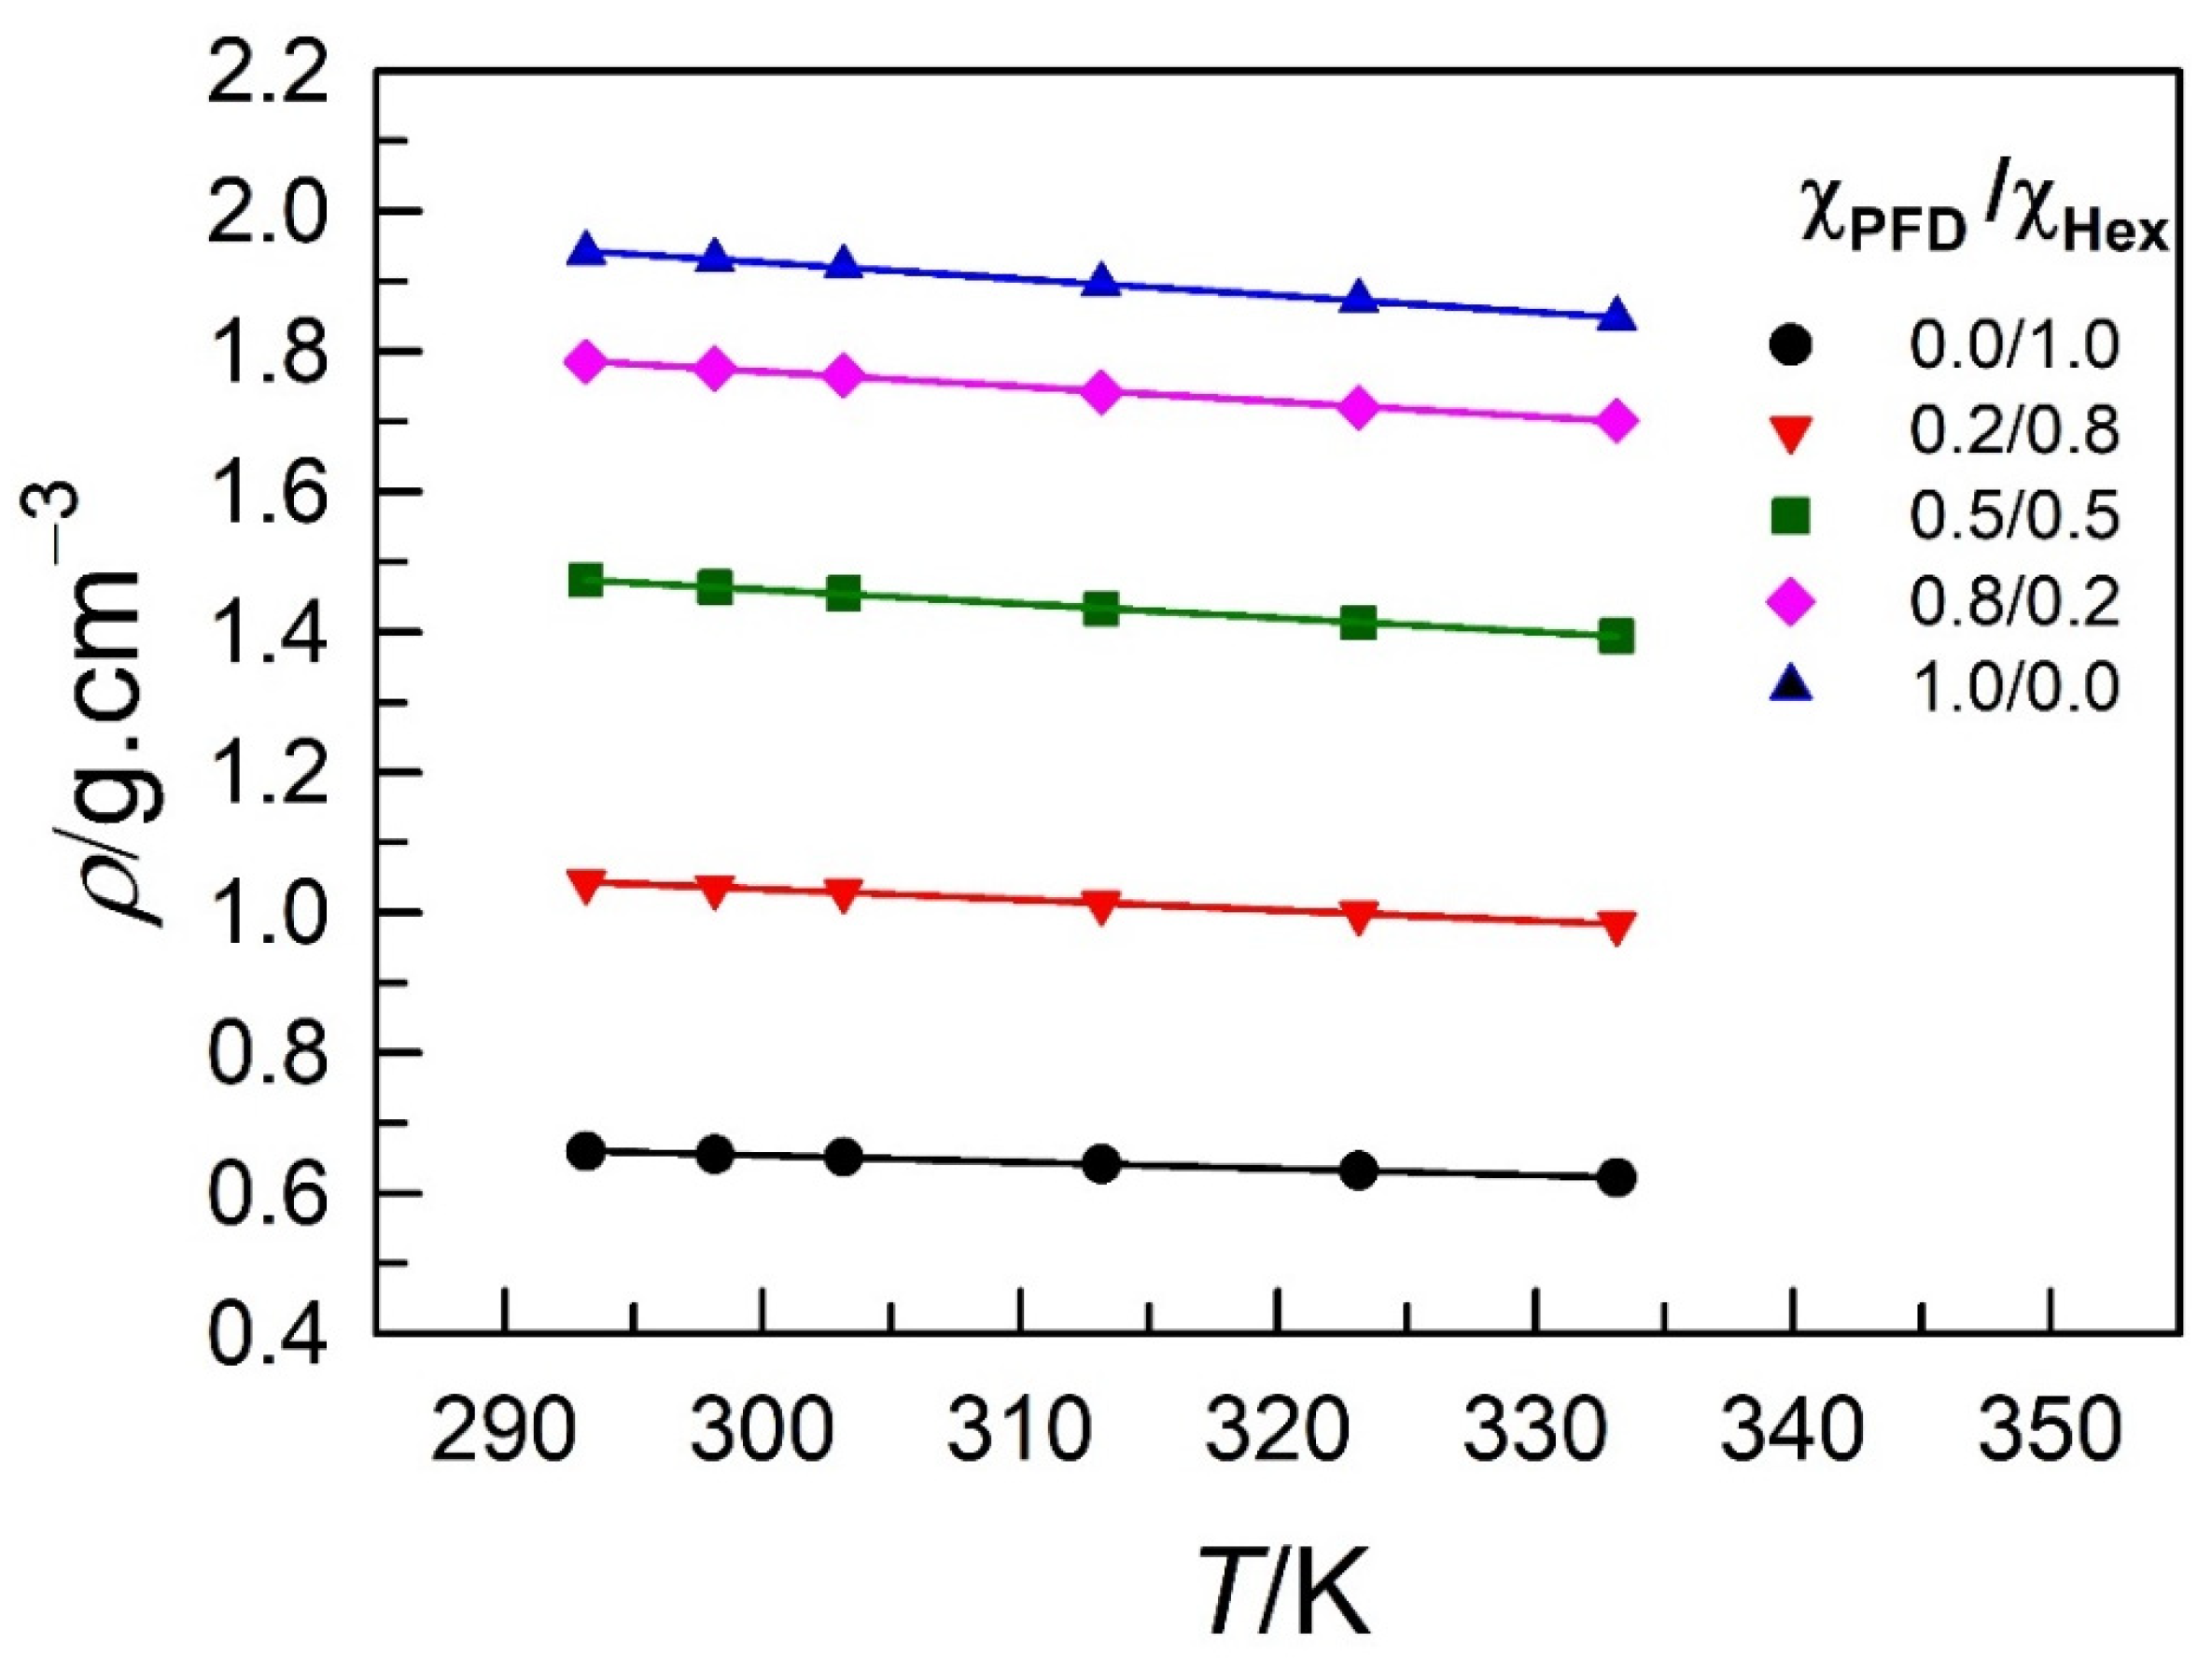
Experimentally measured densities of PFD and (PFD + n-hexane) mixtures as a function of temperature in the range (293 to 333) K at select compositions are reported in Table 1. As expected, with increase in temperature, the densities of PFD, n-hexane, and their mixtures were found to decrease primarily due to thermal expansion and follow a linear dependence according to the equation:
where ρ/g·cm−3 is the density of (PFD + n-hexane) mixtures. The values of the parameters (representing density at T = 0 K) and the slope a along with the standard deviation of the fits are listed in Table 2 (measured densities of (PFD + n-hexane) mixtures along with the fits to a linear expression are presented in Figure 2).
A careful examination of the density data presented in Table 1 and Table 2, along with Figure 2, indicates the density of PFD to be not only higher than that of water but also that it is significantly higher than that of n-hexane (almost 3-fold) at all temperatures. It is inferred that biphasic aqueous extractions using PFD would have PFD as the lower phase and water as the higher phase, as opposed to several organic non-polar solvents that have densities lower than that of water. It is also interesting to note that the density of the PFD is much more sensitive to temperature variation compared to the density of n-hexane (the slope of vs. T is −2.4 (± 0.05) × 10−3 g·cm3·K−1 for PFD as opposed to only −0.9 (± 0.01) × 10−3 g·cm3·K−1 for n-hexane). Such a high sensitivity of density on temperature for PFD may find uses in several industrial applications and processes and also as temperature sensors based on physical property changes [19].
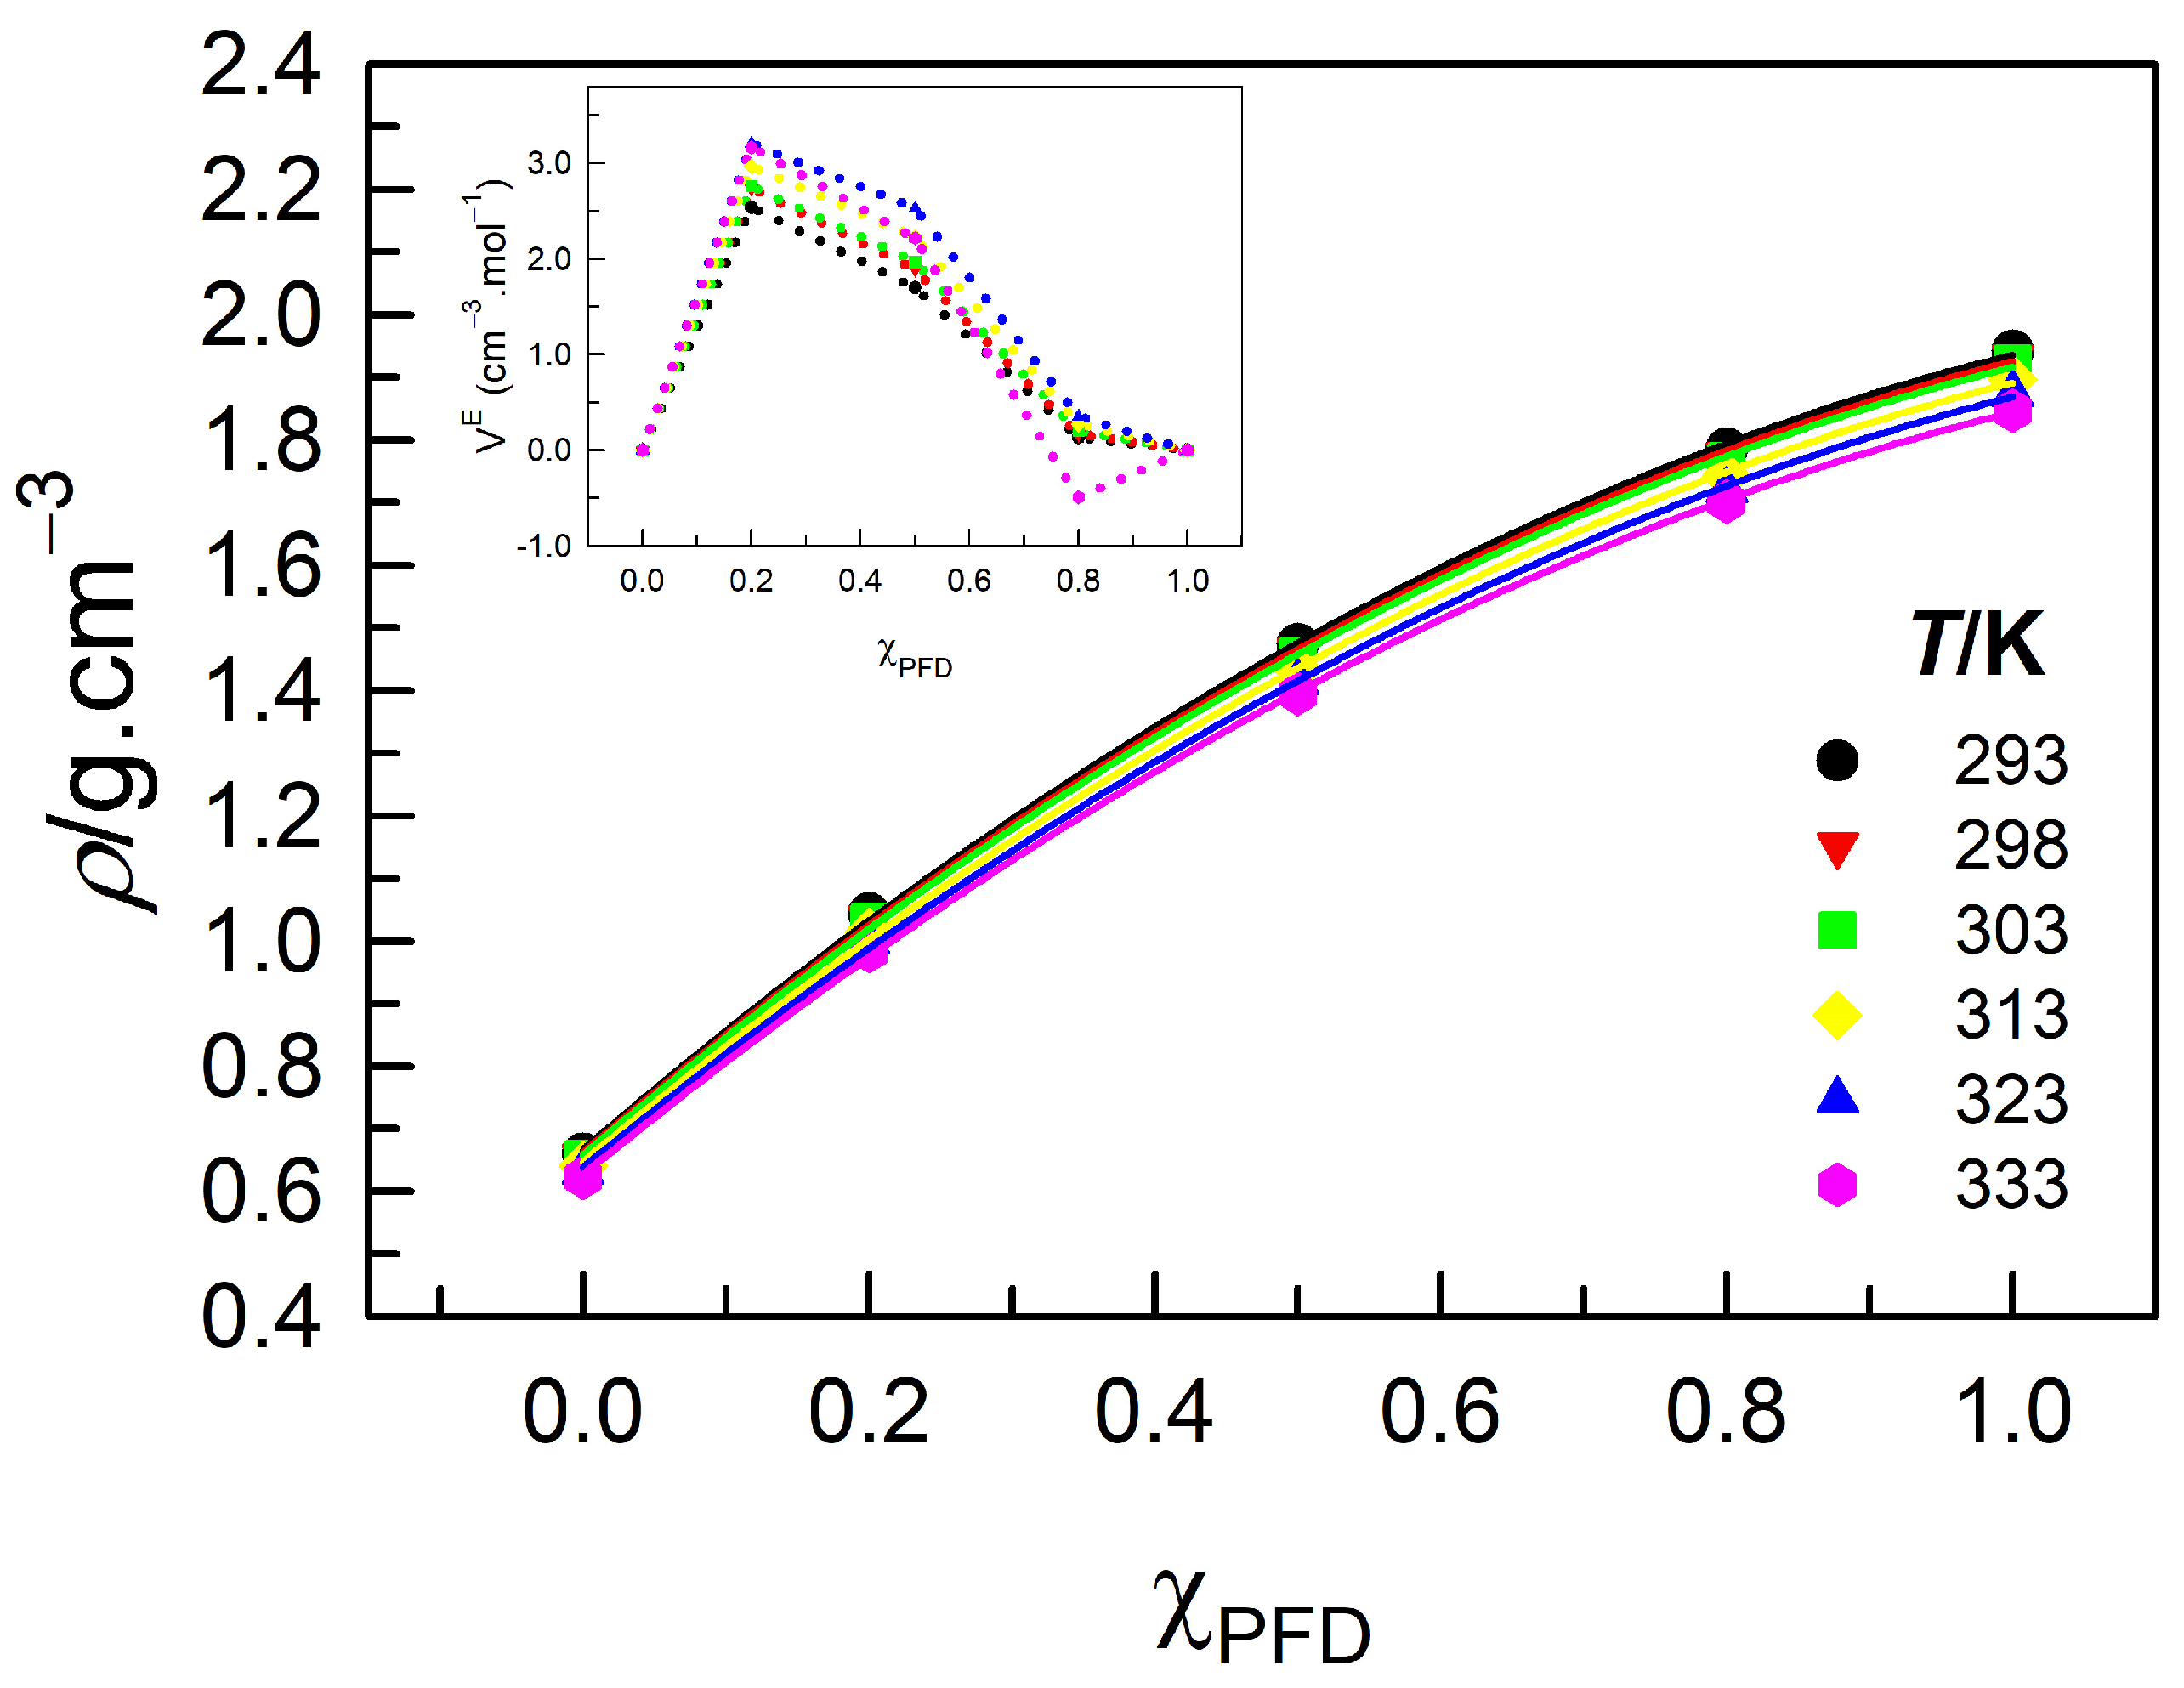
As expected, the density of n-hexane increases monotonically as PFD is gradually added to it (Figure 3). The increase in density with increasing PFD mole fraction in the mixture is not linear, and it rather shows a downward curvature and best fits a quadratic expression:
where xPFD is the mole fraction of PFD in the (PFD + n-hexane) mixtures, and values of parameters 0,xPFD, b, and c are listed in Table 3, while the fits are represented with dark curves in Figure 3. Quadratic dependence of the density on PFD mole fraction of the (PFD + n-hexane) mixtures is clearly established. Excess molar volume (VE) was estimated using equation 3 to assess the extent of molecular-level interactions within (PFD + n-hexane) mixtures.
Here, xPFD, xn-hexane, and ρPFD, ρn-hexane refer to the mole fractions and densities, respectively, of PFD and n-hexane at a given temperature, and ρm is the density of the mixture. MPFD and Mn-hexane are the molecular weights of PFD and n-hexane, respectively. The VE at each investigated temperature for (PFD + n-hexane) mixtures are presented as a function of xPFD in the inset of Figure 3. It is clear that, irrespective of the T, VE are mostly positive and have maxima at ca. xPFD = 0.2. The positive VE points to volume expansion on mixing PFD and n-hexane and thus hints more at the presence of repulsive interaction (s) between PFD and n-hexane or weaker interactions between them than the interactions present within neat PFD and n-hexane, respectively. It may be inferred that the incompatibility of fluorous solvents with most non-fluorous substances brings in the repulsive interaction when the two substances are mixed.
3.2. Dynamic Viscosity of PFD and (PFD + n-Hexane) Mixtures
Experimentally measured dynamic viscosities (η/mPa·s) of PFD and (PFD + n-hexane) mixtures in the temperature range (293 to 333) K are reported in Table 4. It is to be noted that η of PFD is much higher than that of n-hexane and is comparable to 2-ethyl-1-hexanol and other mid-chain alkyl alcohols. While in such alcohols, H-bonding usually gives rise to higher η; in PFD the interaction between fluorine atoms may cause similar η values [20].
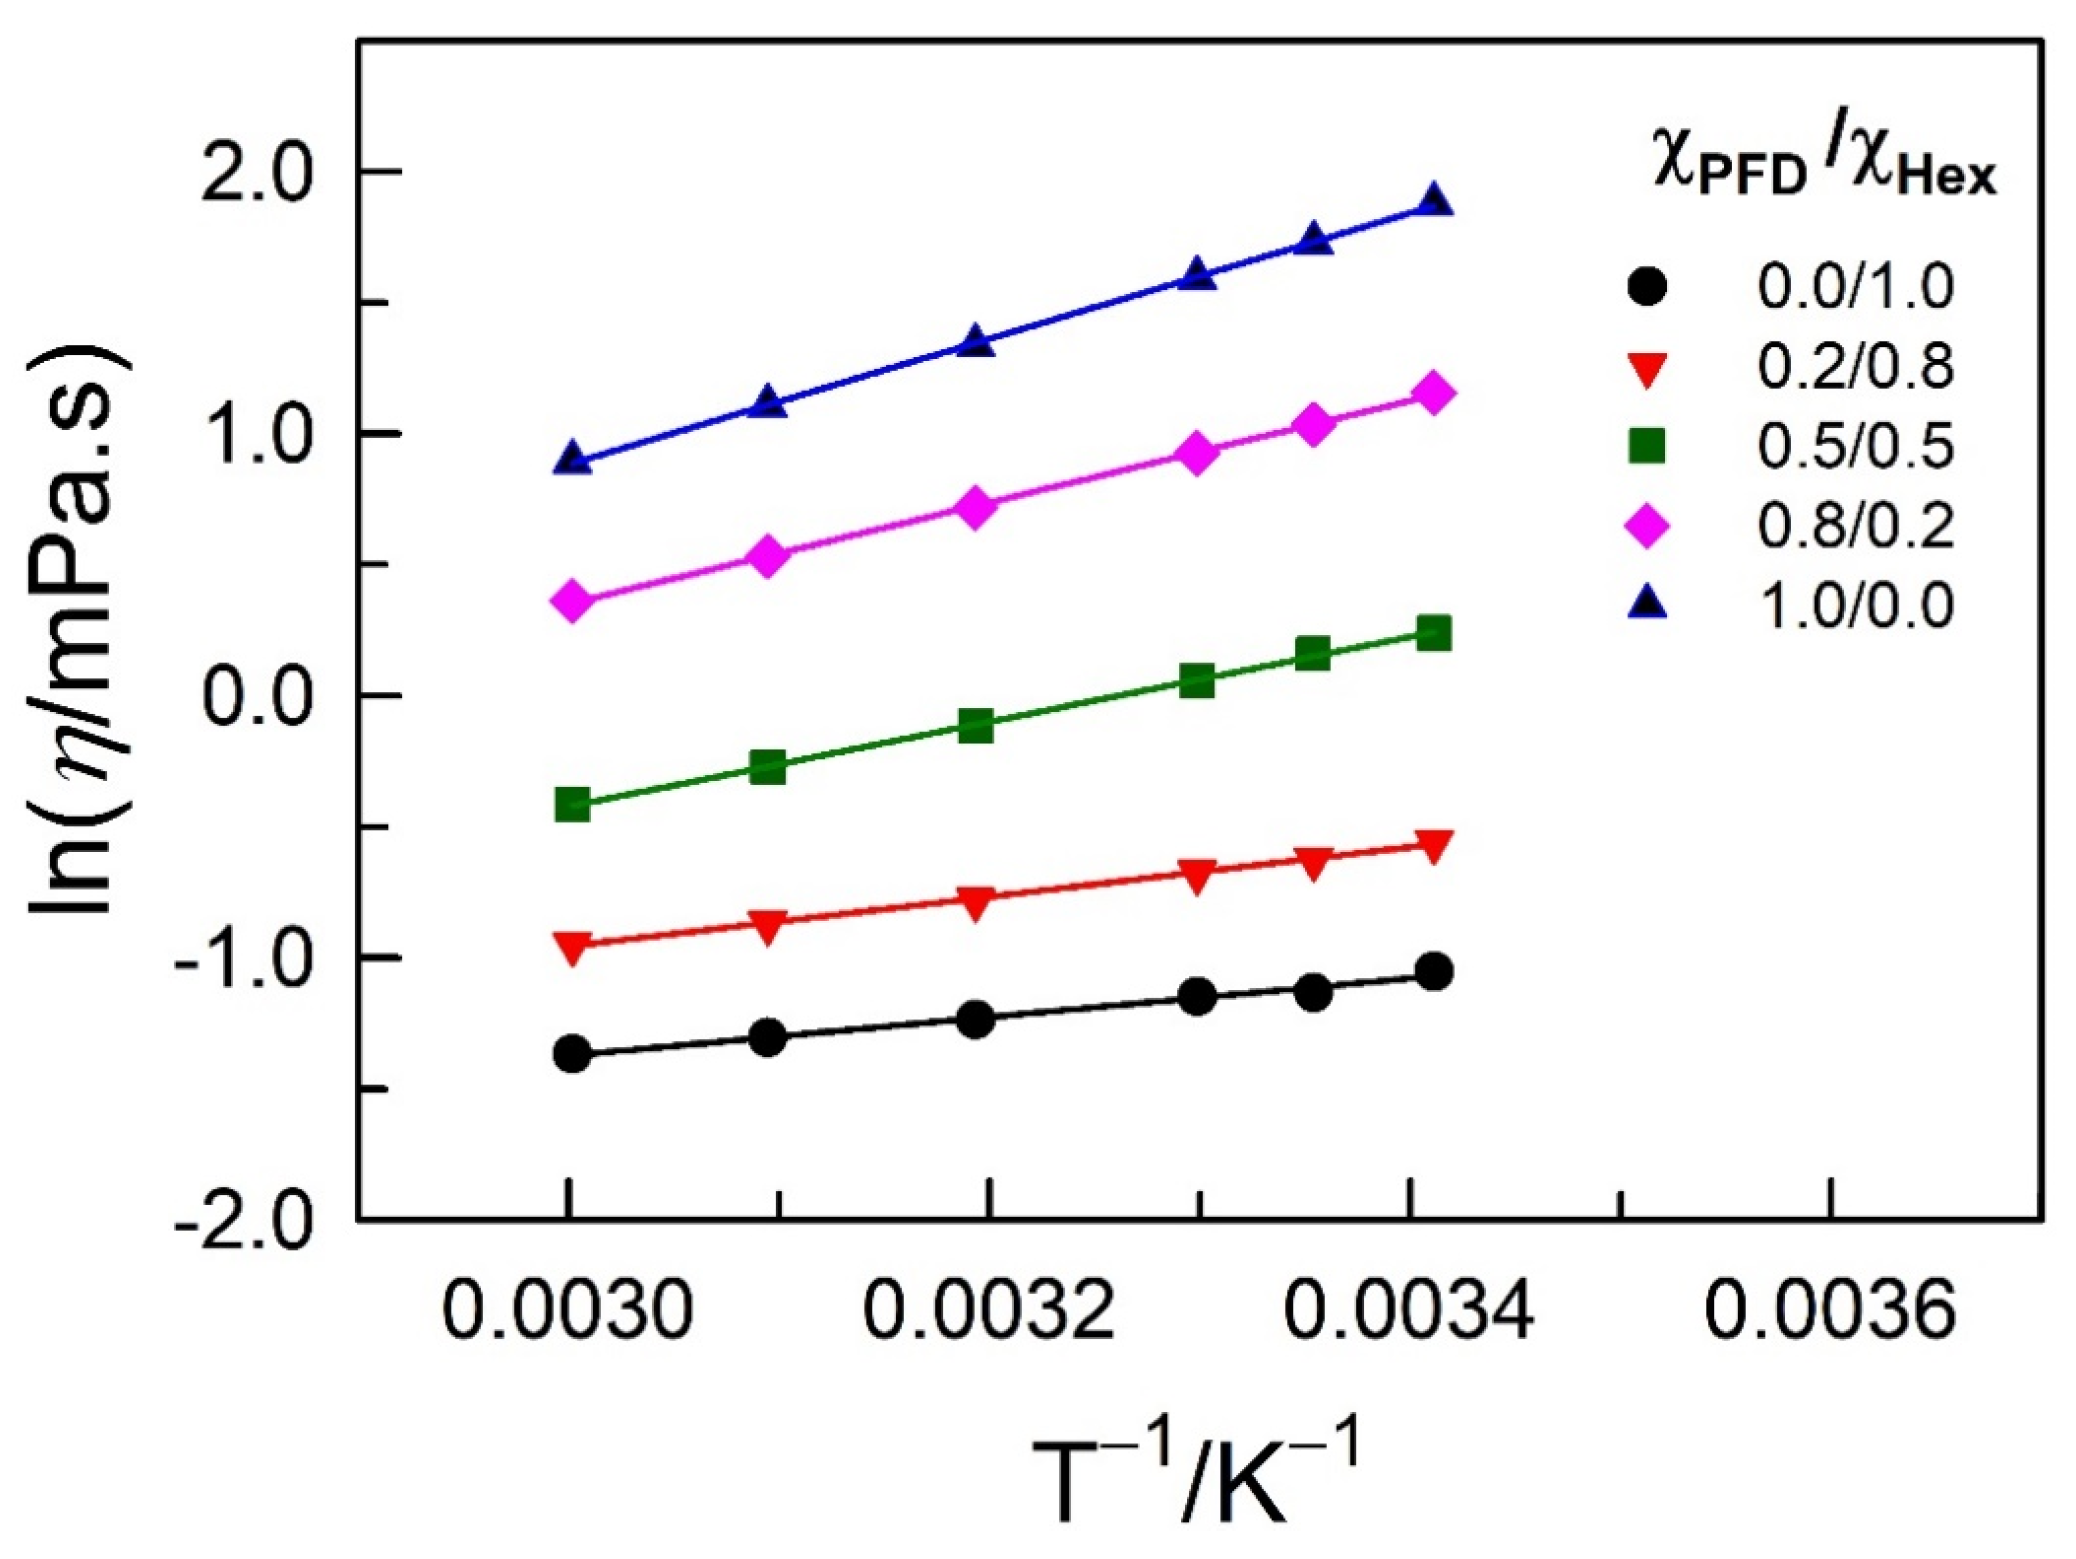
As expected, with an increase in temperature from (293 to 333) K, a monotonic decrease in η is observed for a given composition of (PFD + n-hexane) mixture (Table 4). The temperature dependence of η follows the most simplistic Arrhenius-like behavior:
where Aη is a parameter, and Ea,η is the activation energy of the viscous flow.
Figure 4 demonstrates the plots of ln η versus 1/T for (PFD + n-hexane) mixtures. The best fit lines are according to Arrhenius expression and the recovered parameters ln Aη and Ea,η along with goodness-of-fit are presented in Table 5. As expected, Ea,η increases monotonically as the concentration of the component with higher η PFD is increased in the mixture; neat PFD has the highest Ea,η. It is established that fluorous liquid, PFD, possesses relatively high activation energy of viscous flow compared to the organic solvent n-hexane.
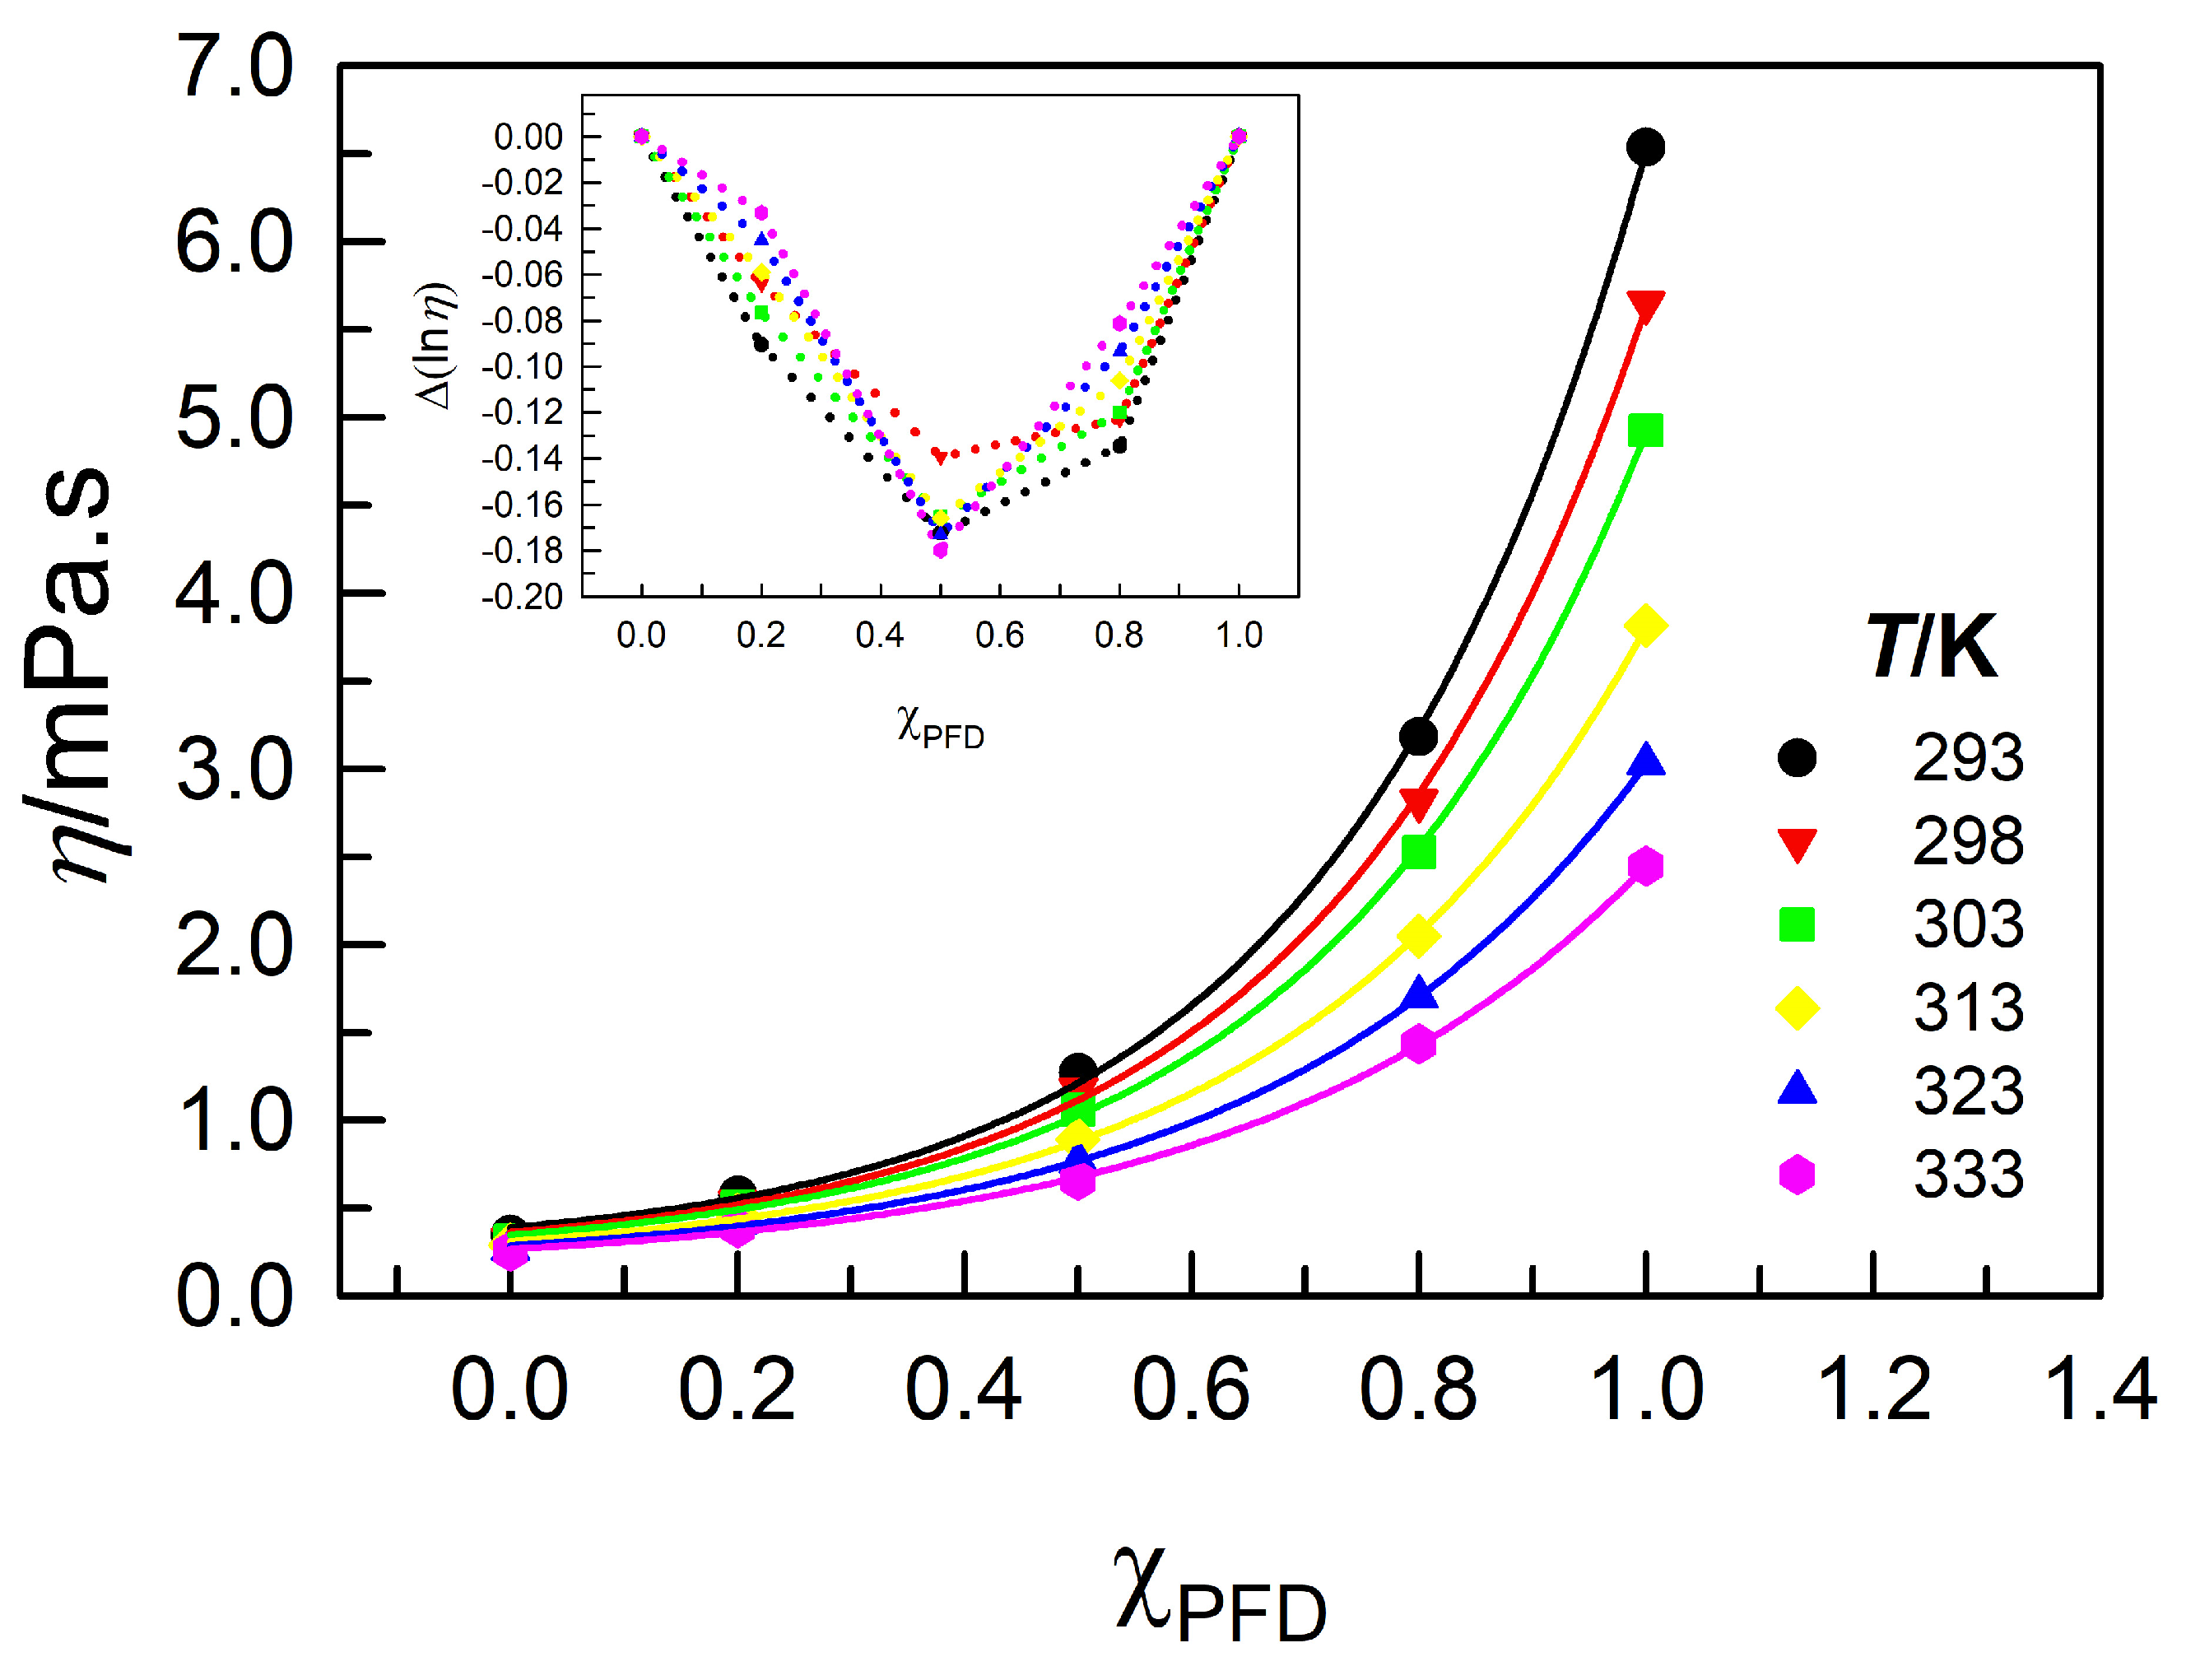
The increase in η with the increasing mole fraction of PFD in the (PFD + n-hexane) mixture is found to be exponential, as per the equation:
Fits are presented in Figure 5, whereas the recovered parameters η0, d, and f, along with the goodness-of-the-fit in terms of R2, are given in Table 6. In order to assess the interactions within (PFD + n-hexane) mixtures, deviation in logarithmic viscosities, ∆(ln η), are estimated from the equation [21],
where ηm is the dynamic viscosity of the (PFD + n-hexane) mixture, and xPFD, xn-hexane, and ηPFD, ηn-hexane refer to the mole fractions and dynamic viscosities, respectively, of PFD and n-hexane at a given temperature. Plots of ∆(ln η) versus for (PFD + n-hexane) mixtures in a temperature range (293 to 333 K) are presented in the inset of Figure 5. A careful examination of Figure 5 reveals that, irrespective of the T, ∆(ln η) are negative and that no clear trend exists with variation in T. The negative ∆(ln η) further emphasizes the lack of attractive interaction within the (PFD + n-hexane) mixture; it rather indicates that repulsive interactions are present between PFD and n-hexane within the mixture, leading to lower viscosities than expected ideally. In this context, the negative ∆(ln η) corroborates and compliments the positive VE.
It is clear from the density and dynamic viscosity of the (PFD + n-hexane) mixtures that unfavorable interactions exist between PFD and n-hexane within the mixture, as documented by the nature of the fluorous solvents in general. The fact that the fluorous solvents exhibit contrast in properties as compared to the common organic solvents is established nonetheless.
4. Conclusions
Fluorous solvents are notorious for their immiscibility with organic solvents and ILs. PFD shows complete miscibility with only a few organic solvents, especially short-chain hydrocarbons. The extreme non-polarity and the presence of the most electronegative fluorine atom play a key role in determining their properties. The density and dynamic viscosity of n-hexane show greater sensitivity towards temperature with an increase in PFD composition in the mixture. The contrasting behavior of PFD as compared to n-hexane is demonstrated. Both VE and ∆(ln η) hint at the repulsive interactions between PFD and n-hexane. The stark differences in the molecular architecture and the size of the two components might be responsible for such interactions. The work suggests that fluorous liquids may be used to effectively modulate the physical properties of common organic solvents. The data presented in this work is the beginning of physicochemical data on fluorous solvents as these solvents may afford a link between the interactions present in the gas phase and in the condensed phase.
Author Contributions
Conceptualization, methodology, visualization, writing—original draft, D.; writing—review and editing, supervision, resources, project administration, S.P. All authors have read and agreed to the published version of the manuscript.
Funding
This work is generously supported by the Science & Engineering Research Board (SERB), Government of India, through a grant to Siddharth Pandey (grant number CRG/2021/000602).
Data Availability Statement
Not applicable.
Acknowledgments
Deepika would like to acknowledge the Ministry of Education (MoE), Government of India, for her Prime Minister Research Fellowship (PMRF).
Conflicts of Interest
There are no conflict to declare.
References
- Sheldon, R.A. Green solvents for sustainable organic synthesis: State of the art. Green Chem. 2005, 7, 267–278. [Google Scholar] [CrossRef]
- Capello, C.; Fischer, U.; Hungerbuhler, K. What is green solvent? A comprehensive framework for the environmental assessment of solvents. Green Chem. 2007, 9, 927–934. [Google Scholar] [CrossRef]
- Clark, J.H.; Tavener, S.J. Alternative solvents: Shades of green. Org. Process Res. Dev. 2007, 11, 149–155. [Google Scholar] [CrossRef]
- Horváth, I.T. Solvents from nature. Green Chem. 2008, 10, 1024–1028. [Google Scholar] [CrossRef]
- Anastas, P.T.; Warner, J.C. Green Chemistry: Theory and Practice; Oxford University Press: Oxford, UK, 1998. [Google Scholar]
- Gladysz, J.A.; Curran, D.P.; Horváth, I.T. Handbook of Fluorous Chemistry; Wiley-VCH Verlag GmbH & Co. KGaA: Weinheim, Germany, 2004. [Google Scholar]
- Horváth, I.T.; Rábai, J. Facile catalyst separation without water: Fluorous biphase hydroformylation of olefins. Science 1994, 266, 72–75. [Google Scholar] [CrossRef] [PubMed]
- Wolf, E.; van Koten, G.; Deelman, B.-J. Fluorous phase separation techniques in catalysis. Chem. Soc. Rev. 1999, 28, 37–41. [Google Scholar] [CrossRef]
- Barthel Rosa, L.P.; Gladysz, J.A. Chemistry in fluorous media: A user’s guide to practical considerations in the application of fluorous catalysts and reagents. Coord. Chem. Rev. 1999, 190–192, 587–605. [Google Scholar] [CrossRef]
- Zhang, W.; Cai, C. New chemical, and biological applications of fluorous technologies. Chem. Commun. 2008, 5686–5694. [Google Scholar] [CrossRef] [PubMed]
- Horvath, I.T. Fluorous biphase chemistry. Acc. Chem. Res. 1998, 31, 641–650. [Google Scholar] [CrossRef]
- Zhang, W.; Soloshonok, V.A.; Mikami, K.; Yamazaki, T.; Welch, J.T.; Honek, J. Current Fluoroorganic Chemistry: New Synthetic Directions, Technologies, Materials and Biological Applications; Oxford University Press: Oxford, UK, 2006; pp. 207–220. [Google Scholar]
- Lowe, K.C. Engineering blood: Synthetic substitutes from fluorinated compound. Tissue Eng. 2003, 9, 389–399. [Google Scholar] [CrossRef] [PubMed]
- Khalil, M.A.K.; Rasmussen, R.A.; Culbertson, J.A.; Prins, J.M.; Grimsrud, E.P.; Shearer, M.J. Atmospheric perfluorocarbons. Environ. Sci. Technol. 2003, 37, 4358–4361. [Google Scholar] [CrossRef] [PubMed]
- Kennedy, G.L.; Butenhoff, J.L.; Olsen, G.W.; O’Connor, J.C.; Seacat, A.M.; Perkins, R.G.; Biegel, L.B.; Murphy, S.R.; Farrar, D.G. The toxicology of perfluorooctanoate. Crit. Rev. Toxicol. 2004, 34, 351–384. [Google Scholar] [CrossRef] [PubMed]
- Stephan, C.; Schlawne, C.; Grass, S.; Waack, I.N.; Ferenz, K.B.; Bachmann, M.; Barnert, S.; Schubert, R.; Bastmeyer, M.; De Groot, H.; et al. Artificial oxygen carriers based on perfluorodecalin-filled poly(n-butyl-cyanoacrylate) nanocapsules. J. Microencapsul. 2014, 31, 284–292. [Google Scholar] [CrossRef] [PubMed]
- Rumble, J.R.; Bruno, T.J.; Doa, M.J. CRC Handbook of Chemistry and Physics: A Ready Reference Book of Chemical and Physical Data, 102nd ed.; CRC Press: Boca Raton, FL, USA, 2021. [Google Scholar]
- Freire, M.G.; Ferreira, A.G.M.; Fonseca, I.M.A.; Marrucho, I.M.; Coutinho, J.A.P. Viscosities of liquid fluorocompounds. J. Chem. Eng. Data 2008, 53, 538–542. [Google Scholar] [CrossRef] [Green Version]
- Fehlauer, H.; Wolf, H. Density reference liquids certified by the Physikalisch-Techische Bundesanstalt. Meas. Sci. Technol. 2006, 17, 2588–2592. [Google Scholar] [CrossRef]
- Sulthana, S.P.; Gowrisankar, M.; Babu, S.; Rao, P.V. Binary mixtures of 2-ethyl-1-hexanol with various functional groups (benzyl chloride, 3-methylaniline, 3-methoxyaniline and 2,6-dimethylcyclohexanone. SN Appl. Sci. 2020, 2, 960. [Google Scholar] [CrossRef] [Green Version]
- Heintz, A.; Klasen, D.; Lehmann, J.K. Excess molar volumes and viscosities of binary mixtures of methanol and the ionic l iquid4- Methyl-N-butylpyridinium Tetrafluoroborate at 25, 40, and 50±C. J. Solut. Chem. 2002, 31, 467–476. [Google Scholar] [CrossRef]
Figure 1.
Structure of perfluorodecalin (PFD).

Figure 2.
Variation in densities of the investigated mixtures with temperature at different mole fraction ratios and at pressure p = 0.1 MPa. The solid line represents fit to the equation /(g·cm−3) = 0,T/(g·cm−3) + (T/K). Parameters 0,T and , along with R2 are provided in Table 2.
Figure 2.
Variation in densities of the investigated mixtures with temperature at different mole fraction ratios and at pressure p = 0.1 MPa. The solid line represents fit to the equation /(g·cm−3) = 0,T/(g·cm−3) + (T/K). Parameters 0,T and , along with R2 are provided in Table 2.

Figure 3.
Variation in densities of the investigated mixtures with varying mole ratios of the constituents at different temperatures (T = 293 to 333 K) and at pressure p = 0.1 MPa. The solid line represents fit to the equation /(g·cm−3) = 0,xPFD/(g·cm−3) + (xPFD) + c(xPFD2). Parameters 0,xPFD, , and , along with R2, are provided in Table 3.

Figure 4.
Variation in ln η of the investigated mixtures with T−1 at different mole fraction ratios and at pressure p = 0.1 MPa. The solid curves represent the best fit to the Arrhenius model: . Parameters ln (Aη), and Eα,η, along with R2 are reported in Table 5.
Figure 4.
Variation in ln η of the investigated mixtures with T−1 at different mole fraction ratios and at pressure p = 0.1 MPa. The solid curves represent the best fit to the Arrhenius model: . Parameters ln (Aη), and Eα,η, along with R2 are reported in Table 5.

Figure 5.
Variation in dynamic viscosities of the investigated mixtures with varying mole ratios of the constituents at different temperatures (T = 293 to 333 K) and at pressure p = 0.1 MPa. The solid line represents fit to the equation /(mPa·s) = 0/(mPa·s) + ef(xPFD). Parameters 0, and , along with R2, are provided in Table 6.


Table 1.
Densities a (/g·cm−3) of the investigated mixtures of PFD and n-hexane at different mole fraction ratios at pressure p b = (0.1 MPa) and temperature T c = (293 K to 333 K).
Table 1.
Densities a (/g·cm−3) of the investigated mixtures of PFD and n-hexane at different mole fraction ratios at pressure p b = (0.1 MPa) and temperature T c = (293 K to 333 K).
| d | T/K | |||||
|---|---|---|---|---|---|---|
| 293 | 298 | 303 | 313 | 323 | 333 | |
| 0.0 | 0.6596 | 0.6553 | 0.6515 | 0.6413 | 0.6320 | 0.6219 |
| 0.2 | 1.0433 | 1.0355 | 1.0298 | 1.0134 | 0.9983 | 0.9835 |
| 0.5 | 1.4735 | 1.4633 | 1.4553 | 1.4332 | 1.4127 | 1.3943 |
| 0.8 | 1.7855 | 1.7750 | 1.7661 | 1.7420 | 1.7199 | 1.7015 |
| 1.0 | 1.9412 | 1.9303 | 1.9212 | 1.8961 | 1.8733 | 1.8468 |
a Standard uncertainty: u(
) = ±0.0001 g·cm−3; b Standard uncertainty: u(p) = ±0.005 MPa; c Standard uncertainty: u(T) = ±0.05 K; d Standard uncertainty: u(x) = ±0.01.
Table 2.
Result of the regression analysis of density (/g·cm−3) versus temperature (T/K) data according to equation: /(g·cm−3) = 0,T/(g·cm−3) + (T/K) for the investigated mixtures at different mole ratios over the temperature range 293 K to 333 K. a
Table 2.
Result of the regression analysis of density (/g·cm−3) versus temperature (T/K) data according to equation: /(g·cm−3) = 0,T/(g·cm−3) + (T/K) for the investigated mixtures at different mole ratios over the temperature range 293 K to 333 K. a
| b | 0,T (g·cm−3) | 10−3 (g·cm−3·K−1) | R2 |
|---|---|---|---|
| 0.0 | 0.9379 ± 0.0048 | −0.9 ± 0.01 | 0.9990 |
| 0.2 | 1.4839 ± 0.0064 | −1.5 ± 0.02 | 0.9993 |
| 0.5 | 2.0610 ± 0.0094 | −2.0 ± 0.03 | 0.9991 |
| 0.8 | 2.4134 ± 0.0134 | −2.1 ± 0.04 | 0.9984 |
| 1.0 | 2.6338 ± 0.0154 | −2.4 ± 0.05 | 0.9982 |
a Standard uncertainties u are, u(T) = ±0.05 K, u() = ±0.0001 g·cm−3; b Standard uncertainty: u(x) = ±0.01; Standard deviations are given with ± sign.
Table 3.
Result of the regression analysis of density (/g·cm−3) versus mole fraction of PFD (xPFD) data according to equation: /(g·cm−3) = 0,xPFD/(g·cm−3) + (xPFD) + c(xPFD2) for the investigated mixtures over the temperature range 293 K to 333 K. a
Table 3.
Result of the regression analysis of density (/g·cm−3) versus mole fraction of PFD (xPFD) data according to equation: /(g·cm−3) = 0,xPFD/(g·cm−3) + (xPFD) + c(xPFD2) for the investigated mixtures over the temperature range 293 K to 333 K. a
| T/K | 0,xPFD (g·cm−3) | R2 | ||
|---|---|---|---|---|
| 293 | 0.6661 ± 0.0107 | 1.9682 ± 0.0548 | −0.6984 ± 0.0529 | 0.9998 |
| 298 | 0.6616 ± 0.0102 | 1.9521 ± 0.0526 | −0.6883 ± 0.0508 | 0.9998 |
| 303 | 0.6578 ± 0.0103 | 1.9409 ± 0.0527 | −0.6824 ± 0.0509 | 0.9998 |
| 313 | 0.6474 ± 0.0099 | 1.9091 ± 0.0507 | −0.6650 ± 0.0489 | 0.9998 |
| 323 | 0.6378 ± 0.0095 | 1.8789 ± 0.0487 | −0.6478 ± 0.0471 | 0.9998 |
| 333 | 0.6267 ± 0.0076 | 1.8682 ± 0.0392 | −0.6507 ± 0.0379 | 0.9999 |
a Standard uncertainties u are, u(T) = ±0.05 K, u() = ±0.0001 g·cm−3, u(x) = ±0.01. Standard deviations are given with ± sign.
Table 4.
Dynamic viscosity a ( /mPa·s) of the investigated mixtures of PFD and n-hexane at different mole fraction ratios at pressure p b = (0.1 MPa) and temperature T c = (293 K to 333 K).
Table 4.
Dynamic viscosity a ( /mPa·s) of the investigated mixtures of PFD and n-hexane at different mole fraction ratios at pressure p b = (0.1 MPa) and temperature T c = (293 K to 333 K).
| d | T/K | |||||
|---|---|---|---|---|---|---|
| 293 | 298 | 303 | 313 | 323 | 333 | |
| 0.0 | 0.349 | 0.322 | 0.317 | 0.291 | 0.271 | 0.255 |
| 0.2 | 0.572 | 0.536 | 0.509 | 0.458 | 0.420 | 0.387 |
| 0.5 | 1.271 | 1.173 | 1.060 | 0.892 | 0.768 | 0.669 |
| 0.8 | 3.179 | 2.816 | 2.524 | 2.050 | 1.703 | 1.435 |
| 1.0 | 6.535 | 5.647 | 4.925 | 3.815 | 3.152 | 2.446 |
a Standard uncertainty: u() = ±0.001 mPa·s. b Standard uncertainty: u(p) = ±0.005 MPa. c Standard uncertainty: u(T) = ±0.05 K. d Standard uncertainty: u(x) = ±0.01.
Table 5.
Summary of parameters associated with dynamic viscosity of the investigated mixtures according to the Arrhenius model using the equation: .
Table 5.
Summary of parameters associated with dynamic viscosity of the investigated mixtures according to the Arrhenius model using the equation: .
| xPFD | /kJ·mol−1 | R2 | |
|---|---|---|---|
| 0.0 | −3.589 ± 0.130 | 6.14 ± 0.33 | 0.9883 |
| 0.2 | −3.794 ± 0.062 | 7.87 ± 0.16 | 0.9983 |
| 0.5 | −5.275 ± 0.055 | 13.45 ± 0.14 | 0.9996 |
| 0.8 | −5.465 ± 0.065 | 16.12 ± 0.17 | 0.9999 |
| 1.0 | −6.303 ± 0.066 | 19.92 ± 0.17 | 0.9999 |
Standard deviations are given with ± sign.
Table 6.
Result of the regression analysis of dynamic viscosity (/mPa·s) versus mole fraction of PFD (xPFD) data according to equation: /(mPa·s) = 0/(mPa·s) + ef(xPFD) for the investigated mixtures over the temperature range 293 K to 333 K. a
Table 6.
Result of the regression analysis of dynamic viscosity (/mPa·s) versus mole fraction of PFD (xPFD) data according to equation: /(mPa·s) = 0/(mPa·s) + ef(xPFD) for the investigated mixtures over the temperature range 293 K to 333 K. a
| T/K | 0 (mPa·s) | f | R2 | |
|---|---|---|---|---|
| 293 | 0.238 ± 0.060 | 0.151 ± 0.020 | 3.726 ± 0.130 | 0.9997 |
| 298 | 0.212 ± 0.063 | 0.151 ± 0.023 | 3.583 ± 0.149 | 0.9996 |
| 303 | 0.201 ± 0.041 | 0.145 ± 0.016 | 3.482 ± 0.107 | 0.9998 |
| 313 | 0.174 ± 0.028 | 0.137 ± 0.012 | 3.275 ± 0.084 | 0.9999 |
| 323 | 0.156 ± 0.024 | 0.130 ± 0.012 | 3.093 ± 0.085 | 0.9999 |
| 333 | 0.142 ± 0.031 | 0.124 ± 0.016 | 2.924 ± 0.121 | 0.9997 |
a Standard uncertainties u are u(T) = ±0.05 K, u() = ±0.001 mPa·s, u(x) = ± 0.01; Standard deviations are given with ± sign.
Disclaimer/Publisher’s Note: The statements, opinions and data contained in all publications are solely those of the individual author(s) and contributor(s) and not of MDPI and/or the editor(s). MDPI and/or the editor(s) disclaim responsibility for any injury to people or property resulting from any ideas, methods, instructions or products referred to in the content. |
© 2023 by the authors. Licensee MDPI, Basel, Switzerland. This article is an open access article distributed under the terms and conditions of the Creative Commons Attribution (CC BY) license (https://creativecommons.org/licenses/by/4.0/).
Share and Cite
MDPI and ACS Style
Deepika; Pandey, S. Density and Dynamic Viscosity of Perfluorodecalin-Added n-Hexane Mixtures: Deciphering the Role of Fluorous Liquids. Liquids 2023, 3, 48-56. https://doi.org/10.3390/liquids3010005
AMA Style
Deepika, Pandey S. Density and Dynamic Viscosity of Perfluorodecalin-Added n-Hexane Mixtures: Deciphering the Role of Fluorous Liquids. Liquids. 2023; 3(1):48-56. https://doi.org/10.3390/liquids3010005
Chicago/Turabian StyleDeepika, and Siddharth Pandey. 2023. "Density and Dynamic Viscosity of Perfluorodecalin-Added n-Hexane Mixtures: Deciphering the Role of Fluorous Liquids" Liquids 3, no. 1: 48-56. https://doi.org/10.3390/liquids3010005