Article

Investigation of the Impact of High Concentration LiTFSI Electrolytes on Silicon Anodes with Reactive Force Field Simulations

1
Institute for Material Science, University of Kiel, 24143 Kiel, Germany
2
Institute for Particle Technology, Technical University of Braunschweig, 38104 Braunschweig, Germany
3
Institute for Physical Chemistry, University of Kiel, 24118 Kiel, Germany
4
Department of Chemistry and Pharmacy, Friedrich Alexander University Erlangen-Nürnberg, 91058 Erlangen, Germany
5
Department of Chemistry, Uppsala University, 752 36 Uppsala, Sweden
*
Author to whom correspondence should be addressed.
These authors contributed equally to this work.
Liquids 2023, 3(1), 132-158; https://doi.org/10.3390/liquids3010011
Submission received: 11 November 2022 / Revised: 12 December 2022 / Accepted: 29 December 2022 / Published: 6 February 2023

Abstract

:
The initial formation cycles are critical to the performance of a lithium-ion battery (LIB), particularly in the case of silicon anodes, where the high surface area and extreme volume expansion during cycling make silicon susceptible to detrimental side reactions with the electrolyte. The solid electrolyte interface (SEI) that is formed during these initial cycles serves to protect the surface of the anode from a continued reaction with the electrolyte, and its composition reflects the composition of the electrolyte. In this work, ReaxFF reactive force field simulations were used to investigate the interactions between ether-based electrolytes with high LiTFSI salt concentrations (up to 4 mol/L) and a silicon oxide surface. The simulation investigations were verified with galvanostatic testing and post-mortem X-ray photoelectron spectroscopy, revealing that highly concentrated electrolytes resulted in the faster formation and SEIs containing more inorganic and silicon species. This study emphasizes the importance of understanding the link between electrolyte composition and SEI formation. This ReaxFF approach demonstrates an accessible way to tune electrolyte compositions for optimized performance without costly, time-consuming experimentation.

Graphical Abstract

1. Introduction

Due to the increase in lithium-ion battery (LIB) usage and production, it is essential to explore options to produce energy storage systems with high energy densities that are based on cheap, earth-abundant, non-toxic materials. Full-cell LIBs with sulfur cathodes and silicon anodes have generated a lot of attention in recent years due to the high specific capacity of both materials (~1600 mAh g−1 and 4200 mAh g−1, respectively) [1,2,3]. In order to combine these electrodes into a full cell, it is important to develop electrolytes that are compatible with both of them. The carbonate solvents, commonly used with silicon anodes, undergo detrimental reactions in the presence of lithium polysulfides [4]; therefore, sulfur-compatible electrolytes must be developed for silicon anodes.
With the growing use of LIBs in vehicles or other applications, the safety of the batteries is coming into question. In particular, the electrolyte solution is composed of volatile solvents that are flammable or can break down into toxic by-products. Electrolytes with lithium salts at high concentrations have been shown to have much lower volatility and better thermal stability compared to the conventional, more dilute electrolytes and to be less likely to produce flammable gases from solvent evaporation or thermal decomposition reactions [5,6,7]. During the initial formation cycles of a battery, the electrolyte undergoes decomposition reactions to form the solid electrolyte interface (SEI) on the surface of the electrode [8,9]. These formation cycles are critical to the long-term function of the cell, particularly in the case of silicon, where the electrode/electrolyte interface is more susceptible to reactions due to the high surface area and expansion of silicon during cycling [10,11,12,13]. The reduction in organic solvent molecules can lead to polymerization reactions, forming a thick, ionically insulating SEI, which increases cell impedance and is detrimental to cell performance [14]. Highly concentrated electrolytes have been shown to result in a more inorganic SEI layer, which would lead to better mechanical and chemical stability of the SEI as well as improved Li+ ion conductivity [9,15]. In addition, high salt concentrations have been shown to improve the electrochemical performance of other high-energy-density electrodes. In the case of sulfur cathodes, high lithium salt concentrations have been observed to minimize the polysulfide shuttle effect and to improve capacity retention [16,17]. In the case of lithium metal anodes, high salt concentrations have been observed to result in the non-dendritic reversible plating and stripping of lithium during cycling [18,19,20]. For applications with silicon anodes, it is important to better understand the compatibility of the silicon active material with highly concentrated lithium salt electrolytes in these early formation cycles.
In order to simulate the processes that occur during SEI formation, different theoretical methods can be used and were indeed used in previous studies. The most straightforward way is to simulate a representative cutout of the electrode–electrolyte interface by means of density functional theory (DFT). A hybrid functional, such as B3LYP [21,22] or PBE0 [23], should be able to describe all reactive processes during SEI formation with reasonable accuracy. The problem is, however, that DFT simulations are much too expensive to be performed on a system with several thousands of atoms, which must be included in a realistic SEI cutout over at least the ns time scales needed for the SEI buildup to occur. When SEI formation studies were performed based on DFT, they concentrated on the calculation of intermediates and reaction paths [24,25,26], thus neglecting the dynamical interplay of different reactive processes.
Large length and time scales, on the other hand, can be treated by traditional nonreactive force fields (FF) such as OPLS [27,28]. By avoiding the direct description of electrons and transferring their physics to the initial optimization of force field parameters, the energy and gradient calculations are accelerated by between four and six orders of magnitude in comparison to DFT. The scaling is also heavily reduced, being quadratic to linear with respect to the number of atoms in the large system limit, depending on the treatment of non-covalent interactions. The drawback, however, is that traditional chemistry FFs are incapable of describing bond breakings and formations, i.e., the largest part of chemical reactions. A bond matrix must be defined at the beginning of the calculation and cannot be updated dynamically. This works fine for the time-dependent description of electrolyte solvents since no reactions usually occur in them. When turning to SEI formations, however, reactive processes are crucial, and traditional chemistry FFs are incapable of describing them.
The ReaxFF reactive force field [29] bridges the gap between DFT and nonreactive FFs. By replacing the rigid bond matrix through bond orders dependent on the actual distance of the two atoms, ReaxFF can describe bond fissions and formations. The effort to calculate a ReaxFF gradient is roughly two orders of magnitude higher than with nonreactive FFs, even with quadratic or even sub-quadratic scaling, so that large systems containing tens of thousands of atoms can also be simulated over the range of ns. The central challenge in running ReaxFF simulations is the parametrization of the force field. Its broader versatility in comparison to nonreactive FFs comes hand in hand with a much more sophisticated formulation of the potential energy function, which needs a large number of element- and element-multiplet-specific parameters to be set up. Additionally, parameter interdependencies are more frequent and subtler than in traditional chemistry FFs.
If a new area of application is treated, a considerable fraction of those parameters must be re-optimized, which is far from trivial both in terms of training-set selection and the finding of a global optimum.
Despite those challenges in its setup, ReaxFF has proven to be of high use in many application areas, and hundreds of publications cover both liquid chemistry and material science, i.e., both sides of the SEI [30,31]. When setting the focus on silicon-related studies, the catalysis of the methanol to olefin reaction on a SiOx/AlOx zeolite was simulated with ReaxFF [32], as well as the processes that occurred at the silica–water interface [33], the interaction of SiO2 with molecular oxygen during surface oxidation [34], the reaction of alkyl radicals on a Si(111) surface [35] and tribochemical reactions of phosphoric acid molecules sheared between two SiO2 surfaces [36].
LIBs in particular is indeed one of the main application fields of ReaxFF, with studies published covering the structure and dynamics of all LIB parts, namely cathodes (sulfur, sulfur with carbon nanotubes/nanofibers), anodes (carbon, silicon, TiO2, Li-metal) and electrolytes (EC, DMC, LiPF6, LiTFSI) [37]. In addition, ReaxFF parameters of Li-atoms for usage within organolithium compounds and small Li-clusters with hydrogen and carbon were optimized [38], and the intercalation of lithium into graphene and Si anodes was simulated as well [39,40,41].
Despite numerous applications in the LIB simulation, studies describing the buildup of the SEI with ReaxFF are still scarce. A good example is the study by Kim et al., who simulated the interface between a lithium metal anode and an electrolyte containing EC and DMC [42]. No studies, however, have been published so far that handle the much more complex SEI formed by electrolytes containing ionic liquid counter ions, such as TFSI, which is probably due to the need for ReaxFF to be able to describe eight elements and their mutual interactions at once. This is clearly in the upper range of complexity with respect to the average number of elements simulated in ReaxFF studies.
In addition to ReaxFF, the REACTER algorithm [43] also has the ability to combine the speed of force fields with the quantitative description of chemical reactions occurring using DFT. In REACTER, the system is described as a traditional, nonreactive force field; reaction events are recognized automatically based on the criteria predefined by the user. During a reaction event, the force field description (bond matrix, parameters, and partial charges) switches to the product configuration, whereas several criteria (pre-calculated activation barriers, configuration matching, etc.) can be evaluated to fine-tune the reactivity. Although this approach is also applied to the growth of SEIs in Li-ion batteries [44], it requires a larger amount of user interference in its setup since all possible reactions must be predefined in all relevant details, whereas in ReaxFF, the underlying potential energy description allows for a certain amount of extrapolation in this regard, based on the reference set used. On the other hand, REACTER can be run with essentially the speed of nonreactive force fields, which makes it much faster than ReaxFF. It might therefore be used to overcome the current limitations with respect to the simulation time in our future studies.
The present publication outlines a framework to set up a suitably parametrized ReaxFF force field, running the simulations on an appropriate model and evaluating the results for the extraction of general trends in the case of SEI formation; a framework that can easily be generalized to similar studies in this topic will be considered in future work. To verify the SEI formation mechanism on the silicon active material surface for highly concentrated lithium salt electrolytes, pure porous silicon anodes were used. Using pure silicon anodes ensures that all of the organic components observed with X-ray photoelectron spectroscopy (XPS) come from the SEI. Structured pure silicon anodes were chosen because they have already shown good long-term cycling stability [45,46,47,48,49] and an understanding of SEI composition for these anodes, which can additionally be applied to silicon anodes containing inactive components such as conductive additives and binders. Keeping in mind the desire to use silicon anodes in combination with sulfur cathodes, solvents that are compatible with sulfur cathodes were also chosen, i.e., ether solvents. In particular, the well-known monoglyme, dimethoxy ethane (DME), together with dioxolane (DOL), were used. Lithium bis(trifluoromethanesulfonyl)imide (LiTFSI) was chosen as the salt since lithium hexafluorophosphide, LiPF6, the most popular Li-salt for LIBs [50], reacts detrimentally with ether solvents [51]. The low association between Li+ and the [TFSI] counter ion means that the ionic conductivity would be less impacted at higher concentrations compared to lithium salts, with a stronger association between the Li+ ion and anion [52].
For experimental verification, the electrochemical performance of the silicon anode in the early formation cycles in electrolytes with low and high Li-salt concentrations is investigated with galvanostatic measurements. The composition of the SEI after the initial formation cycle is investigated in more detail using X-ray photoelectron spectroscopy (XPS). To gain a better understanding of how electrolytes with high salt concentrations can impact the cycling behavior of pure silicon anodes, the electrochemical performance of the porous silicon anodes during these cycles is linked to the electrolyte–surface interactions determined from the ReaxFF simulations, as well as the resulting composition of the SEI.

2. Materials and Methods

2.1. Theory

2.1.1. The ReaxFF Reactive Force Field

The mathematical structure of ReaxFF is fundamentally similar to that of a traditional nonreactive force field, i.e., the energy is calculated solely based on the positions of the atomic cores, and electrons are only treated indirectly by means of damping parameters and correction terms [53].
The force field is adapted to the system of interest by a large set of parameters that affect every atom, bond, angle, and other terms.
The central difference between ReaxFF and nonreactive force fields such as OPLS is that the list of bonds in the system is not fixed but dynamic. Which bonds exist between which atoms are not determined by a fixed, user-given bond matrix but solely by the actual geometry of the atoms that change during the molecular dynamics. Depending on the actual cartesian distance r i j , a bond order (BO) can be calculated between any pair of atoms i and j with:
B O i j = B O i j σ   +   B O i j π = e x p [ p b o 1 · ( r i j r 0 σ ) p b o 2 ] + e x p [ p b o 3 · ( r i j r 0 π ) p b o 4 ] + e x p [ p b o 5 · ( r i j r 0 π π ) p b o 6 ]
where r 0 σ , r 0 π , and r 0 π π are the equilibrium distances of sigma, pi, and double pi bonds for the atom pair and p b o 1 to p b o 6 are atom-pair-specific parameters.
This concept makes it possible to describe chemical reactions, which typically consist of the breakage and formation of chemical bonds. One drawback is that nine parameters are needed for the bond order calculation between a certain combination of elements, in comparison to two or three parameters for the full bond energy in nonreactive FFs. Further, several correction terms taking the total number of bonds to an atom, or the number of lone electron pairs (being just a parameter here) into account, must be included for a reasonable description of the bonding energy. Similar approaches must be undertaken for valence angles and torsions. This results in the total force field (FF) energy taking the form of a sum of several contributions:
E R e a x F F = E b o n d + E l p + E o v e r + E u n d e r + E v a l + E p e n + E e p a i r + E C 2 + E t r i p l e + E t o r s + E c o n j + E H b o n d + E v d W + E C o u l o m b
Besides the usual nonreactive FF terms, including bonding ( E b o n d ), angle ( E v a l ), torsion ( E t o r s ), dispersion ( E v d W ), and Coulomb ( E C o u l o m b ), several ReaxFF-specific terms appear as well, such as under-and over-coordination corrections, if the current atom has too many or too few bonding partners ( E u n d e r , E o v e r ), the terms considering parametric electron pairs ( E e p a i r ), hydrogen bonds ( E H b o n d ), conjugated systems ( E c o n j ), and so on.
Coulombic interactions are crucial for the description of long-range interactions and are especially complicated to treat since no fixed charges can be predefined and no simple formula for the change in partial charges during chemical reactions can be given. Therefore, the charges are updated by the iterative electronegativity equilibration method (EEM) [54] in each energy calculation before being plugged into a slightly modified Coulomb term:
E C o u l o m b = C · q i q j [ r i j 3 + ( 1 γ i j ) 3 ] 1 / 3
where q i and q j are the partial charges of the atoms, C is a scaling constant and γ i j is a damping parameter adjusted to the overlap between atoms at close distances.

2.1.2. Evolutionary Algorithms

The optimization of ReaxFF parameters imposes a highly nontrivial task due to their large number (2298 for this study, if all are updated from scratch) and, due to their interdependency, the validity of bond energy parameters depends on atom-specific parameters and those for different correction schemes. Further, most of them have no direct physical meaning (in contrast to nonreactive FFs), which makes it much harder to evaluate if a certain optimized set is reasonable. An elegant and sufficiently powerful way to perform this challenging task is by applying evolutionary algorithms (EA).
In EAs, the nomenclature of the steps within the optimization process is inspired by natural selection and evolution [55,56], although this is a local competition and not global optimization. The practical efficiency of EAs for global optimization, however, derives from their ability to exploit the partial separability of the optimization problem under study. In the beginning, a population of trial force fields, with randomly (within limits) initiated force field parameters, is set up (also called the genetic pool). The fitness (or error sum) of each individual in this pool is defined as:
F i t n e s s = i = 1 n ( x i , R e a x F F x i , R e f σ i ) 2
where the sum runs over all n items of the reference data (energies, gradient components, charges, etc.), and the squared differences between the ReaxFF value and a reference (DFT in this study) are added and weighted by a factor σ i , which also takes different units of the reference data into account. The aim is, of course, to decrease the fitness as far as possible, which increases the agreement between ReaxFF data and reference data.
During the optimization process, crossovers between two individuals can occur that exchange blocks of parameters between them, leading to new individuals generated from them. This step exploits partial separability and allows for large jumps in the search space that have a good chance of leading to improvements. Furthermore, mutations can alter the parameter values of single individuals. This corresponds to a test for small-distance improvements in the search space. With a combination of random choice and preference for individuals with a lower error sum and proper balance between the long-distance crossover and short-distance mutation, the EA optimization samples the objective function surface effectively and converges to the global minimum. The convergence towards near-global optima is reached much faster in EAs than with, for example, completely randomized multi-start local-search methods, but also, no complete sampling of the search space is needed (as with deterministic methods), which is impossible in the high-dimensional objective function surfaces present in the ReaxFF parameter optimization. With several additional tricks and settings, such as niching (for conserving genetic diversity within the pool) or different ratios of various mutation and crossover operators, the effectiveness of EAs can be raised even more. Further fundamental aspects of EAs are explained elsewhere [57,58].

2.1.3. Force Field Parametrization

Although no published ReaxFF parametrization covers the full system treated in this study, there are at least some publications that treat parts of it. In the originally intended building-block style of ReaxFF parameters, those were used as a starting point for the FF parametrization. The ReaxFF by Liu and Yu [59] covers the full description of LiTFSI and DME/DOL in the interface with lithium metal; the missing interactions are those between the electrolyte and the SiO2 anode. Some of the required parameters were found in the ReaxFFs by Yun and Pai [60] and Wang and Shi [61]. Even after combining those three force fields, however, there were some missing parameters. These were essentially those for the S-Si bond and various angles containing this bond. To the best of our knowledge, no ReaxFF parameters for these interactions have been published so far; this publication, therefore, is the first one to do so. In addition to these parameters, some other bond terms that were thought to be important for the SEI description but were thus far missing in all three ReaxFF parametrizations were also added.
The coordinates, for which new ReaxFF parameters were optimized, are listed in Table 1.
The optimization requires a suitable training set of the reference data, produced with a quantum chemical method that can be reproduced as well as possible by the optimized ReaxFF. Considering the reference used for the three publications, from which other parameters for the new ReaxFF were taken [59,60,61], B3LYP/6-311+G** [21,22,62,63] was chosen, as it is the same with which essentially all other reference data were calculated.
The training set was chosen to be a collection of small molecules with up to 21 atoms, where all of them contain at least one of the coordinates listed in Table 1 (Supplementary Material Figure S1). With this collection, two sets of reference data were obtained: first, optimized B3LYP geometries of the molecules, and second, relative B3LYP energies of the bond and angle scans of the newly added coordinates. Due to the high importance of the S–Si bond potential, four bond scans in different molecules were added as a reference for it, in contrast, to 1–2 scans for the angles. The chosen scan coordinates are also shown in the Supplementary Material (Figure S2).
With the training set at hand, all new force field parameters were optimized simultaneously with the OGOLEM software package, which has the ability to use a wide variety of EA variants and options for the fitting of ReaxFF parameters [56,64]. Only the parameters of the new coordinates were optimized; all the remaining ones were kept at the values optimized by the original authors. This was assumed to be reasonable since the systems treated in the respective publications are similar to those treated here, and a complete re-optimization would have needed a training set spanning all possible intermediates and products within the SEI buildup. With this choice, the search space still had a dimension of 122 parameters. The allowed parameter ranges within the EA were chosen to be in the same order of magnitude as the parameters of similar coordinates, with a variance of ±100%. The global optimization operator was chosen to be a mixture of 10% Arctic and 90% Portugal operators; parent parameter vectors were chosen based on their fitness rank, with a Gaussian width of 0.2 and a mutation ratio of 0.1. The total population of the pool was 400, with 500,000 EA iterations having been conducted. We refer to the online OGOLEM manual [65] for further explanations of these EA setting choices.

2.1.4. Molecular Dynamics Simulations

In order to study the SEI buildup, the interface between the electrolyte and anode was simulated with reactive molecular dynamics (MD) using the newly parametrized ReaxFF. For all calculations, the LAMMPS software package was used [66,67,68,69]. A Nose–Hoover thermostat was used to simulate a canonical ensemble at the desired temperatures in all cases [70]. An amorphous SiO2 surface in contact with two different electrolyte solutions, 0.7 M TFSI and 4 M TFSI, within a 2:1 (v/v) mixture of DME and DOL, should be simulated. In the first place, both the anode and the electrolyte part were generated separately. For the electrolyte solutions, the following procedure was applied: single boxes with pure DOL and DME, each consisting of 512 molecules, were set up and equilibrated with an NpT ensemble using the Nose–Hoover barostat at 1 bar and 298 K. The averaged relative volume of the boxes resulted in a translation of the 1:2 (v/v) ratio into a 1:139544 (mol/mol) ratio of DOL and DME. Based on this, a translation of the macroscopic LiTFSI concentration to molecule numbers was fitted. Details concerning this procedure are explained in the Supplementary Material (see Table S1 and Equation (1)).
After determining the correct concentrations, boxes elongated into z-direction were set up, which contained 384 DOL, 536 DME, and 60 LiTFSI molecules for the 0.7 M LiTFSI and 228 DOL, 324 DME and 428 LiTFSI molecules for the 4 M LiTFSI system.
The amorphous SiO2 bulk was set up by placing Si and O atoms randomly onto a silicon diamond cubic crystal structure, where the first benchmark that ran suggested that the exact distribution of atoms within the bulk had no significant influence on the initial reaction dynamics. Both the electrolyte boxes and the SiO2 bulk were equilibrated by running 1 ns NpT dynamics at 1 bar at 298 K, with a time step of 1 fs. Finally, both parts were brought together, where the x and y dimensions of the electrolyte part were held fixed during equilibration to the final dimensions of the anode part such that both sides of the interface had the same area. After removing the z-periodicity of both parts, electrolyte molecules with dangling bonds were plugged together on one side, whereas dangling bonds in the SiO2 part were kept in place in order to accelerate the SEI growth. This modification serves to indirectly include the influence of an applied electric current on the SEI building process, which occurs much slower (on timescales too long to converge within reasonable ReaxFF simulations, as the benchmarking indicated) if a saturated anode surface is set up.
Starting from this structure, 1.4 ns of reactive MD was propagated for the 0.7 M and 4 M systems at 298 K and 700 K in an NpT ensemble at 1 bar, respectively, with a time step of 0.5 fs. The simulations at different temperatures were conducted in order to check if the SEI buildup could be accelerated without changing its mechanism significantly. Since such changes were indeed observed, all evaluations within the main manuscript are restricted to the 0.7 M and 4 M systems at 298 K, whereas the 700 K results are only shown in the Supplemental Information as a further benchmark regarding the limitation of the simulation method used.

2.1.5. Preparation of Porous Silicon Anode

In order to investigate the SEI composition on the silicon active material surface, pure silicon anodes were chosen. The anodes were structured to enable more stable cycling. The preparation of mesoporous silicon anodes, using a highly p-doped (80 mΩcm) silicon (100) substrate material, was performed with a large area electrochemical etching process, utilizing an “in-line” etching tool. Electrochemical etching was performed using a top-down approach, with an applied current of 13 mA cm−2 and an etching time of 14 min. The resulting mesoporous silicon layer possessed porosities of 43% and a thickness of 6 µm.

2.1.6. Electrochemical Characterization

Two different electrolyte solutions were prepared in a glovebox under an Ar atmosphere with both a low and a high-concentration electrolyte. Both electrolyte solutions were prepared with monoglyme (DME) and DOL in a 2:1 (v/v) ratio of DME:DOL. LiTFSI was used as the lithium salt in the electrolyte, and the concentrations were varied to make 0.7 M and 4 M electrolytes. All chemicals were obtained from Sigma Aldrich. Prior to their characterization, liquid electrolytes were sealed in polyethylene pouch cells in the glove box under an Ar atmosphere. Raman spectroscopy analysis was performed using an alpha 300 RA set-up. An excitation wavelength of 532 nm was used.
Electrochemical characterization of the porous silicon anodes was performed using a half-cell set-up with metallic lithium as the counter and reference electrode. The tests were performed in home-built inert electrode housings using Celgard separators. The electrolyte solutions with high and low lithium salt concentrations, as described previously, were used. A constant current-constant voltage (CC-CV) cycling procedure was carried out on an Astrol battery cycler (Astrol Electronic AG) with a capacity limitation of 75% of the theoretical capacity of silicon: 3150 mAh g−1. A voltage range of 0.1 V–0.8 V vs. Li/Li+ at 0.1 C was used. As this particular study focuses on the SEI composition from the initial formation cycles, only ten cycles were used for the electrochemical verification. This number was chosen to ensure that complete formation was achieved and that a stable coulombic efficiency was reached. Additionally, cyclic voltammetry was performed to investigate the degradation of the electrolyte on the surface of the porous silicon anodes in the initial formation cycle. The voltage was first decreased from the open circuit potential to 1.9 V, with a rate of 0.28 mV s−1, after which the voltage was further decreased to 0.1 V, with a rate of 0.0194 mV s−1 (corresponding to a rate of 0.1 C).

2.1.7. Postmortem Characterization

The ex-situ postmortem characterization of the chemical composition of the SEI, formed in the first cycle, was performed using X-ray photoelectron spectroscopy (XPS). Prior to characterization, the anodes were rinsed in an Ar-filled glove box with a solution of DME/DOL (2:1 (v/v)) to ensure the removal of all soluble SEI components. The samples were then vacuum dried for 5 min. XPS measurements were conducted using an instrument from Omicron Nano-Technology, GmbH, Taunusstein, Germany, with an Al-anode source (240 W). The spectral analysis was performed using CasaXPS software, and the spectra were referenced to aliphatic carbon at 285 eV.

3. Results

The ReaxFF simulations were successfully implemented to investigate the interaction between high-concentration, ether-based electrolytes and a silicon oxide surface (representative of the silicon anode surface chemistry). Experimental verification was later performed by investigating the SEI composition after the first formation cycle using X-ray photoelectron spectroscopy (XPS). The SEI composition after ten cycles was also investigated to determine how the SEI was developed after the initial formation cycles. The results are displayed and discussed below.

3.1. Reactive Force Field Simulation Results

3.1.1. Force Field Parametrization

The results of the ReaxFF parameter optimization conducted for the description of the SEI buildup are presented first. In Figure 1, the total error sum is plotted against the EA iteration number.
The convergence was reached quite fast, at a fitness of approx. 200,000, and the final value of the optimization is 185,288.6. The fast convergence and small deviations between the results of different EA runs (not shown here) indicate an easy EA problem, which is not surprising since a number of mostly independent parameter sets belonging to different coordinates were optimized. The search space is then effectively decomposed into several subspaces, with each dimension from 7 to 15 (depending on the coordinate type). Such low-dimensional problems are trivial to solve for OGOLEM (but are still hard/impossible to handle for other probabilistic or deterministic methods). More significant is how well the optimized ReaxFF reproduces the data collected in the training set. This is shown for the geometry part in Figure 2. Most bond lengths are reproduced well (less than 0.1 Å deviation), building four clusters at 0.95, 1.1, 1.5, and 1.7 Å, while a small fraction showed larger deviations, up to 0.9 Å. This indicates, however, that all the structures were stable, and no dissociations occurred. For bond angles, the average deviations were between 10 and 15 degrees, but no outliers are present here, in contrast to the bond lengths. Therefore, angles are also reproduced reasonably. The dihedral angles are reproduced with good quality, showing somewhat smaller deviations than bond angles, around 10 degrees. In summary, the reproduction of the geometries is reasonable, albeit not of outstanding quality.
The geometry scans show quite a variety of behaviors; three examples are shown in Figure 3. A full collection can be found in the Supplementary Material (Figures S4–S6). The S–Si bond length profile (a) shows a qualitative agreement, although with different shapes. The ReaxFF curves have a much narrower minimum and reach their dissociation energy at approx. 3.5 Å, whereas the DFT curves converge at a much slower rate. The characteristic parameters, however, are reproduced satisfactorily. The ReaxFF equilibrium length is somewhat larger than the DFT references, but the absolute deviation is only around 0.1 Å. The dissociation energies deviate between 50 and 60 kJ mol−1. The angle scans show quite a variety of behaviors. ReaxFF shows very satisfying qualities for some of them (b), whereas other profiles show large deviations in the energetics (c). Most profiles, however, reproduce a correct equilibrium angle and do not diverge.
The reproduction of reference data seems not to be of outstanding quality. This, however, could be expected in advance:
(1)
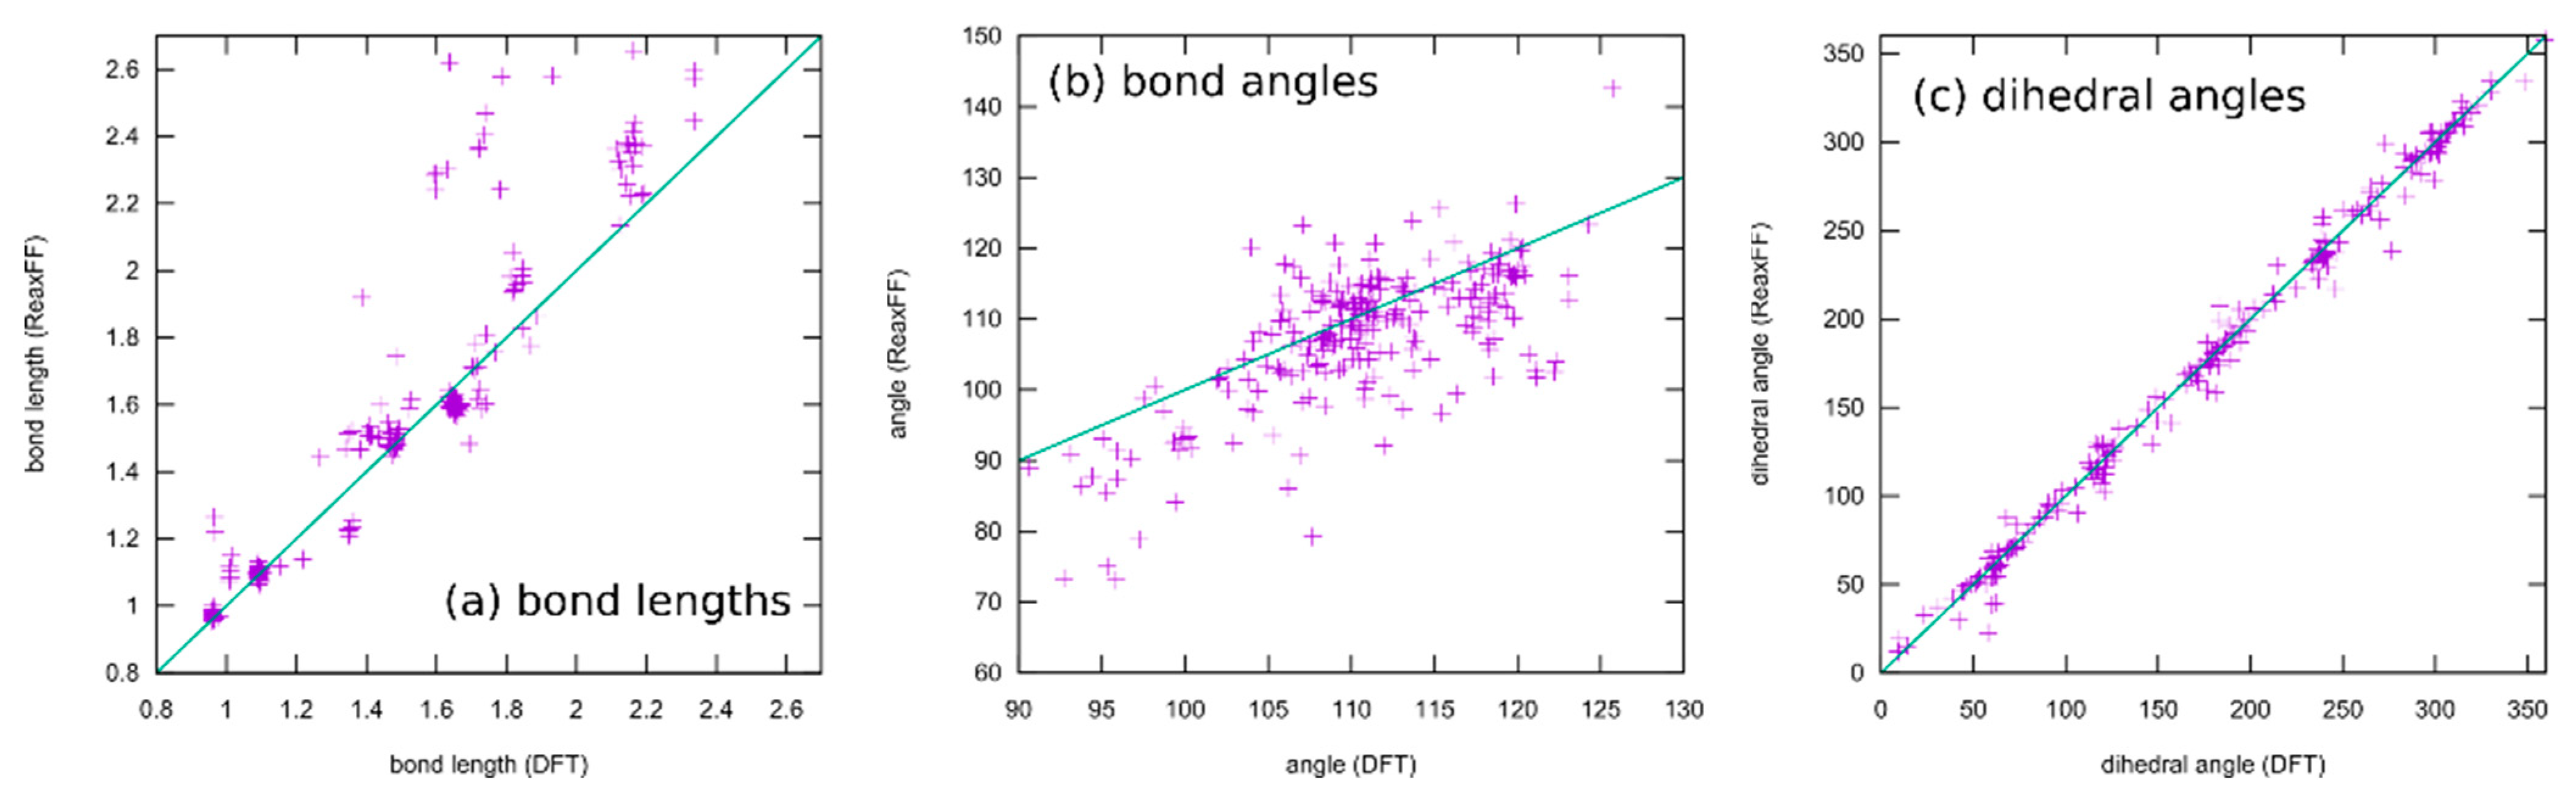
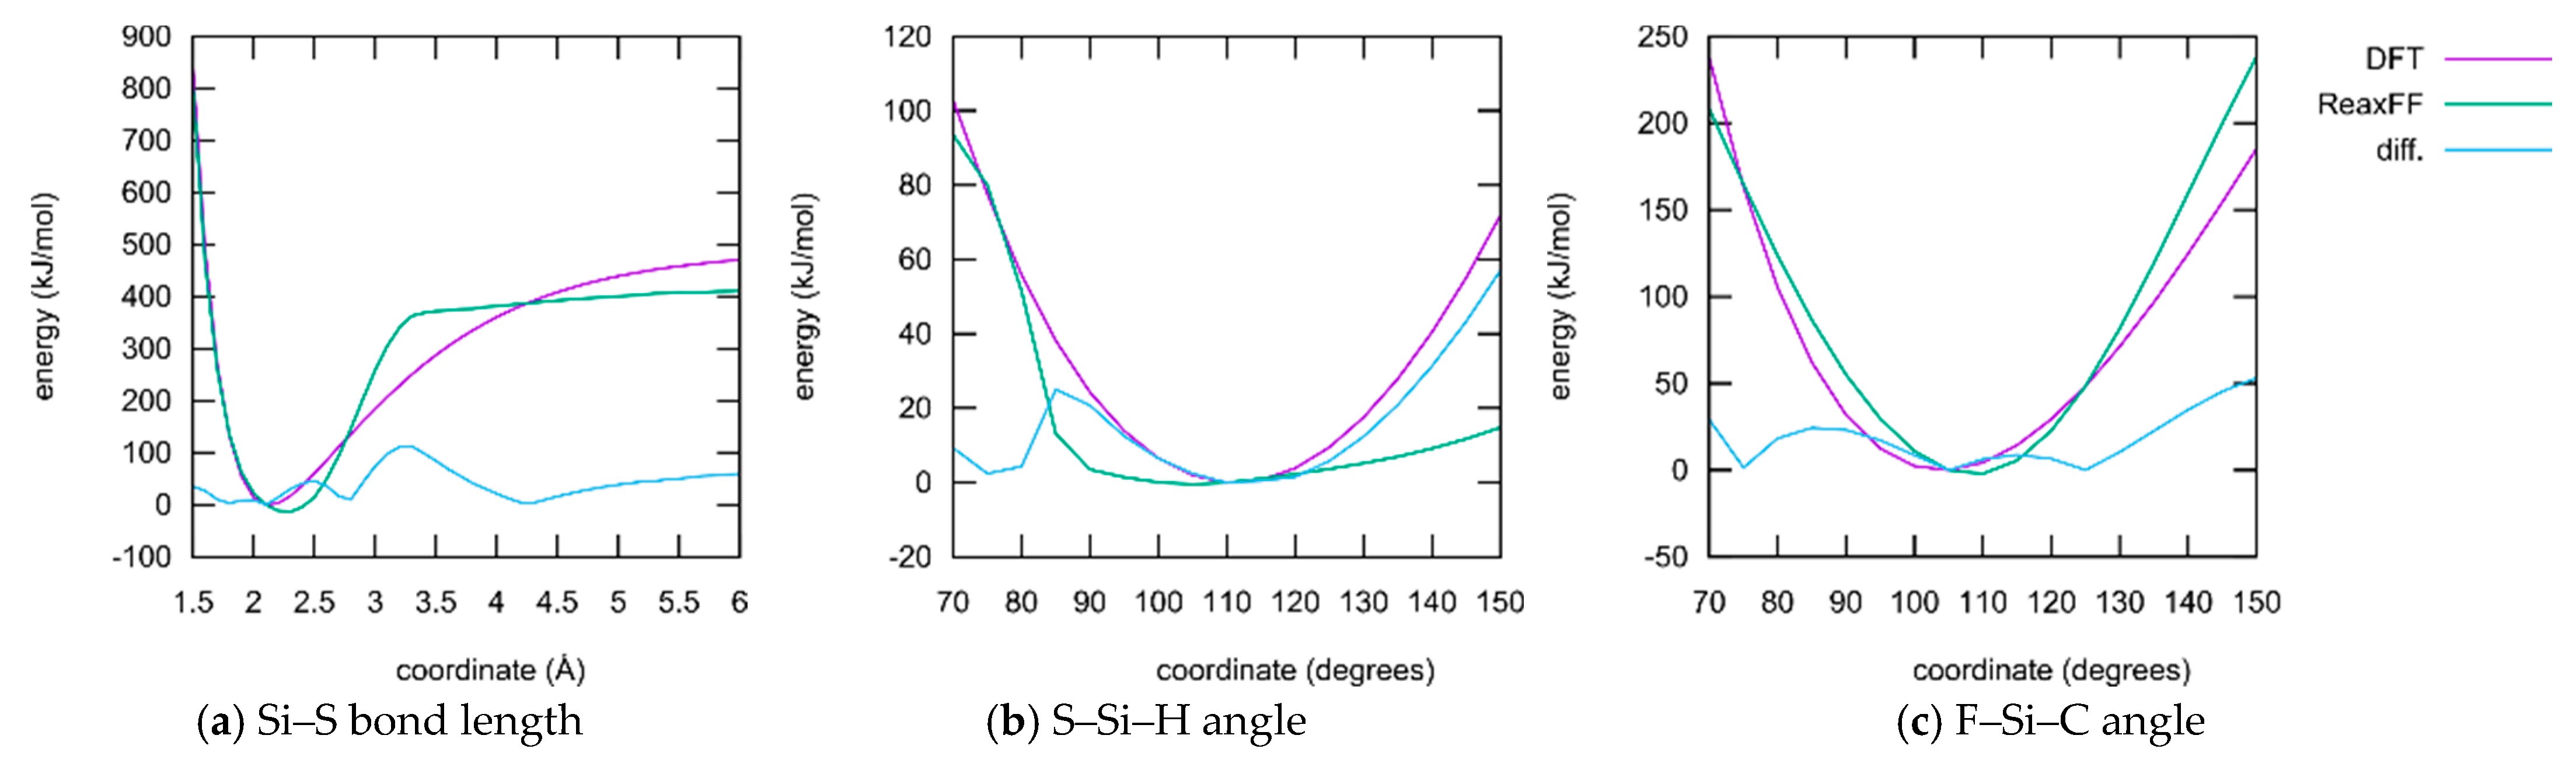
ReaxFF, especially when parameterized for such a large collection of elements as conducted here, usually does not have the ability to reproduce whole potential energy surfaces with chemical accuracy. The aim is rather to obtain the correct relative activation barriers and structural parameters in order to make fast and qualitative simulations of complex reaction networks and alternative reaction paths accessible. In fact, the level of agreement achieved here is on par with typical ReaxFF fittings published in the literature.
(2)
Only a small subset of the important parameters was provided for optimization. All element-specific parameters and all bond parameters besides those for the S–Si bond were kept fixed. The reason for this is that those global parameters have a strong influence on any chemical situation that might occur during the simulation. Much better results regarding the present training set could be achieved if more parameters are released for optimization. Then, however, the large landscape of chemistry considering the reactions of DOL with TFSI, and products containing F, S, and N atoms, etc., would have been altered as well. A huge training set covering the information and references to all these possible reactions must be provided if this should be conducted.
Since most parameters were taken from three papers covering interface reactions with TFSI and DOL/DME, all this chemistry is already included, and there is no need and no rational cause to overwrite all this. Such a global re-optimization could, however, be performed if electrolytes/electrodes with a totally new composition could be simulated.
Nevertheless, the optimized force field can be expected to lead to correct simulation results regarding the SEI composition since this largely depends on the relative size of the reaction barriers.

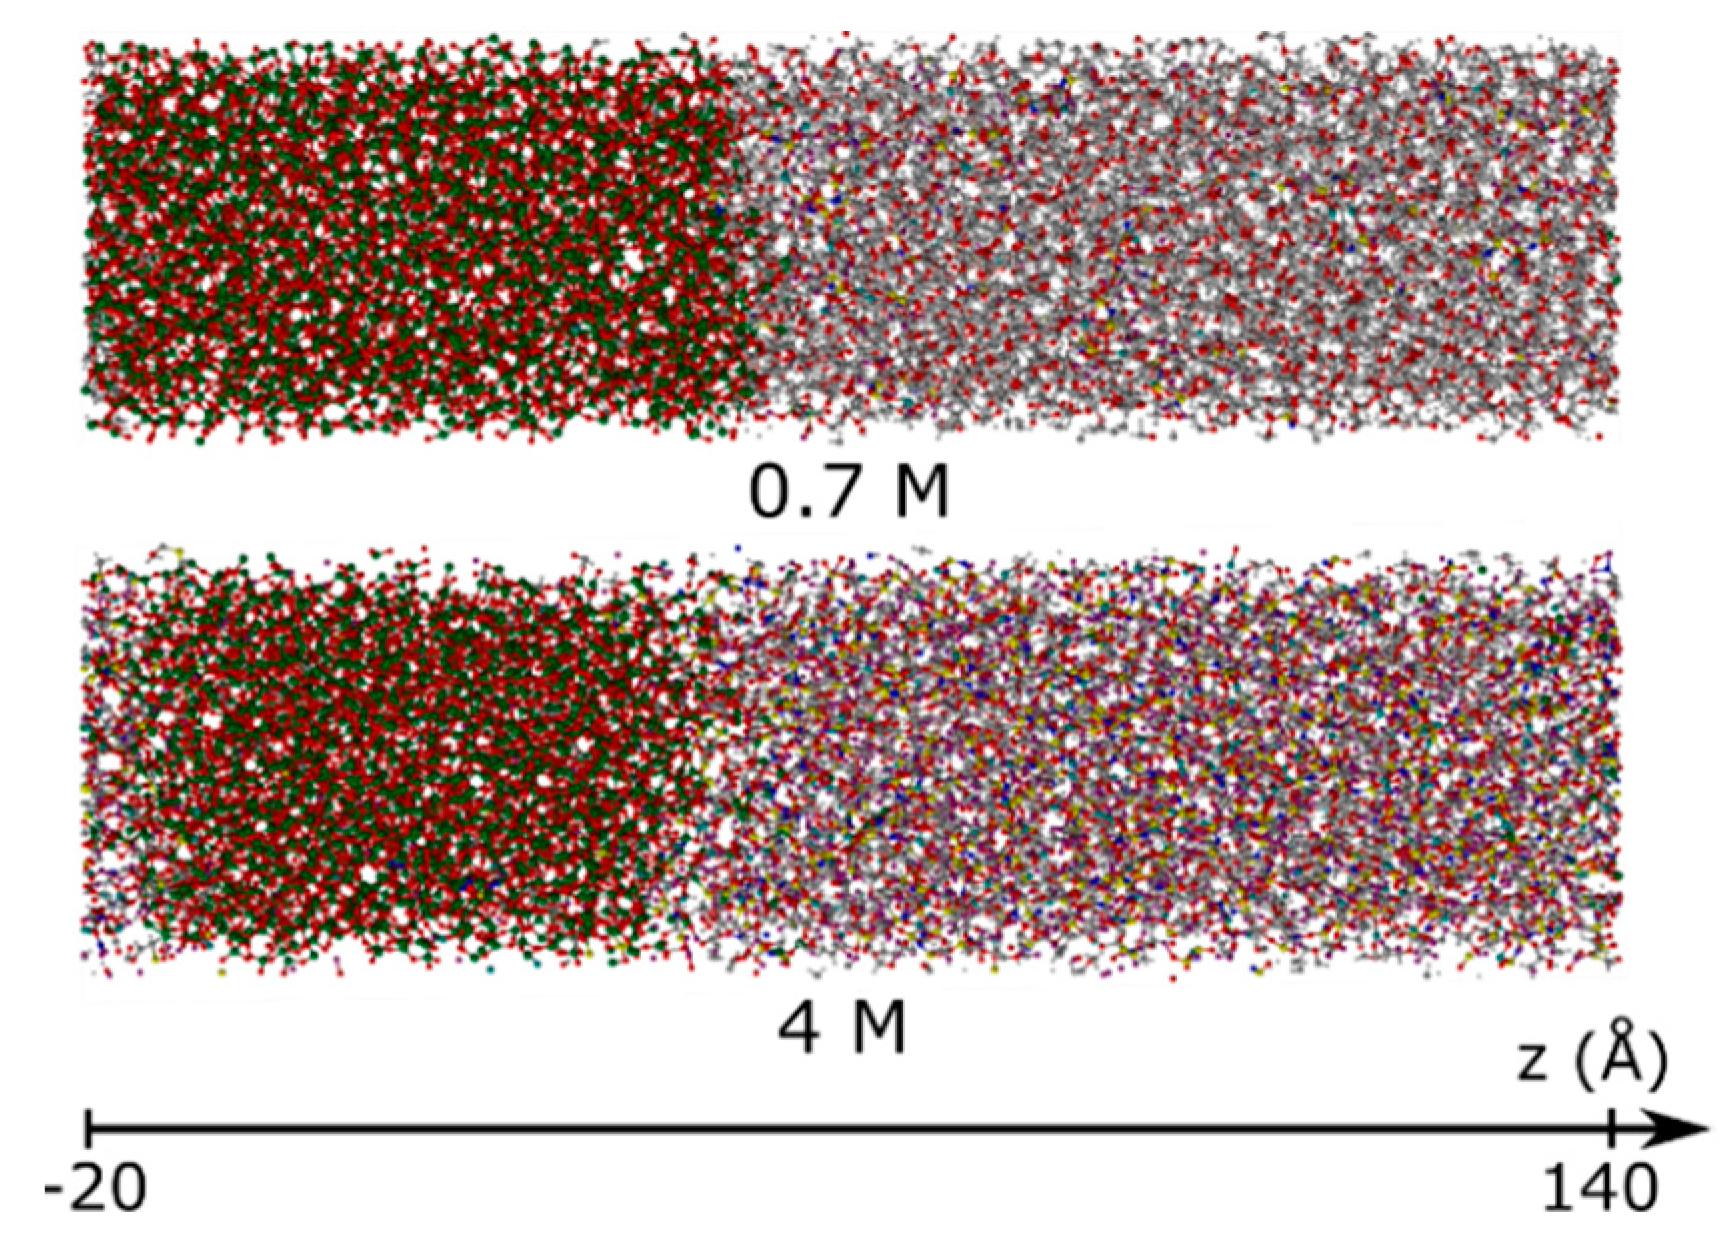
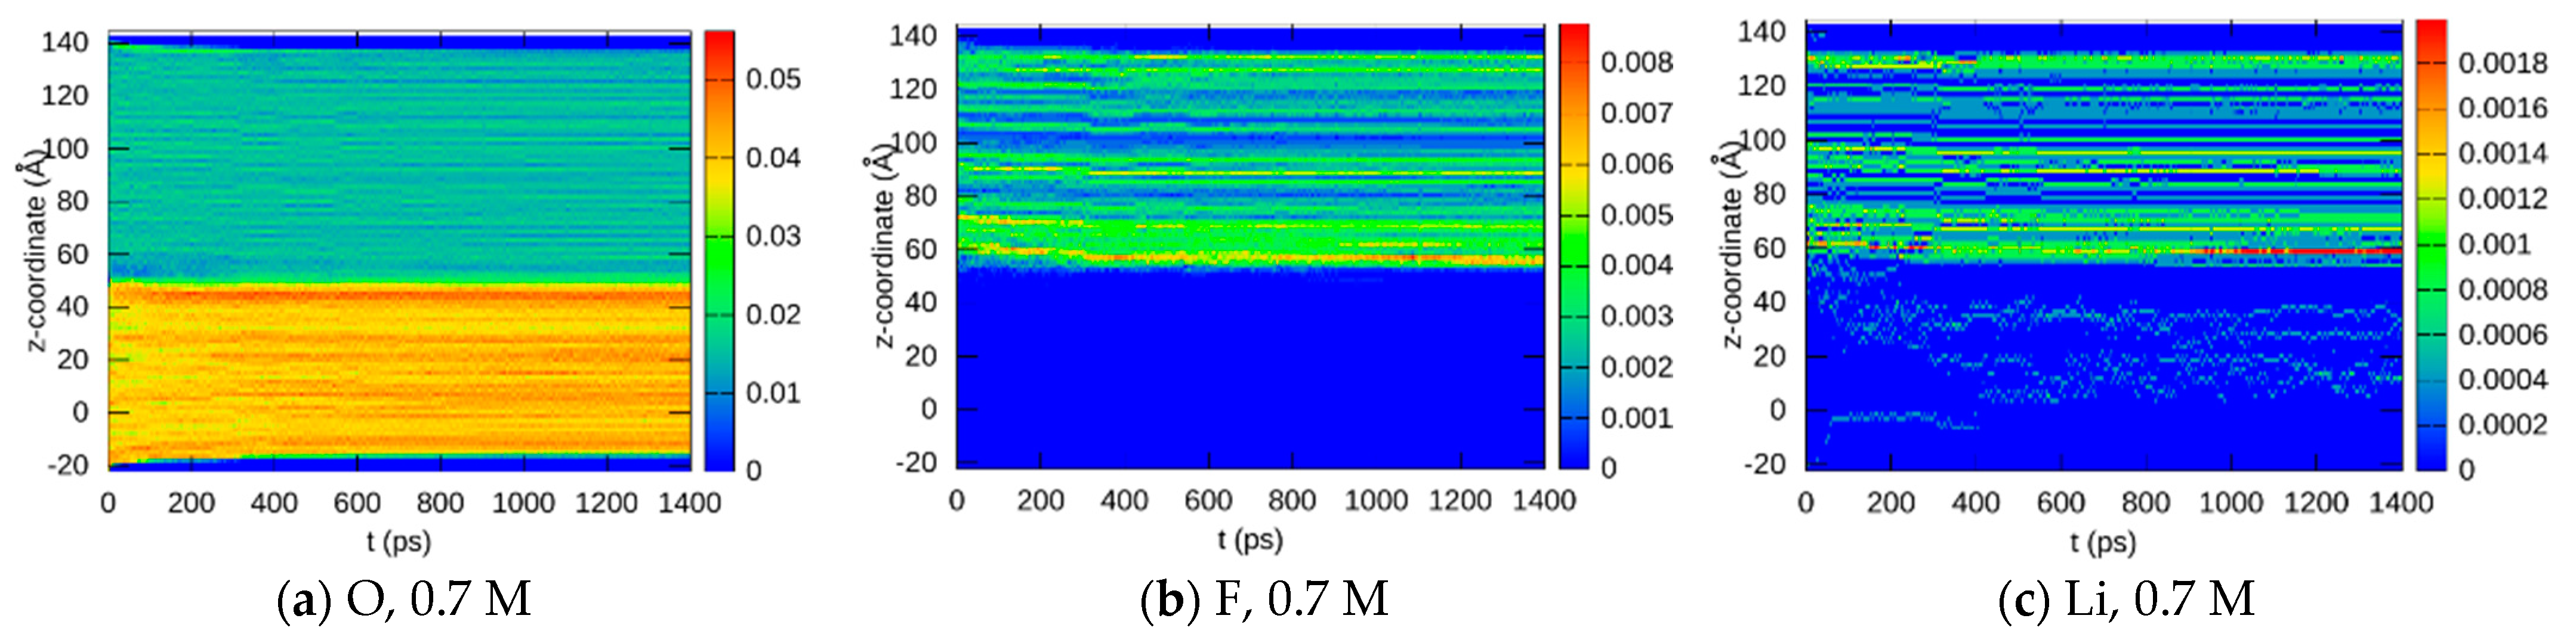
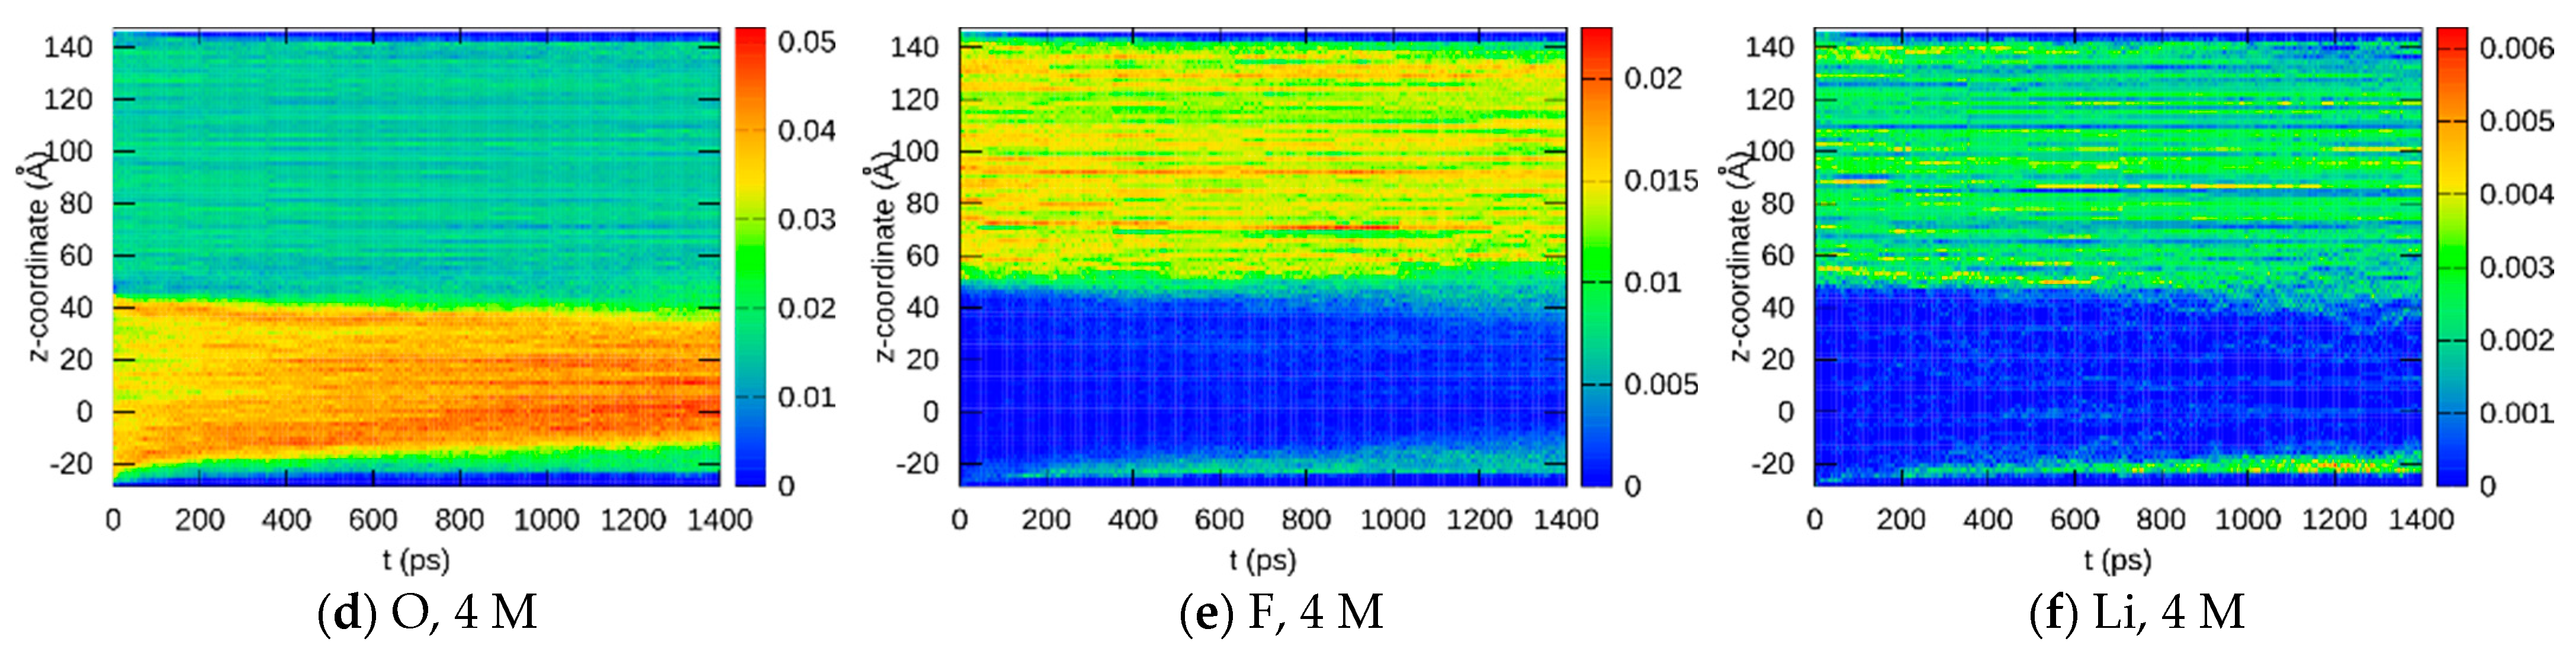
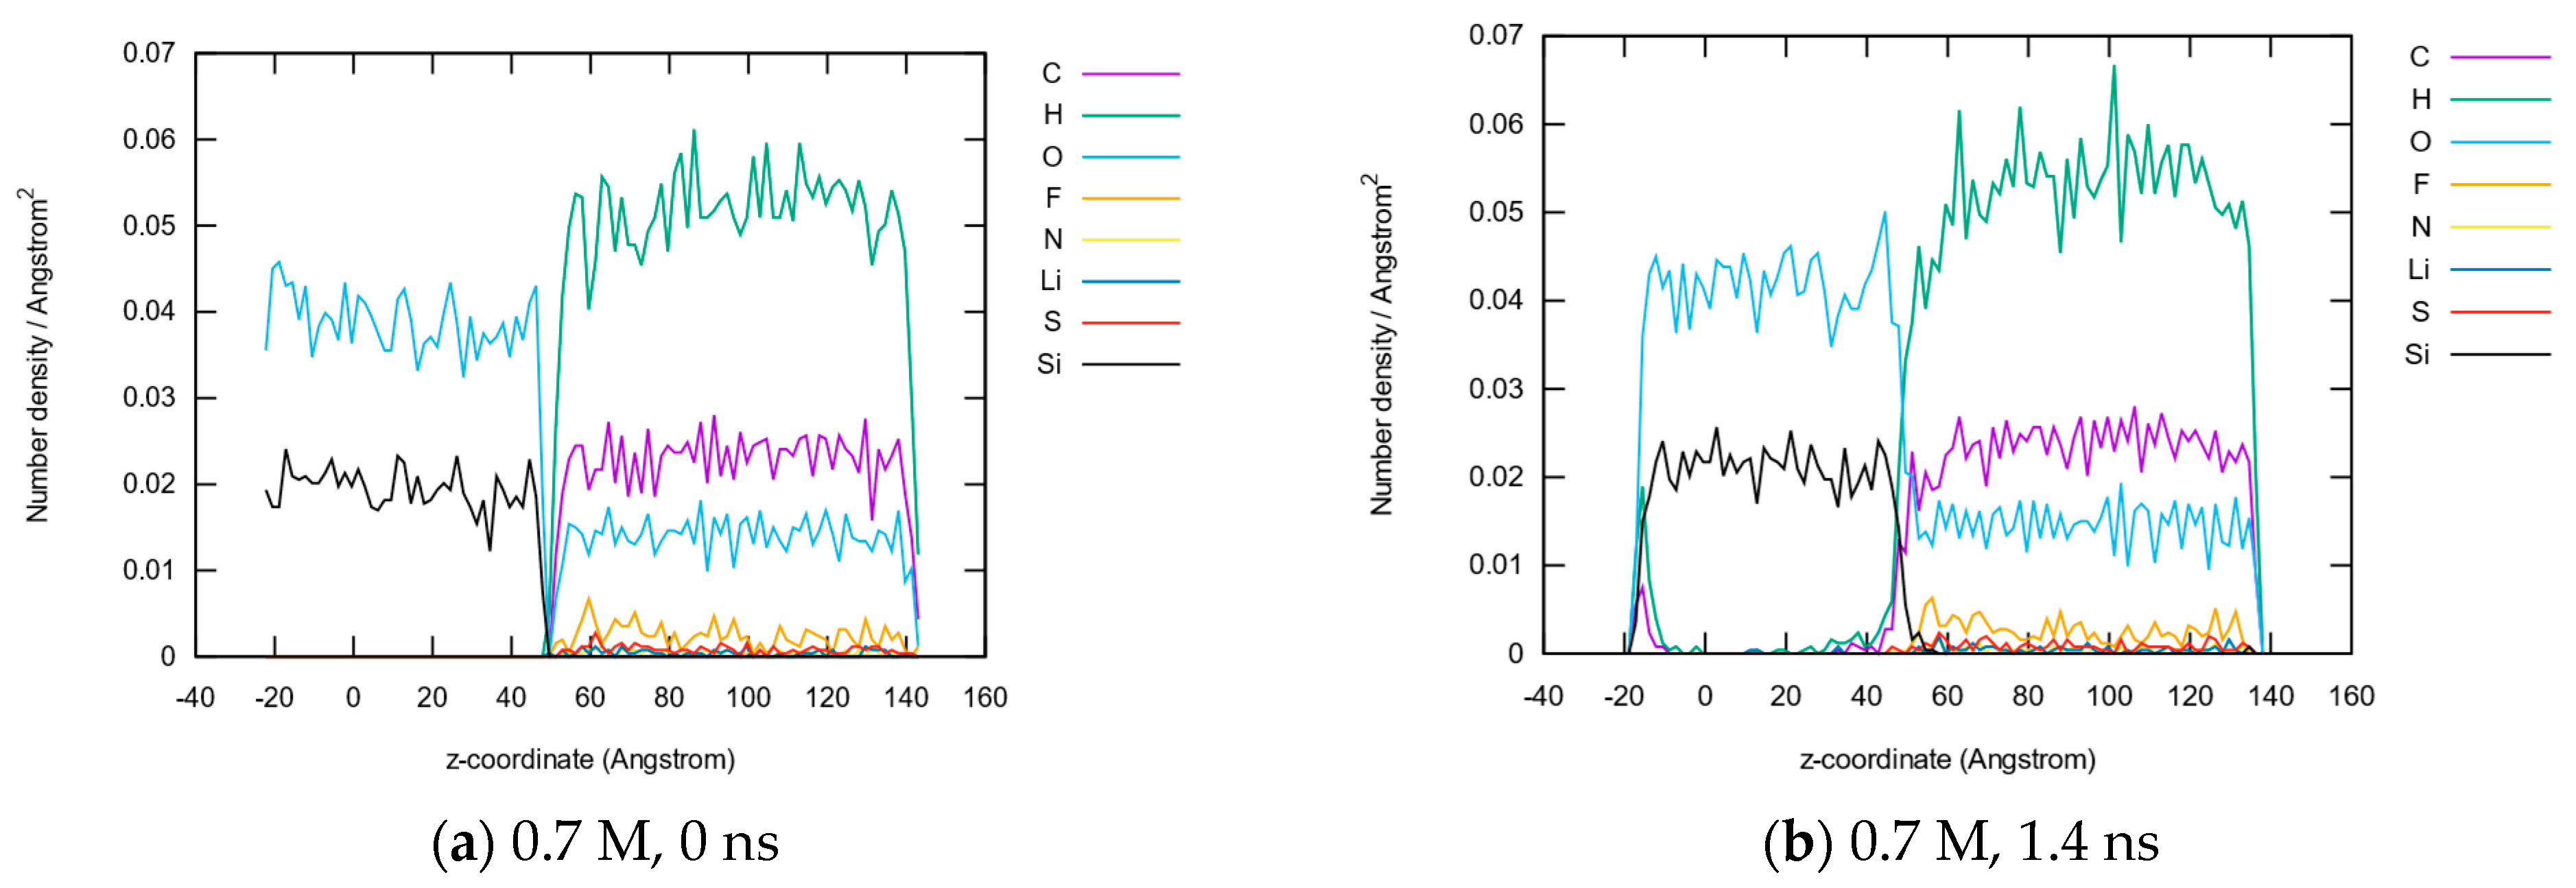
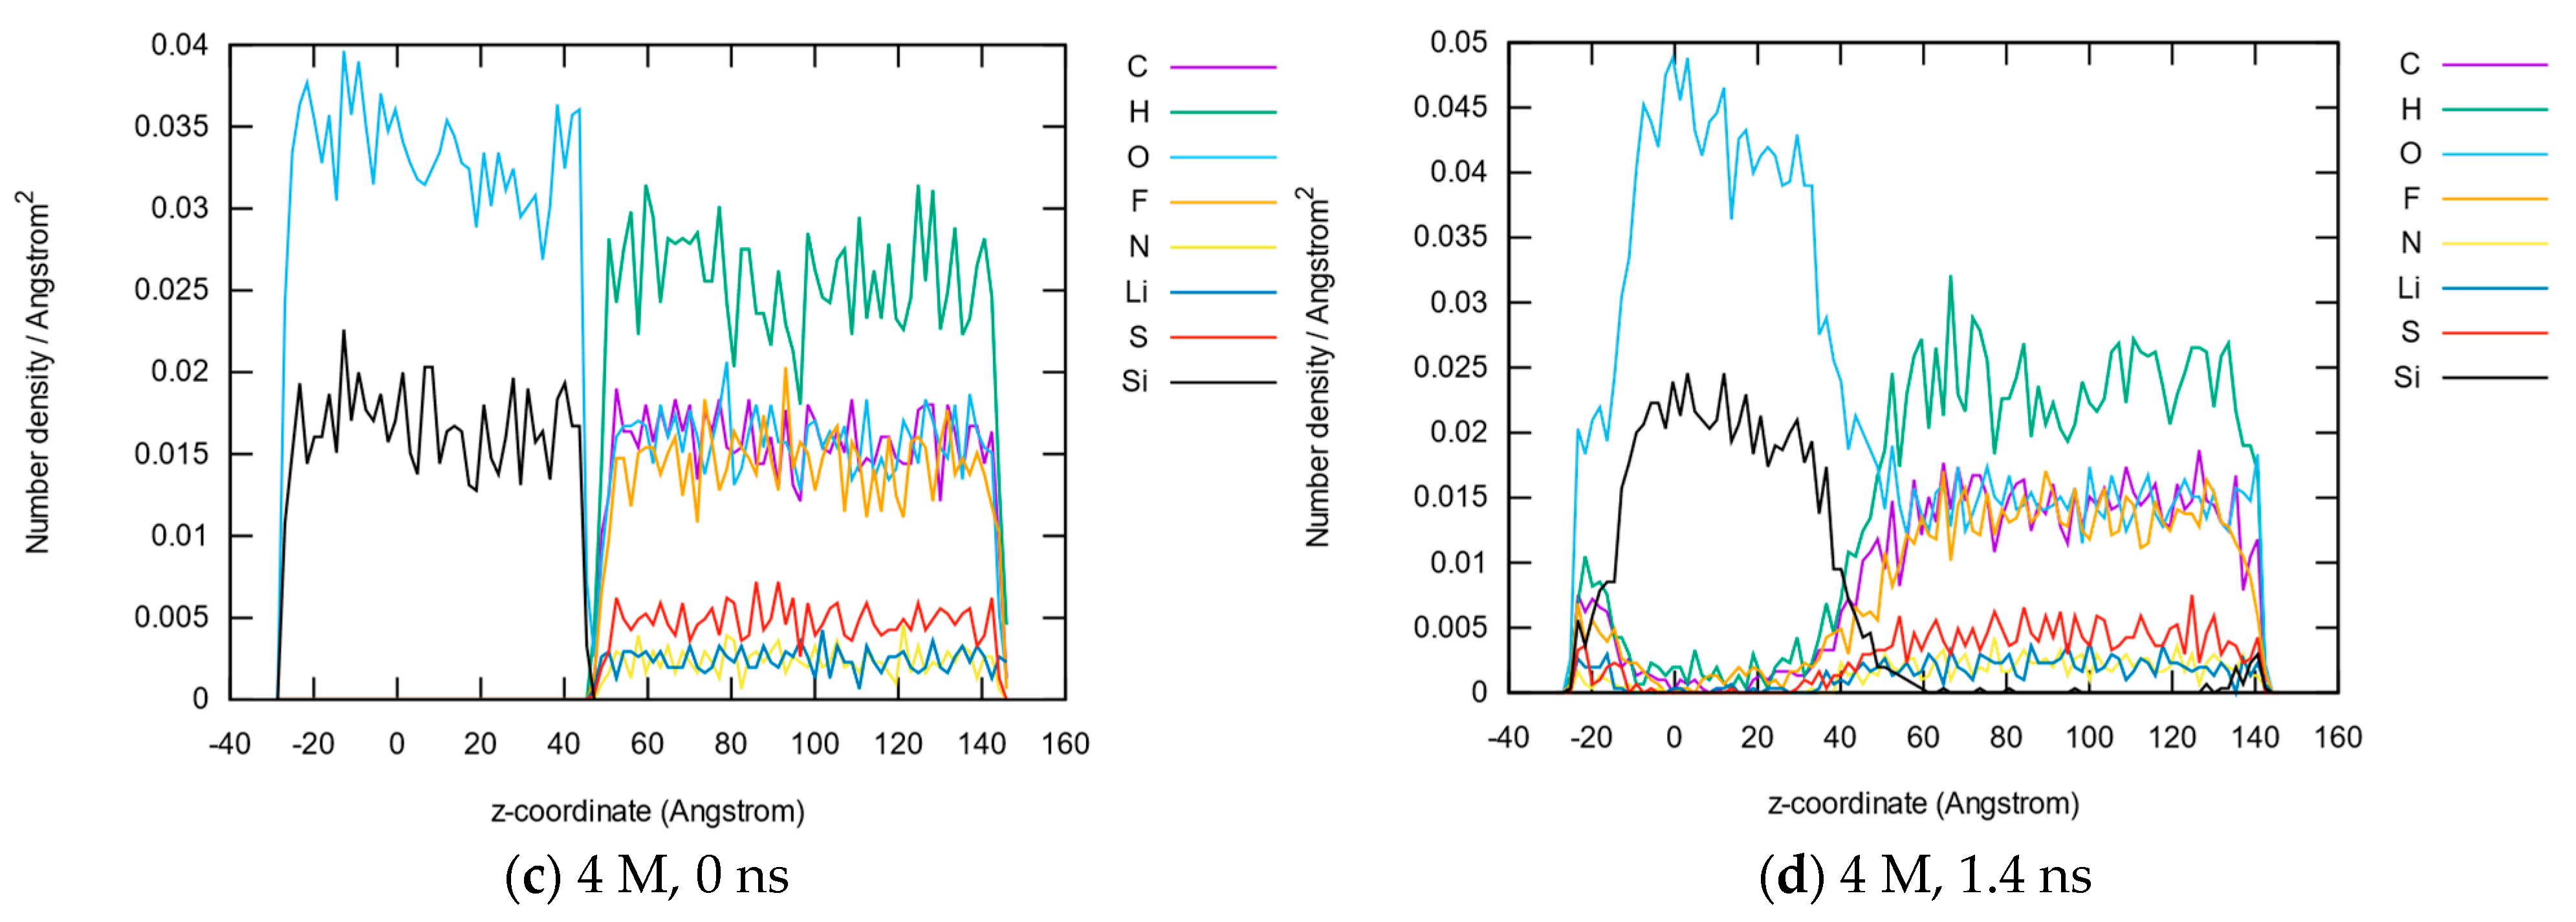
3.1.2. Element Distributions

In the next sections, the results obtained from the ReaxFF sampling trajectories will be shown. In Figure 4, two screenshots of the model battery systems with 0.7 and 4 M TFSI within the electrolyte are shown during SEI formation. Further screenshots can be seen in the Supplementary Material (Figures S7–S9). Obviously, the simulated system is too large and too complex to draw conclusions from such visual inspections alone.
The simplest way to analyze the results of the reactive dynamics is to look at how the eight different elements are distributed in space. Since we are interested mainly in the direction perpendicular to the SEI interface, i.e., the z-axis, the evaluation program packed all atoms of the respective elements into the system with 200 bins along the z-axis and separately for each written time step (one per ps, i.e., 1400 frames in total). The results are shown in Figure 5 for selected elements (O, F, and Li). Complete results, as well as simulations at different pressures and temperatures, are shown in the Supplementary Material (Figures S10–S14). Since the system is periodic in the z-direction, essentially, two SEIs can be seen at z ≈ −18 Å and z ≈ 50 Å.
Here, and in the following, the SEI region is defined as the interval in the -direction, where a clear mixture between both initially separated phases (anode and electrolyte) can be located. This means that elements that existing initially only in the anode (Si) or in the electrolyte (F, N, …) can now be found in the same spatial region, indicating that an interface including components of both phases is formed. With respect to the element concentrations, those regions that experience significant changes (a depletion in the enrichment of elements) during the dynamics were allocated as the SEI region. In the following sections, it turns out that this definition is in good agreement with that of regions where new kinds of chemical bonds exclusive to the interface are formedT).
As expected, two parts of the system can be easily identified: The SiO2 anode from z ≈ −20 to z ≈ 50, where the oxygen concentration is high, and the electrolyte from z ≈ 50 Å to z ≈ 140 Å, where F and Li concentrations are high, and the oxygen concentration is lower. The time-dependent abundance of Li shows approximately horizontal filaments since only one ion is added per LiTFSI unit, building a population of just 60 in total for the case of the 0.7 M system. Lithium ions tend to penetrate the anode part for both the 0.7 and 4 M systems, where this behavior is largely enhanced at higher concentrations. The interface remains clearly visible at 0.7 M for O and F concentrations during the whole simulation time, the SEI grows to a thickness of less than 10 Å, whereas a much broader blurred region between the phases develops at 4 M. There, the SEI region with intermediate O and F concentrations is around 30 Å thick (z ≈ 30 to z ≈ 60 Å) at the end of the simulation time. Especially from the O concentration at 4 M, it appears that the SEI is formed mainly by the penetration of electrolyte atoms into the anode material, which might play the role of a sponge that sucks significant portions of the electrolyte (or its decomposition products) into it. It should be noted that the flow of Li ions from the anode to the electrolyte usually contributes to SEI formation in the formation cycles of a battery; however, this was not considered explicitly in this study. Thus, all Li ions originate from the initially placed LiTFSI units. Since our simulation time is very short in comparison to the time needed for several formation cycles, it was assumed that this contribution could be neglected during the first merge of both phases described here (which corresponds to the very initial buildup of the battery from its parts).
The z-dependent concentrations of all nine elements are plotted for the first- and last-time steps in Figure 6. Both electrode and electrolyte parts show similar characteristics for all the elements involved. While the interface remains rather small for 0.7 M, it becomes much broader for 4 M. Additionally, the electrolyte elements (C, H, F, N, S) significantly permeate into the full range of the anode (d), indicating that the SEI might be much broader, covering at least 50–60 Å, with the center at z ≈ 40 Å.

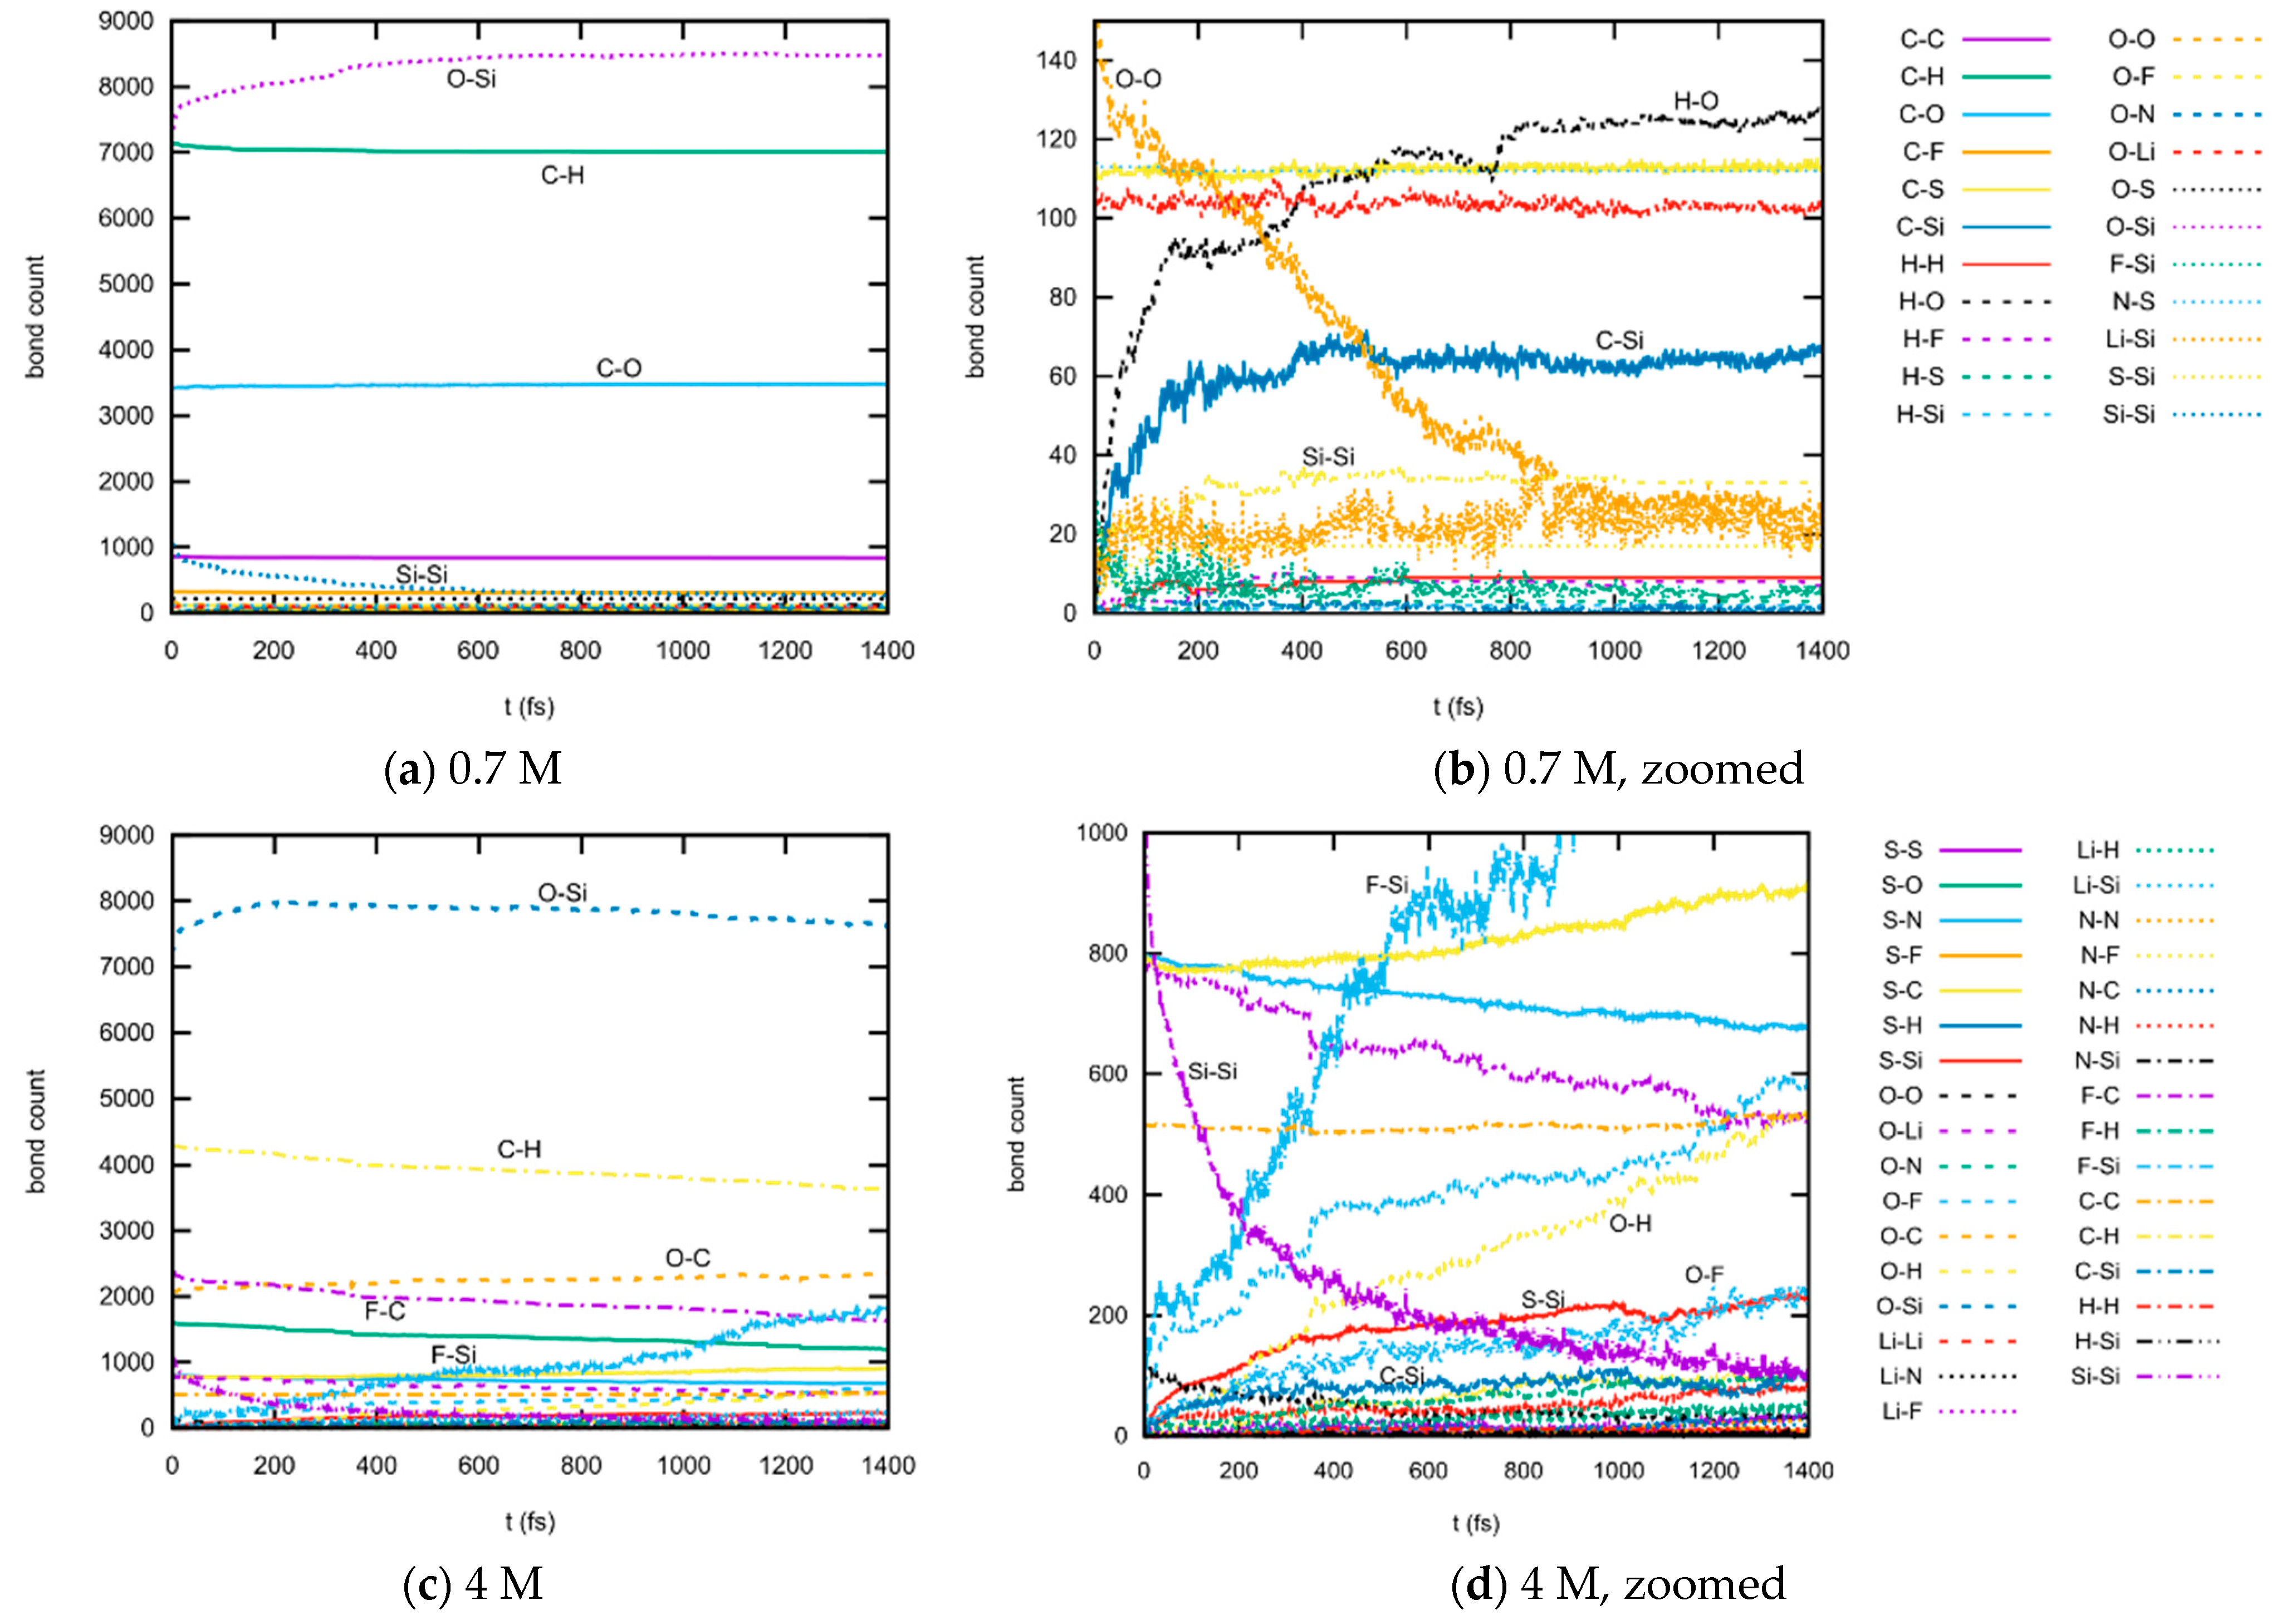
3.1.3. Bond Abundancies

As a first step in studying the chemical reactions happening during the SEI formation, it is instructive to look at the spatial distribution of chemical bonds. The location and species of formed or broken bonds are shown in Figure 7.
For the 0.7 M LiTFSI system, the most abundant bonds during the whole dynamics are O–Si, C–H, and C–O, where the first type is present in the anode bulk, and the other two are in the electrolyte. The number of O–Si bonds rises during the first 800 ps of the dynamics, probably due to the rearrangement and bond reformation within the amorphous anode material, whereas the numbers of C–H and C–O bonds change less significantly: C–H drops and C–O raises. Si–Si bonds also become less common with elapsing time. All other bond types are much scarcer; in order to visualize them, a zoomed-in plot is provided in (b). The most significant changes here are O–O (falls from 150 to 20), H–O (rises from zero to 130), and C–Si (rises from zero to 70). Interpreting just these absolute numbers, it follows that the growth of SEI at a low LiTFSI concentration involves the breaking of O–O, Si–Si, and C–H bonds, where C–Si, C–O, and H–O bonds are formed. Connections between the electrolyte and electrode are built by linking the C bonds of the solvents to the SiO2 network, where the former bonded hydrogens volatilize as parts of small gas molecules (see below). Note that both Si–Si and O–O bonds are absent in perfect crystalline SiO2, indicating that defects in the amorphous material are the main entry points for SEI formation.
The 4 M LiTFSI system again shows much more dynamics and reactivity. O–Si bonds are most abundant; their number rises and reaches a maximum at approximately 200 ps, probably due to two competing processes where bulk rearrangement leads to more crystalline SiO2 and then consumption due to SEI formation. C–H (falling) and C–O (slightly rising) bond abundancies exhibit similar time dependencies as in the 0.7 M system. F–C bonds now appear frequently as well (due to the much higher number of TFSI ions), and their number falls during the SEI formation process. The number of F–Si bonds rises from zero, in the beginning, to almost 2000 at the end. Si–Si bonds, on the other hand (zoomed plot), are consumed almost entirely, as in the 0.7 M system. C–Si interconnections rise from zero to more than 100 (in comparison to 70 in the 0.7 M system), confirming the existence of a broader SEI region. O–H and O–F bonds gain importance as well during the dynamics. Sulfur is also involved in the SEI formation, S-Si bonds (whose parameters were newly introduced into ReaxFF in line with this study) grow from zero to almost two hundred. With the larger diversity and an absolute number of different bonds, it is much more difficult to draw a deduction concerning the actual reaction mechanisms when knowing only the absolute bond numbers. The main points of attack are, again, the defects within the anode material, and the fluoride seems to play an important role since its bonding partners vary significantly during the dynamics.

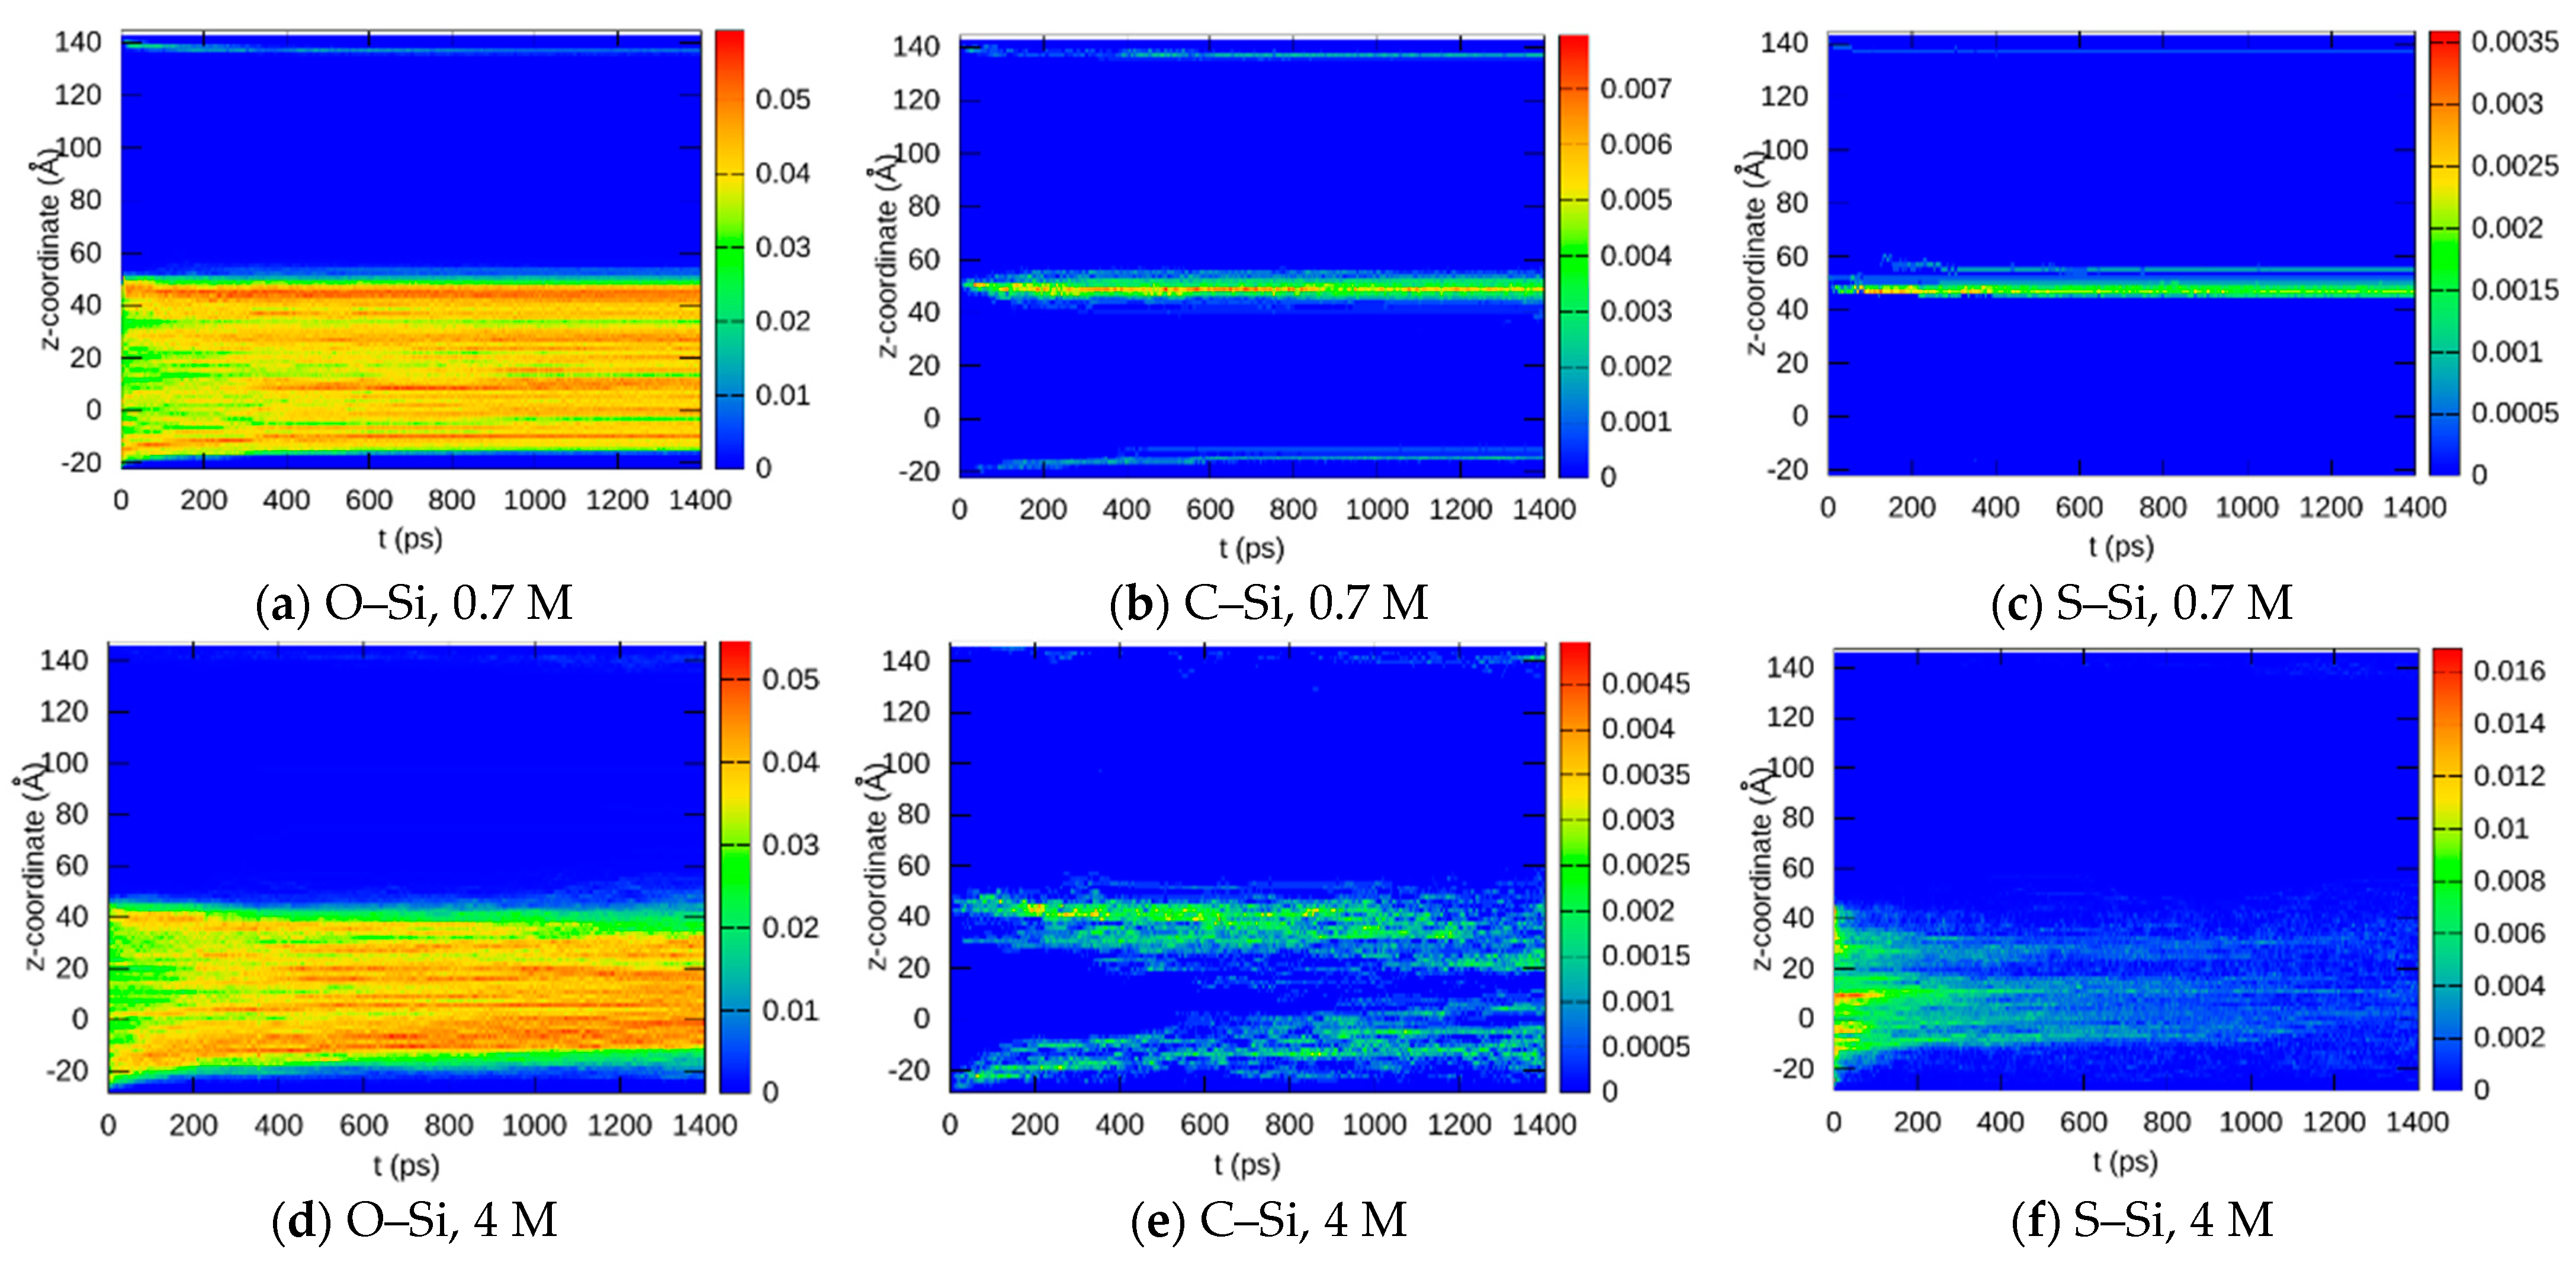
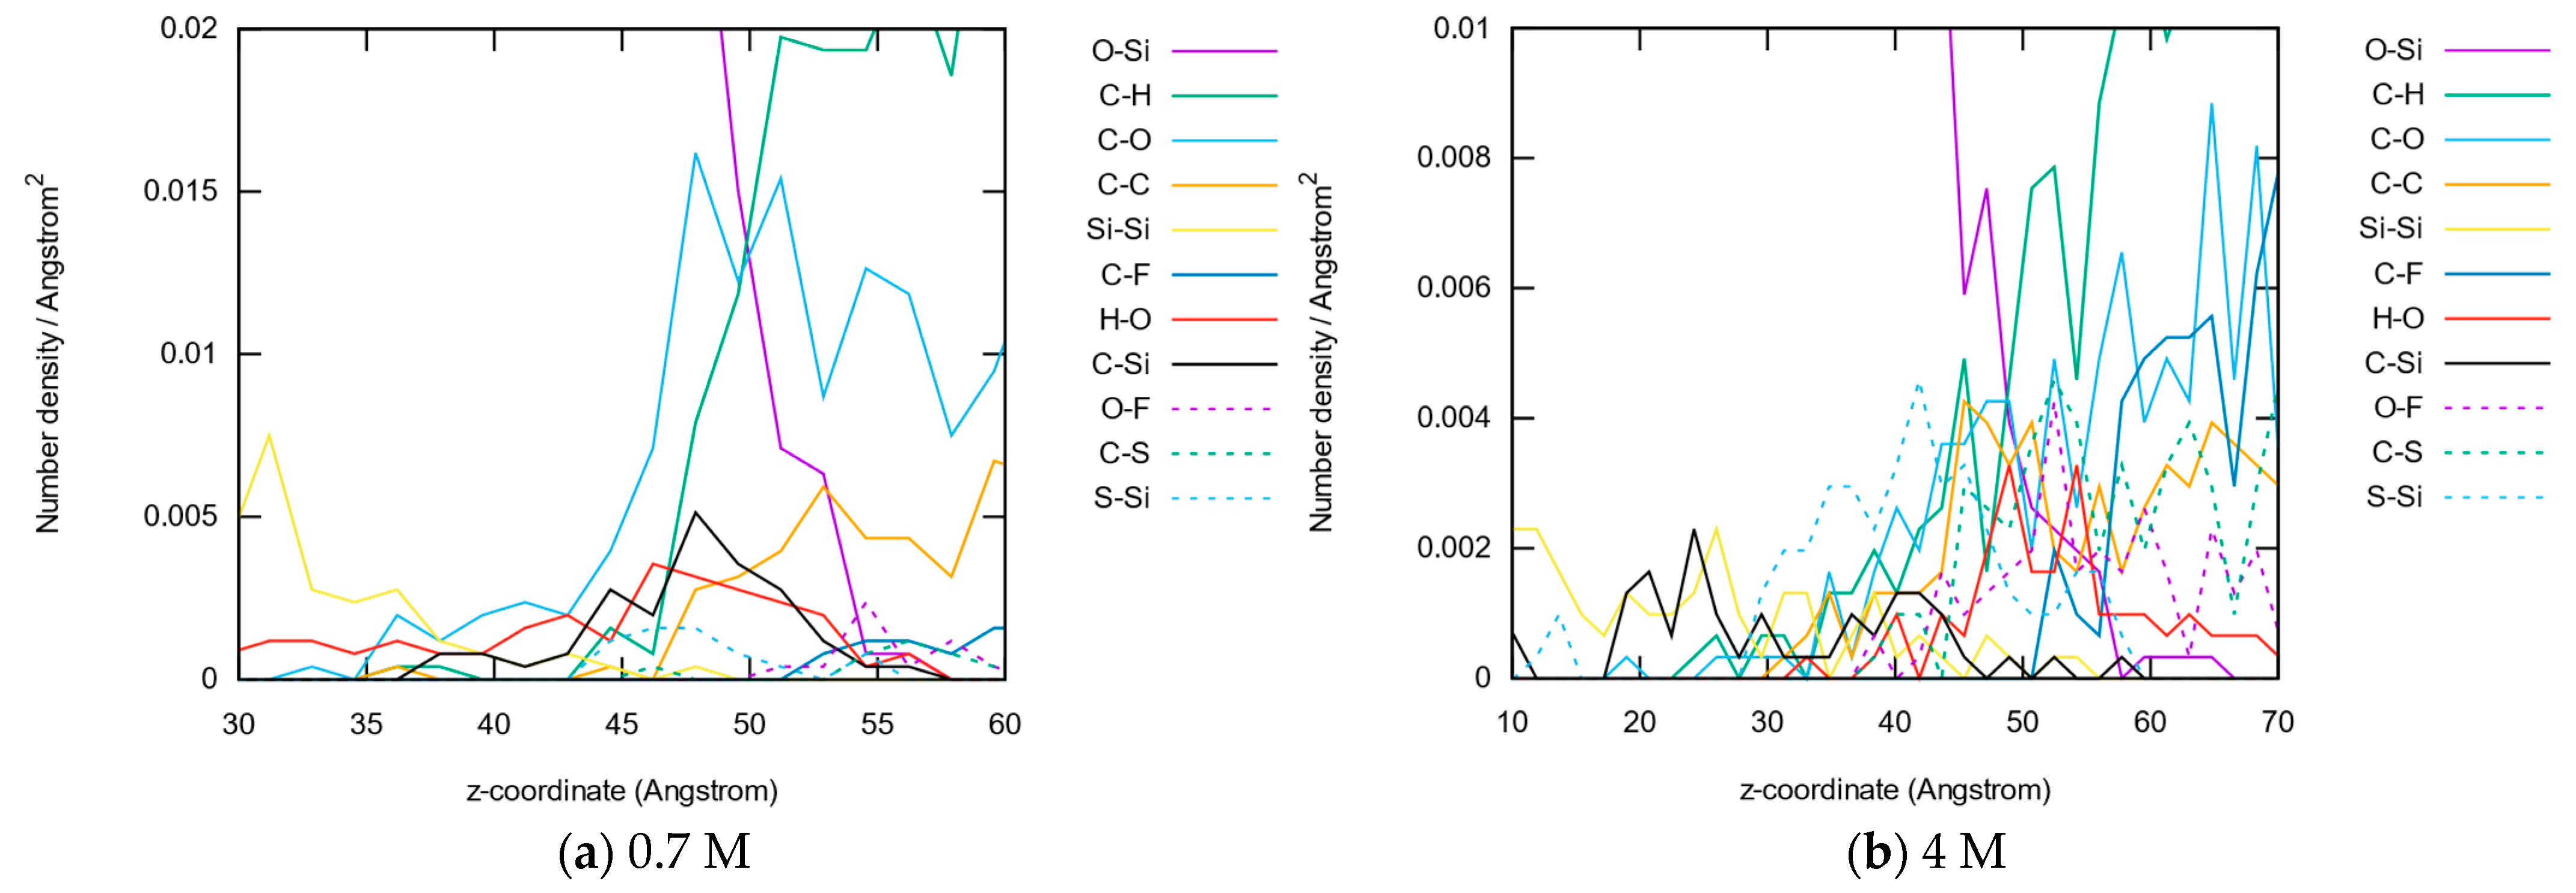
3.1.4. Bond Distributions

As in the case of atoms, the spatial distribution of chemical bonds also provides a good indication of the shape of the SEI. The SEI can essentially be located where new bond species are formed, connecting atoms of the electrolyte and the anode material. Due to combinatorics, many different bond species can be built during the SEI buildup; three representative examples are shown in Figure 8. More distributions are plotted in the Supplementary Material (Figures S15 and S16).
The O–Si bond shown in Figure 8a,d behaves similar to the O atoms in Figure 5. During SEI buildup, the anode consisting mainly of those bonds shrinks in size, and this behavior is more significant in the 4 M system. C–Si and S–Si bonds, on the other hand, are absent at the beginning of the dynamics since they can only be built between both electrolyte and anode phases. Their location, therefore, is a good marker for the current extent of the SEI at different times during the dynamics. As already seen before, the SEI becomes broader in the 4 M system, and it mainly grows into the former anode material (see Figure 8e,f).
A broader view is given in Figure 9, where the spatial densities of the eleven most abundant bonds after 1.4 ns of dynamics are plotted in the SEI region. Similar plots covering the whole z-coordinate range can be found in the Supplemental Material (Figure S17). Whereas the main components of both former phases (anode: O–Si, electrolyte: C–H) mark the intersection of both phases, a larger number of less abundant species is distributed quite broadly along the SEI. The C–Si bond distribution again marks the extent of the SEI, which is roughly 2 nm thick in the 0.7 M system and 4 nm thick in the 4 M system.

3.1.5. Molecule Abundancies and Distributions

Even more interesting than the number and location of chemical bonds in the systems is how many molecules of individual species are present during SEI buildup at different parts of the interface. In this study, this analysis concentrated on small gas phase molecules with up to seven atoms in them. How the molecules were determined from the location of the chemical bonds, by using openbabel [71] for the generation and comparison of SMILES strings [72] for extracted local geometries, is explained in the Supplementary Material (Algorithm S1). For both 0.7 and 4 M systems, the number of those small molecules was counted for each MD screenshot (every 0.5 ps). The most abundant molecules, summed up over all the time frames, are shown in Figure 10, with their numbers in the final time frame indicated as well (see also Supplementary Material, Figures S18 and S19).
Ethylene is the most abundant small molecule in the 0.7 M system, followed by methanol, formaldehyde, hydrogen, carbon dioxide, and hydrogen fluoride. If we compare this with (b), where the same list is given for the 4 M LiTFSI system, we see many similarities but also some obvious differences. First, the total number of small molecules is much larger; the most abundant species are counted nearly 50 times in the last frame, compared to 19 and 12 in the 0.7 M system. The ordering is also somewhat different: the abundance of ethylene is now only the third highest, with carbon dioxide and formaldehyde taking the top positions. Hydrogen fluoride, methyl hypofluoride, and water follow them. Since, as another study suggested, ethylene is one of the main degradation products of DOL [73], this finding coincides well with expectations. As ethylene is a volatile gaseous by-product, it can be expected that, over longer time scales, it will escape the SEI.
In order to study the reaction dynamics, which leads to the formation of the different molecular species, the time-dependent numbers of the most abundant ones are plotted in Figure 11. In the 0.7 M system, we see that the formation of ethylene is mainly finished after 0.6 ns, and other less abundant species then also have essentially constant numbers; only the number of formaldehyde and oxygen molecules slightly decreases after 0.7 ns. This indicates that the SEI formation is essentially finished after 0.6–0.7 ns, with only subordinated reactions consuming some formaldehyde and oxygen still taking place. (Of course, rare reaction events would not be visible on this time scale but could lead to appreciable changes on a millisecond time scale). The picture is again much more interesting for the 4 M system. Here, no real equilibrium is reached in the simulated 1.4 ns; only the number of ethylene molecules reaches a plateau after 0.4 ns. Formaldehyde and carbon dioxide, which are less abundant between 0.4 ns and 0.6 ns, are still being produced, leading them to outplay ethylene. Fluoride species, such as methyl hypofluoride, hydrogen fluoride, and hyperfluorous acid, that are produced from the decomposition of TFSI anions, are important as well; hydrogen fluoride is produced first and reaches a plateau after 0.8 ns, whereas the number of hyperfluorous acid molecules rises until the end of the dynamic.
The rather short simulation time was sufficient to reach the first kind of chemical equilibrium in the SEI region for the 0.7 M system. For the 4 M system, on the other hand, many processes are still not complete, and even longer simulations are needed. Since, however, the general trends concerning the elemental compositions of the SEI are already in qualitative agreement with the experimental findings, and a complete simulation of the buildup seems to be out of reach even for computationally cheaper methods such as REACTER [44], it follows that our approach was justified for giving reasonable mechanistic insights into the process.
Additional information can be gained from the spatial distribution of the molecules. Since the number of molecular species present at one point in time was quite small, the total trajectory was split into five parts, for which molecular spatial abundances were summed up, so that those time-resolved and also sufficiently space-resolved distributions were gained.
These distributions are plotted in Figure 12a,b for the 0.7 M system (see also Supplementary Material, Figures S20 and S21). As could be expected from the previous findings, there is no significant variation between (a) and (b) since the SEI formation is essentially finished after ca. 0.4 ns. All molecules besides oxygen can only be found in the SEI region, and the oxygen originates presumably from local defects in the amorphous SiO2 structure, where excess oxygen atoms dimerize. The SEI region itself is somewhat shifted towards larger z values when comparing it to the bond concentrations shown in Figure 8. There we see that the SEI spreads from z = 40 to z = 60. Small molecules are thus preferentially formed at the electrolyte side of the SEI. The anode side presumably consists mainly of larger networks of molecule parts attached to the dangling SiO2 chains (see below). Within the SEI region consisting of small molecules, a fine structure can be found with the methanol molecules nearer to the anode side (z = 50 to z = 57) and the formaldehyde molecules nearer to the electrolyte side. The most abundant ethylene can be most probably found in the center of the molecular SEI.
If those findings are compared with the time-dependent distributions for the 4 M system in Figure 12c,d the SEI there is much broader. In the first fifth of the trajectory, the SEI covers essentially the same region as for the 0.7 M system, but it grows further, and finally, small molecules can be found in almost the entire electrolyte region. Concerning the different species, carbon dioxide is preferably located near the anode, whereas formaldehyde, ethylene, and methanolate are spread far into the electrolyte region. We can thus follow that the SEI has a layered structure: small molecules are preferentially located at the electrolyte side, with different molecules existing at different layers of the molecular SEI, in contrast to the rather solid-state SEI at the anode side.

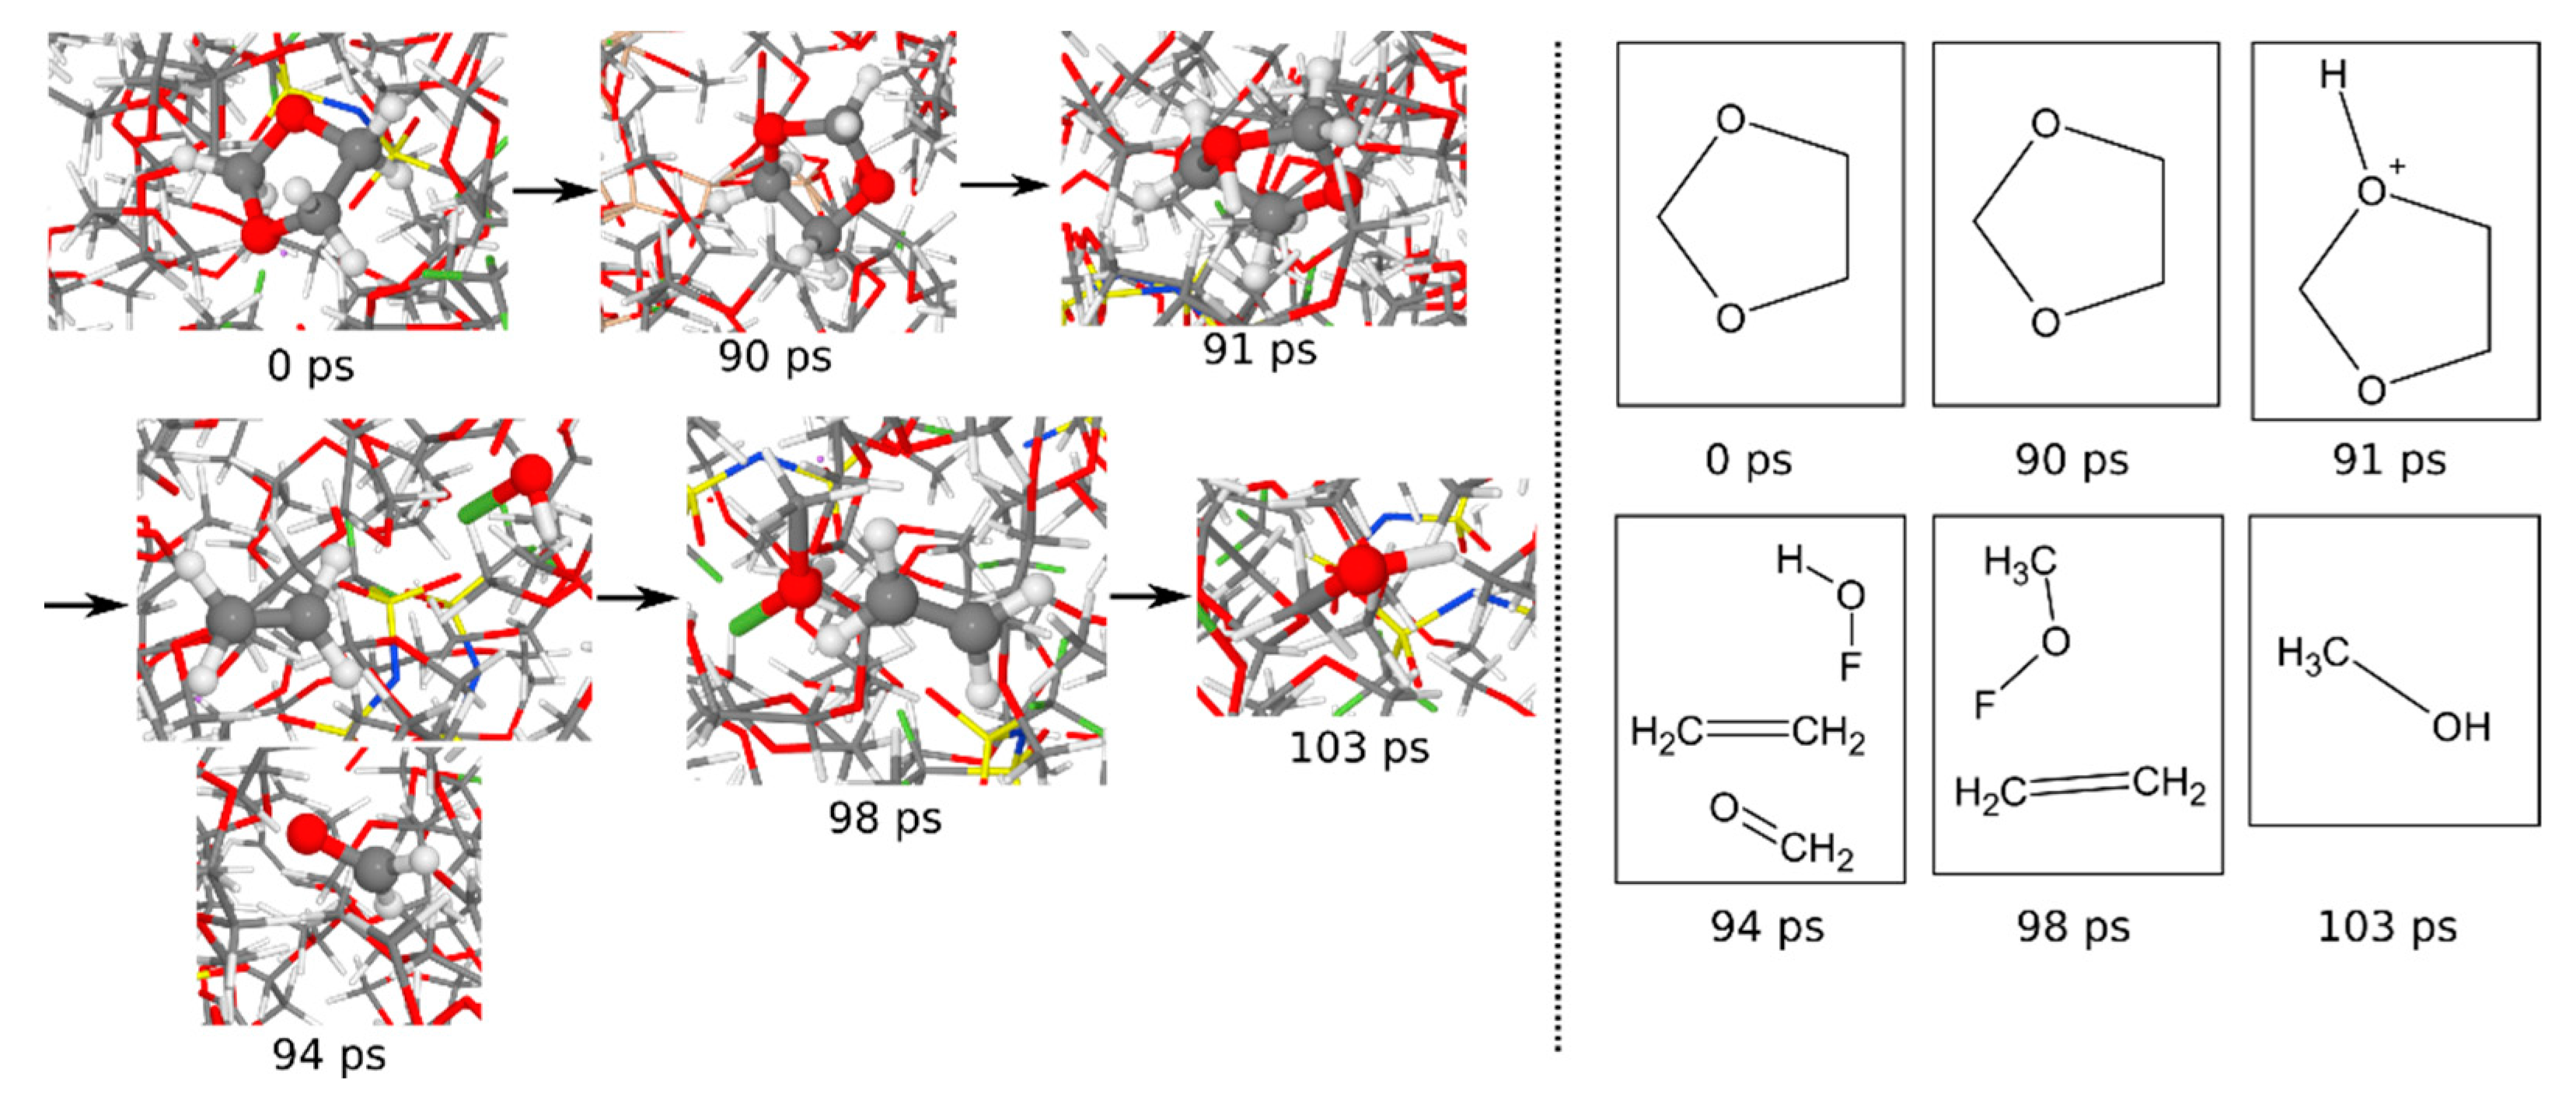
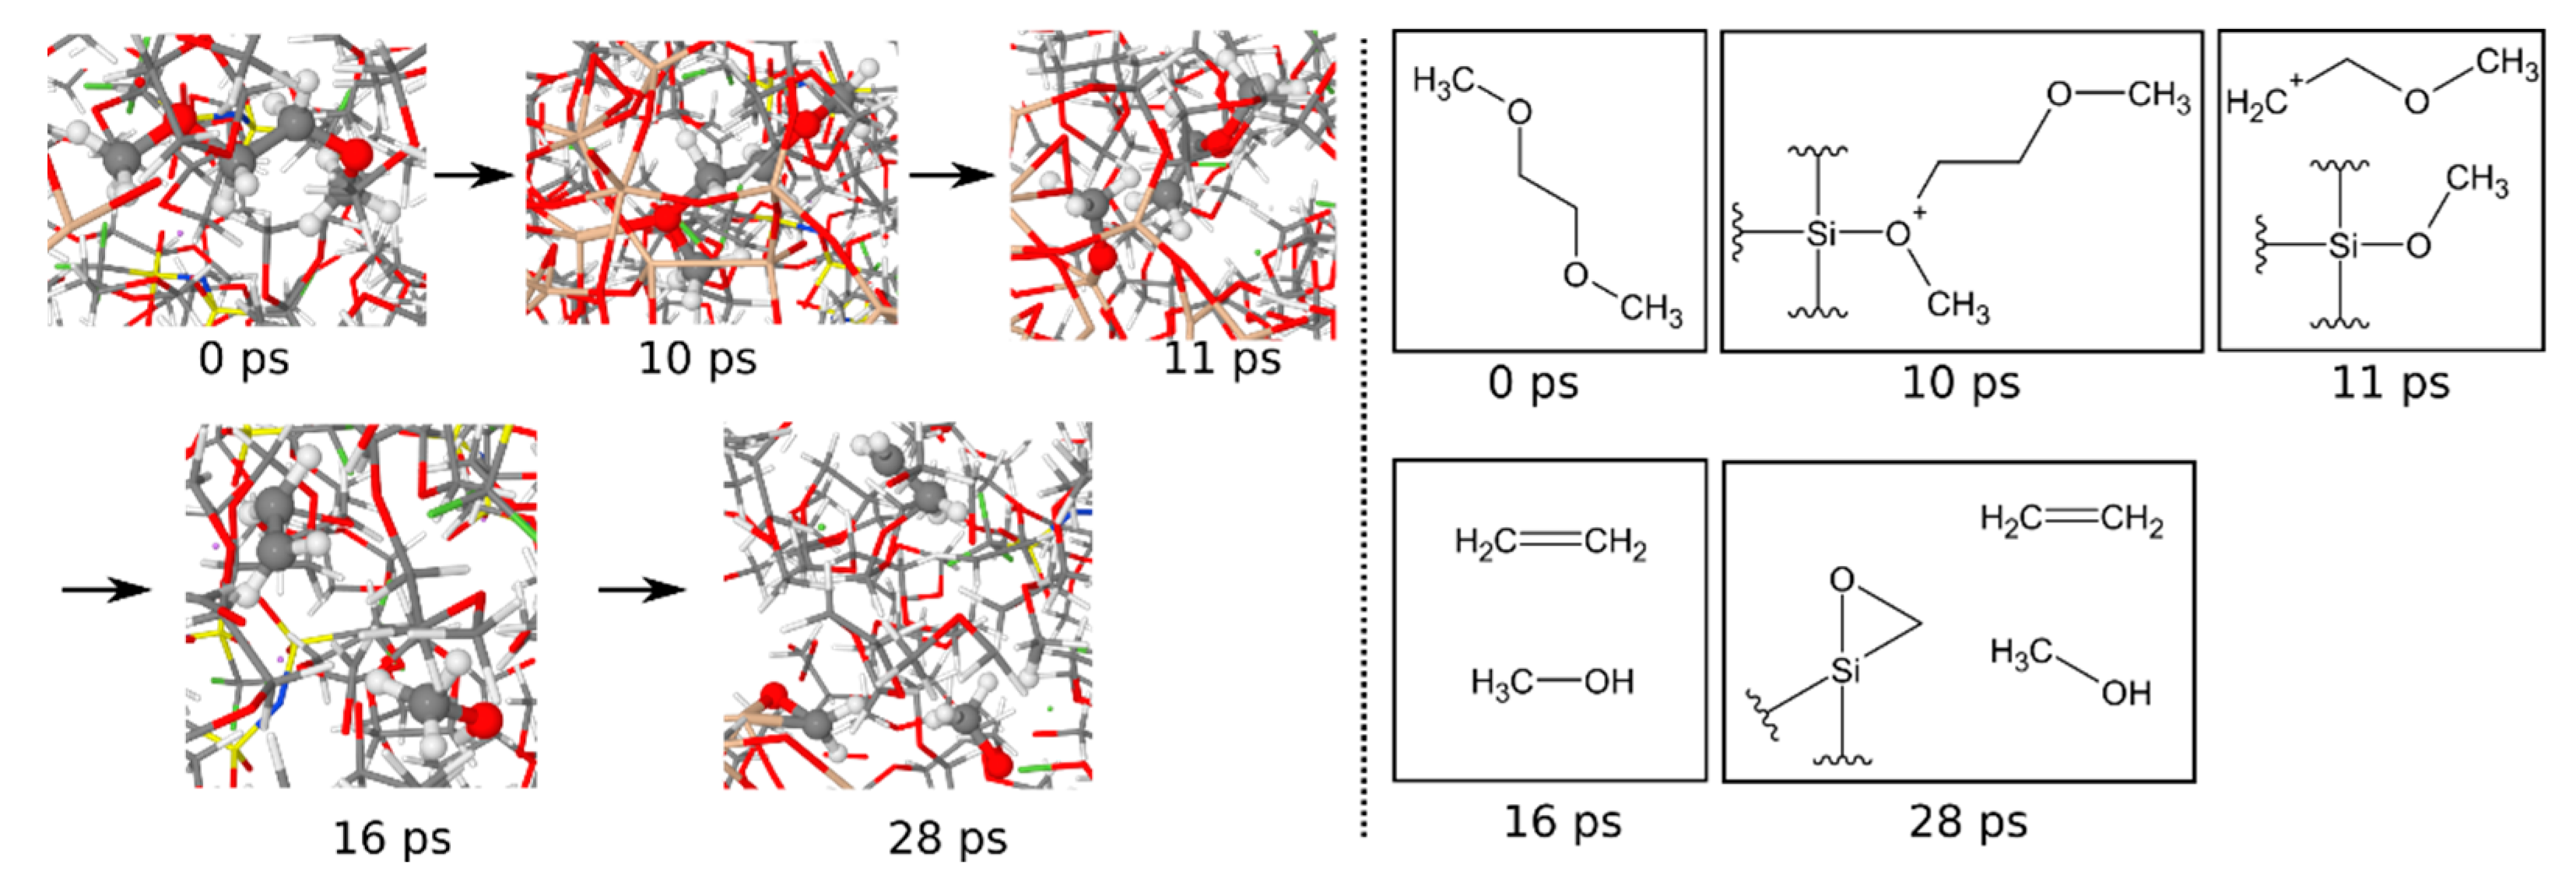
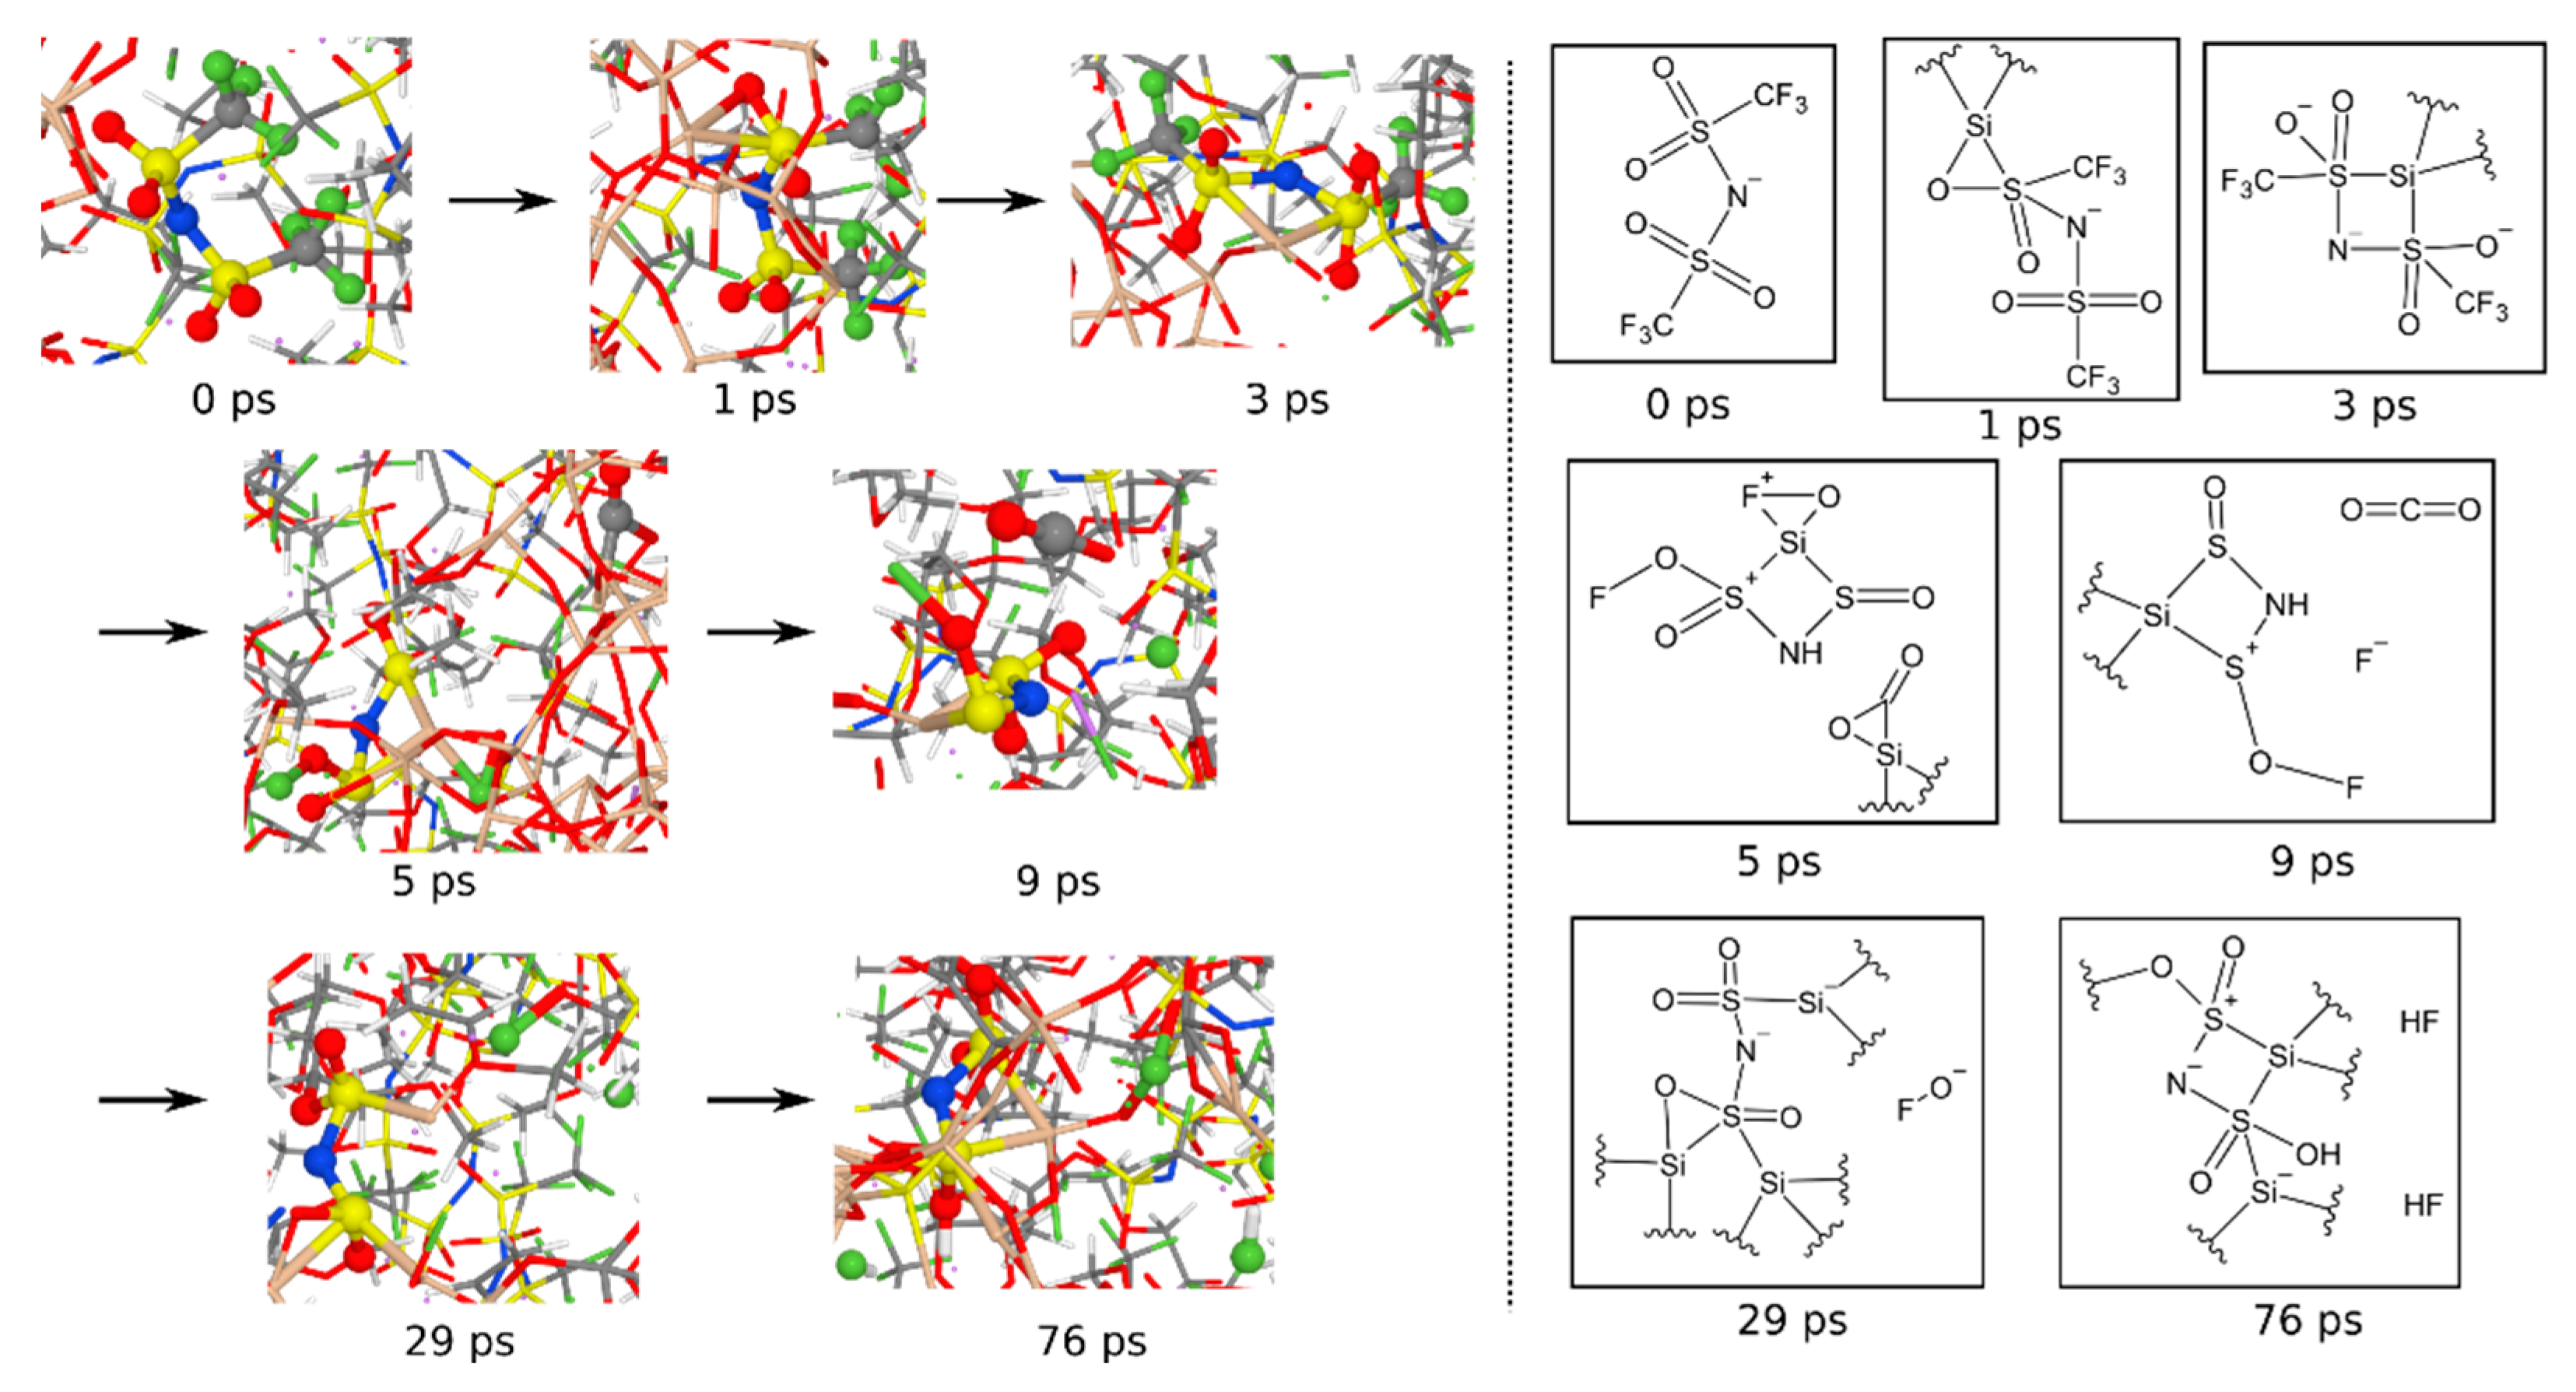
3.1.6. Reaction Mechanisms

A better impression of the reaction mechanisms can be gained if trajectories are visually inspected. Since the systems contain more than 10,000 atoms, no systematic evaluation is possible in that way. Instead, the decomposition of the three electrolyte molecules, DOL, DME, and (Li)TFSI, was tracked for some examples. One example of a DOL molecule in the 0.7 M TFSI system is shown in Figure 13. Initially, the molecule is located some Å away from the electrolyte–anode interface. After 90 ps, it has reached the already growing SEI (beige Si atoms in the background). A proton ejected from some other SEI reaction attacks one of the ether bridges at 91 ps. The DOL molecule then decomposes into one ethylene: formaldehyde and a FOH molecule some ps later. The FOH merges with a methyl group at 98 ps and becomes a methanol molecule after the F atom has left. If this is compared with the molecule abundances in Figure 14, ethylene, methanol, and formaldehyde are indeed the most common small molecules, indicating that the mechanism shown could be an important one.
The example mechanism for a DME molecule is given in Figure 14. The molecule is located near the interface at the beginning; after 10 ps, one ether oxygen is attacked by a silicon atom, probably with a dangling bond. Shortly after, the bridge is broken, a methanol substituent is bonded to the silicon network, and a methoxyethane radical is built. A total of 4 ps later, this radical decomposes into an ethylene and a methanol molecule, where probably, an external proton is involved in breaking the ether bond since the products include one additional hydrogen. Again, all products belong to the most abundant molecules, making this mechanism likely to be the main one.
Finally, an example TFSI decomposition mechanism is shown in Figure 15. In the beginning, it is already placed in the immediate vicinity of the anode surface. Then, at 1 ps later, a silicon atom attacks one sulfur atom, and shortly after, it is bound to two sulfur atoms in a tetrahedral arrangement. Two ps later, both CF3 groups disaggregated. The central N(SO2)2 group essentially remains intact, successively absorbed deeper into the amorphous SiO2 network, noticeable by the larger and larger number of silicon atoms that are bound to the group from different sides. One carbon and one oxygen atom become part of a carbon dioxide molecule (visible at 9 ps). The fluorine atoms, on the other hand, form hydrogen fluoride or react with oxygen atoms from the surrounding (76 ps).

3.2. Experimental Verification

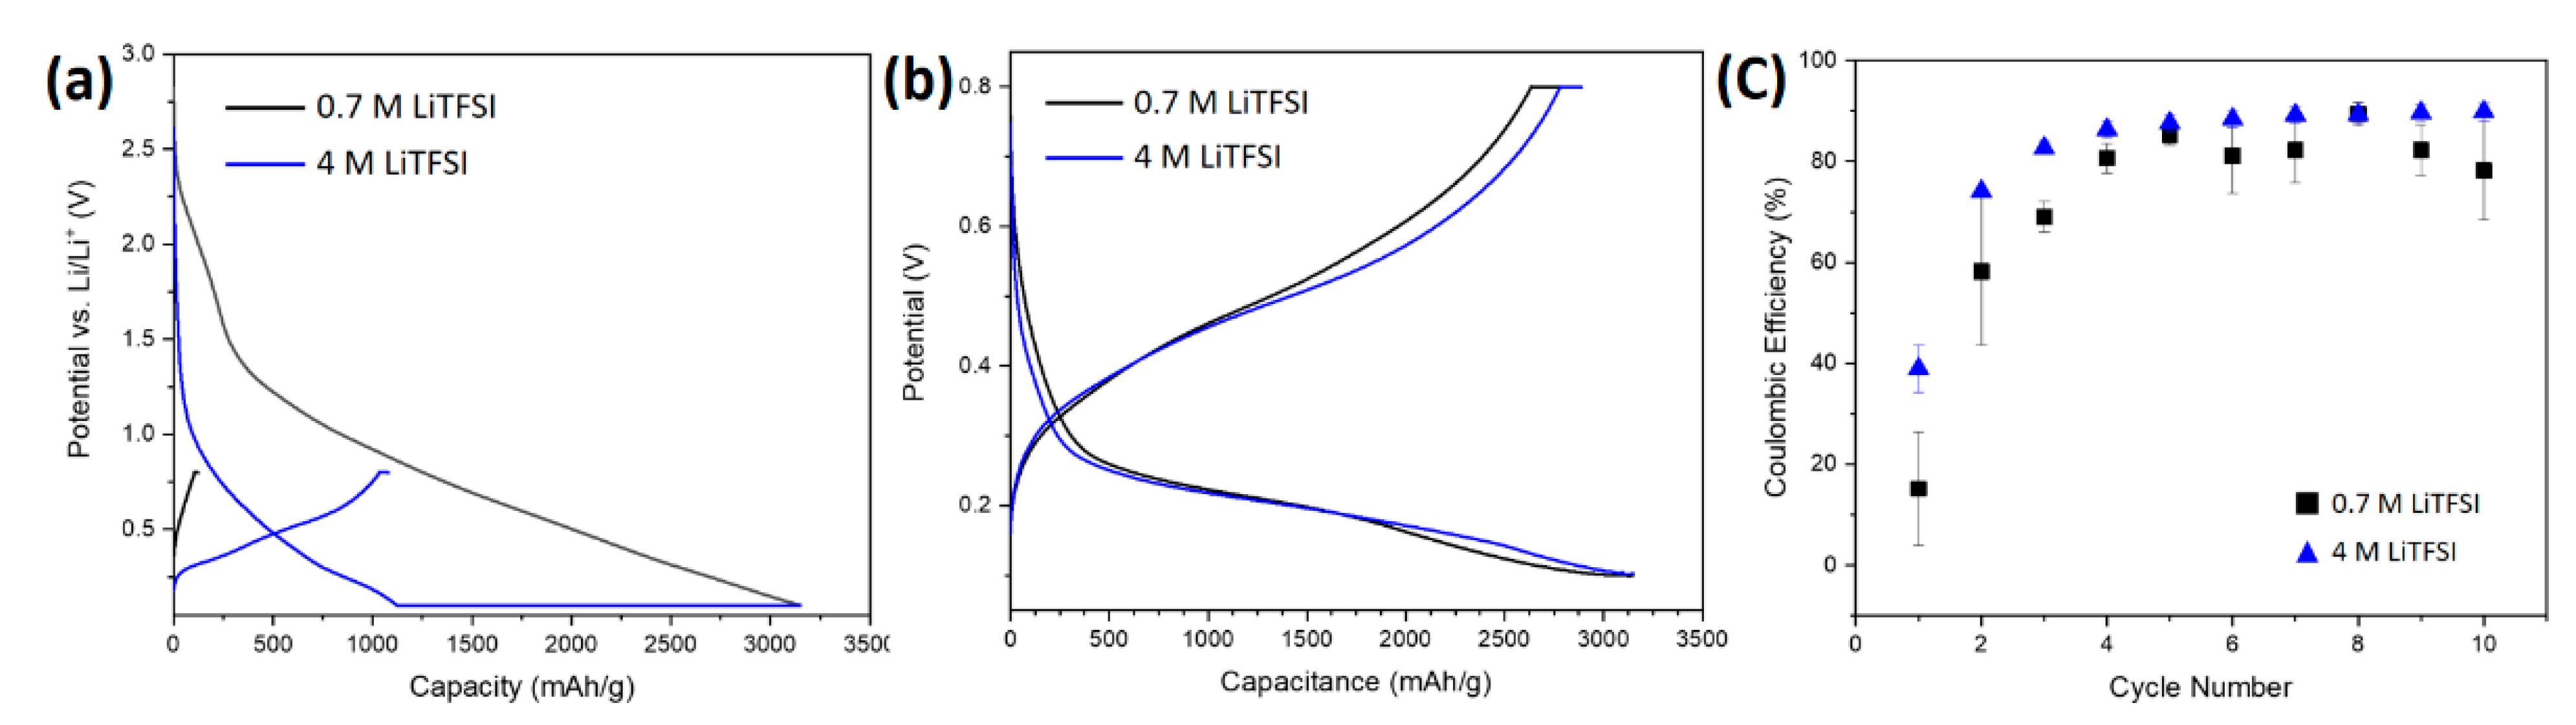
3.2.1. Electrochemical Characterization

In order to investigate the SEI formation on the silicon active material surface, pure porous silicon anodes were cycled in the presence of varying lithium salt concentrations. The anodes were cycled in half-cells with low current densities (0.1 C) against a Li-metal counter and reference electrode and subjected to galvanostatic charge/discharge tests. The results are shown below in Figure 16.
The initial formation cycle is shown in Figure 16a, where the samples are cycled with a CC-CV mode until a cut-off potential of 3150 mAh g−1. For the anode cycled in 0.7 M LiTFSI, there is a small plateau observed during charging around 2.0 V, and a second, much larger plateau beginning at 1.3 V was much higher than the potential for the lithiation of silicon (which normally begins at 0.8 V [4,74]). The first plateau around 2.0 V is caused by electrolyte components beginning to deposit on the surface of the anode [75] and likely corresponds to the peak observed for both electrolytes in the cyclic voltammetry measurements shown in the Supplemental Material (Figure S22). This plateau may also correspond to a reduction in trace H2O and other trace oxygen-containing impurities [76], although these would have a negligible contribution to the overall SEI composition. Below 1.5 V, the plateau is likely caused by electrolyte decomposition and SEI formation reactions. This plateau begins at lower voltages for the 4 M electrolyte (1.2 V), which is characteristic of highly concentrated electrolytes [77].
In the initial formation cycle (Figure 16a), the reversible capacity of the silicon electrode in 4 M LiTFSI is much higher (1226.4 mAh/g) than in the 0.7 M electrolyte (476.1 mAh/g). This is because irreversible electrolyte degradation, resulting in SEI formation, contributes to a more significant amount of the charge capacity measured for the 0.7 M electrode than the 4 M electrode in the first cycle. Therefore, there is less lithium present in this electrode for the delithiation process.
Though the discharge capacities after the formation cycles of the anodes cycled in both electrolytes are both relatively high after ten cycles, the electrolyte containing 4 M LiTFSI obtained the highest discharge capacity of 2830.2 mAh g−1Si (Figure 16b), compared to the discharge capacity of 2463.3 mAh g−1Si obtained by the 0.7 M electrolyte. In addition, in the first cycle, a higher coulombic efficiency was obtained with the 4 M electrolyte (38.9%) compared to the 0.7 M electrolytes (15.1%) (Figure 16c) (related to the higher reversible capacities observed in Figure 16a). Even after reaching a stable point, the coulombic efficiency for both electrodes was still below 100%, implying that there would still be irreversible losses for both electrodes during extended cycling. However, the coulombic efficiency for the electrode in the 4 M electrolyte (~90%) is higher than for the electrode in the 0.7 M electrolyte (~82%). This means that lower irreversible losses and more stable cycling can be expected for this electrolyte.

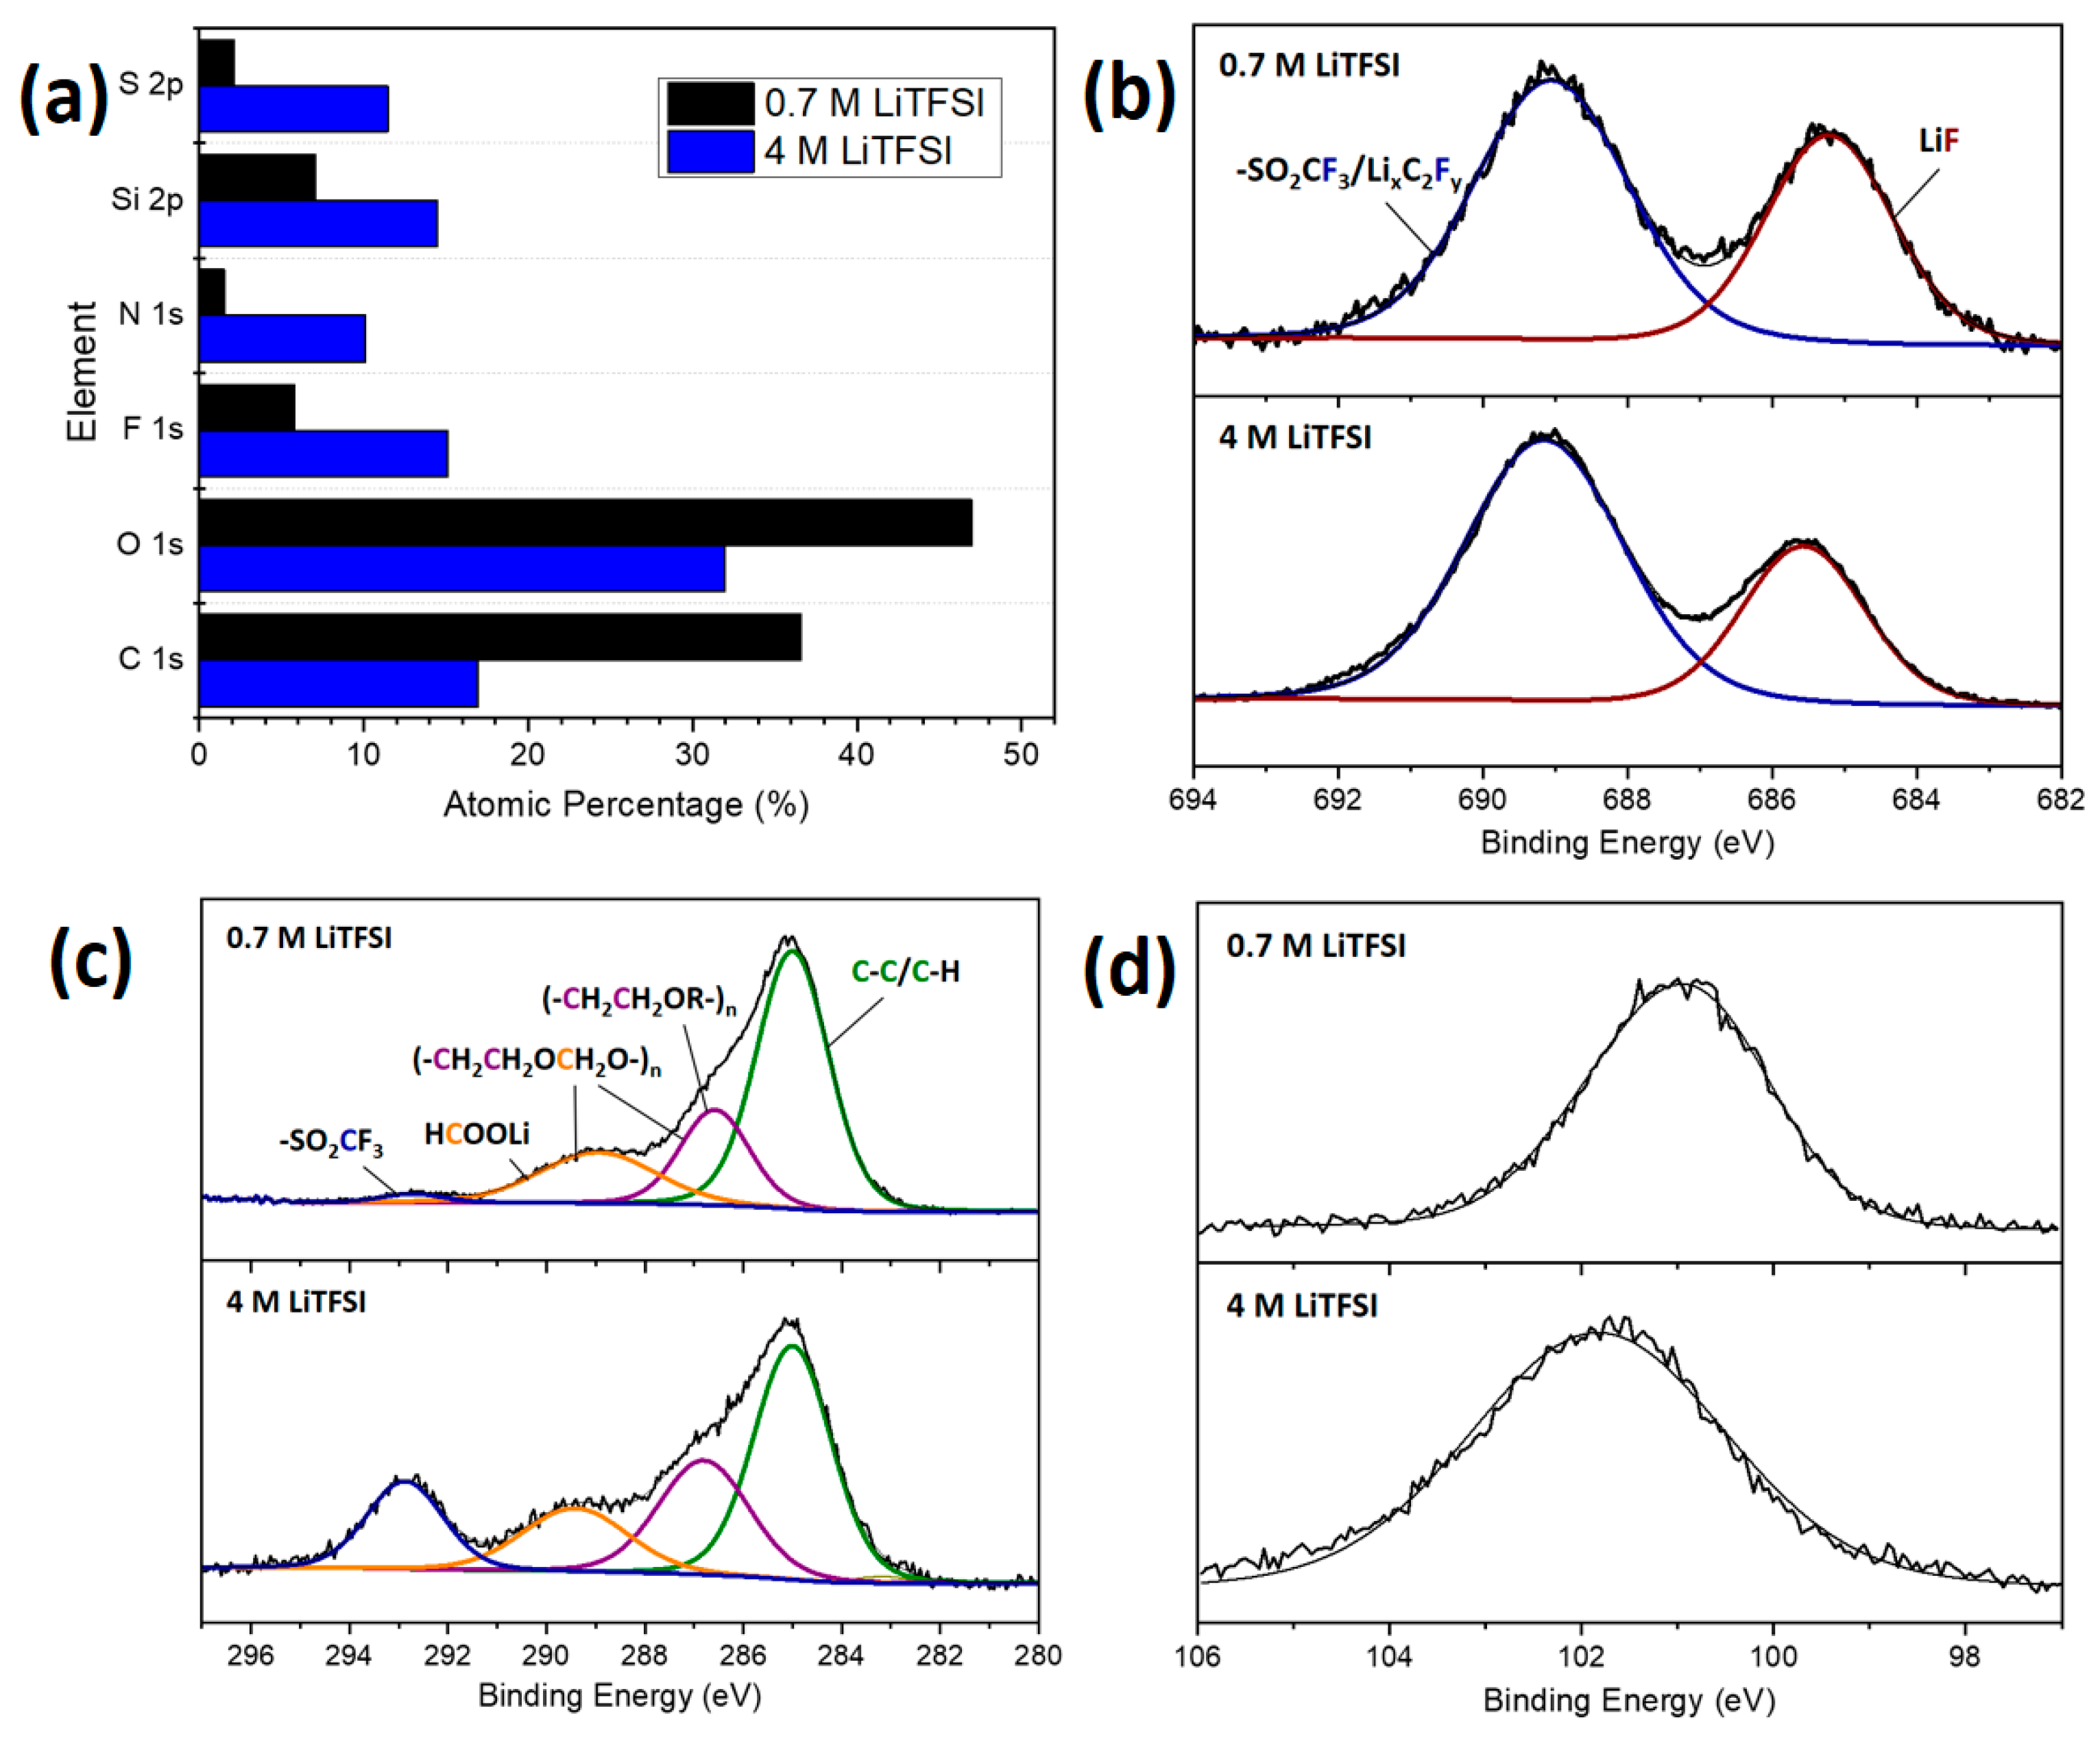
3.2.2. Post-Mortem Investigation

In order to further investigate the chemical composition of the SEI layer, porous silicon anodes, which cycled in the electrolytes with both LiTFSI concentrations (4 M and 0.7 M), were investigated ex-situ with X-ray photoelectron spectroscopy after one cycle. The results are shown below in Figure 17.
The element percentages, calculated from the resolved XPS spectra, are shown in Figure 17a. From this, it is clear that the anode cycled with 4 M LiTFSI possesses much higher percentages of fluorine, sulfur, and nitrogen, all elements unique to the salt anion, and lower percentages of carbon and oxygen. What is particularly interesting is the higher silicon percentage. As the XPS has an attenuation depth of around 10 nm, this seems to indicate that the insoluble SEI for the 4 M sample is thinner than that of the 0.7 M sample. This apparent contradiction to the ReaxFF results is addressed in the following section. The resolved C 1s spectra (Figure 17c) show carbon species originating from the decomposition of the solvent molecules in the binding energy range of 285–290 eV [78,79,80]. The peak at 293 eV, originating from the –CF3 group of the TFSI anion, is seen to increase in intensity for the silicon anode cycled in the 4 M LiTFSI electrolyte. This indicates the presence of more species in the SEI originating from the TFSI anion. This is confirmed with the F 1s spectra (Figure 17b). The broad amorphous peak appearing in the Si 2p resolved spectra (Figure 17d) appears at higher binding energies for the silicon anode cycled with 4 M LiTFSI (101.8 eV compared to 100.6 eV). There may be more lithium silicates, such as LixSiOy, or organosilicates, in the SEI of the silicon anode cycled with 0.7 M LiTFSI [79], while more inorganic species are formed with 4 M LiTFSI. This, combined with the high Si atomic percentage, would indicate that more silicon species are incorporated into the SEI for the 4 M electrolyte than for the 0.7 M electrolyte. Details of the relative peak percentages of different species observed in the resolved XPS spectra are shown in Table S2 and the elemental percentages are shown in Table S3 in the Supplementary Material.

4. Discussion

During typical SEI formation processes, the products of salt anion reduction reactions tend to be inorganic compounds (e.g., LiF or Li2O), while the reduction in solvent molecules results in the formation of insoluble SEI components (e.g., Li2CO3) or partially soluble semi-carbonates and polymers [81]. The SEI structure tends to have inorganic, insoluble components accumulating at the electrode surface, with the components becoming more polymeric towards the electrolyte [82]. This expected SEI structure was seen both in the ReaxFF simulations, as well as the post-mortem XPS investigations. What is interesting is how the SEI structure differs for high LiTFSI salt concentrations, as this directly influences the cycling performance of the silicon anodes.
From the galvanostatic cycling results, it was seen that the formation was completed much faster for the 4 M LiTFSI electrolyte since the reversible capacities are much higher (Figure 16a) and a stable coulombic efficiency is reached sooner than for the 0.7 M electrolyte (Figure 16c). In the ReaxFF simulations, Li penetration into the anode was enhanced at higher concentrations, and the SiOx interface appeared blurred. For low salt concentrations, the SiOx interface remained clearly visible for much longer (Figure 5), suggesting slower SEI formation and lower surface interactions, corresponding to the results observed from the experimental cycling. The broad interface and high penetration of electrolyte atoms into the anode material observed from the ReaxFF simulations in Figure 5 and Figure 6 support the theory that more silicon species are incorporated into the SEI for 4 M LiTFSI (Figure 17). At high salt concentrations, the O–Si bonds are more abundant and increase over time during their formation (Figure 7). In both the ReaxFF simulations and the XPS results, F plays a significant role in the reactions for the 4 M electrolyte, and the species in the SEI are observed to be more inorganic, with a higher number of smaller molecules throughout the SEI (Figure 11). As the organic C species observed in the resolved XPS significantly decreased for the 4 M electrolyte (Figure 17), it could be concluded that there is also a lower polymerization or other reactions associated with a reduction in the solvent molecules.
In the highly concentrated electrolyte, the SEI appears to grow into the anode surface (Figure 8), coinciding with the observation that more silicon species are incorporated into the SEI. From the cycling results, the passivation of the porous silicon anode occurs more quickly with high Li-salt concentrations than with lower concentrations. This is evident from the fact that the CE for the 4 M electrolyte was higher than the 0.7 M electrolyte in the initial cycle (38.9% and 15.1%, respectively) since SEI formation reactions contribute more to the initial charge capacity for the 0.7 M electrolyte. For both electrolytes, the native oxide on the surface is directly involved in SEI formation reactions (shown by the consumption of Si–Si bonds in Figure 7). Additionally, the SEI for both electrolytes appears to be constructed from inorganic decomposition products directly at the surface of the anode, where the first layer mainly involves SiOx species and organic decomposition products at the electrolyte side. A similar SEI construction was observed in previous studies [83,84]. After formation for the 4 M electrolyte, the organic decomposition products at the electrolyte side were minimal, corresponding to the highly inorganic SEI observed with XPS. In the ReaxFF simulations, the SEI was thinner in the case of 0.7 M TFSI, in contrast to the XPS data, which suggests that the 4 M SEI is thinner. This is probably due to the fact that the time scale of the ReaxFF simulations (1.4 ns) is still too short for a complete simulation of the converging growth process. In addition to this, comparatively slow transport processes might, e.g., move gaseous species away from the SEI, which still constitutes a significant part of the SEI in the 4 M model. Nevertheless, the ReaxFF simulations were able to reproduce many of the trends with respect to the elemental composition of the interface.
The SEI formation mechanism is likely also linked to the different solvation structures in the low and highly-concentrated electrolytes. The solvation structure of the electrolyte is made up of solvent-separated ion pairs (SSIPs), contact ion pairs (CIPs), and aggregates (AGG), and the latter dominate at high salt concentrations. In the literature, CIPs (when ions are in contact with each other) have been shown to be preferentially reduced prior to SSIPs (where ions are separated by solvent molecules) [85]. As seen in the work by Yamada et al. [86], with higher salt concentrations, there is a change in the lowest unoccupied molecular orbital (LUMO) of the electrolyte from the solvent molecule (for low salt concentrations) to the TFSI anion. More CIPs were observed in the 4 M electrolyte, which can be observed with Raman spectroscopy (see Figures S23 and S24 in the Supplementary Material). Since the CIPs are preferentially reduced at the anode surface, the early passivation occurring in the first cycles for the 4 M electrolyte is due to this reduction in the CIPs on the surface. Since more CIPs are present at high concentrations, this reduction can occur more quickly, and the passivation of the surface is reached earlier.

5. Conclusions

The ReaxFF simulations were successfully completed, and, combined with the results from the experimental verification, it can be concluded that penetration of lithium into the silicon surface occurs more easily for highly concentrated electrolytes. At high LiTFSI concentrations, more SiOx species are incorporated into the SEI, and more TFSI anions take part in SEI formation reactions, allowing for more efficient SEI formation, as well as a more inorganic SEI layer. This leads to higher coulombic efficiencies being reached in the initial formation cycle (38.9%, compared to 15.1% for the 0.7 M electrolyte) and higher discharge capacities after formation (2830.2 mAh g−1Si and 2463.3 mAh g−1Si for 4 M and 0.7 M LiTFSI, respectively). From these results, high LiTFSI salt concentrations appear to enhance the performance of silicon anodes; however, further investigations are still required to determine the implications for long-term cycling and for full-cell applications with sulfur cathodes.
This ReaxFF approach was shown to correspond well with the experimental results and offers the possibility of gaining a deeper understanding of SEI formation mechanisms and predicting the performance of silicon anodes with different electrolyte chemistries without undergoing time-consuming experimental testing. Arbitrary spatial and temporal resolutions can be gained during the simulations, allowing for the characterization of different sublayers in the SEI in the vicinity of the anode or the electrolyte. Further, molecular reaction products can be identified and classified automatically, elucidating the complex chemical mechanisms during the formation. The general setup of the ReaxFF optimization, as well as its application during reactive molecular dynamics, together with the evaluations conducted by utility scripts developed with the focus on reactive interfaces, facilitate future simulations of SEI formations in different LIBs, with only moderate translation efforts required.

Supplementary Materials

The following supporting information can be downloaded at: https://www.mdpi.com/article/10.3390/liquids3010011/s1.

Author Contributions

Conceptualization, H.C.; methodology, H.C. and J.S.; software, J.S.; validation, J.S. and H.C.; formal analysis, J.S. and H.C.; investigation, J.S., H.C. and N.G.; resources, R.A. and B.H.; data curation, J.S. and H.C.; writing—original draft preparation, J.S. and H.C.; writing—review and editing, S.H., B.H. and R.A.; supervision, S.H., B.H. and R.A.; funding acquisition, S.H., B.H. and R.A. All authors have read and agreed to the published version of the manuscript.

Funding

This work was performed within the framework of the German project “Entwicklung und Charakterisierung von großflächigen, porösen Si-Film Anoden für Lithium-Schwefel Silizium-Energiespeichern” (PorSSi, 03XP0126 B) and partially funded by the “Federal Ministry of Education and Research” (BMBF).

Data Availability Statement

Not applicable.

Acknowledgments

Acknowledgements go to Redwanul Islam for assistance with X-ray photoelectron spectroscopy measurements.

Conflicts of Interest

The authors declare no conflict of interest.

References

  1. Krause, A.; Dörfler, S.; Piwko, M.; Wisser, F.M.; Jaumann, T.; Ahrens, E.; Giebeler, L.; Althues, H.; Schädlich, S.; Grothe, J.; et al. High Area Capacity Lithium-Sulfur Full-Cell Battery with Prelithiatied Silicon Nanowire-Carbon Anodes for Long Cycling Stability. Sci. Rep. 2016, 6, 27982. [Google Scholar] [CrossRef]
  2. Ye, R.; Bell, J.; Patino, D.; Ahmed, K.; Ozkan, M.; Ozkan, C.S. Advanced Sulfur-Silicon Full Cell Architecture for Lithium Ion Batteries. Sci. Rep. 2017, 7, 17264. [Google Scholar] [CrossRef]
  3. Shen, C.; Ge, M.; Zhang, A.; Fang, X.; Liu, Y.; Rong, J.; Zhou, C. Silicon(lithiated)-Sulfur Full Cells with Porous Silicon Anode Shielded by Nafion Against Polysulfides to Achieve High Capacity and Energy Density. Nano Energy 2016, 19, 68–77. [Google Scholar] [CrossRef]
  4. Gao, J.; Lowe, M.A.; Kiya, Y.; Abruña, H.D. Effects of Liquid Electrolytes on the Charge/Discharge Performance of Rechargeable Lithium/Sulfur Batteries: Electrochemical and in-Situ X-ray Absorption Spectroscopic Studies. J. Phys. Chem. C 2011, 115, 25132–25137. [Google Scholar] [CrossRef]
  5. Watanabe, M.; Thomas, M.L.; Zhang, S.; Ueno, K.; Yasuda, T.; Dokko, K. Application of Ionic Liquids to Energy Storage and Conversion Materials and Devices. Chem. Rev. 2017, 117, 7190–7239. [Google Scholar] [CrossRef] [PubMed]
  6. Yamada, Y.; Furukawa, K.; Sodeyama, K.; Kikuchi, K.; Yaegashi, M.; Tateyama, Y.; Yamada, A. Unusual Stability of Acetonitrile-Based Superconcentrated Electrolytes for Fast-Charging Lithium-Ion Batteries. J. Am. Chem. Soc. 2014, 136, 5039–5046. [Google Scholar] [CrossRef] [PubMed]
  7. Yamada, Y.; Yamada, A. Review—Superconcentrated Electrolytes for Lithium Batteries. J. Electrochem. Soc. 2015, 162, A2406–A2423. [Google Scholar] [CrossRef]
  8. Kim, K.; Ma, H.; Park, S.; Choi, N.S. Electrolyte-Additive-Driven Interfacial Engineering for High-Capacity Electrodes in Lithium-Ion Batteries: Promises and Challenges. ACS Energy Lett. 2020, 5, 1537–1553. [Google Scholar] [CrossRef]
  9. Zhang, Y.; Du, N.; Yang, D. Designing superior solid electrolyte interfaces on silicon anodes for high-performance lithium-ion batteries. Nanoscale 2019, 11, 19086–19104. [Google Scholar] [CrossRef]
  10. Jung, S.C.; Choi, J.W.; Han, Y.K. Anisotropic Volume Expansion of Crystalline Silicon during Electrochemical Lithium Insertion: An Atomic Level Rationale. Nano Lett. 2012, 12, 5342–5347. [Google Scholar] [CrossRef]
  11. Dai, F.; Yi, R.; Yang, H.; Zhao, Y.; Luo, L.; Gordin, M.L.; Sohn, H.; Chen, S.; Wang, C.; Zhang, S.; et al. Minimized Volume Expansion in Hierarchical Porous Silicon upon Lithiation. ACS Appl. Mater. Interfaces 2019, 11, 13257–13263. [Google Scholar] [CrossRef] [PubMed]
  12. Schmidt, H.; Jerliu, B.; Hüger, E.; Stahn, J. Volume expansion of amorphous silicon electrodes during potentiostatic lithiation of Li-ion batteries. Electrochem. Commun. 2020, 115, 106738. [Google Scholar] [CrossRef]
  13. Ge, M.; Cao, C.; Biesold, G.M.; Sewell, C.D.; Hao, S.M.; Huang, J.; Zhang, W.; Lai, Y.; Lin, Z. Recent Advances in Silicon-Based Electrodes: From Fundamental Research toward Practical Applications. Adv. Mater. 2021, 33, 2004577. [Google Scholar] [CrossRef] [PubMed]
  14. Feng, K.; Li, M.; Liu, W.; Kashkooli, A.G.; Xiao, X.; Cai, M.; Chen, Z. Silicon-Based Anodes for Lithium-Ion Batteries: From Fundamentals to Practical Applications. Small 2018, 14, 1702737. [Google Scholar] [CrossRef]
  15. Tokranov, A.; Kumar, R.; Li, C.; Minne, S.; Xiao, X.; Sheldon, B.W. Control and Optimization of the Electrochemical and Mechanical Properties of the Solid Electrolyte Interphase on Silicon Electrodes in Lithium Ion Batteries. Adv. Energy Mater. 2016, 6, 1502302. [Google Scholar] [CrossRef]
  16. Park, J.W.; Ueno, K.; Tachikawa, N.; Dokko, K.; Watanabe, M. Ionic liquid electrolytes for lithium-sulfur batteries. J. Phys. Chem. C 2013, 117, 20531–20541. [Google Scholar] [CrossRef]
  17. Dokko, K.; Tachikawa, N.; Yamauchi, K.; Tsuchiya, M.; Yamazaki, A.; Takashima, E.; Park, J.W.; Ueno, K.; Seki, S.; Serizawa, N.; et al. Solvate Ionic Liquid Electrolyte for Li-S Batteries. J. Electrochem. Soc. 2013, 160, A1304–A1310. [Google Scholar] [CrossRef]
  18. Zeng, Z.; Murugesan, V.; Han, K.S.; Jiang, X.; Cao, Y.; Xiao, L.; Ai, X.; Yang, H.; Zhang, J.G.; Sushko, M.L.; et al. Non-Flammable Electrolytes with High Salt-to-Solvent Ratios for Li-ion and Li-metal Batteries. Nat. Energy 2018, 3, 674–681. [Google Scholar] [CrossRef]
  19. Suo, L.; Hu, Y.S.; Li, H.; Armand, M.; Chen, L. A New Class of Solvent-in-Salt Electrolyte for High-Energy Rechargeable Metallic Lithium Batteries. Nat. Commun. 2013, 4, 1481. [Google Scholar] [CrossRef]
  20. Wang, M.; Huai, L.; Hu, G.; Yang, S.; Ren, F.; Wang, S.; Zhang, Z.; Chen, Z.; Peng, Z.; Shen, C.; et al. Effect of LiFSI Concentrations to Form Thickness- and Modulus-Controlled SEI Layers on Lithium Metal Anodes. J. Phys. Chem. C 2018, 122, 9825–9834. [Google Scholar] [CrossRef]
  21. Becke, A.D. Density-functional thermochemistry. III. The role of exact exchange. J. Chem. Phys. 1993, 98, 5648–5652. [Google Scholar] [CrossRef]
  22. Stephens, P.J.; Devlin, F.J.; Chabalowski, C.F.; Frisch, M.J. Ab Initio Calculation of Vibrational Absorption and Circular Dichroism Spectra Using Density Functional Force Fields. J. Phys. Chem. 1994, 98, 11623–11627. [Google Scholar] [CrossRef]
  23. Adamo, C.; Barone, V. Toward reliable density functional methods without adjustable parameters: The PBE0 model. J. Chem. Phys. 1999, 110, 6158. [Google Scholar] [CrossRef]
  24. Ganesh, P.; Kent, P.R.C.; Jiang, D. Solid–Electrolyte Interphase Formation and Electrolyte Reduction at Li-Ion Battery Graphite Anodes: Insights from First-Principles Molecular Dynamics. J. Phys. Chem. C 2012, 116, 24476–24481. [Google Scholar] [CrossRef]
  25. Martinez de la Hoz, J.M.; Leung, K.; Balbuena, P.B. Reduction Mechanisms of Ethylene Carbonate on Si Anodes of Lithium-Ion Batteries: Effects of Degree of Lithiation and Nature of Exposed Surface. ACS Appl. Mater. Interfaces 2013, 5, 13457–13465. [Google Scholar] [CrossRef]
  26. Soto, F.A.; Martinez de la Hoz, J.M.; Seminario, J.M.; Balbuena, P.B. Modeling solid electrolyte interfacial phenomena in silicon anodes. Curr. Opin. Chem. Eng. 2016, 13, 179–185. [Google Scholar] [CrossRef]
  27. Damm, W.; Frontera, A.; Tirado-Rives, J.; Jorgensen, W.J. OPLS all-atom force field for carbohydrates. J. Comput. Chem. 1997, 18, 1955–1970. [Google Scholar] [CrossRef]
  28. Doherty, B.; Zhong, X.; Gathiaka, S.; Li, B.; Acevedo, O. Revisiting OPLS Force Field Parameters for Ionic Liquid Simulations. J. Chem. Theory Comput. 2017, 13, 6131–6145. [Google Scholar] [CrossRef]
  29. Van Duin, A.C.T.; Dasgupta, S.; Lorant, F.; Goddard, W.A., III. ReaxFF: A Reactive Force Field for Hydrocarbons. J. Phys. Chem. A 2001, 105, 9396–9409. [Google Scholar] [CrossRef]
  30. Han, Y.; Joang, D.; Zhang, J.; Li, W.; Gan, Z.; Gu, J. Development, applications and challenges of ReaxFF reactive force field in molecular simulations. Front. Chem. Sci. Eng. 2016, 10, 16–38. [Google Scholar] [CrossRef]
  31. Senftle, T.P.; Hong, S.; Islam, M.M.; Kylasa, S.B.; Zheng, Y.; Shin, Y.K.; Junkermeier, C.; Engel-Herbert, R.; Janik, M.J.; Aktulga, H.M.; et al. The ReaxFF reactive force-field: Development, applications and future directions. NPJ Comp. Mater. 2016, 2, 15011. [Google Scholar] [CrossRef]
  32. Bai, C.; Liu, L.; Sun, H. Molecular Dynamics Simulations of Methanol to Olefin Reactions in HZSM-5 Zeolite Using a ReaxFF Force Field. J. Phys. Chem. C 2012, 116, 7029–7039. [Google Scholar] [CrossRef]
  33. Fogarty, J.C.; Aktulga, H.M.; Grama, A.Y.; van Duin, A.C.T. A reactive molecular dynamics simulation of the silica-water interface. J. Chem. Phys. 2010, 132, 174704. [Google Scholar] [CrossRef] [PubMed]
  34. Kulkarni, A.D.; Truhlar, D.G.; Srinivasan, S.G.; van Duin, A.C.T.; Norman, P.; Schwarzentruber, T.E. Oxygen Interactions with Silica Surfaces: Coupled Cluster and Density Functional Investigation and the Development of a New ReaxFF Potential. J. Phys. Chem. C 2013, 117, 258–269. [Google Scholar] [CrossRef]
  35. Soria, F.A.; Zhang, W.; Paredes-Olivera, P.A.; van Duin, A.C.T.; Patrito, E.M. Si/C/H ReaxFF Reactive Potential for Silicon Surfaces Grafted with Organic Molecules. J. Phys. Chem. C 2018, 122, 23515–23527. [Google Scholar] [CrossRef]
  36. Yue, D.C.; Ma, T.B.; Hu, Y.Z.; Yeon, J.; van Duin, A.C.T.; Wang, H.; Luo, J. Tribochemistry of Phosphoric Acid Sheared between Quartz Surfaces: A Reactive Molecular Dynamics Study. J. Phys. Chem. C 2013, 117, 25604–25614. [Google Scholar] [CrossRef]
  37. Shi, Z.; Zhou, J.; Li, R. Application of Reaction Force Field Molecular Dynamics in Lithium Batteries. Front. Chem. 2021, 8, 15011. [Google Scholar] [CrossRef]
  38. Han, S.S.; van Duin, A.C.T.; Goddard, W.A., III; Lee, H.M. Optimization and Application of Lithium Parameters for the Reactive Force Field, ReaxFF. J. Phys. Chem. A 2005, 109, 4575–4582. [Google Scholar] [CrossRef]
  39. Raju, M.; Ganesh, P.; Kent, P.C.R.; van Duin, A.C.T. Reactive Force Field Study of Li/C Systems for Electrical Energy Storage. J. Chem. Theory Comput. 2015, 11, 2156–2166. [Google Scholar] [CrossRef]
  40. Cui, J.; Zheng, F.; Wu, S.; Zhu, Z.Z. ReaxFF Molecular Dynamics Simulations on Silicon Suboxide as Anode Material for Lithium-Ion Batteries. J. Electrochem. Soc. 2020, 167, 020547. [Google Scholar] [CrossRef]
  41. Ostadhossein, A.; Kim, S.Y.; Cubuk, E.D.; Qi, Y.; van Duin, A.C.T. Atomic Insight into the Lithium Storage and Diffusion Mechanism of SiO2/Al2O3 Electrodes of Lithium Ion Batteries: ReaxFF Reactive Force Field Modeling. J. Phys. Chem. A 2016, 120, 2114–2127. [Google Scholar] [CrossRef] [PubMed]
  42. Kim, S.P.; van Duin, A.C.T.; Shenoy, V.B. Effect of electrolytes on the structure and evolution of the solid electrolyte interphase (SEI) in Li-ion batteries: A molecular dynamics study. J. Power Sources 2011, 196, 8590–8597. [Google Scholar] [CrossRef]
  43. Gissinger, J.R.; Jensen, B.D.; Wise, K.E. REACTER: A Heuristic Method for Reactive Molecular Dynamics. Macromolecules 2020, 53, 9953–9961. [Google Scholar] [CrossRef]
  44. Alzate-Vargas, L.; Blau, S.M.; Spotte-Smith, E.W.C.; Allu, S.; Persson, K.A.; Fattebert, J.-L. Insight into SEI Growth in Li-Ion Batteries using Molecular Dynamics and Accelerated Chemical Reactions. J. Phys. Chem. C 2021, 125, 18588–18596. [Google Scholar] [CrossRef]
  45. Nöhren, S.; Quiroga-Gonzalez, E.; Carstensen, J.; Föll, H. Electrochemical Fabrication and Characterization of Silicon Microwire Anodes for Li Ion Batteries. J. Electrochem. Soc. 2015, 163, A373. [Google Scholar] [CrossRef]
  46. Hansen, S.; Shree, S.; Neubüser, G.; Carstensen, J.; Kienle, L.; Adelung, R. Corset-like solid electrolyte interface for fast charging of silicon wire anodes. J. Power Sources 2018, 381, 8–17. [Google Scholar] [CrossRef]
  47. Hansen, S.; Quiroga-Gonzalez, E.; Carstensen, J.; Föll, H. Size-dependent cyclic voltammetry study of silicon microwire anodes for lithium ion batteries. Electrochim. Acta 2016, 217, 283–291. [Google Scholar] [CrossRef]
  48. Sakabe, J.; Ohta, N.; Ohnishi, T.; Mitsuishi, K.; Takada, K. Porous amorphous silicon film anodes for high-capacity and stable all-solid-state lithium batteries. Commun. Chem. 2018, 1, 24. [Google Scholar] [CrossRef]
  49. Cangaz, S.; Hippauf, F.; Reuter, R.S.; Doerfler, S.; Abendroth, T.; Althues, H.; Kaskel, S. Enabling High-Energy Solid-State Batteries with Stable Anode Interphase by the Use of Columnar Silicon Anodes. Adv. Energy Mater. 2020, 10, 2001320. [Google Scholar] [CrossRef]
  50. Younesi, R.; Veith, G.M.; Johansson, P.; Edström, K.; Vegge, T. Lithium salts for advanced lithium batteries: Li–metal, Li–O2, and Li–S. Energy Environ. Sci. 2015, 8, 1905–1922. [Google Scholar] [CrossRef] [Green Version]
  51. Aurbach, D.; Zaban, A.; Gofer, Y.; Ely, Y.E.; Weissman, I.; Chusid, O.; Abramson, O. Recent studies of the lithium-liquid electrolyte interface Electrochemical, morphological and spectral studies of a few important systems. J. Power Sources 1995, 54, 76–84. [Google Scholar] [CrossRef]
  52. Menne, S.; Pires, J.; Anouti, M.; Balducci, A. Protic ionic liquids as electrolytes for lithium-ion batteries. Electrochem. Comm. 2013, 31, 39–41. [Google Scholar] [CrossRef]
  53. Chenoweth, K.; van Duin, A.C.T.; Goddard, W.A. ReaxFF Reactive Force Field for Molecular Dynamics Simulations of Hydrocarbon Oxidation. J. Phys. Chem. A 2008, 112, 1040–1053. [Google Scholar] [CrossRef] [PubMed]
  54. Mortier, W.J.; Ghosh, S.K.; Shankar, S. Electronegativity-equalization method for the calculation of atomic charges in molecules. J. Am. Chem. Soc. 1986, 108, 4315–4320. [Google Scholar] [CrossRef]
  55. Hartke, B. Global Optimization. WIREs Comput. Mol. Sci. 2011, 1, 879–887. [Google Scholar] [CrossRef]
  56. Dittner, M.; Müller, J.; Aktulga, H.M.; Hartke, B. Efficient Global Optimization of Reactive Force Field Parameters. J. Comput. Chem. 2015, 36, 1550–1561. [Google Scholar] [CrossRef] [PubMed]
  57. Weise, T. Global Optimization Algorithms—Theory and Application. Available online: http://www.it-weise.de/projects/book.pdf (accessed on 7 September 2022).
  58. Hartke, B. Non-deterministic global structure optimization: An introductory tutorial. In Reviews in Computational Chemistry; Parrill, A., Lipkowitz, K., Eds.; Wiley e-Books: Hoboken, NJ, USA, 2022; Volume 32. [Google Scholar]
  59. Liu, Y.; Yu, P.; Wu, Y.; Yang, H.; Xie, M.; Huai, L.; Giddard, W.A.; Cheng, T. The DFT-ReaxFF Hybrid Reactive Dynamics Method with Application to the Reductive Decomposition Reaction of the TFSI and DOL Electrolyte at a Lithium−Metal Anode Surface. J. Phys. Chem. Lett. 2021, 12, 1300–1306. [Google Scholar] [CrossRef]
  60. Yun, K.S.; Pai, S.J.; Yeo, B.C.; Lee, K.R.; Kim, S.J.; Han, S.S. Simulation Protocol for Prediction of a Solid-Electrolyte Interphase on the Silicon-based Anodes of a Lithium-Ion Battery: ReaxFF Reactive Force Field. J. Phys. Chem. Lett. 2017, 8, 2812–2818. [Google Scholar] [CrossRef]
  61. Wang, Y.; Shi, Y.; Sun, Q.; Lu, K.; Kubo, M.; Xu, J. Development of a Transferable ReaxFF Parameter Set for Carbon- and Silicon-Based Solid Systems. J. Phys. Chem. C 2020, 124, 10007–10015. [Google Scholar] [CrossRef]
  62. McLean, A.D.; Chandler, G.S. Contracted Gaussian-basis sets for molecular calculations. 1. 2nd row atoms, Z = 11–18. J. Chem. Phys. 1980, 72, 5639–5648. [Google Scholar] [CrossRef]
  63. Raghavachari, K.; Binkley, J.S.; Seeger, R.; Pople, J.A. Self-Consistent Molecular Orbital Methods. 20. Basis set for correlated wave-functions. J. Chem. Phys. 1980, 72, 650–654. [Google Scholar]
  64. Dieterich, J.M.; Hartke, B. OGOLEM: Global cluster structure optimisation for arbitrary mixtures of flexible molecules. A multiscaling, object-oriented approach. Mol. Phys. 2010, 108, 279–291. [Google Scholar] [CrossRef]
  65. OGOLEM.ORG: Framework for GA-Based Global Optimization. Available online: https://www.ogolem.org (accessed on 10 November 2022).
  66. Plimpton, S. Fast Parallel Algorithms for Short-Range Molecular Dynamics. J. Comp. Phys. 1995, 117, 1–19. [Google Scholar] [CrossRef]
  67. Thompson, A.P.; Aktulga, H.M.; Berger, R.; Bolintineanu, D.S.; Brown, W.M.; Crozier, P.S.; in’t Veld, P.J.; Kohlmeyer, A.; Moore, S.G.; Nguyen, T.D.; et al. LAMMPS—A flexible simulation tool for particle-based materials modeling at the atomic, meso, and continuum scales. Comp. Phys. Comm. 2022, 271, 108171. [Google Scholar] [CrossRef]
  68. LAMMPS. Available online: https://www.lammps.org (accessed on 8 September 2022).
  69. Aktulga, H.M.; Fogarty, J.C.; Pandit, S.A.; Grama, A.Y. Parallel reactive molecular dynamics: Numerical methods and algorithmic techniques. Parallel Comput. 2012, 38, 245–259. [Google Scholar] [CrossRef]
  70. Nose, S. A unified formulation of the constant temperature molecular dynamics methods. J. Chem. Phys. 1984, 81, 511. [Google Scholar] [CrossRef]
  71. O’Boyle, N.M.; Banck, M.; James, C.A.; Morley, C.; Vandermeersch, T.; Hutchinson, G.R. Open Babel: An open chemical toolbox. J. Chemoinform. 2011, 3, 33. [Google Scholar] [CrossRef]
  72. Weininger, D. SMILES, a chemical language and information system. 1. Introduction to methodology and encoding rules. J. Chem. Inf. Comput. Sci. 1988, 28, 31–36. [Google Scholar] [CrossRef]
  73. Chen, X.; Hou, T.-Z.; Li, B.; Yan, C.; Zhu, L.; Guan, C.; Cheng, X.-B.; Peng, H.-J.; Huang, J.-Q.; Zhang, Q. Towards stable lithium-sulfur batteries: Mechanistic insights into electrolyte decomposition on lithium metal anode. Energy Storage Mater. 2017, 8, 194–201. [Google Scholar] [CrossRef]
  74. Gao, H.; Xiao, L.; Plümel, I.; Xu, G.L.; Yang, R.; Zuo, X.; Liu, Y.; Schulz, C.; Wiggers, H.; Amine, K.; et al. Parasitic Reactions in Nanosized Silicon Anodes for Lithium-Ion Batteries. Nano Lett. 2017, 17, 1512–1519. [Google Scholar] [CrossRef]
  75. Arreaga-Salas, D.E.; Sra, A.K.; Roodenko, K.; Chabal, Y.J.; Hinkle, C.L. Progression of Solid Electrolyte Interphase Formation on Hydrogenated Amorphous Silicon Anodes for Lithium-Ion Batteries. J. Phys. Chem. C 2012, 116, 9072–9077. [Google Scholar] [CrossRef]
  76. Kitz, P.G.; Novak, P.; Berg, E.J. Influence of Water Contamination on the SEI Formation in Li-Ion Cells: An Operando EQCM-D Study. ACS Appl. Mater. Interfaces 2022, 12, 15934–15942. [Google Scholar] [CrossRef] [PubMed]
  77. Chang, Z.H.; Wang, J.T.; Wu, Z.H.; Gao, M.; Wu, S.J. The Electrochemical Performance of Silicon Nanoparticles in Concentrated Electrolyte. ChemSusChem 2018, 2, 1787–1796. [Google Scholar] [CrossRef]
  78. Etacheri, V.; Haik, O.; Goffer, Y.; Roberts, G.A.; Stefan, I.C.; Fasching, R.; Aurbach, D. Effect of Fluoroethylene Carbonate (FEC) on the Performance and Surface Chemistry of Si-Nanowire Li-Ion Battery Anodes. Langmuir 2012, 28, 965–976. [Google Scholar] [CrossRef] [PubMed]
  79. Jaumann, T.; Balach, J.; Klose, M.; Oswald, S.; Eckert, J.; Giebeler, L. Role of 1,3-Dioxolane and LiNO3 Addition on the Long Term Stability of Nanostructured Silicon/Carbon Anodes for Rechargeable Lithium Batteries. J. Electrochem. Soc. 2016, 163, A557–A564. [Google Scholar] [CrossRef]
  80. Aurbach, D.; Pollak, E.; Elazari, R.; Salitra, G.; Kelley, C.S.; Afinito, J. On the Surface Chemical Aspects of Very High Energy Density, Rechargeable Li–Sulfur Batteries. J. Electrochem. Soc. 2009, 156, A694–A702. [Google Scholar] [CrossRef]
  81. Peled, E.; Menkin, S. Review—SEI: Past, Present and Future. J. Electrochem. Soc. 2017, 164, A1703. [Google Scholar] [CrossRef]
  82. Verma, P.; Maire, P.; Novak, P. A review of the features and analyses of the solid electrolyte interphase in Li-ion batteries. Electrochim. Acta 2010, 55, 6332–6341. [Google Scholar] [CrossRef]
  83. Ravikumar, B.; Mynam, M.; Rai, B. Effect of Salt Concentration on Properties of Lithium Ion Battery Electrolytes: A Molecular Dynamics Study. J. Phys. Chem. C 2018, 122, 8173–8181. [Google Scholar] [CrossRef]
  84. Cao, C.; Abate, I.I.; Sivonxay, E.; Shyam, B.; Jia, C.; Moritz, B.; Devereaux, T.P.; Persson, K.A.; Steinrück, H.G.; Toney, M.F. Solid Electrolyte Interphase on Native Oxide-Terminated Silicon Anodes for Li-Ion Batteries. Joule 2019, 3, 762–781. [Google Scholar] [CrossRef]
  85. Yoon, T.; Chapman, N.; Seo, D.M.; Lucht, B.L. Lithium Salt Effects on Silicon Electrode Performance and Solid Electrolyte Interphase (SEI) Structure, Role of Solution Structure on SEI Formation. J. Electrochem. Soc. 2017, 164, A2082–A2088. [Google Scholar] [CrossRef] [Green Version]
  86. Nilsson, V.; Younesi, R.; Brandell, D.; Edström, K.; Johansson, P. Critical evaluation of the stability of highly concentrated LiTFSI—Acetonitrile electrolytes vs. graphite, lithium metal and LiFePO4 electrodes. J. Power Sources 2018, 384, 334–341. [Google Scholar] [CrossRef]
Figure 1. Result of the ReaxFF parameter optimization with OGOLEM. Shown is the error sum (Equation (3)) for the EA iterations, where the right figure is zoomed into the first 50 iterations.
Liquids 03 00011 g001
Figure 2. Result of the OGOLEM ReaxFF parameter optimization for the geometry part of the training set. Shown are the deviations between the ReaxFF and DFT reference for all included coordinates, bond lengths (a), angles (b) and dihedral angles (c), where the ReaxFF values originate from geometry-optimized structures with the optimized force field (Supplementary Material, Figure S1).
Liquids 03 00011 g002
Figure 3. Selected results of the OGOLEM ReaxFF parameter optimization for energy scans (kJ mol−1) in the training set, for the Si–S bond (a) and the S–Si–H (b) and F–Si–C (c) angles.
Liquids 03 00011 g003
Figure 4. Screenshots of the model battery systems with 0.7 and 4 M LiTFSI concentrations within the electrolyte. In addition, the z-coordinate axis used for the subsequent evaluations is introduced.
Liquids 03 00011 g004
Figure 5. z-Coordinate and time-dependent element distributions for O (a), F (b), and Li (c) obtained from the ReaxFF MD trajectories at a 0.7 M LiTFSI and for O (d) F (e) and Li (f) at 4 M TFSI concentrations.
Liquids 03 00011 g005aLiquids 03 00011 g005b
Figure 6. Element concentrations along the z-axis at the first and last timesteps of both simulated electrode–electrolyte interface systems for 0.7 M LiTFSI at 0 ns (a) and 1.4 ns (b) and 4 M LiTFSI at 0 ns (c) and 1.4 ns (d).
Liquids 03 00011 g006aLiquids 03 00011 g006b
Figure 7. Plot of time-dependent bond-abundancies during ReaxFF dynamics. All appearing bond types are shown in the left, whereas in the right it is zoomed to those which are less abundant. Plots are shown for 0.7 M LiTFSI (a) and 0.7 M LiTFSI, magnified (b), as well as 4 M LiTFSI (c) and 4 M LiTFSI magnified (d).
Liquids 03 00011 g007
Figure 8. Space- and time-resolved densities of selected bond species during the ReaxFF dynamics of both simulated battery systems. Displayed are results for O–Si (a), C–Si (b) and S–Si (c) with 0.7 M LiTFSI and O–Si (d), C–Si (e) and S–Si (f) with 4 M LiTFSI.
Liquids 03 00011 g008
Figure 9. Bond spatial densities along the z-axis for the last time step of both simulated systems, zoomed into the SEI buildup regions for 0.7 M LiTFSI (a) and 4 M LiTFSI (b).
Liquids 03 00011 g009
Figure 10. The 12 most abundant molecules during the reactive dynamics of both systems: 0.7 M LiTFSI (a) and 4 M LiTFSI (b). Noted in brackets are their respective numbers in the last trajectory frame.
Liquids 03 00011 g010
Figure 11. Time-dependent abundancies of different molecules during the dynamics of both systems. The ordering of the molecules is the same as in Figure 10: species 1–6 at 0.7 M (a), species 7–12 at 0.7 M (b), species 1–6 at 4 M (c), species 7–12 at 4 M (d).
Liquids 03 00011 g011
Figure 12. Space-resolved concentrations of the most abundant eight molecule species averaged over the first and last fifth of the overall dynamics. Shown are the results for 0.7 M LiTFSI for 0–280 ps (a) and 1120–1400 ps (b) as well as for 4 M LiTFSI for 0–280 ps (c) and 1120–1400 ps (d).
Liquids 03 00011 g012aLiquids 03 00011 g012b
Figure 13. Decomposition mechanism of an exemplary chosen DOL molecule in the 0.7 M system. Shown are trajectory screenshots as well as the effective Lewis structures of the visible parts.
Liquids 03 00011 g013
Figure 14. Decomposition of an exemplary chosen DME molecule. Shown are trajectory screenshots as well as the effective Lewis structures of the visible parts.
Liquids 03 00011 g014
Figure 15. Decomposition mechanism of an exemplary chosen LiTFSI molecule. Shown are trajectory screenshots as well as the effective Lewis structures of the visible parts. Short-lived intermediates or transition states might correspond to unusual Lewis structure patterns.
Liquids 03 00011 g015
Figure 16. Displays select charge/discharge curves resulting from the galvanostatic measurements for the porous silicon anode cycled in the electrolytes with salt concentrations of: 0.7 M (black) and 4 M LiTFSI (blue) in DOL:DME (2:1, v/v), with a rate of 0.1C for the first formation cycle (a), the tenth cycle (b), and the corresponding calculated coulombic efficiencies against cycle number (c).
Liquids 03 00011 g016
Figure 17. Displays of the element percentages determined from the resolved XPS spectra (a), and the resolved F 1s (b), C 1s (c), and Si 2p. (d) XPS spectra for the porous silicon anode samples cycled in 0.7 M LiTFSI and 4 M LiTFSI solutions for one cycle with a rate of C/10.
Liquids 03 00011 g017
Table 1. Added coordinates in the new ReaxFF parametrization.
S–SiSi–Si–SSi–S–SiH–Si–SSi–S–HSi–S–S
Si–S–OSi–O–SS–Si–FSi–S–NC–N–SC–Si–F
F–S–FSi–N–SF–N–NF–N–SF–S–SF–N–F
F–C–NS–Si–NF–O–FO–O–F
Disclaimer/Publisher’s Note: The statements, opinions and data contained in all publications are solely those of the individual author(s) and contributor(s) and not of MDPI and/or the editor(s). MDPI and/or the editor(s) disclaim responsibility for any injury to people or property resulting from any ideas, methods, instructions or products referred to in the content.

