Article

Antioxidant Potential Profile of Portuguese Wheat (Bread and Durum) Germplasm

1
Centre for the Research and Technology of Agro-Environmental and Biological Sciences (CITAB), University of Trás-os-Montes and Alto Douro (UTAD), Quinta de Prados, 5000-801 Vila Real, Portugal
2
International Maize and Wheat Improvement Center (CIMMYT), ICRAF House, UN Avenue, Nairobi P.O. Box 1041-00621, Kenya
3
Department of Molecular Biology, College of Biotechnology, CCS Haryana Agricultural University, Hisar 125004, Haryana, India
4
Department of Agronomy, University of Trás-os-Montes and Alto Douro (UTAD), Quinta de Prados, 5000-801 Vila Real, Portugal
5
Plant Cytogenomics Laboratory, Department of Genetics and Biotechnology, University of Trás-os-Montes and Alto Douro (UTAD), Quinta de Prados, 5000-801 Vila Real, Portugal
*
Author to whom correspondence should be addressed.
Crops 2023, 3(2), 124-135; https://doi.org/10.3390/crops3020012
Submission received: 19 January 2023 / Revised: 10 April 2023 / Accepted: 12 April 2023 / Published: 17 April 2023
(This article belongs to the Special Issue Phytochemicals of Crop Plants)

Abstract

:
Antioxidant properties of phenolic compounds are presumed responsible for several health benefits due to their capacity to scavenge free radicals and chelate metals prevenient oxidative stress. Since these compounds are ubiquitous in plants, including cereals, the available antioxidant potential profile of wheat genotypes could allow the development of new cultivars with an increased nutritional value that may result in antioxidant-rich foods. In this study, total phenolics content (TPC) was quantified in the whole grain flour of 92 wheat (46 genotypes each from bread and durum) genotypes, which were evaluated under field conditions during 2 different crop seasons (2004-05 and 2009-10). Of the ninety-two, fourteen (six and eight from bread and durum wheat, respectively) genotypes were comprehensively evaluated for antioxidant activity [2,2-diphenyl-1-picrylhydrazyl (DPPH), 2,2′-azino-bis (3-ethylbenzothiazoline-6-sulphonic acid) (ABTS) and reducing power] and ferulic acid contents. The results revealed that substantial genotypic variability exists for TPC in wheat genotypes with a mean value of 991 and 787 µg ferulic acid equivalents (FAE)/g DW in bread and durum wheat, respectively. Moreover, bound phenolics as a source of ferulic acid, including both cis- and trans-isomers, were observed as a major contributor to the total phenolics, which must be considered in assessing the antioxidant activity in wheat grain. In conclusion, these findings may also help improve wheat grains as natural sources of antioxidants utilizing selected genotypes in breeding programs.

1. Introduction

In biological systems, Reactive Oxygen Species (ROS) are thought to play a dual role. Low ROS levels can positively affect several physiological processes, such as pathogen avoidance, wound healing, and tissue repair. In contrast, high ROS levels lead to non-specific damage to proteins, lipids, and nucleic acids, resulting in autoimmunity conditions [1,2]. Some redox-active secondary metabolites, commonly known as antioxidants, can balance ROS synthesis and scavenging and are thus pivotal in an organism’s defense metabolism [3,4,5,6]. In animals, including humans, antioxidant production is limited. Therefore, they depend on exogenous antioxidants, mainly acquired in the form of vitamins (A, C, and E), minerals, and polyphenols through plant-derived food [6].
Cereals, principally wheat, rice, and maize, are major staples that provide approximately 50% of human food calories and are vital sources of essential nutrients (micro- and macro-nutrients) [7]. Beyond meeting nutrition needs, the beneficial influence of grains and grain-based cereal products on human health has been recently recognized because of providing non-nutrient phytochemicals such as phenolic compounds with antioxidant properties required for human health [8,9,10,11].
Generally, total phenolic content (TPC) in the Poaceae family is ranked in the following decreasing order: barley > wheat > oat > maize > rice [12]. In cereal grains, most phenolic compounds are localized in seed coats as free and bound components [13]. The bound phenolics represent about 80–95% of the total phenolics [14]. Free phenolics are represented mainly by flavonoids, whereas the bound compounds consist mainly of ferulic acid and its dimmers [15,16,17]. Ferulic acid is widely known for its therapeutic potential (anti-aging, anti-inflammatory, anti-allergic, and anti-carcinogenic). Its diverse role in several physiological and biological activities is continuously emerging, mainly due to its potent antioxidant capacity [5].
However, the quality of food products depends on several factors, including nutritional properties and stability [18]. In addition to genotypic variability for these compounds, the growing environments play an essential role in the antioxidant activities of soft wheat [19,20]. As flour fortification is expensive and may not reach those who need it most, exploiting wheat cultivars with high antioxidant components for pre-emptive wheat breeding is the most useful and affordable measure without significant additional inputs.
Yet, most previous phenolics studies in wheat have been limited to grain fractions and performed only in a few genotypes. Only a few studies involving many genotypes have been conducted [21,22]. Thus, the objectives of the present study were to assess variability for total phenolic contents (free and bound) in grains of Portuguese bread and durum wheat germplasm and to determine further the antioxidant activity and ferulic acid profiles, including both cis- and trans-isomers of selected genotypes of both bread and durum wheat.

2. Materials and Methods

2.1. Plant Material

A total of 92 wheat genotypes (46 genotypes each from bread and durum wheat) used in the present study were obtained from the plant germplasm unit, University of Trás-os-Montes and Alto Douro (UTAD), Vila Real, Portugal (Table S1). The seed sample of each genotype was collected from individual crop seasons (2004–2005 and 2009–2010), which were preserved in the UTAD germplasm bank at −18 °C and previously screened for carotenoid content [23]. The meteorological data corresponding to 2014-15 and 2009-10 are described in Figure 1 (https://en.tutiempo.net/climate, accessed on 16 January 2023).

2.2. Preparation of Plant Material

The seed samples were carefully cleaned and ground to a fine flour in an Ultra Centrifugal Mill ZM 200 (Retsch ZM 200, Haan, Germany). The flour of each genotype was sealed in well-identified individual bags and kept at −80 °C before use.

2.3. Chemicals and Reagents

Analytical grade Acetone, Methanol (MeOH), Ethanol (EtOH), Trifluoracetic acid (TFA), Folin–Ciocalteu’s reagent, 2,2-azino-bis(3-ethylbenzothiazoline)-6-sulfonic acid (ABTS), Trolox, ferulic acid, 4-hydroxy-3-methoxybenzoic acid (vanillic acid), p-hydroxybenzoic acid, chlorogenic acid, and catechin were bought from Sigma-Aldrich (St. Louis, MO, USA). In contrast, Formic acid (pro-analysis) and acetonitrile were HPLC-grade and purchased from Panreac (Barcelona, Spain). Deionized water (Milli-Q, Millipore, MA, USA) was used throughout the experiment.

2.4. Preparation of Wheat Flour Extracts

The total and low molecular weight phenolics were extracted from the de-fated wheat flour using a modified protocol described by Vasconcelos and Colleagues [24]. Briefly, to extract the fatty acids from dry flour, 10 mL of acetone was added to the subsamples of flour (3 × 0.5 g) in a 50 mL tube, followed by vortexing for 30 min, centrifugation (13,000× g for 5 min), and drying of the pellet. After the pellet was dried entirely, 5 mL of 70% MeOH was added and left at 70 °C for 30 min in 10 mL screw-top tubes. Samples were centrifuged for 10 min at 13,000 rpm. The supernatant of each sample, with the free phenolics, was collected and stored at −20 °C in dark conditions till use. The resulting residue sample pellet was re-used to extract the bound phenolics by adding 10 mL of 70% EtOH and leaving it for 1 h at room temperature (RT), followed by centrifugation for 5 min at 13,000 rpm. This step was repeated and followed by three series of adding 10 mL of 100% EtOH. Finally, the pellet was kept for 1 h at RT and centrifuged at 13,000 rpm for 5 min. At the end of this series, the supernatant was discarded, and the pellet was left to dry overnight. The dried pellet was eluted in 5 mL of 2M TFA dissolved in 50% MeOH and kept for 2 h at 80 °C. Samples were further centrifuged for 20 min at 4 °C using 13,000 rpm. The supernatant was transferred to a new well-identified flask with the extracted bound phenolics and kept at −20 °C before use.

2.5. Preparation of the Ferulic Acid Standard and Calibration Curve

The stock solution of ferulic acid (1 mg/mL) was prepared by dissolving 10 mg ferulic acid in a final volume of 10 mL MeOH. This stock solution was further used to prepare the calibration curve of 0–1000 µg/mL of ferulic acid. The curve was made by adding 80 µL of 7.5% sodium carbonate solution and 100 µL of Folin–Ciocalteu reagent diluted with double distilled water in the ratio 1:10 in each well plate of 96-well ELISA plates. The absorbance of all the solutions was measured at 750 nm. The calibration curve was plotted by considering the absorbance readings against their corresponding concentration by linear least square regression analysis.

2.6. Analysis of Free, Bound, and Total Phenolics Using the Folin–Ciocalteu Method

Free and bound phenolics extract samples were diluted to a final volume of 0.2 mL. In a 96-well ELISA plate, 100 µL of Folin–Ciocalteu’s reagent and 80 µL of a 7.5% saturated sodium carbonate (Na2CO3) solution were added to neutralize the extract [25,26]. Plates were kept in a heating block at 45 °C for 15 min and quantified in a microplate spectrophotometer (Multiskan™ FC Microplate Photometer, Vantaa, Finland) at 750 nm. The total phenolics content of a sample was calculated by summing the values of free and bound phenolics readings; for every three biological repetitions, two technical repeats were made. Finally, the results were expressed as micrograms of ferulic acid equivalent (FAE) per gram of the sample.

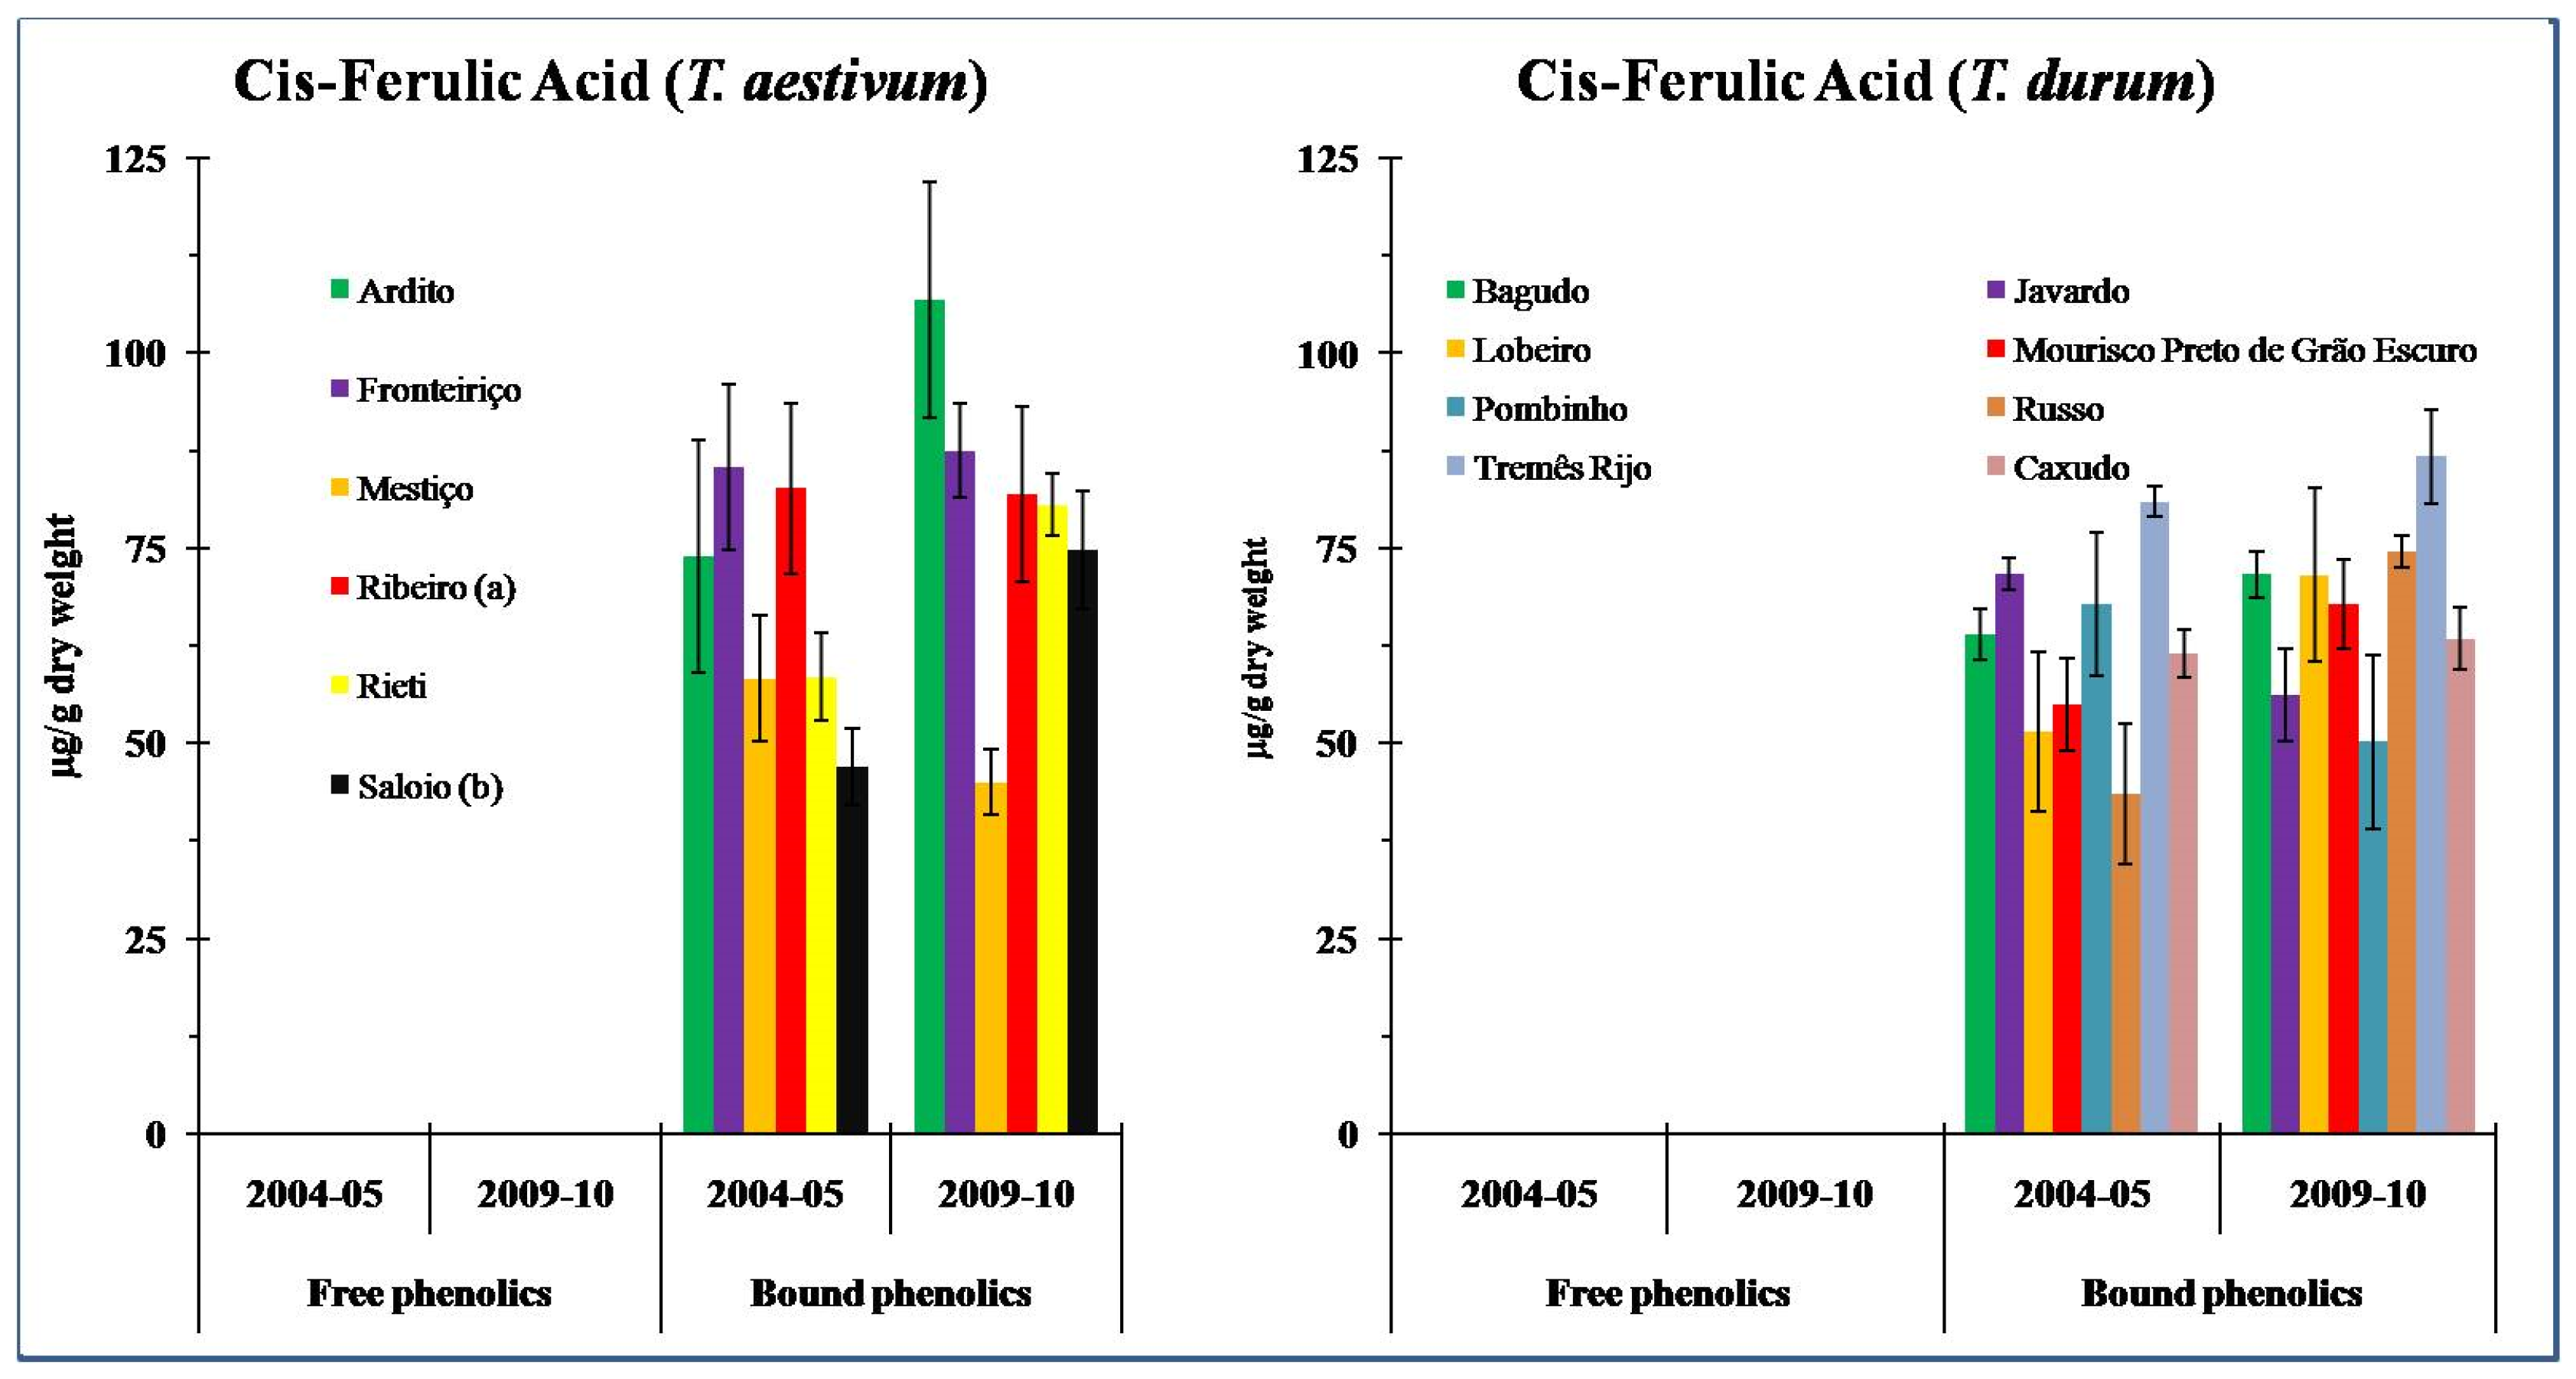
2.7. Determination of Ferulic Acid Content Using HPLC

Of the 92 wheat genotypes, 14 genotypes (6 and 8 from bread and durum wheat, respectively) were further selected for quantification of ferulic acid in free and bound phenolics by HPLC-DAD/UV-Vissystem (Gilson Inc., Middleton, WI, USA) using a C18 column (250 × 46 mm; 5 μm) (ACE, Advanced Chromatography Technologies, Aberdeen, UK). Phenolic acid separation was accomplished using a 60 min solvent gradient of water with 1% of TFA (solvent A) and acetonitrile with 0.1% TFA (solvent B) at a flow rate of 1 mL/min as follows: at 0–5 min 100% A, at 15 min 80% A, at 30 min 50% A, at 45–50 min 0% A, and at 55–60 min 100% A. The ferulic acid was identified by peak retention time, UV spectra, and UV max absorbance bands, along with a comparison with those found for external commercial standards (Sigma-Aldrich Chemie GmbH, Taufkirchen, Germany, and Extrasynthese, Lyon, France) at 320 nm. The ferulic acid concentration in sample extracts was extrapolated from the pure cis-ferulic acid and trans-ferulic acid standard curve. External standards were freshly prepared in 70% MeOH. Phytochemicals were identified using a response factor for each detected compound compared with pure standards.

2.8. Determination of Total Antioxidant Activity

The radical-scavenging activity was determined by the 2,2-diphenyl-1-picrylhydrazyl (DPPH) and 2,2-azino-bis (3-ethylbenzothiazoline)-6 sulfonic acid (ABTS) radical cation decolorization assay [27,28,29,30].

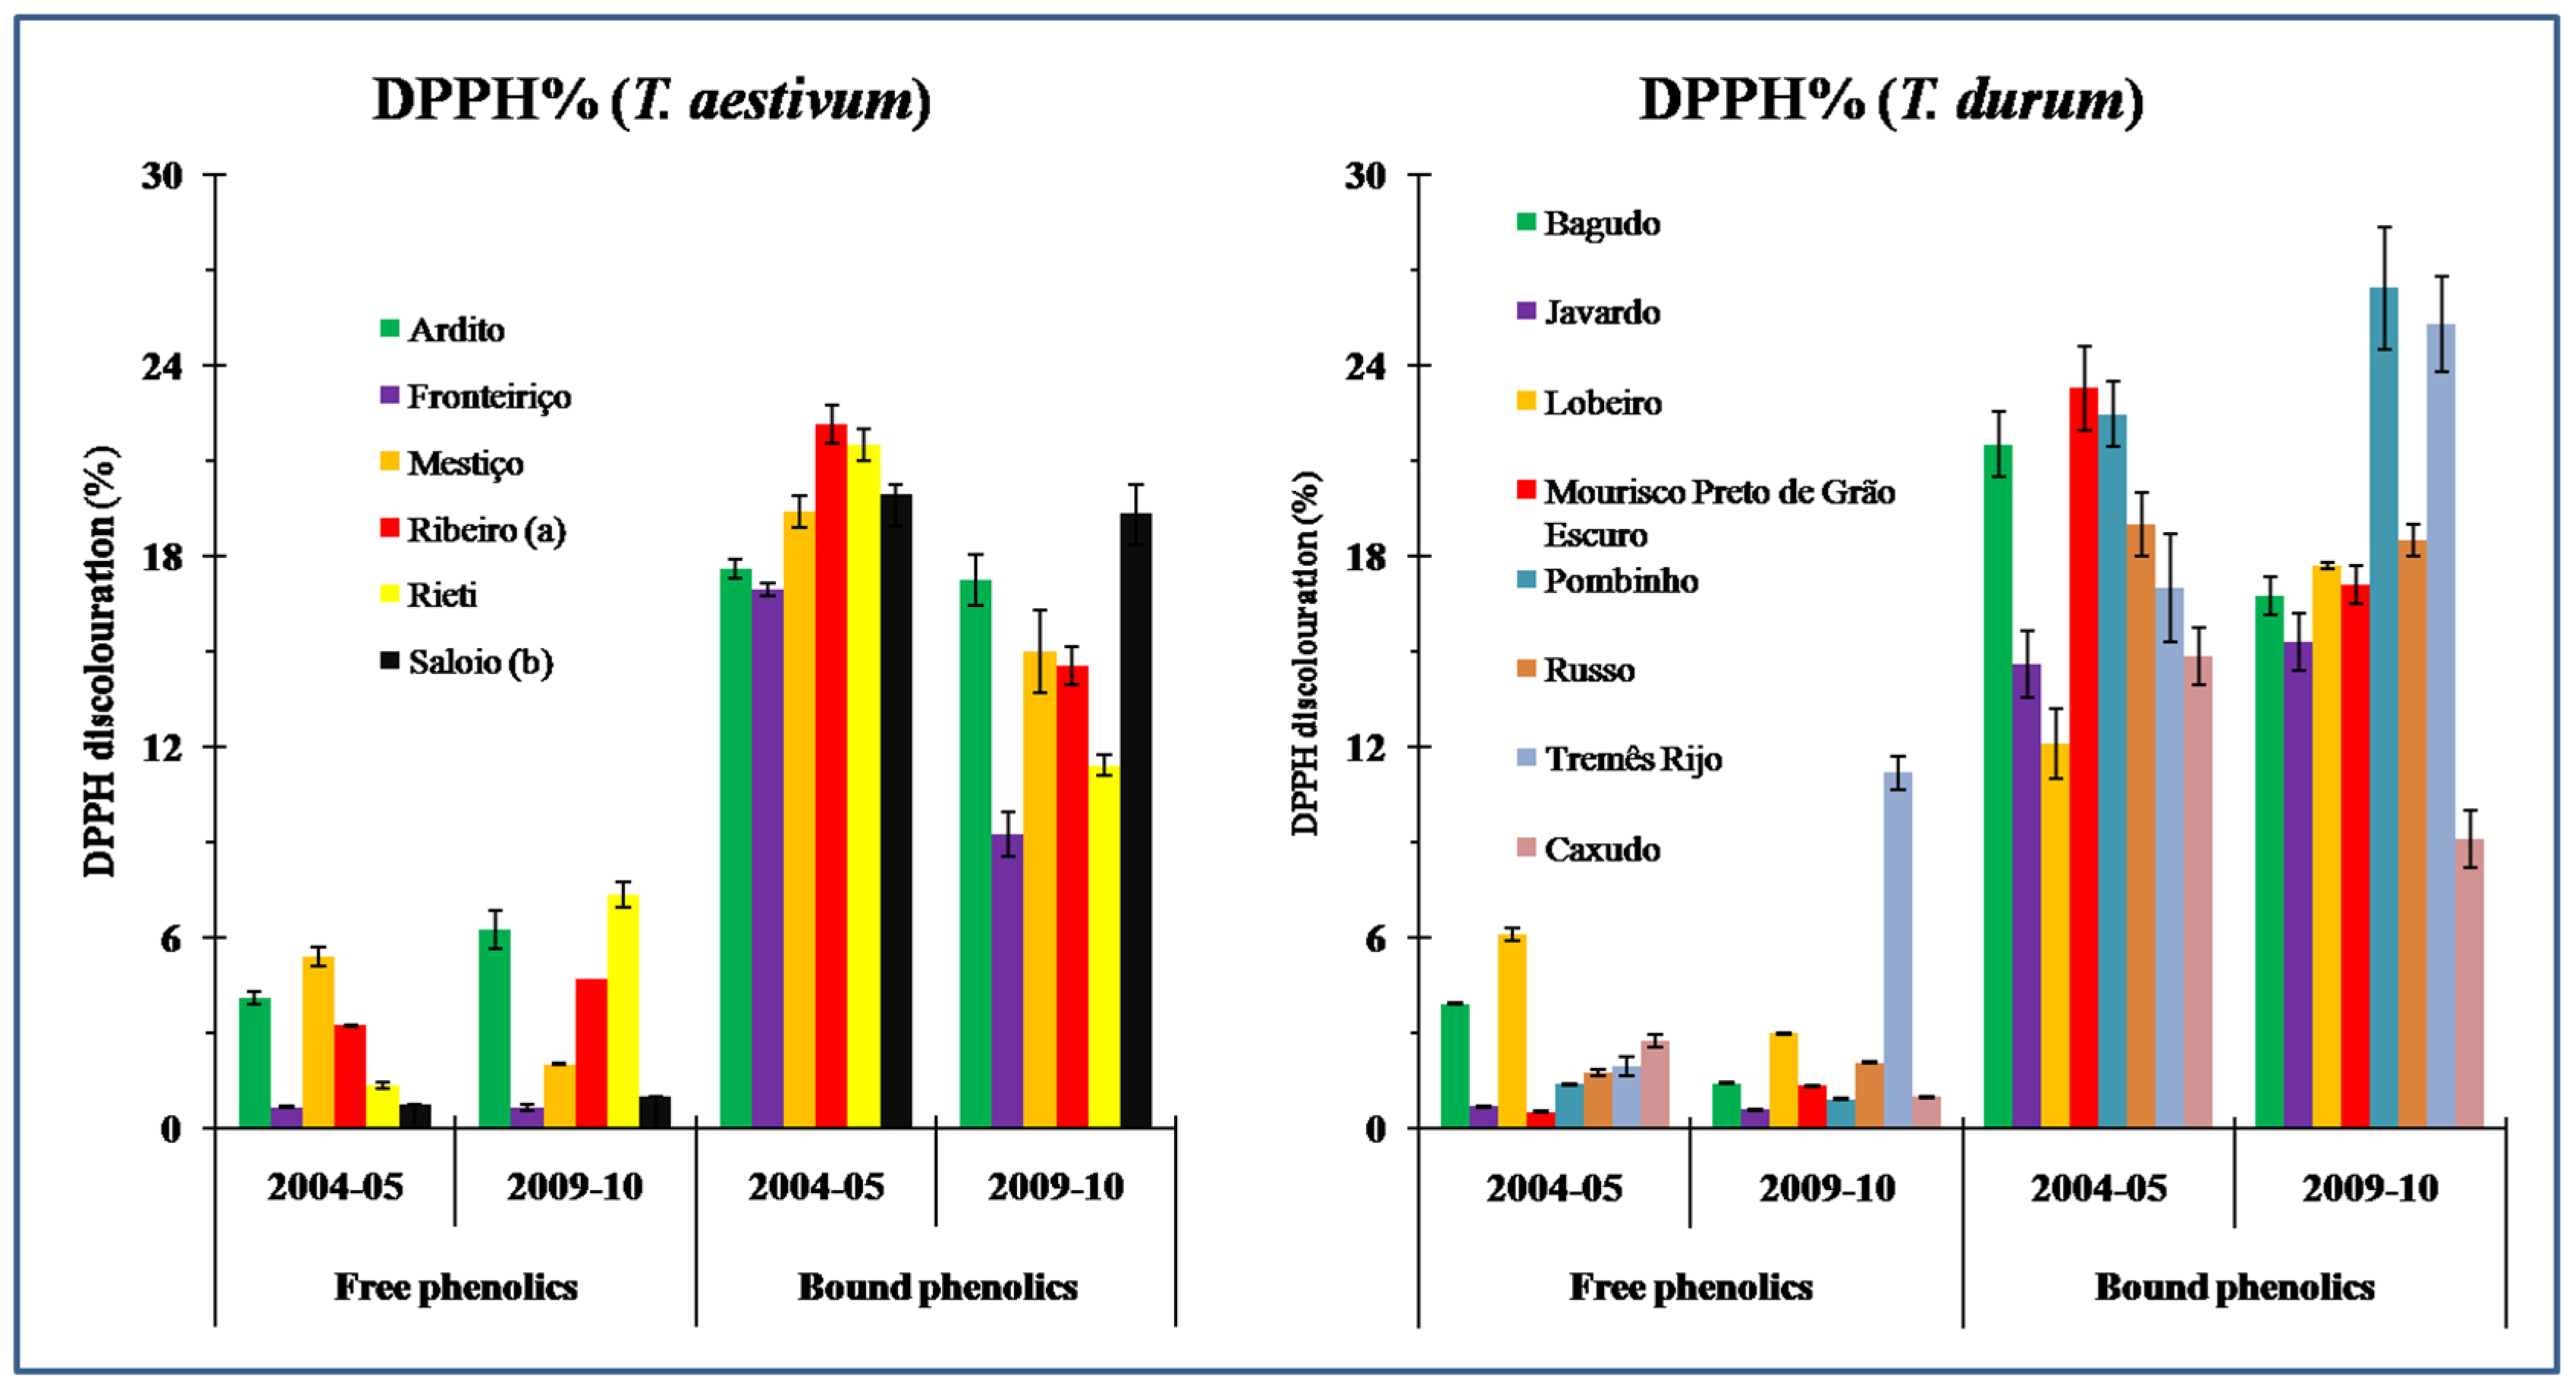
2.8.1. DPPH Radical Scavenging Assay
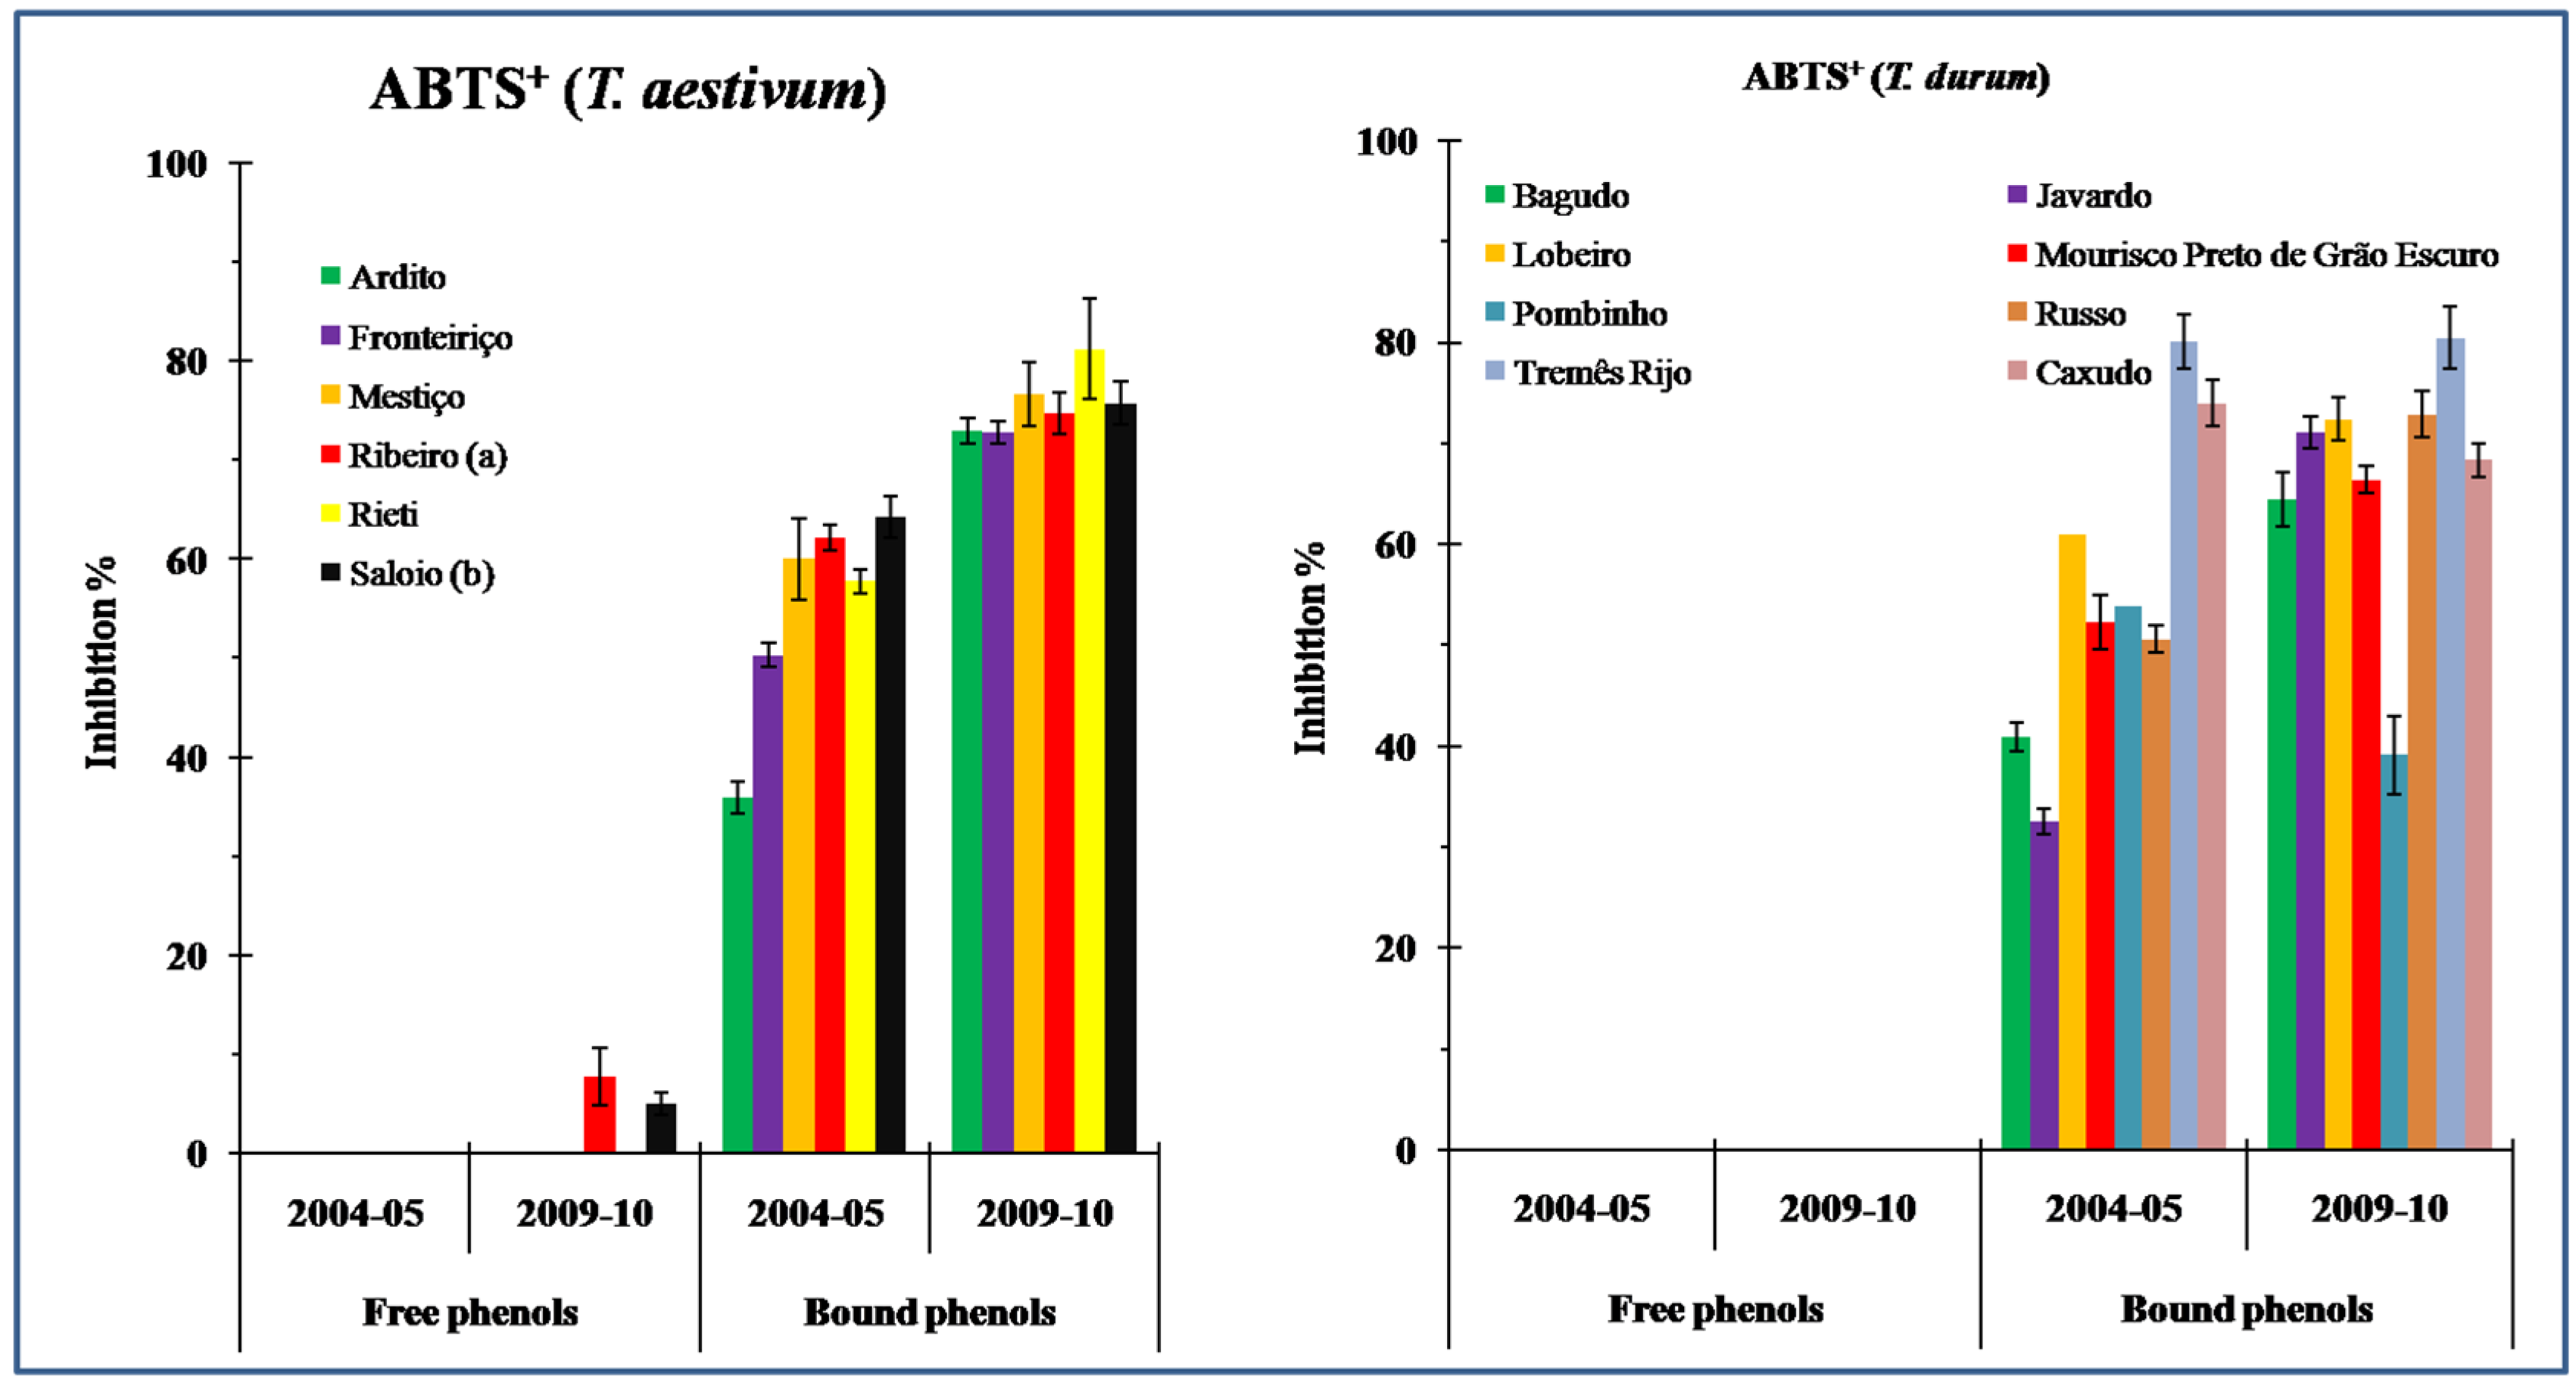
DPPH radical scavenging capacities of the wheat extracts were determined according to the previously described methods [28,29,30]. DPPH solution was prepared by mixing 4 mg of 2,2-diphenyl-1-picrylhydrazyl radical with 100 mL of MeOH. An aliquot of 15 µL of each extracted sample was loaded in a 96-well microplate containing 285 µL of DPPH solution and left for 10 min at RT in the dark. The absorbance values of samples were measured in a microplate reader (Multiskan™ FC Microplate Photometer, Vantaa, Finland) at 570 nm, and % of Antioxidant Activity or % of DPPH radical scavenging capacity was calculated using the following formula: %AA = ([(Absblank − Abssample)/Absblank] × 100.

2.8.2. ABTS Assay

For ABTS+ oxidant radical solution, ABTS (1 mg/mL) and potassium persulfate (0.65 mg/mL) were mixed in a 1:1 (v/v) ratio and kept at RT in the dark for 12–16 h to form the radical cation ABTS+. The ABTS+ solution was diluted with 20 mM sodium phosphate buffer (pH 6.6) to obtain absorbance values between 0.8 and 1.0 at 750 nm. Constant initial absorbance values were used for standards and samples. An aliquot of 15 µL of each extracted sample was loaded in a 96-well microplate containing 285 µL of standard solution and left for 10 min in the dark at RT. Subsequently, the absorbance values were recorded in a microplate reader (Multiskan™ FC Microplate Photometer, Vantaa, Finland). The antioxidant activity was expressed as a percentage (%), and results were calculated according to the following formula: % AA = [(Absblank − Abssample)/Absblank] × 100.

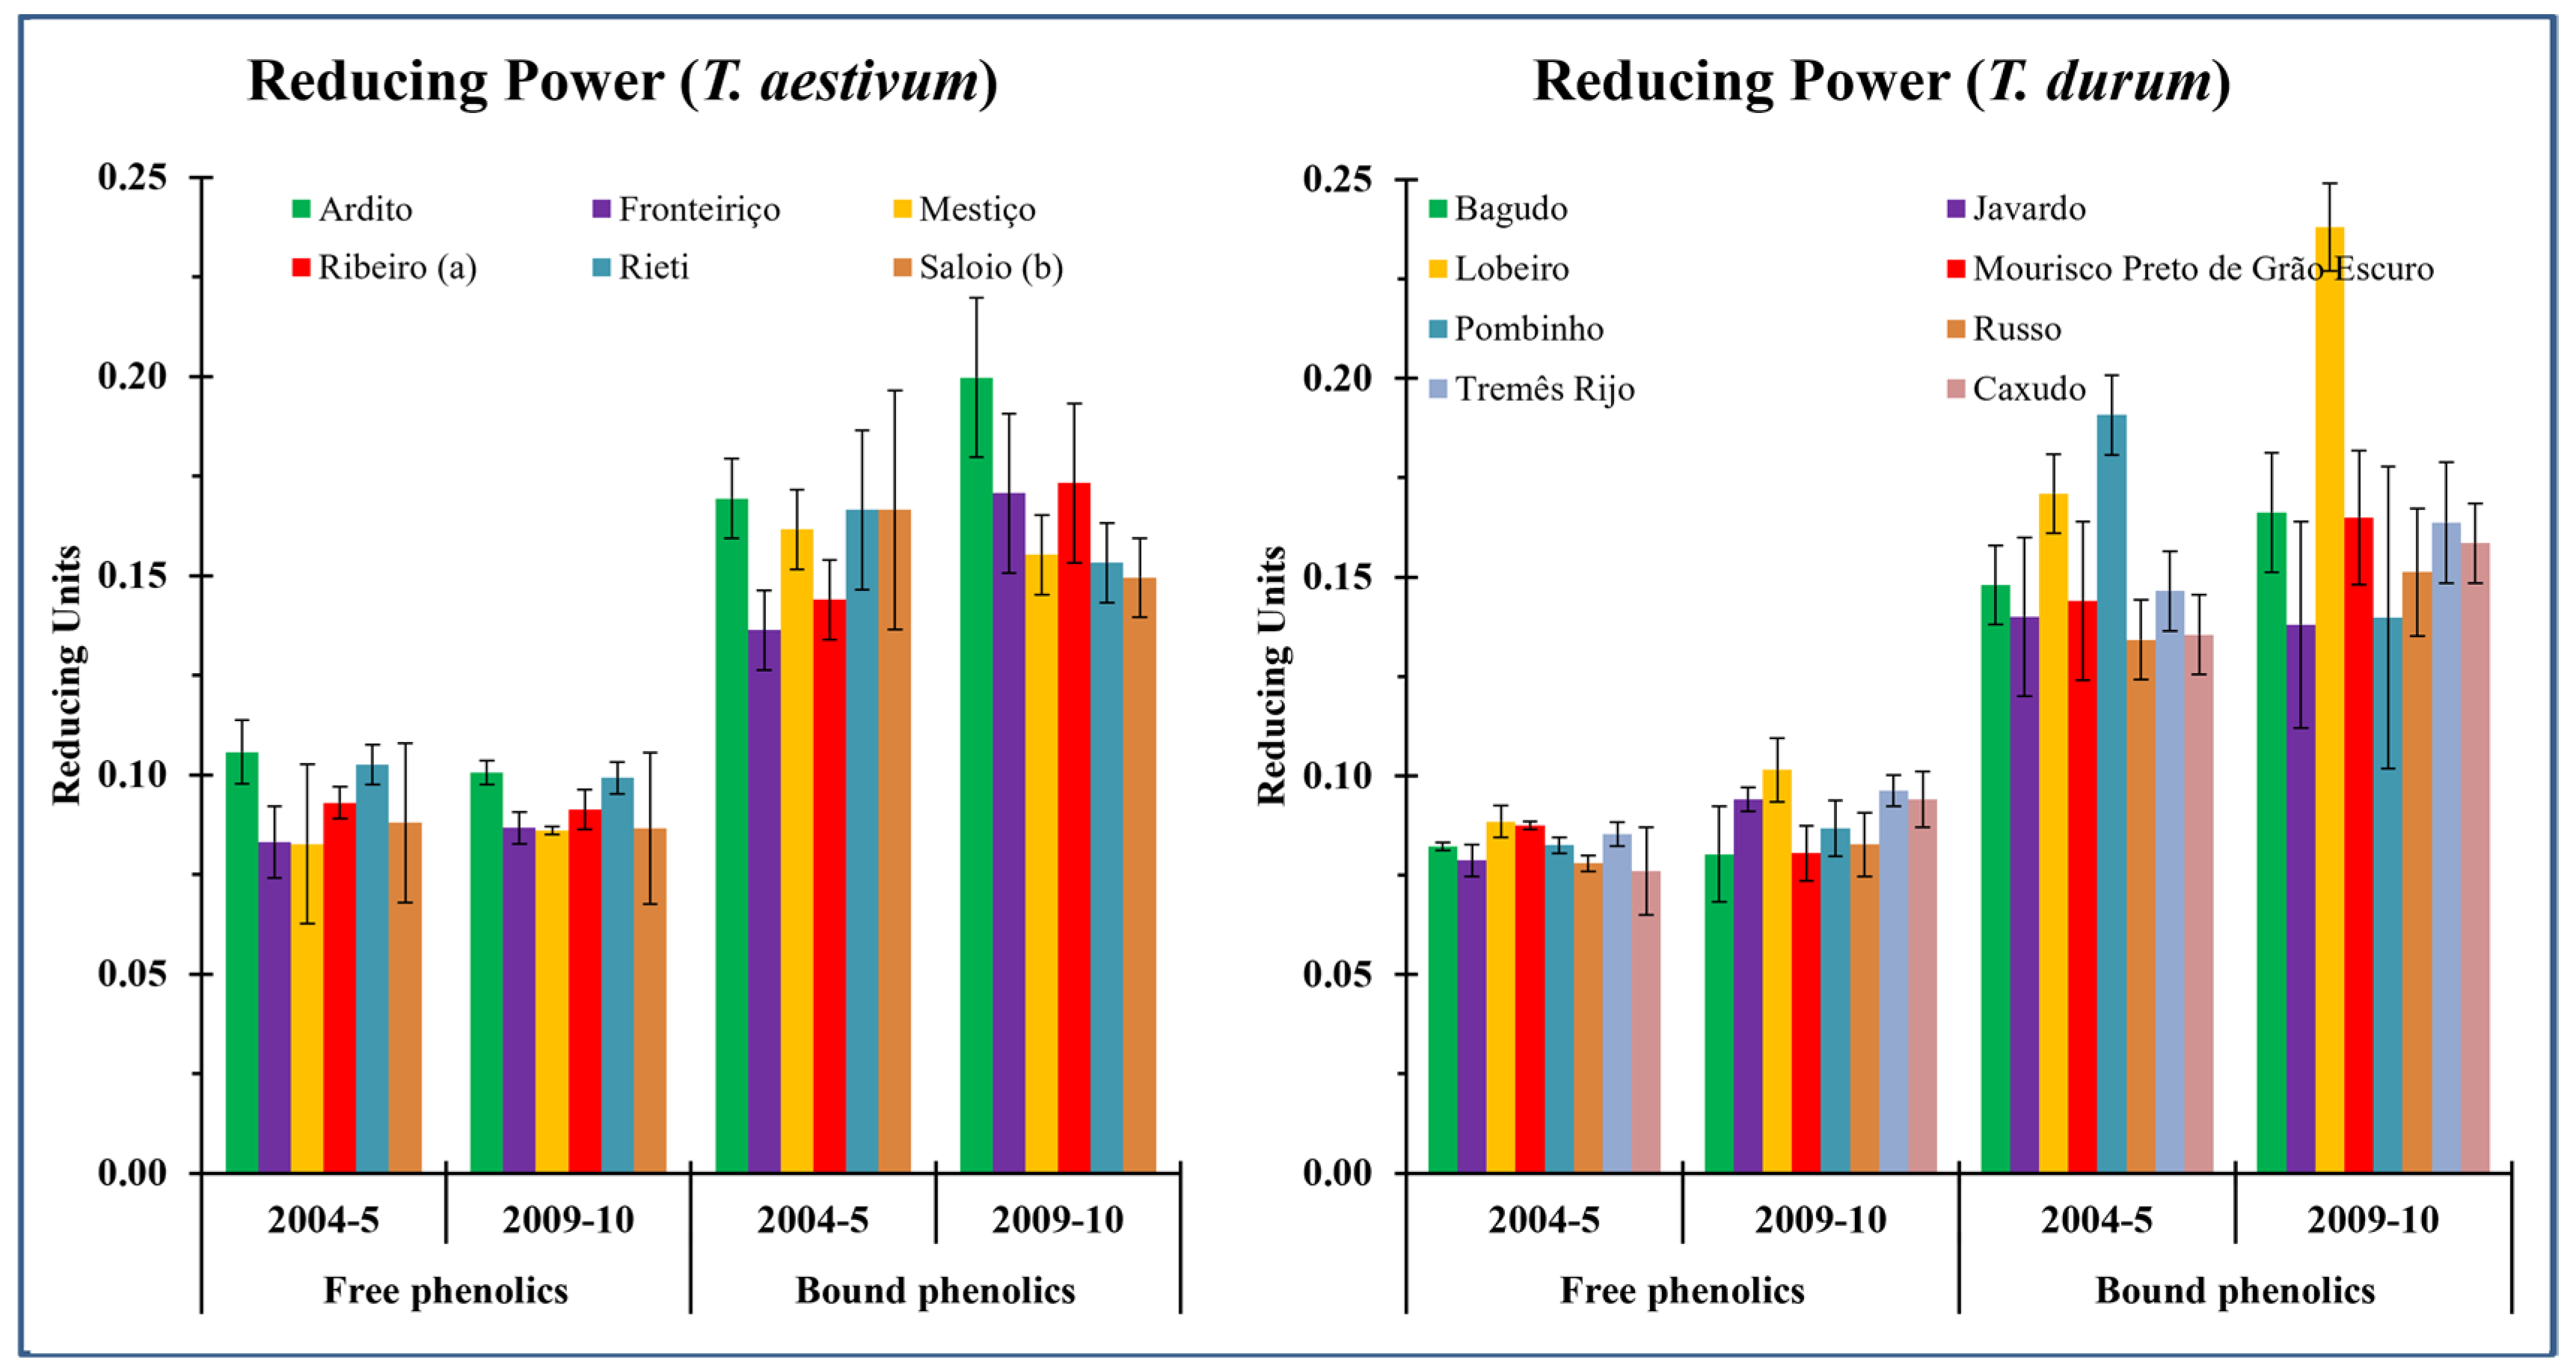
2.9. Reducing Power Method—Fe3+ to Fe2+ Activity Assay

The transformation of Fe3+ into Fe2+ was accessed following the previously described methods [31,32]. Briefly, an aliquot of 15 µL of each extracted sample was loaded in 96-well microplate wells containing 25 µL of sodium phosphate (pH 6.6, 0.2 M) together with 50 µL of 1% of aqueous potassium hexacyanoferrate [K3Fe(CN)6] solution. The mixed solution was incubated at 50 °C for 30 min. Subsequently, 25 µL of 10% trichloroacetic acid was added and mixed thoroughly. After that, 100µL ultra-pure water was added to the mixture solution with 25 µL of 0.1% of aqueous FeCl3 and mixed thoroughly. The absorbance of each sample was measured at 750 nm against control in a microplate reader (Multiskan™ FC Microplate Photometer, Vantaa, Finland). Higher absorbance of the sample indicated a higher reducing power.

2.10. Statistics

ANOVA statistically analyzed all variables for antioxidant activity, and Scheffe’s probability test was performed using the software program ‘StatView Version 4.5’ (Abacus Concepts Inc., Berkeley, CA, USA). Differences were considered significant at the 5% level when Scheffe’s probability test was applied.

3. Results

3.1. Total Phenolics Content (TPC)

The TPC of free and bound fractions from whole grain wheat flour were accessed using the Folin–Ciocalteu’s assay. Substantial genetic variability was observed for total phenolics content (sum of the free and bound form) in both bread and durum wheat genotypes (Table S2). TPC varied in bread and durum wheat from 650 to 1148 and 638 to 966 of µg ferulic acid equivalents (FAE)/g DW with a mean value of 991.1 and 786.7 µg FAE/g DW, respectively (Table 1). In general, the level of TPC was observed to be higher in bread wheat than in durum wheat. Similarly, significant variation was observed in the free and bound phenolic contents among the bread and durum wheat genotypes. Expectedly, bread and durum wheat presented a lower proportion of free phenolics in the total phenolics than their corresponding bound phenolics content. Interestingly, higher values of free phenolics content were observed in both bread and durum wheat during crop season 2004–2005 than in 2009–2010, whereas a reverse trend was noticed for bound phenolics content (Table 1).

3.2. Antioxidant Capacity (AC)

To access the antioxidant activity of free and bound phenolics from wheat samples, we performed DPPH and ABTS assays. The average free and bound DPPH were 3.04% and 17.41% in bread and 2.54% and 18.14% in durum wheat, respectively. The bound DPPH values were 5.73 and 7.14 times higher than free DPPH values for bread and durum wheat, respectively (Table S3). The highest total DPPH antioxidant capacity was observed for Mestiçoin bread wheat and Tremês Rijo in durum wheat. However, the total DPPH value of all the genotypes except Fronteiriço (bread) and Javardo and Caxudo (durum) were observed to be more than 20%, suggesting their importance in terms of antioxidant activity (Figure 2).
Like total DPPH antioxidant capacity, Tremês Rijo (durum) also showed the highest ABTS levels (Figure 2). Among bread wheat genotypes, Saloio (b) exhibited the overall highest ABTS level, which showed >20% inhibition value for DPPH. When comparing both methods to determine the antioxidant activity, ABTS represented a higher variation than DPPH (Figure 2; Table S3). Moreover, both methods demonstrated higher antioxidant activity of bound phenolics. DPPH and ABTS methods revealed significant differences between seasons (2004–2005 and 2009–2010) for total antioxidant activities in bread and durum wheat.

3.3. Reducing Power (RP)

Figure 3 illustrates the potent ferric-reducing power of free and bound phenolics extracts from bread and durum wheat. Higher absorbance indicates a high reducing power ability. The samples of bread, as well as durum wheat from crop season 2009-10, exhibited higher reducing power (Table S4). Nonetheless, it revealed a minor environmental influence between the reducing power of free and bound phenolics in bread and durum wheat. The free and bound phenolic extracts of Ardito and Lobeiro had the highest iron-reducing capacity across the years than all other bread and durum wheat genotypes, respectively (Figure 3).

3.4. Ferulic Acid (FA) Content

Details of free and bound cis- as well as trans-isomers of ferulic acid in individual bread and durum wheat genotypes are presented in Figure 4. Noticeably, only the trans-isomer of ferulic acid was detected in both free and bound phenolics, whereas the cis-isomer of ferulic acid was only detected in bound phenolics (Figure 4). In total ferulic acid content, free ferulic acid’s contribution was less than 2% in bread and durum wheat (Table 2). In bread and durum wheat, free ferulic acid ranged from 19 µg/g DW in Fronteiriço and Ribeiro(a) to 42 µg/g DW in Ardito and 13 µg/g DW in Pombinho to 32 µg/g DW in Lobeiro with mean values of 29.0 and 20.2 µg/g DW, respectively (Table 2). Among the studied genotypes, the highest bound ferulic acid, as well as total ferulic acid content, was found in Ardito (985 µg/g DW and 1027 µg/g DW) and Tremês Rijo (997 µg/g DW and 1010 µg/g DW) than in all other varieties of bread and durum wheat, respectively.

4. Discussion

All living cells depend on their oxidative metabolism, which naturally causes the production of free radicals and ROS, leading to oxidative changes in the regulatory living systems [33,34,35]. From the human molecular biology perspective, excessive ROS leads to several degenerative diseases and causes food nutritional and preservative quality deterioration due to chemical changes [3,4,34]. The interaction of several antioxidants provides the defense mechanisms against excessive ROS action obtained mainly through food ingestion. In addition to antioxidant activity, phenolic compounds act as reducing agents, singlet quenchers, and metal chelators [35].

4.1. Phenolic Content in Free and Bound Forms in Wheat

In the present study, we measured free and bound phenolics in 92 Portuguese wheat genotypes (46 each for bread and durum wheat, respectively). We observed substantial genetic variability for these compounds in the studied genotypes. The wide genotypic range for TPC (sum of free and bound phenolics content) in the current investigated material (650–1148 µg FAE/g DW and 638–966 µg FAE/g DW in bread and durum wheat, respectively) suggests the scope for improvement of wheat for these nutritionally important compounds. Moreover, these results indicate that the cultivar is more critical than the wheat type (either durum or bread wheat). Based on the average content, bread wheat (993 µg FAE/g DW) showed higher TPC than durum wheat (788 µg FAE/g DW) cultivars. These results corroborated the findings of Menga et al. [36], who also reported a slightly lower level of TPC in durum (882 µg FAE/g DW) than that of soft wheat (938 µg FAE/g DW) cultivars.
Like TPC, considerable differences were observed among wheat cultivars for free and bound phenolics. Noticeably, a higher level of free phenolics was observed in durum wheat (276 µg FAE/g DW) than in bread wheat (196 µg FAE/g DW). However, the contributions from bound type to the total phenolics were observed at about 80% and 65% in bread and durum wheat, with mean levels being 797 µg FAE/g DW and 512 µg FAE/g DW, respectively, thus representing bound phenolics as a predominant component of TPC in wheat. As shown in the present study, previous literature also reported a very high contribution of bound phenolics (around 75–77%) in TPC for the wheat [37,38]. However, the absorption mechanism of bound phenolics released in the colon after upper gastrointestinal digestion has not yet been well studied, where they might be processed and transformed by microbial activity [39]. Nonetheless, bound phenolics have more health benefits, especially in the colon. This fact may partly explain the low incidence of colon cancers and other chronic diseases associated with consuming wheat grain products [40].

4.2. Antioxidant Capacity (AC) in Wheat

Considering the various antioxidants’ action modes, more than one method for measuring total antioxidant capacity in vitro must be used. However, DPPH and ABTS assays are the easiest to perform and deliver fast and reproducible results [25]. The antioxidant activity of bread and durum wheat grains based on DPPH revealed a high percentage of DPPH scavenging of bound phenolics (17.41% and 18.14% DPPH for bread and durum wheat, respectively) than free phenolics (3.04% and 2.54% DPPH for bread and durum wheat, respectively). These results agree with the earlier reports that bound phenolics are better free radical scavengers than free phenolics in wheat [41,42]. The percentage of DPPH scavenging observed in the current material agrees with the reports of Narwal et al. [21] and Verma et al. [43], who observed an average reduction in color of 12.3% and 15.6% in wheat cultivars with a range of 6–25% and 11.9–20.1% discoloration. Contrarily, Mpofu et al. [44] reported lower % discoloration (13.2–15.0%) in Canadian spring durum wheat genotypes.
In addition to DPPH, ABTS radical cation decolorization test is also widely performed to assess antioxidant activity. In the present study, the mean ABTS inhibition values for bread and durum wheat were observed at 65.4% and 60.0%, respectively, representing a higher variation than that observed for DPPH inhibition. The order of radical cation ABTS+ scavenging activities of the studied cultivars differed from that of DPPH quenching capacities. Still, the cultivar Javardo (durum wheat) showed the lowest antioxidant capacity (41.8%), as observed with the DPPH assay (12.8%).
Our results revealed the substantial reducing power of wheat grains, suggesting that phenolic compounds of wheat grain may serve as effective antioxidants by reducing the ferric/ferricyanide complex to the ferrous form. Both free and bound fractions contributed significantly to reducing power in wheat grains. The higher reducing power of bound phenolics than free fractions agree with Revanappa et al. [42] and Chandrasekara and Shahidi [26], who also observed stronger reducible capabilities in the bound extracts than the free phenolic fractions from wheat and pearl millet, respectively. Significant genotypic differences for reducing power indicate the presence of reductones in both bread and durum wheat grains which may serve as a viable source of electron donors and can reduce the oxidized intermediates of peroxidation by acting as antioxidants [26]. Notably, the contribution to the total phenolics content must be considered in assessing the antioxidant activity of wheat grains because total phenolics content is positively associated with their corresponding reducing power.

4.3. Content and Contribution of Ferulic Acid Isomers in Wheat

In general, ferulic acid is the most abundant phenolic acid in wheat grains, representing up to 95% on average of total phenolic acids, and occurs in free and bound forms [45]. In the present study, we measured both cis- and trans-isomers of ferulic acid in free and bound extracts. The predominant contribution (97%) of bound ferulic acid in total ferulic acid detected in the present study was similar to previously obtained results in wheat [46,47].
Noticeably, cis-ferulic acid was only detected in the bound extracts, whereas trans-ferulic was found in both free and bound extracts. The trans-isomer was observed as the more predominant form of ferulic acid than its respective cis-isomer with an overall contribution of >91% and varied about two-fold across the concentration range in bread (529–919 µg/g DW) and durum (573–927 µg/g DW) wheat genotypes. Nonetheless, the cis-isomer of ferulic acid was only detected in the bound fraction. Still, a notable concentration was measured in bread and durum wheat genotypes, accounting for 9% of total ferulic acid, supporting Tian et al. [48], who also reported about 10% contribution of cis-isomer in the level of total ferulic acid in wheat grains. Notably, depending upon the methodology, Verma et al. [43] reported a 2–4% contribution of cis-isomer in total ferulic acid in bread wheat brans. The differences found between our study together with Tian et al. [48] and Verma et al. [43] suggest that there is the possibility that the trans-isomer form could be partially converted to the cis-form by the cis-transferase enzyme during the extraction and quantification of these isomers and the type of biological material and methodology used [45].

5. Conclusions

Many food applications involving wheat-based products, such as cooking, steaming, or baking, typically require significant thermal processing. Although essential nutritional compounds, including phenolics, are inevitably affected by food processing, there is a discrepancy in the effect of processing methods on the overall quality of the food product. Some studies suggest that thermal processing has adverse or no effect on the phenolic content [45], while others indicate an improvement in the bio-accessibility of phenolics, which in turn results in drop-off of these nutritionally important compounds in wheat-based products [49]. Thus, exploitation of genetic variation for increasing the levels of phenolic compounds is the most economical and effective method for the improvement of wheat quality properties. Overall, our results demonstrate the existence of significant genotypic differences for TPC in Portuguese bread as well as durum wheat. An analysis of 92 cultivars confirmed that a bound fraction contributes a major proportion of TPC in bread and durum wheat. However, a significant influence of environmental conditions was noticed, making the genotypic differences more apparent. Our study showed that the bread wheat genotypes Belém, Eborense, and Mocho Espiga Quadrada and the durum wheat genotypes Mongia(a) and Mourisco Ruivo(a) could be exploited in a breeding program for further selection and development of cultivars with enhanced phenolics as a valuable tool to improve the public health. Noticeably, the higher antioxidant capacity of bound extract might be attributed to the ferulic acid, especially trans-isomer, which is prevalent in the bound extract. The implications of these findings are significant when considering the potential health benefits of cereals, particularly wheat since this crop grains are consumed in various product forms and the antioxidant compounds must endure additional processing conditions.

Supplementary Materials

The following supporting information can be downloaded at: https://www.mdpi.com/article/10.3390/crops3020012/s1; Table S1: Details of Portuguese wheat genotypes used in present study; Table S2: Description of phenolics content of Portuguese wheat germplasm evaluated during crop season 2004–2005 and 2009–2010; Table S3: Statistics of antioxidant activity (DPPH% and ABTS%) of Portuguese wheat germplasm evaluated during crop season 2004–2005 and 2009–2010; Table S4: Statistics of antioxidant capacity (Reducing power) of Portuguese wheat germplasm evaluated during crop season 2004–2005 and 2009–2010.

Author Contributions

Conceptualization, J.L.-B. and A.B.; methodology, A.L.G.-O.; software, A.L.G.-O.; formal analysis, A.L.G.-O. and A.A.; investigation, A.L.G.-O., A.A. and R.C.; data curation, A.L.G.-O. and A.A.; writing—original draft preparation, A.L.G.-O.; writing—review and editing, all authors; funding acquisition, J.L.-B., A.B. and V.C. All authors have read and agreed to the published version of the manuscript.

Funding

This research was funded by Project INNovation in the FOOD (INNOFOOD) sector through the valorization of food and agro-food by-products (NORTE-07-0124-FEDER-0000029), financed by the North Portugal Regional Operational Programme (ON.2–O Novo Norte) under the National Strategic Reference Framework (QREN), through FEDER, as well as by PIDDAC through FCT/MEC.

Data Availability Statement

The data presented in this study is available in the supporting information and can be downloaded at: https://www.mdpi.com/article/10.3390/crops3020012/s1.

Acknowledgments

A.L.G.-O. acknowledge the Fundação para a Ciência e Tecnologia(FCT) of Portugal for the Post-Doctoral Fellowship (BDP/InnoFood/UTAD/771/2014) during the research period. The authors thank the unknown referees for their pertinent comments and suggestions.

Conflicts of Interest

The authors declare no conflict of interest. The funders had no role in the study’s design; in the collection, analyses, or interpretation of data; in the writing of the manuscript; or in the decision to publish the results.

References

  1. Bhattacharyya, A.; Chattopadhyay, R.; Mitra, S.; Crowe, S.E. Oxidative Stress: An Essential Factor in the Pathogenesis of Gastrointestinal Mucosal Diseases. Physiol. Rev. 2014, 94, 329–354. [Google Scholar] [CrossRef] [PubMed]
  2. Pichersky, E.; Gang, D.R. Genetics and biochemistry of secondary metabolites in plants: An evolutionary perspective. Trends Plant Sci. 2000, 5, 439–445. [Google Scholar] [CrossRef] [PubMed]
  3. Griendling, K.; Fitzgerald, G.A. Oxidative Stress and Cardiovascular Injury: Part II: Animal and human studies. Circulation 2003, 108, 1912–1916. [Google Scholar] [CrossRef] [PubMed]
  4. Bandyopadhyay, D.; Chattopadhyay, A.; Ghosh, G.; Datta, A. Oxidative Stress-Induced Ischemic Heart Disease: Protection by Antioxidants. Curr. Med. Chem. 2004, 11, 369–387. [Google Scholar] [CrossRef]
  5. He, S.; Liu, F.; Xu, L.; Yin, P.; Li, D.; Mei, C.; Jiang, L.; Ma, Y.; Xu, J. Protective Effects of Ferulic Acid against Heat Stress-Induced Intestinal Epithelial Barrier Dysfunction In Vitro and In Vivo. PLoS ONE 2016, 11, e0145236. [Google Scholar] [CrossRef]
  6. Abraão, A.S.; Fernandes, N.; Silva, A.M.; Domínguez-Perles, R.; Barros, A. Prunus lusitanica L. Fruits as a Novel Source of Bioactive Compounds with Antioxidant Potential: Exploring the Unknown. Antioxidants 2022, 11, 1738. [Google Scholar] [CrossRef]
  7. Fischer, R.A.; Edmeades, G.O. Breeding and Cereal Yield Progress. Crop. Sci. 2010, 50, S85–S98. [Google Scholar] [CrossRef]
  8. Gülçin, I. Antioxidant activity of food constituents: An overview. Arch. Toxicol. 2012, 86, 345–391. [Google Scholar] [CrossRef]
  9. So, Y.B.; Woong, B.J.; Dong, S.K.; Hwa, Y.H.; Yong, W.S. Antioxidant activity and total phenolic compounds in grain extracts of wheat, barley, and oat. Korean J. Crop Sci. 2002, 47, 102–107. [Google Scholar]
  10. Beta, T.; Nam, S.; Dexter, J.E.; Sapirstein, H.D. Phenolic Content and Antioxidant Activity of Pearled Wheat and Roller-Milled Fractions. Cereal Chem. 2005, 82, 390–393. [Google Scholar] [CrossRef]
  11. Li, W.; Shan, F.; Sun, S.; Corke, H.; Beta, T. Free Radical Scavenging Properties and Phenolic Content of Chinese Black-Grained Wheat. J. Agric. Food Chem. 2005, 53, 8533–8536. [Google Scholar] [CrossRef] [PubMed]
  12. Goufo, P.; Trindade, H. Rice antioxidants: Phenolic acids, flavonoids, anthocyanins, proanthocyanidins, tocopherols, tocotrienols, γ-oryzanol, and phytic acid. Food Sci. Nutr. 2014, 2, 75–104. [Google Scholar] [CrossRef] [PubMed]
  13. Liyana-Pathirana, C.M.; Shahidi, F. Antioxidant Activity of Commercial Soft and Hard Wheat (Triticum aestivum L.) as Affected by Gastric pH Conditions. J. Agric. Food Chem. 2005, 53, 2433–2440. [Google Scholar] [CrossRef] [PubMed]
  14. Irakli, M.N.; Samanidou, V.F.; Biliaderis, C.; Papadoyannis, I.N. Development and validation of an HPLC-method for determination of free and bound phenolic acids in cereals after solid-phase extraction. Food Chem. 2012, 134, 1624–1632. [Google Scholar] [CrossRef]
  15. Fincher, G.B. Ferulic acid in barley cell walls: A fluorescence study. J. Inst. Brew. 1976, 82, 347–349. [Google Scholar] [CrossRef]
  16. Stewart, D.; Robertson, G.W.; Morrison, I.M. Phenolic acids dimers in the cell walls of barley. J. Mass Spectrom. 1994, 23, 71–74. [Google Scholar] [CrossRef]
  17. Sun, R.; Sun, X.; Wang, S.; Zhu, W.; Wang, X. Ester and ether linkages between hydroxycinnamic acids and lignins from wheat, rice, rye, and barley straws, maize stems, and fast-growing poplar wood. Ind. Crop. Prod. 2002, 15, 179–188. [Google Scholar] [CrossRef]
  18. van Ruth, S.; Villegas, B.; Akkermans, W.; Rozijn, M.; van der Kamp, H.; Koot, A. Prediction of the identity of fats and oils by their fatty acid, triacylglycerol and volatile compositions using PLS-DA. Food Chem. 2010, 118, 948–955. [Google Scholar] [CrossRef]
  19. Lv, J.; Lu, Y.; Niu, Y.; Whent, M.; Ramadan, M.F.; Costa, J.; Yu, L. Effect of genotype, environment, and their interaction on phytochemical compositions and antioxidant properties of soft winter wheat flour. Food Chem. 2013, 138, 454–462. [Google Scholar] [CrossRef]
  20. Avramiuc, M. The influence of viability on phenolic content, conductivity and sugars efflux, and the relation-ships between these indices in wheat seeds. Food Environ. Saf. 2014, 13, 116–121. [Google Scholar]
  21. Narwal, S.; Thakur, V.; Sheoran, S.; Dahiya, S.; Jaswal, S.; Gupta, R.K. Antioxidant activity and phenolic content of the Indian wheat varieties. J. Plant Biochem. Biotechnol. 2014, 23, 11–17. [Google Scholar] [CrossRef]
  22. Yiğit, A.; Erekul, O. Antioxidant Activity and Essential Amino acid Content of Bread Wheat (Triticum aestivum L.) Varieties. J. Agric. Sci. 2023, 29, 130–141. [Google Scholar] [CrossRef]
  23. Garcia-Oliveira, A.L.; Machado, N.; Barros, A.; Carnide, V.; Lima-Brito, J. Genotypic Variation For Carotenoids Content and Chemometric Model Development For Seed Quality Parameters in Wheat. Procedia Environ. Sci. 2015, 29, 162–163. [Google Scholar] [CrossRef]
  24. de Vasconcelos, M.; Bennett, R.; Castro, C.; Cardoso, P.; Saavedra, M.; Rosa, E. Study of composition, stabilization and processing of wheat germ and maize industrial by-products. Ind. Crop. Prod. 2012, 42, 292–298. [Google Scholar] [CrossRef]
  25. Huang, D.; Ou, B.; Prior, R.L. The Chemistry behind Antioxidant Capacity Assays. J. Agric. Food Chem. 2005, 53, 1841–1856. [Google Scholar] [CrossRef]
  26. Chandrasekara, A.; Shahidi, F. Content of Insoluble Bound Phenolics in Millets and Their Contribution to Antioxidant Capacity. J. Agric. Food Chem. 2010, 58, 6706–6714. [Google Scholar] [CrossRef]
  27. Stratil, P.; Klejdus, B.; Kubáň, V. Determination of Total Content of Phenolic Compounds and Their Antioxidant Activity in VegetablesEvaluation of Spectrophotometric Methods. J. Agric. Food Chem. 2006, 54, 607–616. [Google Scholar] [CrossRef]
  28. Brand-Williams, W.; Cuvelier, M.E.; Berset, C. Use of a free radical method to evaluate antioxidant activity. LWT Food Sci. Technol. 1995, 28, 25–30. [Google Scholar] [CrossRef]
  29. Sanchez-Moreno, C.; Larrauri, J.A.; Saura-Calixto, F.A. A procedure to measure the antiradical efficiency of polyphenols. J. Sci. Food Agric. 1998, 76, 270–276. [Google Scholar] [CrossRef]
  30. Siddhuraju, P.; Becker, K. Antioxidant Properties of Various Solvent Extracts of Total Phenolic Constituents from Three Different Agroclimatic Origins of Drumstick Tree (Moringa oleifera Lam.) Leaves. J. Agric. Food Chem. 2003, 51, 2144–2155. [Google Scholar] [CrossRef]
  31. Gülçin, I.; Mshvildadze, V.; Gepdiremen, A.; Elias, R. Screening of antiradical and antioxidant activity of monodesmosides and crude extract from Leontice smirnowii tuber. Phytomedicine 2006, 13, 343–351. [Google Scholar] [CrossRef] [PubMed]
  32. Hinneburg, I.; Dorman, H.D.; Hiltunen, R. Antioxidant activities of extracts from selected culinary herbs and spices. Food Chem. 2006, 97, 122–129. [Google Scholar] [CrossRef]
  33. Antolovich, M.; Prenzler, P.D.; Patsalides, E.; McDonald, S.; Robards, K. Methods for testing antioxidant activity. Analyst 2001, 127, 183–198. [Google Scholar] [CrossRef] [PubMed]
  34. McCord, J.M. The evolution of free radicals and oxidative stress. Am. J. Med. 2000, 108, 652–659. [Google Scholar] [CrossRef]
  35. Shahidi, F.; Naczk, M. Phenolics in Food and Nutraceuticals; CRC Press: Boca Raton, FL, USA, 2004; pp. 1–545. [Google Scholar]
  36. Menga, V.; Fares, C.; Troccoli, A.; Cattivelli, L.; Baiano, A. Effects of genotype, location and baking on the phenolic content and some antioxidant properties of cereal species. Int. J. Food Sci. Technol. 2010, 45, 7–16. [Google Scholar] [CrossRef]
  37. Adom, K.K.; Liu, R.H. Antioxidant Activity of Grains. J. Agric. Food Chem. 2002, 50, 6182–6187. [Google Scholar] [CrossRef]
  38. Zhang, Y.; Wang, L.; Yao, Y.; Yan, J.; He, Z. Phenolic acid profiles of Chinese wheat cultivars. J. Cereal Sci. 2012, 56, 629–635. [Google Scholar] [CrossRef]
  39. Rocchetti, G.; Gregorio, R.P.; Lorenzo, J.M.; Barba, F.J.; Oliveira, P.G.; Prieto, M.A.; Simal-Gandara, J.; Mosele, J.I.; Motilva, M.; Tomas, M.; et al. Functional implications of bound phenolic compounds and phenolics–food interaction: A review. Compr. Rev. Food Sci. Food Saf. 2022, 21, 811–842. [Google Scholar] [CrossRef]
  40. Jacobs, D.R., Jr.; Meyer, K.A.; Kushi, L.H.; Folsom, A.R. Whole-grain intake may reduce the risk of ischemic heart disease death in postmenopausal women: The Iowa Women’s Health Study. Am. J. Clin. Nutr. 1998, 68, 248–257. [Google Scholar] [CrossRef]
  41. Maillard, M.-N.; Berset, C. Evolution of Antioxidant Activity during Kilning: Role of Insoluble Bound Phenolic Acids of Barley and Malt. J. Agric. Food Chem. 1995, 43, 1789–1793. [Google Scholar] [CrossRef]
  42. Revanappa, S.; Salimath, P.V. Phenolic acid profiles and antioxidant activities of different wheat (Triticum aestivum L.) varieties. J. Food Biochem. 2011, 35, 759–775. [Google Scholar] [CrossRef]
  43. Verma, B.; Hucl, P.; Chibbar, R.N. Phenolic Content and Antioxidant Properties of Bran in 51 Wheat Cultivars. Cereal Chem. 2008, 85, 544–549. [Google Scholar] [CrossRef]
  44. Mpofu, A.; Sapirstein, H.D.; Beta, T. Genotype and Environmental Variation in Phenolic Content, Phenolic Acid Composition, and Antioxidant Activity of Hard Spring Wheat. J. Agric. Food Chem. 2006, 54, 1265–1270. [Google Scholar] [CrossRef] [PubMed]
  45. Ma, D.; Wang, C.; Feng, J.; Xu, B. Wheat grain phenolics: A review on composition, bioactivity, and influencing fac-tors. J. Sci. Food Agric. 2021, 101, 6167–6185. [Google Scholar] [CrossRef]
  46. Abdel-Aal, E.-S.M.; Hucl, P.; Sosulski, F.W.; Graf, R.; Gillott, C.; Pietrzak, L. Screening Spring Wheat for Midge Resistance in Relation to Ferulic Acid Content. J. Agric. Food Chem. 2001, 49, 3559–3566. [Google Scholar] [CrossRef] [PubMed]
  47. Adom, K.K.; Sorrells, M.E.; Liu, R.H. Phytochemical Profiles and Antioxidant Activity of Wheat Varieties. J. Agric. Food Chem. 2003, 51, 7825–7834. [Google Scholar] [CrossRef]
  48. Tian, W.; Chen, G.; Gui, Y.; Zhang, G.; Li, Y. Rapid quantification of total phenolics and ferulic acid in whole wheat using UV–Vis spectrophotometry. Food Control 2020, 123, 107691. [Google Scholar] [CrossRef]
  49. Laddomada, B.; Caretto, S.; Mita, G. Wheat bran phenolic acids: Bioavailability and stability in whole wheat-based foods. Molecules 2015, 20, 15666–15685. [Google Scholar] [CrossRef]
Figure 1. Climatic conditions of Vila Real, Portugal during 2004–2005 and 2009–2012 seasons. Note: PP for monthly rain or snow precipitation in mm; TM for monthly average maximum temperature in °C and Tm for monthly average minimum temperature in °C.
Crops 03 00012 g001
Figure 2. Antioxidant activity (DPPH and ABTS) of selected Portuguese bread and durum wheat genotypes.
Crops 03 00012 g002aCrops 03 00012 g002b
Figure 3. Antioxidant activity (reducing power) of selected Portuguese bread and durum wheat genotypes.
Crops 03 00012 g003
Figure 4. Ferulic acid content (µg/g DW) of selected Portuguese bread and durum wheat genotypes.
Crops 03 00012 g004aCrops 03 00012 g004b
Table 1. Total phenolics content (µg ferulic acid equivalents (FAE)/g DW) of Portuguese bread and durum wheat genotypes.
Wheat
Species
Crop
Season
Free PhenolicsBound PhenolicsTotal Phenolics
RangeAverageRangeAverageRangeAverage
T. aestivum
(n = 46)
2004-200558–252122.2 ± 7.8292–1160815.4 ± 25.9378–1253937.6 ± 26.9
2009-2010200–371268.0 ± 6.3492–1033774.3 ± 16.3741–12611018.5 ± 28.7
Combined119–286193.4 ± 5.7485–1029797.7 ± 17.1650–1148991.1 ± 16.9
T. durum
(n = 46)
2004-2005167–430246.7 ± 9.2310–880660.1 ± 19.1668–1230906.8 ± 20.6
2009-201093–616304.0 ± 20.9176–613362.7 ± 13.6398–1098666.7 ± 22.7
Combined152–412275.3 ± 10.3389–659511.4 ± 9.3638–966786.7 ± 11.9
n denotes the number of genotypes.
Table 2. Ferulic acid (FA) content of Portuguese bread and durum wheat genotypes.
Wheat
Species
Crop
Season
Ferulic Acid (μg/g Dry Matter)
Free PhenolicsBound PhenolicsTotal
RangeAverageRangeAverageRangeAverage
T. aestivum
(n = 6)
2004-200514–4729.7 ± 5.7526–956773.2 ± 93.0573–971803 ± 63.1
2009-201023–4028.3 ± 2.6449–1141860.4 ± 150.9478–1181889 ± 95.9
Combined19–4229.0 ± 3.8552–986816.8 ± 72.2580–1027846 ± 71.7
T. durum
(n = 8)
2004-20053–3520.4 ± 3.7470–1021671.4 ± 60.0485–1024632 ± 58.4
2009-201011–3520.0 ± 3.0509–973748.7 ± 52.1520–9971010 ± 54.0
Combined13–3220.2 ± 2.7619–997710.0 ± 44.3632–1010730 ± 44.3
Disclaimer/Publisher’s Note: The statements, opinions and data contained in all publications are solely those of the individual author(s) and contributor(s) and not of MDPI and/or the editor(s). MDPI and/or the editor(s) disclaim responsibility for any injury to people or property resulting from any ideas, methods, instructions or products referred to in the content.

