Article

Analysis of the Influence of Variable Meteorological Conditions on the Performance of the EV Battery and on the Driving Range

by
Carlos Armenta-Déu
1,* and
Baptiste Giorgi
2
1
Department of Matter Structure, Thermal Physics and Electronics, Faculty of Physical Sciences, Complutense University of Madrid, 28040 Madrid, Spain
2
Polytechnical Institute, Campus Universitaire des Cézeaux, 2, Université Clermont Auvergne, Avenue Blaise-Pascal, TSA 60,206-CS 60026, CEDEX, 63178 Aubière, France
*
Author to whom correspondence should be addressed.
Future Transp. 2023, 3(2), 626-642; https://doi.org/10.3390/futuretransp3020037
Submission received: 21 January 2023 / Revised: 8 March 2023 / Accepted: 5 May 2023 / Published: 12 May 2023
(This article belongs to the Special Issue Feature Papers in Future Transportation)

Abstract

:
The influence of variable weather conditions on the performance of the battery that powers electric vehicles (EV) was studied and analyzed. This paper also deals with the effects that changes in the performance of the battery have on the driving range of the vehicle. An algorithm to evaluate the influence of temperature on the behavior of the battery and on the real driving range of electric vehicles was developed. Our theoretical approach was assessed in experimental tests run under operating conditions that reproduce real situations. A correction factor was obtained to match theoretical and experimental values with an accuracy higher than 98%. A linear relation between driving range and ambient temperature was observed from a simulation process, with a high regression coefficient. The relation shows that the driving range increases with ambient temperature. The ratio of the estimated driving range from the simulation process and the standard value for a reference temperature of 25 °C was obtained. The ratio shows that the global driving range can be increased by up to 29% in high temperatures associated with the summer season, while for very low temperatures, near −30 °C, the global driving range is reduced by 20%. The comparative analysis of the driving range for different temperatures shows that there is a reduction of about 18% for the low range of ambient temperatures, between −15 °C and 5 °C, while for medium temperatures, between 5 °C and 25 °C, the reduction in the driving range is only 4.6%. Finally, tests demonstrated that with a reduction in high temperatures from 25 °C to 35 °C, the driving range only reduced by about 0.4%. For higher temperatures, around 50 °C, the longest driving distance can be achieved, with a higher accuracy.

1. Introduction

The implementation of electric vehicles (EV) to reduce environmental pollution and to avoid the negative influence of global atmospheric heating and climatic change due to greenhouse effects has become the main political goal of supranational institutions such as the European Commission (EC) and other public and private organizations [1,2,3,4,5,6], which have united with the common goal of reducing carbon emissions [7,8,9,10,11,12,13,14,15].
The spread of electric vehicles is hampered by the high costs, low autonomy, the reluctance of users to switch to this new technology, and the insufficient charging infrastructure. These are key points that impede the full implementation of EV in road transportation and generate doubts when purchasing electric vehicles [16,17]. The price is heavily dependent on technological development and mass production, particularly in relation to the high price of lithium batteries that power EV. The insufficient charging infrastructure is related to investment, since the profitability of installing an electric vehicle charging station is still highly questionable, and the balance between advantages and drawbacks is not clearly established [18,19,20]. This profitability depends on how many vehicles use the charging station facility, which has become a vicious circle: there are no charging stations because there are not enough electric vehicles, and there are no electric vehicles because there are not enough charging stations. The low autonomy is directly related to the capacity of the battery [21,22], which has led researchers to improve its performance and make it more efficient [23,24,25]. Despite all the efforts devoted to increasing the driving range of electric vehicles, their comparatively lower desirability as compared to conventional combustion engine cars continues to be one of the limiting aspects for the adoption of electric vehicles as the primary option for future transportation.
Supercapacitors are another option to power electric vehicles [26], although they suffer from quick discharge in high power units and slow discharge in lower power units. Some research has been devoted to the hybridization of batteries and supercapacitors in power electric vehicles, using the supercapacitor to supply high-rate discharge when high power is required, and using the batteries for medium or low discharge rates during moderate or low power requirements [27].
Battery performance can be improved by the use of the equivalent consumption minimization strategy (ECMS), although this method is currently applied to hybrid electric vehicles (HEV) or plug-in hybrid electric vehicles (PHEV) [28,29]. Another method for the improvement of the battery performance is model predictive control (MPC), which can be applied either to electric vehicles (EV) [30], plug-in hybrid electric vehicles [31], or hybrid electric vehicles [32]. The two above mentioned methods can be combined with the method proposed in this paper, thus improving the management of battery performance and optimizing its operation.
One additional aspect that affects the autonomy of a battery, and thus the driving range of an electric vehicle, is the temperature; this factor does not depend on technological advances, but conditions the useful time the battery is capable of delivering charge and energy. A large selection of studies can be found in the literature analyzing the influence of temperature on the performance of the battery of EV. Some of them are related to the general behavior of the battery as an electrochemical device [33,34,35,36,37], while others deal with the management procedure to minimize the negative effects of temperature or to characterize how thermal management may improve the performance of the battery [38,39,40].
It appears that the effects of temperature on the performance of the battery in electric vehicles have been adequately characterized and that the positive and negative influence has already been analyzed and evaluated. Nevertheless, the influence of dynamic changes in ambient temperature on the performance of the battery remains under explored. This is why the effects of variable meteorological conditions should be studied and their impact on the behavior of the battery and on the driving range of the powered electric vehicle analyzed.

2. Theoretical Background

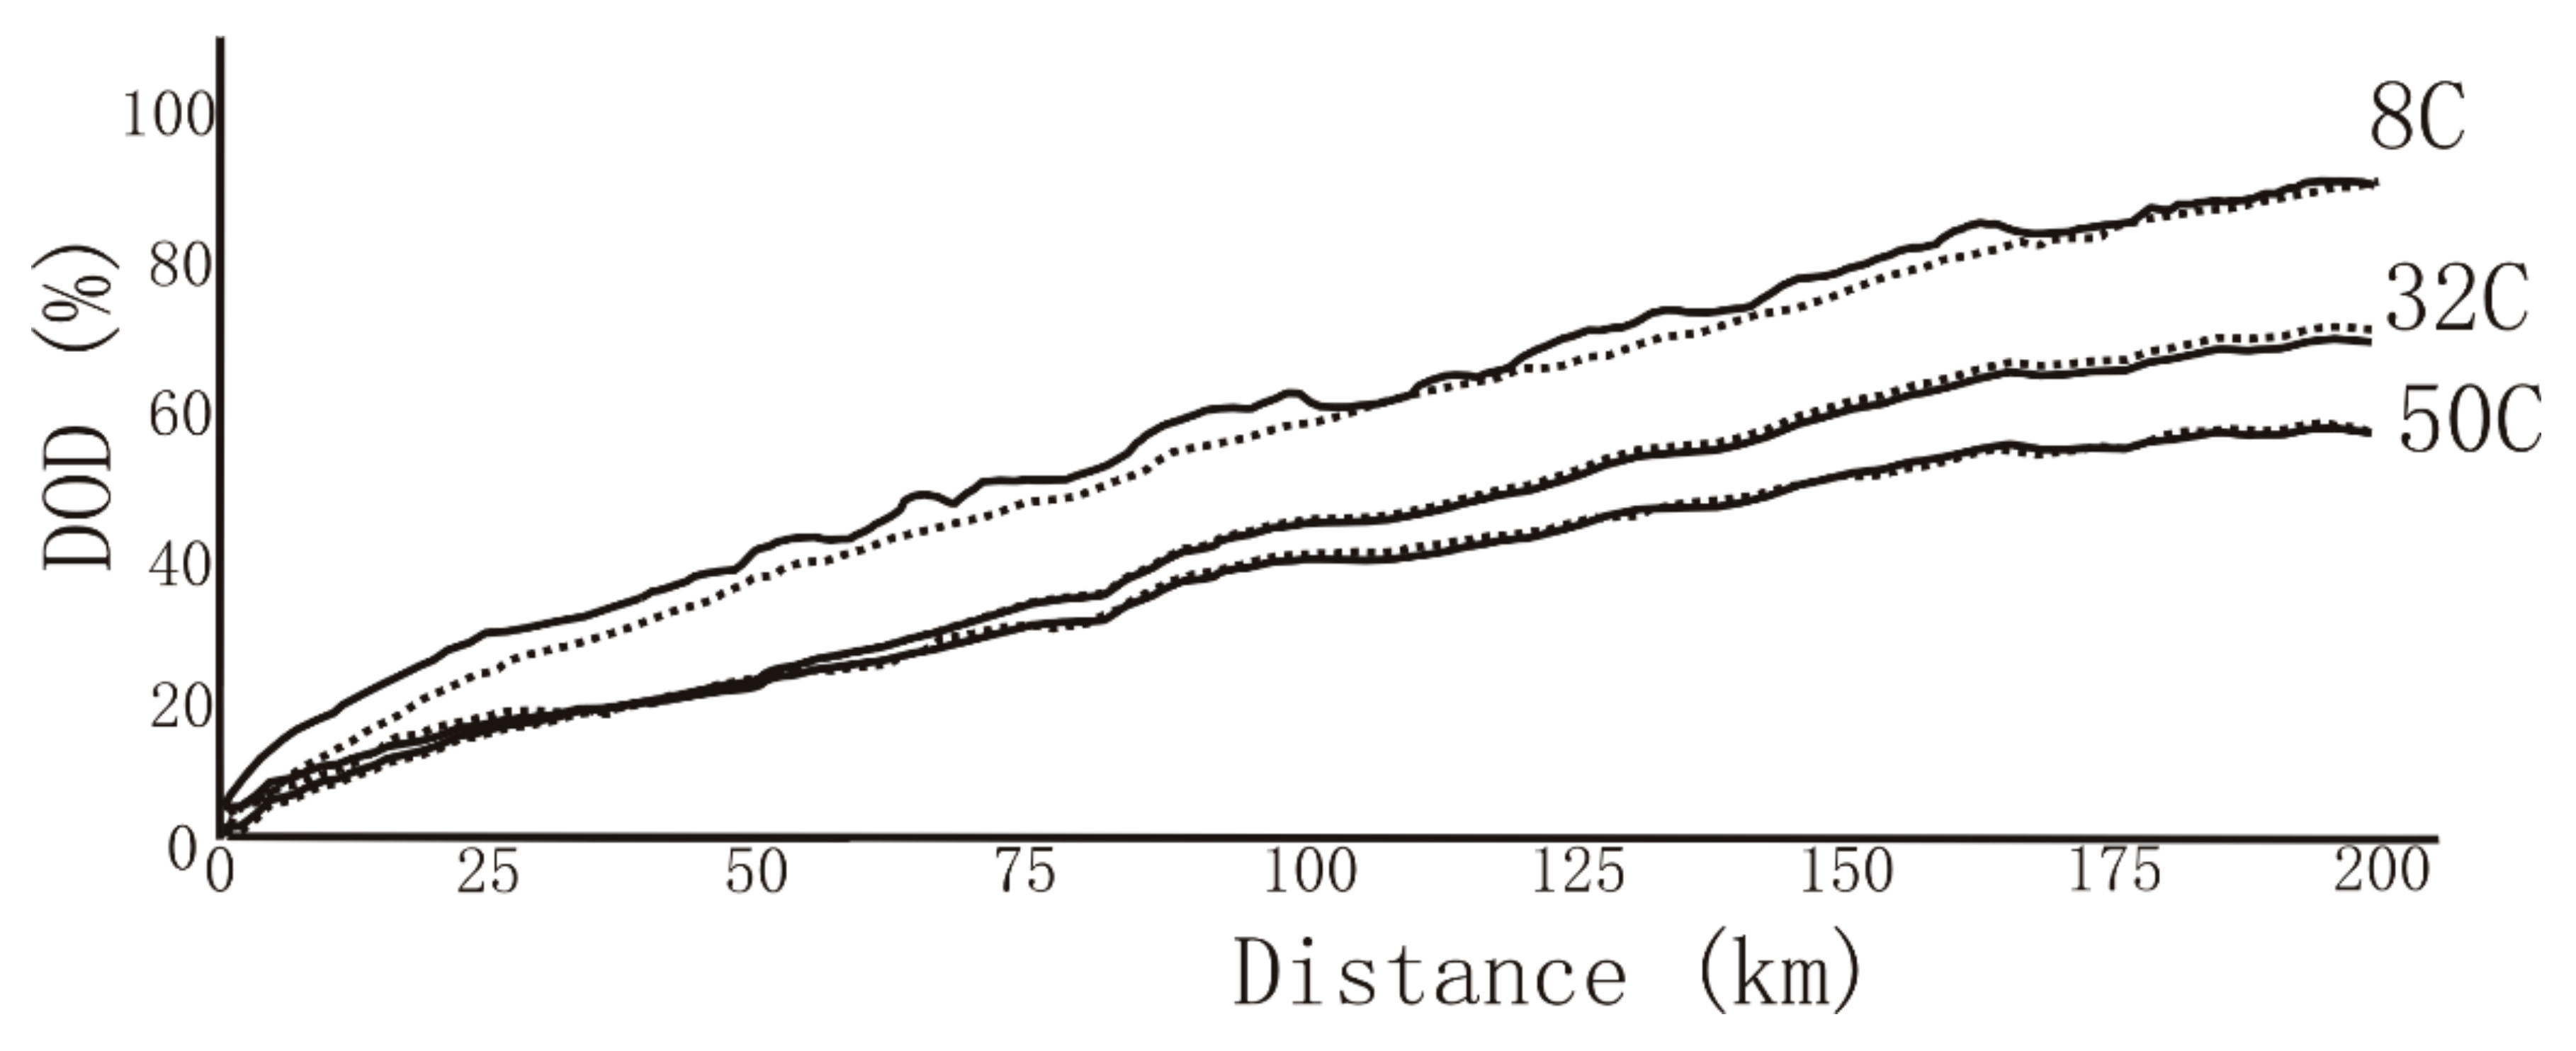
2.1. Effects of Temperature on Battery Capacity

The battery capacity in lithium-ion batteries is given for specific operating conditions, and more precisely, to a specific discharge rate, which is currently 20 h. Therefore, the capacity of a battery is modified if the discharge current differs from the reference one, given by:
C j = C n f C
where Cn is the 20 h rate battery capacity, also known as the nominal capacity, and fC is the capacity correction factor that considers the variation of the capacity with the discharge rate. This correction factor is expressed as [41]:
f C = 0.9571 t D 0.0148
tD accounts for the real discharge time, which can be obtained from:
t D = C n I D
where ID is the real discharge current, and the nominal capacity is given by the battery manufacturer.
The expression for the battery capacity is related to standard conditions, which means a standard temperature of 25 °C (298 K); however, if the temperature changes, the capacity of the battery is also changed depending on the temperature variation. This dependence is expressed by the following relation [42]:
C T = C j 1.0047 I D I r e f 1.0213 T r e f T D 0.4393
where CT is the real capacity of the battery for the specific operating temperature, ID and Iref are the operating and reference current discharge value, respectively, and TD and Tref are the operating and reference temperature value, respectively.
Combining Equations (1) to (4), we obtain:
C T = 0.9571 C n 1.0148 I D 0.0148 1.0047 I D I r e f 1.0213 T r e f T D 0.4393 = = 0.9616 C n 1.0148 I D 1.0063 I r e f 1.0213 T r e f T D 0.4393
Equation (5) provides the algorithm to determine the real capacity of the battery for any temperature and discharge current conditions.
Relating the battery capacity to electric vehicle driving range, we have:
D R = C T R d r V b a t
Rdr is the driving range rate of the electric vehicle for standard conditions, and Vbat is the battery operating voltage. It is assumed that the electric engine operates at the same voltage as the battery.
Although the battery voltage decays with energy consumption as the electric vehicle is running, in the case of lithium-ion batteries, the decay is produced very slowly, so the battery voltage can be considered fairly constant, especially if the time interval is short.
Nevertheless, to develop a more precise determination of the performance of the battery, the driving range was divided into segments, assuming the operation conditions remain constant for every segment. This is true if the time interval for every segment is short enough to assure that the changes in any of the variable parameters are low or negligible.
When a trip segmentation process has been applied, and considering the discharge rate, the battery voltage, and the operating temperature to be constant, the real driving range of the electric vehicle can be expressed as:
D R = i = 1 n D R i
where the partial driving range of every segment (DR)i can be obtained applying Equation (5) to Equation (6), and applying specific operating conditions for the i-segment of the trip; therefore:
D R i = V b a t , i R d r , i 0.9616 C n 1.0148 I D , i 1.0063 I r e f 1.0213 T r e f T D , i 0.4393
Since the temperature for specific weather conditions can be considered constant, we have:
D R i = 0.9616 C n 1.0148 I r e f 1.0213 T r e f T D 0.4393 V b a t , i R d r , i I D , i 1.0063
To obtain the real driving range of the vehicle, a trip segmentation process must be applied with every segment of the trip, while maintaining the discharge rate and the operating temperature constant; under these premises, the driving range can be expressed as in Equation (7).
The driving range is dependent on driving conditions, and thus on the driving force and vehicle speed. Using the dimensions equation formulism, we obtain:
R d r = ξ ( W h ) d ( k m ) R d r = P t ( W ) t ( h ) d ( k m ) = F ( N ) d ( m ) t ( h ) d ( k m ) t ( s ) = 3.6 F ( N )
Equation (10) gives a simple way to determine the driving range rate using the driving force, which leads us to analyze the driving conditions for every segment of the trip.

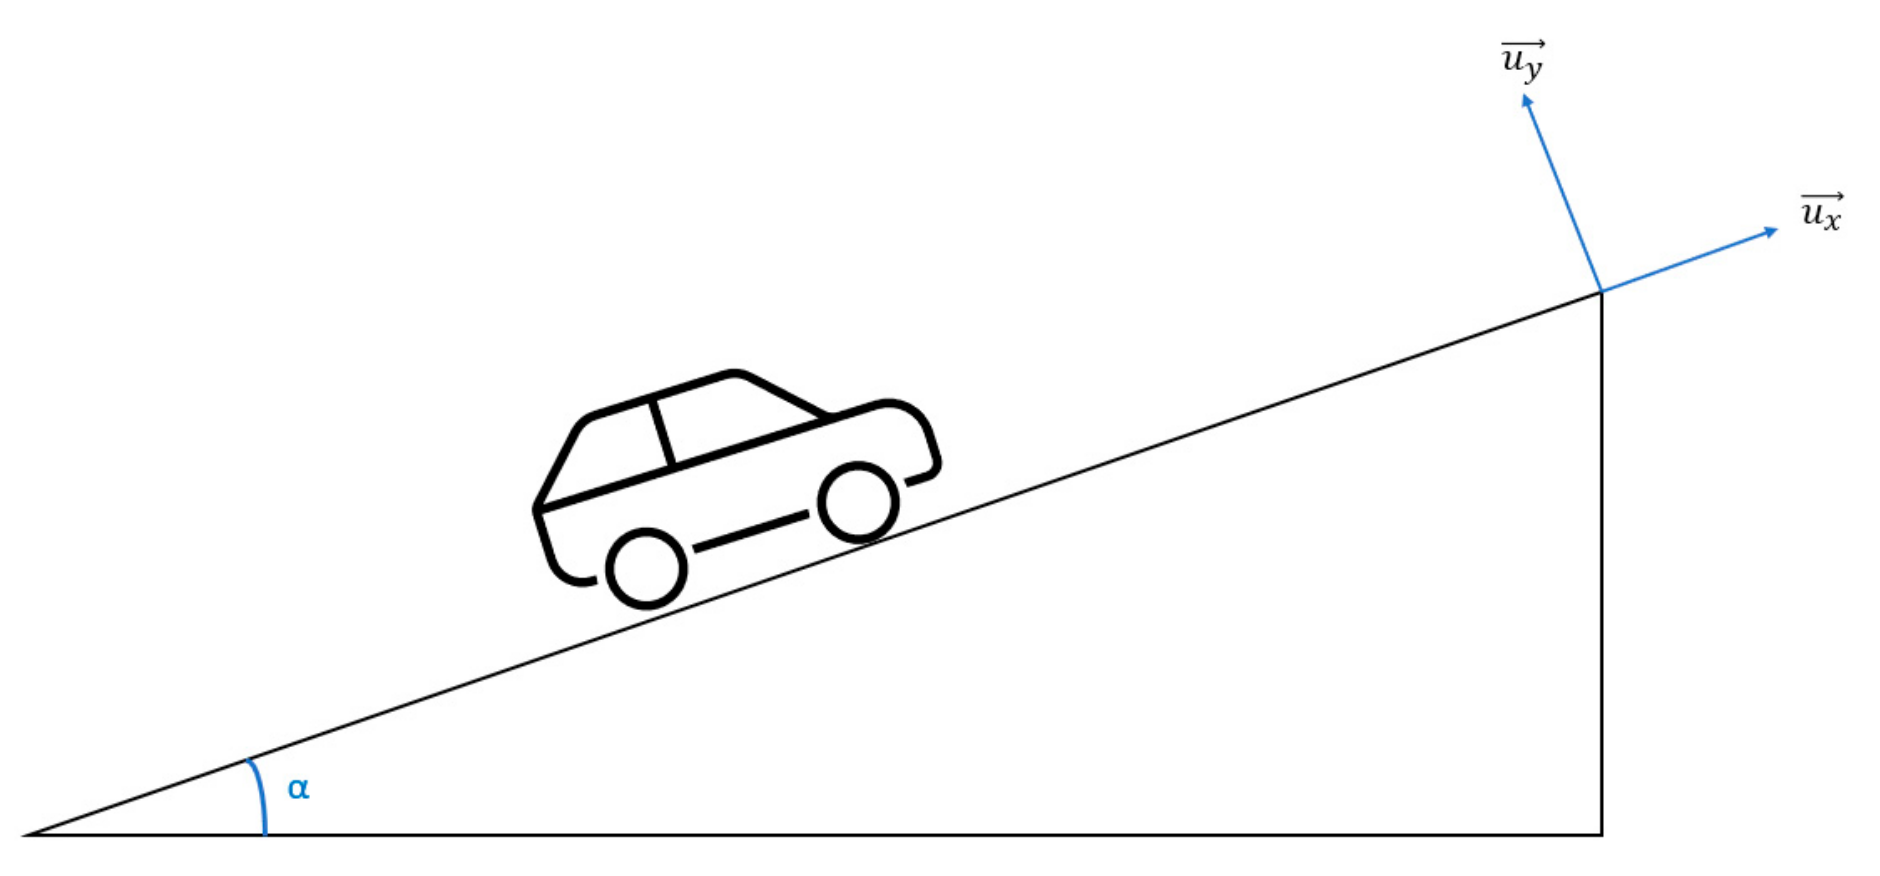
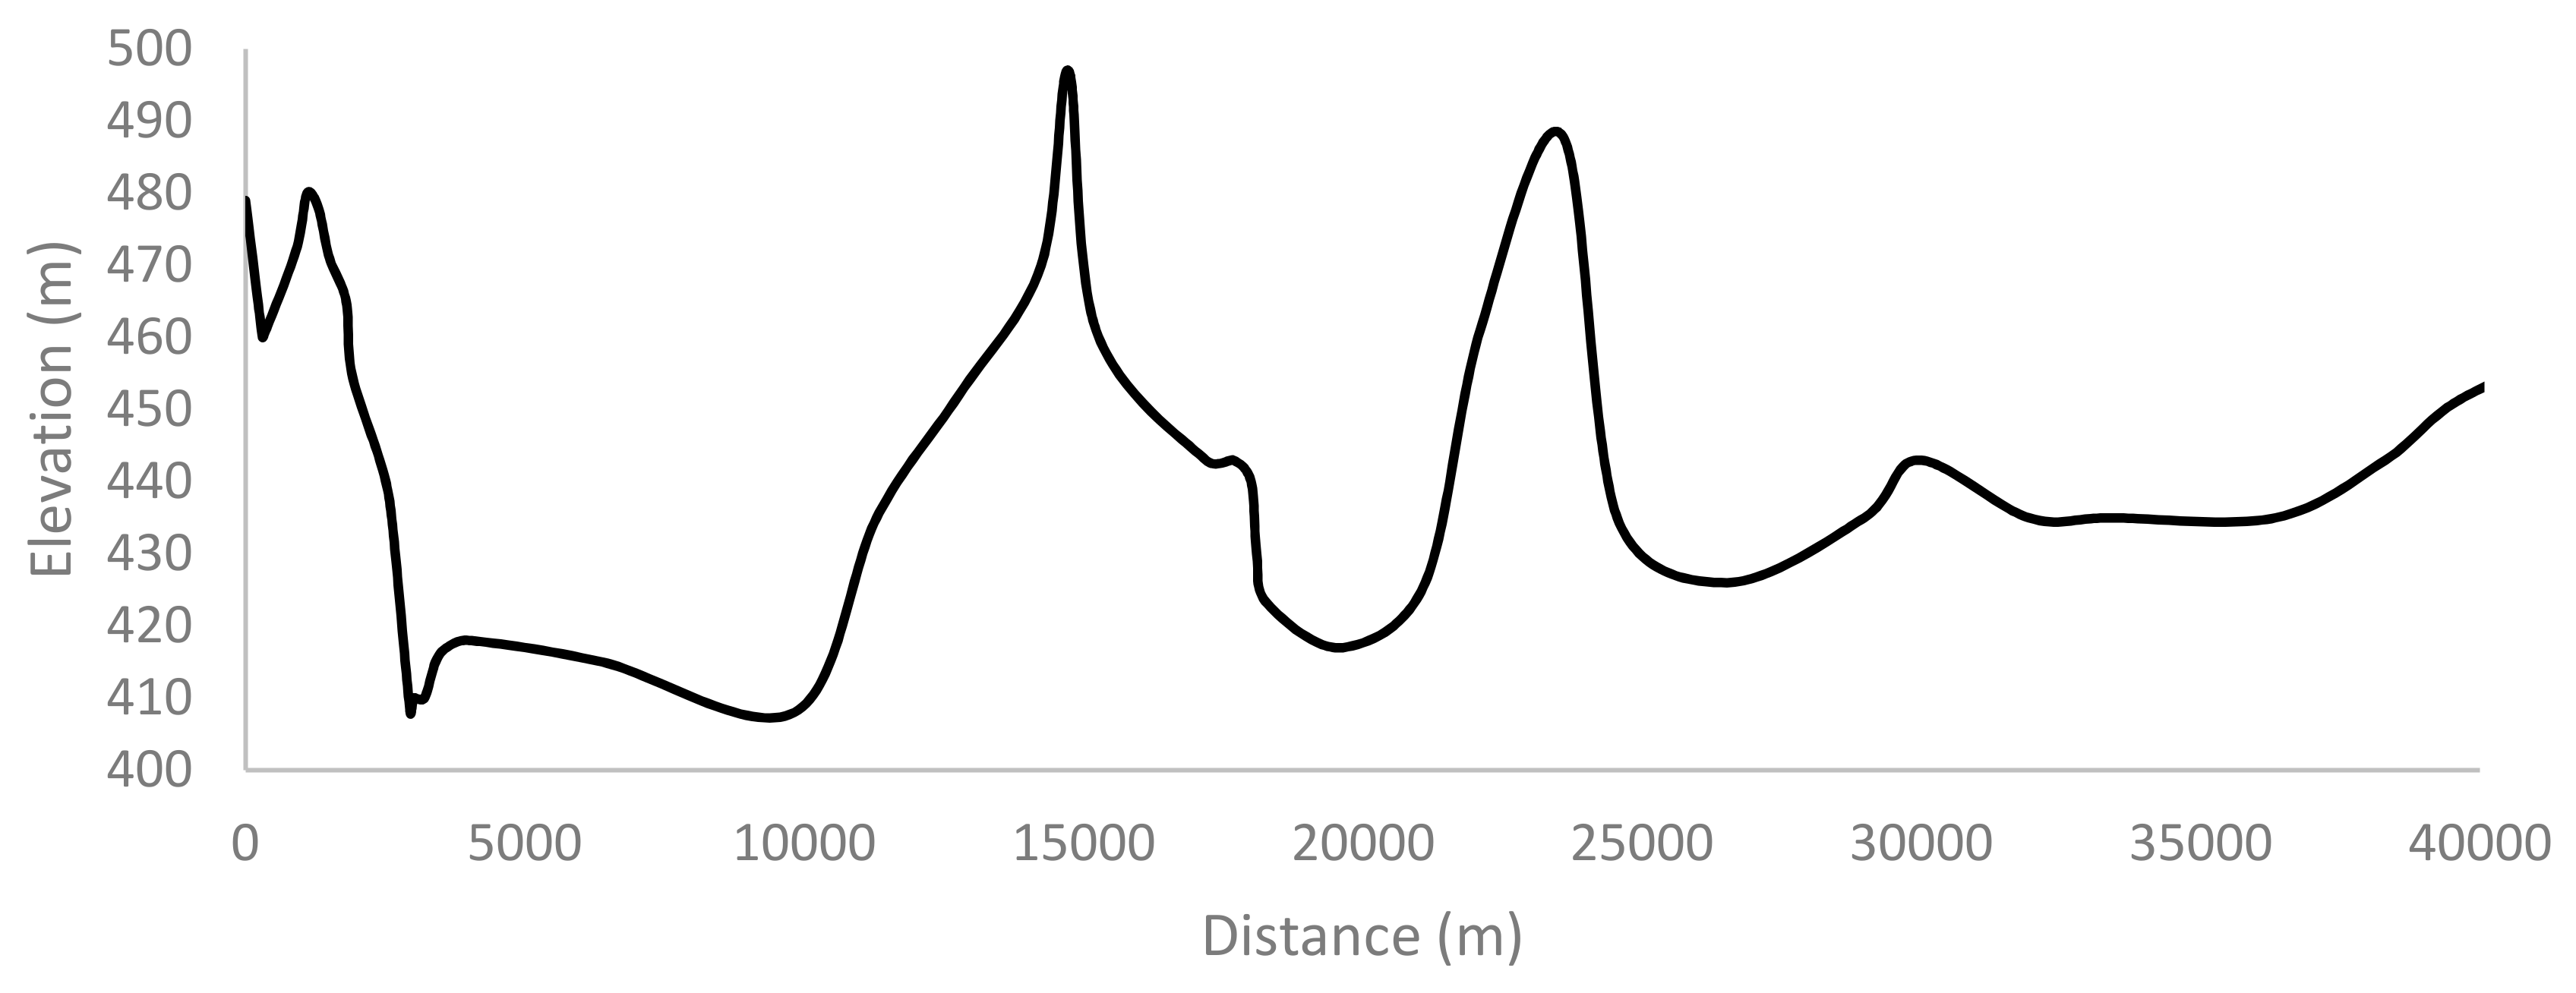
2.2. Driving Conditions

During the trip, multiple forces are applied to the car, e.g., gravity, wind drag, rolling resistance, ground reaction, and engine force.
To write the force equations, the reference illustrated in Figure 1 was used.
The above-mentioned five forces can be expressed in a single equation as follows:
F = m a m g sin α u x cos α u y m g u y C r m g cos α u x κ v v v w 2 u x
where m is the vehicle’s mass, a is the acceleration vector, α is the road’s tilt, κ is the drag force coefficient due to the wind resistance to the forward movement, v is the velocity, with subindex v for the vehicle and w for wind, and Cr is the rolling coefficient, which depends on the temperature as in:
C r , 1 = 1.9 × 10 6 T 2 2.1 × 10 4 T + 0.013 + 5.4 × 10 5 v v
Equation (11) can be applied considering the slope of the road to be constant for ascent and descent segments, and assuming the wind speed is maintained around an average value during the trip.
When tire pressure is taken into consideration, the rolling coefficient is given by:
C r , 2 = 0.005 + T o T p o 0.01 + 0.0095 v v 100 2
The results for the Cr coefficient given by Equations (12) and (13) are near to each other for the same temperature; therefore, we used the average value:
C r = C r , 1 + C r , 2 2
The drag force coefficient is given by:
κ = 1 2 ρ a S C x
where ρa is the air density, S is the front area of the vehicle, and Cx the dynamic drag coefficient.
Since Equation (11) is given in vector form, and the driving range rate is a scalar magnitude, the vector expression for the driving form must be transformed into a scalar magnitude, making use of the vector analysis; the resulting force is, therefore:
F = F x 2 + F y 2 1 / 2
where the x and y component of the driving force are given by:
F x = m a x + m g sin α C r m g cos α κ v v v w 2 F y = m a y + m g cos α m g
Thus, the driving force expression for the i-segment results in:
F i = m a x , i + m g sin α i C r , i m g cos α i κ i v v , i v w , i 2 2 + m a y , i + m g cos α i m g 2 1 / 2
Moreover, the driving range rate for the same i-segment is, therefore:
R d r , i = 3.6 F i
where the driving range rate is expressed in Wh/km, and the force in newtons.
The combined use of Equations (9), (18) and (19) gives the driving range for the specific i-segment.
D R i = 0.267 C n 1.0148 I r e f 1.0213 T r e f 0.4393 V b a t , i I D , i 1.0063 / T D 0.4393 m a x , i + m g sin α i C r , i m g cos α i κ i v v , i v w , i 2 2 + m a y , i + m g cos α i m g 2 1 / 2
To evaluate the real driving range, every partial value corresponding to an i-segment of the trip must be converted into fractional depth of discharge (DOD); the relation between depth of discharge and driving range is:
D O D i = I D , i V b a t , i t i R d r , i D R i
where ti is the running time for the i-segment.

2.3. Methodological Procedure

The calculation process of the global driving range determines every single value of the depth of discharge for the i-segment and computes the addition of all the values until the maximum DOD is reached. Considering the battery is fully charged at the beginning of the process and can be discharged until full depletion, the DOD range is 100% or in normalized values ∆DOD = 1. Therefore, the addition of all terms given by Equation (21) must fulfil the following condition:
i = 1 n I D , i V b a t , i t i R d r , i D R i = 1
To determine the partial depth of discharge corresponding to every segment of the trip, we developed a control software that follows the flowchart shown in Figure 2.
The program operates based on a set of parameters that remain constant for the whole process, such as the nominal capacity of the battery, the reference values for the battery temperature and discharge current, and the ambient temperature for the specific time of the year when the discharge process is taking place. The mass of the electric vehicle and gravity acceleration are also set parameters.
The variable inputs for the program are the battery voltage, the discharge current, and the dynamic conditions, such as the vehicle acceleration and speed, the tilt of the road, the rolling coefficient, the wind velocity, and the drag force coefficient.
Input values are taken from specific sensors that should equip the electric vehicle to obtain the required software information.
The control software runs in a loop until the depth of discharge fulfils the condition marked in the flow chart. We noticed that the limit imposed on the lowest value of the depth of discharge can be values other than one; this is because, for various reasons, the user could decide to limit the discharge of the battery to a lower value to preserve an amount of energy for other uses such as charge exchange with the grid.
Some set parameters, such the nominal capacity and the reference values of temperature and discharge current, can be obtained from the battery manufacturer, and the ambient temperature, the mass of the vehicle, and the dynamic drag coefficient can be obtained from meteorological services or the car manufacturer.
This control software can be applied to any environmental condition with only the ambient and battery temperature needing to be changed; therefore, it is very adaptive to variable weather, e.g., the seasonal evolution.

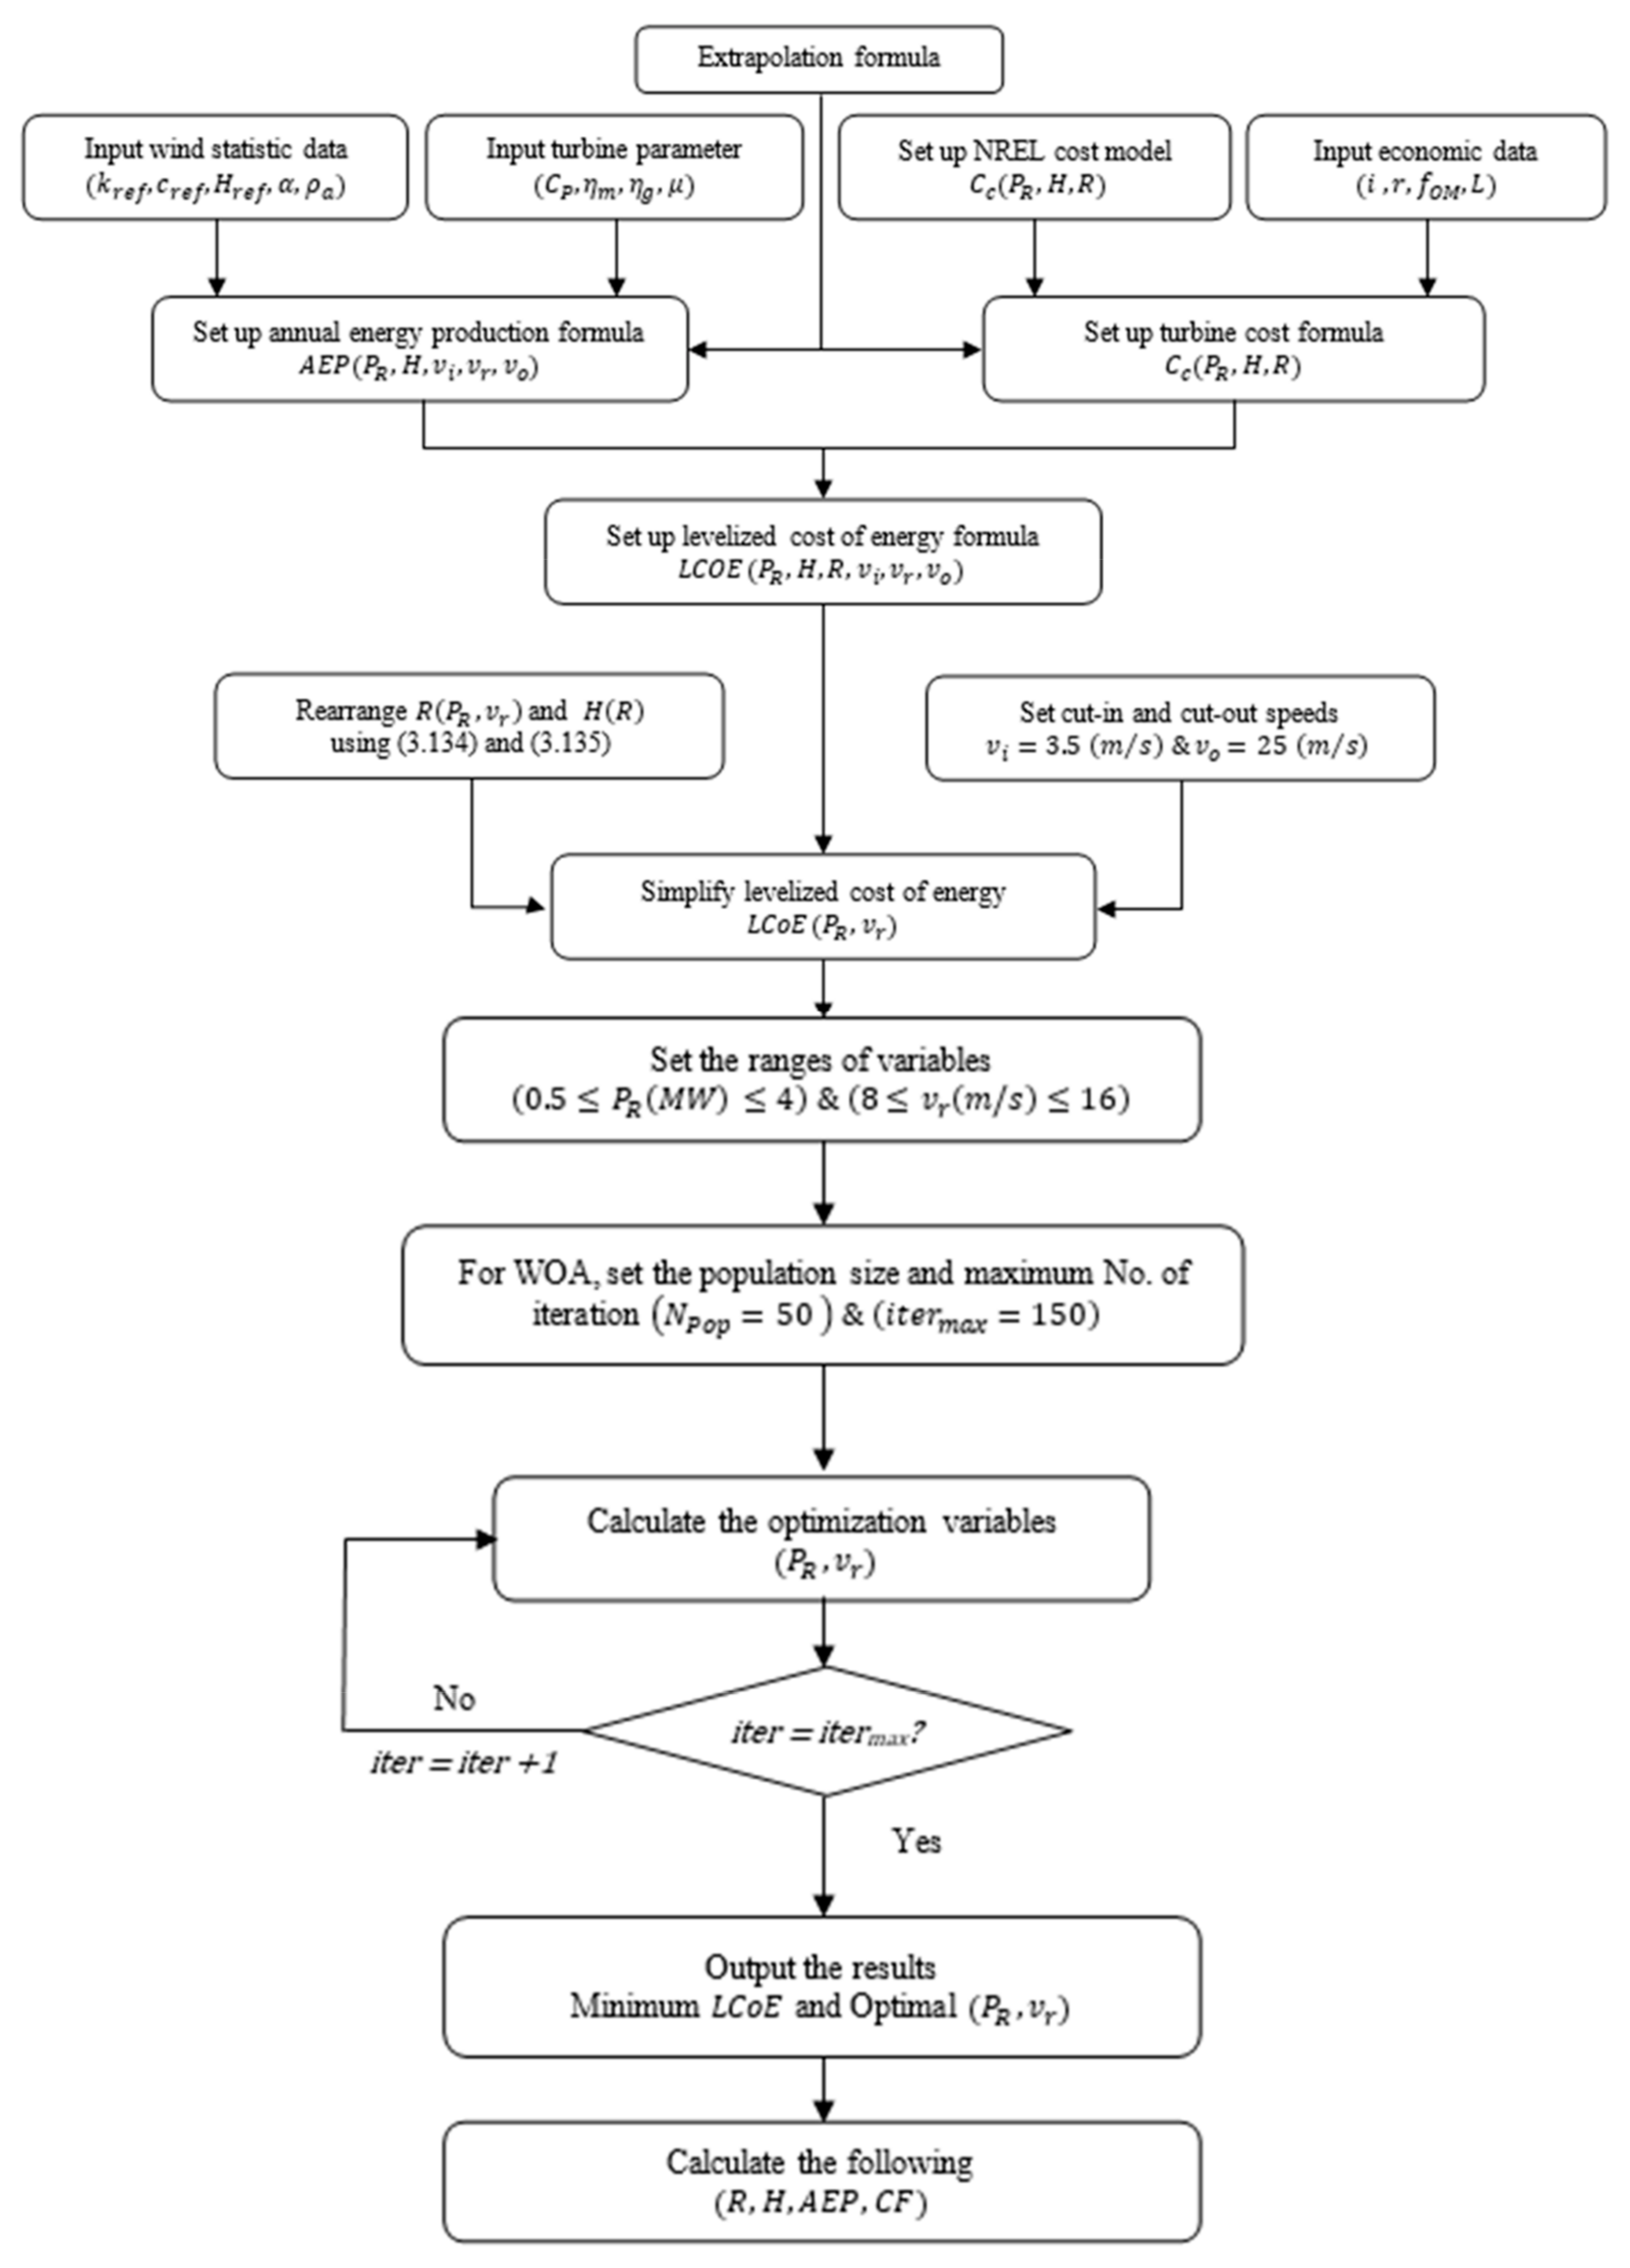
2.4. Modeling and Simulation

To evaluate the performance of the model, we designed and built a prototype model at laboratory scale, reproducing the behavior of a real electric vehicle under variable weather conditions. The electric vehicle was simulated by a variable load made up of a resistance circuit electronically controlled by a control unit. This control unit is an Arduino board Mega 2560 commanded by a program that operates with digital values between an upper and a lower value, which correspond to the minimum and maximum external load of an electric circuit (Figure 3).
The simulation process was developed for every segment of the trip, assigning a current to any segment. The current at the segment i is given by:
I i = 0.7937 255 V b a t , i ( P W M ) i
where Vbat,i is the battery voltage at the beginning of the i-segment, and PWMi is the value of the so-called pulse according to modulation provided by the Arduino board. The duration of the segments and the current value assigned to the segments were stored in the Arduino board memory. No motor was used; it was replaced by a power resistor. The value of the Arduino PWM signal cut the alimentation voltage at power resistor boundaries, the average value of which is given by:
V P R = P W M V b a t 255
where VPR accounts for the voltage of the power resistor, PWM is the pulse according to the modulation signal, between 0 and 256, and Vbat is the voltage of the battery that supplies power to the circuit.
Because there was a power resistor of 1 Ω connected to the motor controller, the current through the power resistor was proportional to the voltage of the power resistor, VPR (Figure 4). The linear dependence between current and voltage is expressed by the following relation:
I = 0.792 V
where I is the current and V is the voltage.
As a first approach, the current can be considered equal to the current delivered by the battery. The motor controller was composed of a MOSFET transistor, so it had a low current consumption. Therefore, the correct PWM signal was set regarding the alimentation voltage of the motor controller, which was the battery voltage and the value of the current stored in the Arduino memory during the segment. The motor controller was a HW-039 board composed of two BTS7980 units, which allowed us to create a high current. The Arduino board read the battery voltage and the power resistor voltage, and generated the PWM signal. The electronic circuit is shown in Figure 5.
The simulation process was run in MATLAB programming, using a temperature interval from −20 °C to 50 °C. The minimum temperature attained in the laboratory tests was 8 °C since the cooling system could not operate below 5 °C; however, the maximum temperature attained was higher than 50 °C. Therefore, the model was validated for this temperature range although it is applicable in an extended range.

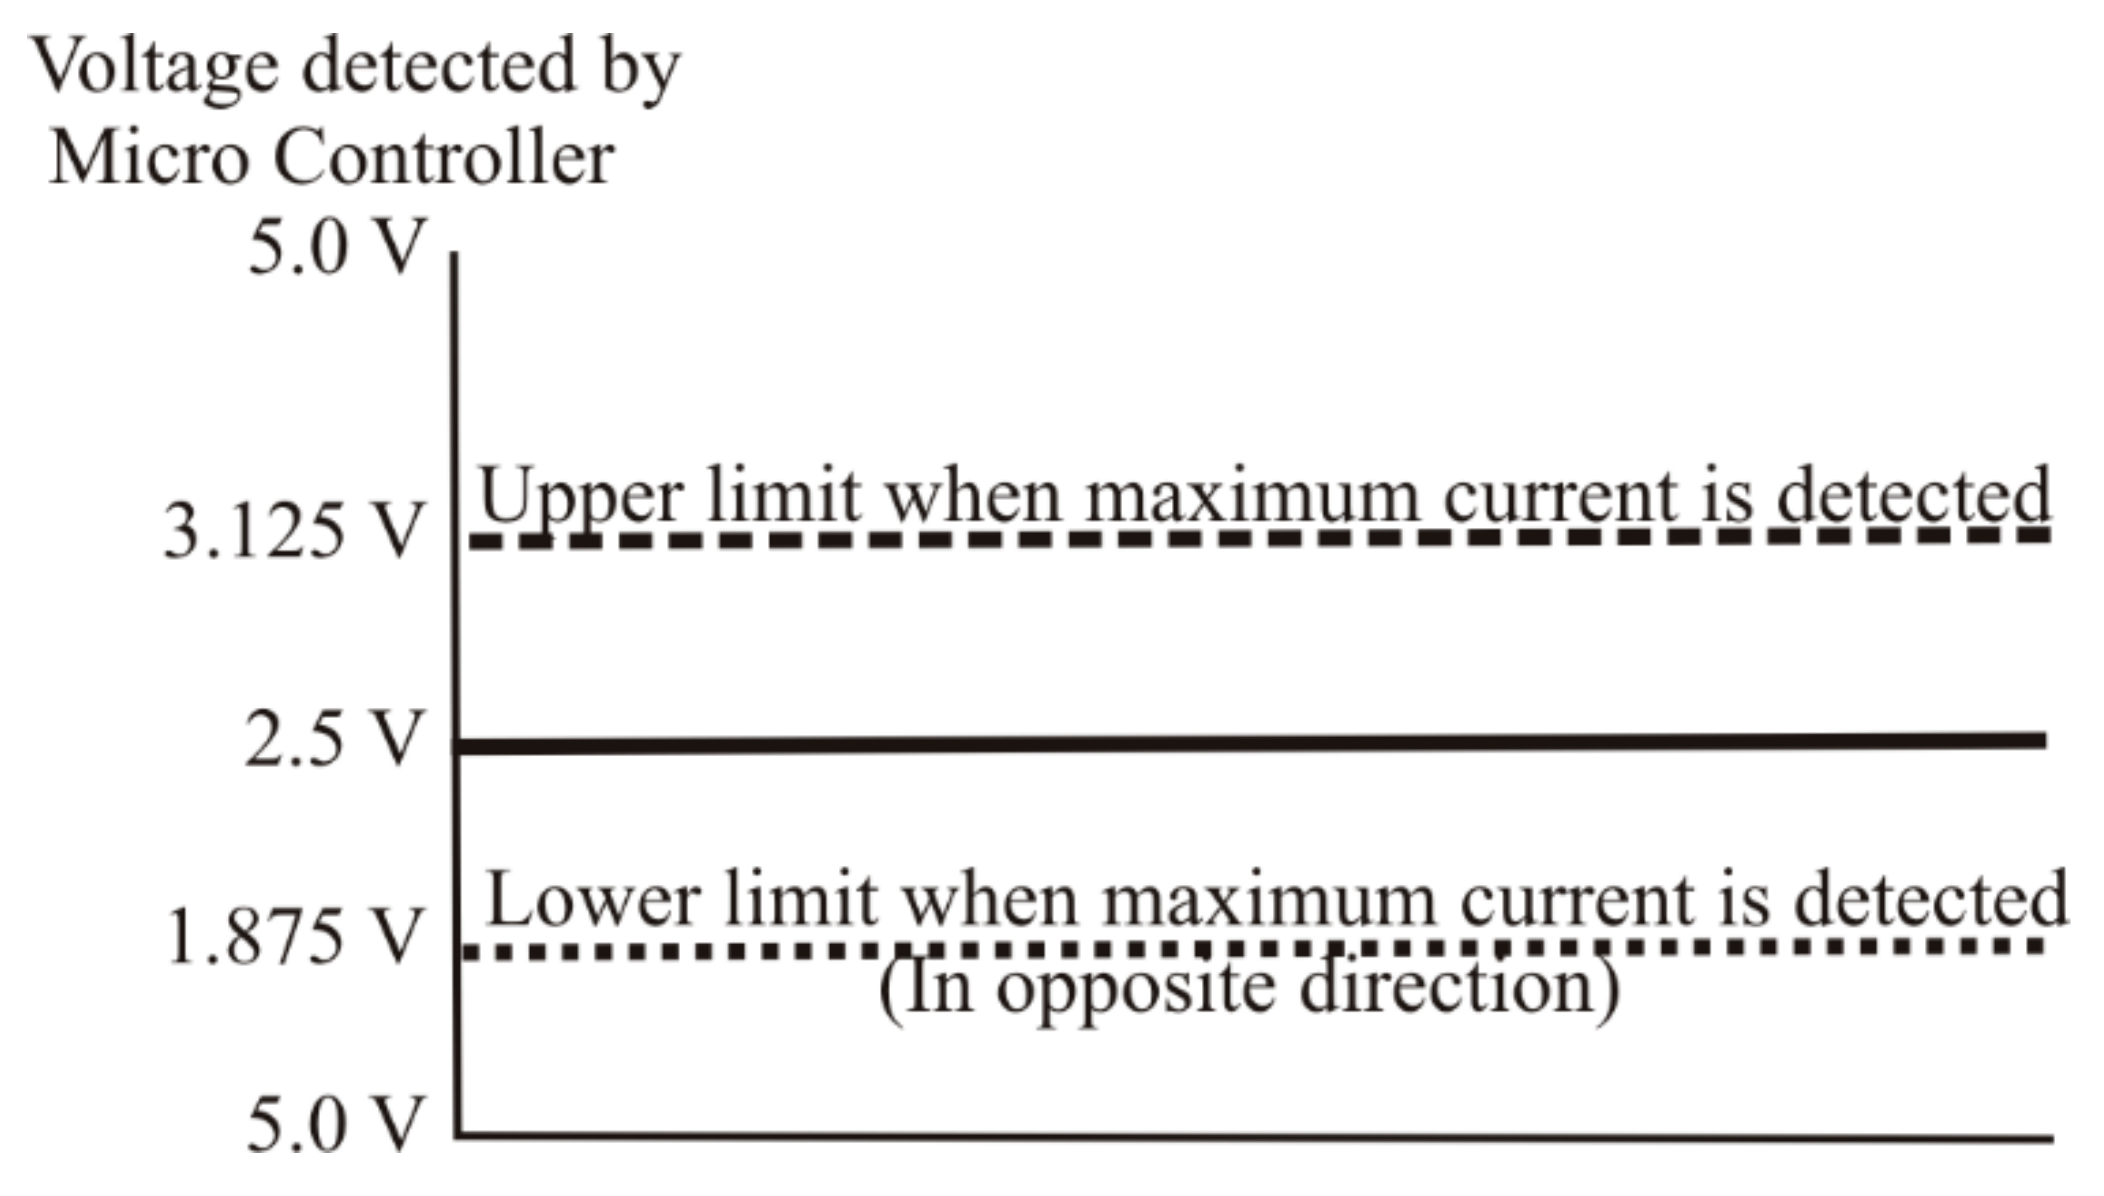
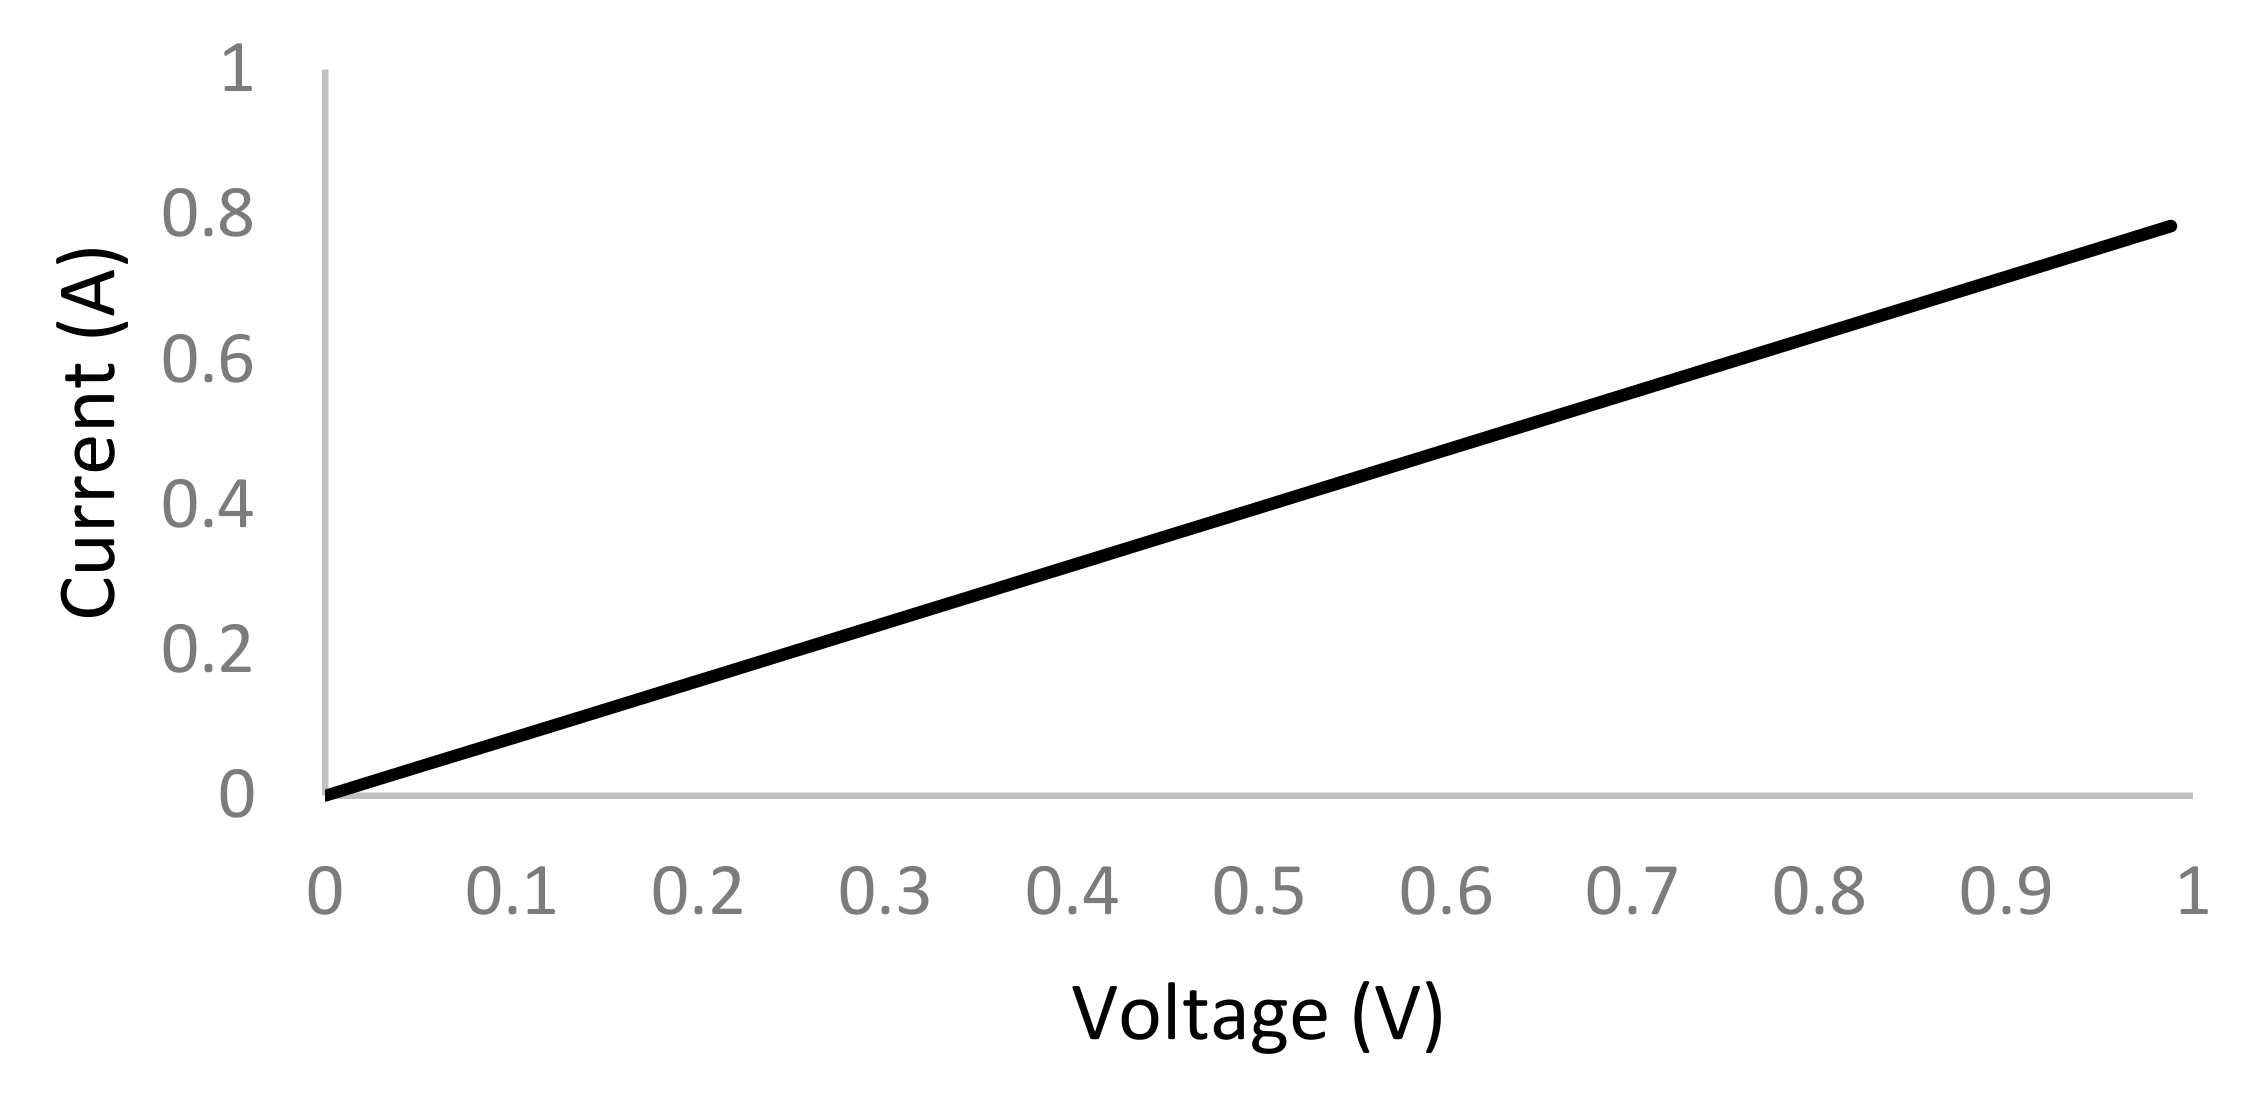
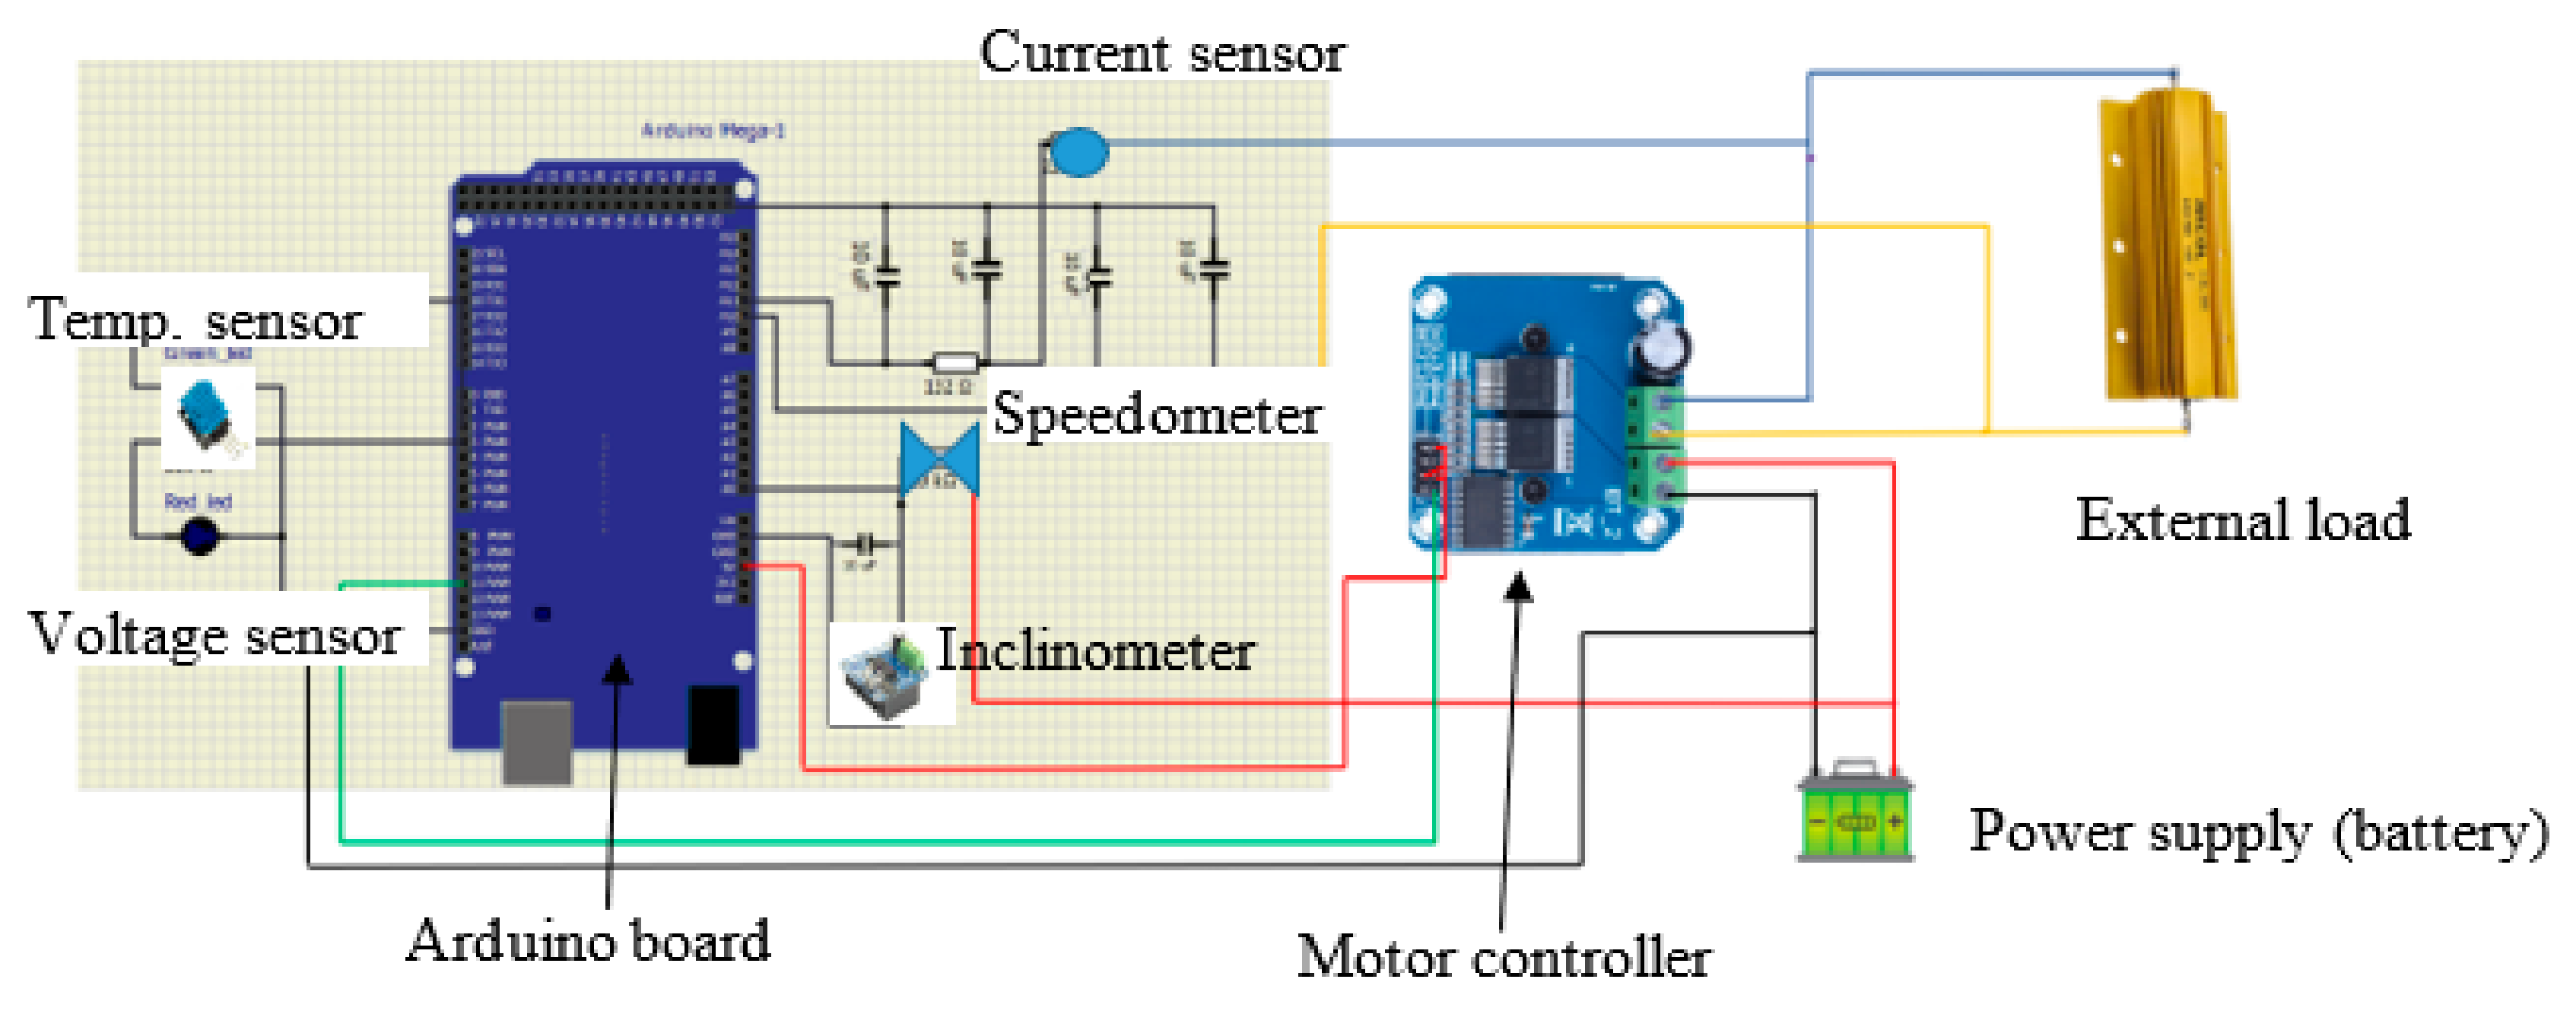
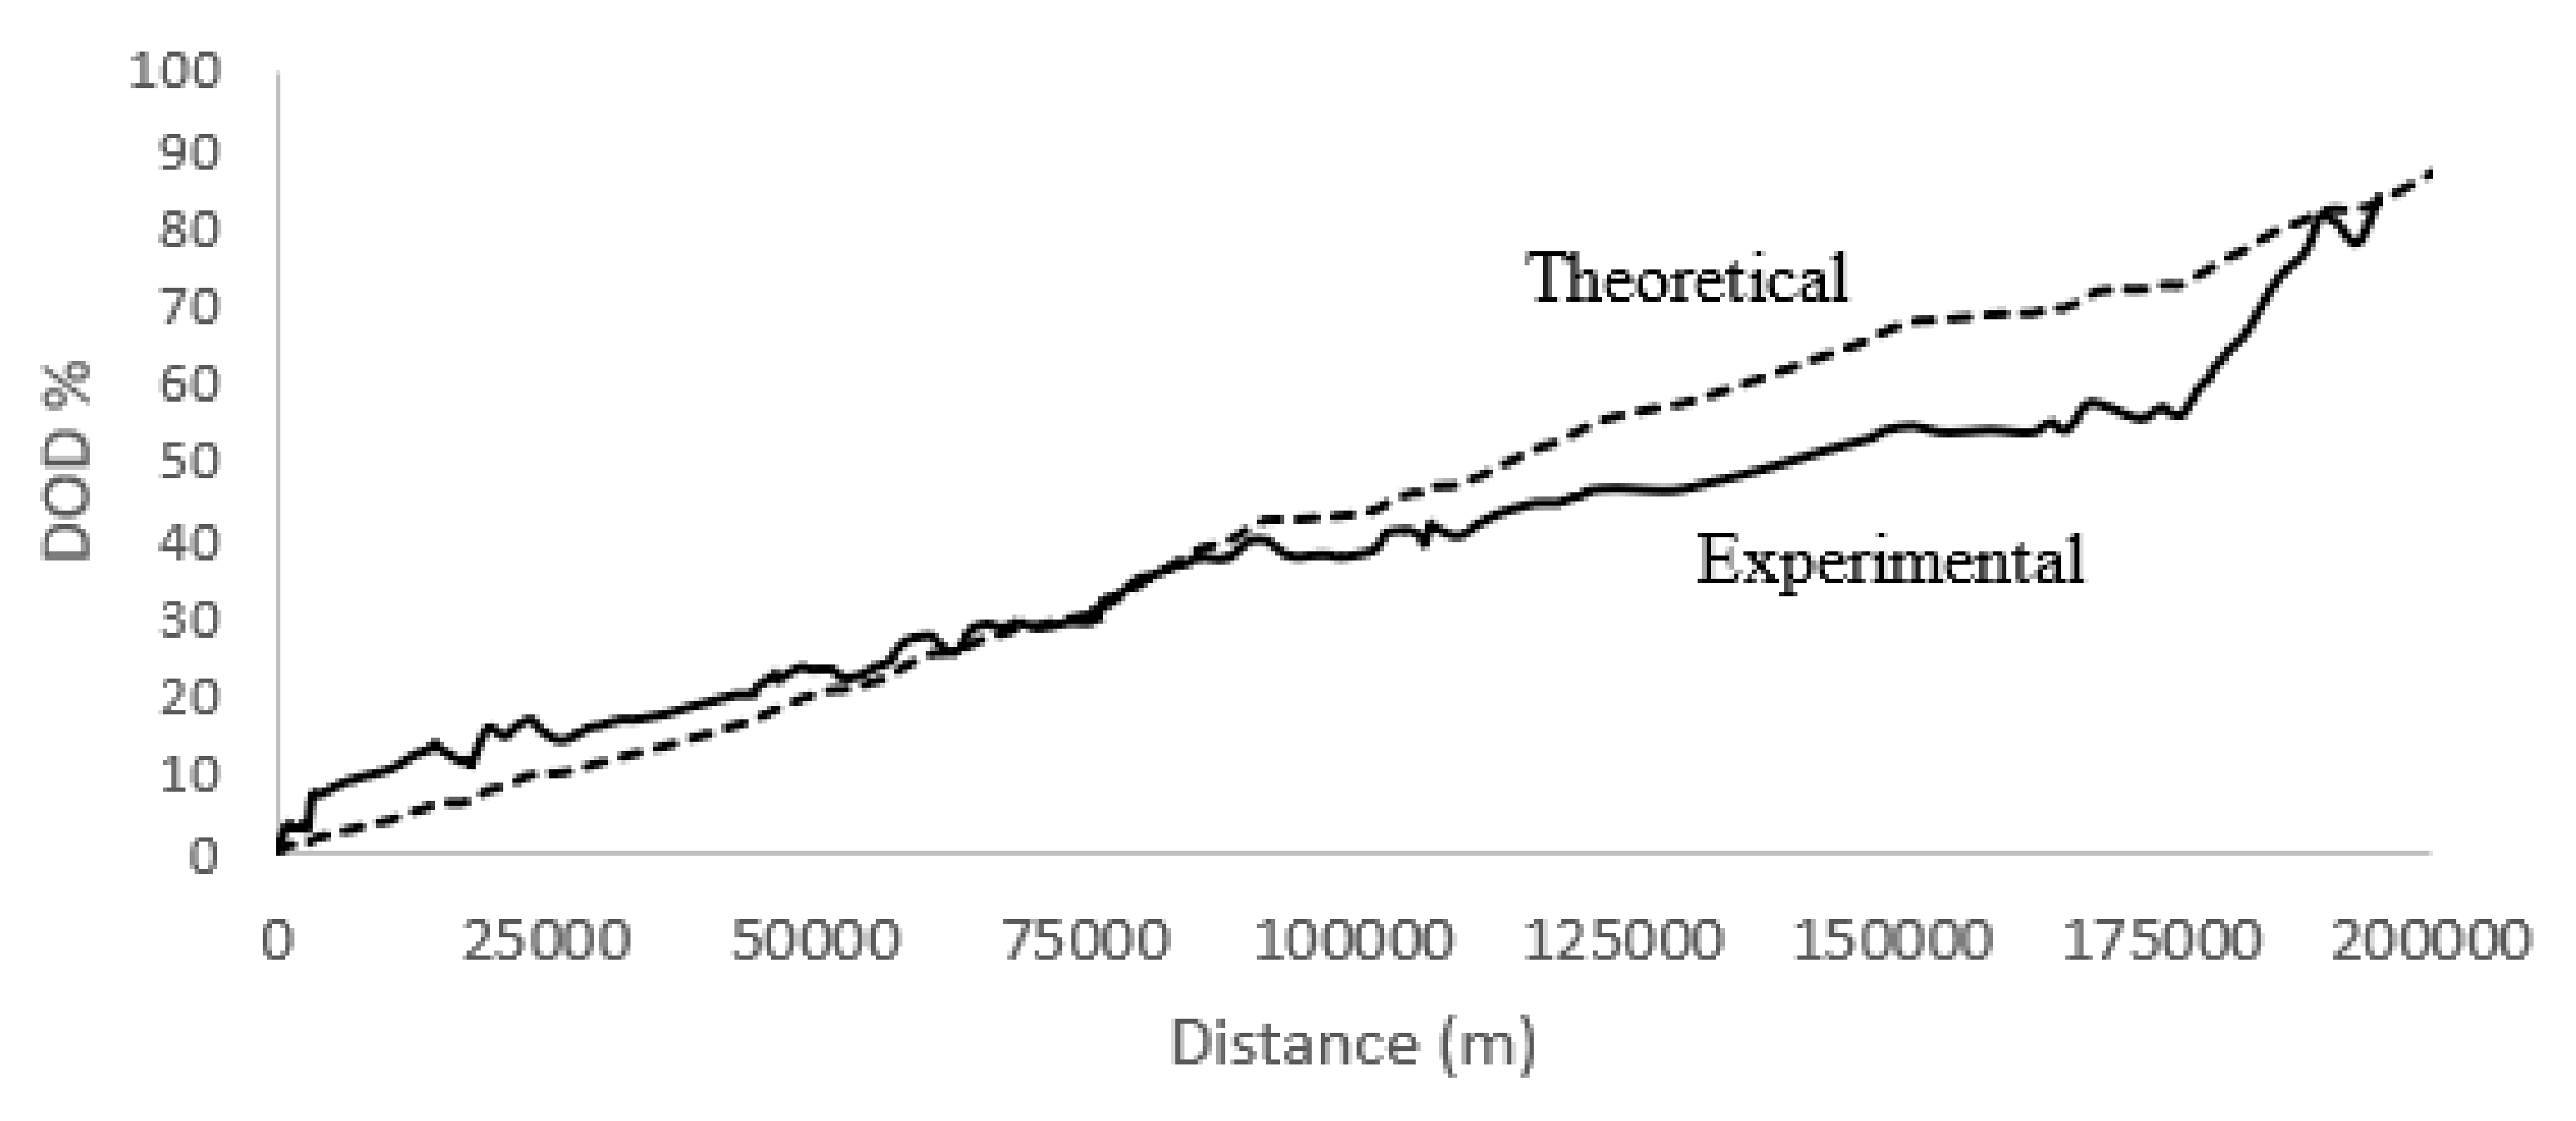
2.5. Experimental Tests

Three different tests were run at temperatures of 8 °C, 32 °C, and 50 °C to evaluate the performance of the system under variable weather conditions. The tests were intended to reproduce the evolution in the battery performance when changes in ambient temperature occur, and how these changes modified the expected driving range of the vehicle.
Changes in environmental conditions were simulated by means of a thermostatic chamber where the experimental prototype was inserted; for the hot climate simulation, the chamber was connected to a heating system made up of a commercial convection heater that blew hot air into the chamber at temperatures of up to 130 °C. If a cold climate was being reproduced, the commercial heater was replaced by an air conditioning system that was able to cool down temperature in the chamber to 5 °C.
During the tests, it was assumed that there was a thermal equilibrium between the battery and the environment, and that the thermal inertia of the battery was negligible, so it operated in a quasi-steady state for the entire test. To verify this statement, the temperature was measured in the air chamber and the battery. If the temperature differed by less than 1 °C, it was considered that thermal equilibrium was reached; otherwise, the temperature of the chamber was maintained by controlling the heater or the air conditioning unit until the condition was fulfilled.
Taking this into consideration, we were able to operate at almost any temperature, provided that the temperature fell in the operating range given by the hot and cold air in the chamber.
This study evaluated the changes in the performance of the battery, thus on the driving range of the electric vehicle, as a function of thermal gradients, which is a more representative parameter of climatic condition variations than the temperature itself. Since the experimental system attempted to be a faithful reproduction of real conditions, changes in the temperature were controlled to match real conditions, which were obtained from the local ambient temperature at the different control spots of the trip and the speed of the electric vehicle.
The simulated trip was in an urban area with an estimated standard driving range of 200 km. The global distance corresponded to a set of daily trips of equal travelled distance of 40 km, which means that the simulation corresponded to a labor week of five working days. The study was applied to different weather conditions, corresponding to periods of the year where the ambient temperature is different. In our case, we supposed the maximum and minimum ambient temperatures to be 8 °C and 48 °C, which correspond to a cold climate in winter and a very hot climate in summer. An intermediate value of temperature, 32 °C, was taken as representative for the periods of fall and spring.
The first group of tests was run for a reference temperature of 32 °C. The simulated trip was divided into 231 segments of 865 m each. The selected number of segments was the result of dividing the maximum current gap allowed by our control system, 11.5 mA, by the minimum current interval the system can detect within the accuracy of the Arduino unit, which was 50 μA.
The slope of the road was taken from the route profile provided by the geographic information system (GIS) of the zone [43]. An example of the output information generated by the GIS service is shown in Figure 6.
It can be noticed that the route profile is quite flat, with a maximum difference in altitude of around 100 m, which corresponds to a city with a moderate elevation profile.
To run the simulation, the system was submitted to different current values controlled by the Arduino program. The experimental value of the current for the i-segment is given by the expression:
I D , i = F i < v > i V b a t , i
where force F is obtained from Equation (18), <v> is the average value of the vehicle speed at the i-segment, and Vbat is the battery voltage obtained from direction measurement at the simulation electric circuit.
The results from the simulation for the case of an ambient temperature of 32 °C are presented in Figure 7.
We observed that there is a very good correlation between the theoretical values and experimental data, except for the upper values of the range when the travelled distance was higher. The deviation, however, was corrected at the end of the trip, showing a perfect match between the theoretical and experimental data.
The maximum deviation in the range from 0 to near 100 km of the travelled distance was 5% in the DOD value. The deviation increased to a maximum of 15% at 175 km, with an average value of 10% in the range from 100 km to 175 km. From this latter point on, the simulation predicted a merge of the theoretical and experimental values, which altered the previous trend.
The analysis of the simulation results show that the theoretical approach underestimated the battery depth of discharge for short travelled distances and overestimated the depth of discharge for long distances.
Until now, we have not found a reasonable explanation for this apparently anomalous behavior in the experimental evolution of the DOD, which can be attributed to the lack of linearity in the battery performance with the current produced.
Correlating both curves to a linear fitting, we obtained the following algorithms:
D O D t h = 0.0004 d 0.6466       ( R 2 = 0.9981 ) D O D exp = 0.0003 d + 5.636       ( R 2 = 0.9667 )
The correlation algorithms indicate that there was an average deviation of 3.14% in the theoretical prediction related to experimental values. The theoretical prediction underestimated the DOD value for low travelled distances, within the range 0–100 km, which represents half the distance of the driving distance, and overestimated the DOD for the second half of the driving distance.
The slope of the linear correlation for both the theoretical and experimental curves differed by 30%, which indicates the performance of the battery cannot be fairly reproduced with the theoretical simulation process. Therefore, we applied a correction factor to match theoretical and experimental values that evolves with the travelled distance according to the expression:
f = 7 × 10 31 d 6 + 5 × 10 25 d 5 1 × 10 19 d 4 + 2 × 10 14 d 3 1 × 10 9 d 2 + 5 × 10 5 d 0.0478
The application of this factor to the theoretical predictions makes them match with the experimental values to within 99.88%.
Tests were also run for ambient temperatures of 8 °C and 50 °C. The results from the three simulations are shown in Figure 8, where the correction factor given in Equation (28) was applied.
The theoretical approach is represented by a solid line, while the experimental simulation values are drawn in dotted lines.
It can be noticed that in any of the three simulated situations, the battery was completely discharged, with final DOD values of 88.8%, 68.9%, and 55.7% for the temperatures of 8 °C, 32 °C, and 50 °C, respectively.
We observed that there is a very good correlation between the theoretical approach and experimental results for the three cases, with accuracies of 95.8%, 98.9%, and 99.5% for the temperature curves of 8 °C, 32 °C, and 50 °C, respectively. The higher deviation in the case of the lowest temperature was attributed to the thermal gains of the thermostatic chamber where battery was placed for the tests, since the chamber was operated in environmental conditions near 30 °C.
The analysis of results from the simulation, represented in Figure 8, shows that the DOD of the battery increased as the temperature lowered for the same driving distance. In the case of 32 °C and 50 °C, up to 50 km, there was no difference in the DOD value related to the driving distance, which means that, for short driving distances, the battery behavior was the same for temperatures of 30 °C and higher. Since we associated the temperature of 32 °C to late spring or early and late summer, and 50 °C for the bulk of the summer, the battery behavior remained almost constant from these periods of the year. On the contrary, from late fall, winter, and early spring, the DOD evolved much quicker.
Translating the values from Figure 8 to the global driving distance in the fully discharged state of the battery, we obtained the following results (Table 1):
Correlating the driving distance and ambient temperature, we obtained a linear correlation of the type:
D R = 3.1693 T + 196.49
where T is the ambient temperature, in Celsius.
The above correlation shows a regression coefficient of R2 = 0.9901.
Equation (29) gives us the chance to estimate the global driving range at any ambient temperature, which represents a very powerful tool, not only for the verification and control centers, but also for car manufacturers and drivers. Figure 9 shows the simulation of the estimated driving range with the ambient temperature.
Considering a standard reference of 275 km, which corresponds to an ambient temperature of 25 °C, the ratio of the driving distance at any ambient temperature is shown in Figure 10. The ratio corresponds to the next linear regression:
r D R = 0.0115 T + 0.7126       ( R 2 = 0.9989 )
Applying Equation (30) to the tested temperatures, we obtained a ratio of 0.805, 1.080, and 1.287 for the ambient temperature case of 8 °C, 32 °C, and 50 °C, respectively.
The analysis of the results shows that the driving distance was improved with the increasing temperature by up to 28.7% for very hot weather (summer), and it decreased if the temperature decreased, down to 20% for very cold zones (−30 °C).

3. Conclusions

A study to determine the influence of ambient temperature on the performance of the battery of electric vehicles was developed. The study was modelled using a simulation process that reproduces the real performance of the battery with a variable ambient temperature.
The simulation was developed based on the analysis of the performance of the battery when powering an electric vehicle submitted to dynamic operating conditions. The simulation determines the value of the depth of discharge (DOD) of the battery and converts it into driving range. The simulation process was run for different temperatures to determine the evolution of the global driving range of the electric vehicle with the ambient temperature.
A theoretical approach was developed to be applied in the simulation process; the theoretical approach results were compared to the experimental data obtained from tests run under identical dynamic and thermal conditions. The theoretical approach and experimental values were correlated to determine the accuracy of the theoretical predictions. The observed deviation was corrected through a polynomial function that produced a perfect match between the theoretical approach and experimental tests.
The estimated driving range was obtained as a function of the ambient temperature for three testing temperatures, 8 °C, 32 °C, and 50 °C, which were associated to cold, semi-warm, and hot ambient conditions. The three temperatures can be identified as representative of different seasons of the year in a specific geographical area. The results from the correlation between the theoretical approach results, modified by the correction factor, and the experimental tests show a very high accuracy, i.e., higher than 98% on average.
A linear dependence of the global driving range and ambient temperature was found. The linear function allows control centers, car manufacturers, and users to estimate the real driving range as a function of the ambient temperature. The linear dependence shows a very high accuracy factor, i.e., near 99.9%.
The global driving range of the electric vehicle was improved with the increasing temperature, but decreased when the temperature decreased. A ratio between the estimated driving range and the standard distance for the reference temperature was obtained. The ratio shows that the driving range can be increased by up to 29% for very hot ambient conditions, i.e., near 50 °C, and decrease to 20% for very cold ambient conditions.
The comparative analysis of the driving range for different temperatures shows that there was a reduction of about 18% for the low range of ambient temperatures, i.e., between −15 °C and 5 °C, while for medium temperatures, i.e., between 5 °C and 25 °C, the reduction in the driving range was only 4.6%. Finally, the tests demonstrated that for a reduction in high temperatures from 25 °C to 35 °C, the driving range was only reduced by about 0.4%.

Author Contributions

Conceptualization: C.A.-D.; Methodology: C.A.-D. and B.G.; Software: B.G.; Validation: C.A.-D. and B.G.; Formal analysis: C.A.-D. and B.G.; Investigation: B.G.; Resources: C.A.-D. and B.G.; Data curation: B.G.; Writing-original draft: C.A.-D.; Preparation: C.A.-D.; Writing review and editing: C.A.-D.; Visualization: C.A.-D.; Supervision: C.A.-D.; Project administration: C.A.-D. All authors have read and agreed to the published version of the manuscript.

Funding

This research received no external funding.

Institutional Review Board Statement

Not applicable.

Informed Consent Statement

Not applicable.

Data Availability Statement

The data presented in this study are available on request from the corresponding author.

Conflicts of Interest

The authors declare no conflict of interest.

Abbreviations

Symbols
αRoad slope angle
CjCapacity of the battery at the current state
CnNominal capacity of the battery
CrRolling coefficient
CTReal capacity of the battery at a temperature T
CxDynamic drag coefficient
dDistance
ξEnergy
FForce
fCBattery capacity correction factor
ICurrent
IDDischarge current
IrefReference discharge current
κDrag force coefficient
mMass of the vehicle
PtPower
poPressure of tires
RdrDriving range rate of the electric vehicle for standard conditions
ρaAir density
SFront area of the vehicle
TDTemperature at the discharge
TrefTemperature of reference
tTime
tDTime of discharge
VVoltage
VbatBattery voltage
VPRvoltage of the power resistor
vvVehicle speed
vwWind velocity
Abbreviations
BTSBridge Transmission System
DODDepth of Discharge
DRDriving Range
ECEuropean Commission
ECMSEquivalent Consumption Minimization Strategy
EVElectric Vehicle
GISGeographical Information System
HEVHybrid Electric Vehicle
MPCModel Predictive Control
PHEVPlug-in Hybrid Electric Vehicle
PWMPulse Wave (Signal) Modulation

References

  1. Rietmann, N.; Lieven, T. A comparison of policy measures promoting electric vehicles in 20 countries. In The Governance of Smart Transportation Systems; Springer: Cham, Germany, 2019; pp. 125–145. [Google Scholar]
  2. Kester, J.; Noel, L.; de Rubens, G.Z.; Sovacool, B.K. Policy mechanisms to accelerate electric vehicle adoption: A qualitative review from the Nordic region. Renew. Sustain. Energy Rev. 2018, 94, 719–731. [Google Scholar] [CrossRef]
  3. Knez, M.; Obrecht, M. Policies for Promotion of Electric Vehicles and Factors Influencing Consumers’ Purchasing Decisions of Low Emission Vehicles. J. Sustain. Dev. Energy, Water Environ. Syst. 2017, 5, 151–162. [Google Scholar] [CrossRef]
  4. Mačiulis, P.; Konstantinavičiutė, I.; Pilinkienė, V. Assessment of electric vehicles promotion measures at the national and local administrative levels. Eng. Econ. 2018, 29, 434–445. [Google Scholar] [CrossRef]
  5. He, H.; Jin, L.; Cui, H.; Zhou, H. Assessment of Electric Car Promotion Policies in Chinese Cities. International Council on Clean Transportation. 2018, pp. 1–49. Available online: https://theicct.org/sites/default/files/publications/China_city_NEV_assessment_20181018.pdf (accessed on 20 January 2023).
  6. Petrauskiene, K.; Dvarioniene, J.; Kaveckis, G.; Kliaugaite, D.; Chenadec, J.; Hehn, L.; Pérez, B.; Bordi, C.; Scavino, G.; Vignoli, A.; et al. Situation Analysis of Policies for Electric Mobility Development: Experience from Five European Regions. Sustainability 2020, 12, 2935. [Google Scholar] [CrossRef]
  7. Ercan, T.; Onat, N.C.; Keya, N.; Tatari, O.; Eluru, N.; Kucukvar, M. Autonomous electric vehicles can reduce carbon emissions and air pollution in cities. Transp. Res. Part D Transp. Environ. 2022, 112, 103472. [Google Scholar] [CrossRef]
  8. Wolfram, P.; Lutsey, N. Electric Vehicles: Literature Review of Technology Costs and Carbon Emissions; The International Council on Clean Transportation: Washington, DC, USA, 2016; pp. 1–23. [Google Scholar]
  9. Märtz, A.; Plötz, P.; Jochem, P. Global perspective on CO2 emissions of electric vehicles. Environ. Res. Lett. 2021, 16, 054043. [Google Scholar] [CrossRef]
  10. Fuinhas, J.A.; Koengkan, M.; Leitão, N.C.; Nwani, C.; Uzuner, G.; Dehdar, F.; Relva, S.; Peyerl, D. Effect of Battery Electric Vehicles on Greenhouse Gas Emissions in 29 European Union Countries. Sustainability 2021, 13, 3611. [Google Scholar] [CrossRef]
  11. Noshadravan, A.; Cheah, L.; Roth, R.; Freire, F.; Dias, L.; Gregory, J. Stochastic comparative assessment of life-cycle greenhouse gas emissions from conventional and electric vehicles. Int. J. Life Cycle Assess. 2015, 20, 854–864. [Google Scholar] [CrossRef]
  12. Leard, B.; McConnell, V. Progress and Potential for Electric Vehicles to Reduce Carbon Emissions. Resources for the Future (RFF) Report. 2020, pp. 20–24. Available online: https://www.rff.org/publications/reports/potential-role-and-impact-evs-us-decarbonization-strategies/ (accessed on 20 January 2023).
  13. Koengkan, M.; Fuinhas, J.A.; Teixeira, M.; Kazemzadeh, E.; Auza, A.; Dehdar, F.; Osmani, F. The Capacity of Battery-Electric and Plug-in Hybrid Electric Vehicles to Mitigate CO2 Emissions: Macroeconomic Evidence from European Union Countries. World Electr. Veh. J. 2022, 13, 58. [Google Scholar] [CrossRef]
  14. Teixeira, A.C.R.; Sodré, J.R. Impacts of replacement of engine powered vehicles by electric vehicles on energy consumption and CO2 emissions. Transp. Res. Part D Transp. Environ. 2018, 59, 375–384. [Google Scholar] [CrossRef]
  15. Petrović, Đ.T.; Pešić, D.R.; Petrović, M.M.; Mijailović, R. Electric cars: Are they solution to reduce CO2 emission? Therm. Sci. 2020, 24 Pt A, 2879–2889. [Google Scholar]
  16. Ziefle, M.; Beul-Leusmann, S.; Kasugai, K.; Schwalm, M. Public Perception and Acceptance of Electric Vehicles: Exploring Users’ Perceived Benefits and Drawbacks. In International Conference of Design, User Experience, and Usability; Springer: Cham, Switzerland, 2014; pp. 628–639. [Google Scholar]
  17. Schlüter, J.; Weyer, J. Car sharing as a means to raise acceptance of electric vehicles: An empirical study on regime change in automobility. Transp. Res. Part F Traffic Psychol. Behav. 2019, 60, 185–201. [Google Scholar] [CrossRef]
  18. Murugan, M.; Marisamynathan, S.; Panjwani, T. Investigating the Influencing Factors to Adopt Public Electric Vehicle Charging Facility at Existing Fueling Station: A Study Based on Users Perceptive. In Recent Advances in Transportation Systems Engineering and Management; Springer: Singapore, 2023; pp. 851–868. [Google Scholar]
  19. Pareek, S.; Sujil, A.; Ratra, S.; Kumar, R. Electric vehicle charging station Challenges and opportunities: A future perspective. In Proceedings of the 2020 International Conference on Emerging Trends in Communication, Control and Computing (ICONC3), Sikar, India, 21–22 February 2020; IEEE: New York, NY, USA, 2020; pp. 1–6. [Google Scholar]
  20. Martínez-Lao, J.; Montoya, F.G.; Montoya, M.G.; Manzano-Agugliaro, F. Electric vehicles in Spain: An overview of charging systems. Renew. Sustain. Energy Rev. 2017, 77, 970–983. [Google Scholar] [CrossRef]
  21. Mruzek, M.; Gajdáč, I.; Kučera, Ľ.; Barta, D. Analysis of Parameters Influencing Electric Vehicle Range. Procedia Eng. 2016, 134, 165–174. [Google Scholar] [CrossRef]
  22. Baek, D.; Chen, Y.; Bocca, A.; Bottaccioli, L.; Di Cataldo, S.; Gatteschi, V.; Pagliari, D.J.; Patti, E.; Urgese, G.; Chang, N.; et al. Battery-Aware Operation Range Estimation for Terrestrial and Aerial Electric Vehicles. IEEE Trans. Veh. Technol. 2019, 68, 5471–5482. [Google Scholar] [CrossRef]
  23. Lu, R.; Yang, A.; Xue, Y.; Xu, L.; Zhu, C. Analysis of the key factors affecting the energy efficiency of batteries in electric vehicle. World Electr. Veh. J. 2010, 4, 9–13. [Google Scholar] [CrossRef]
  24. Du, J.; Chen, J.; Song, Z.; Gao, M.; Ouyang, M. Design method of a power management strategy for variable battery capacities range-extended electric vehicles to improve energy efficiency and cost-effectiveness. Energy 2017, 121, 32–42. [Google Scholar] [CrossRef]
  25. Gerssen-Gondelach, S.J.; Faaij, A.P. Performance of batteries for electric vehicles on short and longer term. J. Power Sources 2012, 212, 111–129. [Google Scholar] [CrossRef]
  26. Wang, K.; Wang, S.; Liu, J.; Guo, Y.; Mao, F.; Wu, H.; Zhang, Q. Fe-Based Coordination Polymers as Battery-Type Electrodes in Semi-Solid-State Battery–Supercapacitor Hybrid Devices. ACS Appl. Mater. Interfaces 2021, 13, 15315–15323. [Google Scholar] [CrossRef]
  27. Armenta-Déu, C.; Jach, Q. Battery/Supercapacitor Hybrid System for Electric Vehicles. J. Automob. Eng. Appl. 2022, 9, 20–42. [Google Scholar]
  28. Onori, S.; Serrao, L.; Rizzoni, G. Adaptive Equivalent Consumption Minimization Strategy for Hybrid Electric Vehicles. In Proceedings of the ASME 2010 Dynamic Systems and Control Conference, Cambridge, MA, USA, 12–15 September 2010; Volume 2, pp. 499–505. [Google Scholar]
  29. Tulpule, P.; Marano, V.; Rizzoni, G. Energy management for plug-in hybrid electric vehicles using equivalent consumption minimisation strategy. Int. J. Electr. Hybrid Veh. 2010, 2, 329. [Google Scholar] [CrossRef]
  30. Jalali, M.; Hashemi, E.; Khajepour, A.; Chen, S.-K.; Litkouhi, B. Integrated model predictive control and velocity estimation of electric vehicles. Mechatronics 2017, 46, 84–100. [Google Scholar] [CrossRef]
  31. Zhang, S.; Xiong, R.; Sun, F. Model predictive control for power management in a plug-in hybrid electric vehicle with a hybrid energy storage system. Appl. Energy 2017, 185, 1654–1662. [Google Scholar] [CrossRef]
  32. Minh, V.T.; Rashid, A.A. Modeling and model predictive control for hybrid electric vehicles. Int. J. Automot. Technol. 2012, 13, 477–485. [Google Scholar] [CrossRef]
  33. Ma, S.; Jiang, M.; Tao, P.; Song, C.; Wu, J.; Wang, J.; Deng, T.; Shang, W. Temperature effect and thermal impact in lithium-ion batteries: A review. Prog. Nat. Sci. 2018, 28, 653–666. [Google Scholar] [CrossRef]
  34. Belt, J.R.; Ho, C.D.; Miller, T.J.; Habib, M.A.; Duong, T.Q. The effect of temperature on capacity and power in cycled lithium ion batteries. J. Power Sources 2005, 142, 354–360. [Google Scholar] [CrossRef]
  35. Lu, Z.; Yu, X.; Wei, L.; Cao, F.; Zhang, L.; Meng, X.; Jin, L. A comprehensive experimental study on temperature-dependent performance of lithium-ion battery. Appl. Therm. Eng. 2019, 158, 113800. [Google Scholar] [CrossRef]
  36. Alipour, M.; Ziebert, C.; Conte, F.V.; Kizilel, R. A Review on Temperature-Dependent Electrochemical Properties, Aging, and Performance of Lithium-Ion Cells. Batteries 2020, 6, 35. [Google Scholar] [CrossRef]
  37. Liao, L.; Zuo, P.; Ma, Y.; Chen, X.; An, Y.; Gao, Y.; Yin, G. Effects of temperature on charge/discharge behaviors of LiFePO4 cathode for Li-ion batteries. Electrochim. Acta 2012, 60, 269–273. [Google Scholar] [CrossRef]
  38. Karimi, G.; Li, X. Thermal management of lithium-ion batteries for electric vehicles. Int. J. Energy Res. 2013, 37, 13–24. [Google Scholar] [CrossRef]
  39. Zhang, X.; Li, Z.; Luo, L.; Fan, Y.; Du, Z. A review on thermal management of lithium-ion batteries for electric vehicles. Energy 2022, 238, 121652. [Google Scholar] [CrossRef]
  40. Yuksel, T.; Michalek, J.J. Effects of Regional Temperature on Electric Vehicle Efficiency, Range, and Emissions in the United States. Environ. Sci. Technol. 2015, 49, 3974–3980. [Google Scholar] [CrossRef] [PubMed]
  41. Armenta-Deu, C.; Carriquiry, J.P.; Guzmán, S. Capacity correction factor for Li-ion batteries: Influence of the discharge rate. J. Energy Storage 2019, 25, 839. [Google Scholar] [CrossRef]
  42. Hausmann, A.; Depcik, C. Expanding the Peukert equation for battery capacity modeling through inclusion of a temperature dependency. J. Power Sources 2013, 235, 148–158. [Google Scholar] [CrossRef]
  43. Alhamadani, O. Road Path Selection Using Geographic Information System GIS. Univ. Baghdad Eng. J. 2006, 12, 295–303. [Google Scholar]
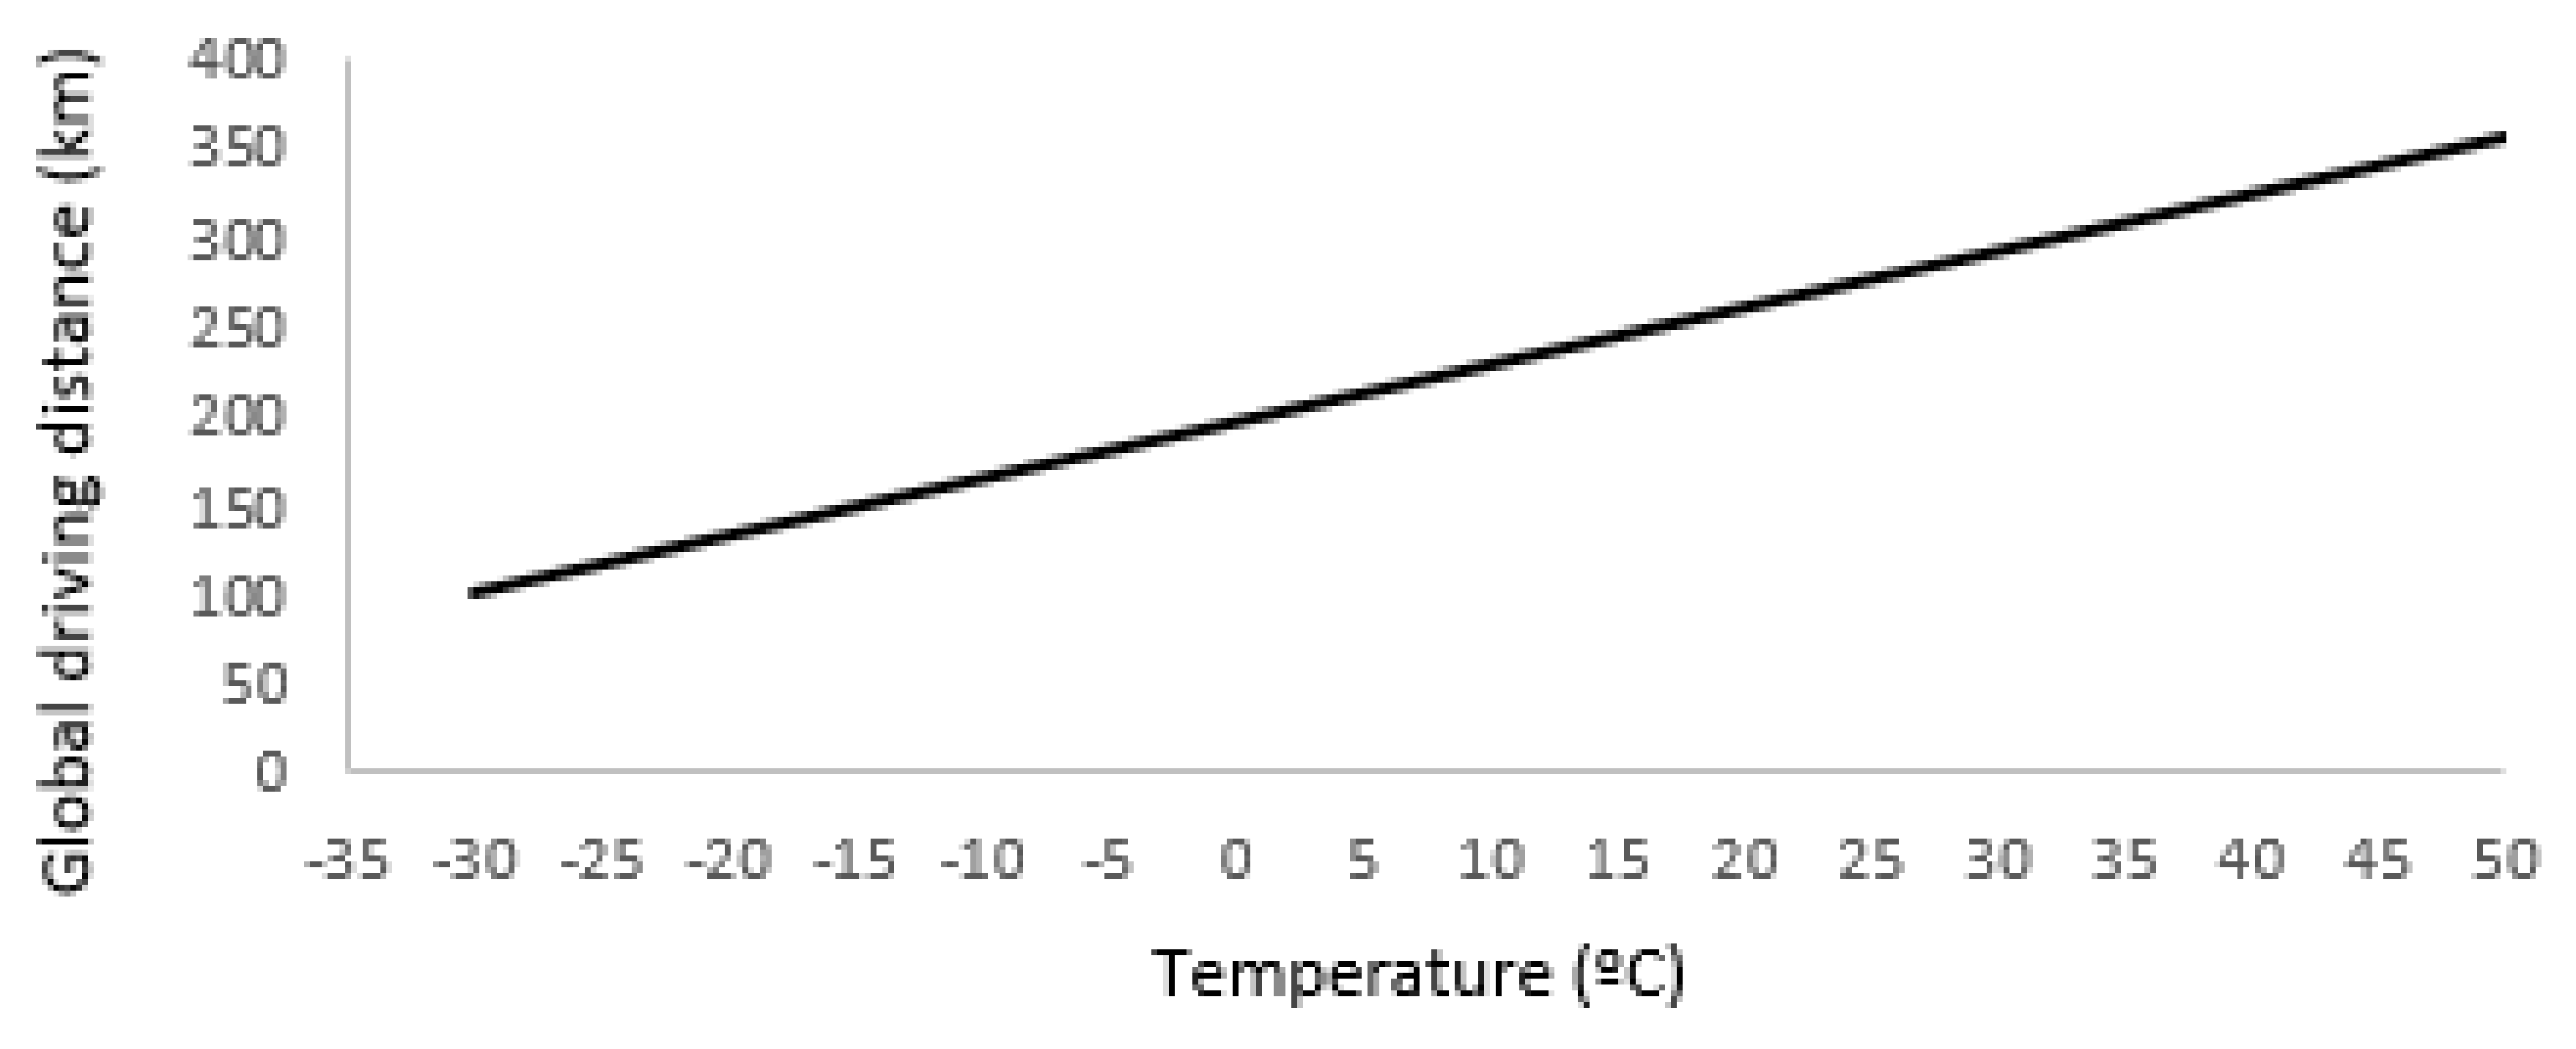
Figure 1. Schematic of the reference used to calculate forces.
Futuretransp 03 00037 g001
Figure 2. Flow chart of the control software.
Futuretransp 03 00037 g002
Figure 3. Schematic view of the microcontroller operation.
Futuretransp 03 00037 g003
Figure 4. Relation between current and voltage at the motor controller.
Futuretransp 03 00037 g004
Figure 5. Layout of the experimental simulator.
Futuretransp 03 00037 g005
Figure 6. Elevation profile with travelled distance.
Futuretransp 03 00037 g006
Figure 7. Simulation results of battery performance for Tamb = 32 °C.
Futuretransp 03 00037 g007
Figure 8. Evolution of DOD of the electric vehicle battery with driving distance.
Futuretransp 03 00037 g008
Figure 9. Estimated global driving range vs. ambient temperature (simulated values).
Futuretransp 03 00037 g009
Figure 10. Ratio of global driving range as a function of ambient temperature.
Futuretransp 03 00037 g010
Table 1. Global driving distance as a function of ambient temperature.
Temperature (°C)83250
Driving distance (km)225.1290.2359.4
Disclaimer/Publisher’s Note: The statements, opinions and data contained in all publications are solely those of the individual author(s) and contributor(s) and not of MDPI and/or the editor(s). MDPI and/or the editor(s) disclaim responsibility for any injury to people or property resulting from any ideas, methods, instructions or products referred to in the content.

