
Last-Mile Logistics Network Design under E-Cargo Bikes


School of Rural, Surveying Engineering and Geoinformatics Engineering, National Technical University of Athens, 9 Iroon Polytechniou Str., Zografou Campus, 15773 Athens, Greece
*
Author to whom correspondence should be addressed.
Future Transp. 2023, 3(2), 403-416; https://doi.org/10.3390/futuretransp3020024
Submission received: 11 February 2023
/
Revised: 17 March 2023
/
Accepted: 29 March 2023
/
Published: 31 March 2023
Abstract
:E-cargo bikes, i.e., electric bicycles equipped with baskets for transporting goods, are perceived as an advantageous solution for urban last-mile logistics. Particularly for short distances and low volumes of goods, the use of e-cargo bikes is ideal in urban areas where access of conventional cars may be prohibited. In this context, this study presents an e-cargo bike routing model for urban deliveries. The problem is formulated as a Capacitated Vehicle Routing Problem (CVRP), which takes several aspects into account, such as restrictions on bicycle capacity, road grade and workload balancing. A mathematical model is constructed to solve the problem, and a Genetic Algorithm (GA) is applied. Results on a case study in Athens, Greece are presented and analyzed, highlighting the applicability of the model in real-world operations, yielding reasonable results in short computational times.
1. Introduction
The growing urban population density and increased reliance on the automobile deteriorate traffic congestion are characterized as some of the most critical problems in modern metropolitan centers. Emissions of pollutants and exhaust fumes cause significant environmental problems and directly affect public health [1,2]. The need for sustainable development in urban areas calls for the adoption of more environmentally friendly transport systems. In this context, the use of alternative fuel vehicles is widely perceived as the way forward for the transport sector, with electric vehicles emerging as an environmentally friendly alternative to their fossil fuel counterparts [1].
Under the scope of electromobility, e-cargo bikes are considered a promising solution for last-mile urban logistics [2]. E-cargo bikes, i.e., electric bicycles equipped with baskets for transporting goods, are perceived as an advantageous solution for urban deliveries [2,3,4,5]. Indeed, e-cargo bikes can replace up to 10% of small conventional trucks without affecting efficiency while reducing carbon dioxide emissions by 73% [1]. In terms of trips, recent studies estimated that approximately 40–50% of urban delivery trips could be substituted by e-cargo bikes [4]. In this context, an increasing number of delivery companies have invested in the purchase of e-cargo bike fleets in recent years due to the low cost and the great movement flexibility they offer within cities [3]. In particular, for relatively short distances and low volumes of goods, the use of e-cargo bikes is ideal in urban areas where access of conventional cars may be prohibited due to narrow streets, sidewalks, and historical centers [2,3,4,5]. Additionally, owing to the evolution of battery technology, e-cargo bikes can be charged quickly and can be deployed in operational conditions considered challenging for regular cargo bikes, such as steep inclines and headwind [2,3,4,5,6].
In recent years, the use of cargo bicycles, both electric and conventional, for urban logistics has attracted a lot of research attention, with several studies analyzing their strengths and benefits or proposing decision support models [3].
In this line of work, a group of studies presented simulation models to evaluate cargo bikes under a variety of operational scenarios. Arnold et al. [7] showed that e-cargo bike distribution systems can benefit both the companies and the quality of life by encouraging self-pickup by customers. In a similar concept, Sardi and Boha [8] used macroscopic simulation to investigate the performance of an e-bike and electric truck distribution system for different types of shopping malls under various network structures. Temporrelli et al. [9] conducted life cycle assessment for last-mile logistics, comparing e-cargo bikes to electric, plug-in hybrid, and diesel vans, concluding that e-cargo bikes perform better in all aspects considered.
A subset of studies combined simulation and optimization models considering cargo bikes within hybrid delivery systems. Dall Chiara et al. [10] simulated the performance of a delivery distribution system operated by cargo cycles with mobile hubs under different demand and parking conditions comparing it to a truck-only system. Vehicle assignment was performed by solving two successive bin-packing problems, one per priority level of delivery requests. Fikar et al. [11] developed a decision support system for urban food deliveries under a fleet of conventional vans and cargo bikes, with coordination performed at urban consolidation centers. A dynamic agent-based simulation was combined with local search and best-insertion heuristics to evaluate the impact of different scheduling policies. Perboli and Rosano [12] introduced a simulation–optimization decision support system tool for evaluating mixed-fleet policies considering conventional, diesel and electric vehicles as well as cargo bikes for the management of parcel delivery in urban areas. An adaptive neighborhood search metaheuristic was integrated within the simulation to optimize routes. Lorca and Moeckel [13] used MATSim coupled with an open-source metaheuristic routing solver to assess cargo bike deployment under different modal shares between cargo bikes and vans, demand conditions, and micro depot densities in the context of parcel delivery.
Furthermore, another stream of studies presented optimization models for truck/van and cargo bike fleets. In such models, trucks are typically assumed to operate in an urban zone and are complemented by bikes operating in restricted zones. In this line of work, Caggiani et al. [14] formulated a so-called “Two-Echelon Electric Vehicle Routing Problem with Time Windows and Partial Recharging” for the distribution of goods by vans and cargo bikes operating in restricted traffic zones, such as historical centers and pedestrian streets. An exact optimization approach was used to solve the problem for a small case study. Similarly, a two-echelon vehicle routing problem (VRP) with covering options was presented in Enthoven et al. [15] for an urban logistics system operated by trucks and cargo bikes. An adaptive large neighborhood search heuristic was used to handle the complex problem arising. A similar model considering a heterogeneous fleet of trucks and bikes was presented in [5] and solved using simulated annealing. Büttgen et al. [16] presented a two-stage distribution system based on electric vans and cargo bikes for parcel delivery in the city of Innsbruck, and solved the problem using a tabu search algorithm.
Few studies also presented optimization models for last-mile logistics exclusively under cargo bikes. In this line of work, Choubassi et al. [4] presented a heuristic solution algorithm for designing delivery routes for two types of electric bikes, assuming dedicated cycle infrastructure. A pick-up-and-delivery VRP was presented in Niels et al. [17] for addressing the parcel delivery problem under a fleet of conventional and electric bikes. A heuristic solver integrated into Geographic Information Software (GIS) was used to handle the problem. More recently, Naumov and Pawluś [18] applied a local search algorithm to determine optimal routes for e-cargo bikes under load-dependent speed and packing constraints. Fontaine [19] presented a model and an adaptive large neighborhood algorithm for the VRP under load-dependent speed as well, considering conventional cargo bicycles. Taking into account demand stochasticity, Naumov [20] combined the Clarke–Wright heuristic with simulation for determining hubs for e-bike deliveries and associated routes. Robichet et al. [21] solved the micro-hub facility location problem and subsequently the cargo bike routing problem for parcel delivery in Paris, showing that cargo bikes are economically preferable to trucks under high numbers of daily requests. Caggiani et al. [22] presented an e-cargo bike routing model for last-mile delivery, considering both travel time and driver exposure to emissions. For a thorough review of related studies, we refer the interested reader to the survey papers by Narayan and Antoniou [3] and Vasiutina et al. [23].
Overall, few studies have considered purely electric cargo bike fleets, while the impact of road grade and uneven workloads has been overlooked. Although inclination is crucial when dealing with cargo bikes as it affects energy consumption and therefore e-bike range, such considerations have been neglected in relevant VRPs [24]. What is more, last-mile deliveries are subject to strongly varying workloads, so last-mile solution methods should be scalable on short notice, while workload should be balanced among bike couriers [25]. To our knowledge, no study has presented an optimization model and algorithm for e-cargo bike routing that takes into account road grade and workload balancing for couriers. In this context, this study presents an optimization model for addressing the e-cargo bike routing problem for urban deliveries under link restrictions and workload balancing, addressing practical considerations. As such, road grade, which significantly affects e-bike applicability and energy consumption, is taken into account both by a priori excluding unsuitable links and by considering its effect on energy consumption. Driver workload balancing refers to fairly distributing delivery requests among bike couriers. In particular, the number of delivery points (regardless of the number of packages) and the total distance traveled by each bike courier should be similar among couriers to ensure fair workload allocation. The goal is to minimize the energy consumed by electric cargo bicycles for a given set of delivery requests. The packages to be delivered refer to homogeneous products, i.e., those that are of similar dimensions and weight, such as parcels or standard delivery boxes. The problem is formulated as a Capacitated Vehicle Routing Problem (CVRP), where e-cargo bikes start from a specific point—depot, visit delivery nodes and finally return to the depot [6]. To solve the problem at hand, a mathematical model was developed and a tailored at hand Genetic Algorithm (GA) was subsequently applied, yielding near-optimal routes in short computational times. The performance of the proposed algorithm is also validated against Ant Colony Optimization (ACO), which is a popular metaheuristic used for handling VRPs.
The remainder of this study is structured as follows. The mathematical model and the solution algorithm are outlined next. Results on a case study in Athens are subsequently presented. Finally, conclusions and directions for further research are summarized.
2. Materials and Methods
This section presents the methodological framework of the problem and the solution algorithm, outlining its distinct components.
2.1. Problem Description
The problem at hand is formulated as a CVRP for e-cargo bikes, aiming to minimize the energy consumed by electric bicycles, considering link attributes (grade) and workload balancing between couriers on planned routes. A predefined set of delivery points, denoted as V, and a homogeneous fleet of e-cargo bikes B is assumed. The e-cargo bikes are assumed to start and end their itinerary at the depot; the depot is therefore represented as both 0 and N + 1, for modeling purposes. The matrix of distances between all nodes is denoted as D, and each link is uniquely defined by a pair of nodes (i,j) with i, j ∈ , i ≠ j. The charging station is located at the depot, and the e-cargo bikes are charged there before starting their routes and do not need extra charging enduring operations. Each delivery point can be visited once, i.e., split deliveries are not allowed. We assume that all requests are known at the start of optimization and communicated to the delivery provider within a reasonable timeframe. Workload balancing is considered under a two-fold approach. On the one hand, the number of delivery points should be evenly distributed among bikes, while on the other hand, the distance that every e-cargo bike travels should be as close as possible to the average, with a tolerance of α%. The combination of these two constraints precludes large discrepancies among bike couriers. In terms of road grade, links with grades above a certain threshold are excluded from the network where e-bikes are allowed to move. For grades below the adopted threshold, energy consumption is accordingly adjusted. The full notation is presented in Table 1.
Using the notation shown in Table 1, the problem is formulated as follows:
subject to
The objective function, given in Equation(1), seeks to minimize the energy consumption for the fleet of e-cargo bikes. For simplicity, we adjust average energy consumption per distance unit by a multiplicative factor that depends on the slope of the particular segment. In this manner, the objective function also implicitly accounts for travel times. Constraints (2)–(3) ensure that all e-cargo bikes start and end their routes at the depot by imposing that one outgoing arc from and one ingoing arc to the depot is used by each cargo bike. Constraint (4) prevents cycles between delivery points, stating that each link can be traversed at most in one direction by a bike. Constraint (5) enforces workload balancing in the total amount of daily delivery points with a tolerance of α%. Similarly, Constraints (6) and (7) achieve balance in the total traveled distance, with a tolerance of α%. Constraint (8) refers to the maximum load that each bicycle can carry per day. Constraints (9) and (10) ensure a unique path to and from each node of the network. Constraint (11) ensures that the energy consumed by each bike is lower than the usable battery capacity. Constraints (12) and (13) are the so-called “sub-tour elimination constraints” [26]. Finally, Constraint (14) specifies the form of the decision variables.
2.2. Solution Method
The e-cargo bike routing problem presented belongs to the general class of VRP problems and as such is an NP-Hard problem [27]. This means that the computational complexity of the problem rises exponentially with respect to its size; thus, even if an exact approach could be used for a small instance, larger instances could not be solved in an acceptable time [27]. For this reason, a GA is employed to solve the problem in short computational times. In general, GAs have been widely used for routing problems and are considered suitable for NP-hard problems with many variants and constraints [26,27,28]. In particular, GAs can be easily hybridized with external modules and heuristic algorithms to handle additional tasks [28]. In the proposed GA, a heuristic routine is employed to extract routes from each chromosome so that capacity constraints are not violated, and for penalizing solutions with uneven workload.
2.2.1. Solution Representation and Initialization
A candidate solution is represented by a sequence of nodes. This sequence indicates the order of delivery points that the electric bicycles will follow from their starting point (depot, case N = 0) until their return. Assuming that there are 25 delivery points and four routes planned, a possible chromosome generated may be the following:
[ 10 14 7 4 11 13 17 15 18 16 5 2 12 21 20 19 24 8 25 23 22 3 9 6 1 ].
Due to the absence of trip delimiters, an external heuristic procedure, described later on, is applied to extract feasible sub-routes from the sequence of delivery points.
So, a possible route set could be as follows:
[ 0 10 14 7 4 11 13 0 ],
[ 0 17 15 18 16 5 0 ],
[ 0 2 12 21 20 19 24 8 0 ],
[ 0 25 23 22 3 9 6 1 0 ].
The initialization was performed by a randomized process, while two different population sizes were investigated, namely 25 and 50.
2.2.2. Fitness Function Value
Each solution’s performance is calculated and evaluated according to the fitness function value, as defined in Equation (1). To enforce Constraints (5)–(7), the cost for each solution violating these is increased by 50%.
2.2.3. Genetic Operators
The population members are ranked based on their fitness function value. A steady state approach is followed for replacement: worst population members are replaced instead of the whole population. In this way, less “fit” members of the population can participate in the next generation during the early stages of the process. As the algorithm progresses, the most efficient individuals dominate the population.
An ordered crossover is applied, where two random points are selected from the parent chromosome and the genes located between these points are copied to the first offspring [26,28]. The remaining genes are copied to the second parent. In the example below, two sequences of nodes are shown before and after the crossover.
[ 10 14 7 4 11 13 ] → [ 10 14 21 20 19 13 ],
[ 2 12 21 20 19 24 8 ] → [ 2 12 7 4 11 24 8 ].
2.2.4. Route Extraction
An external procedure is incorporated into the GA for determining routes and associated costs. The procedure creates routes based on delivery demand for each point and the maximum distance that can be covered, as dictated by e-cargo bike load capacity and battery capacity. The heuristic calculates the cost for each route, exhausting capacity and distance constraints [26].
2.2.5. Genetic Algorithm Termination
In the experiments carried out, it was observed that after 1000 iterations, the values of the algorithm were stabilized, and the improvement of solutions was insignificant after that point. Therefore, the termination criterion was defined as 1000 iterations.
3. Results
This section presents the results of the algorithm based on a real-world case study as well as a sensitivity analysis for e-cargo bike capacity and parcel demand. Finally, the performance of the algorithm is validated against another metaheuristic solution method, ACO.
3.1. Overview
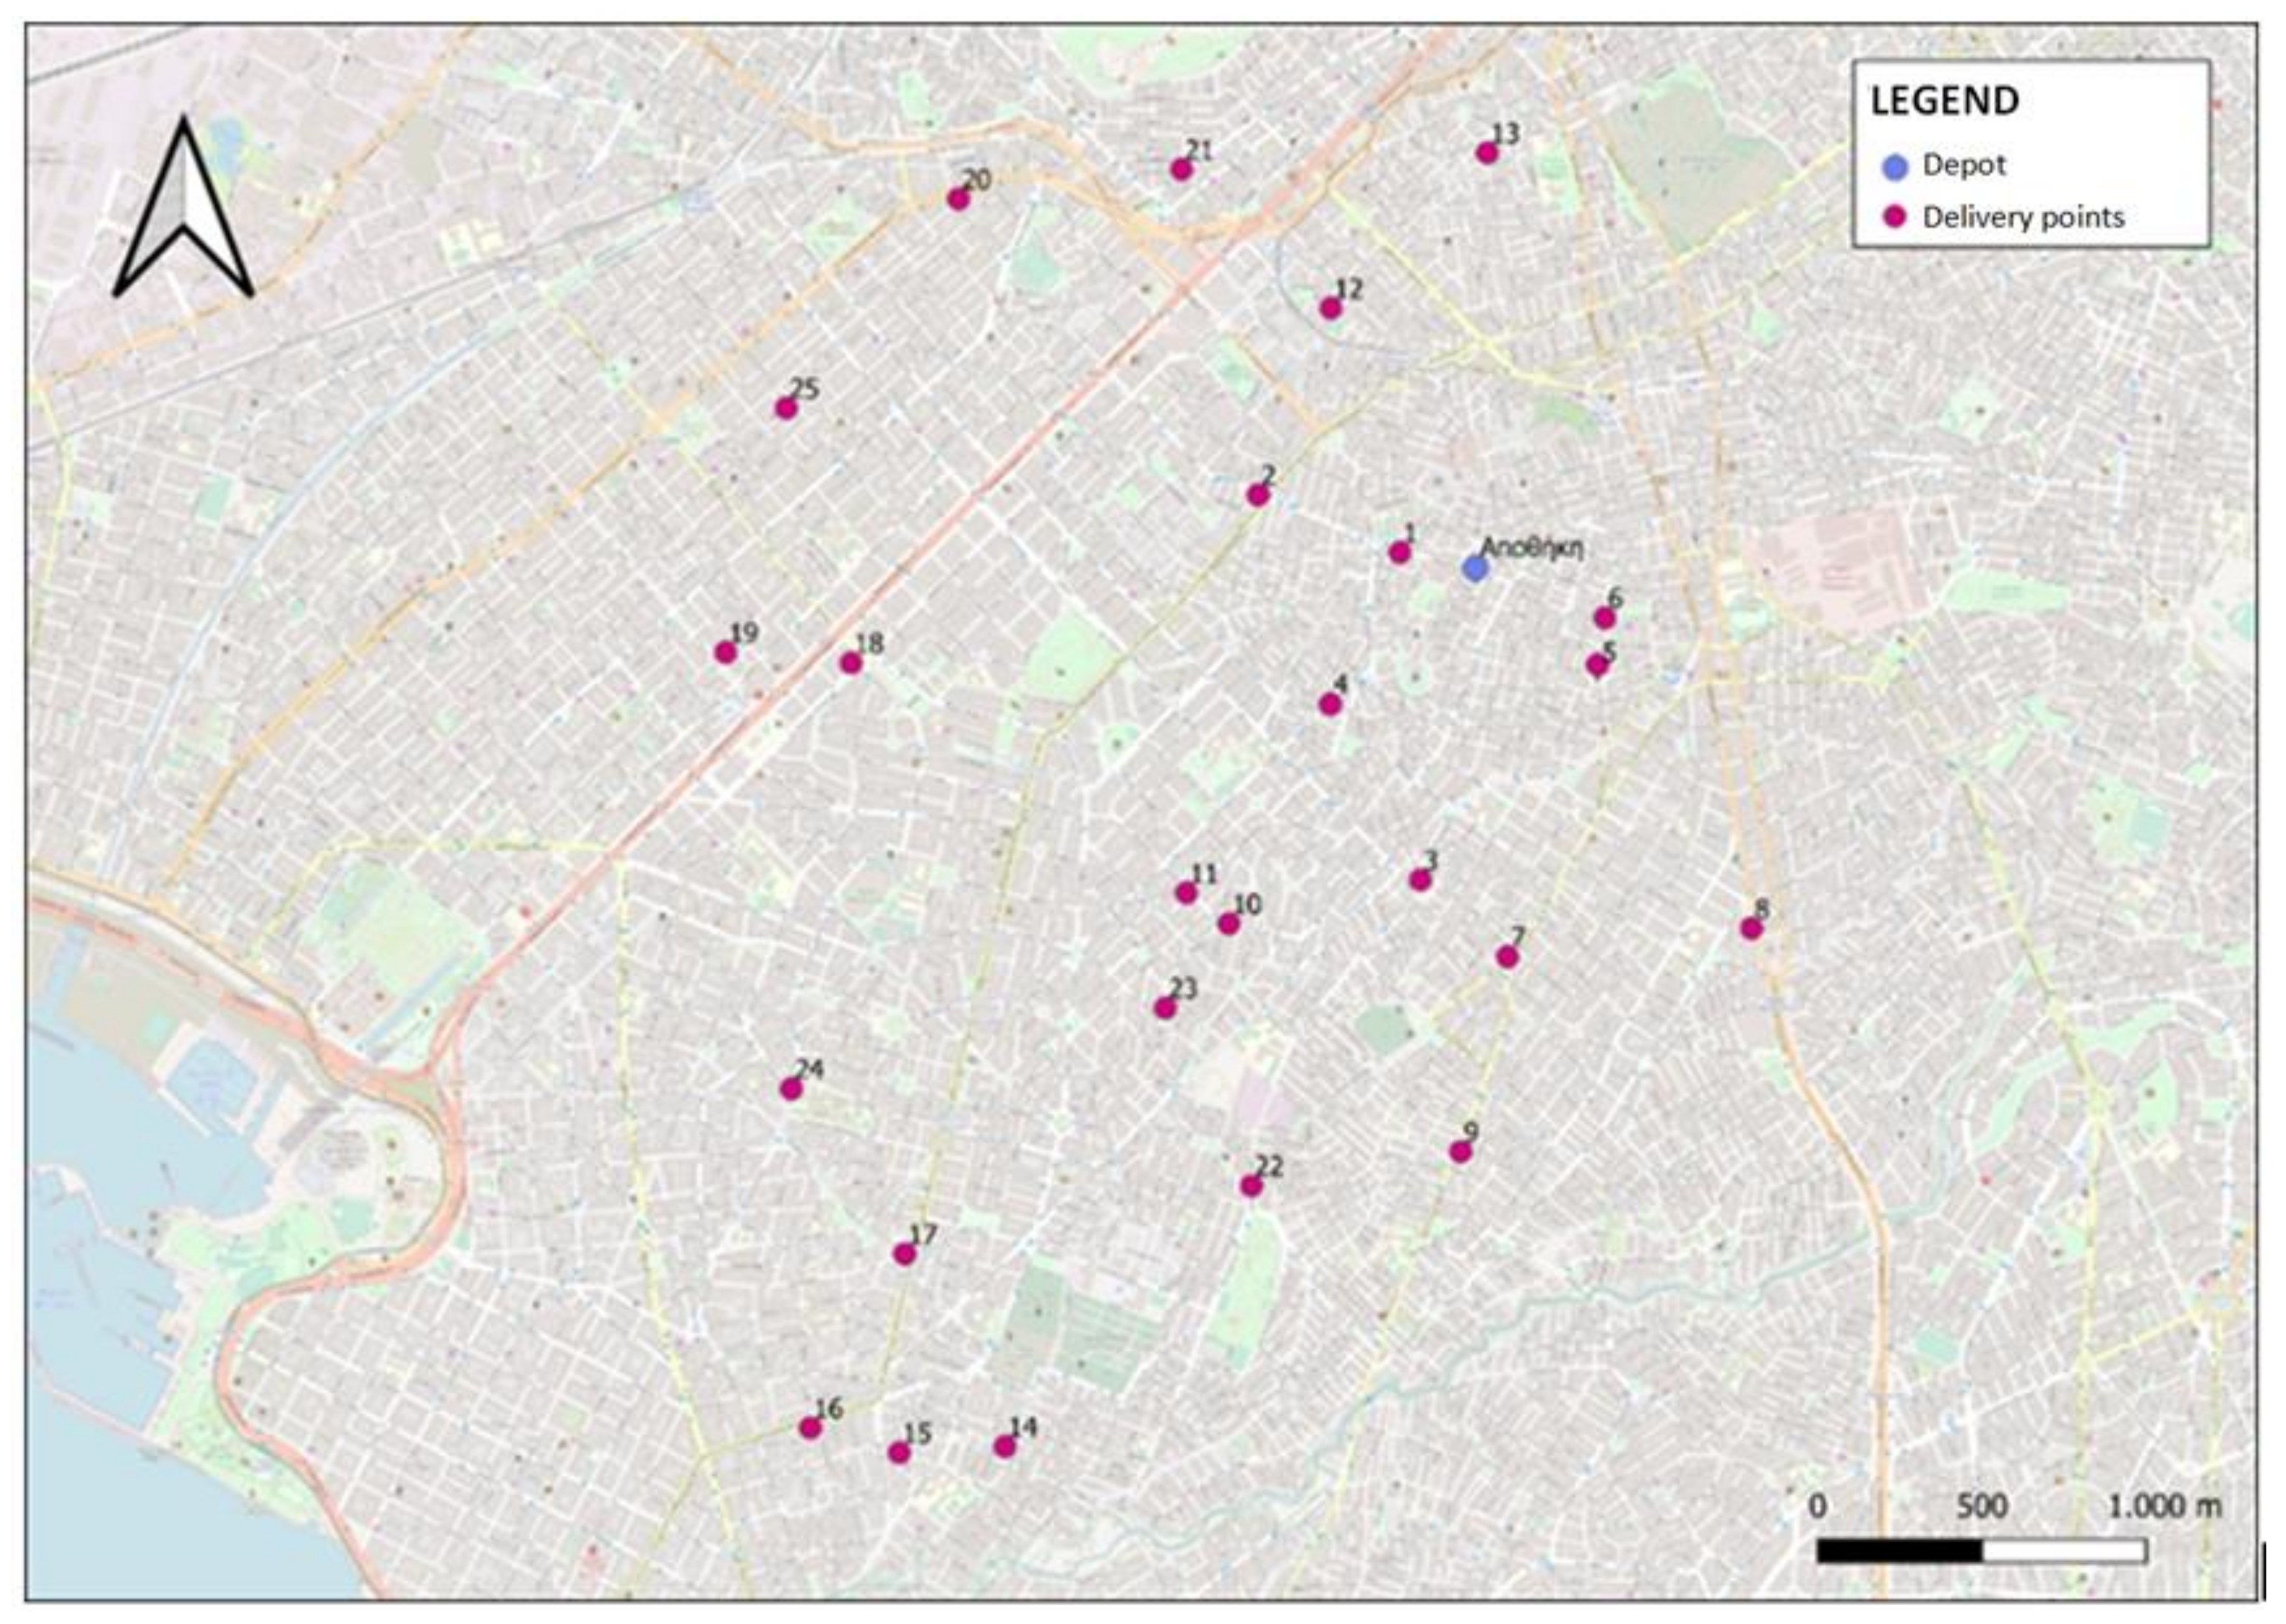
The constructed model was applied for an area in the southwestern sector of Athens, Greece including 25 delivery points that belong to four distinct municipalities, as shown in Figure 1. These points correspond to shopping centers and large supermarkets in the area in an effort to realistically capture potential delivery locations.
The demand for each delivery point is randomly distributed in [1, 6]. The total demand was 76 packages. Travel costs were calculated using Google maps, while QGISTM was used to determine road grades. The gradient threshold for e-bike deployment was assumed as 8% [29,30]. The battery capacity of the e-cargo bikes was assumed as 450 Wh (2). Average energy consumption was assumed as 10 Wh/km [2] and adjusted according to the gradient of segments [31]. The usable capacity is assumed as 80%, while the tolerance rate used for workload balancing was assumed as 20%. Finally, packages to be delivered are homogeneous, with specific dimensions and similar weight, not exceeding 2 kg. Capacity of e-cargo bikes is expressed in terms of parcels [7]. For this analysis, it is assumed that the maximum load of bicycles is 20 parcels [13].
3.2. GA Parameters and Fine Tuning
Different GA parameter combinations were tested, with each combination being run five (5) times, for population size (POP) (values of 25, 50), crossover rate (CR) (values of 0.2, 0.6, 0.86) and mutation rate (MR) (values of 0.05, 0.15, 0.25). In total, 18 × 5 = 90 calibration experiments were carried out. The GA was terminated after 1000 iterations. The evaluation procedure was developed in Visual Basic for Applications™ and the GA was implemented using Palisade Evolver 6.0™. The optimization was performed on a “Dell-Precision” laptop with 32.0 GB of RAM and CPU Intel Core i7-10750H @ 2.60 GHz. Computational times ranged between 4 and 5 min. In Table 2, the word “best” refers to the smallest value of the five runs for each combination.
3.3. Results
As shown in Table 2, the combination with the lowest average cost value is POP = 25, CR = 0.8, and MR = 0.05. Nevertheless, due to the large standard deviation observed, the combination POP = 25, CR = 0.2, and MR = 0.05 was chosen instead, featuring the next best average value (782.75) and a smallest standard deviation (58.12). Subsequently, optimization was performed for this combination of GA parameters under a fixed run time of 20 min.
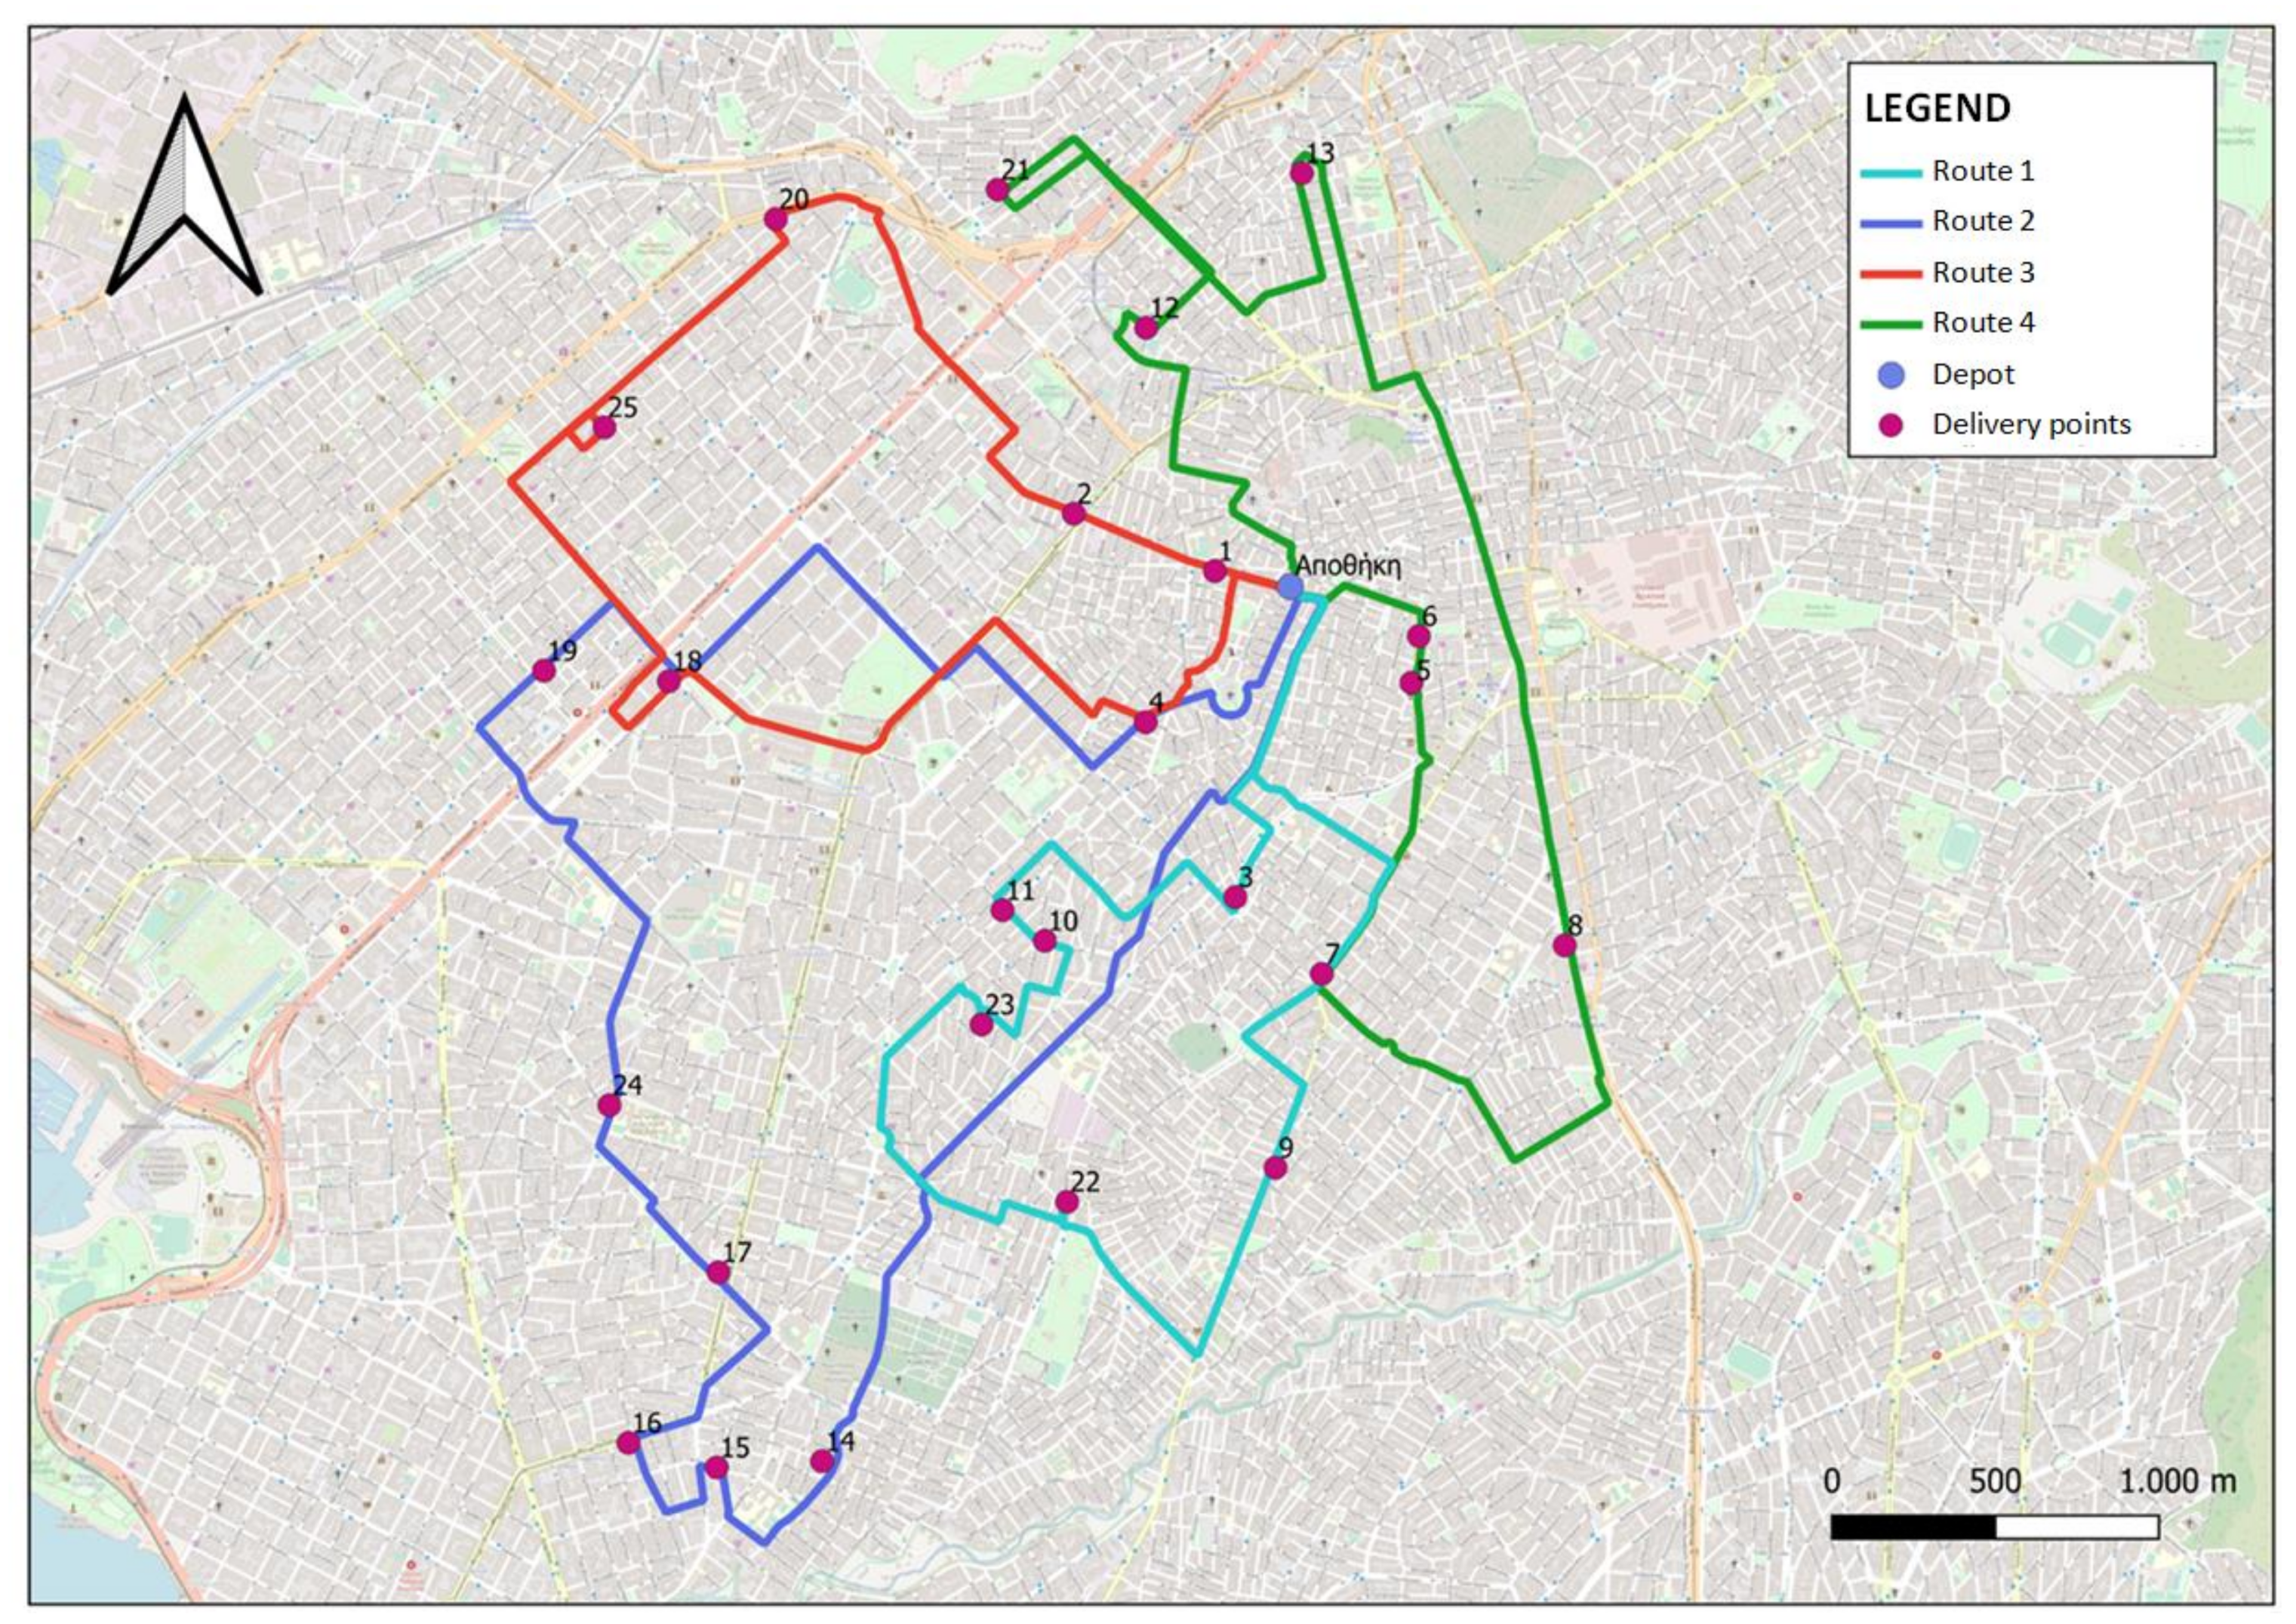
Table 3 presents the best solution attained, which consists of 4 e-cargo bike routes. The distance traveled for each bike courier along with the number of packages and points per route are shown.
Table 3 shows that a fair allocation of workload, both in terms of distance traveled and number of customers, is attained using the proposed algorithm. It should be noted that we assume that the logistics provider is aware of demand requests beforehand and there is a reasonable request cut-off period. In any case, the short computational times allow for a very small request cut-off window to be assumed, i.e., under 5 min. The total energy consumed is approximately equal to 634 Wh. The corresponding near-optimal routes are shown in Figure 2.
As seen in Figure 2, there is a relatively similar geographical distribution of points among bike couriers, without significant route overlap. There are also cases where two points, relatively close to each other, are served by different routes, which is related to the capacity of e-bikes in terms of parcels.
3.4. Sensitivity Analysis
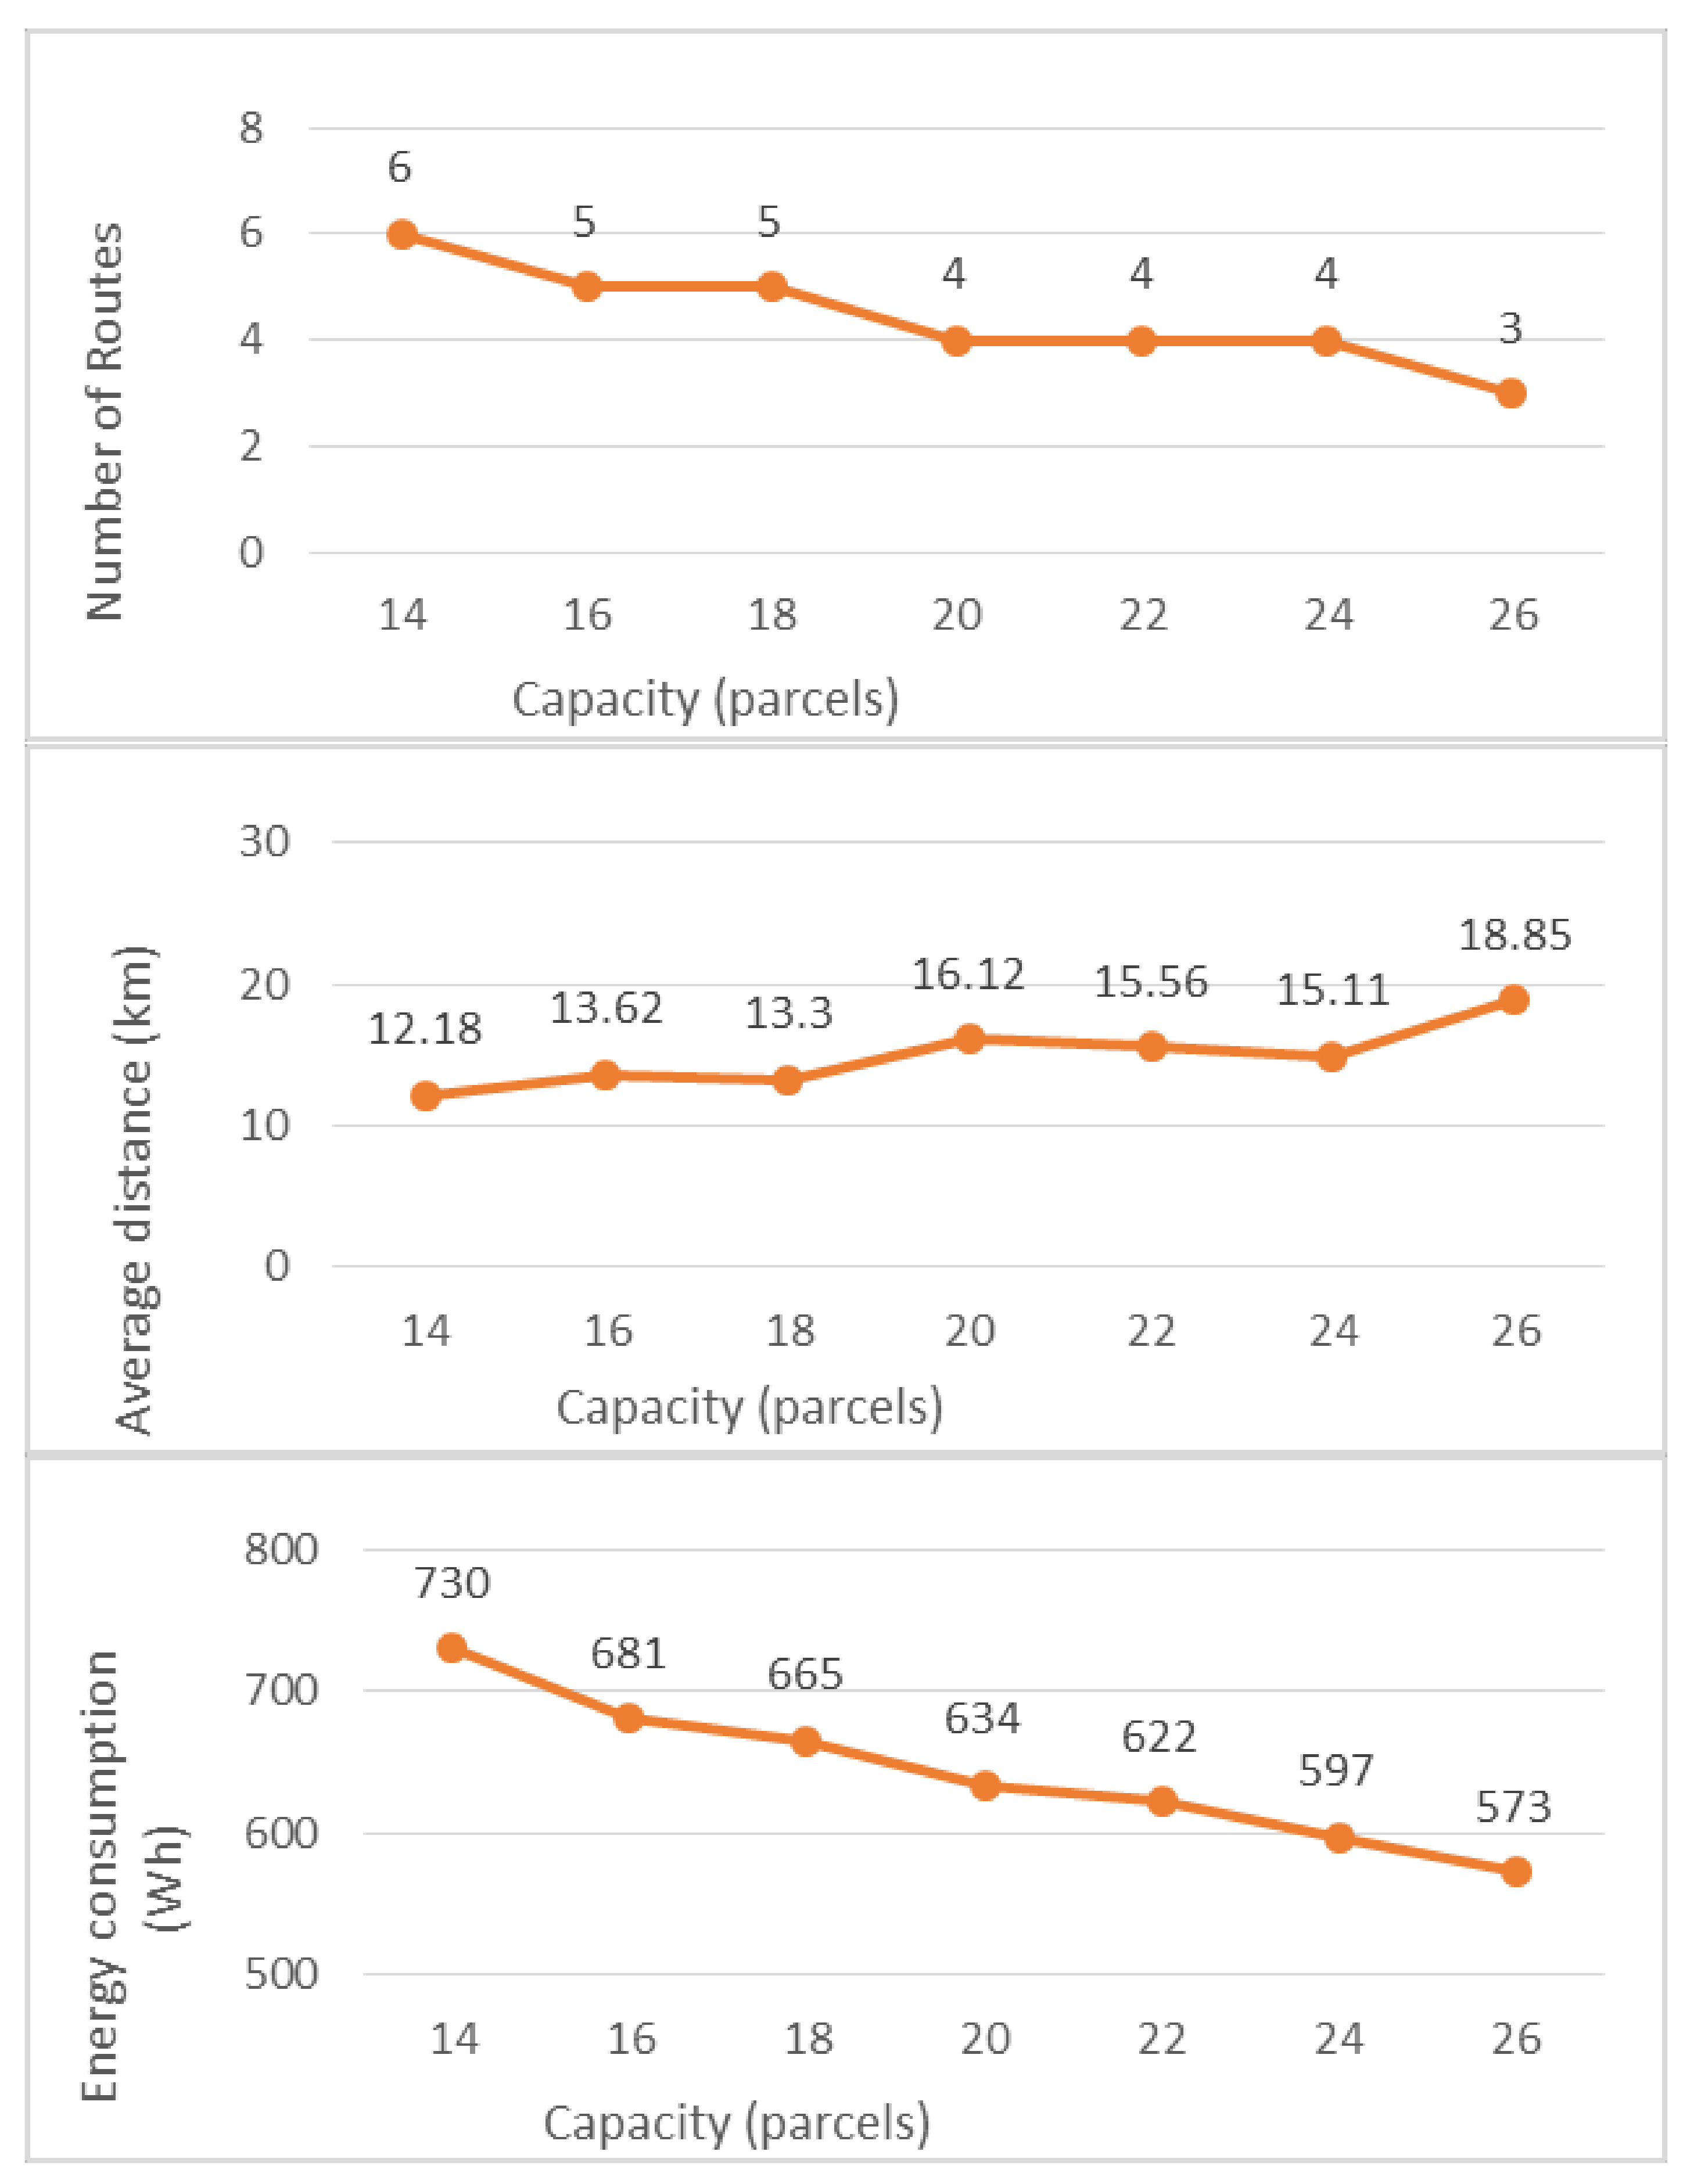
The sensitivity of the model is analyzed in terms of the capacity of bicycles in parcels and customer demand levels. Figure 3 shows the impact of different capacity values within 30% of the baseline case.
As shown in Figure 3, the lower the capacity, the more routes are required to serve customer requests. The number of routes remains the same for small differences in capacity, as workload and maximum range constraints apply. In fact, for the number of routes to drop from 4 to 3, a 30% increase in capacity is required. Reasonably, the distance per bike increases with capacity, as each courier can serve more requests. For a value of capacity equal to 26, a 25% increase in distance traveled by each courier is noted compared to the case of capacity equal to 24 parcels. Similarly, the total energy consumption decreases almost linearly as the load capacity of the bicycles increases. For 30% increase in capacity, 10–14% less energy may be required, depending on the corresponding reduction in the number of routes as well.
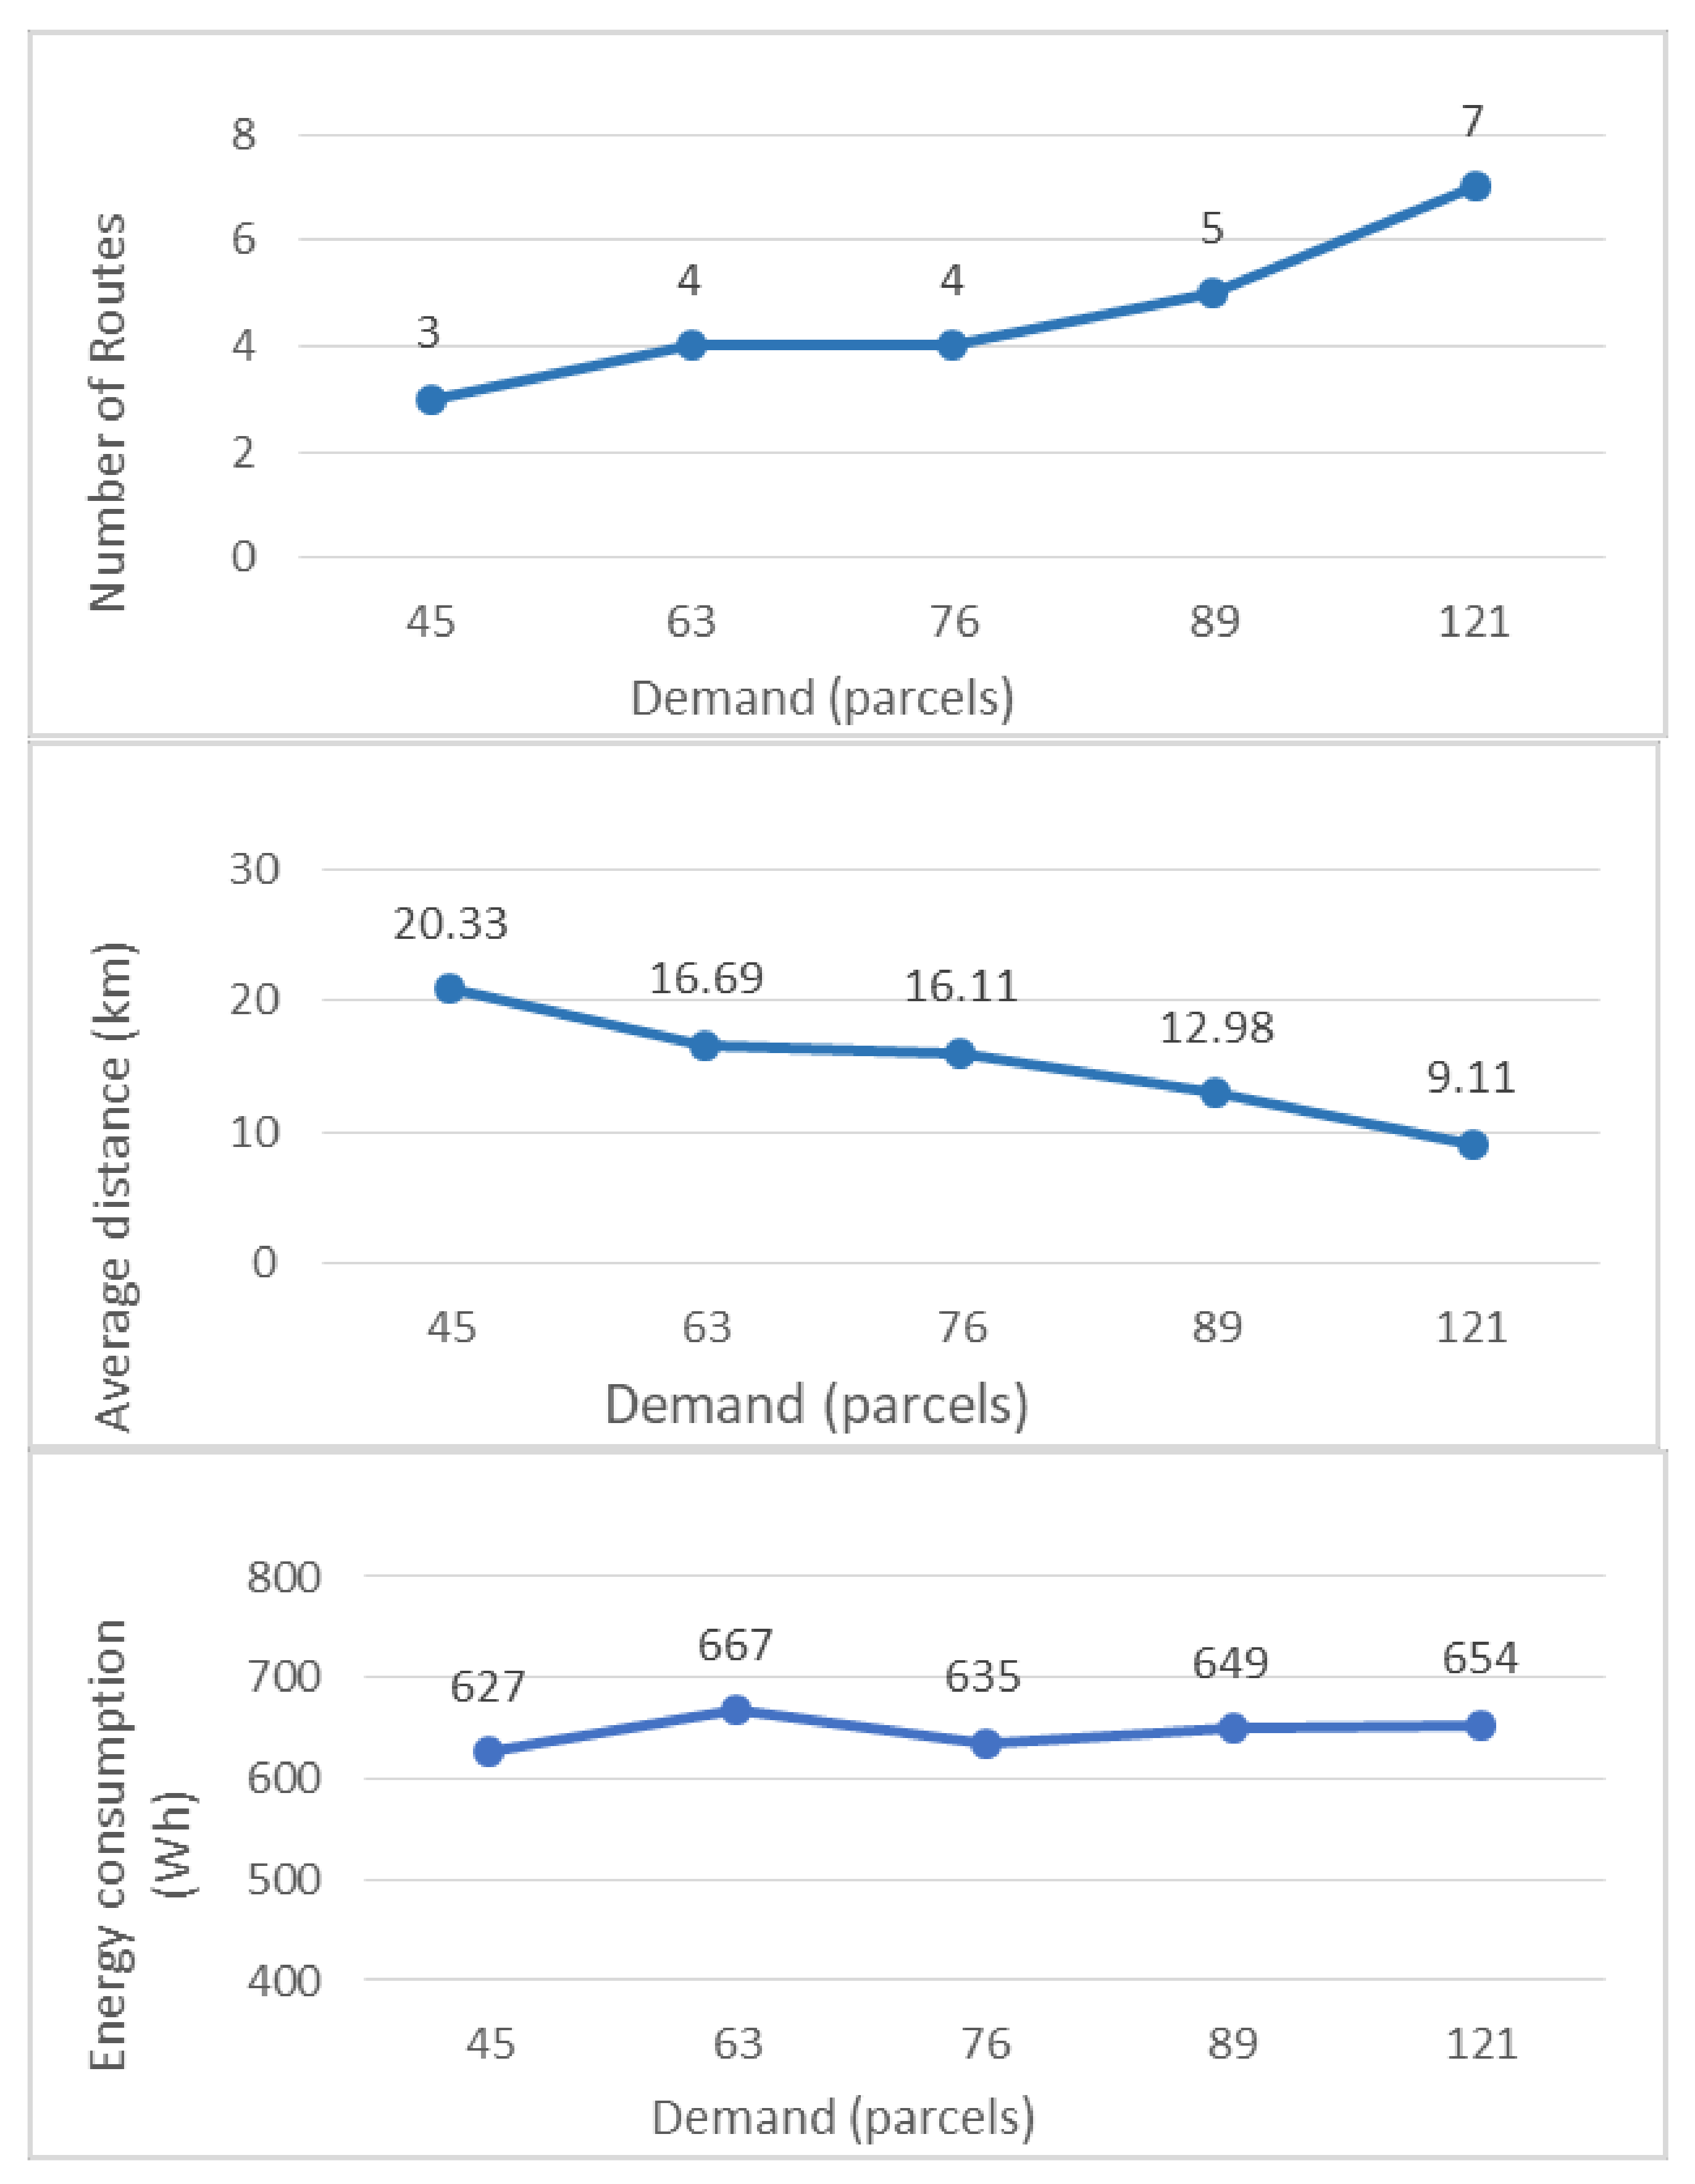
Next, customer demand was modified by +/− 20% and +/− 50% per point under the same bicycle capacity of 20 parcels. Since these figures refer to parcels, rounding was subsequently performed. This results in total demand values between 45 and 121 parcels. Figure 4 shows the effect of the different demand levels on results.
As seen in Figure 4, as demand increases, more routes are required to meet customers’ needs, as capacity constraints apply. Reasonably, the average distance traveled per bike decreases at the same time, with an almost linear trend observed. For the lowest demand value, just one less route is required, yet average distance per courier increases by 25%. To some extent, this relatively mild effect may be attributed to rounding and not allowing zero demand values at delivery points. In contrast, for the higher value of total demand, seven bike routes are required, yet workload per e-cargo bike drops by 44% in terms of distance traveled. Finally, the energy consumed is not affected much by changes in demand, as the number of delivery points remains the same. The differences among scenarios lie at the distribution of delivery requests among bike couriers, with small efficiency gains observed for the lowest number of routes due to a higher degree of grouping.
3.5. GA Performance Validation
GAs have been widely used to solve VRPs and are considered a very efficient metaheuristic, widely applied to problems arising in transportation [32]. To validate the performance of the proposed GA, we also solve the problem using an ACO algorithm implemented in Python 3.8. ACO is considered one of the best performing algorithms for solving VRPs [33]. The specification of pheromone values and related update processes can be found in [34], while solution evaluation and constraint handling are identical to the proposed GA. For the ACO algorithm, we also run five experiments of 1000 iterations and use a population size of 25, comparing to the best results obtained in our preliminary experiments. Table 4 shows the corresponding results.
The best resulting route set for ACO consists of five routes in this case ([21, 20, 25, 19, 2, 1], [23, 10, 11, 3], [12, 13, 5, 6, 4], [24, 17, 16, 15, 14, 22], [9, 8, 7, 18]) versus four routes for the GA ([13, 20, 21, 2, 12, 9, 5], [6, 8, 3, 22, 7, 4, 1], [18, 14, 24, 23, 10, 11], [16, 15, 17, 19, 25]). As seen in Table 4, the GA produced a slightly improved best solution, while the ACO produces an improved average result, with a smaller standard deviation. Based on these results, we consider the performance of the two algorithms comparable, concluding that the proposed GA is on par with other state-of-the-art methods.
4. Conclusions
Electromobility is widely perceived as the future of the transportation sector. In terms of urban logistics, electric cargo bicycles can replace traditional last-mile delivery trips performed by trucks and vans. In this context, this paper presents a model for urban logistics network design under e-cargo bikes, taking into consideration bike load capacity, road grades and workload balancing between couriers, regarding both the distance traveled and the number of requests served. A mathematical model was constructed for this purpose, and a GA was employed to handle the problem. Results show that the model yields reasonable routes in short computational times, allowing for real-world application under short request cut-off times for logistics providers. Reasonably, bicycle capacity is a critical factor and can allow for a reduction in the number of routes, yet with longer routes and thus higher workload for bike couriers. However, total energy consumption decreases with capacity, with gains over 10% for a capacity increase of 30%. The number of parcels per delivery point is also significant for the number of routes and average distance traveled per bike courier, implying that parcel limits per customer may be a sensible approach for reducing fleet size and courier workload.
Future research could consider multi-objective optimization methods to generate sets of non-dominated solutions, providing more flexibility to decision makers [35] or incorporate uncertainty in the various planning stages [36]. Moreover, e-bike applicability indices [29] may be incorporated in the decision support model to evaluate routes in terms of rider comfort as well. Similarly, network connectivity metrics for e-cargo bikes can be estimated and incorporated in the evaluation of candidate solutions.
Author Contributions
Formal Analysis: E.P.; Software: E.P. and C.I.; Visualization: E.P.; Investigation: E.P.; Writing—Original draft preparation: E.P. and C.I.; Conceptualization: K.K.; Supervision: K.K.; Writing—Review and Editing: K.K. All authors have read and agreed to the published version of the manuscript.
Funding
This research received no external funding.
Institutional Review Board Statement
Not applicable.
Informed Consent Statement
Not applicable.
Data Availability Statement
Data can be made available upon reasonable request.
Conflicts of Interest
The authors report there are no competing interest to declare.
References
- Melo, S.; Baptista, P. Evaluating the impacts of using cargo cycles on urban logistics: Integrating traffic, environmental and operational boundaries. Eur. Transp. Res. Rev. 2017, 9, 30. [Google Scholar] [CrossRef] [Green Version]
- Nocerino, R.; Colorni, A.; Lia, F.; Lue, A. E-bikes and E-scooters for smart logistics: Environmental and economic sustainability in pro-E-bike Italian pilots. Transp. Res. Procedia 2016, 14, 2362–2371. [Google Scholar] [CrossRef] [Green Version]
- Narayanan, S.; Antoniou, C. Electric cargo cycles-A comprehensive review. Transp. Policy 2021, 116, 278–303. [Google Scholar] [CrossRef]
- Aiello, G.; Quaranta, S.; Certa, A.; Inguanta, R. Optimization of urban delivery systems based on electric assisted cargo bikes with modular battery size, taking into account the service requirements and the specific operational context. Energies 2021, 14, 4672. [Google Scholar] [CrossRef]
- Lee, K.; Chae, J.; Kim, J. A courier service with electric bicycles in an Urban Area: The case in Seoul. Sustainability 2019, 11, 1255. [Google Scholar] [CrossRef] [Green Version]
- Choubassi, C.; Seedah, D.P.; Jiang, N.; Walton, C.M. Economic analysis of cargo cycles for urban mail delivery. Transp. Res. Rec. 2016, 2547, 102–110. [Google Scholar] [CrossRef]
- Arnold, F.; Cardenas, I.; Sorensen, K.; Dewulf, W. Simulation of B2C e-commerce distribution in Antwerp using cargo bikes and delivery points. Eur. Transp. Res. Rev. 2017, 10, 2. [Google Scholar] [CrossRef]
- Sárdi, D.L.; Bóna, K. A geometrical structure-based new approach for city logistics system planning with cargo bikes and its application for the shopping malls of Budapest. Appl. Sci. 2021, 11, 3300. [Google Scholar] [CrossRef]
- Temporelli, A.; Brambilla, P.C.; Brivio, E.; Girardi, P. Last Mile Logistics Life Cycle Assessment: A Comparative Analysis from Diesel Van to E-Cargo Bike. Energies 2022, 15, 7817. [Google Scholar] [CrossRef]
- Dalla Chiara, G.; Alho, A.R.; Cheng, C.; Ben-Akiva, M.; Cheah, L. Exploring benefits of cargo-cycles versus trucks for urban parcel delivery under different demand scenarios. Transp. Res. Rec. 2020, 2674, 553–562. [Google Scholar] [CrossRef]
- Fikar, C.; Hirsch, P.; Gronalt, M. A decision support system to investigate dynamic last-mile distribution facilitating cargo-bikes. Int. J. Logist. Res. Appl. 2018, 21, 300–317. [Google Scholar] [CrossRef]
- Perboli, G.; Rosano, M. Parcel delivery in urban areas: Opportunities and threats for the mix of traditional and green business models. Transp. Res. Part C Emerg. Technol. 2019, 99, 19–36. [Google Scholar] [CrossRef]
- Llorca, C.; Moeckel, R. Study of Cargo Bikes for Parcel Deliveries under Different Supply, Demand and Spatial Conditions. In Proceedings of the 2020 Forum on Integrated and Sustainable Transportation Systems (FISTS), Delft, The Netherlands, 3–5 November 2020. [Google Scholar]
- Caggiani, L.; Colovic, A.; Prencipe, P.L.; Ottomanelli, M. A green logistics solution for last-mile deliveries considering e-vans and e-cargo bikes. Transp. Res. Procedia 2020, 52, 75–82. [Google Scholar] [CrossRef]
- Enthoven, D.L.; Jargalsaikhan, B.; Roodbergen, K.J.; Uit het Broek, M.A.; Schrotenboer, A.H. The two-echelon vehicle routing problem with covering options: City logistics with cargo bikes and parcel lockers. Comp. Oper. Res. 2020, 118, 104919. [Google Scholar] [CrossRef]
- Büttgen, A.; Turan, B.; Hemmelmayr, V. Evaluating Distribution Costs and CO2-Emissions of a Two-Stage Distribution System with Cargo Bikes: A Case Study in the City of Innsbruck. Sustainability 2021, 13, 13974. [Google Scholar] [CrossRef]
- Niels, T.; Hof, M.T.; Bogenberger, K. Design and Operation of an Urban Electric Courier Cargo Bike System. In Proceedings of the 2018 21st International Conference on Intelligent Transportation Systems, Maui, HI, USA, 4–7 November 2018. [Google Scholar]
- Naumov, V.; Pawluś, M. Identifying the optimal packing and routing to improve last-mile delivery using cargo bicycles. Energies 2021, 14, 4132. [Google Scholar] [CrossRef]
- Fontaine, P. The vehicle routing problem with load-dependent travel times for cargo bicycles. Eur. J. Oper. Res. 2022, 300, 1005–1016. [Google Scholar] [CrossRef]
- Naumov, V. Substantiation of Loading Hub Location for Electric Cargo Bikes Servicing City Areas with Restricted Traffic. Energies 2021, 14, 839. [Google Scholar] [CrossRef]
- Robichet, A.; Nierat, P.; Combes, F. First and Last Miles by Cargo Bikes: Ecological Commitment or Economically Feasible? The Case of a Parcel Service Company in Paris. Transp. Res. Rec. 2022, 2676, 269–278. [Google Scholar] [CrossRef]
- Caggiani, L.; Prencipe, L.P.; Colovic, A.; Dell’Orco, M. An Eco-Friendly Decision Support System for Last-Mile Delivery Using E-Cargo Bikes. In Proceedings of the 2020 IEEE International Conference on Environment and Electrical Engineering and 2020 IEEE Industrial and Commercial Power Systems Europe (EEEIC/I&CPS Europe), Madrid, Spain, 9–12 June 2020; IEEE: Piscataway, NJ, USA, 2020; pp. 1–6. [Google Scholar]
- Vasiutina, H.; Szarata, A.; Rybicki, S. Evaluating the Environmental Impact of Using Cargo Bikes in Cities: A Comprehensive Review of Existing Approaches. Energies 2021, 14, 6462. [Google Scholar] [CrossRef]
- Anderluh, A.; Hemmelmayr, V.C.; Nolz, P.C. Sustainable Logistics with Cargo Bikes—Methods and Applications. In Sustainable Transportation and Smart Logistics; Faulin, J., Juan, A.A., Grasman, S.E., Hirsch, P., Eds.; Elsevier: Amsterdam, The Netherlands, 2019; pp. 207–232. [Google Scholar]
- Boysen, N.; Fedtke, S.; Schwerdfeger, S. Last-mile delivery concepts: A survey from an operational research perspective. OR Spectr. 2021, 43, 1–58. [Google Scholar] [CrossRef]
- Iliopoulou, C.; Kepaptsoglou, K.; Karlaftis, M.G. Route planning for a seaplane service: The case of the Greek Islands. Comp. Oper. Res. 2015, 59, 66–77. [Google Scholar] [CrossRef]
- Lenstra, J.K.; Rinnooy Kan, A.H.G. Complexity of vehicle routing and scheduling problems. Networks 1981, 11, 221–227. [Google Scholar] [CrossRef] [Green Version]
- Charisis, A.; Iliopoulou, C.; Kepaptsoglou, K. DRT route design for the first/last mile problem: Model and application to Athens, Greece. Public Transp. 2018, 10, 499–527. [Google Scholar] [CrossRef]
- Liu, L.; Suzuki, T. Quantifying e-bike applicability by comparing travel time and physical energy expenditure: A case study of Japanese cities. J. Transp. Health 2019, 13, 150–163. [Google Scholar] [CrossRef]
- Liazos, A.; Iliopoulou, C.; Kepaptsoglou, K.; Bakogiannis, E. Geofence planning for electric scooters. Transp. Res. Part D Transp. Environ. 2022, 102, 103149. [Google Scholar] [CrossRef]
- Arango, I.; Lopez, C.; Ceren, A. Improving the autonomy of a mid-drive motor electric bicycle based on system efficiency maps and its performance. World Electr. Veh. J. 2021, 12, 59. [Google Scholar] [CrossRef]
- Iliopoulou, C.; Kepaptsoglou, K.; Vlahogianni, E. Metaheuristics for the transit route network design problem: A review and comparative analysis. Public Transp. 2019, 11, 487–521. [Google Scholar] [CrossRef]
- Bell, J.E.; McMullen, P.R. Ant colony optimization techniques for the vehicle routing problem. Adv. Eng. Inform. 2004, 18, 41–48. [Google Scholar] [CrossRef]
- Alpos, T.; Iliopoulou, C.; Kepaptsoglou, K. Nature-Inspired Optimal Route Network Design for Shared Autonomous Vehicles. Vehicles 2023, 5, 24–40. [Google Scholar] [CrossRef]
- Eslamipoor, R. A fuzzy multi-objective model for supplier selection to mitigate the impact of vehicle transportation gases and delivery time. J. Data Inf. Manag. 2022, 4, 231–241. [Google Scholar] [CrossRef]
- Eslamipoor, R. A two-stage stochastic planning model for locating product collection centers in green logistics networks. Clean. Logist. Supply Chain 2023, 6, 100091. [Google Scholar] [CrossRef]
Figure 1.
Map of delivery points in the area of interest, Athens, Greece.

Figure 2.
Best route set.

Figure 3.
Impact of capacity on number of routes (top), average distance (center) and energy consumption (bottom).
Figure 3.
Impact of capacity on number of routes (top), average distance (center) and energy consumption (bottom).

Figure 4.
Impact of demand on number of routes (top), average distance (center) and energy consumption (bottom).
Figure 4.
Impact of demand on number of routes (top), average distance (center) and energy consumption (bottom).


Table 1.
Mathematical model notation.
| Description | |
|---|---|
| Sets | |
| V | |
| Set of delivery points including depot 0 and depot N+1 (starting and ending point), | |
| B | |
| Q | Set of packages for delivery |
| Parameters | |
| N | Number of delivery points |
| qi | Number of packages to be delivered at point i |
| C | Capacity of the e-cargo bike (in packages) |
| b | Ε-cargo bike |
| dij | Distance between delivery points (i,j) (km) |
| eij | Energy consumption for link (i,j) |
| L | Battery Capacity for each e-cargo bike |
| r | Usable capacity factor |
| α | Tolerance for workload allocation |
| Decision Variable | |
| xijb | Binary variable equal to 1 if the vehicle b is traveling on arc (i,j), |
Table 2.
Results for different GA parameter combinations.
| Set of Experiments | POP | CR | MR | Best Objective Function Value (Wh) | Average | Standard Deviation |
|---|---|---|---|---|---|---|
| 1 | 25 | 0.2 | 0.05 | 685.25 | 782.75 | 58.12 |
| 2 | 0.15 | 828.46 | 889.904 | 77.01 | ||
| 3 | 0.25 | 835.36 | 866.548 | 25.77 | ||
| 4 | 0.6 | 0.05 | 790.24 | 842.862 | 44.12 | |
| 5 | 0.15 | 771.81 | 907.45 | 99.96 | ||
| 6 | 0.25 | 877.54 | 905.056 | 31.30 | ||
| 7 | 0.8 | 0.05 | 678.71 | 779.924 | 92.43 | |
| 8 | 0.15 | 816.55 | 845.22 | 20.19 | ||
| 9 | 0.25 | 838.55 | 909.574 | 102.79 | ||
| 10 | 50 | 0.2 | 0.05 | 784.98 | 891.39 | 78.83 |
| 11 | 0.15 | 888.74 | 929.058 | 43.19 | ||
| 12 | 0.25 | 867.45 | 893.08 | 19.63 | ||
| 13 | 0.6 | 0.05 | 836.39 | 855.262 | 13.45 | |
| 14 | 0.15 | 832.02 | 890.702 | 36.36 | ||
| 15 | 0.25 | 941.46 | 1018.814 | 57.91 | ||
| 16 | 0.8 | 0.05 | 834.1 | 834.56 | 57.87 | |
| 17 | 0.15 | 849.77 | 876.99 | 42.07 | ||
| 18 | 0.25 | 942.1 | 1013.29 | 194.39 |
Table 3.
Best solution results.
| Travelled Distance (m) | Packages Per Route | Delivery Points Per Route | |
|---|---|---|---|
| Route 1 | 14,689 | 20 | 7 |
| Route 2 | 18,581 | 18 | 6 |
| Route 3 | 16,856 | 19 | 6 |
| Route 4 | 14,351 | 19 | 6 |
| Objective Function | 634 Wh | ||
Table 4.
Comparison of results with Ant Colony Optimization (ACO).
| Algorithm | Best Objective Function Value (Wh) | Average | Standard Deviation |
|---|---|---|---|
| GA | 678.71 | 779.924 | 92.43 |
| ACO | 699.12 | 740.818 | 24.9 |
Disclaimer/Publisher’s Note: The statements, opinions and data contained in all publications are solely those of the individual author(s) and contributor(s) and not of MDPI and/or the editor(s). MDPI and/or the editor(s) disclaim responsibility for any injury to people or property resulting from any ideas, methods, instructions or products referred to in the content. |
© 2023 by the authors. Licensee MDPI, Basel, Switzerland. This article is an open access article distributed under the terms and conditions of the Creative Commons Attribution (CC BY) license (https://creativecommons.org/licenses/by/4.0/).
Share and Cite
MDPI and ACS Style
Papaioannou, E.; Iliopoulou, C.; Kepaptsoglou, K. Last-Mile Logistics Network Design under E-Cargo Bikes. Future Transp. 2023, 3, 403-416. https://doi.org/10.3390/futuretransp3020024
AMA Style
Papaioannou E, Iliopoulou C, Kepaptsoglou K. Last-Mile Logistics Network Design under E-Cargo Bikes. Future Transportation. 2023; 3(2):403-416. https://doi.org/10.3390/futuretransp3020024
Chicago/Turabian StylePapaioannou, Eleni, Christina Iliopoulou, and Konstantinos Kepaptsoglou. 2023. "Last-Mile Logistics Network Design under E-Cargo Bikes" Future Transportation 3, no. 2: 403-416. https://doi.org/10.3390/futuretransp3020024