Article

Port Efficiency Based on the Super-Efficiency EBM-DEA-SDM Model: Empirical Evidence from China

1
Department of Electronic Business, South China University of Technology, Guangzhou 510006, China
2
School of Business, Singapore University of Social Sciences, Singapore 599494, Singapore
*
Author to whom correspondence should be addressed.
Future Transp. 2023, 3(1), 23-37; https://doi.org/10.3390/futuretransp3010002
Submission received: 30 November 2022 / Revised: 21 December 2022 / Accepted: 22 December 2022 / Published: 27 December 2022

Abstract

:
Guangdong Province enjoys a very high economic status in China especially in terms of port construction. In response to the port development directions in China, the Guangdong government released a policy about the construction of Guangdong ports in the next 15 years. Based on the policy, this study proposes to evaluate the port efficiency of major ports in Guangdong Province during 2011–2020 using the Super-efficiency EBM-DEA model that considers undesirable outputs, and the spatial effect of port efficiency and its influencing factors is further analyzed using the spatial Durbin model. The empirical results shows that the overall port efficiency in Guangdong Province is not high and varies widely among port clusters, thereby lacking synergistic development. The results of the spatial Durbin model show that port efficiency is positively correlated with the level of economic development, port-city relationship and transportation structure, as well as negatively correlated with the efficiency of neighboring ports. The findings have a far-reaching impact on the development of port construction.

1. Introduction

Ports remain the main gateway to international trade, and the relationship between ports and international trade is inextricably linked [1]. As the hub of transportation and the window of foreign exchange, the role of ports in promoting international trade and regional economic development is becoming more apparent [2]. After more than 40 years of reform and opening up, China is now one of the world’s major port countries [3], and the Pearl River Delta in Guangdong Province is the place where ports are relatively concentrated [4]. We can see that the coastal port cargo throughput and container throughput of Guangdong Province in 2020 is ranked in the first place in China, as can be seen in Table 1.
However, in recent years, due to the COVID-19 pandemic, the shrinking demand and excessive investment have led to excess port capacity, especially the ability to gather and allocate resources that need to be improved [5]. Studies have shown that there is a big gap between China and other developed countries in terms of resource allocation structure. In other words, there is still a long way to go in terms of resource allocation [6]. Furthermore, due to the rapid development of ports, environmental pollution has become increasingly prevalent. The uncontrolled development of ports in competition for shoreline resources and the severe pollution caused by port activities have had a significant impact on the environment. Therefore, competition between ports has a significant impact on the green efficiency of these ports too [7].
In 2022, the Guangdong Province Government issued a policy about the construction of ports for the next 15 years. This policy highlighted several problems of Guangdong ports. The problems can be summarized into two aspects. Firstly, the duplication of port construction and hinterland overlap result in economic efficiency to be difficult to achieve the Pareto optimal effect. Secondly, the expansion of the port scale has caused unreasonable utilization of shoreline and port layout, which has led to a series of problems in port efficiency, safety, and environmental pollution [8]. In addition, according to the policy, Guangdong Province will lead the country in building a world-class port, with the construction of the Pearl River Delta port cluster as the core, and the Eastern and Western Guangdong port clusters as the two poles pattern.
Based on this objective, if port efficiency is not specified in port development, then it would be hard to see long-term development [9]. Although many scholars have extensively researched on port efficiency, very few scholars have taken into account the competition among ports and the spatial variability of port efficiency. In order to strengthen the comprehensive construction of ports and build an efficient and environmentally friendly world-class port cluster, it is important to analyze the port efficiency around the unbalanced and insufficient port development [10], the lack of synergistic development among the Pearl River Delta port cluster and Eastern and Western Guangdong clusters, and the construction of green ports. Therefore, this study aims to analyze the efficiency and influencing factors of ports in Guangdong Province, so as to respond to the development goals of the policy and make targeted suggestions for the development of ports in Guangdong Province as well as the rest of China. The Super-Efficiency EBM-DEA model used in this study takes into account the undesirable outputs. In addition, the model can better measure port efficiency, and the spatial Durbin model can analyze the relationship between port efficiency and its influencing factors while considering the spatial differences.
The rest of the paper is structured as follows. Section 2 summarizes previous literature and identifies the literature gaps. Section 3 describes the methodology, variables, and data used in this study. Section 4 analyzes the empirical results, including the Super-efficiency EBM-DEA analysis. Section 5 describes the spatial autocorrelation of port efficiency and Section 6 identifies of the influencing factors. Conclusions and implications are provided in Section 7.

2. Literature Review

2.1. Port Efficiency

Studies have analyzed efficiency at the terminal level in ports. Li et al. (2021) [11] examined the operation efficiency of container terminals in China and offered useful insights for the container industry. Similarly, Mustafa et al. (2021) [12] investigated the technical efficiency of several Asian and Middle Eastern ports and subsequently offered sug-gestions to improve their efficiency and management optimization.
Data Envelopment Analysis (DEA) is currently the most used method for port efficiency research. DEA was first proposed in 1978, and it has advantages in avoiding subjective factors and simplifying algorithms and has been widely used in the efficiency evaluation and ranking of decision units [13]. This is known as the DEA-CCR model, which was introduced by Charnes, Cooper dan Rhodes. The first application of DEA to measure port efficiency was from Roll and Hayuth [14], a comparative analysis of 20 world ports, which showed that DEA is a useful tool for port managers and researchers to gain more insight into port performance. Then, many scholars have used DEA to measure the efficiency of ports and have achieved some insights, e.g. the DEA-BCC model proposed by Banker, Charnes dan Cooper. [15,16].
With further research, Tone [17] proposed a slacks-based measure (SBM) model, which effectively solves the problem of bias in efficiency estimation caused by traditional DEA models by introducing slack variables into the objective function. Based on the model properties, the SBM-DEA model is often used in port efficiency cases that consider undesirable outputs. Chang and Tovar [18] estimated the environmental efficiency of Korea ports using the SBM-DEA model with undesirable outputs and estimated the C O 2 emission reduction for each port. Na et al. [19] used the SBM-DEA model to estimate the environmental efficiency of eight Chinese container ports in a year. Elsayed and Shabaan Khalil [20] applied the SBM-DEA model to assess and analyze the factors that could significantly affect the level of efficiency (especially infrastructure capacity) at Safaga Port.
Although the DEA model analysis method has greatly improved the efficiency evaluation, it is unable to overcome the error problem caused by the external environment and other factors. Fried et al. [21] proposed a new technique that incorporates environmental effects and statistical noise into DEA. The technique consists of a three-stage analysis in which, in the first stage, initial measurements are made with traditional DEA. In the second stage, Stochastic Frontier Analysis (SFA) is used to perform regressions. This provides a three-way decomposition of the change in performance for each input and output due to environmental effects, managerial inefficiencies, and statistical noise. In the third stage, the inputs and outputs are adjusted to account for the environmental effects and the statistical noise found in the second stage. A Three-stage DEA deals well with the effects of environmental variables and random errors and is used by many scholars in the port efficiency assessment [22,23].
Another popular direction is dynamic efficiency measures. Some scholars have applied dynamic metrics such as the Malmquist index to port efficiency evaluation in order to dynamically consider the changes in port efficiency. Ding et al. [24] used DEA and the Malmquist productivity index (MPI) to evaluate operational and productivity efficiency change in 21 coastal small and medium-sized-port container terminals in China. Barros et al. [25] analyzed the productivity of Brazilian seaports over the period 2004–2010, using a Malmquist index with technological bias. Estache et al. [26] relied on the Malmquist index to calculate and decompose the productivity changes in infrastructure for the 11 major Mexican ports between 1996 and 1999.
However, DEA models may encounter a situation where there are multiple decision-making units (DMU) with an efficiency of 1, which means that multiple DMUs are efficient. To further determine which of the efficient decision units is more efficient, Andersen and Petersen [27] proposed a method to further differentiate the effectiveness of efficient DMUs, which later became known as the Super-efficiency model. Xiao et al. [28] ranked the efficiency and analyzed the efficiency changes from 2009 to 2019 one after another by the Super-efficiency SBM-DEA model. Wu and Goh [29] used the Super-efficiency DEA model to study container ports in 7 developed and 14 developing countries based on the import and export cargo volumes in 2005. Wang et al. [30] combined the actual and forecast values and used the Super-efficiency SBM-DEA model to derive the ranking of Vietnamese ports for past, present and future periods from 2011–2022.
All the above DEA models are derived from radial DEA and non-radial DEA, respectively, as we can see in Table 2, and non-radial DEA solves the problem that radial DEA cannot consider slack variables, but may lead to inaccurate calculation of efficiency [31]. Therefore, Tone and Tsutsui [32] proposed the epsilon-based measure (EBM) model, which is a hybrid model that integrates both radial and SBM distance functions, taking into account the diversity of input and output data and their relative importance for measuring technical efficiency. The model not only solves the shortcomings of the traditional data envelopment analysis method which does not consider the slack variables and the loss of the original proportional information of the projection values of the efficiency frontier, but also solves the problem of comparing multiple decision units at the frontier position, providing a new method for the efficiency measurement of decision units [33].

2.2. Regression Methodology

The main methods used to analyze the impact factors are traditional econometric methods and spatial econometric methods. The former is mainly the Tobit model, which addresses the regression of truncated or restricted variables [34]. Chang et al. [35] used a two-stage approach to examine the relationship between influencing factors and the efficiency of Chinese dry ports. In the first stage, DEA was used to measure the technical efficiency of these dry ports. In the second stage, Tobit regression analysis was applied to explore the relationship between efficiency and the influencing factors. Figueiredo De Oliveira and Cariou [36] used the DEA model and Tobit model to confirm that the degree of port competition affects the efficiency of container ports. Yuen et al. [37] explored the impact of foreign financing, local holding and other factors on the efficiency of Chinese container ports through a two-stage DEA approach.
However, traditional econometric methods do not consider spatial autocorrelation. They do not recognize the existence of spatial heteroskedasticity, which may lead to bias in the calculated coefficients [38]. Various spatial econometric methods, such as SLM or SEM, can capture spatial factors when the dependent variable shows some degree of spatial autocorrelation in different study areas correlation, providing better accuracy than traditional econometric methods [33].
In summary, although many scholars have explored deeply in port efficiency research, very few studies looked at the competition among ports and the spatial variability of port efficiency, and the current studies still have some defects: (a) The above DEA is derived from radial DEA and non-radial DEA, respectively. Radial DEA models assume that inputs or outputs vary according to proportions, so they may overestimate the efficiency value of DMUs. The non-radial SBM model solves the potential problems of the radial DEA model, and the non-radial DEA solves the problem that the radial DEA cannot take into account the slack variables, but may lead to inaccurate calculation of efficiency [39]. The best way to solve these problems is to combine the features of radial DEA and non-radial DEA to consolidate their advantages like EBM-DEA model does. (b) The existing literature is less concerned with the spatial autocorrelation of port efficiency. If the spatial autocorrelation of port efficiency exists, it is necessary to conduct spatial pattern analysis from the perspective of geography. The spatial Durbin model (SDM) takes into account the influence of efficiency not only by local explanatory variables but also by explanatory variables and lagged efficiency after neighboring provinces. Therefore, this study seeks to fill the gap by using Super-Efficiency EBM-DEA and spatial Durbin models and analyze the efficiency and influencing factors of ports in Guangdong Province.

3. Methodology

3.1. The Super-Efficiency EBM-DEA Model with Undesirable Outputs

3.1.1. Non-Oriented EBM-DEA Model

In this study, on top of obtaining the potential input factors such as port berths and berth length, the potential of output factors such as cargo throughput will also be studied. Hence, the results will be developed from both input and output perspectives. Since the initial EBM model is input-oriented and does not include output factors, in order to analyze the improvement of port efficiency with simultaneous changes in inputs and outputs, this paper first improves the initial model EBM into a non-oriented EBM model, which can be formulated as follows:
γ = m i n θ ε x i = 1 m ω i s i x i k φ + ε y r = 1 q ω r + s r + y r k
s . t .   j = 1 n x i j λ j + s i = θ x i k , i = 1 , , m
j = 1 n y r j λ j s r + = φ y r k , r = 1 , , s
λ 0 , s i 0 , s r + 0
There are n DMUs (j = 1, …, n) which have m inputs ( i = 1, …, m) and s outputs ( i = 1, …, s). The input matrices are indicated by Χ = { x i j } R m × n , the output matrices are denoted by Y = { y i j } R s × n . x i k , y r k refers to the inputs and outputs of decision unit k ; λ , θ refers to the linear combination coefficients and the planning parameters of the radial part of the DMU; s i is the slack of input indicator, s r + is the output slack variable; φ denotes the planning parameter of the radial part of the output indicator; ε x denotes the importance level of the non-radial part of the calculation process, ε y identifies the importance level of the non-radial part of the output indicator in the efficiency value; ω i indicates the relative importance level of the input indicator i ; ω r + indicates the relative importance level of the r th output indicator.
The efficiency calculation result γ lies between 0 and 1, higher score indicates that DMU is more efficient and the DMU is relatively more efficient than other DMUs and lies on the production frontier if γ =1.

3.1.2. EBM-DEA Model with Undesirable Outputs

In order to match the national strategic goals of carbon peaking and carbon neutrality, environmental variables are the issues that must be assessed. In this study, the port’s C O 2 emissions are included in the model as an undesirable output. Through the DEA evaluation method based on the directional distance function, the method can effectively improve the efficiency of DMUs along a specific direction, increasing the desired output while reducing the undesirable output in the same proportion to make up for the lack of unilateral improvement. This study draws on a treatment of undesirable outputs by Tone [3] as follows:
γ = m i n θ ε x i = 1 m ω i s i x i k φ + ε y r = 1 q ω r + s r + y r k + ε b t = 1 p ω t b s t b b t k
s . t .   j = 1 n x i j λ j + s i = θ x i k , i = 1 , , m
j = 1 n y r j λ j s r + = φ y r k , r = 1 , , s
λ 0 , s i 0 , s r + 0 ,   s t b 0
where b t k denotes the tth undesirable output of the k th DMU, s t b refers to the undesirable output slack variable, and the undesirable output radial planning parameters remain consistent with the desired output. ε b denotes the importance of the non-radial component of the undesirable output in the efficiency value calculation; ω t b denotes the relative importance of each undesirable output indicator, satisfying t = 1 p ω t b = 1 .

3.1.3. The Super-Efficiency EBM-DEA Model

The above EBM model has already measured the port efficiency, but there is a case when more than 1 port with efficiency scores equal to 1, and it is impossible to judge which of these ports is more or less efficient. In order to accurately assess the port efficiency, the constraints are adjusted and the non-oriented Super-Efficiency EBM-DEA model with undesirable outputs can be expressed as follows:
γ = m i n θ + ε x i = 1 m ω i s i x i k φ ε y r = 1 q ω r + s r + y r k + ε b t = 1 p ω t b s t b b t k
s . t .   j = 1 , j k n x i j λ j s j θ x i k , i = 1 , , m
j = 1 , j k n y r j λ j + s r + φ y r k , r = 1 , , s
j = 1 , j k n b t j λ j s t b b t k , t = 1 , , p
λ 0 , s i 0 , s r + 0 ,   s t b 0

3.2. Spatial Autocorrelation Analysis

The global Moran’s I is a widely used measurement of spatial autocorrelation that can portray the overall spatial characteristics of the distribution of geographical elements within a certain regional scale [9], which is calculated as follows:
I = [ n i = 1 n j = 1 n w i j ( x i x ¯ ) ( x j x ¯ ) ] [ i = 1 n j = 1 n w i j j = 1 n ( x i x ¯ ) 2 ]
where I represents the global Moran’s I; n represents the number of assessment units; x refers to the value of the assessment unit; x ¯ refers to the mean value of the assessment unit; w i j denotes the spatial weight of elements i and j , which takes the value of 1 if they are spatially adjacent, otherwise it takes the value of 0. The global Moran’s I is between 1 and −1, where the positive or negative value indicates that the elements show a positive or negative correlation in space, and 0 means the elements are uncorrelated and randomly distributed. The index I is tested for significance by the Z-value:
Z = I E ( I ) v a r ( I )
where E ( I ) represents the expectation of I , v a r ( I ) represents the variance of I , and takes the significance level of 5% to get the value of 1.96, when Z > 1.96 , it indicates that the elements are purely in significant positive correlation, that is, they can show the characteristics of spatial agglomeration, referred to as high aggregation (High-High (H-H) agglomeration area, occurs between high-value area and high-value area, or low aggregation Low-Low (L-L) agglomeration area, occurs between low-value area and low-value area. When Z is less than −1.96, there is a significant negative correlation between elements, characterized by spatial anomalies, that is, high-value regions are adjacent to low-value regions, referred to as High-Low (HL) agglomeration area, and low-value regions are adjacent to high-value regions, referred to as Low-High (LH) agglomeration area. When Z is less than or equal to 1.96, the spatial autocorrelation is insignificant and the regions are randomly distributed.

3.3. Spatial Durbin Model

Considering that there is a significant competitive relationship between neighboring ports, that is, the explanatory variables are influenced by the spatial lag term of the explanatory variables. Referring to Zhao et al. [33], a spatial Durbin model was developed to analyze the relationship between port efficiency and explanatory variables as follows:
y = ( I ρ W ) 1 ( X β + W X ¯ γ + ε )
where   ε ~ N ( 0 ,   σ 2 I ) , ε denotes the random error, γ refers to the parameter vector to measure the marginal impact of the explanatory variables in adjacent regions on the dependent variable y , W refers to the spatial weight matrix, ρ refers to the spatial autoregressive coefficients of the explanatory variables, X represents explanatory variables, β   denotes the regression coefficient of explanatory variables.
Figure 1 shows the overall flow of the methodology.

3.4. Research Area and Indicator Selection

The policy mentioned above specifies the regional port cluster layout planning scheme, which involves one core including 14 ports in the Pearl River Delta region, two poles including 4 ports in Eastern Guangdong and 3 ports in Western Guangdong. Considering the availability of data, this study selects 16 ports among the above 21 ports as the research objects to examine the port efficiency of the above ports in the 10 years from 2011 to 2020.
In the current literature on port efficiency using DEA methods, input indicators are mainly measured from three aspects: capital, labor and land. Among the input indicators, the length of berth, the number of loading and unloading equipment and the number of berths is the most important indicators. For output indicators, the vast majority of relevant literature view cargo throughput and container throughput as desired output indicators and some literature consider port operation profit or user satisfaction as output indicators. In summary, based on the data availability, this study selects the number of berths and the length of berths as input indicators, cargo throughput as desirable output indicators, and C O 2 emissions as undesirable output indicators.

4. Analysis of the Characteristics of Port Efficiency

4.1. Port Efficiency Characteristics in Guangdong Province

Based on the selected input and output indicators, the Super-Efficiency EBM-DEA efficiency values were obtained using MAXDEA software, and the port efficiency values were obtained as shown in Table 3 below.

4.2. Port Efficiency Time Series Change

The temporal changes in port efficiency of each port are shown in Figure 2. It can be seen that the port efficiency shows a fluctuating trend. The efficiencies of Guangzhou Port, Shenzhen Port and Zhanjiang Port are always at a high level, showing that the utilization rate of port resources of the three ports is very high; the scale of economic resources input and infrastructure input of Zhuhai Port belongs to the top of the province, and the efficiency value is stable at the middle and lower level of the province, which shows that its own output is not effective, and Zhuhai Port should pay more attention to the improvement of output efficiency in its future development; the output of Dongguan Port is always at the top of the province, with the orderly integration of port resources in recent years, its port efficiency has steadily improved; Foshan Port is close to Guangzhou Nansha Port, and there is a certain homogeneous competition with Nansha Port, with excess port input and low resource allocation efficiency; Zhongshan Port has also faced intense competition from Guangzhou Port, and its port efficiency has declined in recent years; Huizhou Port is at the edge of the Pearl River Delta, but the presence of international terminal enterprises has increased its port dynamism. Jiangmen Port is a very important river port with its inland network deep into the southwest hinterland of China, but its port efficiency is low; Maoming Port has been supported by a series of policies in recent years and has developed rapidly, and its port efficiency has continued to improve; although Shantou Port has accelerated its port construction and has transformed from an estuary port to a modern deep-water port, its port efficiency is still low compared with other ports in Guangdong Province, but the port efficiency of Shantou Port has improved gradually in recent years because of its foreign trade, with its foreign trade cargo throughput accounting for a larger proportion of the cargo throughput. On the other hand, the port efficiency of Yangjiang Port has decreased in recent years because of the insufficient berth capacity. The throughput capacity of Yangjiang Port is only 2.65 million tons, accounting for 17.2% of the total capacity, and the development of public terminals is slow; Yunfu Port, Qingyuan Port and Zhaoqing Port are influenced by the direct hinterland, the supply of cargo is limited, so the port efficiency value is in a state of continuous decrease in recent years.

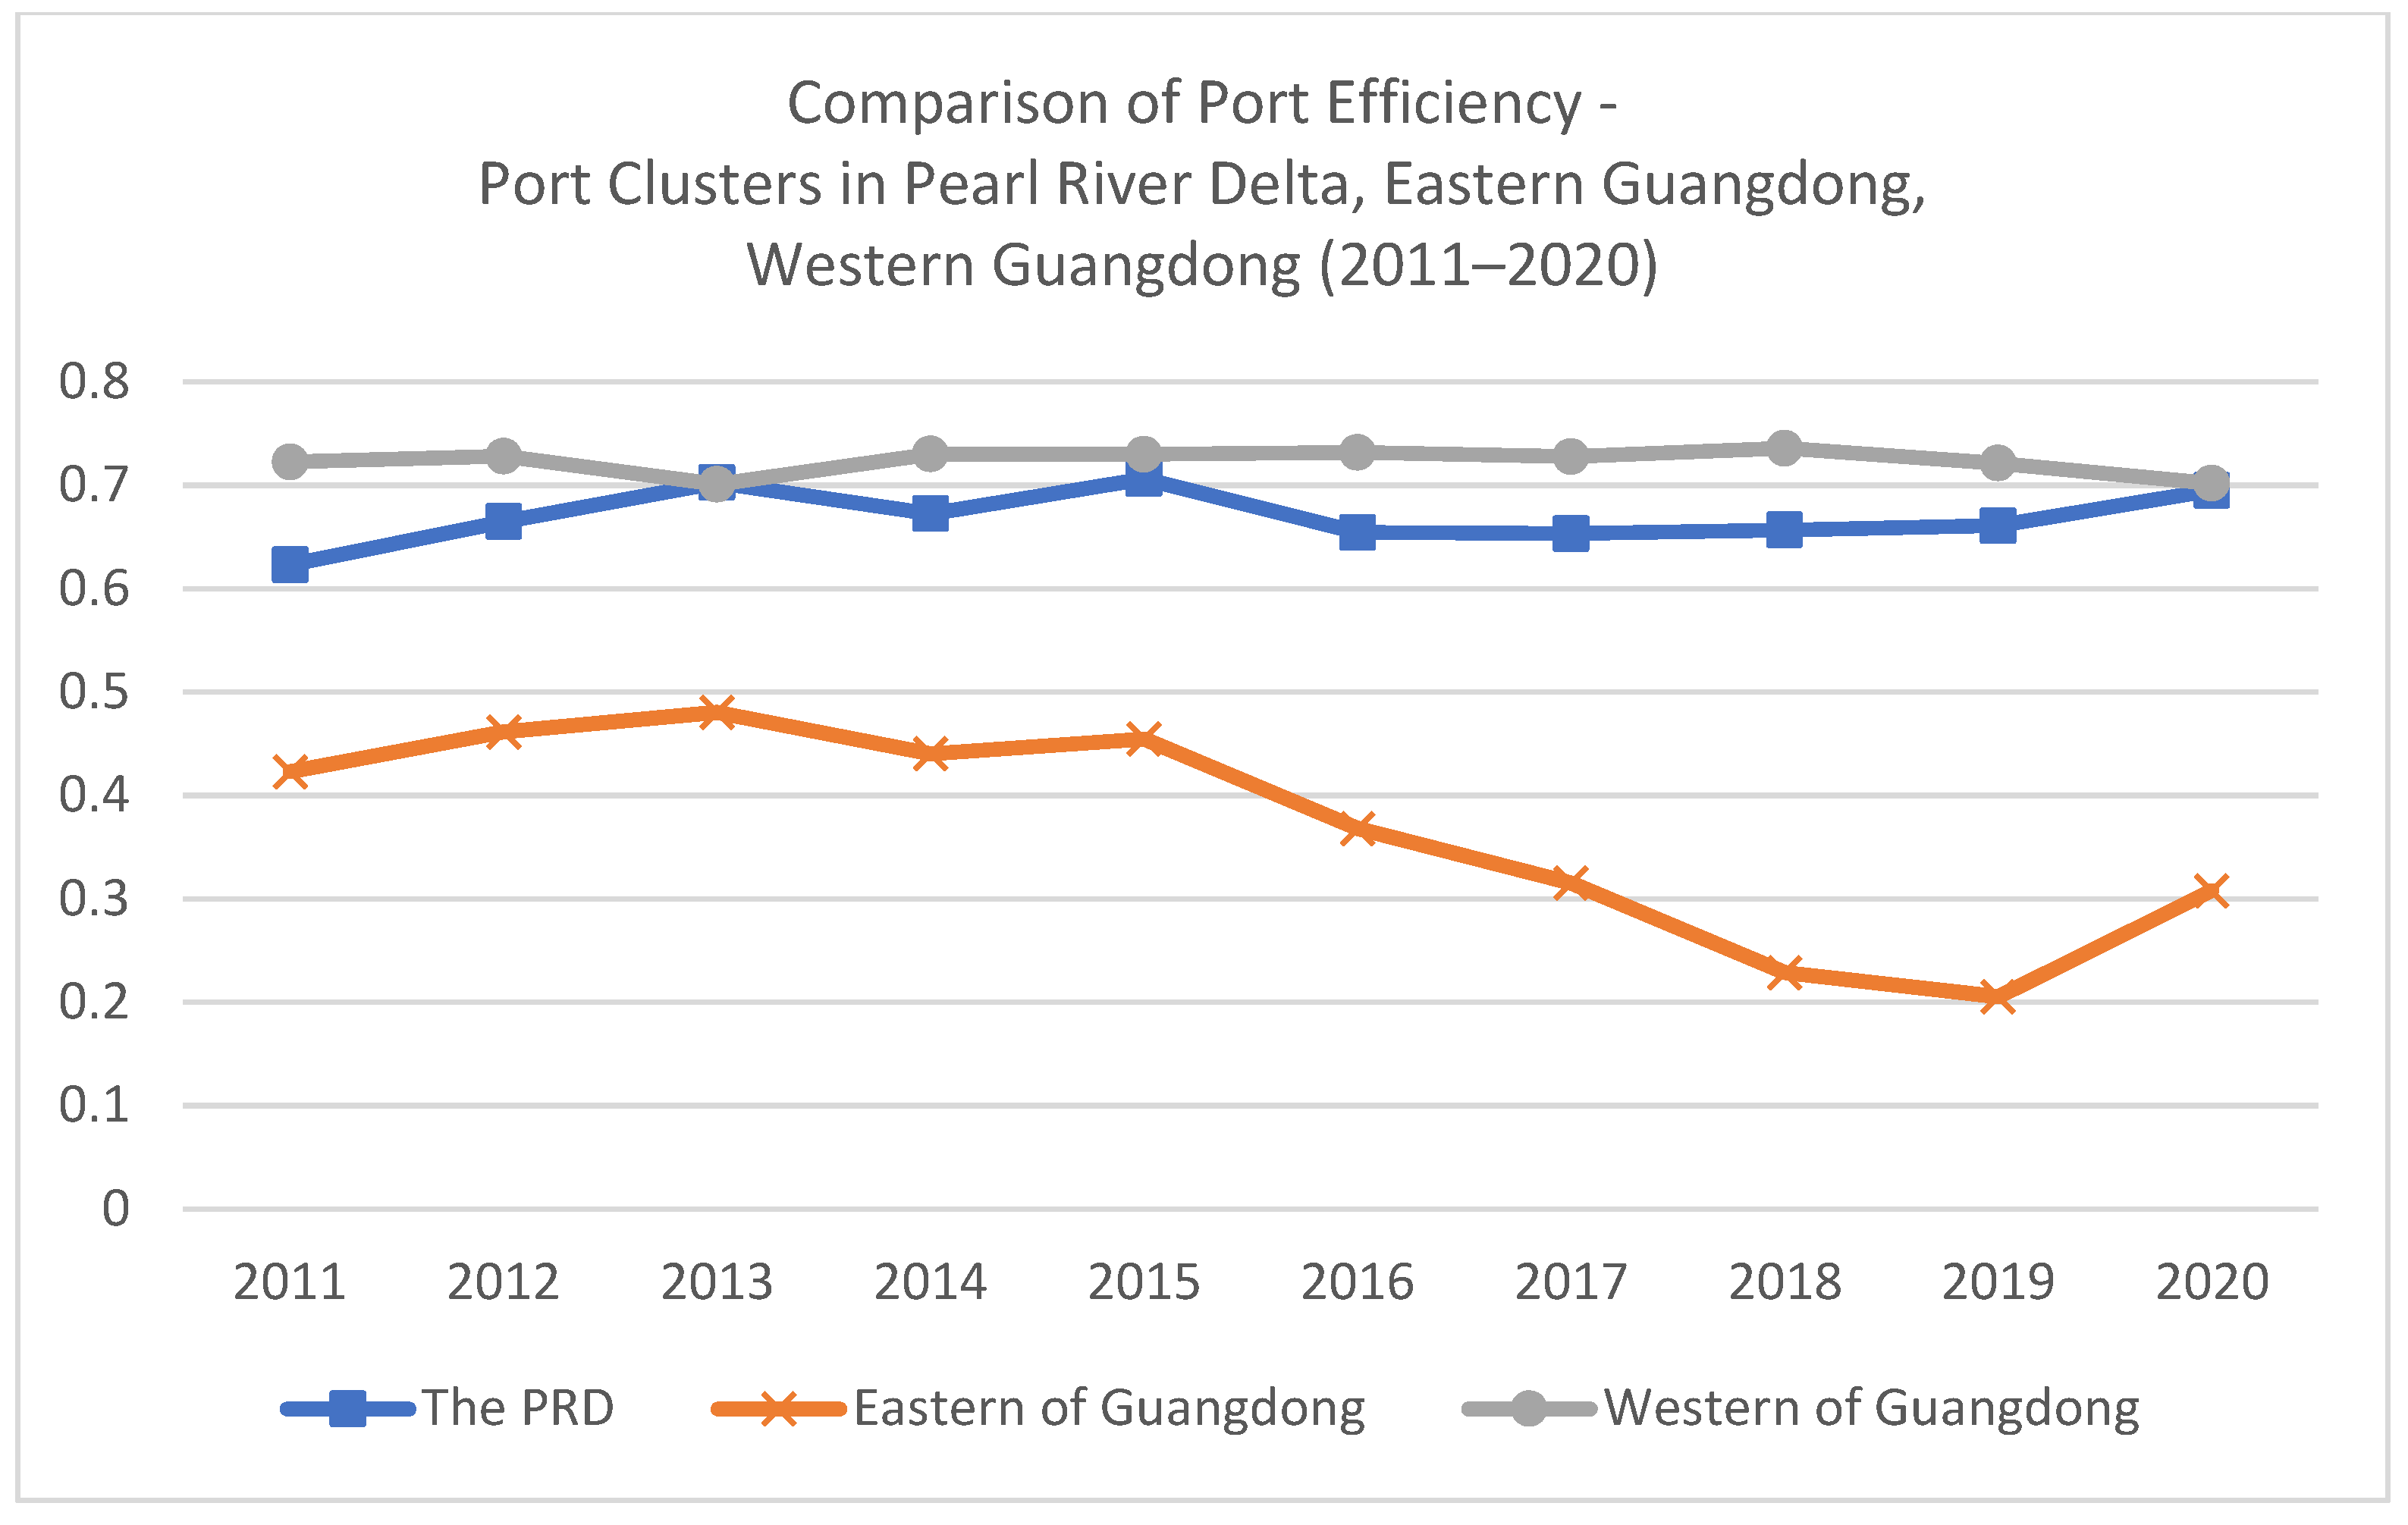
4.3. Port Efficiency Characteristics in Different Port Clusters

As can be seen in Figure 3, the port efficiency development of the Pearl River Delta port cluster and the Western Guangdong port cluster is relatively smooth and significantly higher than that of the Eastern Guangdong port cluster. As a world-class port group, the Pearl River Delta port group is one of the top five port clusters in China, with the cargo throughput of the Pearl River Delta port group (12 ports in this study) reaching 163 million tons in 2020. The port cluster has formed the layout of one city one port with the advantage of the well-developed Pearl River water system, and the problem of homogeneous competition is more prominent, and there is over allocation of resources and excess port throughput capacity. the cargo throughput of Western Guangdong port group (3 ports in this study) has reached 294 million tons in 2020. In recent years, the construction of ports in Western Guangdong has achieved certain results and made greater contributions to the socio-economic development of the hinterland, but there are also problems of homogenization in Zhanjiang, Maoming and Yangjiang due to the overlapping economic hinterland of the ports, resulting in a certain degree of waste of resources. This study can only analyze one port in Eastern Guangdong port cluster, that is Shantou port, due to the difficulty in data acquisition. Shantou port is the best deep-water port in Eastern Guangdong and the hub port of the Eastern Guangdong port cluster. Shantou port should seize the opportunity of the synergistic development of Shenzhen-Shantou to improve its own port capacity and drive the development of the East Guangdong port cluster.

5. The Spatial Autocorrelation of Port Efficiency

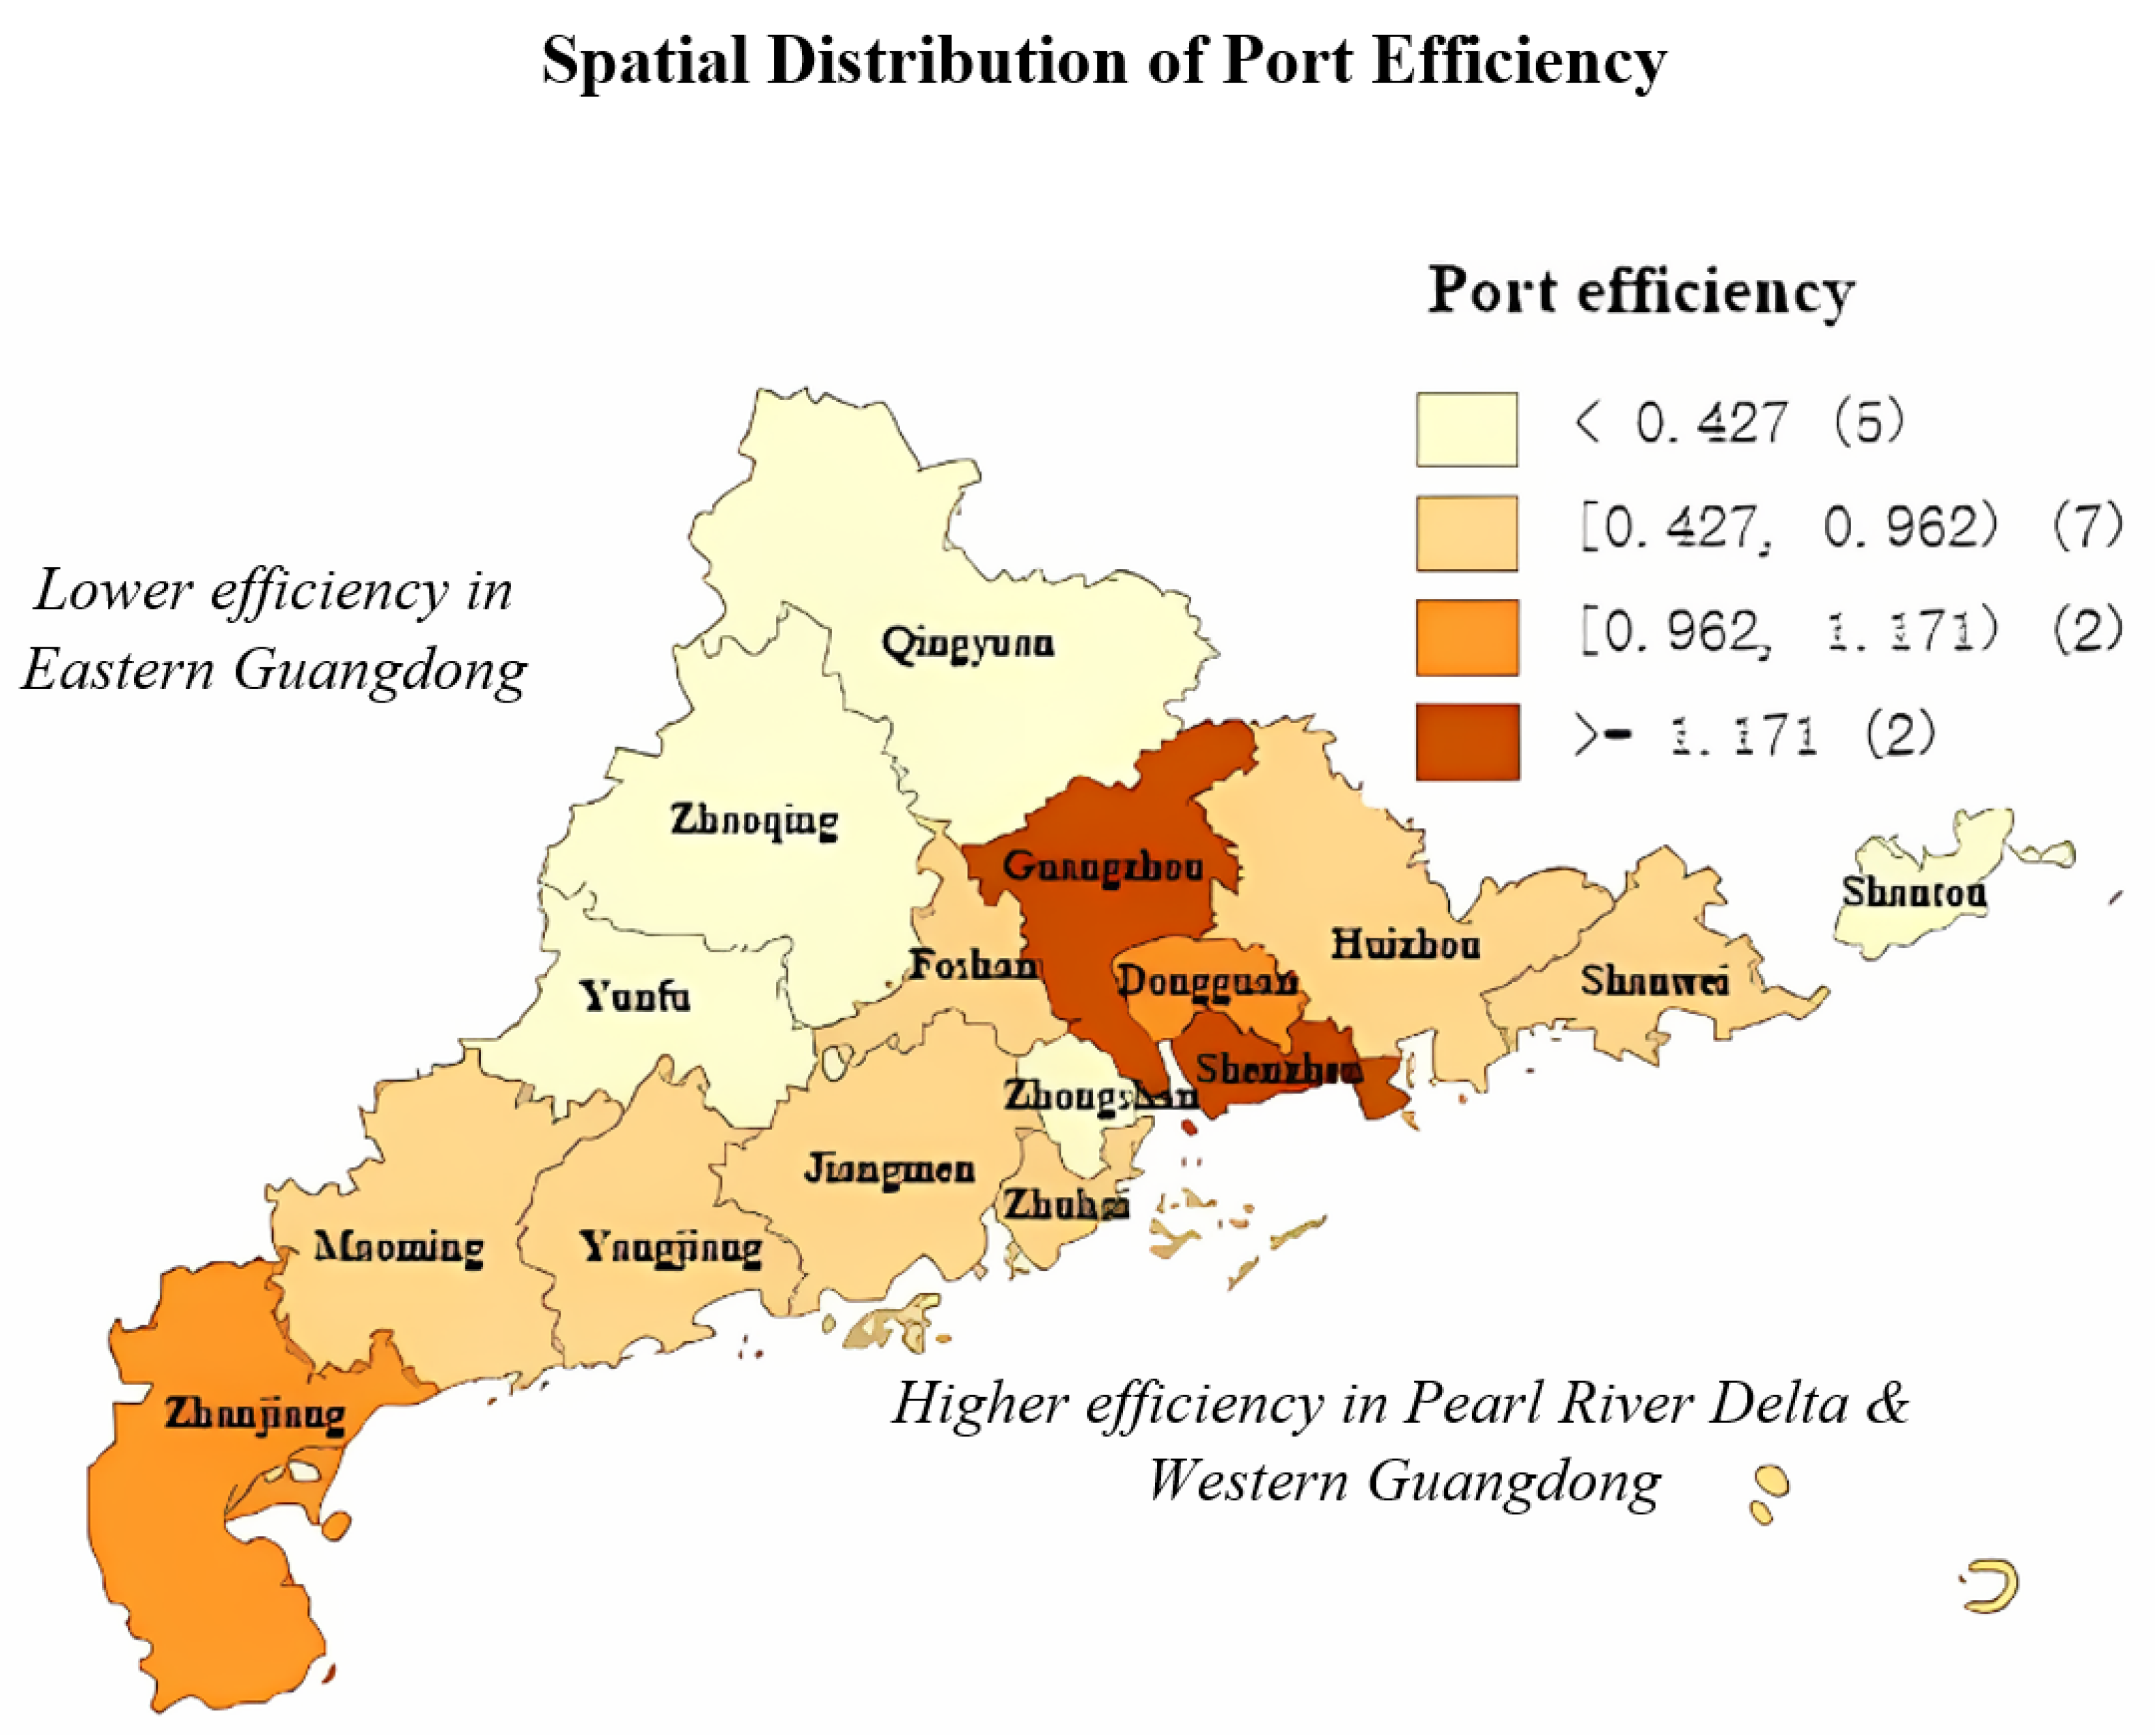
5.1. Spatial Characteristics of Port Efficiency

We visualized the spatial distribution of port efficiency values in 2020 by Geoda software, as shown in Figure 4, the spatial distribution of port efficiency yields the spatial characteristics of higher efficiency in the Pearl River Delta and Western Guangdong and lower efficiency in Eastern Guangdong.

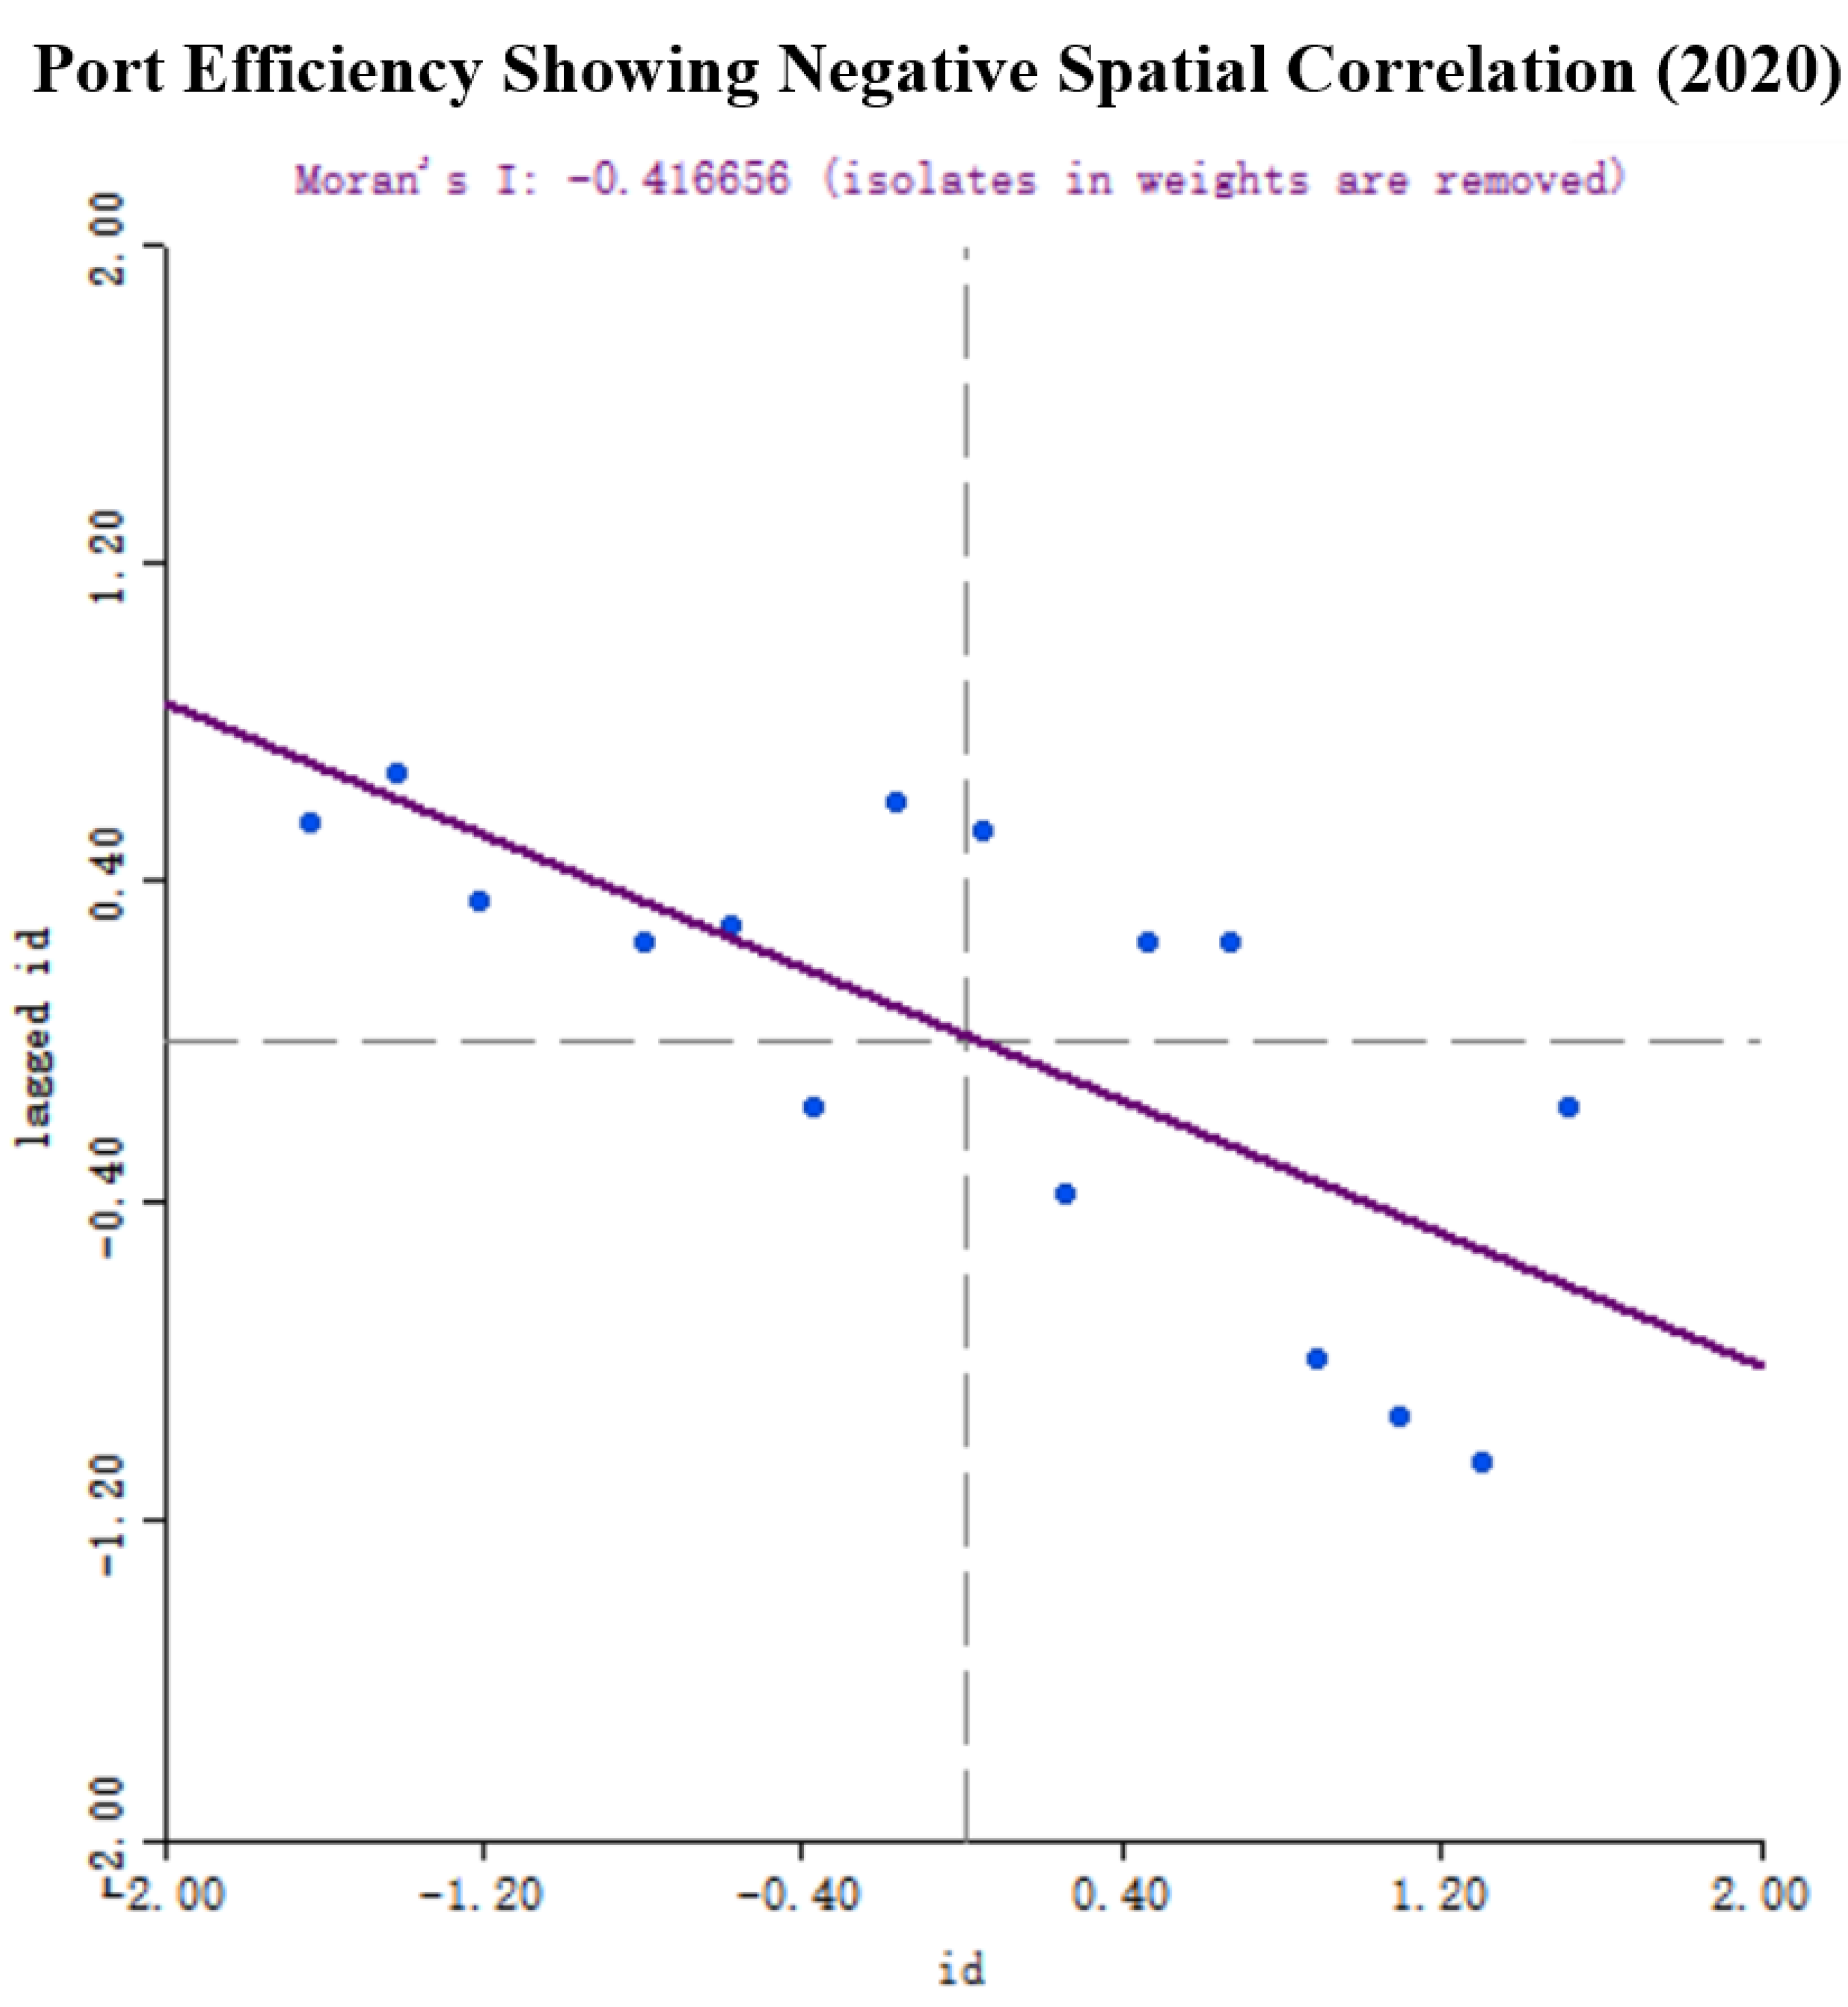
5.2. The global Spatial Autocorrelation Analysis

Before conducting the spatial effect analysis, the explanatory variables need to be tested for spatial autocorrelation. The global Moran’s I = −0.416656, z-value of −1.7942 and p-value of 0.023, which passed the significance test, as shown in Figure 5. it can be seen from the figure that: port efficiency in 2020 has a negative spatial autocorrelation. This indicates that there is a significant negative autocorrelation between the elements, which is consistent with the nature of competition between ports.

6. Factors Influencing Port Efficiency

Before conducting the spatial Durbin model analysis, it is necessary to determine the index system of port efficiency influencing factors first. Most of the early ports were mainly for the storage and handling of goods, so the geographical and natural conditions were the focus of scholars’ research on port efficiency influencing factors at that time [40,41,42]. With the change in port development, the port’s own technology level and regional economic level also become the factors that dominate the difference in port efficiency [35,37,43]. Previous research results indicated that the port has a strong pulling and restructuring effect on the development of the total economy, industry, related services and industry of the city where it is located, and in turn the output products of the city industry and industry that are compatible with the port economy are an important part of the port’s cargo source. In terms of total volume, the level of economic development of the port city, and foreign trade status directly affect the port’s throughput status. In terms of the environmental aspect, since the pollutant emissions of road transport are much higher than those of waterway transport, the share of waterway freight in the transport structure will indirectly affect the green efficiency of the port. In addition, this study also includes the port-city relationship in the area of analysis of factors affecting port efficiency. The popular method used to study the port-city relationship was proposed by Vallega [44] in his study of the relationship between Mediterranean ports and their regions as a quantitative measure of the relationship between the scale of port development and the scale of urban development.
In general, the index system of port efficiency influencing factors are shown in Table 4, and predictions on their effects on port efficiency are as follows:
(a) The level of economic development represented by Gross Domestic Product (GDP);
(b)The degree of opening up indicated by total import and export foreign trade;
(c) The port-city relationship indicated by Rank Correlation Index (RCI);
(d) The transport structure represented by proportion of the total of water freight volume to total freight volume.
It is predicted that the level of economic development, the degree of opening, the port-city relationship was positive to port efficiency, while the effects of the transport structure was unknown.
From Table 5, it can be seen that: the level of economic development (lnx1 coefficient = 0.314, p < 0.01), port-city relationship (x3 coefficient = 0.176, p < 0.01), transportation structure (x4 coefficient = 0.426, p < 0.1), and spatial lag term of economic development level (w1x_lnx1 coefficient = 0.05, p < 0.01) have a positive relationship on port efficiency, indicating that the economic development level of the hinterland, the port-city relationship and the transportation structure can improve the port efficiency, and the improvement of the competitive level of the surrounding hinterland can also improve the port efficiency. The spatial lag term of the degree of external openness (w1x_lnx2 coefficient = −0.041, p < 0.1) has a negative correlation with port efficiency, which indicates that the improvement of the level of external openness of the surrounding hinterland does not help to improve port efficiency, which may be due to the reason of vicious competition between ports. The degree of external openness (lnx2), the spatial lag term of the port-city relationship (w1x_x3), and the spatial lag term of transportation structure (w1x_x4) have insignificant effects on port efficiency with p-values greater than 0.1. In addition, there is a significant negative spatial effect of port efficiency (ρ = −0.019, p < 0.01), which further proves the characteristic of mutual competition among ports.

7. Conclusions and Policy Implications

This study measures the port efficiency of 16 ports in Guangdong Province from 2011 to 2020 using the Super-Efficiency EBM-DEA model with undesirable outputs. The study found that the port efficiency of the overall port cluster in Guangdong Province is not high on average, but shows an upward trend. The port efficiency of the Pearl River Delta port cluster and Western Guangdong port cluster is high, and the port efficiency of the Eastern Guangdong port cluster is low. According to the results of the spatial autocorrelation test, we found that the spatial cross-sectional data of port efficiency in Guangdong Province in 2020 have a negative spatial correlation, which is consistent with the fact that ports existing competition. Spatial concerns may extend to issues related to sea space demand as investigated by other scholars, who raised the concerns of normalizing port efficiency measurements to incorporate sea space elements [45].
Based on the analysis of the spatial Durbin model, it is concluded that the level of economic development, port-city relationship and transportation structure are conducive to the improvement of port efficiency, and the level of economic development has a significant positive spatial effect, while the degree of opening to the outside world has a significant negative spatial effect. This is largely in line with prior studies that explored the relationship between port efficiency and economic development. Park et al. (2019) highlighted how maritime transport is critical for economic growth as compared to air and land transport [46]. Park and Seo (2016) [47] found that container port activities have positive effects on regional economic growth; Seo and Park (2018) [48] also found evidence to show that ports are strongly correlated with economic development.
Based on the above findings, this study puts forward the following policy recommendations for the Guangdong government as well as China: (a) Accelerate the integration of port resources, strengthen the cooperation among ports, make reasonable resource allocation according to the characteristics of each port and the port clusters, and reduce homogeneous competition; (b) Given the redundancy of port infrastructure investment, we should focus on improving the level of professionalism and strengthening the quality of berths, instead of piling up the number and length of berths; (c) To reduce the proportion of road transport in the transport structure through the water cargo construction, reduce transport costs and help green transport; (d) While strengthening the development of port-related industries, port cities should further improve the effectiveness of the city’s own economic system, carry out scientific planning of city functions, improve the city’s basic service system, further strengthen the interrelationship between industries, and realize the synchronous development between cities and ports. This study did not consider uncertainty and incorporating uncertainty into the problem is an interesting future research direction [49].

Author Contributions

Conceptualization, Y.G., W.L. and H.S.L.; Data curation, Y.G. and W.L.; Formal analysis, Y.G., W.L. and H.S.L.; Investigation, Y.G. and W.L.; Methodology, Y.G. and W.L.; Project administration, Y.G.; Resources, Y.G.; Software, W.L.; Supervision, Y.G.; Validation, Y.G. and W.L.; Visualization, Y.G., W.L. and H.S.L.; Writing—Original draft, Y.G., W.L. and H.S.L.; Writing—Review and editing, Y.G., W.L. and H.S.L. All authors have read and agreed to the published version of the manuscript.

Funding

This research received funding support from the Philosophy and Social Science Foundation of Guangdong province (Grant No. GD22XGL03).

Institutional Review Board Statement

Not applicable.

Informed Consent Statement

Not applicable.

Data Availability Statement

The data presented in this study are available on request from the corresponding author.

Conflicts of Interest

The authors declare no conflict of interest.

References

  1. Chang, Y.-T.; Jo, A.; Choi, K.-S.; Lee, S. Port efficiency and international trade in China. Transp. A Transp. Sci. 2021, 17, 801–823. [Google Scholar] [CrossRef]
  2. Bottasso, A.; Conti, M.; de Sa Porto, P.C.; Ferrari, C.; Tei, A. Port infrastructures and trade: Empirical evidence from Brazil. Transp. Res. Part A Policy Pract. 2018, 107, 126–139. [Google Scholar] [CrossRef] [Green Version]
  3. Xiao, Z.; Bai, X. Impact of local port disruption on global container trade: An example of stressing testing Chinese ports using a D-vine copula-based quantile regression. Ocean Coast. Manag. 2022, 228, 106295. [Google Scholar] [CrossRef]
  4. Liu, H.; Meng, Z.-H.; Shang, Y.; Lv, Z.-F.; Jin, X.-X.; Fu, M.-L.; He, K.-B. Shipping emission forecasts and cost-benefit analysis of China ports and key regions’ control. Environ. Pollut. 2018, 236, 49–59. [Google Scholar] [CrossRef]
  5. Liu, J.; Wang, X.; Guo, J. Port efficiency and its influencing factors in the context of Pilot Free Trade Zones. Transp. Policy 2021, 105, 67–79. [Google Scholar] [CrossRef]
  6. Yang, X.; Ni, L.; Tong, F.; Zhang, H. Optimal Management and Allocation of Superior Resources in Port Industries. J. Coast. Res. 2019, 94, 500. [Google Scholar] [CrossRef]
  7. Wang, L.; Zhou, Z.; Yang, Y.; Wu, J. Green efficiency evaluation and improvement of Chinese ports: A cross-efficiency model. Transp. Res. Part D Transp. Environ. 2020, 88, 102590. [Google Scholar] [CrossRef]
  8. Yang, L.; Zhang, Q.; Lv, Z.; Zhang, Y.; Yang, Z.; Fu, F.; Lv, J.; Wu, L.; Mao, H. Efficiency of DECA on ship emission and urban air quality: A case study of China port. J. Clean. Prod. 2022, 362, 132556. [Google Scholar] [CrossRef]
  9. Liu, M. Research on Port Infrastructure, Port Efficiency and Urban Trade Development. J. Coast. Res. 2020, 115, 220–222. [Google Scholar] [CrossRef]
  10. Wang, J.; Yang, M. Measurement and Comparison of Economic Efficiency of Major Coastal Ports in China. J. Coast. Res. 2020, 115, 687–691. [Google Scholar] [CrossRef]
  11. Li, L.-L.; Seo, Y.-J.; Ha, M.-H. The efficiency of major container terminals in China: Super-efficiency data envelopment analysis approach. Marit. Bus. Rev. 2021, 6, 173–187. [Google Scholar] [CrossRef]
  12. Mustafa, F.S.; Khan, R.U.; Mustafa, T. Technical efficiency comparison of container ports in Asian and Middle East region using DEA. Asian J. Shipp. Logist. 2021, 37, 12–19. [Google Scholar] [CrossRef]
  13. Charnes, A.; Cooper, W.W.; Rhodes, E. Measuring the efficiency of decision making units. Eur. J. Oper. Res. 1978, 2, 429–444. [Google Scholar] [CrossRef]
  14. Roll, Y.; Hayuth, Y. Port performance comparison applying data envelopment analysis (DEA). Marit. Policy Manag. 1993, 20, 153–161. [Google Scholar] [CrossRef]
  15. Martínez-Budría, E.; Díaz-Armas, R.; Navarro-Ibañez, M.; Ravelo-Mesa, T. A study of the efficiency of spanish port authorities using data envelopment analysis. Int. J. Transp. Econ. 1999, 26, 237–253. [Google Scholar]
  16. Tongzon, J. Efficiency measurement of selected Australian and other international ports using data envelopment analysis. Transp. Res. Part A Policy Pract. 2001, 35, 107–122. [Google Scholar] [CrossRef]
  17. Tone, K. A slacks-based measure of efficiency in data envelopment analysis. Eur. J. Oper. Res. 2001, 130, 498–509. [Google Scholar] [CrossRef] [Green Version]
  18. Chang, V.; Tovar, B. Metafrontier analysis on productivity for West Coast of South Pacific terminals. Transp. Res. Part A Policy Pract. 2017, 103, 118–134. [Google Scholar] [CrossRef]
  19. Na, J.-H.; Choi, A.-Y.; Ji, J.; Zhang, D. Environmental efficiency analysis of Chinese container ports with CO2 emissions: An inseparable input-output SBM model. J. Transp. Geogr. 2017, 65, 13–24. [Google Scholar] [CrossRef]
  20. Elsayed, A.; Khalil, N.S. Evaluate and Analysis Efficiency of Safaga Port Using DEA-CCR, BCC and SBM Models–Comparison with DP World Sokhna. IOP Conf. Ser. Mater. Sci. Eng. 2017, 245, 042033. [Google Scholar] [CrossRef] [Green Version]
  21. Fried, H.O.; Lovell, C.A.K.; Schmidt, S.S.; Yaisawarng, S. Accounting for Environmental Effects and Statistical Noise in Data Envelopment Analysis. J. Prod. Anal. 2002, 17, 157–174. [Google Scholar] [CrossRef]
  22. Huang, X.; Wang, Y.; Dai, X.; Luo, J.X.; Chen, J. Evaluation of port efficiency in shanghai port and busan port based on three-stage dea model with environmental concerns. Transport 2020, 35, 454–461. [Google Scholar] [CrossRef] [Green Version]
  23. Gao, L.; Sun, Q. Operation Efficiency Evaluation of Listed Port Companies in China. J. Coast. Res. 2020, 111, 317–321. [Google Scholar] [CrossRef]
  24. Ding, Z.-Y.; Jo, G.-S.; Wang, Y.; Yeo, G.-T. The Relative Efficiency of Container Terminals in Small and Medium-Sized Ports in China. Asian J. Shipp. Logist. 2015, 31, 231–251. [Google Scholar] [CrossRef] [Green Version]
  25. Barros, C.P.; Felício, J.A.; Fernandes, R.L. Productivity analysis of Brazilian seaports. Marit. Policy Manag. 2012, 39, 503–523. [Google Scholar] [CrossRef]
  26. Estache, A.; de la Fé, B.T.; Trujillo, L. Sources of efficiency gains in port reform: A DEA decomposition of a Malmquist TFP index for Mexico. Util. Policy 2004, 12, 221–230. [Google Scholar] [CrossRef]
  27. Andersen, P.; Petersen, N.C. A Procedure for Ranking Efficient Units in Data Envelopment Analysis. Manag. Sci. 1993, 39, 1261–1264. [Google Scholar] [CrossRef]
  28. Xiao, Y.; Qi, G.; Jin, M.; Yuen, K.F.; Chen, Z.; Li, K.X. Efficiency of Port State Control inspection regimes: A comparative study. Transp. Policy 2021, 106, 165–172. [Google Scholar] [CrossRef]
  29. Wu, Y.-C.J.; Goh, M. Container port efficiency in emerging and more advanced markets. Transp. Res. Part E Logist. Transp. Rev. 2010, 46, 1030–1042. [Google Scholar] [CrossRef]
  30. Wang, C.-N.; Day, J.-D.; Lien, N.T.K.; Chien, L.Q. Integrating the Additive Seasonal Model and Super-SBM Model to Compute the Efficiency of Port Logistics Companies in Vietnam. Sustainability 2018, 10, 2782. [Google Scholar] [CrossRef] [Green Version]
  31. Sueyoshi, T.; Goto, M. DEA environmental assessment of coal fired power plants: Methodological comparison between radial and non-radial models. Energy Econ. 2012, 34, 1854–1863. [Google Scholar] [CrossRef]
  32. Tone, K.; Tsutsui, M. An epsilon-based measure of efficiency in DEA—A third pole of technical efficiency. Eur. J. Oper. Res. 2010, 207, 1554–1563. [Google Scholar] [CrossRef]
  33. Zhao, P.; Zeng, L.; Li, P.; Lu, H.; Hu, H.; Li, C.; Zheng, M.; Li, H.; Yu, Z.; Yuan, D.; et al. China’s transportation sector carbon dioxide emissions efficiency and its influencing factors based on the EBM DEA model with undesirable outputs and spatial Durbin model. Energy 2022, 238, 121934. [Google Scholar] [CrossRef]
  34. Tobin, J. Estimation of relationships for limited dependent variables. Econom. J. Econom. Soc. 1958, 26, 24–36. [Google Scholar] [CrossRef] [Green Version]
  35. Chang, Z.; Yang, D.; Wan, Y.; Han, T. Analysis on the features of Chinese dry ports: Ownership, customs service, rail service and regional competition. Transp. Policy 2019, 82, 107–116. [Google Scholar] [CrossRef]
  36. De Oliveira, G.F.; Cariou, P. The impact of competition on container port (in)efficiency. Transp. Res. Part A Policy Pract. 2015, 78, 124–133. [Google Scholar] [CrossRef]
  37. Yuen, A.C.-L.; Zhang, A.; Cheung, W. Foreign participation and competition: A way to improve the container port efficiency in China? Transp. Res. Part A Policy Pract. 2013, 49, 220–231. [Google Scholar] [CrossRef]
  38. Yang, W.; Wang, W.; Ouyang, S. The influencing factors and spatial spillover effects of CO2 emissions from transportation in China. Sci. Total Environ. 2019, 696, 133900. [Google Scholar] [CrossRef]
  39. Yang, L.; Wang, K.-L.; Geng, J.-C. China’s regional ecological energy efficiency and energy saving and pollution abatement potentials: An empirical analysis using epsilon-based measure model. J. Clean. Prod. 2018, 194, 300–308. [Google Scholar] [CrossRef]
  40. Slack, B. Containerization, inter-port competition, and port selection. Marit. Policy Manag. 1985, 12, 293–303. [Google Scholar] [CrossRef]
  41. McCalla, R.J. Canadian container ports: How have they fared? How will they do? Marit. Policy Manag. 1994, 21, 207–217. [Google Scholar] [CrossRef]
  42. Tongzon, J.L. Determinants of port performance and efficiency. Transp. Res. Part A Policy Pract. 1995, 29, 245–252. [Google Scholar] [CrossRef]
  43. Hwang, C.-C.; Chiang, C.-H. Cooperation and Competitiveness of Intra-Regional Container Ports. J. East. Asia Soc. Transp. Stud. 2010, 8, 2283–2298. [Google Scholar]
  44. Vallega, A. Fonctions portuaires et polarisations littorales dans la nouvelle régionalisation de la Méditerranée, quelques réflexions. Villes Et Ports Développement Portuaire Croissance Spat. Des Villes Environ. Littoral 1979, 355–367. [Google Scholar]
  45. Yap, W.Y.; Loh, H.S. Next generation mega container ports: Implications of traffic composition on sea space demand. Marit. Policy Manag. 2019, 46, 687–700. [Google Scholar] [CrossRef]
  46. Park, J.S.; Seo, Y.-J.; Ha, M.-H. The role of maritime, land, and air transportation in economic growth: Panel evidence from OECD and non-OECD countries. Res. Transp. Econ. 2019, 78, 100765. [Google Scholar] [CrossRef]
  47. Park, J.S.; Seo, Y.-J. The impact of seaports on the regional economies in South Korea: Panel evidence from the augmented Solow model. Transp. Res. Part E Logist. Transp. Rev. 2016, 85, 107–119. [Google Scholar] [CrossRef]
  48. Seo, Y.-J.; Park, J.S. The role of seaports in regional employment: Evidence from South Korea. Reg. Stud. 2017, 52, 80–92. [Google Scholar] [CrossRef]
  49. Wang, W.; Wu, Y. Is uncertainty always bad for the performance of transportation systems? Commun. Transp. Res. 2021, 1, 100021. [Google Scholar] [CrossRef]
Figure 1. Flowchart of the methodology.
Futuretransp 03 00002 g001
Figure 2. Port efficiency time series change from 2011 to 2020.
Futuretransp 03 00002 g002
Figure 3. Port efficiency of three port clusters.
Futuretransp 03 00002 g003
Figure 4. Spatial distribution characteristics of port efficiency.
Futuretransp 03 00002 g004
Figure 5. The Moran’s I scatterplot of 16 port efficiency in 2020.
Futuretransp 03 00002 g005
Table 1. Coastal port cargo throughput and container throughput in 2020.
ProvinceCargo Throughput
(‘000 Tons)
ProvinceContainer Throughput
(‘000 TEUs)
Guangdong1,757,880Guangdong60,440
Shandong1,688,810Shanghai43,500
Zhejiang1,414,470Zhejiang32,190
Hebei1,204,460Shandong31,910
Liaoning820,040Tianjin18,350
Table 2. Summary of DEA models used in port efficiency.
Author(s)MethodologyVariables
Roll and Hayuth [14]DEAInputs: berth length, berth area, number of bridge cranes, number of yard cranes, number of straddle carriers;
Outputs: container throughput.
MartÍNez-BudrÍA et al. [15]DEA-BCCInputs: berth length, container berth length;
Outputs: container throughput, cargo throughput.
Tongzon [16]DEA-CCRInputs: number of cranes, berths and tugs, terminal area, delay time and labor;Outputs: container throughput, ship working rate.
Estache et al. [26] DEA-MalmquistInputs: length of docks, number of workers;
Outputs: the volume of merchandise handled (loading and unloading).
Wu and Goh [29]Super-efficiency DEAInputs: terminal area, total quay length, number of pieces of equipment;
Outputs: container throughput.
Ding et al. [24] DEA-MalmquistInputs: terminal length, handling equipment quantity, staff quantity;
Outputs: container throughput.
Chang and Tovar [18]SBM-DEAInputs: number of workers, a capital variable approximated by the stock of net fixed assets, obtained from each terminal;
Outputs: container throughput, gerolling freight and bulk cargo.
Elsayed and Shabaan Khalil [20]SBM-DEAInputs: number of berth, berth length, land area, fixed cranes, yard cranes, water area, storage, terminal, depth of berth, passenger station, labor;
Outputs: cargo throughput.
Na et al. [19] SBM-DEAInputs: berth lengths, port area, number of quay cranes, and number of yard cranes;
Outputs: container throughput and C O 2 emission.
Wang et al. [30]Super-SBMInputs: total assets, owner’s equity;
Outputs: net revenue, gross profit.
Huang et al. [22] Three-stage DEAInputs: the number of production berths, the length of production quay and the number of container cranes;
Outputs: cargo throughput, container throughput.
Xiao et al. [28]Super-SBMInputs: number of inspections;
Outputs: inspections with deficiencies (DEF), inspections with detentions (DET)
Table 3. Port efficiency by port from 2011 to 2020.
2011201220132014201520162017201820192020
Dongguan Port0.8010.8860.9260.9140.9360.8740.8300.8070.8650.962
Foshan Port0.2020.2070.2340.2240.2590.2270.2400.1700.3780.427
Guangzhou Port1.1151.1971.2681.1031.1751.0901.1771.2251.1931.171
Huizhou Port0.6370.5570.6050.6100.5630.6640.4130.4630.6140.684
Jiangmen Port0.2790.2980.3100.2900.3110.2520.2580.1980.2610.446
Maoming Port0.5820.5330.5030.5350.5140.5020.3380.3460.4230.514
Qingyuan Port0.1890.2010.2100.3070.3520.3630.3750.3260.2720.229
Shantou Port0.4230.4620.4800.4400.4550.3680.3150.2290.2050.308
Shanwei Port0.4010.4550.5480.3080.3940.3570.3440.4910.3820.436
Shenzhen Port1.0621.0851.1061.0181.1321.0761.1871.2771.2151.210
Yangjiang Port0.5750.6030.5510.6240.6130.6440.6870.6990.6640.566
Yunfu Port0.1540.1560.1730.1510.1490.1680.1800.1620.1950.220
Zhanjiang Port1.0101.0481.0491.0311.0631.0501.1581.1631.0771.026
Zhaoqing Port0.1770.2020.2270.2430.3440.3830.3250.3940.3090.282
Zhongshan Port0.6470.6350.7720.8040.7390.4860.5200.5250.1940.205
Zhuhai Port0.3030.5370.5300.4890.5400.4420.4260.3480.5060.538
Table 4. Influencing factors and prediction of effect.
FactorsIndicators/CalculationsPrediction of Effect
Economic Development LevelGDPPositive
Opening LevelTotal import and export foreign tradePositive
Port-city relationshipRCI Positive
Transportation structureThe proportion of the total water freight volume to total freight volumeUnknown
Table 5. Unit root test.
CoefficientStd.Err.Z p
lnx10.3140.0913.450.001
lnx2−0.0610.055−1.120.263
x30.1760.0453.890.000
x40.4260.2281.870.062
w1x_lnx10.0500.0104.910.000
w1x_lnx2−0.0410.016−2.490.013
w1x_x3−0.0480.036−1.340.182
w1x_x4−0.1530.158−0.970.333
ρ −0.0190.113−0.170.068
Sigma0.1010.0185.650.000
cons−2.0530.515−3.990.000
Disclaimer/Publisher’s Note: The statements, opinions and data contained in all publications are solely those of the individual author(s) and contributor(s) and not of MDPI and/or the editor(s). MDPI and/or the editor(s) disclaim responsibility for any injury to people or property resulting from any ideas, methods, instructions or products referred to in the content.

