Article

Analysing the Potential of Performing Last-Mile Bicycle Deliveries: The Perspective of Brazilian Logistics Operators

by
Carla de Oliveira Leite Nascimento
1 and
Leise Kelli de Oliveira
2,*
1
Faculty of Logistics, Molde University College, 6410 Molde, Norway
2
Department of Transportation and Geotechnical Engineering, Federal University of Minas Gerais, Belo Horizonte 31270-901, Brazil
*
Author to whom correspondence should be addressed.
Future Transp. 2023, 3(1), 296-310; https://doi.org/10.3390/futuretransp3010018
Submission received: 13 December 2022 / Revised: 6 February 2023 / Accepted: 10 February 2023 / Published: 1 March 2023

Abstract

:
Knowledge about the perception of stakeholders regarding the effectiveness of last-mile bicycle deliveries is essential to promote solutions at a local and national level. However, their use is an incipient solution in the Brazilian context. This paper aims to analyse the potential of performing last-mile bicycle deliveries according to the perspective of Brazilian logistics operators. First, the variables that affect the decision of logistic operators to adopt bicycles were captured using the theory of planned behaviour. Later, the intention of behaviour was measured by estimating an ordered logistic regression. The results showed that environmental awareness, public policies and weather conditions negatively influence the intention of logistics operators to perform last-mile bicycle deliveries in Brazil. However, these variables are more cultural than operational, and could be changed by awareness of the importance of performing last-mile bicycle deliveries to promote sustainable cities. Additionally, the findings could encourage the development of sustainable freight policies from private companies to achieve sustainable future transportation.

1. Introduction

The use of bicycles for last-mile deliveries has been discussed as a possible way to achieve sustainable urban freight transport [1,2,3,4]. Studies in Europe and the United States show that bicycles may be suitable for home deliveries (mainly up to 5 km). Moreover, the travel time may be similar to (or shorter) diesel-powered freight vehicles [3]. On the contrary, using bicycles or cargo bikes for performing last-mile deliveries is not usual in Brazil. However, bicycles have been used for e-commerce deliveries to and from local retailers to their destination in some large Brazilian cities, such as Rio de Janeiro [5]. This use contradicts common sense by meeting the demand for product distribution where motorcycles, automobiles and trucks are predominant or the only option [5]. However, a lack of awareness, knowledge of competitiveness and regulation of bicycles as freight vehicles create a barrier and limit their growth potential in Brazilian cities [6].
The main barriers to implementing last-mile bicycle delivery are related to the acceptance that bicycles could replace freight vehicles. This resistance is related to a lack of security (both theft and accidents), low load capacity, available cycling infrastructure and the prejudgment that the bicycle is suitable only for leisure or for the displacement of people [3,7]. Additionally, society does not see bicycles as viable and economical freight vehicles due to a lack of knowledge of specific regulations and incentives [3]. Furthermore, local authorities have a fundamental role to play in including bicycles in freight policies. These perception factors end up restricting the market to small and medium-sized companies. Additionally, knowledge about the costs and competitiveness of last-mile bicycle deliveries compared to standard delivery options requires demonstrating its economic and operational viability [7]. Therefore, economic viability increases the success of this delivery option [8].
This paper was inspired by the study developed by Gruber and Kihm [9]. The authors analysed the use of electric cargo bicycles for last-mile deliveries from the perspective of courier messengers. Although several pilot cases demonstrate the viability of performing last-mile bicycle delivery, no studies dealt with the perspective of the logistics operator. A logistics operator provides services combined with transport and storage services. Additionally, few works illustrate the last-mile bicycle delivery in developing countries, with most reporting trial cases [5,10,11].
Based on the above, the following research question is addressed in this paper: what factors can affect last-mile bicycle delivery according to logistic operators? Furthermore, according to logistics operators in Brazil, the following hypothesis was conjectured: the last-mile bicycle delivery has no barriers. Therefore, this paper aims to identify the variables and measure their influence on performing last-mile bicycle delivery according to the perspective of logistics operators. The Theory of Planned Behaviour (TPB) was the methodological technique used, being helpful when evaluating the intention of behaviour in adopting new technologies, product implementation and habit change, among others.
The contribution of this paper is threefold. First, we show that the TPB measures intentional behaviour toward bicycle adoption for last-mile deliveries in Brazil. Second, we demonstrate that Brazilian logistics operators have cultural resistance to performing last-mile bicycle delivery. Finally, findings could encourage sustainable freight policies. Bicycles are generally considered a freight solution in the Sustainable Urban Mobility Plan (SUMP) in the European Union. The Brazilian Urban Mobility Policy (version corresponding to the SUMP) suggests prioritising non-motorised transportation modes to improve urban mobility. Therefore, despite not being explicitly mentioned as a solution for sustainable development, performing last-mile bicycle delivery contributes to sustainable development goals.
This paper is divided into five sections. After this introductory section, Section 2 presents the influential factors of performing last-mile bicycle delivery. Section 3 reports the application of TPB in UFT. Section 4 draws the research method, delivering the results in Section 5. Finally, Section 6 closes this paper with the conclusion.

2. Influential Factors of Performing Last-Mile Bicycle Delivery

The use of bicycles for last-mile deliveries is considered from several perspectives in literature, including the characterisation and identification of the companies [8,12], the economic and environmental factors [3,13,14], the potential market [4,15,16,17,18], case studies or pilot projects [1,7,19,20,21,22]. The advantages of performing last-mile bicycle delivery are related to the weight and size of the packages. Additionally, bicycles achieve their most significant benefits compared to motorised freight vehicles in urban and congested areas [23,24]. On the other hand, the main barriers are related to acceptance that a bicycle is a suitable vehicle for last-mile deliveries, lack of security (both theft and accidents), low load capacity, available infrastructure and the prejudgment that a bicycle is suitable only for leisure or as a mode of transport [25,26].
The theoretical basis indicates some factors in performing last-mile bicycle delivery. Most factors concern operation, such as road safety [20,27], security [28,29], operational cost [1,13,15,17], efficiency, reliability [7,30], weather conditions [31,32] and topography [33,34]. Other factors are related to environmental awareness [5,7,16,30,35]. The infrastructure also has a vital role in using cargo bikes, such as cycling infrastructure [22,36,37] and urban distribution centres or micro hubs [19,21,33,38,39]. Furthermore, the positive perception of the company [17,20], its competitive advantage [35,40] and visibility [7,15,38] are factors that can stimulate performing last-mile bicycle delivery. Finally, a freight policy agenda could encourage logistics operators to adopt more sustainable delivery vehicles, such as bicycles [3,4,30].
In Brazil, the literature describes the use of bicycles in urban delivery [5,10,33] and the benefits of combining mobile distribution centres and cargo bikes [11]. More specifically, the characteristics of Brazilian cargo bike companies were described in [33]. Furthermore, the benefits of performing last-mile bicycle delivery in Copacabana (Rio de Janeiro) were described by [5]. In Rio de Janeiro, 628 bicycles (all 100% powered by human energy) performed 7524 daily deliveries in seven neighbourhoods [10]. Furthermore, a pilot test using cargo tricycles and conventional trucks identified successful results based on environmental and financial factors [11].
The literature has few works on last-mile bicycle delivery for developing countries. In addition to improving the economic competitiveness of urban areas, the promise of reducing greenhouse gas emissions from the transport sector encourages last-mile bicycle delivery in Europe. This promise also can be achieved in Brazil. Furthermore, last-mile bicycle delivery could address problems related to urban freight mobility in Brazilian cities, which is exacerbated due to inadequate urban and transport planning, combined with the low importance given to the urban freight transport [29,41]. Typically, restrictive measures are implemented by the government to limit the circulation of freight vehicles in some areas of cities, and this, together with the lack of urban planning and transport, causes negative impacts on access to goods in urban areas and the quality of life of citizens [36,37].
Nevertheless, Brazil has similar characteristics to other places, mainly regarding bicycle limitations related to dangerous situations in road traffic. Therefore, identifying the crucial factors contributing to last-mile bicycle delivery contributes to sustainable freight transport. Considering city authorities’ perspective, the literature shows that urban mobility plans should consider freight in transportation planning. In addition, urban mobility plans must include bicycles as sustainable vehicles for last-mile deliveries. Therefore, local authorities should encourage this measure for logistics operator companies, and not just cargo bike companies. Therefore, implementing bicycle infrastructure associated with restricted access measures or restricted parking policies in densely populated areas should reduce the challenges faced by cargo bike companies and stimulate the expansion of last-mile bicycle delivery.

3. Theory of Planned Behaviour and UFT

UFT solutions must consider stakeholders’ objectives for efficient operation, and long-term plans must be developed and included in urban development strategies [42]. In recent years, scholars have considered motivations and assessed alternative costs and benefits of these actions [9,34]. However, the literature suggests that the perception of stakeholders regarding the performing of last-mile bicycle delivery needs to be explored more. This knowledge is essential to promote sustainable solutions [12]. Transport systems, like other technologies, are marked by a strong dependence on routes due to habits, infrastructure and market rigidity. Therefore, new solutions must go through cyclical phases, beginning with experiments, introduction and adoption that are spread and then obsolete. This dependence path is challenging for innovative solutions. Therefore, the decision to replace conventional vehicles with more sustainable ones is based on the existence of a reliable and viable alternative. Currently, the bicycle is being adopted and disseminated in some countries, while in Brazil, most cases are trial tests or in a beginning phase.
Despite this, Vasconcellos [40] points out that resorting to European experiences for using the bicycle can bring good ideas to Brazil. Therefore, the conclusions can be misleading and the results can be frustrating if one does not consider that Europeans’ perception of the bicycle is generally well accepted [40]. Thus, it is necessary to consider the perception difference between Europeans and Brazilians. In Brazil, for example, there are similar characteristics in different places, mainly regarding limitations to the use of bicycles related to traffic safety. However, given the diverse characteristics of Brazilian cities, it is necessary to properly know the specificities to increase last-mile bicycle delivery in the urban freight transport system. Thus, knowing the role of bicycles in last-mile deliveries can help identify similar factors that boost or slow down this delivery service. Therefore, the perception of the effectiveness of last-mile bicycle deliveries depends on the location, and is usually related to how it has been used.
Based on the above, the TPB helps to analyse the influential factors in performing last-mile bicycle deliveries. Furthermore, the TPB aims to understand and predict social behaviours and behavioural intentions that precede and condition natural behaviours [43]. Nonetheless, adopting a new behaviour depends on the effort to achieve it (the strength of the attempt) and the individual’s control over other factors, such as information and skills, including willpower, time and opportunity [43].
Three constructs determine behavioural intention: attitudes construct; perceived behaviour; and subjective norm [44]. Constructs are a set of variables representing a concept within a specific theoretical framework. The attitude construct is a behavioural belief, and refers to the degree to which a person has an assessment (favourable or unfavourable) of the behaviour in question [44]. The perceived behavioural construct refers to the perceived ease or difficulty of carrying out the behaviour, and reflects past experiences [44]. Finally, subjective norm refers to the perceived social pressure to have a behaviour, i.e., one person becomes more likely to have a behaviour if the people in their social network (friends, neighbours, relatives) support this behaviour. On the other hand, if one person believes that their behaviour is frowned upon by these same people, the person is less likely to perform this behaviour [44].
Human behaviour is guided by belief, which can be understood as a variable that interferes with intention, and consequently with behaviour [45]. There are three types of beliefs: behavioural; normative; and control. Behavioural beliefs relate behaviour to expected consequences, considering the subjective probability that behaviour produces a result and determining the predominant attitude [44]. Normative beliefs refer to the expectations and perceived social pressure of important reference groups for individuals [44]. Normative beliefs, combined with personal motivations, determine subjective norms. Perceived control helps recognise factors that can hinder some behaviour [44]. Combined with controlling factors, they determine perceived behavioural control, which refers to each person’s perception of their abilities to have (or not) one specific behaviour [44]. It is possible to investigate why people have certain attitudes, subjective norms and perceived behavioural controls by measuring these beliefs [45].
The TPB was used to explain and predict various transport-related behaviours, including switching from private car use to public transport, the intention to use public transport by bus and the adoption of electric vehicles. Regarding UFT, the TPB was addressed to assess the choice of companies to adopt electric freight vehicles [46,47,48], the perception of consumers about green services [49], new technologies [50], the effect of public policies on urban freight [51] and the use of electric cargo bikes by courier messengers for urban distribution in Germany [9]. Therefore, the perspective of logistics operator companies was not evaluated by the scholars. However, since those companies deliver most last-mile parcels, it becomes crucial to know their viewpoint on performing last-mile bicycle delivery. Therefore, TPB was used to identify variables. Their influence was measured by estimating an ordered logistic regression to determine the effect of critical factors on logistics operator companies to perform last-mile bicycle delivery.

4. Research Approach

The research approach (Figure 1) was designed to identify the behavioural intention and measure this intention of logistics operators to perform last-mile bicycle delivery. Thus, their attitude towards this specific behaviour was investigated, not their behaviour itself. First, the influential variables of last-mile bicycle delivery were identified in the literature (Section 2). Then, these variables were paired with the constructs postulated by the TPB, followed by data collection with logistic operator companies in Brazil. Lastly, the intention of the behaviour was identified and measured. The following subsections detail the steps described.

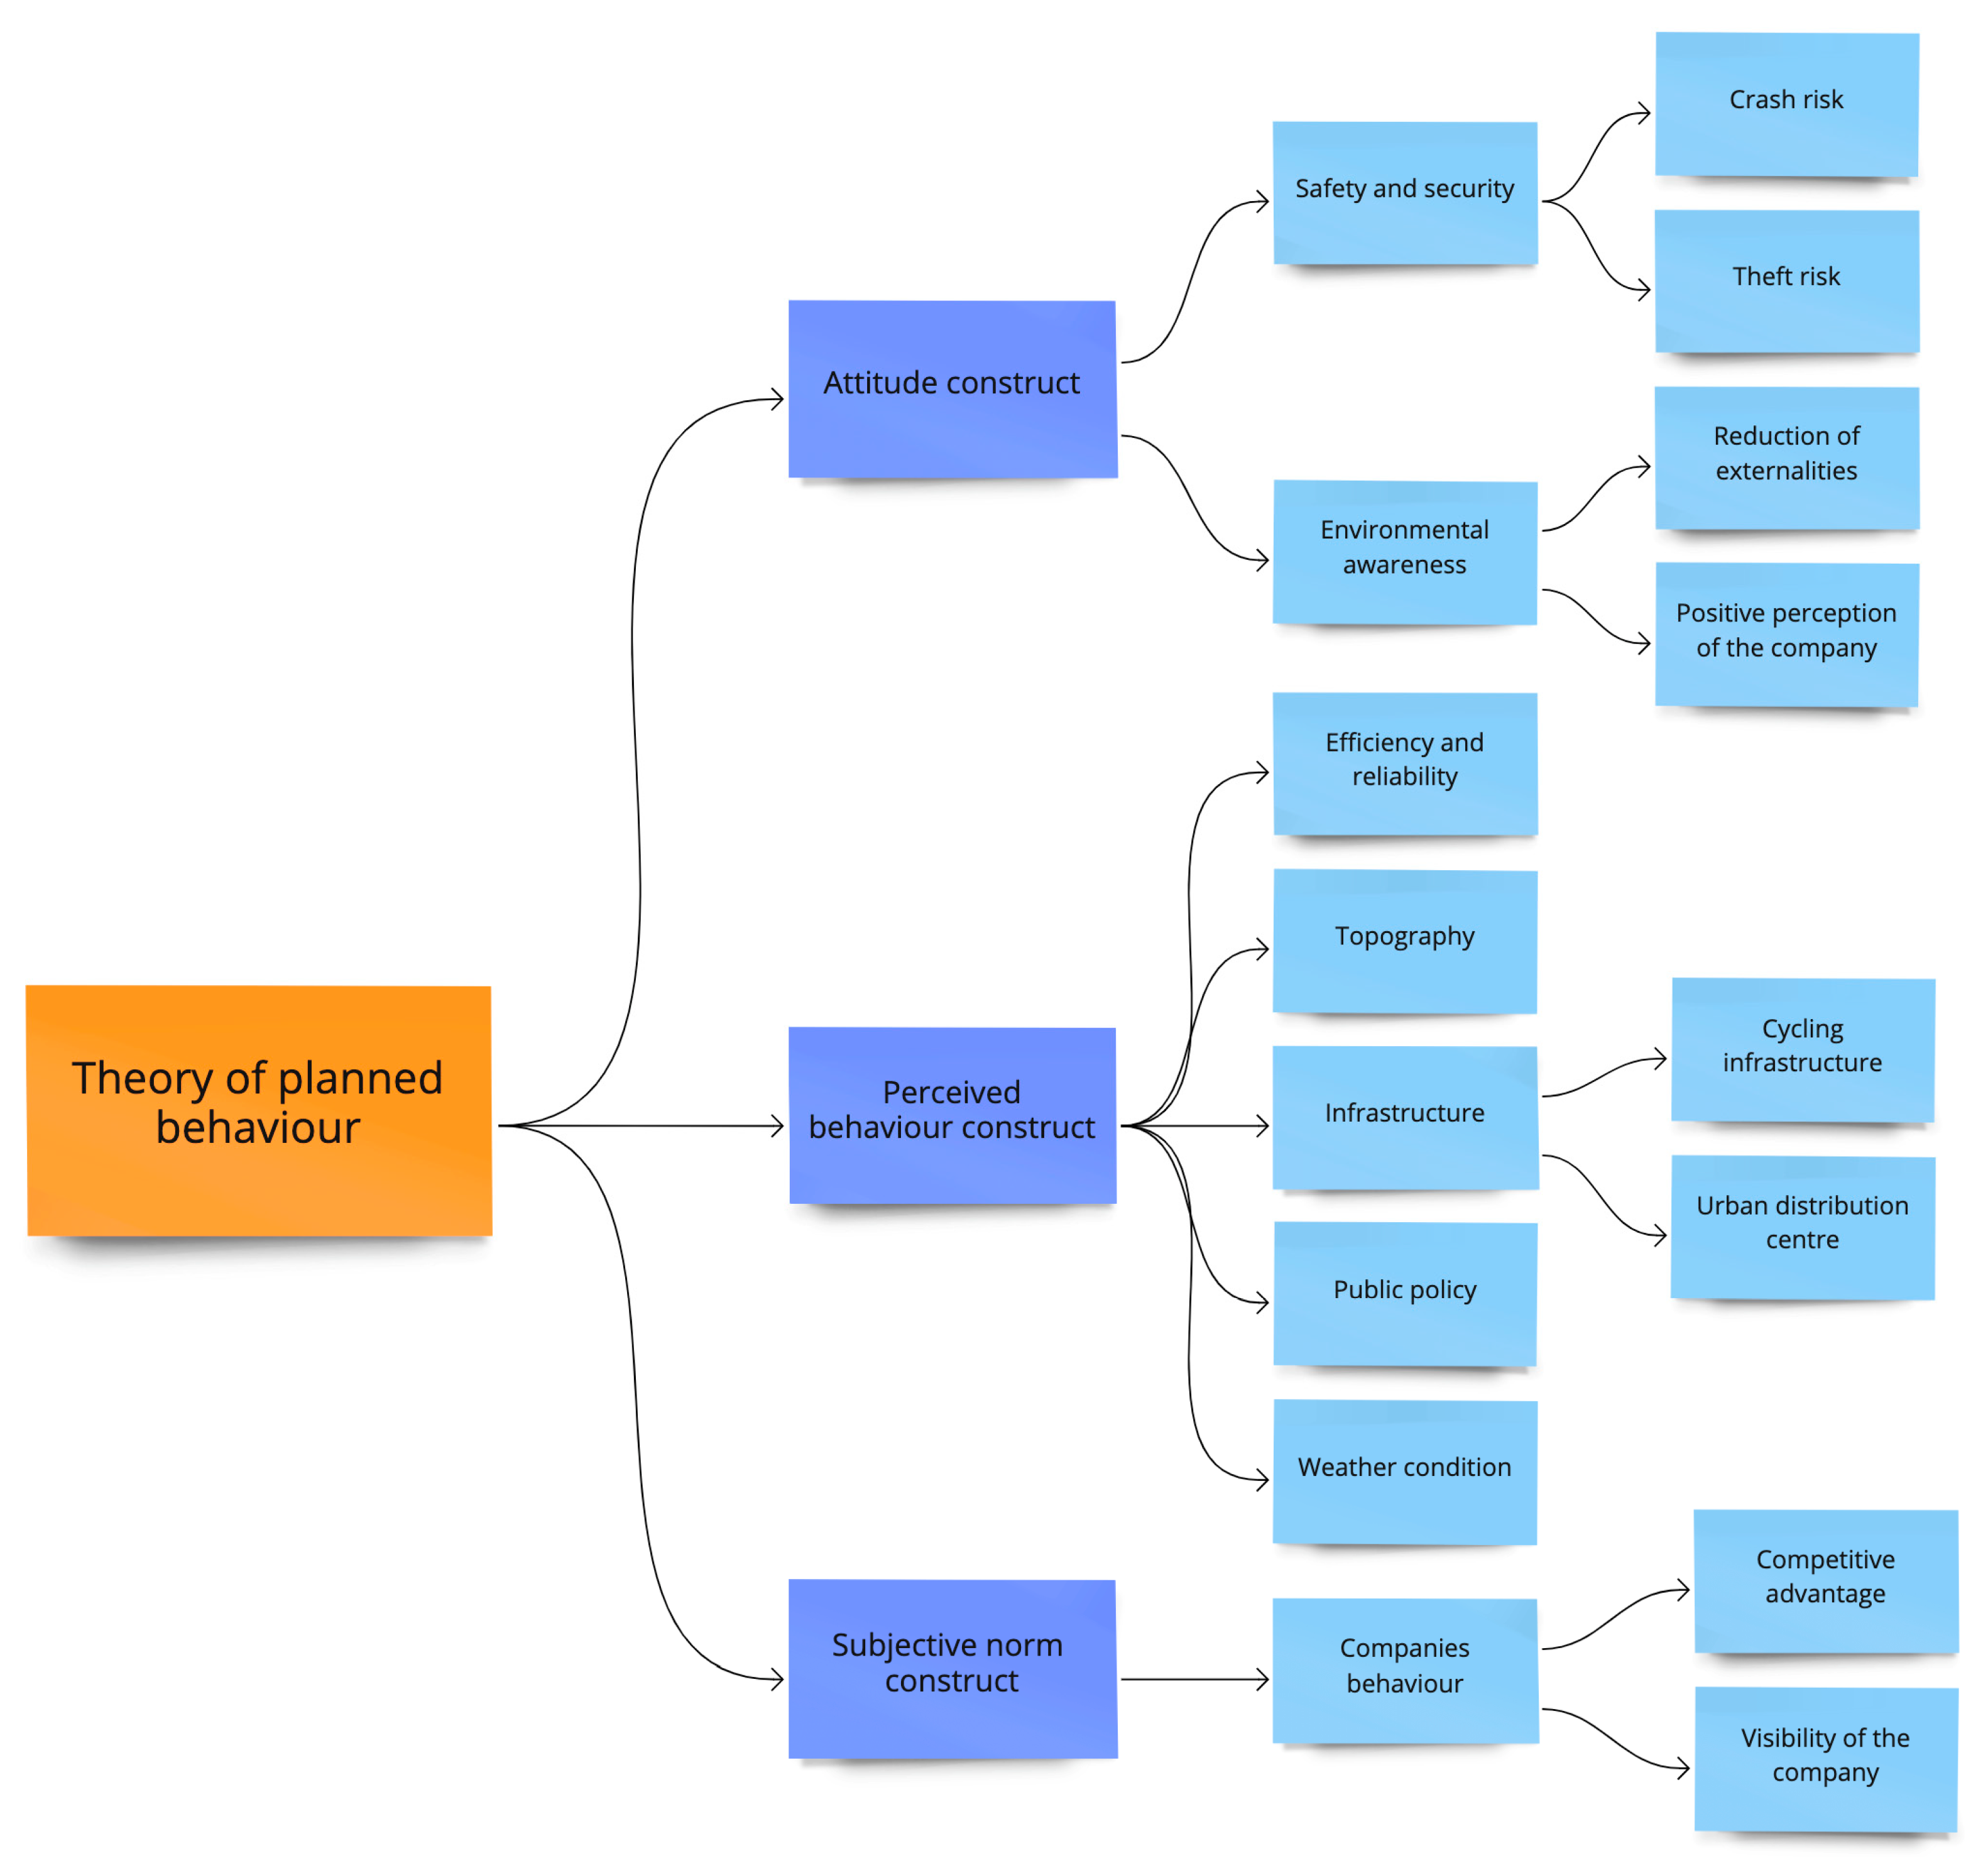
4.1. Relating the TPB Constructs with the Variables

Figure 2 relates the TPB constructs to the variables influencing last-mile bicycle delivery. Some variables, such as topography, were included because bicycles are not common for urban deliveries in Brazil [6]. In addition, the scholars reported other variables, as mentioned in the previous section. The variables related to the attitude construct measure their relevance for last-mile bicycle delivery. The variables related to the perceived control construct measure their influence on the decision-making of performing last-mile bicycle delivery. Finally, the variables associated with the subjective norm construct measure the effect of the perception of society regarding last-mile bicycle delivery.
For each variable presented in Figure 2, statements were prepared and presented for evaluation of respondents according to their level of interference in behaviour (in the case of statements linked to the construct Perceived Control and Subjective Norm) and level of relevance (for statements of the Attitude construct), using a 5-level Likert scale. The eight beliefs were divided into statements and questions on the questionnaire to assess their importance and intensity according to the value of the scale. All statements are presented in Appendix A.

4.2. Data Collection

A questionnaire was designed to obtain data for the analysis based on these constructs and respective variables. First, the TPB statements were evaluated using the Likert scale. Then, the respondents ranked the UFT measures. In addition, they answered questions about companies, including the size of companies (measured by the number of employees), type of goods and the annual revenue. Finally, the respondents declared whether the company is interested in performing last-mile bicycle delivery.
A web-based survey was carried out with logistics operators in Brazil in 2018. The web-based survey was done in partnership with a business school in Brazil, which sent an email inviting companies to participate in the survey. As a result, 202 logistics operators (LOs) responded to the survey, representing 13% of the Brazilian gross domestic product in the transport sector.
The companies deliver goods in the different regions of Brazil, especially in the large urban centres of the country. In addition, the fleet dedicated to these deliveries is mixed own and outsourced (84%), own (6%) and outsourced fleet (9%). Furthermore, the companies deliver different types of product, and some operate only with e-commerce deliveries. Regarding the number of employees and annual revenue, 45.5% of the companies are medium-sized with a staff of 51–500 employees, and 54.5% of the company’s respondents have revenues below R$100 million (1US$ ≅ R$5 in March 2022).
The reliability of statements evaluation was given by calculating Cronbach’s alpha. Values above 0.7 were desirable [52].

4.3. Identifying Behavioural Intention

According to Ajzen [45], attitudes, subjective norms and perceived behaviour can be theoretically investigated by measuring beliefs. Therefore, it is possible to measure the value of beliefs and assess their consequences using scales that measure the intensity and importance of each belief. Thus, the values of each belief are multiplied by the value of the importance of the same belief in measuring the constructs. In this study, the highest possible value is 25, relative to the multiplication of the highest values of the Likert scale used in the questionnaire (5 × 5), indicating that the person is favourable to their beliefs. On the other hand, the lowest possible value is 1, which means that the person is totally against that belief. Moreover, the average value is 13, indicating indifference toward that belief. Ajzen [45] details the calculation procedure of the belief.

4.4. Measuring the Behaviour Intention

The last step is measuring the behaviour intention. Therefore, the influence of the constructs on the behavioural intentions of the respondents can be evaluated by estimating an ordered logistic regression. The response to the question “Are you interested in performing last-mile bicycle delivery?” was used as a response variable. The independent variables (or predictors) are the variables that interfere in this use—in other words, the salient beliefs.
The estimated coefficients indicate the most influential variables in performing last-mile bicycle delivery. Furthermore, the influence of beliefs was measured and its probability calculated.
Variables were considered to evaluate the influence and impact of last-mile bicycle delivery. For example, to measure the effect of crash risk (represented by the variable influence.crash), the respondent evaluates whether the crash risk influences last-mile bicycle delivery and whether the crash risk influence last-mile bicycle delivery.
The z-value is a test statistic that measures the ratio between the coefficient and its standard error. Coefficients with a p-value of 0.05 or less are statistically significant (significance level of α = 0.05). Moreover, a positive relationship is described when the odds ratio (Exp β) is greater than 1. In another way, an odds ratio of less than one implies a negative association.

5. Results

The respondents ranked the UFT measures from 1 to 14, where one is the most important and 14 is the least important. The results presented in Table 1 showed the reliability of the evaluation, since the Cronbach alpha is around 0.8. The most favourable is the urban freight mobility plan. The cargo bike was ranked seventh, behind night deliveries and freight restriction initiatives. This evaluation shows the non-priority importance of the cargo bicycle as a vehicle for urban freight transport.
Concerning urban freight mobility plans, since 2012, a Brazilian Federal Law has determined the obligation to prepare mobility plans for municipalities with a population above 20,000 inhabitants. However, public managers’ knowledge of freight policies is limited [53]. Thus, the inclusion of freight in the mobility plans is incipient, and those that have included, in general, proposed measures related to the freight restriction. From the perspective of logistics operators, however, the urban freight mobility plan could be a way to include freight measures in the transportation agenda in Brazilian municipalities [41]. For example, the city could propose and stimulate last-mile bicycle delivery. One prime example is the pro-e-bike project, which promoted the use of clean and energy-efficient vehicles, analysing the performance of electric bicycles (e-bikes) and electric scooters to deliver goods in urban areas of seven European countries [20]. Moreover, the decision-making process can influence urban freight fleet composition, and freight policies could stimulate using bicycles as freight vehicles [54].

5.1. Identifying Behavioural Intention

Identifying behavioural intention was based on measurements of the salient beliefs. Table 2 shows the results. The four most influential variables in their attitude toward last-mile bicycle delivery are Traffic Safety (represented by variables crash risk and theft risk), Efficiency, Reliability and Weather Conditions, since their belief result was closer to 25. On the other hand, the behaviour of companies and society about last-mile bicycle delivery and the topography achieves an average value close to 13, indicating that these variables do not influence the decision process of logistics operator companies. Lastly, according to the TPB, the environmental awareness value was lower than 13, indicating that the variable is not considered influential in the decision of last-mile bicycle delivery.
By comparing these results with the literature, some of the variables identified as influential by TPB were not relevant; for example, weather conditions do not influence last-mile bicycle delivery [6]. According to the logistic operator companies, however, the weather condition was considered the most influential variable, and influenced the intention of these companies to perform last-mile bicycle delivery. From the results, there is a paradigm regarding the influence of weather on last-mile bicycle delivery. The growth of last-mile bicycle delivery corroborates this fact.

5.2. Measurement of Behavioural Intention

Table 3 shows the behavioural intention of performing last-mile bicycle delivery by estimating an ordered logistics regression model. Model 1 represents the influence of all variables on the attitude construct, while model 2 represents the effect of the most influential variables on the attitude construct according to the intention of behaviour. Model 3 shows the influence of all variables of the perceived behavioural construct, while model 4 depicts the effect of the most influential variables of the perceived behavioural construct. Finally, model 6 shows the influence of all variables of the subjective norm construct, while model 6 depicts the most influential variables of the subjective norm construct.
Model 1 is related to all the variables from the attitude construct, where only the influence of environmental awareness has statistical significance (p-value < 0.05), with a negative impact on last-mile bicycle delivery (coefficient odds ratio value is lower than 1). Furthermore, environmental awareness is not influential (the measured value was less than 13) (Table 2).
Model 2 considered the influential variables in the attitude construct according to the TPB (results from Table 4). From that, cargo theft positively influences the decision to make last-mile bicycle deliveries. In Brazil, logistics operators and retailers identified cargo theft as a barrier to urban delivery, mainly in large cities [29,41]. In some regions, such as favelas, there is usually an additional delivery fee to cover the freight insurance [41]. The problem is so complex that a police station specialises in cargo theft in the Metropolitan Region of Belo Horizonte due to the frequency of robberies. However, this situation is due to a lack of security in Brazilian cities, and is not exclusively for cargo bikes.
Model 3 considered variables from the perceived behavioural construct, where impact.infrastructure, impact.publicpolicy and influence.weather are statistically significant. The impact.infrastructure (i.e., cycling infrastructure) positively influences last-mile bicycle deliveries. The cycling infrastructure is recurrent in the literature, offering operational advantages for companies and couriers, such as agility and reducing the risk of accidents by the courier cycle [13,17,39]. In another way, the impact.publicpolicy and influence.weather variables have a negative effect. In Brazil, for example, the freight restriction policy adopted by municipalities restricts the time windows or the size/weight of freight vehicles [28,41]. However, freight restriction is not a measure used exclusively in Brazil and is one of the main barriers to achieving delivery efficiency. In the same sense, the weather negatively influences last-mile bicycle deliveries.
Furthermore, the tropical climate predominant in Brazil influences the perception of the performance of last-mile bicycle delivery, affecting the perception of logistics operator companies. Model 4 considered the more influential variables of the perceived behaviour construct. The influence.efficiencyreliability is statistically significant, and positively influences the decision-making process of logistics operator companies. Thus, last-mile bicycle deliveries could have the same efficiency and reliability as typical freight vehicles.
Model 5 considered the variables of the subjective norm construct. The impact.advantage, influence.visibility and impact.visibility are statistically significant, indicating that these factors influence the subjective norm of logistics operator companies regarding last-mile bicycle deliveries. In addition, the visibility of the company affects last-mile bicycle deliveries. Thus, companies could make last-mile bicycle deliveries due to positive visibility from the customer and society. According to the literature, the community had good visibility of companies performing last-mile bicycle deliveries, potentially attracting more customers [3,4,12,20,55].
Furthermore, campaigns promoting the benefits of last-mile bicycle deliveries positively impact the decision of logistics operator companies [22]. Finally, Model 6 considered variables with more influence considering all constructs. With this combination of variables, only the influence.efficiencyreliability was statistically significant, with a positive impact on last-mile bicycle deliveries.
Table 4 summarises the beliefs considered relevant by the TPB and the variables that positively influence last-mile bicycle deliveries. When comparing the results of the ordered logistic regression with the intention of behavioural behaviour (Table 3), efficiency and reliability positively influence statistical significance. Therefore, according to the respondents, these beliefs are the most important for last-mile bicycle deliveries. However, environmental awareness had the lowest value in the measurement of beliefs, indicating indifference perception despite its statistical significance. Additionally, efficiency and reliability, environmental awareness, cycling infrastructure and the behaviour of companies and society contribute positively to last-mile bicycle deliveries.

5.3. Policy Implications

Brazilian logistics operator companies evaluated cycling infrastructure as an essential factor. Therefore, cycling infrastructure positively interferes with the decision on last-mile bicycle deliveries. Furthermore, the lack of infrastructure can be correlated with accident risk, since bicycles share the same space as motorised vehicles without infrastructure. Another essential factor concerns the safety/security variable. The theft of goods in Brazil is one problem affecting logistics operators in the country [41]. Therefore, city authorities have a crucial role in improving public security to promote last-mile bicycle deliveries.
The regulations imposed on freight vehicles, such as parking policies and restricted access zones, can encourage replacing diesel-powered vehicles with bicycles in densely populated areas. Furthermore, bicycle use can be highly productive for shorter delivery distances (up to 10 km). In addition, micro hubs, urban consolidation centres or mobile depots in central areas require green vehicles, such as bicycles, for last-mile deliveries [19,21].
Additionally, urban mobility plans must include freight transport measures; therefore, the bicycle could be suggested as a delivery vehicle, and its use could be indicated in urban mobility plans. Furthermore, improving the infrastructure of bicycles associated with measures to restrict access in densely populated areas reduces the challenges faced by bicycle logistics companies, and can stimulate the expansion of bicycle deliveries. These measures reduce the difficulties bicycle logistics companies face and can facilitate the growth of bicycle delivery services.

6. Conclusions

This paper identified the variables and measured their influence on the decision-making process of logistics operator companies performing last-mile bicycle deliveries. The TBP was used to determine the influential factors. Furthermore, an ordered logistic regression was estimated to measure the influence of factors in last-mile bicycle deliveries. The hypothesis that there are no barriers for logistics operators performing last-mile bicycle deliveries in Brazil was rejected for the following elements: externalities; public policy; and weather conditions. Furthermore, the weather does not influence last-mile bicycle deliveries, which diverges from the results found by Nascimento et al. [6]. Therefore, the mistaken view of the logistics operators is evident in the weather influence of last-mile bicycle deliveries. However, this negative perception can be changed through pilot tests.
Although cost is one of the main variables for a company to choose an alternative delivery, this variable was insignificant in the estimated models. Therefore, logistics operator companies perceive that the economic return would be fast by performing last-mile bicycle deliveries, being an attractive investment in Brazil. Furthermore, in Brazil, freight transport planning is one of the main problems, since most freight policies were implemented without a detailed planning process. Therefore, the participation and engagement of stakeholders could provide more effective freight policies. Furthermore, public policies for cargo bikes and cycling infrastructure can encourage last-mile bicycle deliveries, promoting sustainable urban mobility.
The variables considered in this paper are suitable for Brazil; therefore, countries with similar resistance to bicycles for last-mile deliveries could use the same ones. However, other places should consider their specificities for a more effective analysis. Nevertheless, TPB has been proven to be an efficient method of capturing intention in behaviour to perform last-mile bicycle deliveries in Brazil.
Performing last-mile bicycle deliveries contributes to sustainable transport. Therefore, municipalities must incentivise last-mile bicycle deliveries by increasing the bicycle infrastructure, companies must perform last-mile bicycle deliveries and society must require last-mile bicycle deliveries for a liveable city. For future work, it is suggested to include variables such as the regulation of public policies and the development or improvement of cycling infrastructure.

Author Contributions

Conceptualisation, C.d.O.L.N. and L.K.d.O.; methodology, C.d.O.L.N.; validation, C.d.O.L.N. and L.K.d.O.; formal analysis, C.d.O.L.N.; investigation, C.d.O.L.N.; data curation, C.d.O.L.N.; writing—original draft preparation, C.d.O.L.N. and L.K.d.O.; writing—review and editing, C.d.O.L.N. and L.K.d.O.; and supervision, L.K.d.O. All authors have read and agreed to the published version of the manuscript.

Funding

This research was funded by Coordination of Superior Level Staff Improvement, grant number 001, and for the National Council for Scientific and Technological Development grant 303026/2017-0 and 303171/2020-0.

Informed Consent Statement

Informed consent was obtained from all subjects involved in the study.

Data Availability Statement

The data presented in this study are available on request from the corresponding author.

Acknowledgments

The authors thank Fundação Dom Cabral for supporting the data collection. Moreover, the authors thank the valuable comments of reviewers to improve this paper.

Conflicts of Interest

The authors declare no conflict of interest.

Appendix A

Table A1. Constructs Statements.
ConstructsStatement
AttitudePerforming last-mile bicycle deliveries increases the risk of accidents.
Performing last-mile bicycle deliveries increases the risk of cargo theft.
Last-mile bicycle deliveries reduce UFT externalities.
Last-mile bicycle deliveries provide a positive environmental perception of the company.
Last-mile bicycle deliveries provide a competitive advantage for the company.
Perceived behaviourThe lack of cycling infrastructure, such as cycle lanes and parking areas, reduces the performance of last-mile bicycle deliveries.
The lack of micro hubs or urban consolidation centres reduces the performance of last-mile bicycle deliveries.
Last-mile deliveries performed by bicycle are more economically viable than those achieved by diesel-powered vehicles.
Hilly topography is a barrier to last-mile bicycle deliveries.
The delivery time of bicycle deliveries has the same advantages as those of diesel vehicles.
Last-mile bicycle deliveries are not affected by freight restrictions.
The weather is a challenge for last-mile bicycle deliveries.
Subjective NormThe visibility of the company is improved through last-mile bicycle deliveries.

References

  1. Gruber, J.; Kihm, A.; Lenz, B. A New Vehicle for Urban Freight? An Ex-Ante Evaluation of Electric Cargo Bikes in Courier Services. Res. Transp. Bus. Manag. 2014, 11, 53–62. [Google Scholar] [CrossRef] [Green Version]
  2. Riggs, W. Cargo Bikes as a Growth Area for Bicycle vs. Auto Trips: Exploring the Potential for Mode Substitution Behavior. Transp. Res. Part F Traffic Psychol. Behav. 2016, 43, 48–55. [Google Scholar] [CrossRef]
  3. Schliwa, G.; Armitage, R.; Aziz, S.; Evans, J.; Rhoades, J. Sustainable City Logistics—Making Cargo Cycles Viable for Urban Freight Transport. Res. Transp. Bus. Manag. 2015, 15, 50–57. [Google Scholar] [CrossRef] [Green Version]
  4. Tipagornwong, C.; Figliozzi, M. Analysis of Competitiveness of Freight Tricycle Delivery Services in Urban Areas. Transp. Res. Rec. 2014, 2410, 76–84. [Google Scholar] [CrossRef] [Green Version]
  5. Hagen, J.X.; Lobo, Z.; Mendonça, C. The Benefits of Cargo Bikes in Rio de Janeiro: A Case Study. In Proceedings of the 13th World Conference on Transportation Research, Rio de Janeiro, Brazil, 15 July 2013. [Google Scholar]
  6. Nascimento, C.d.O.L.; Rigatto, I.B.; Oliveira, L.K. Characterization and Analysis of the Economic Viability of Cycle Logistics Transport in Brazil. Transp. Res. Procedia 2020, 46, 189–196. [Google Scholar] [CrossRef]
  7. Wrighton, S.; Reiter, K. CycleLogistics—Moving Europe Forward! Transp. Res. Procedia 2016, 12, 950–958. [Google Scholar] [CrossRef] [Green Version]
  8. Leonardi, J.; Browne, M.; Allen, J.; Bohne, S.; Ruesch, M. Best Practice Factory for Freight Transport in Europe: Demonstrating How ‘Good’ Urban Freight Cases Are Improving Business Profit and Public Sectors Benefits. Procedia Soc. Behav. Sci. 2014, 125, 84–98. [Google Scholar] [CrossRef] [Green Version]
  9. Gruber, J.; Kihm, A. Reject or Embrace? Messengers and Electric Cargo Bikes. Transp. Res. Procedia 2016, 12, 900–910. [Google Scholar] [CrossRef] [Green Version]
  10. Hagen, J.X.; Lobo, Z.; Linke, C.C. Clean, Silent, Space-Efficient and Non-Trivial Urban Freight Delivery: An Overview of Cycle Logistics in Rio de Janeiro. In Proceedings of the Transportation Research Board 96th Annual Meeting, Washington, DC, USA, 8 January 2017. [Google Scholar]
  11. Marujo, L.G.; Goes, G.V.; D’Agosto, M.A.; Ferreira, A.F.; Winkenbach, M.; Bandeira, R.A.M. Assessing the Sustainability of Mobile Depots: The Case of Urban Freight Distribution in Rio de Janeiro. Transp. Res. Part D: Transp. Environ. 2018, 62, 256–267. [Google Scholar] [CrossRef]
  12. Rudolph, C.; Gruber, J. Cargo Cycles in Commercial Transport: Potentials, Constraints, and Recommendations. Res. Transp. Bus. Manag. 2017, 24, 26–36. [Google Scholar] [CrossRef]
  13. Koning, M.; Conway, A. The Good Impacts of Biking for Goods: Lessons from Paris City. Case Stud. Transp. Policy 2016, 4, 259–268. [Google Scholar] [CrossRef]
  14. Vasiutina, H.; Szarata, A.; Rybicki, S. Evaluating the Environmental Impact of Using Cargo Bikes in Cities: A Comprehensive Review of Existing Approaches. Energies 2021, 14, 6462. [Google Scholar] [CrossRef]
  15. Choubassi, C.; Seedah, D.P.K.; Jiang, N.; Walton, C.M. Economic Analysis of Cargo Cycles for Urban Mail Delivery. Transp. Res. Rec. 2016, 2547, 102–110. [Google Scholar] [CrossRef]
  16. Conway, A.; Cheng, J.; Kamga, C.; Wan, D. Cargo Cycles for Local Delivery in New York City: Performance and Impacts. Res. Transp. Bus. Manag. 2017, 24, 90–100. [Google Scholar] [CrossRef]
  17. Heinrich, L.; Schulz, W.H.; Geis, I. The Impact of Product Failure on Innovation Diffusion: The Example of the Cargo Bike as Alternative Vehicle for Urban Transport. Transp. Res. Procedia 2016, 19, 269–271. [Google Scholar] [CrossRef]
  18. Rudolph, C.; Nsamzinshuti, A.; Bonsu, S.; Ndiaye, A.B.; Rigo, N. Localization of Relevant Urban Micro-Consolidation Centers for Last-Mile Cargo Bike Delivery Based on Real Demand Data and City Characteristics. Transp. Res. Rec. 2022, 2676, 365–375. [Google Scholar] [CrossRef]
  19. Navarro, C.; Roca-Riu, M.; Furió, S.; Estrada, M. Designing New Models for Energy Efficiency in Urban Freight Transport for Smart Cities and Its Application to the Spanish Case. Transp. Res. Procedia 2016, 12, 314–324. [Google Scholar] [CrossRef] [Green Version]
  20. Nocerino, R.; Colorni, A.; Lia, F.; Luè, A. E-Bikes and E-Scooters for Smart Logistics: Environmental and Economic Sustainability in Pro-E-Bike Italian Pilots. Transp. Res. Procedia 2016, 14, 2362–2371. [Google Scholar] [CrossRef] [Green Version]
  21. Verlinde, S.; Macharis, C.; Milan, L.; Kin, B. Does a Mobile Depot Make Urban Deliveries Faster, More Sustainable and More Economically Viable: Results of a Pilot Test in Brussels. Transp. Res. Procedia 2014, 4, 361–373. [Google Scholar] [CrossRef] [Green Version]
  22. Narayanan, S.; Gruber, J.; Liedtke, G.; Antoniou, C. Purchase Intention and Actual Purchase of Cargo Cycles: Influencing Factors and Policy Insights. Transp. Res. Part A: Policy Pract. 2022, 155, 31–45. [Google Scholar] [CrossRef]
  23. Dalla Chiara, G.; Alho, A.R.; Cheng, C.; Ben-Akiva, M.; Cheah, L. Exploring Benefits of Cargo-Cycles versus Trucks for Urban Parcel Delivery under Different Demand Scenarios. Transp. Res. Rec. 2020, 2674, 553–562. [Google Scholar] [CrossRef]
  24. Gonzalez-Calderon, C.A.; Posada-Henao, J.J.; Granada-Muñoz, C.A.; Moreno-Palacio, D.P.; Arcila-Mena, G. Cargo Bicycles as an Alternative to Make Sustainable Last-Mile Deliveries in Medellin, Colombia. Case Stud. Transp. Policy 2022, 10, 1172–1187. [Google Scholar] [CrossRef]
  25. Iwińska, K.; Blicharska, M.; Pierotti, L.; Tainio, M.; de Nazelle, A. Cycling in Warsaw, Poland—Perceived Enablers and Barriers According to Cyclists and Non-Cyclists. Transp. Res. Part A: Policy Pract. 2018, 113, 291–301. [Google Scholar] [CrossRef] [PubMed]
  26. Karanikola, P.; Panagopoulos, T.; Tampakis, S.; Tsantopoulos, G. Cycling as a Smart and Green Mode of Transport in Small Touristic Cities. Sustainability 2018, 10, 268. [Google Scholar] [CrossRef] [Green Version]
  27. Gevaers, R.; Van de Voorde, E.; Vanelslander, T. Cost Modelling and Simulation of Last-Mile Characteristics in an Innovative B2C Supply Chain Environment with Implications on Urban Areas and Cities. Procedia Soc. Behav. Sci. 2014, 125, 398–411. [Google Scholar] [CrossRef] [Green Version]
  28. Oliveira, L.K.; Bertoncini, B.V.; Nascimento, C.D.; Rocha, L.B.; Batista, L.A.; Cellin, L.V. Factors Affecting the Choice of Urban Freight Vehicles: Issues Related to Brazilian Companies. Sustainability 2019, 11, 7010. [Google Scholar] [CrossRef] [Green Version]
  29. Oliveira, L.K.; Barraza, B.; Bertocini, B.V.; Isler, C.A.; Pires, D.R.; Madalon, E.C.N.; Lima, J.; Vieira, J.G.V.; Meira, L.H.; Bracarense, L.S.F.P.; et al. An Overview of Problems and Solutions for Urban Freight Transport in Brazilian Cities. Sustainability 2018, 10, 1233. [Google Scholar] [CrossRef] [Green Version]
  30. Anderluh, A.; Hemmelmayr, V.C.; Nolz, P.C. Synchronizing Vans and Cargo Bikes in a City Distribution Network. Cent. Eur. J. Oper. Res. 2017, 25, 345–376. [Google Scholar] [CrossRef] [Green Version]
  31. Melo, S.; Baptista, P. Evaluating the Impacts of Using Cargo Cycles on Urban Logistics: Integrating Traffic, Environmental and Operational Boundaries. Eur. Transp. Res. Rev. 2017, 9, 30. [Google Scholar] [CrossRef] [Green Version]
  32. Perboli, G.; Rosano, M. Parcel Delivery in Urban Areas: Opportunities and Threats for the Mix of Traditional and Green Business Models. Transp. Res. Part C: Emerg. Technol. 2019, 99, 19–36. [Google Scholar] [CrossRef]
  33. Andrade, V.; Guth, D.; Kanitz, M. Ciclologística: Entregas Por Bicicleta Na Última Milha; LabMob: Rio de Janeiro, Brazil; AliançaBike: São Paulo, Brazil; Abralog: São Paulo, Brazil, 2020. [Google Scholar]
  34. Stathopoulos, A.; Valeri, E.; Marcucci, E. Stakeholder Reactions to Urban Freight Policy Innovation. J. Transp. Geogr. 2012, 22, 34–45. [Google Scholar] [CrossRef]
  35. Browne, M.; Allen, J.; Leonardi, J. Evaluating the Use of an Urban Consolidation Centre and Electric Vehicles in Central London. IATSS Res. 2011, 35, 1–6. [Google Scholar] [CrossRef] [Green Version]
  36. Oliveira, L.K.d.; França, J.G.d.C.B.; Nascimento, C.d.O.L.; Oliveira, I.K.d.; Meira, L.H.; Rabay, L. Evaluating Problems and Measures for a Sustainable Urban Freight Transport in Brazilian Historical Cities. Sustain. Cities Soc. 2021, 69, 102806. [Google Scholar] [CrossRef]
  37. Barbosa, M.W.; de Sousa, P.R.; de Oliveira, L.K. The Effects of Barriers and Freight Vehicle Restrictions on Logistics Costs: A Comparison before and during the COVID-19 Pandemic in Brazil. Sustainability 2022, 14, 8650. [Google Scholar] [CrossRef]
  38. Arnold, F.; Cardenas, I.; Sörensen, K.; Dewulf, W. Simulation of B2C E-Commerce Distribution in Antwerp Using Cargo Bikes and Delivery Points. Eur. Transp. Res. Rev. 2017, 10, 2. [Google Scholar] [CrossRef]
  39. Leonardi, J.; Browne, M.; Allen, J. Before-After Assessment of a Logistics Trial with Clean Urban Freight Vehicles: A Case Study in London. Procedia Soc. Behav. Sci. 2012, 39, 146–157. [Google Scholar] [CrossRef] [Green Version]
  40. Vasconcelos, E.A. Transporte Urbano Nos Países Em Desenvolvimento—Reflexões e Propostas; Editora Annablume: São Paulo, Brazil, 2000. [Google Scholar]
  41. Oliveira, L.K.; Leite Nascimento, C.D.; de Sousa, P.R.; de Resende, P.T.; Ferreira da Silva, F.G. Transport Service Provider Perception of Barriers and Urban Freight Policies in Brazil. Sustainability 2019, 11, 6890. [Google Scholar] [CrossRef] [Green Version]
  42. Kiba-Janiak, M. Urban Freight Transport in City Strategic Planning. Res. Transp. Bus. Manag. 2017, 24, 4–16. [Google Scholar] [CrossRef]
  43. Ajzen, I. From Intentions to Actions: A Theory of Planned Behavior. In Action-Control: From Cognition to Behavior; Springer: Berlin/Heidelberg, Germany, 1985; pp. 11–39. [Google Scholar]
  44. Ajzen, I. The Theory of Planned Behavior. Organ. Behav. Hum. Decis. Process. 1991, 50, 179–211. [Google Scholar] [CrossRef]
  45. Ajzen, I. Perceived Behavioral Control, Self-Efficacy, Locus of Control, and the Theory of Planned Behavior. J. Appl. Soc. Psychol. 2002, 32, 665–683. [Google Scholar] [CrossRef]
  46. Kaplan, S.; Gruber, J.; Reinthaler, M.; Klauenberg, J. Intentions to Introduce Electric Vehicles in the Commercial Sector: A Model Based on the Theory of Planned Behaviour. Res. Transp. Econ. 2016, 55, 12–19. [Google Scholar] [CrossRef]
  47. Morganti, E.; Browne, M. Technical and Operational Obstacles to the Adoption of Electric Vans in France and the UK: An Operator Perspective. Transp. Policy 2018, 63, 90–97. [Google Scholar] [CrossRef] [Green Version]
  48. Wang, S.; Fan, J.; Zhao, D.; Yang, S.; Fu, Y. Predicting Consumers’ Intention to Adopt Hybrid Electric Vehicles: Using an Extended Version of the Theory of Planned Behavior Model. Transportation 2016, 43, 123–143. [Google Scholar] [CrossRef]
  49. Wang, X.; Yuen, K.F.; Wong, Y.D.; Teo, C.-C. It Is Green, but Is It Fair? Investigating Consumers’ Fairness Perception of Green Service Offerings. J. Clean. Prod. 2018, 181, 235–248. [Google Scholar] [CrossRef]
  50. Wang, X.; Yuen, K.F.; Wong, Y.D.; Teo, C.C. An Innovation Diffusion Perspective of E-Consumers’ Initial Adoption of Self-Collection Service via Automated Parcel Station. Int. J. Logist. Manag. 2018, 29, 237–260. [Google Scholar] [CrossRef]
  51. Nathanail, E.; Adamos, G.; Karakikes, I.; Mitropoulos, L. Does the Implementation of Urban Freight Transport Policies and Measures Affect Stakeholders’ Behavior? In Proceedings of the Data Analytics: Paving the Way to Sustainable Urban Mobility; Nathanail, E.G., Karakikes, I.D., Eds.; Springer International Publishing: Cham, Switzerland, 2019; pp. 631–638. [Google Scholar]
  52. Taber, K.S. The Use of Cronbach’s Alpha When Developing and Reporting Research Instruments in Science Education. Res. Sci. Educ. 2018, 48, 1273–1296. [Google Scholar] [CrossRef] [Green Version]
  53. Dias, J.M.; Sobanski, G.B.; Silva, J.E.A.R.; Oliveira, L.K.; Vieira, J.G.V. Are Brazilian Cities Ready to Develop an Efficient Urban Freight Mobility Plan? Urbe. Rev. Bras. De Gestão 2018, 10, 587–599. [Google Scholar] [CrossRef] [Green Version]
  54. Pinto, R.; Lagorio, A. Supporting the Decision Making Process in the Urban Freight Fleet Composition Problem. Int. J. Prod. Res. 2021, 59, 3861–3879. [Google Scholar] [CrossRef]
  55. Zhang, L.; Matteis, T.; Thaller, C.; Liedtke, G. Simulation-Based Assessment of Cargo Bicycle and Pick-up Point in Urban Parcel Delivery. Procedia Comput. Sci. 2018, 130, 18–25. [Google Scholar] [CrossRef]
Figure 1. The steps of the research approach.
Futuretransp 03 00018 g001
Figure 2. Constructs and respective variables (beliefs) regarding last-mile bicycle delivery.
Futuretransp 03 00018 g002
Table 1. Evaluation of urban freight measures by logistics operators’ companies.
Urban Freight Measures Cronbach AlphaRank Position
Urban freight mobility plan0.781
Guidelines for parking areas0.792
Truck lines in urban areas0.773
Using big data for planning city logistics0.794
Freight restriction0.805
Night delivery0.826
Cargo bike0.797
Collaborative delivery system0.828
Pick-up points or similar initiative0.829
Electric freight vehicle0.8110
Urban distribution centre0.7811
Digital application for on-demand transport0.7712
Booking system and payment for on-street parking0.7713
Urban toll for freight vehicles0.8114
Table 2. Identifying behavioural intention.
ConstructVariableAverageFinal Average
AttitudeTraffic safetyCrash risk18.77418.799
Theft risk18.824
Environmental awarenessReduction of externalities7.21910.104
Positive perception12.988
Perceived behaviourInfrastructureCycling infrastructure20.98017.453
UDC18.824
Operational cost 17.65817.658
Topography 15.96015.960
Efficiency and reliability 20.06120.061
Public policy 11.56711.567
Weather condition 21.63621.636
Subjective normThe behaviour of companies and societyCompetitive advantage18.12714.089
Visibility10.050
Table 3. Measured behavioural intention.
ModelVariablesCoefficientz-Value
M1intercept−3.5749−1.126
influence.theft−0.0052−0.068
impact.theft0.36170.573
influence.crash0.43650.062
impact.crash0.21480.405
influence.externalities−1.083−4.858 ***
impact.externalities0.55021.045
influence.perception0.1660.500
impact.perception0.38260.724
M2intercept−8.4636−2.613 ***
influence.theft−0.5383−0.696
impact.theft−1.58112.653 ***
influence.crash0.28270.467
impact.crash0.66171.297
M3intercept3.64931.600
influence.infrastructure0.89692.042
impact.infrastructure0.33820.668 **
influence.udc−0.5929−1.44
impact.udc0.07160.151
influence.operationalcost−0.0519−0.132
impact.operationalcost−0.0613−0.145
influence.topography−0.0007−0.001
impact.topography−0.0575−0.113
influence.efficiencyreliability0.69291.636
impact.efficiencyreliability0.37631.052
influence.publicpolicy0.12370.213
impact.publicpolicy−0.7814−2.067 **
influence.weather−0.8197−1.975 **
impact.weather0.67281.635
M4intercept−6.1875−4.427 ***
influence.efficiencyreliability1.13904.956 ***
impact.efficiencyreliability0.43311.122
influence.weather−0.3650−1.119
impact.weather0.59511.809
M5intercept−1.09−0.77
influence.advantage−0.334−0.94
impact.advantage−1.068−3.74 ***
influence.visibility1.02512.964 ***
impact.visibility0.65742.200 **
M6intercept−7.1361 −2.359 **
influence.accident−0.4836−0.353
impact.accident0.48360.899
influence.theft−0.7134−1.019
impact.theft0.93401.453
influence.efficiencyreliability1.09633.347 ***
Impact.EfficiencyReliability0.20880.631
Influence.Weather−0.4124−1.021
Impact.Weather0.37661.067
Significance codes: *** 0.001; ** 0.01.
Table 4. Summary of the variables that influence using a bicycle.
AnalysisVariables
Most relevant salient beliefs (with maximum values of 25, according to the TPB)Safety/security
Efficiency and reliability
Weather conditions
Statistically valid coefficient variables, which have a positive influence on the intention to perform last-mile bicycle deliveriesEfficiency and reliability
Environmental awareness
Cycling infrastructure
Behaviour of companies and society
Statistically significant variables estimated with logistic regression, which had a negative influence on the intention to perform last-mile bicycle deliveriesReduction of externalities
Public policy
Weather conditions
Disclaimer/Publisher’s Note: The statements, opinions and data contained in all publications are solely those of the individual author(s) and contributor(s) and not of MDPI and/or the editor(s). MDPI and/or the editor(s) disclaim responsibility for any injury to people or property resulting from any ideas, methods, instructions or products referred to in the content.

