

Self-Organized Neural Network Method to Identify Crash Hotspots
by
 and
and
Esmaiel Karimi
1,
Farshidreza Haghighi
1,*,
Abbas Sheykhfard
1,
Mohammad Azmoodeh
1 and
Khaled Shaaban
2
1
Department of Civil Engineering, Babol Noshirvani University of Technology, Shariati Ave., Babol 4714871167, Iran
2
Department of Engineering, Utah Valley University, Orem, UT 84058, USA
*
Author to whom correspondence should be addressed.
Future Transp. 2023, 3(1), 286-295; https://doi.org/10.3390/futuretransp3010017
Submission received: 31 October 2022
/
Revised: 11 January 2023
/
Accepted: 17 February 2023
/
Published: 1 March 2023
Abstract
:Crash hotspot identification (HSID) is an essential component of traffic management authorities’ efforts to improve safety and allocate limited resources. This paper presents a method for identifying hotspots using self-organizing maps (SOM). The SOM method was used to identify high-risk areas based on five commonly used HSID methods: crash frequency, equivalent property damage only, crash rate, empirical Bayes, and the societal risk-based method. Crashes on a major road in Iran were examined using the proposed method. Based on these criteria, high-risk locations were grouped into six clusters, which provided appropriate criteria for each location depending on the importance of the cluster. The findings show that the identification of crash hotspots tends to focus on areas with more crashes and deaths, demonstrating that the research methodology was appropriate.
1. Introduction
Road crashes are rare events with far-reaching consequences that statistically account for a small share of the total real-world interactions between drivers and the road environment. While occasional, the information that can be gleaned from such events is the most valuable data for road safety engineers in mapping the possible causes of a crash. Therefore, crash data, followed by identifying crash hotspots, are a vital component of safety diagnosis [1,2].
The identification of hotspots in crashes is an active area of research. Hotspot identification (HSID) is a method of identifying sites with promise, hazardous locations, or high-risk areas (sites that experience greater risk than expected). The terms refer to points where traffic crashes have a high number and characteristic or where there may be a higher risk of injury over a certain period as a result of road conditions, traffic conditions, climate, or the environment. There is usually an uneven distribution of traffic on roads. A road section with a high concentration of crashes can affect the overall safety of the road and even determine it to some extent. To improve road safety, it is most effective and economical to eliminate safety hazards in concentrated road sections.
This is one of the essential aspects of improving the roadway safety performance of the roadway network, since high-crash locations severely reduce the quality of road services [3]. The most necessary step in improving road traffic safety is to determine the areas of the road that need immediate improvement. Furthermore, locations can be prioritized based on importance and urgency, and acceptance criteria for increasing traffic safety can be defined and adapted. Therefore, many methods have been used to identify and prioritize high-crash points.
The process of studying crashes is divided into two stages: prevention and treatment. The purpose of the prevention stage is to identify high-hazard road sections to prevent crashes. The treatment stage, on the other hand, aims to reduce losses involved in crashes and the severity of the crashes by implementing corrective measures. Due to this, identifying hotspots is an integral part of engineering programs that aim to improve the safety of transportation networks as part of an effort to make them more reliable [4]. Considering the problem of identifying crash-prone locations, Norden et al. used final quality control methods to analyze road crash data beginning in the 1950s, and this was continued with several studies [5,6]. The results of these studies include several methods that have been proposed to identify and rank high-crash locations on the road network. Although these studies are very similar, they differ greatly in many ways.
Researchers have conducted substantial research on the method of identifying crashes. Methods for identifying hotspots for traffic crashes consist of direct and indirect methods. Within the direct methods, historical traffic crash data are analyzed and the method includes crash frequency analysis, crash rate analysis, crash frequency–crash rate analysis (AF-AR), quality control analysis, cumulative frequency analysis, matrix analysis, gray theory analysis, and regression analysis. As an alternative to historical data on traffic crashes, indirect methods, such as traffic conflict techniques and safety factor methods, use another type of intermediary.
It is important to note that most of the studies that provide safety estimates in different transportation networks rely on the reporting of recorded crash statistics. In addition to determining the location of the crash using a map method, the crash frequency method, the crash rate method, and the safety index method, there are several other methods of determining the location of a crash [4]. For example, in the case of marking on a map, hotspots are demarcated visually by markings on sections of the road where crashes have occurred [7]. There have been a number of studies and publications that have used alternative methods, such as frequency, density, crash rate, distance rate frequency, and crash rate by distance and time [7,8]. Moreover, methods such as quality control, crash severity, and EPDO attempt to analyze the problem of high-crash locations more qualitatively [7].
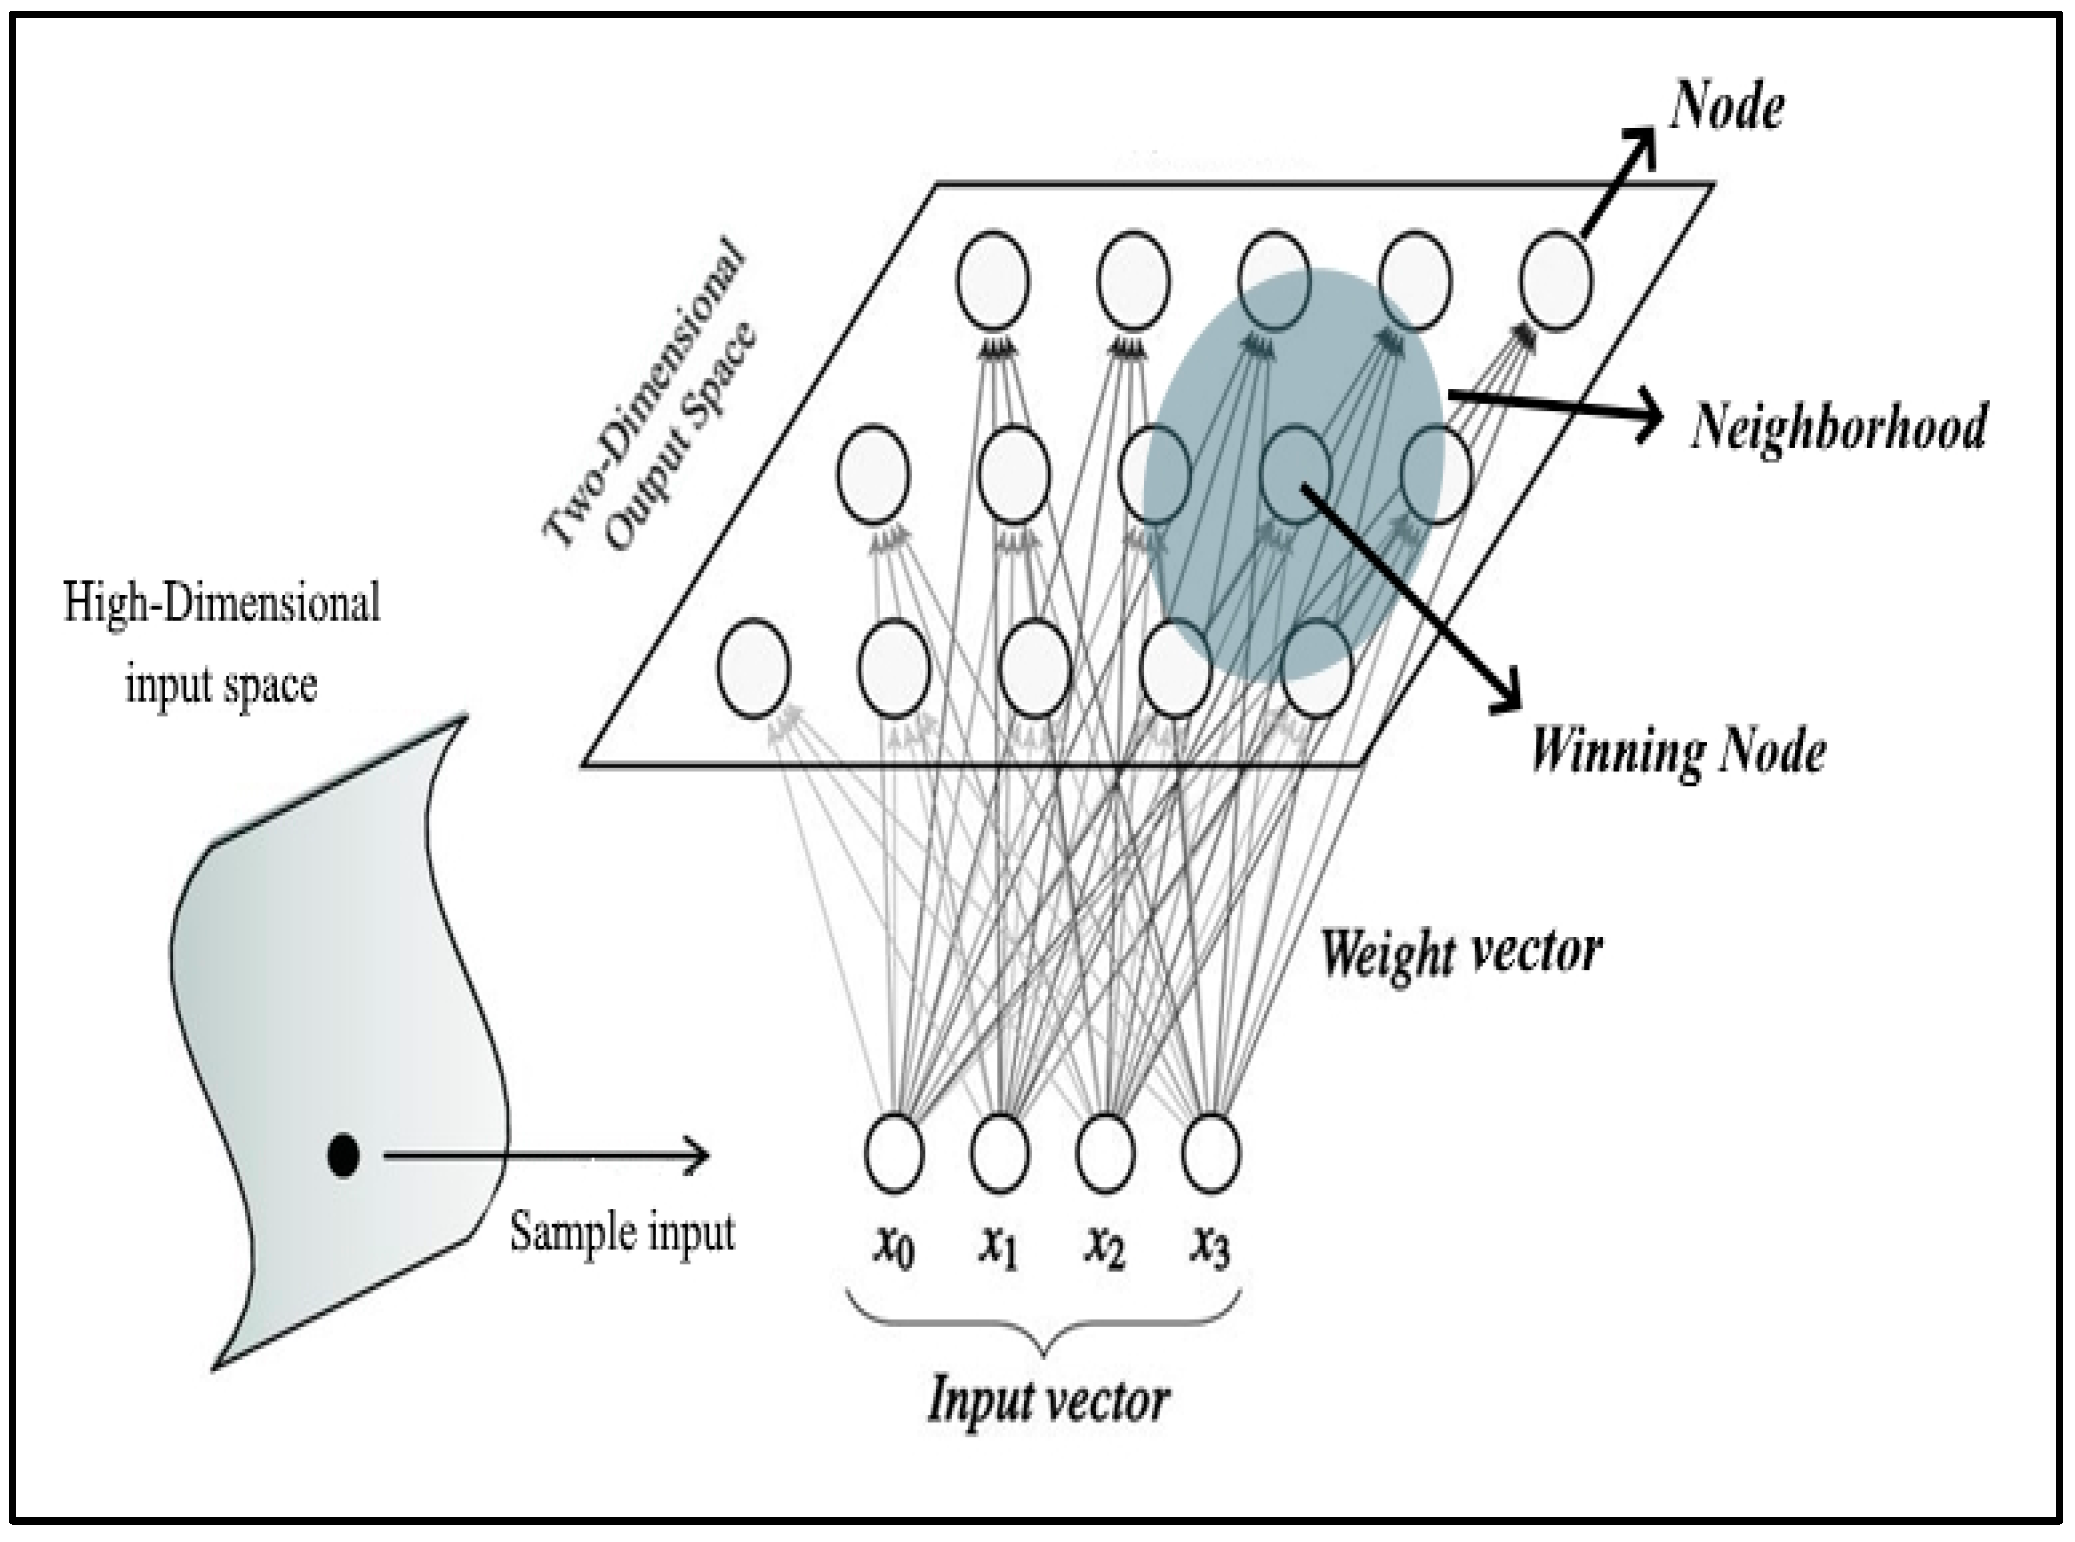
An SOM algorithm is an unsupervised machine learning technique that creates low-dimensional representations of high-dimensional data sets while preserving their topology. A data set with n observations and p variables could be represented as clusters of observations. High-dimensional data can therefore be visualized and analyzed more easily because observations within proximal clusters have similar values. In the same way, as with most neural networks, self-organizing maps function in two modes: training and mapping. Through an input data set (called the “input space”), a training algorithm generates a low-dimensional representation of the input data (called the “map space”). Afterward, mapping uses the generated map to classify additional input data. By finding the node with the smallest distance metric to the input space vector, the map can be used to classify additional observations for the input space. In other words, the self-organizing map (SOM), also known as the Kohonen map or topology-preserving feature map, is a neural network method that can cluster, classify, estimate, predict, and mine data in a wide range of disciplines, including signal recognition, the organization of large collections of data, process monitoring and analysis, modeling, and water resource management. As a typical SOM, the desired solutions or targets are not given, and the network learns to cluster the data by recognizing different patterns. As mentioned, the identification of road sections characterized by a high of risk crashes is the first step for any successful road safety management process, considering the limited available resources. Although researchers started to study hotspots decades ago, there are many unanswered questions in this field. In the identification process of hotspots, three main methods can be used: screening methods, clustering methods, and crash prediction methods. Many case studies have been published describing each method’s advantages and disadvantages. These studies concentrate mostly on one type of road each time, although road characteristics (i.e., speed, ADT) can highly affect the success and precision of the applied method. As a result, research has identified crash-prone hotspots based on one specific factor and has not considered other affective factors. The identification of crash-prone points on roads typically relies on a specific method that includes some parameters of crash occurrence, and there is no classification of crash-prone hotspots to eliminate them. Therefore, a method is needed to assess the factors affecting crashes and identify crash-prone hotspots based on their combination [9]. Accordingly, the present study uses SOM to cluster high-traffic locations and identify high-priority locations, resulting in the better allocation of financial resources. The first step is to identify crash-prone potential hotspots by using various methods of identifying crash-prone locations. Then, crash-prone points are clustered and classified using the SOM method. Random sites are clustered based on the criteria presented in this clustering. Clusters have areas that are compatible with one another and have the most separation from each other.
2. Materials and Methods
In this paper, the following HSID methods have been used: the crash frequency (CF), the crash rate (CR), the ranking of equivalent property damage only crash frequency (EPDO), societal risk-based (SRCM), and the empirical Bayes (EB) method [3,8,10,11,12,13,14,15,16,17].
2.1. Crash Frequency (CF)
CF ranks the sites in descending order of observed crash frequency as the simplest and most commonly used method. Thus, the number of crashes at each segment during a specified period reports the safety performance of the road segment.
2.2. Crash Rate (CR)
The CR method is defined as the crash count divided by the total entering volume for a roadway segment and ranks road segments by their crash rate; it normalizes the frequency of crashes with exposure.
2.3. Equivalent Property Damage Only Crash Frequency (EPDO)
To develop a combined frequency and severity score and consider crash costs in calculations, EPDO weights each crash based on its severity. Property damage only (PDO) crashes are assumed as one unit, and other types (fatal, injury) are weighted concerning their severity level.
2.4. Societal Risk-Based Crash Hotspot Identification (SRCM)
Considering the impacts of crashes on societal monetary loss, SRCM estimates the amounts that individuals are willing to pay to reduce the risk to their lives and takes the monetary losses caused by different crash severities by converting crashes into their corresponding economic losses.
2.5. Empirical Bayes (EB)
In the empirical Bayes approach, data are gathered by calculating a sample mean and variance based on reference sites similar to the ones under evaluation, or by calculating a safety performance function that relates the crash frequency of the reference sites with their characteristics. Therefore, the crash frequency would be modified by using the reference sites, and a more accurate estimation of the crash average long-term frequency could be obtained. The crash frequency average and the population reference variance must be calculated if the time procedure is used.
2.6. Self-Organizing Map (SOM)
Introduced by Kohonen in the 1980s, SOM is an unsupervised machine learning technique used to reduce the input dimensionality to represent its distribution as a map, which converts complex statistical relationships among high-dimensional data into simple geometric relationships on a low-dimensional display (Figure 1) [18]. In a nutshell, SOM is a classification technique in which data points are grouped by similarity. By applying a competitive learning rule, output nodes compete among themselves for the chance to represent distinct patterns within the input space. The learning process in SOM is not guided by predefined target outcomes (such as supervised networks). Thus, a form of data-driven learning by observation reveals the hidden patterns in the data set [19,20]. Data clustering can be performed with SOM without knowing the class memberships of the inputs. The learning algorithm operates in three stages, competition, cooperation, and adaptation, in which, respectively, output nodes compete with each other, and the winning nodes determine the spatial location of a neighborhood of cooperating nodes. Finally, weight vectors are adjusted in favor of higher values of discriminant functions for the winner and its neighboring units on the map [19,21,22,23].
By preserving the relationships (i.e., topology) in the data, but not the distances, SOMs are designed to transform complex high-dimensional input spaces into simpler, low-dimensional (typically two-dimensional), discrete output spaces. Nodes in the output space are located spatially, indicating that the data in the input space contain inherent statistical characteristics. The principal component analysis and multidimensional scaling techniques are well-known techniques for dimension reduction. SOM procedures are nonparametric but have several advantages over these multivariate methods. The first advantage is that they do not require independence among variables or assumptions about their distributions. A second benefit is their ease of implementation, as well as their capability to solve complex, nonlinear problems. The algorithms are also more effective when dealing with noisy and incomplete data, very small dimensionality, and unlimited samples. SOMs are trained using an unsupervised learning algorithm, one of the architectures and algorithms offered for artificial neural networks. In other words, unlike supervised networks, SOM learning does not involve predefined target outcomes. This allows hidden patterns in the data set to be discovered through observation rather than example-based learning. Using a competitive learning rule, SOMs learn without a teacher by competing among their output nodes to represent distinct patterns in the input space. As input nodes send information to output nodes, SOMs’ feedforward nature allows information to flow only in one direction, without looping or cycling. An SOM contains nodes in both input and output layers, which means that the input and output layers are connected (with weights).
SOMs are formed through three distinct processes, which can be summarized as follows.
(1) Competition: This is a means for output nodes (neurons) in a self-organizing map to compete for the representation of the input sample. A discriminant function is used to measure representation success, which compares input vectors with the weight vectors of the output nodes. There is a competition to determine the node whose connection weights most closely match those of the input sample. There are a number of different functions to determine the winner, i.e., the best-matching unit (BMU) on the map. The most commonly used one is the Euclidean distance.
(2) Cooperation: The SOM is a topographic organization that represents inputs with similar properties in the output space, similar to the way in which neurons dealing with closely related information are located close together so that they are able to interact via short synaptic connections. Neighborhood information is necessary for this to occur. Cooperating nodes form neighborhoods based on the spatial location of the winning node. Those nodes that share many common features activate one another to be able to learn from the same input.
(3) Adaptation: The weight vectors of the winner and its neighboring units are adjusted to favor more highly discriminant functions. These nodes become more similar to the input sample through this learning process. Thus, nodes that respond strongly to a specific piece of input data will be more likely to respond to similar input data in the future.
The SOM repeats these processes for all training samples. Using this method, different locations on the map are trained to respond strongly to various types of data.
In the present study, due to the high volume of calculations required to identify high-crash areas based on the SOM method to implement the SOM clustering process in this research, MATLAB software is used.
2.7. Case Study Data
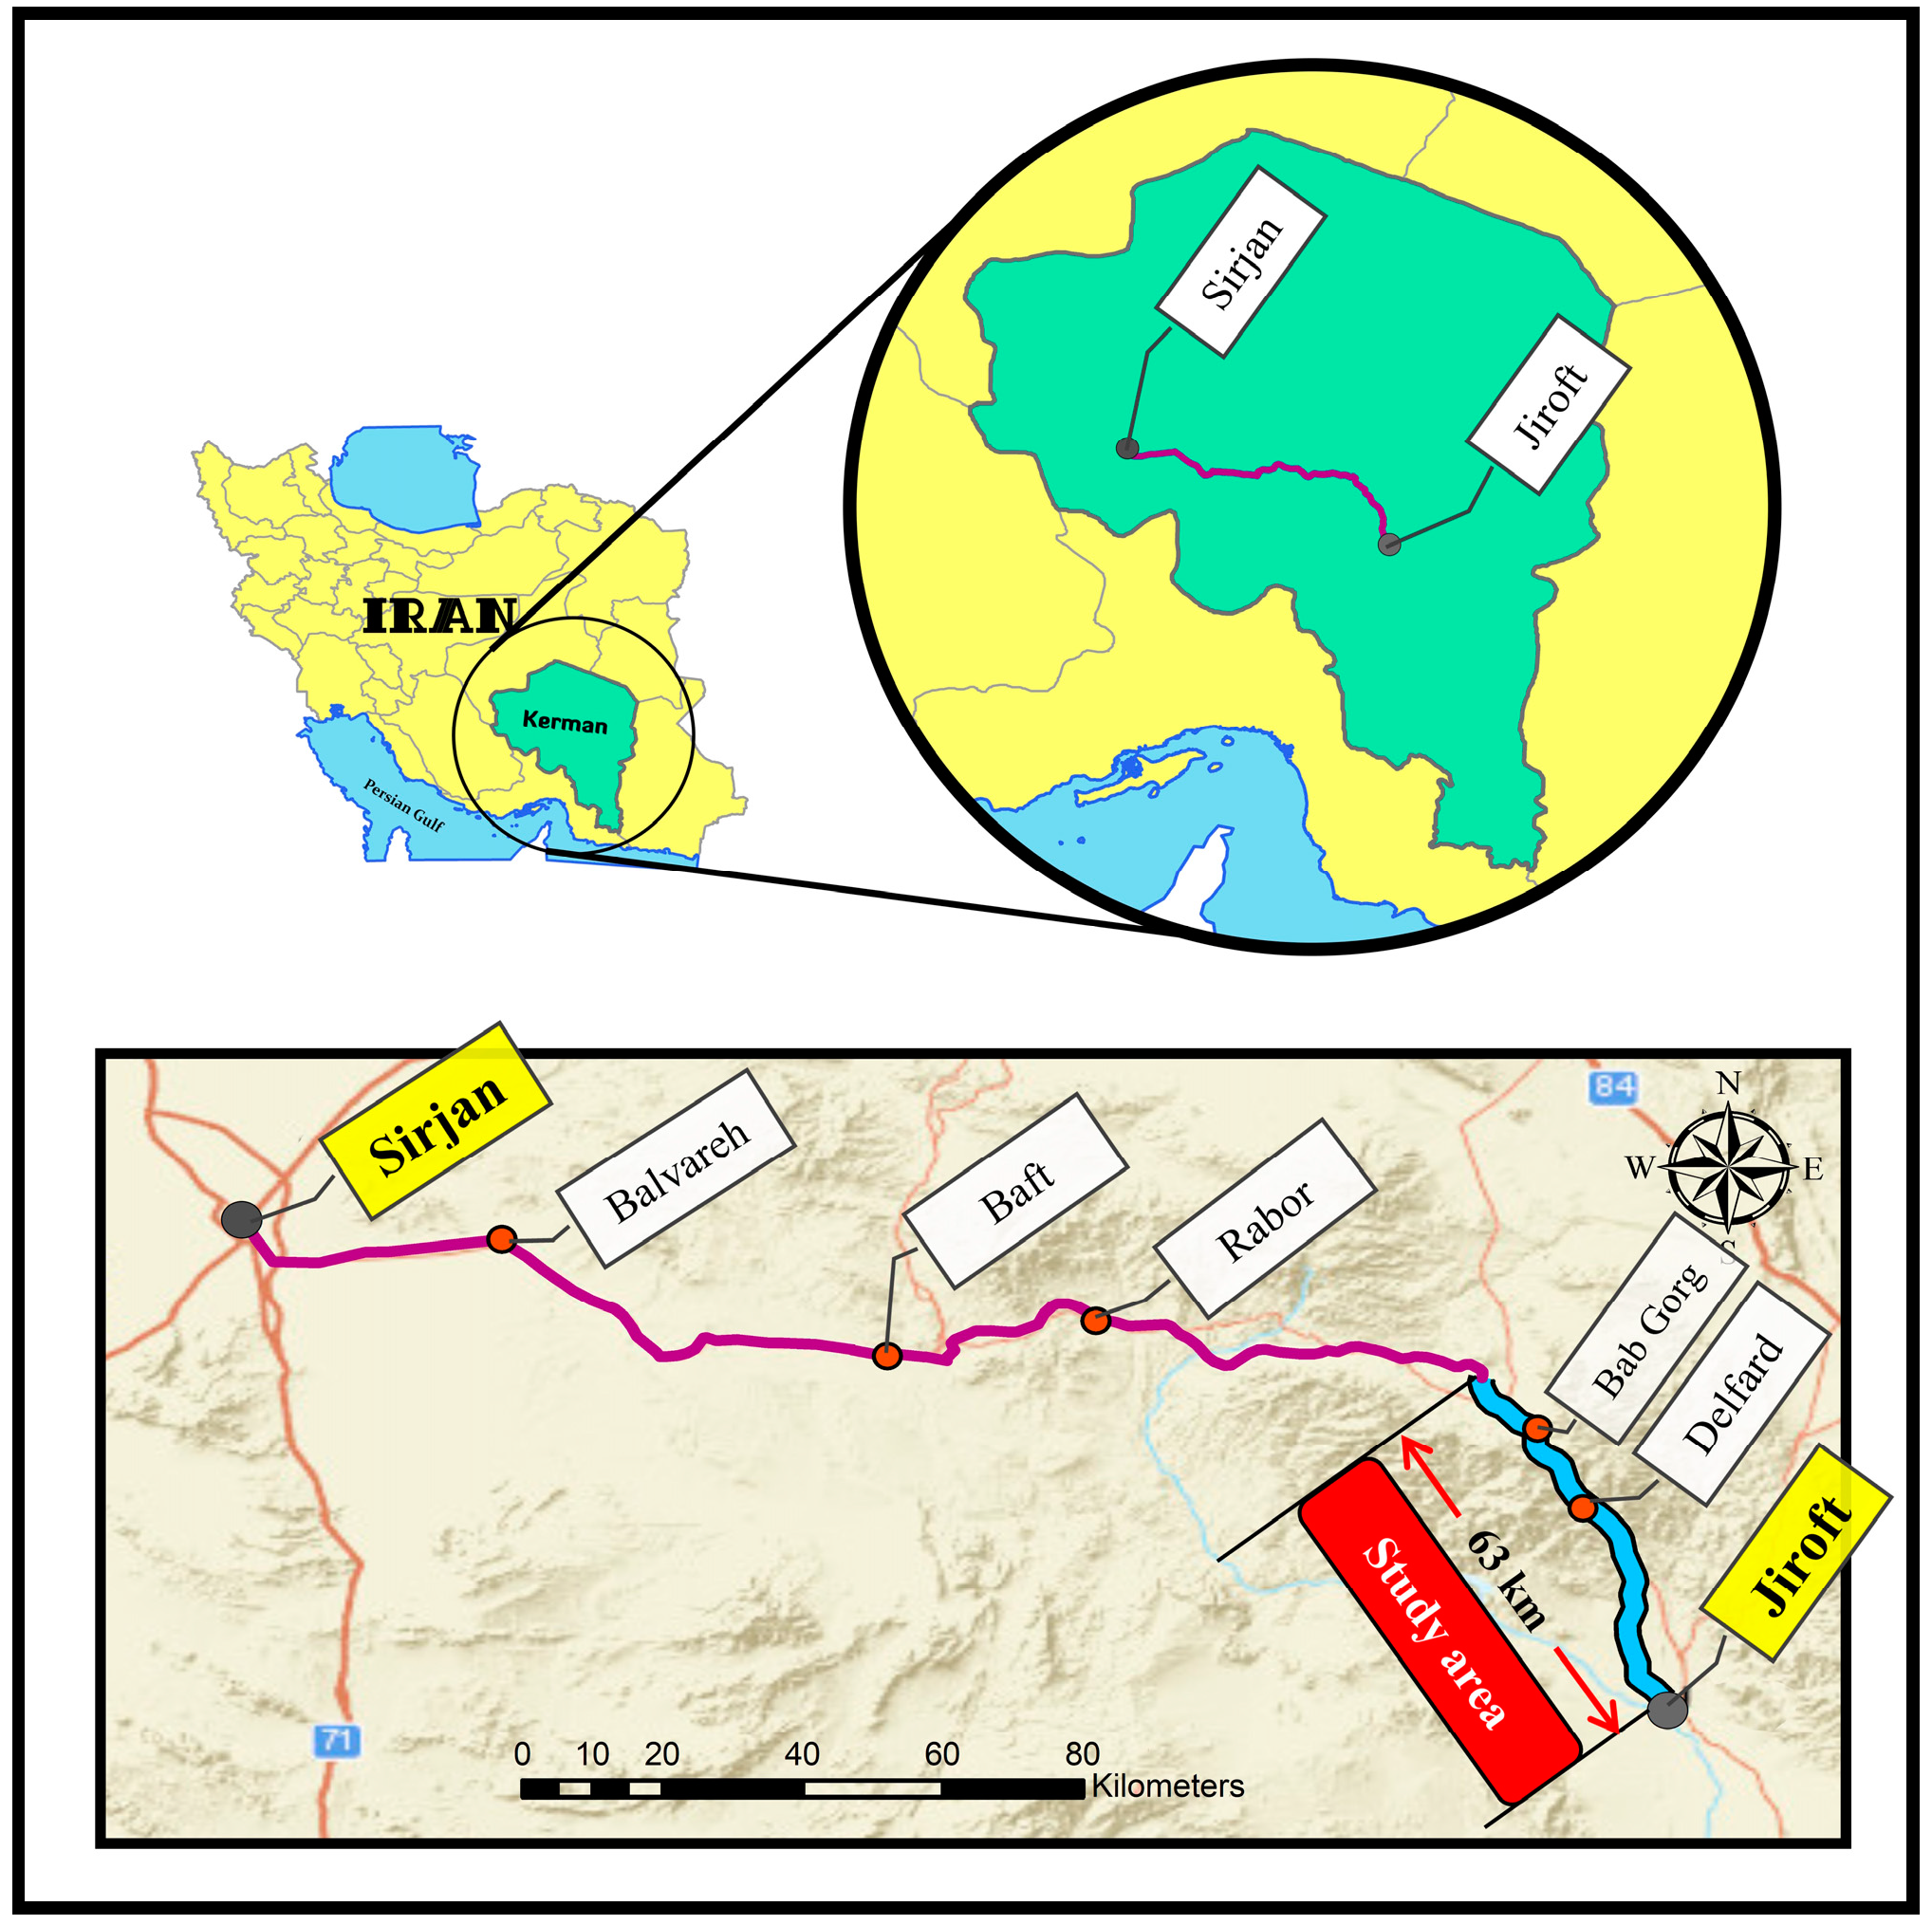
The case study area is a 63-km section of a two-line road in Jiroft–Sirjan (Figure 2), Iran, for which related geometric data, traffic volumes, and crash records were collected. Then, the chosen section was divided into 63 homogenous 1000-m-length segments based on horizontal alignment characteristics and traffic flow volumes. Moreover, crash data from 2018 to 2020 were collected by analyzing police reports and were integrated with detailed site inspections. Data indicate that 346 crashes occurred in the analysis period; 147 crashes were severe (fatal plus injuries).
3. Results and Discussion
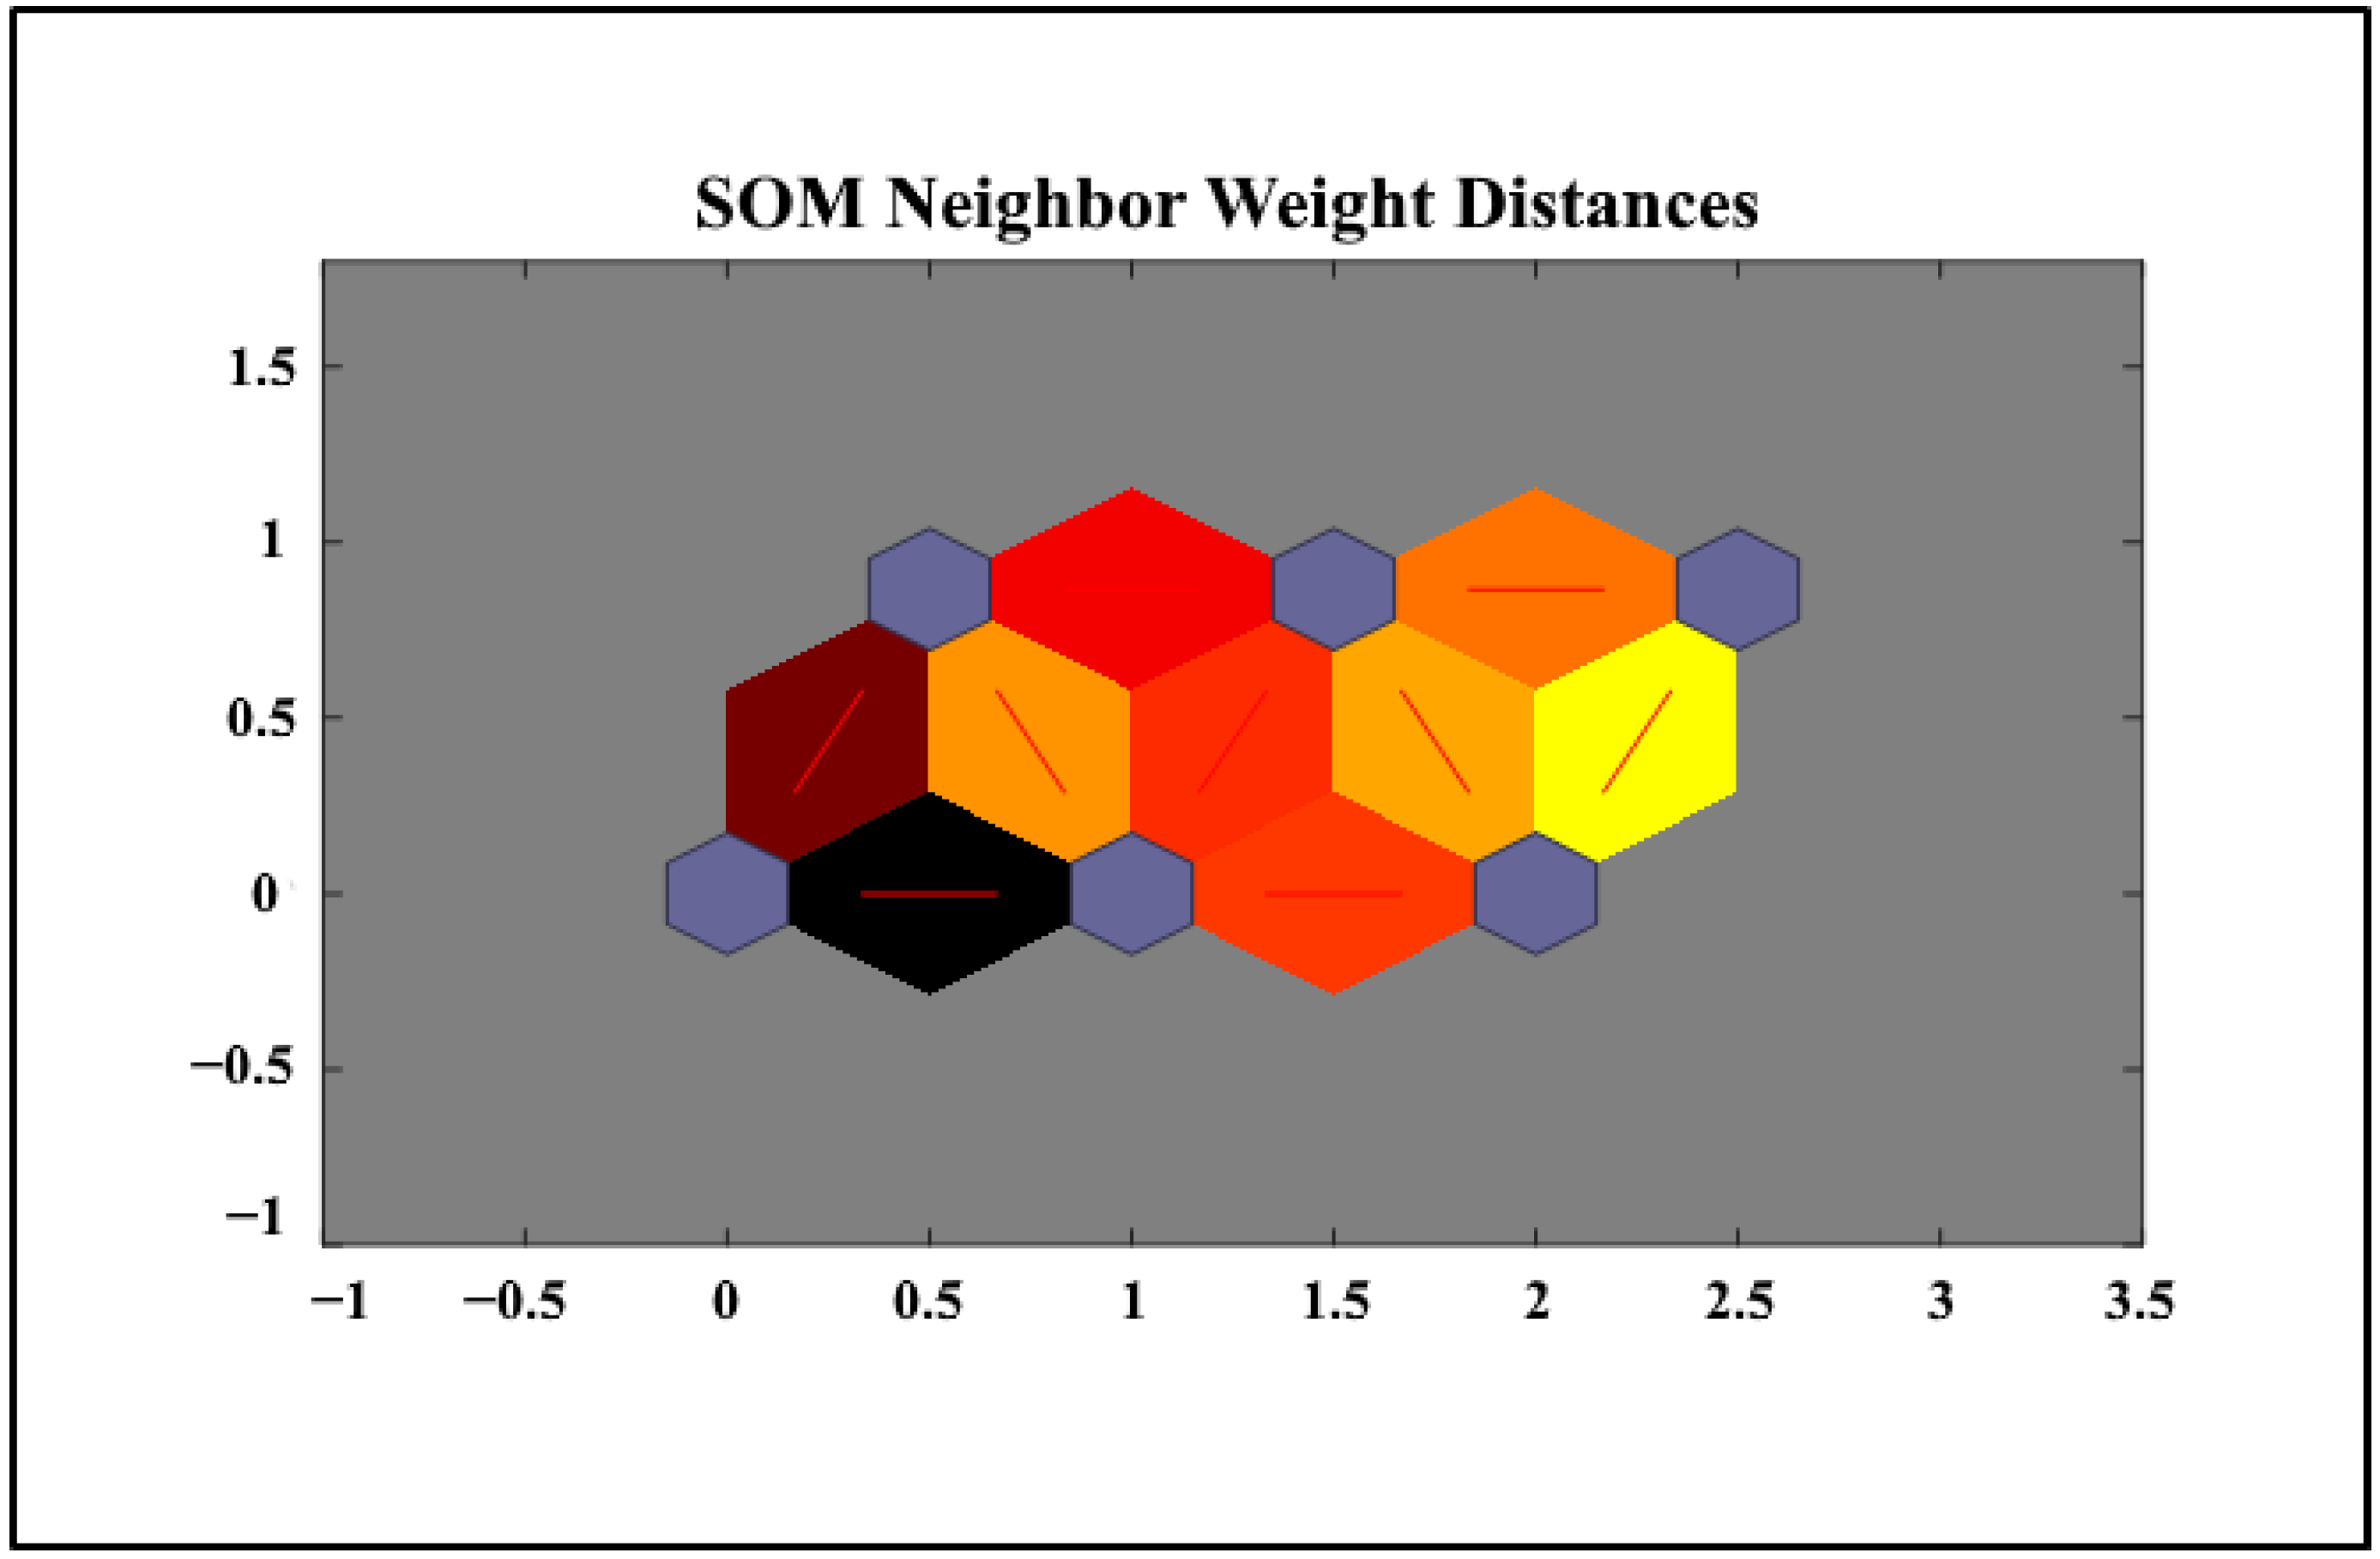
In the present study, the results obtained from five methods of identifying high-crash locations have been used as the desired parameters to identify hotspot locations based on the SOM method. Therefore, the methods used as parameters in this research are the crash frequency (CF), the ranking of equivalent property damage only (EPDO) crash frequency, the crash rate (CR), the empirical Bayes (EB), and the societal risk-based method. In total, 55 sections have crashes and 8 sections have no crashes on the studied road, respectively. The data related to the 55 sections with crashes on the studied road are used as the input data. Then, according to the five indicators, 55 input vectors are given to the desired SOM network with five components. Moreover, using Vesanto and Al-Honiemi’s recommendation, the number of SOM network clusters can be determined from the same number of the total data [24]. This study trained the SOM network with 600 iterations in structuring using six default clusters (i.e., 2 by 3 topologies) and the hexagonal topology (LinkDist) function. The number of network neurons will therefore equal six based on this notion. As shown in Figure 3, after the implementation of the network, the distance between the centers of these six clusters (network neurons) is the same as the neighborhood similarities.
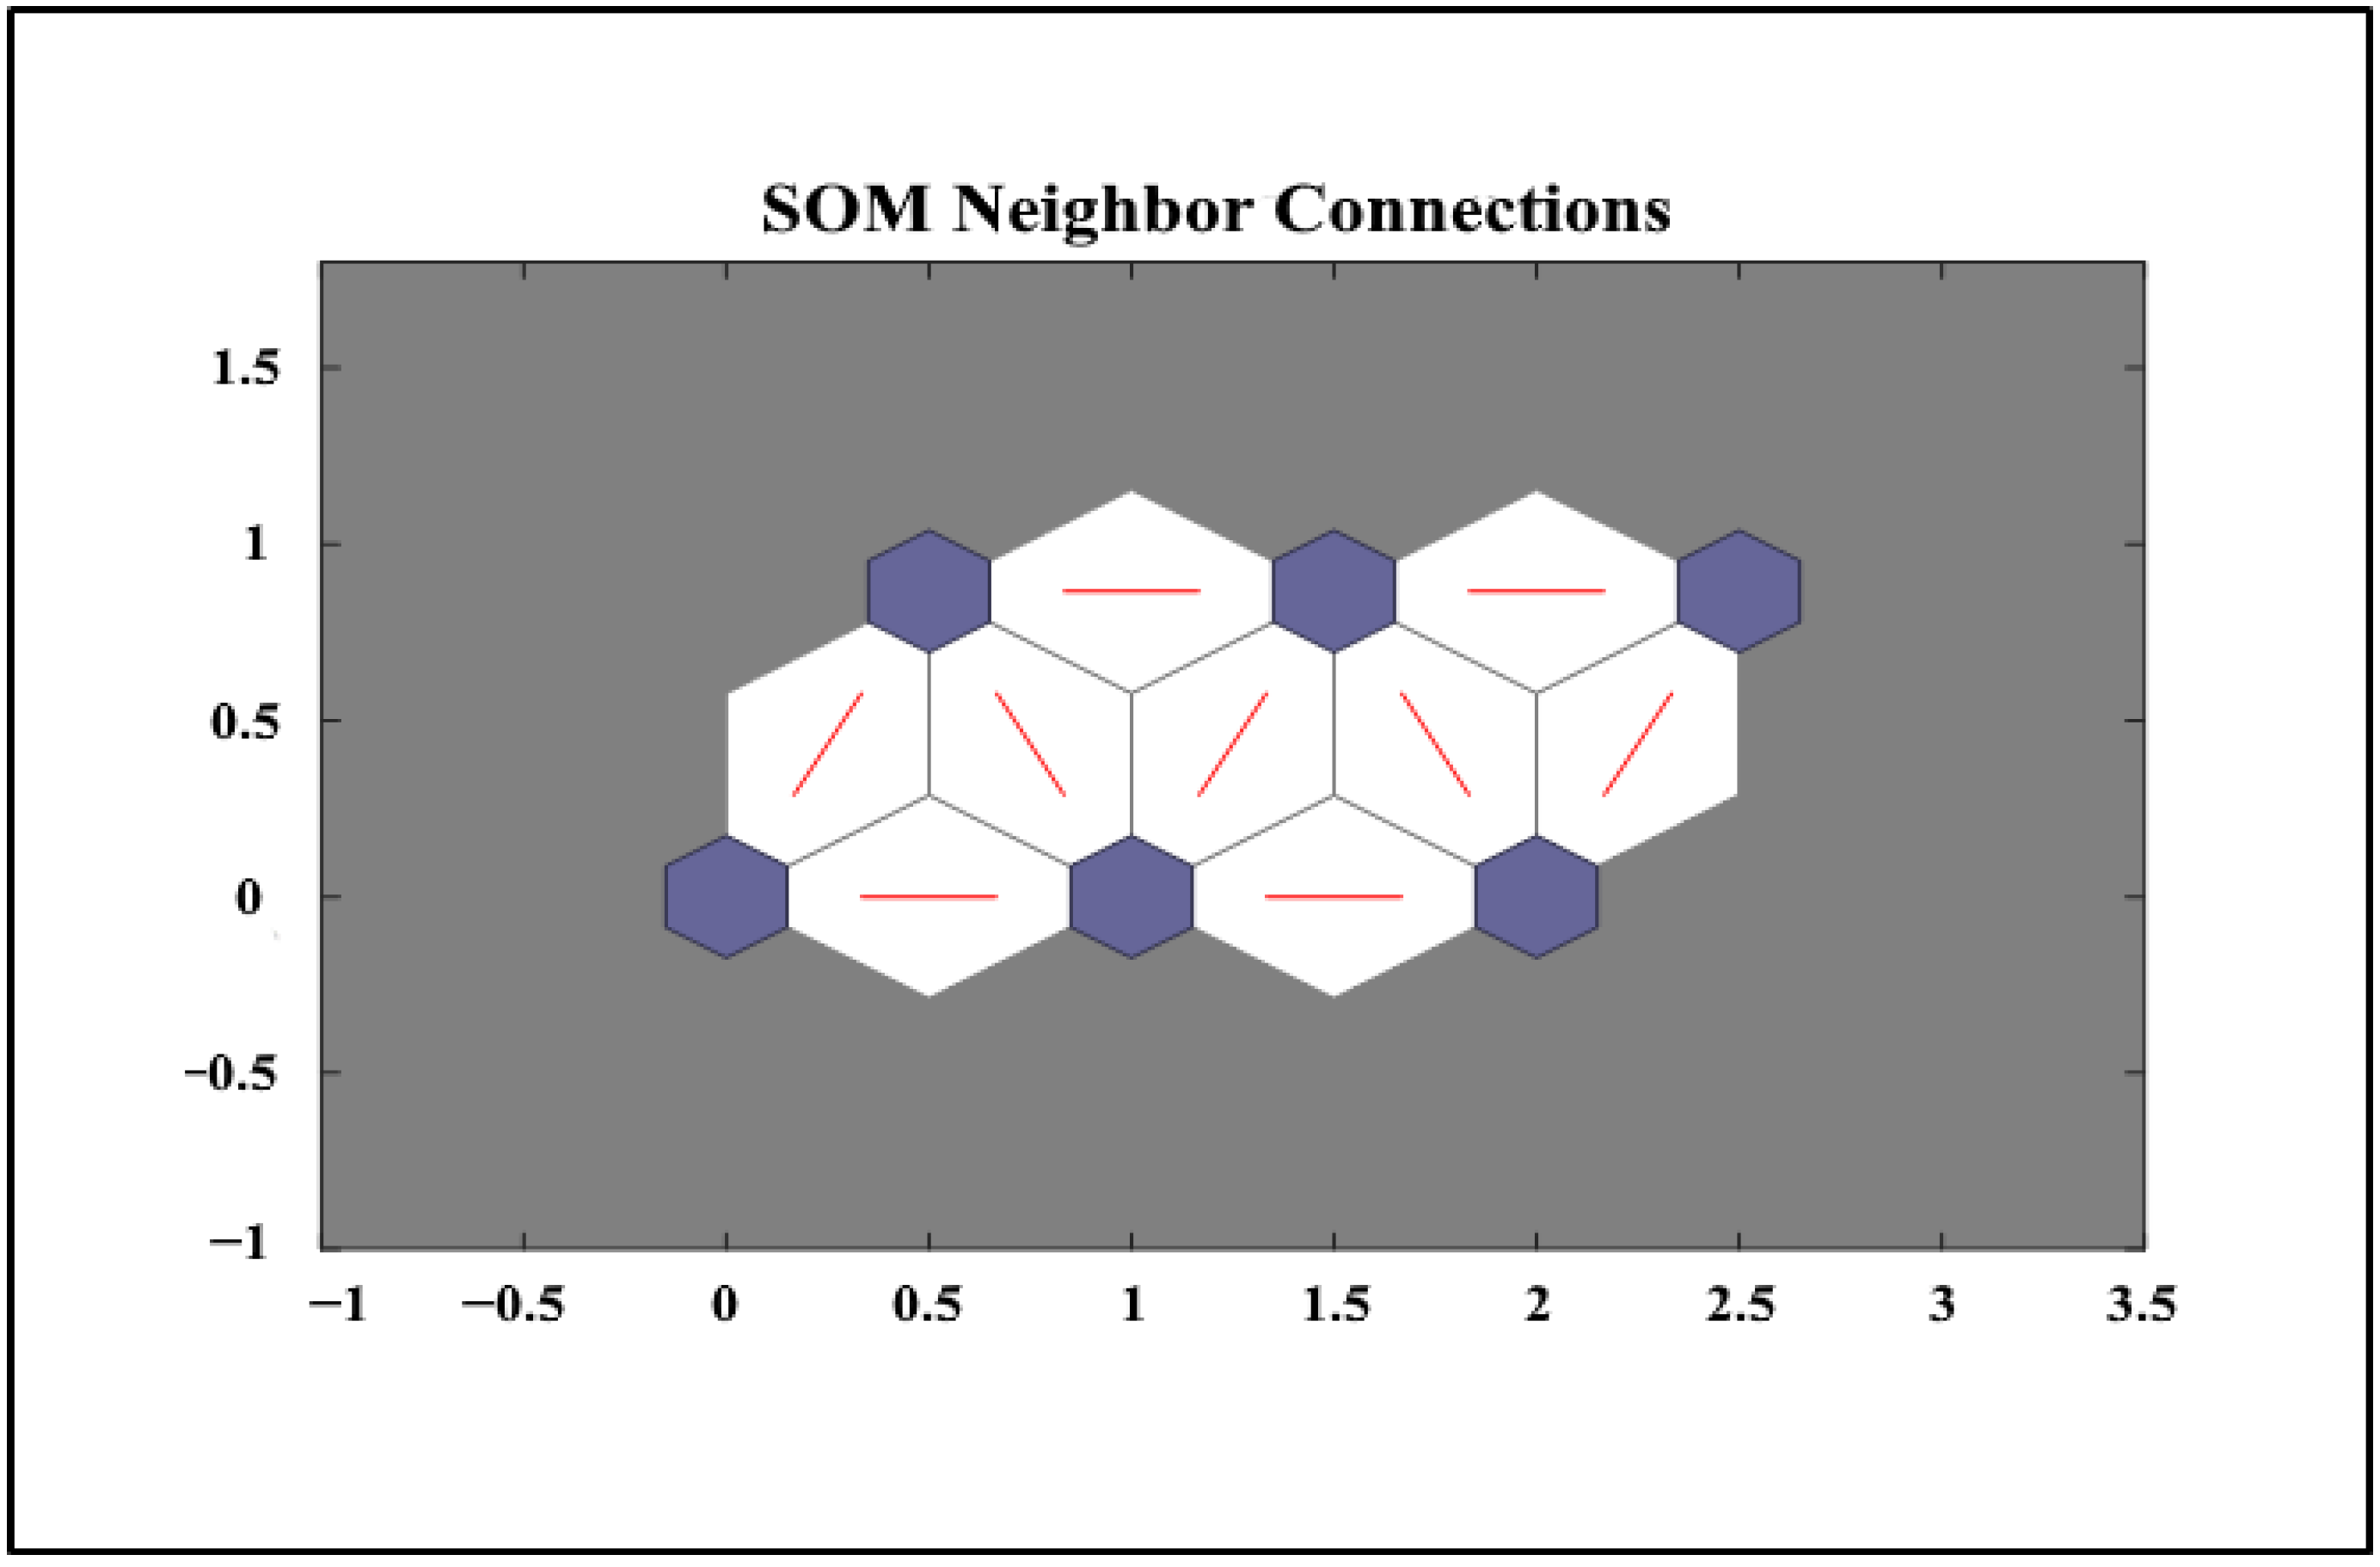
In Figure 3, the distance diagrams of neurons (clusters) show that the greater the distance between two neurons, the darker their neighborhood line. The smaller the distance between them in real space, the more similar they are, and the lighter the color. This shape is known as the U matrix. This matrix helps to interpret multidimensional data in a two-dimensional image. In Figure 4, we also show the neighborhood connections between clusters. As can be seen from Figure 4, each cluster (neuron) can have a maximum of six links (neighborhood) in the hexagonal structure, and it is also clear as to which cluster (neuron) each cluster (neuron) is connected. Meanwhile, in the diagrams (numbers 2 and 3), the horizontal and vertical dimensions indicate the dimensions of the topology (i.e., 2 × 3), respectively, and these dimensions are dimensionless (Figure 5).
Considering that the high-crash sections in this clustering are divided into six clusters, it is now possible to identify and classify the high-crash points of the studied road based on the location of each high-crash section in each cluster. More attention should be paid to the top cluster, and more investment should be made in repairing these crash-prone locations. Therefore, to identify the superior cluster and better invest the available budget, the information presented in Table 1 shows each cluster’s output in the form of the cluster’s center. In Table 1, the center vector of each cluster is calculated using the net.IW command in MATLAB, where each row has six components corresponding to the five indices examined.
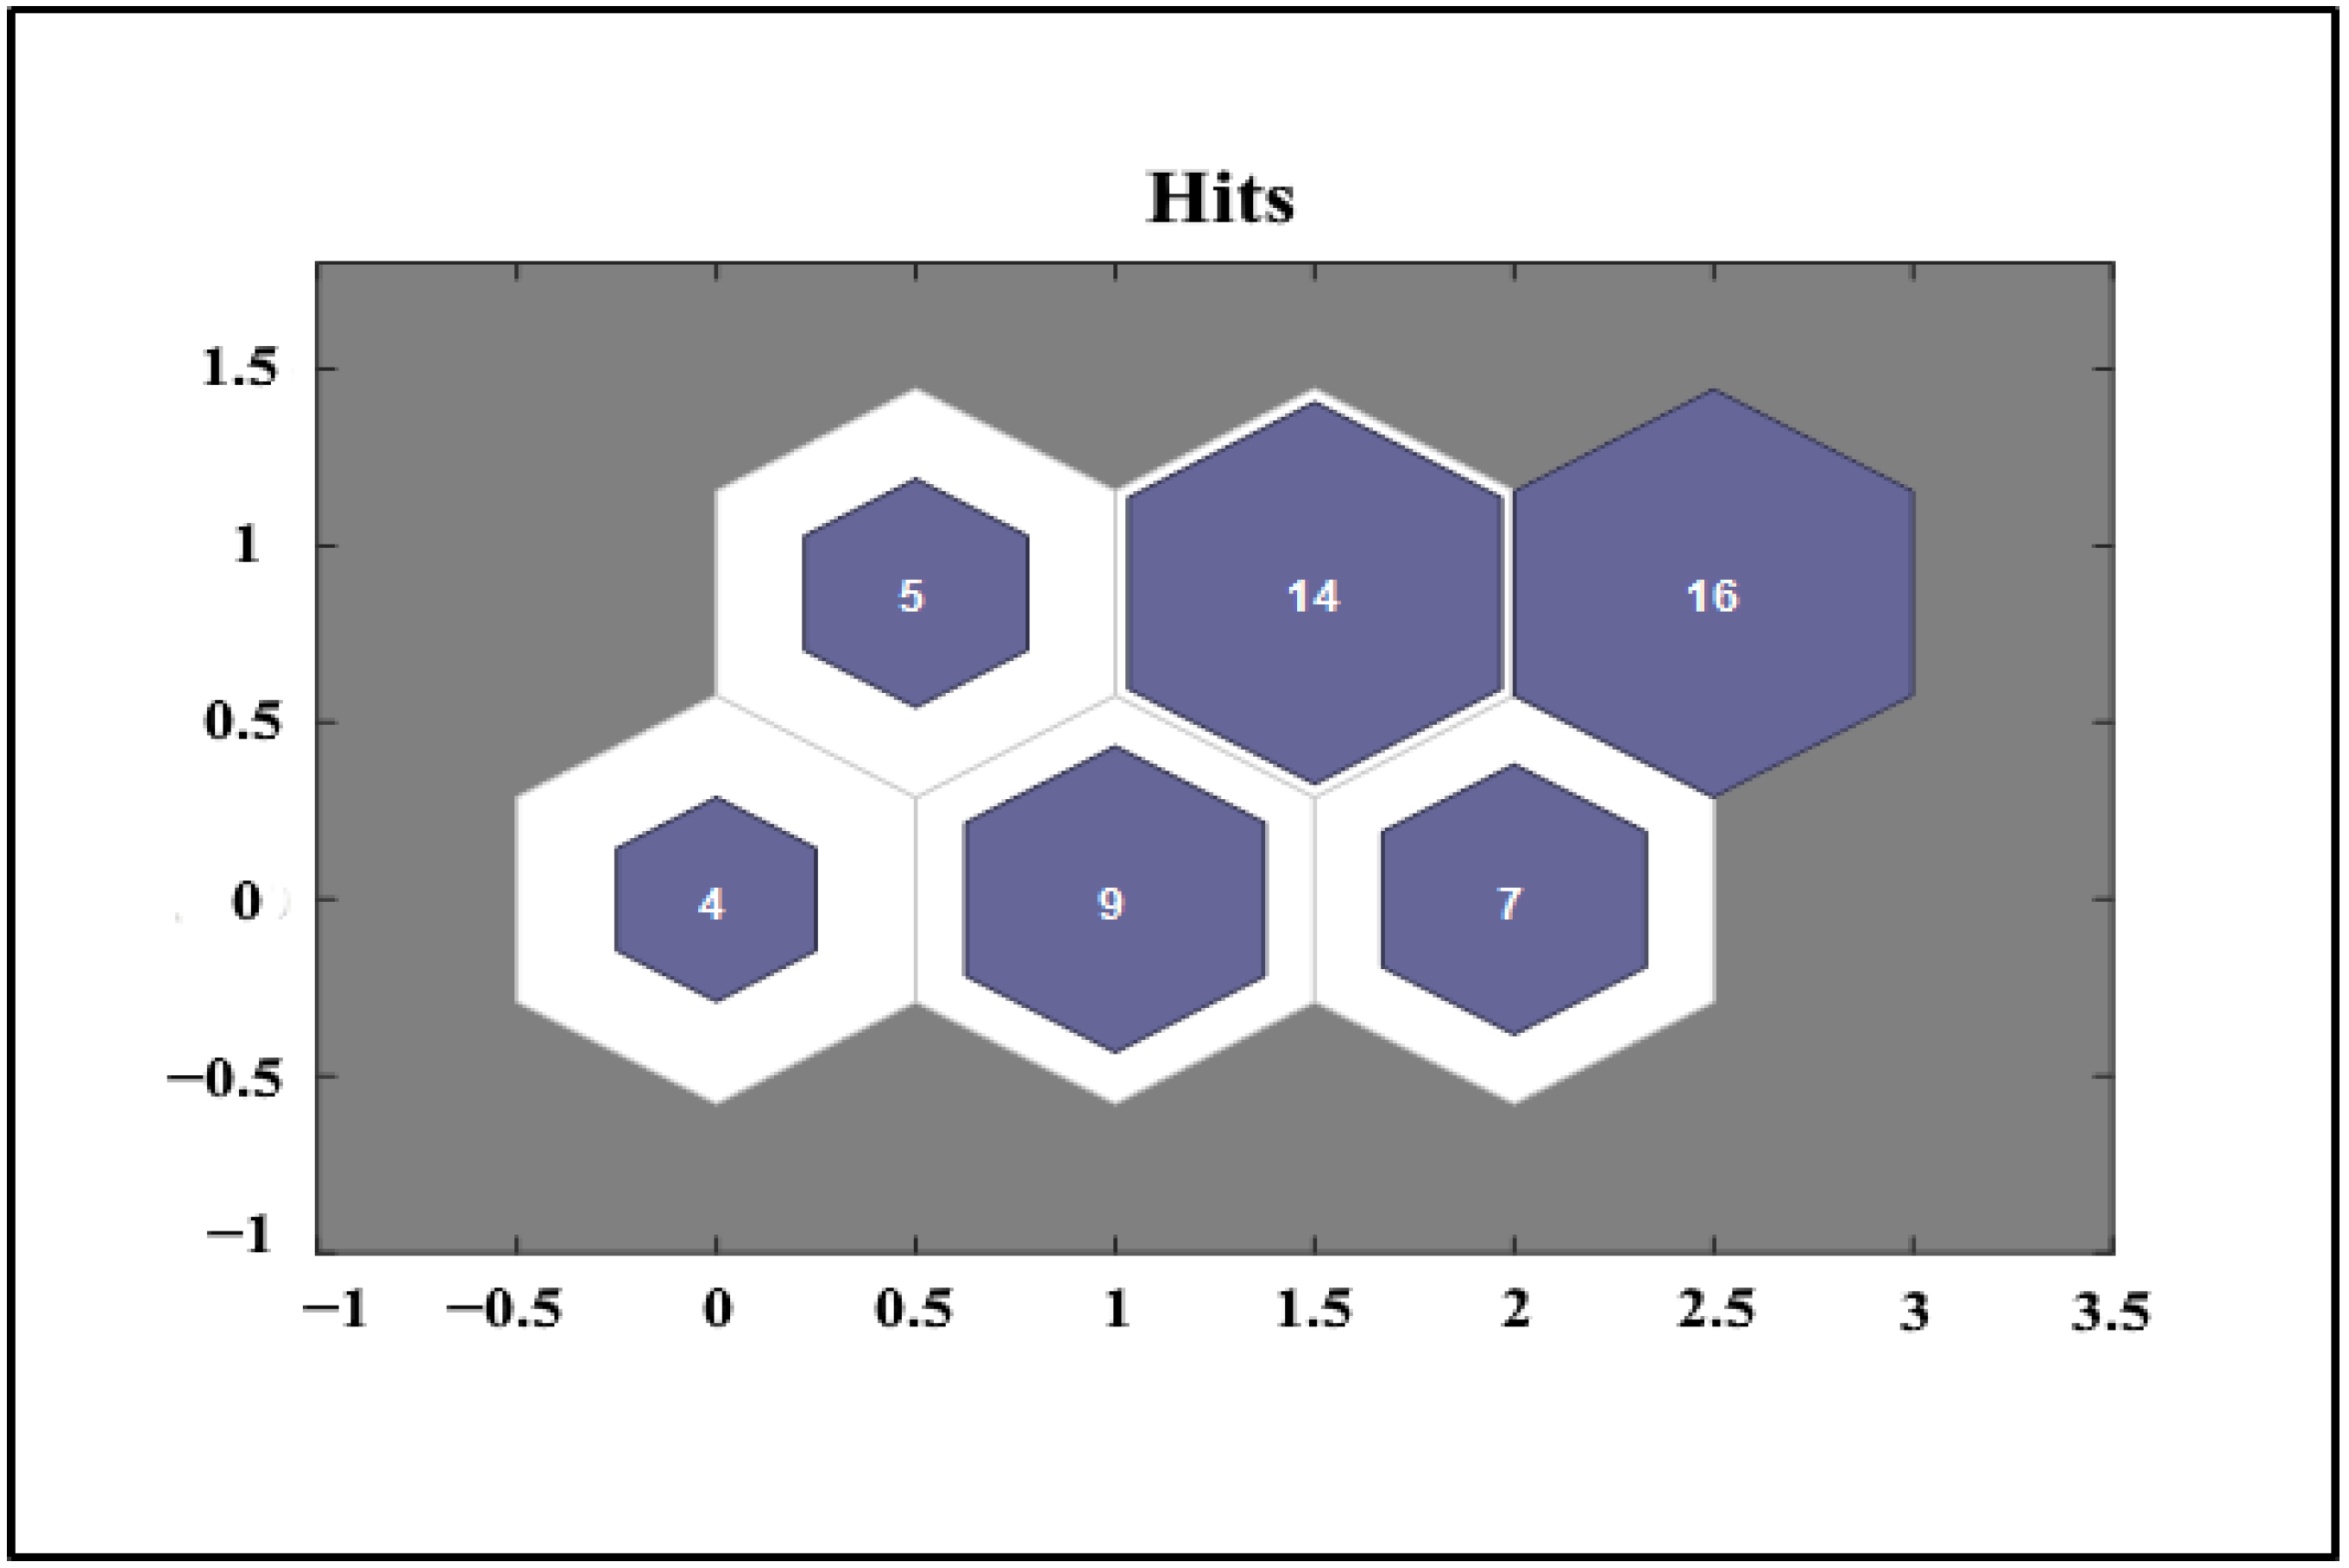
Therefore, according to Table 1, the centers obtained from it, and the sum of the centers of each cluster, the clusters are ranked. The result of this ranking and the most hotspot sections of each cluster are shown in Table 2. Moreover, Table 2, based on the sum of the centers’ index, shows that cluster 1, with four hotspot locations, is better than the other clusters. Cluster 1 is followed by clusters 4, 2, 3, and 5. Finally, cluster 6, with 16 hotspot locations, is the safest cluster in this category.
4. Conclusions
One of the most negative impacts of the development and building of transportation systems in many countries is road crashes, which result in the loss of lives. The social and economic losses caused by these crashes are another cost that is added to the overall cost of the crash. The implementation of safety measures is costly and restricted funds impose limitations on the number of sites that may be treated. To make the best possible use of the limited amount of funds, it is, therefore, necessary to define the priorities of the high-risk sites and their related safety measures so that they can be used as effectively as possible.
Although several approaches have been proposed for identifying high-crash road locations, each of them investigates different aspects of hotspot identification methods [25,26,27,28,29]. Some of these methods have limitations and shortcomings, such as turning to places with high traffic volumes and not considering the nature of crashes. In this study, a method has been presented that considers more relevant and influential factors in crashes. Considering the combination of different identification methods and covering their shortcomings leads to the better identification of hotspots. Only a series of crash-prone sections are identified in prior studies related to hotspot identification, and their priority is not determined. Therefore, in the present study, the self-organized neural network (SOM) method is used as a suitable and remarkable method for classifying and identifying high-crash points.
To analyze and identify high-crash locations based on the SOM method to implement SOM clustering, MATLAB software has been used. The records of 55 hotspot sections on the Jiroft–Sirjan road in Kerman Province were obtained by analyzing police reports, which were integrated with detailed site inspections. In the analysis period, 346 crashes occurred; among them, the number of severe crashes (fatal plus all injuries) was 147. Eventually, to identify hotspot locations based on the SOM method, the results obtained from five methods of identifying high-crash locations were used as the desired parameters. The parameters used in this method were the crash frequency (CF), the ranking of equivalent property damage only (EPDO), the crash rate (CR), the empirical Bayes (EB), and the societal risk-based method. All hotspots were clustered into six categories concerning these criteria as to appropriate services that could be provided for each high-crash point based on the importance of each cluster. The sum of centers indicator in clusters was used to rank and determine the significance of each cluster.
Therefore, as shown in Table 2, the first cluster, with four hotspot locations, has been identified as the highest-priority cluster. The forth cluster was identified as the second most important, followed by the second, third, and fifth clusters. Finally, the sixth cluster, with 16 hotspots, was recognized as the safest cluster in this category.
The findings indicate that self-organized neural networks (SOMs) can be used as a suitable tool for multidimensional data analysis and clustering. The method allows the road safety decision-maker to identify similar high-crash sections that require similar policies and financial resources to address their crash occurrence and place them in the same cluster. This is especially important when the number of crash hotspots on the road is very high, but the recovery budget is limited. Therefore, in this study, using the self-organized mapping algorithm (SOM), hotspot locations that need more attention have been identified, and thus, given that similar hotspot locations can be found in the cluster separately, and the hotspots of each road can be identified, services and financial resources can be provided to eliminate crash hotspots based on proper clustering.
Besides the several approaches to identifying crash hotspots and improving safety in these sections, public policies can be helpful in reducing crashes. For example, applying a multimodal public transport system that is well integrated with the land use system can encourage people to stop using private cars. Directing the attention of planners and policymakers toward sustainable mobility can facilitate a reduction in traveling by private modes and thus reduce the risk of crashes [30,31,32,33].
It should be noted that the results obtained are based on several HSID methods, and the results may change when other methods are used. However, the research results are significant. Furthermore, further study should be undertaken in different areas and with other HSID methods to obtain more confidence in the benefits of using the self-organizing mapping (SOM) method. Although the present model could be extended to different clusters, fuzzy neural networks are a powerful method for predicting phenomena. Therefore, to expand the present study, it is possible to combine artificial neural networks with fuzzy logic or optimization for each new section category. This approach will lead to methods for uncertain situations.
Author Contributions
Conceptualization, E.K. and F.H.; methodology, E.K. and F.H.; software, E.K.; validation, E.K.; formal analysis, E.K., F.H., A.S., M.A. and K.S.; data curation, E.K.; writing—original draft preparation, E.K., A.S. and M.A.; writing—review and editing, E.K., F.H., A.S., M.A. and K.S.; supervision, F.H. All authors have read and agreed to the published version of the manuscript.
Funding
This research received no external funding.
Institutional Review Board Statement
Not applicable.
Informed Consent Statement
Not applicable.
Data Availability Statement
Not applicable.
Acknowledgments
This study was conducted by Babol Noshirvani University of Technology. The authors would like to thank and acknowledge all the collaborators of the project.
Conflicts of Interest
The authors declare no conflict of interest.
References
- Al-Aamri, A.K.; Hornby, G.; Zhang, L.C.; Al-Maniri, A.A.; Padmadas, S.S. Mapping road traffic crash hotspots using GIS-based methods: A case study of Muscat Governorate in the Sultanate of Oman. Spat. Stat. 2021, 42, 100458. [Google Scholar] [CrossRef]
- Guo, X.; Wu, L.; Zou, Y.; Fawcett, L. Comparative analysis of empirical bayes and bayesian hierarchical models in hotspot identification. Transp. Res. Rec. 2019, 7, 111–121. [Google Scholar] [CrossRef]
- Persaud, B.; Lan, B.; Lyon, C.; Bhim, R. Comparison of empirical Bayes and full Bayes approaches for before–after road safety evaluations. Crash Anal. Prev. 2010, 42, 38–43. [Google Scholar] [CrossRef] [PubMed]
- Thakali, L.; Kwon, T.J.; Fu, L. Identification of crash hotspots using kernel density estimation and kriging methods: A comparison. J. Mod. Transp. 2015, 23, 93–106. [Google Scholar] [CrossRef] [Green Version]
- Norden, M.; Orlansky, J.; Jacobs, H. Application of statistical quality-control techniques to analysis of highway-crash data. Highw. Res. Board. 1956, 117, 17–31. [Google Scholar]
- Songchitruksa, P.; Zeng, X. Getis–Ord spatial statistics to identify hot spots by using incident management data. Transp. Res. Rec. 2010, 2165, 42–51. [Google Scholar] [CrossRef]
- Pawlovich, P.I. Road Safety Manual; Southeast Michigan Council of Governments: Detroit, MI, USA, 2007. [Google Scholar]
- Montella, A. A comparative analysis of hotspot identification methods. Crash Anal. Prev. 2010, 42, 571–581. [Google Scholar] [CrossRef]
- Yang, X.; Zou, Y.; Tang, J.; Liang, J.; Ijaz, M. Evaluation of short-term freeway speed prediction based on periodic analysis using statistical models and machine learning models. J. Adv. Transp. 2020, 2020, 9628957. [Google Scholar] [CrossRef] [Green Version]
- Taghva, M.; Bamakan, S.; Toufani, S. A data mining method for service marketing: A case study of banking industry. Manag. Sci. Lett. 2011, 3, 253–262. [Google Scholar] [CrossRef]
- Briz-Redón, Á.; Martínez-Ruiz, F.; Montes, F. Identification of differential risk hotspots for collision and vehicle type in a directed linear network. Crash Anal. Prev. 2019, 132, 105278. [Google Scholar] [CrossRef]
- Cheng, W.; Gill, G.S.; Ensch, J.L.; Kwong, J.; Jia, X. Multimodal crash frequency modeling: Multivariate space-time models with alternate spatiotemporal interactions. Crash Anal. Prev. 2018, 113, 159–170. [Google Scholar] [CrossRef]
- Cheng, Z.; Zu, Z.; Lu, J. Traffic crash evolution characteristic analysis and spatiotemporal hotspot identification of urban road intersections. Sustainability 2018, 11, 160. [Google Scholar] [CrossRef] [Green Version]
- Ma, L.; Yan, X.; Wei, C.; Wang, J. Modeling the equivalent property damage only crash rate for road segments using the hurdle regression framework. Anal. Methods Crash Res. 2016, 11, 48–61. [Google Scholar] [CrossRef]
- Qu, X.; Meng, Q. A note on hotspot identification for urban expressways. Saf. Sci. 2014, 66, 87–91. [Google Scholar] [CrossRef] [Green Version]
- Wang, L.; Zhong, H.; Ma, W.; Abdel-Aty, M.; Park, J. How many crashes can connected vehicle and automated vehicle technologies prevent: A meta-analysis. Crash Anal. Prev. 2020, 136, 105299. [Google Scholar] [CrossRef]
- Yu, R.; Abdel-Aty, M. Analyzing crash injury severity for a mountainous freeway incorporating real-time traffic and weather data. Saf. Sci. 2014, 63, 50–56. [Google Scholar] [CrossRef]
- Lanard, J.G.; Pietrzyk, M.; Cser, L. Mathematical and Physical Simulation of the Properties of Hot Rolled Products; Elsevier: Amsterdam, The Netherlands, 1999. [Google Scholar]
- Asan, U.; Ercan, S. An introduction to self-organizing maps. In Computational Intelligence Systems in Industrial Engineering; Kahraman, C., Ed.; Atlantis Press: Paris, France, 2012; Volume 1, pp. 295–315. [Google Scholar]
- Bangert, P. Machine Learning and Data Science in the Power Generation Industry; Elsevier: Amsterdam, The Netherlands, 2021. [Google Scholar]
- Bhuiyan, M.A.; Karmaker, S.C.; Bodrud-Doza, M.; Rakib, M.A.; Saha, B.B. Enrichment, sources and ecological risk mapping of heavy metals in agricultural soils of dhaka district employing SOM, PMF and GIS methods. Chemosphere 2021, 263, 245–259. [Google Scholar]
- Ghadiri, S.M.; Mazlumi, K. Adaptive protection scheme for microgrids based on SOM clustering technique. Appl. Soft Comput. 2020, 88, 62–106. [Google Scholar] [CrossRef]
- Makmuang, S.; Nootchanat, S.; Ekgasit, S.; Wongravee, K. Non-destructive method for discrimination of weedy rice using near infrared spectroscopy and modified self-organizing maps (SOMs). Comput. Electron. Agric. 2021, 191, 106522. [Google Scholar] [CrossRef]
- Vesanto, J.; Alhoniemi, E. Clustering of the self-organizing map. IEEE Trans. Neural Netw. 2000, 11, 586–600. [Google Scholar] [CrossRef]
- Mahmoud, N.; Abdel-Aty, M.; Cai, Q.; Zheng, O. Vulnerable road users’ crash hotspot identification on multi-lane arterial roads using estimated exposure and considering context classification. Accid. Anal. Prev. 2021, 159, 106294. [Google Scholar] [CrossRef] [PubMed]
- Zaki, M.H.; Sayed, T.; Shaaban, K. Use of drivers’ jerk profiles in computer vision–based traffic safety evaluations. Transp. Res. Rec. 2014, 2434, 103–112. [Google Scholar] [CrossRef]
- Tageldin, A.; Sayed, T.; Shaaban, K. Comparison of time-proximity and evasive action conflict measures: Case studies from five cities. Transp. Res. Rec. 2017, 2661, 19–29. [Google Scholar] [CrossRef]
- Osama, A.; Sayed, T.; Zaki, M.H.; Shaaban, K. An inclusive framework for automatic safety evaluation of roundabouts. J. Transp. Saf. Secur. 2016, 8, 377–394. [Google Scholar] [CrossRef]
- Lee, J.; Chung, K.; Papakonstantinou, I.; Kang, S.; Kim, D.K. An optimal network screening method of hotspot identification for highway crashes with dynamic site length. Crash Anal. Prev. 2020, 135, 105358. [Google Scholar] [CrossRef] [PubMed]
- Tiboni, M.; Rossetti, S.; Vetturi, D.; Torrisi, V.; Botticini, F.; Schaefer, M.D. Urban Policies and Planning Approaches for a Safer and Climate Friendlier Mobility in Cities: Strategies, Initiatives and Some Analysis. Sustainability 2021, 13, 1778. [Google Scholar] [CrossRef]
- Pazzini, M.; Lantieri, C.; Vignali, V.; Simone, A.; Dondi, G.; Luppino, G.; Grasso, D. Comparison between Different Territorial Policies to Support Intermodality of Public Transport. Transp. Res. Procedia 2022, 60, 68–75. [Google Scholar] [CrossRef]
- Pazzini, M.; Lantieri, C.; Vignali, V.; Simone, A.; Dondi, G.; Luppino, G.; Grasso, D. Case Studies in the Emilia Romagna Region in Support of Intermodality and Accessibility of Public Transport. In Proceedings of the 5th Conference on Sustainable Urban Mobility, Virtual CSUM2020, Volos, Greece, 17–19 June 2020; Nathanail, E.G., Adamos, G., Karakikes, I., Eds.; Advances in Intelligent Systems and Computing; Springer International Publishing: Cham, Switzerland, 2021; pp. 65–74. [Google Scholar]
- Azmoodeh, M.; Haghighi, F.; Motieyan, H. Proposing an Integrated Accessibility-Based Measure to Evaluate Spatial Equity among Different Social Classes. Environ. Plan. B Urban Anal. City Sci. 2021, 48, 2790–2807. [Google Scholar] [CrossRef]
Figure 1.
An illustration of a self-organizing map.

Figure 2.
The study area in Kerman Province, Iran.

Figure 3.
Graph of distances between neighboring neurons in the SOM network. Note: Colored areas represent individual clusters.
Figure 3.
Graph of distances between neighboring neurons in the SOM network. Note: Colored areas represent individual clusters.

Figure 4.
Neighborly connections between clusters.

Figure 5.
Number of crash-prone sections located in each cluster (neuron).


Table 1.
The centers of each cluster based on five indicators.
| Indices | Cluster 1 | Cluster 2 | Cluster 3 | Cluster 4 | Cluster 5 | Cluster 6 |
|---|---|---|---|---|---|---|
| AF | 13.2500 | 5.2500 | 14.7143 | 18.7500 | 5.2308 | 1.8125 |
| EPDO | 40.1250 | 16.5625 | 30.4286 | 40.3750 | 10.2308 | 2.9063 |
| AR | 6.4733 | 2.5649 | 7.1887 | 9.1604 | 2.5555 | 0.8855 |
| EB | 12.1525 | 5.5994 | 13.3520 | 16.6578 | 5.5836 | 2.7836 |
| Societal risk-based | 108.6220 | 43.5340 | 2.7669 | 45.4420 | 0.8935 | 0.2115 |
| Total | 180.6228 | 73.5108 | 68.4505 | 130.3852 | 24.4942 | 8.5994 |
Table 2.
Hotspot sections in each cluster.
| Cluster | Kilometers of Sections Located in Each Cluster | Ranking of Cluster |
|---|---|---|
| 1 | 23, 35, 43, 58 | 1 |
| 2 | 4, 7, 13, 19, 22, 24, 48, 51, 60 | 3 |
| 3 | 5, 21, 27, 30, 40, 45, 55 | 4 |
| 4 | 15, 18, 20, 25, 50 | 2 |
| 5 | 8, 10, 12, 17, 26, 29, 31, 32, 33, 34, 36, 37, 38, 42 | 5 |
| 6 | 1, 11, 14, 16, 28, 39, 41, 44, 46, 47, 52, 53, 57, 59, 62, 63 | 6 |
Disclaimer/Publisher’s Note: The statements, opinions and data contained in all publications are solely those of the individual author(s) and contributor(s) and not of MDPI and/or the editor(s). MDPI and/or the editor(s) disclaim responsibility for any injury to people or property resulting from any ideas, methods, instructions or products referred to in the content. |
© 2023 by the authors. Licensee MDPI, Basel, Switzerland. This article is an open access article distributed under the terms and conditions of the Creative Commons Attribution (CC BY) license (https://creativecommons.org/licenses/by/4.0/).
Share and Cite
MDPI and ACS Style
Karimi, E.; Haghighi, F.; Sheykhfard, A.; Azmoodeh, M.; Shaaban, K. Self-Organized Neural Network Method to Identify Crash Hotspots. Future Transp. 2023, 3, 286-295. https://doi.org/10.3390/futuretransp3010017
AMA Style
Karimi E, Haghighi F, Sheykhfard A, Azmoodeh M, Shaaban K. Self-Organized Neural Network Method to Identify Crash Hotspots. Future Transportation. 2023; 3(1):286-295. https://doi.org/10.3390/futuretransp3010017
Chicago/Turabian StyleKarimi, Esmaiel, Farshidreza Haghighi, Abbas Sheykhfard, Mohammad Azmoodeh, and Khaled Shaaban. 2023. "Self-Organized Neural Network Method to Identify Crash Hotspots" Future Transportation 3, no. 1: 286-295. https://doi.org/10.3390/futuretransp3010017