Article

Analyzing Urban Travel Behavior Components in Tehran, Iran

1
Department of Geography and Urban Planning, Faculty of Humanities, Shahid Chamran University of Ahvaz, Ahvaz 6135783151, Iran
2
The IDEC Institute and Network for Education and Research on Peace and Sustainability (NERPS), Hiroshima University, Higashihiroshima 739-8529, Japan
*
Author to whom correspondence should be addressed.
Future Transp. 2023, 3(1), 236-253; https://doi.org/10.3390/futuretransp3010014
Submission received: 5 January 2023 / Revised: 1 February 2023 / Accepted: 3 February 2023 / Published: 8 February 2023

Abstract

:
This research is an attempt to explore the nature and characteristics of urban travel behavior in the metropolitan area of the Iranian capital, Tehran. To this end, using the perspectives of 822 participants via a questionnaire survey, we assessed six major Travel Behavior Components (TBCs)—namely, travel mode, travel time, travel destination, travel frequency, travel choice, and travel purpose—from the lens of five different sociodemographic characteristics—that is, gender, age, family structure, and educational and occupational groups. Using SPSS-26, MAXQDA, and Structural Equation Model (SEM) via AMOS software, we analyzed priorities and preferences related to TBCs across different social groups and explored the impact of preferences of different social groups on TBCs in the Tehran metropolitan area. The results indicate that firstly, the tendency to travel by private transport has the highest share among all groups compared with other modes of travel. Secondly, we identified four major challenges affecting urban travel behavior in Tehran: lacking diverse options for urban traveling, old vehicles and infrastructure, traffic congestion, and unequal access to travel facilities in the city. Finally, we found that sociodemographic characteristics have a relatively strong and significant impact on TBCs. The study highlights the role of sociodemographic characteristics in travel behavior transformations and gives more insights into the travel behavior preferences of urban residents. Such insights would be effective for city policymakers and planners to enhance the quality of urban transportation.

1. Introduction

Cities historically are known as hubs of transformation and development [1]. They undeniably impact the environment and are responsible for up to 70% of CO2 emissions [2]. Urban transportation has also always been pivotal in urban environmental changes and challenges [3,4]. In this regard, emissions from transportation are rising faster than in any other sector. Based on [5] (p. 66) “The transportation sector is a major emitter of CO2 and currently contributes 20–25% of global CO2 emissions, with its global share estimated to rise to 30–50% by 2050”. Despite increasing investment in electric and new smart vehicles in recent years, many transportation systems remain dependent on fossil-fuel-powered internal combustion engines [6].
Due to various factors, such as old transportation infrastructure, inefficient vehicles, limited planning capacity, and unregulated urban growth that increases car dependency, urban transportation has caused many challenges in the urban areas of developing countries [7]. This situation also affects urban travel behavior, which is directly affected by the structure, policies, and facilities of the urban transportation system in urban areas [8,9].
Travel behavior can have a remarkable and determinative role in understanding urban transportation patterns, trends, and outputs [10]. It not only represents social demands and desires but also highlights the level of urban transportation development and sustainability [11,12]. As Yao and Wang have defined it, travel behavior refers to “the daily life trip making behavior in terms of when, where, by what means, how long or how far trips are made” [12] (p. 122). Specifically, it can be considered in the form of some measures, such as travel frequencies, travel time, travel distance, travel mode, travel reason, and so on [13,14]. Further, according to the literature, one of the influential factors in travel behavior is the individual identity which has great potential to explain behavior and its changes [15,16,17]. It is also linked with the ‘habit’ that effectively impacts travel choice and its changes as well as travel behavior prediction [17]. Personal identity can clarify the reasons for different choices of individuals even in the most similar situations and socioeconomic conditions [17,18,19]. Hence, examining travel behavior is an effective way of understanding the quality of changes in a society’s economic, social, and cultural conditions [14,20,21].
The social context of travel behavior may provide valuable insights into modeling, predicting, and managing activity and travel demands [22,23]. As it was said, it can shed more light on the community’s social, cultural, and economic features [24]. Additionally, studying the social context can show opportunities and limitations of individuals’ travel and explain measures that shape their daily activity-travel behavior [23]. Although considerable literature has been established on the social context of travel behavior, such as social interaction and influence [25,26], limited attention has been devoted to urban travel behavior from the lens of sociodemographic features, specifically in cities like Tehran in developing countries.
Considering the remarkable increase in urban population and urban expansion (mainly in sprawl form), the crucial demand to have various forms of mobility, changes in travel tendencies, and interest in Tehran, studying urban travel behavior to identify its needs and challenges is necessary for the Tehran Metropolitan Area. Moreover, there is a lack of proper modes of urban transportation due to some structural, planning, and economic challenges. There have been some efforts over the past decades to provide affordable public transportation infrastructure (e.g., subway and Bus Rapid Transit (BRT)). However, traffic congestion is still a major issue in the city, indicating the limited success of such efforts in addressing the challenges. Further, there have been no adequate considerations and reliable studies on travel behavior opportunities and challenges in the city. Accordingly, to fill this gap, this study seeks to clarify urban travel behavior in the Tehran metropolitan area through three main goals as follows:
  • Assessing priorities and preferences of urban travel behavior among different sociodemographic groups;
  • Identifying major challenges which affect urban travel behavior in Tehran;
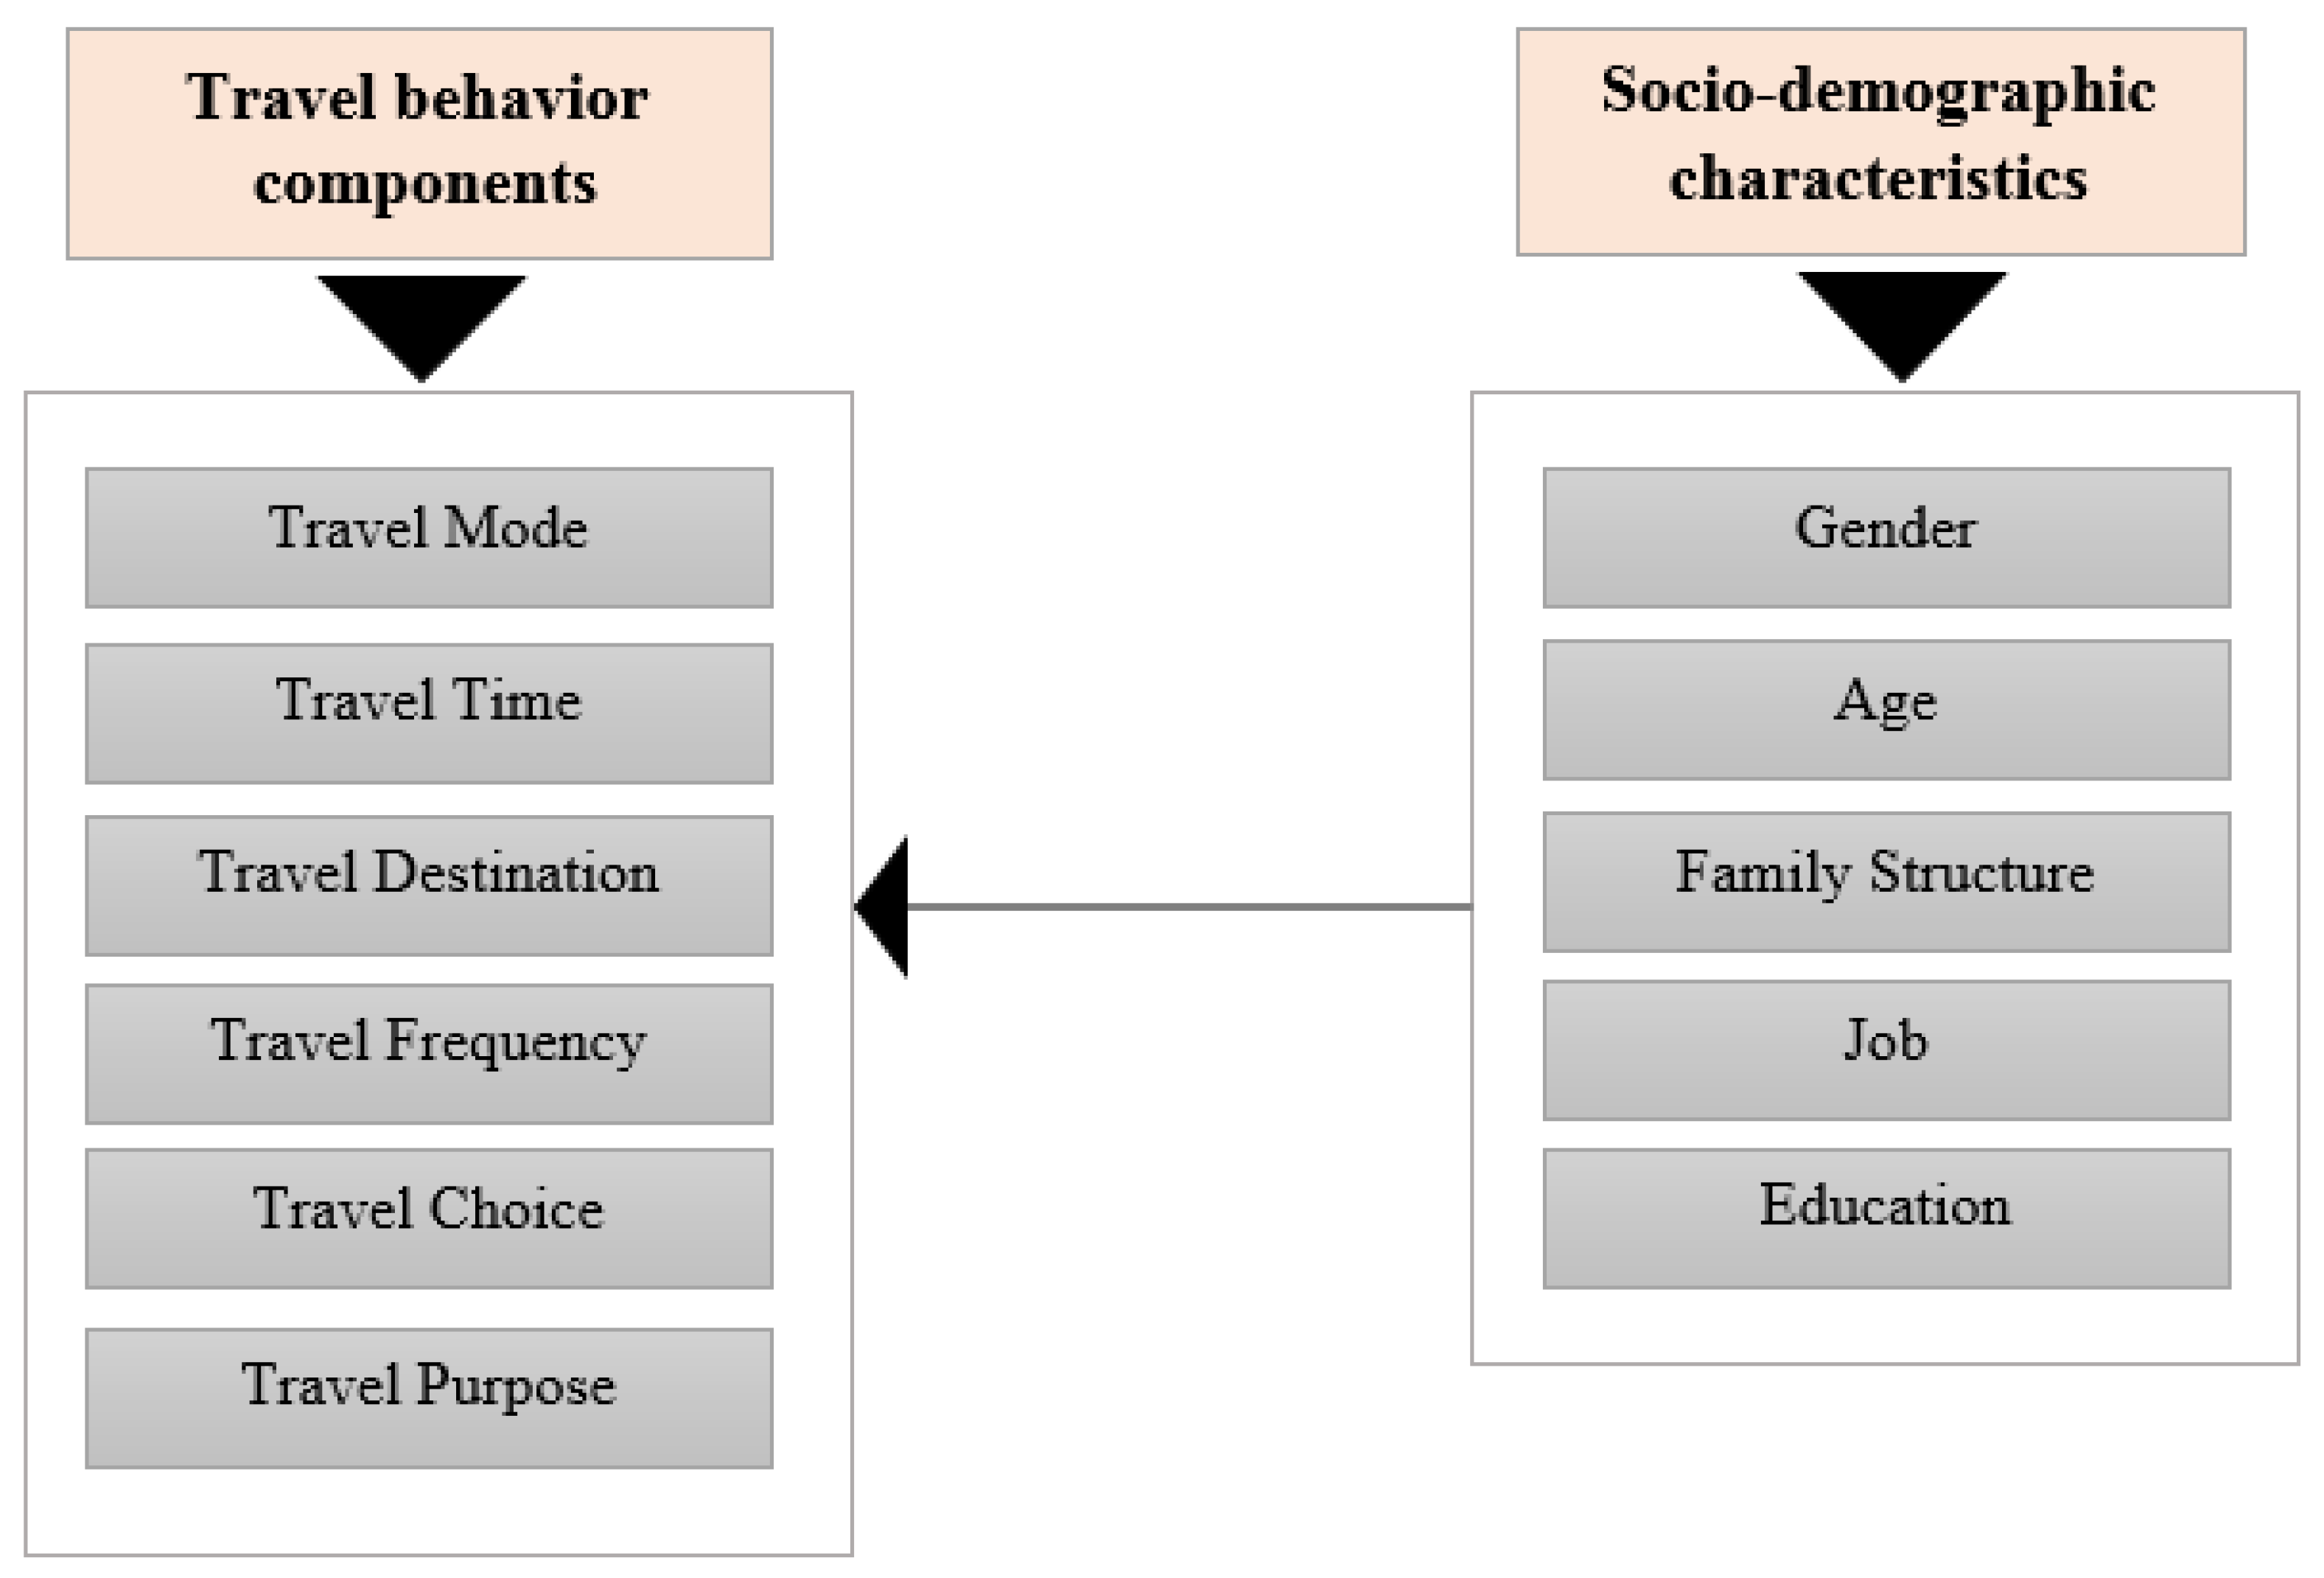
  • Analyzing the impact of the preferences of different sociodemographic groups on the state of Travel Behavior Components (TBCs).
Overall, understanding social tendencies and demands in terms of TBCs can inform planners and urban policymakers of actions that need to be taken to facilitate the transition toward sustainable transportation.

2. Literature Review

The cities of developing countries are known for their rapid growth from both demographic and physical standpoints. This issue causes an increasing demand for sufficient and sustainable resources and infrastructure in these areas. One of the most important infrastructure components that play a vital role in the development and livability of cities is transportation and related facilities [27]. However, urban transportation characteristics in developing cities can be summarized as follows: “(1) weak transport planning and regulatory institutions; (2) inadequate and deteriorating transport infrastructure; (3) poor walking and cycling facilities; (4) declining standards of public transport: (5) growth of an unregulated informal transport sector consisting of minibuses, taxis, and motorcycles; (6) a rising dependency on the use of private cars and; (7) limited travel mode alternatives leading to many residents being transit captives” [28] (p. 2).
These features result in significant changes in citizens’ travel behavior and routines [28,29]. As stated by [29], due to various factors such as the lack of sufficient and diverse transportation modes in developing cities like Bangkok and the inferior quality of public transportation, the tendency for owning and using private mode is very high among citizens. The inability to meet the high demand for various modes of travel, especially public transportation, has led to a growth of an informal system of transportation and an increasing tendency to use motorcycles. This is the case in the cities of Southeast Asia, Latin America, and West and East Africa [28,30]. Evidence from different contexts, such as Malaysia, shows that living in car-dependent cities with high volumes of traffic and pollution has caused many challenges for vulnerable groups such as women and the elderly in terms of travel choice and quality [31].
In terms of other major influencing factors on travel behavior in developing cities, a study in Shiraz, Iran, highlights the impact of lifestyle on the travel behavior of citizens. This study also considers the role of factors such as travel attitude, socioeconomic characteristics of citizens, and objective factors such as land use attributes as influencing factors on travel mode choice [32]. Taking this into account, [33] citizens who live in areas with high density and mixed land use tend to own fewer vehicles, take shorter trips, drive less, and walk more. Urban form factors such as activity location and household residence have significant impacts on traveling mode in developing countries’ cities. In this regard, the tendency to use a private car and reluctance to walk is more prevalent in crowded and big cities than in smaller cities [34].

3. Study Area

Tehran (Figure 1), the capital of Iran, has a population of 8.5 million, and this number reaches 12.5 million people due to the daily commute of people who come from nearby cities such as Karaj, Qom, and Qazvin for education and work [35,36].
Reports indicate 17 million trips are made daily in Tehran, mostly by private cars. In fact, with 80 percent of all vehicles (close to 4 million), private cars are the largest vehicle type in the city [37]. The high reliance on private cars in the city is despite the various efforts taken over the past few decades to expand the public transportation infrastructure in the city. It should, however, be mentioned that investment in sustainable transportation in the city has mainly focused on subway and BRT networks. Unlike trends in many other countries, there has been limited investment in cycling and walking networks that are also essential for promoting sustainable urban transportation.
According to a World Bank report, Tehran is among the most polluted cities in the world. In terms of ambient PM10 levels, Tehran is ranked 12th among 26 megacities around the world, and over 4000 people die from ambient PM2.5 air pollution in Tehran per year. Seventy percent of PM emission originates from transportation, especially outdated vehicles [37]. As stated by the Air Quality Control Company of Tehran Municipality (AQCC), Tehran had 111 unhealthy days in 2015, and it reached 123 days in 2020. In this process, one of the main reasons for this challenge is the worn-out transportation fleet and the tendency toward private transportation [38].
Other modes of transportation in Tehran (public transport, cycling, and smart modes) are marginal compared with the private mode in daily trips in the city. In 2017, Tehran Traffic Organization indicated that the “Tehran bus system gave service to passengers by 240 regular bus and 10 BRT lines” [39] (p. 5). However, the tremendous change in Tehran’s urban transportation has been related to the metro, which started its operation in 1990. It is said that in 2017, about 732 million trips were made by the metro in Tehran [39].

4. Materials and Methods

This study seeks to analyze urban travel behavior in the Tehran metropolitan area. Regarding the research goals, we considered five different sociodemographic characteristics, namely gender, age groups, educational groups, family structure, and occupational groups. These were selected as major characteristics according to the previous studies. Moreover, we assessed six major components that have been frequently analyzed in travel behavior studies (See Figure 2). These components were the travel mode, travel time, travel destination, travel frequency, travel choice, and travel purpose that explain travel behavior status in the cities. To collect data, we used a questionnaire survey. Figure 1 shows an overview of the study variables. To reach the research goals and analyze the obtained data, we used SPSS 26 to assess TBCs priorities, Maxqda to identify urban travel challenges and preferences, and Structural Equation Modeling (SEM) through AMOS software to test the impacts of the preferences of different social groups on TBCs.

4.1. Participants

The participants in this research were selected based on a random sampling method and the sample size was 822 [40]. Given the conditions caused by the COVID-19 pandemic and the nature of the study, an electronic questionnaire survey was used to target the population and collect the data. We tried to find pages and channels of Tehran residents on social media. In this regard, Facebook, Telegram, WhatsApp, and LinkedIn were used as public social media crowdsourcing platforms. The members of the mentioned platforms were urged to answer the questionnaire. The participants were invited to call on more respondents and share the link to the survey. In other words, the snowball sampling method was adopted. After six months, from December 2020 to May 2021, we received 846 responses, of which 822 were completed. Table 1 shows the sociodemographic characteristics of the participants.

4.2. Questionaire

To construct the questionnaire, according to the literature on travel behavior, we selected six major components to analyze travel behavior priorities and tendencies among Tehran citizens. The components have some options (see Table 2) for specifying and evaluating their situations from the lens of sociodemographic characteristics. The questions were about the most usual trip of the participants in light of each travel behavior component. At the end of the questionnaire, we designed two open-ended questions as follows: (1): Please state the reasons for your preference or aversion to each of the travel modes in the city (2): Describe the most important challenges that affect your travel behavior in the city.
The questionnaire was previously validated by five individuals who were experts in urban transportation and transport engineering areas. These were researchers with publications in relevant journals in the area of transportation and travel behavior. To assess the reliability of the questionnaire, we relied on Kaiser-Meyer-Olkin (KMO) and Bartlett’s test as well as Cronbach’s alpha (α) [41]. For this purpose, we did a pilot test from the perspective of 50 participants. Results showed a strong value for the research instrument (0.9 for KMO and Bartlett’s test and 0.91 for Cronbach’s alpha (α)).

5. Results

This section is divided into three subsections. The first subsection is about the tendencies and priorities of the TBCs from the lens of sociodemographic characteristics, and the second one is about identifying the major challenges that affect urban travel behavior and, finally, the impact of such characteristics and differences among different groups on the TBCs in the Tehran metropolitan area.

5.1. Priorities of TBCs from the Lens of SocioDemographic Characteristics

The results of tendencies and priorities of the TBCs options in light of sociodemographic characteristics are shown in the following tables.
According to Table 3, among males (G1), the highest share among travel modes, 40%, belongs to private transportation. The likely reason for the high share of this mode is the limited availability of other options, such as adequate and efficient public transportation. Among females (G2), this share is 38%. The tendency to use walking and cycling is generally low, but higher among females. The likely reason for the low percentage of walking and cycling and also smart travel (i.e., travel with smart vehicles enabled by smart technologies and using clean fuels) is the lack of proper infrastructure and adequate facilities.
As can be seen in Table 4, the preference for smart traveling mode (TM3) among the age groups older than 18 has the highest priority and tendency compared with other travel modes. Smart transportation here refers to using electronic and digital vehicles with clean fuel. This age group prefers using electric and hybrid vehicles. New digital and ICT-based technologies have impacted the lifestyle and desires of this group. Among the age groups between 30–50 years old, the preference for private transportation is high. However, the age group over 50 prefers public transportation. It is likely that senior citizens find public transportation more comfortable and want to avoid traffic congestion.
Considering the results presented in Table 5, the preference for private transportation is the highest among single-parent and nuclear families with 49% and 48%, respectively. The share of public transportation is the highest for solitaries and extended families. In terms of travel frequency (TF), the largest share is daily travel (TF1), and the smallest share is monthly travel (TF4). For solitaries and single-parent families, the main factor influencing their travel choice is cost (TC3), and for nuclear and extended family groups, it is safety (TC2).
According to the results presented in Table 6, among travel modes for job groups, private transportation (TM1) has the largest share of those in the military service. On the other hand, public transportation (TM2) is the choice for both public-service and healthcare-service job groups. In terms of travel choice, comfortability (TC1) is the first choice of either public-service job groups or healthcare-service job groups, while safety is the choice for educational job groups.
Among educational job groups, as presented in Table 7, the tendency to cycle and walk has the smallest share among travel mode options, due to the lack of adequate facilities. This is true for the case of travel time exceeding 3 h (TT4). Among travel choice options, comfortability and safety have received the attention of educational groups more than the other two options, i.e., cost and city travel facilities.

5.2. Identifying Main Reasons for Travel Mode Preference among Gender Groups

In this section, we tried to identify the main reasons involved in travel mode preferences among gender groups. The results are shown in Table 8 and show similarities between males and females.
The results presented in Table 8 revealed that comfortability, more freedom, and quick access to the workplace are the main reasons that explain the preferences for private transportation among gender groups. In Tehran, lacking adequate and proper infrastructure and facilities for public and other modes of transportation and long distances between residences of households and workplaces have led to choosing private travel modes. On the other hand, creating a high volume of traffic and pollution are the reasons for rejecting the private mode of transportation among gender groups.
Important reasons for preferring public transportation by gender groups in Tehran are reducing the volume of traffic and air pollution and supporting sustainability. In this case, some weaknesses and shortcomings—namely, the lack of proper accessibility, worn-out fleet and infrastructure, and crowded travel conditions—are the most important barriers to preferring public transportation for travel.
According to gender groups, the lack of facilities and access to smart infrastructure and vehicles and lack of familiarity with their operation explain a low interest in using smart transportation. However, residents know that smart mode supports sustainability and is effective in reducing energy consumption and not wasting it.
In terms of cycling and walking, being comfortable, being cheap, supporting a healthy and clean urban environment, and ease of movement are the reasons for some gender groups to prefer these modes of travel. However, the lack of proper infrastructure for smart mobility has resulted in limited preferences among gender groups.

5.3. Identifying Major Challenges That Affect Urban Travel Behavior

Using MAXQDA software, we tried to identify major challenges that affect urban travel behavior in Tehran. In this regard, we designed an open-ended question with the following theme: Describe the most important challenges that affect your travel behavior in the city. After assessing responses, we identified four major challenges among the participants’ responses. Table 9 shows these challenges.
Based on Table 9, the first challenge that impacts urban travel behavior is the lack of diverse urban travel options. This challenge was mentioned by 86% of the respondents. In fact, this challenge has caused many barriers to having resilient and sustainable transportation in the Tehran metropolitan area. Relying on one option, especially the private mode, degrades the quality of the environment in the city and leads to traffic congestion. Along with this challenge, there is the challenge of old vehicles and infrastructure, which was mentioned by 81% of the respondents. This problem is seen mostly in old and poor areas of the city, and it threatens the security of travel in the city. This issue is evident in the occurrence of urban accidents and urban transportation vulnerability to disasters. Traffic congestion with 80% was ranked third and is one of the main factors in the spread of pollutants in Tehran. Due to relying on private transportation and lacking proper access to other travel modes, Tehran suffers from severe traffic congestion. Unequal access to travel facilities in the city with 76% was the fourth challenge. In some parts of the city, there is still no fair access, especially to public transport and infrastructure related to walking and cycling. This issue, along with the aged infrastructure disadvantages the residents of old and dilapidated areas of the city.

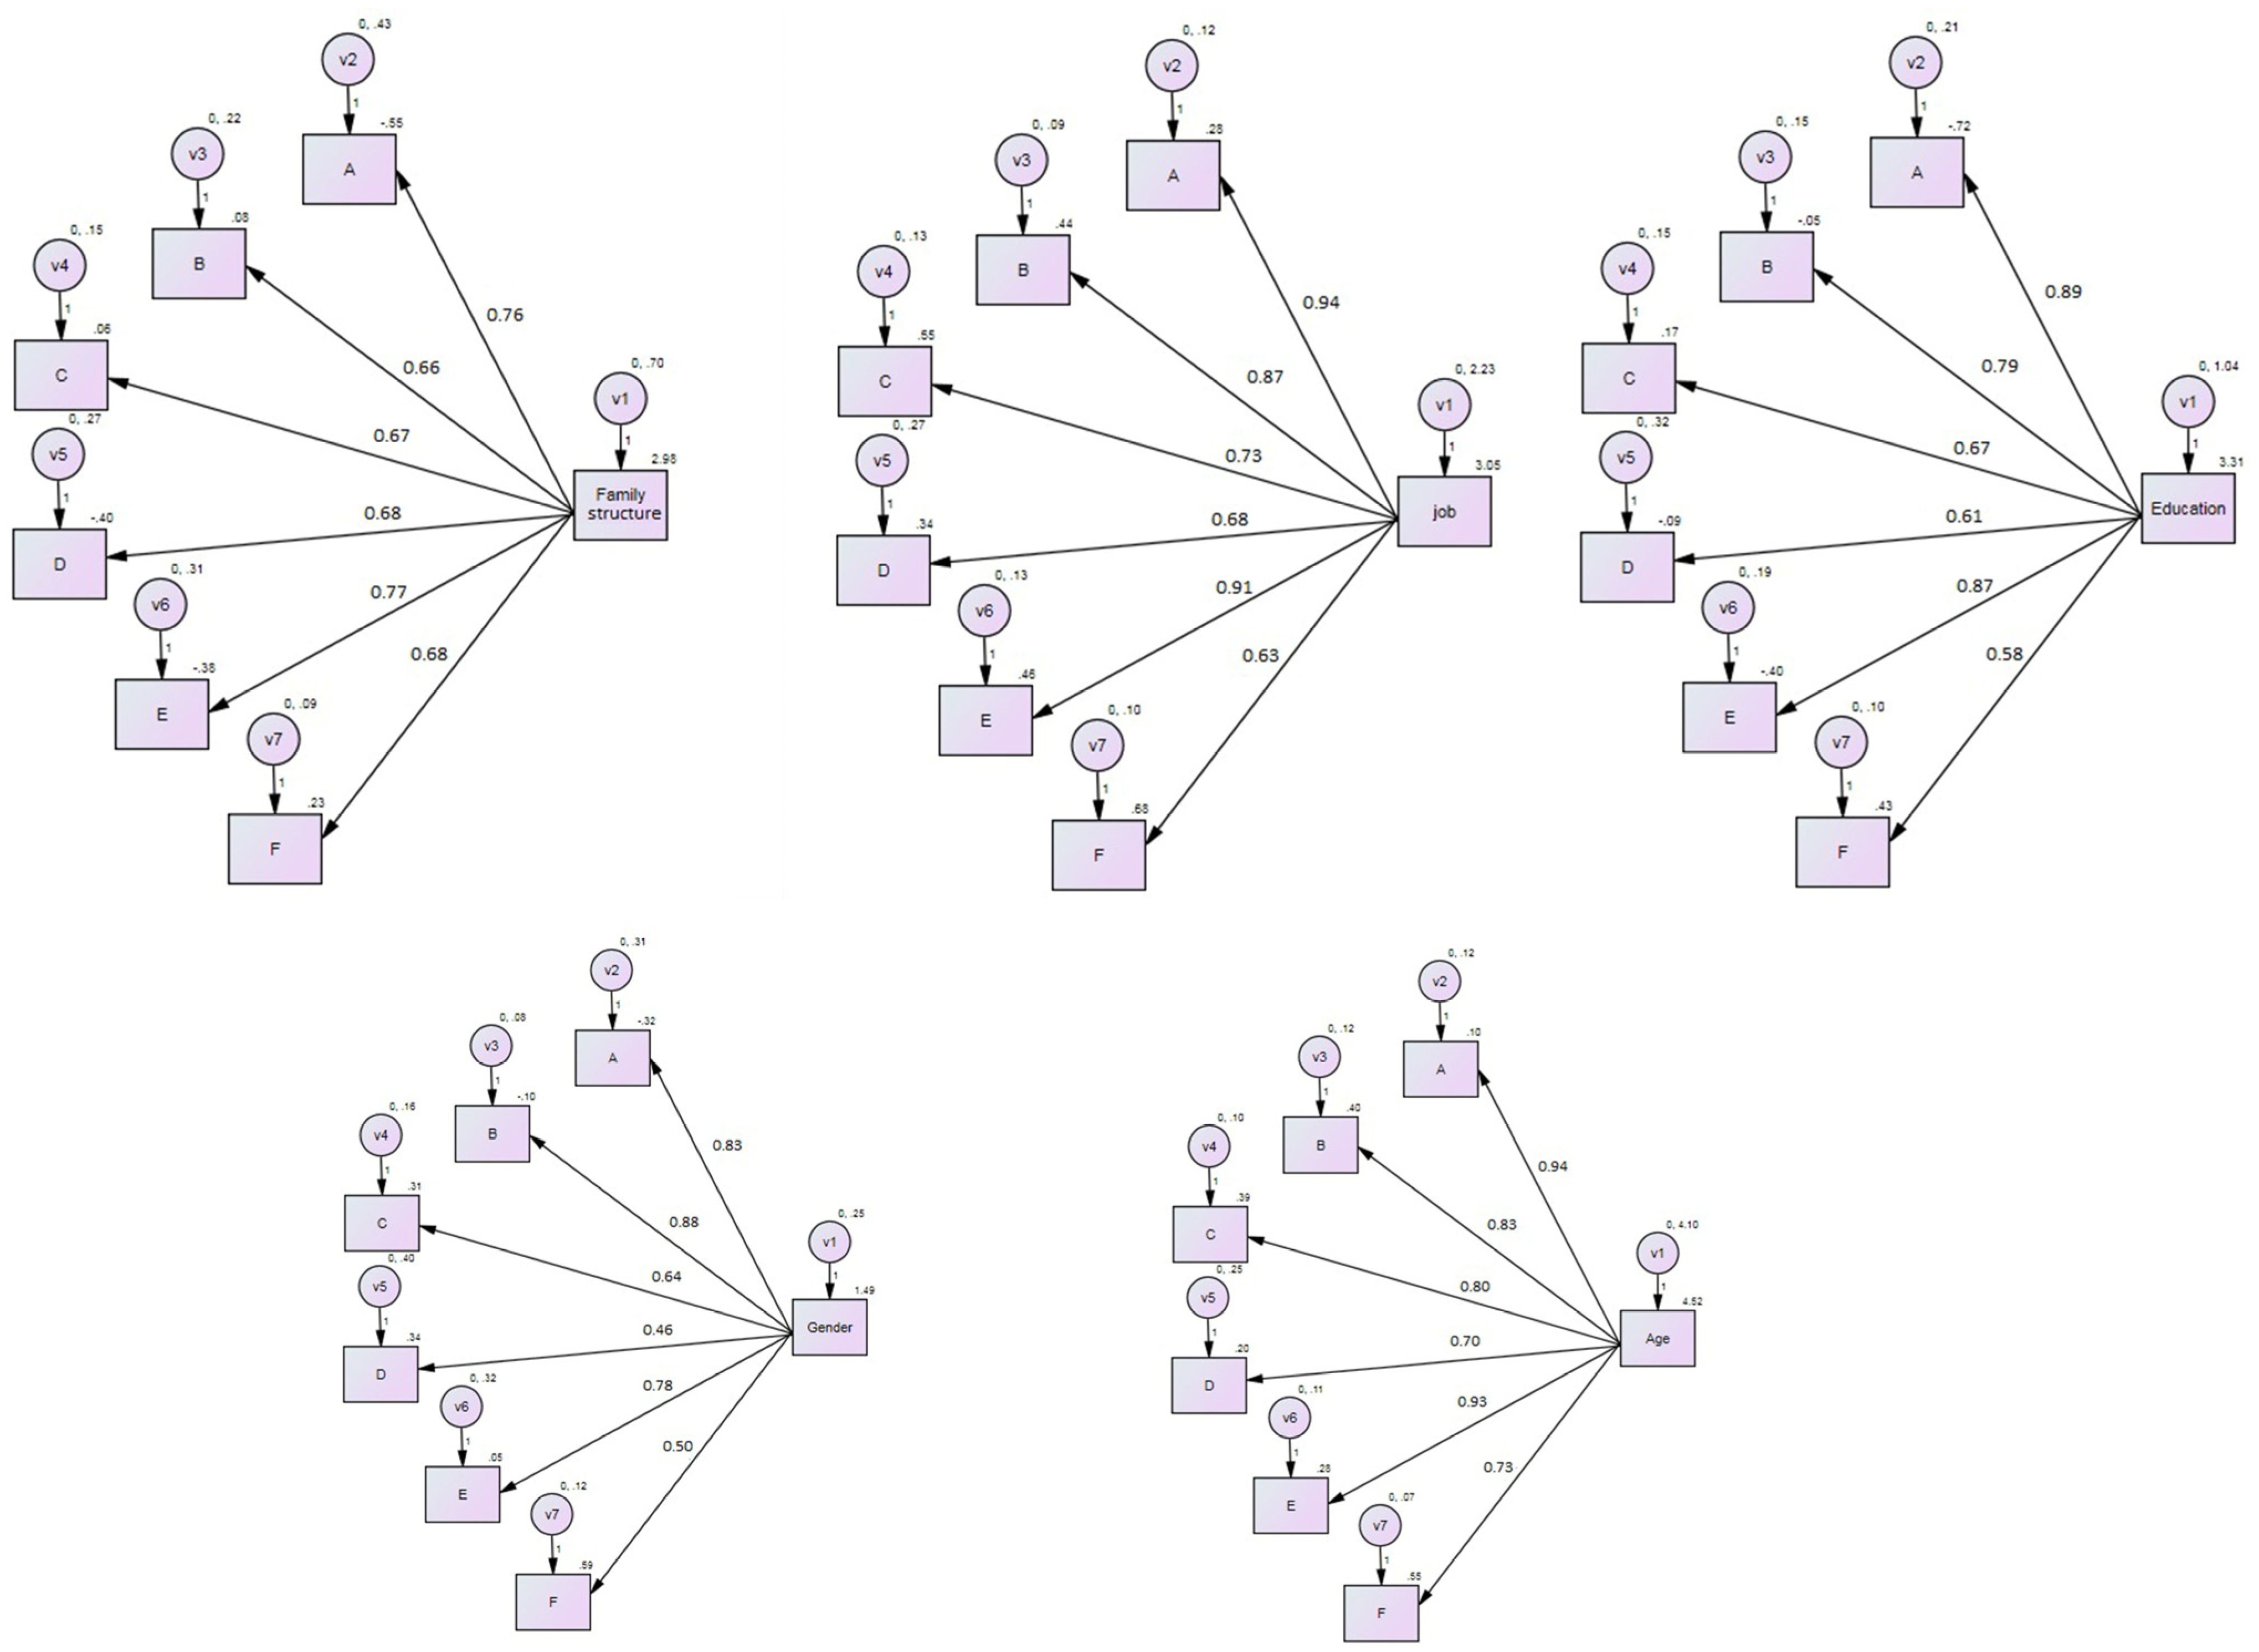
5.4. The Impacts of Preferences of SocioDemographic Groups on the Travel Behavior Components

Here we show how the preferences of different groups influence the TBCs in Tehran. Concerning this purpose, we used SEM via AMOS software and applied a maximum likelihood estimate for estimating the effects of different variables. For testing and ensuring the model’s fitness, at first, we assessed the model’s goodness-of-fit. To this end, we used different goodness-of-fit indexes. Results are shown in Table 10.
According to the results presented in Table 10, at a 99% confidence level, all main indexes show acceptable results, so the model fits. (Bentler & Bonett, 1980; Chiao et al., 2018). The second stage was evaluating the quality and significance of the impacts of independent variables (sociodemographic characteristics) on dependent variables (TBCs). Table 11 provides statistical coefficients that describe the quality of the effects of sociodemographic characteristics on the TBCs.
The results in Table 11 illustrate that all 30 defined paths (see also Figure 3) have a relatively strong and significant impact on the TBCs. These results indicate that the preferences of different groups have a remarkable and positive impact on TBCs’ direction and status. According to the standardized regression weights (β) and the direct effect, all sociodemographic characteristics have over 0.45 effect on TBCs, and among them, the impact of preferences of occupational groups on travel modes (A) with 0.940 β has the highest effect and the lowest impact is for gender age groups with travel frequency (D).

6. Discussion

Travel behavior in developing countries usually experiences high levels of changes due to high levels of transformation in the urban environment [52]. The rapid rates of urbanization in large cities of these countries have caused significant physical and environmental changes [53]. These changes have also led to considerable transformations in transportation systems and urban travel behavior [54].
Increasingly, there has been a growth in car ownership and chronic congestion in urban areas of such countries, which resulted in carbon-intensive transport systems. In Tehran, due to the challenges revealed by this study, such as the lack of access to adequate and proper infrastructure, especially in the public transport sector, worn-out fleet, and the lack of design of the necessary spaces and facilities to use other travel modes such as walking and cycling, which are drivers of achieving sustainability in urban transport, the preference of studied groups in the city is mainly to use private transportation. This trend has caused an increased rate of car ownership and the use of private transportation in the city, which has resulted in traffic congestion, excessive air pollution, and environmental degradation in the city.
Despite the efforts that have been made in the field of developing public transportation, especially the urban metro in Tehran, unequal access, lack of proper attention to sustainability issues, and the rapid growth of the city from both demographic and physical standpoints have made these efforts insignificant. Regarding this, similar to situations in other large cities in Iran, as stated by [32,55], the challenges originated by urban form and urban land use management alongside urban sprawl have emerged as serious obstacles to the realization of travel modes such as public transport and walking and cycling that support sustainability.
Overall, overemphasis on the physical expansion of urban transportation infrastructure has caused challenges and resulted in neglecting other determinative factors that are necessary to reduce inequalities and enhance the social quality of urban travel. Therefore, assessing and considering sociodemographic characteristics as determinative factors in the context of urban travel behavior can bring social qualities back to the fore.

7. Conclusions

7.1. Summary of Findings

Transport-related issues are widely addressed in the literature on urban studies and planning [56]. However, there is a lack of understanding of the underlying factors that determine transport behavior in Tehran. This study sought to shed more light on urban travel behavior in the Tehran metropolitan area. To the best of the authors’ knowledge, this is the first attempt in this regard in the context of Tehran. The findings indicated that in all sociodemographic groups travel by private car is dominant. Moreover, the results revealed that urban travel in the Tehran metropolitan area suffers from old transport system facilities, a lack of diverse options for travel, unequal access to urban travel facilities, and traffic congestion. These challenges have major negative impacts on the travel behavior of the residents in the city and prevent the realization of sustainable travel behavior. Findings give more insight into residents’ preferences for urban travel components. The results can inform planners and policymakers in their efforts to make better plans for sustainable transportation in Tehran.

7.2. Implication for Policymakers

Based on the results, the following major implications for policy and practice can be highlighted. While these are mainly targeting planning and policy making in Tehran, they are of relevance to other cities in developing countries that feature similar characteristics and problems.
  • There is a need for further investment in urban public transportation. In particular, the public transport fleet needs to be renewed, and more efforts should be made to enhance safety and accessibility. This is particularly important in the post-COVID era as the pandemic has raised concerns over the safety of public transportation systems.
  • Investment in smart solutions and technologies and further attention to smart city plans and policies should be prioritized as they can provide effective and efficient solutions for overcoming challenges and promoting sustainable travel behavior. Various forms of smart transport solutions, ranging from vehicle-to-grid systems, vehicle-to-vehicle communication networks, car-sharing platforms, and ride-sourcing services can be promoted in this regard.
  • Pursuing and presenting efficient plans and policies to prevent urban sprawl and consequently car ownership by facilitating and encouraging planned and sustainable growth and development of infrastructure based on public and green transportation (cycling and walking).

7.3. Research Limitation

Overall, the study analyzed urban travel behavior in the Tehran metropolitan area via six major components from the lens of five different sociodemographic characteristics. While the findings are useful, the study may have some limitations. First, due to using the questionnaire survey, we had some difficulties in terms of reaching participants and encouraging them to participate in the survey. Second, although we tried to analyze urban travel behavior from the lens of various components and different sociodemographic characteristics, it is acknowledged that these components and characteristics may not be exhaustive. Therefore, future studies should endeavor to take a more comprehensive approach by including other potentially influential components and characteristics.

Author Contributions

Conceptualization, H.A. and A.S.; methodology, H.A. and A.S.; software, H.A.; validation, H.A.; formal analysis, H.A.; data curation, H.A; writing—original draft preparation, H.A. and A.S.; writing—review and editing, H.A. and A.S; supervision, A.S. All authors have read and agreed to the published version of the manuscript.

Funding

This research received no external funding.

Institutional Review Board Statement

Not applicable.

Informed Consent Statement

Not applicable.

Data Availability Statement

The data presented in this study are available on request from the corresponding author.

Conflicts of Interest

The authors declare no conflict of interest.

References

  1. Alizadeh, H.; Sharifi, A. Assessing Resilience of Urban Critical Infrastructure Networks: A Case Study of Ahvaz, Iran. Sustainability 2020, 12, 3691. [Google Scholar] [CrossRef]
  2. Sharifi, A. Co-benefits and synergies between urban climate change mitigation and adaptation measures: A literature review. Sci. Total. Environ. 2020, 750, 141642. [Google Scholar] [CrossRef] [PubMed]
  3. Mahmoudi, R.; Shetab-Boushehri, S.-N.; Hejazi, S.R.; Emrouznejad, A. Determining the relative importance of sustainability evaluation criteria of urban transportation network. Sustain. Cities Soc. 2019, 47, 101493. [Google Scholar] [CrossRef]
  4. Wey, W.-M.; Huang, J.-Y. Urban sustainable transportation planning strategies for livable City’s quality of life. Habitat. Int. 2018, 82, 9–27. [Google Scholar] [CrossRef]
  5. Yang, L.; Wang, Y.; Han, S.; Liu, Y. Urban transport carbon dioxide (CO2) emissions by commuters in rapidly developing Cities: The comparative study of Beijing and Xi’an in China. Transp. Res. D Transp. Environ. 2019, 68, 65–83. [Google Scholar] [CrossRef]
  6. Senecal, P.; Leach, F. Diversity in transportation: Why a mix of propulsion technologies is the way forward for the future fleet. Results Eng. 2019, 4, 100060. [Google Scholar] [CrossRef]
  7. Aljoufie, M. The Impact Assessment of Increasing Population Density on Jeddah Road Transportation Using Spatial-Temporal Analysis. Sustainability 2021, 13, 1455. [Google Scholar] [CrossRef]
  8. Gwilliam, K. Urban transport in developing countries. Transp. Rev. 2003, 23, 197–216. [Google Scholar] [CrossRef]
  9. Wang, C.; Hess, D.B. Role of Urban Big Data in Travel Behavior Research. Transp. Res. Rec. J. Transp. Res. Board 2020, 2675, 222–233. [Google Scholar] [CrossRef]
  10. Kitamura, R. Life-style and travel demand. Transportation 2009, 36, 679–710. [Google Scholar] [CrossRef]
  11. Feng, J. The influence of built environment on travel behavior of the elderly in urban China. Transp. Res. Part D Transp. Environ. 2017, 52, 619–633. [Google Scholar] [CrossRef]
  12. Yao, M.; Wang, D. Mobility and travel behavior in urban China: The role of institutional factors. Transp. Policy 2018, 69, 122–131. [Google Scholar] [CrossRef]
  13. Kamruzzaman, M.; Shatu, F.; Habib, K.N. Travel behavior in Brisbane: Trends, saturation, patterns and changes. Transp. Res. A Policy. Pract. 2020, 140, 231–250. [Google Scholar] [CrossRef]
  14. Wang, D.; Zhou, M. The built environment and travel behavior in urban China: A literature review. Transp. Res. Part D Transp. Environ. 2017, 52, 574–585. [Google Scholar] [CrossRef]
  15. Senikidou, N.; Basbas, S.; Georgiadis, G.; Campisi, T. The Role of Personal Identity Attributes in Transport Mode Choice: The Case Study of Thessaloniki, Greece. Soc. Sci. 2022, 11, 564. [Google Scholar] [CrossRef]
  16. Murtagh, N.; Gatersleben, B.; Uzzell, D. Multiple identities and travel mode choice for regular journeys. Transp. Res. Part F Traffic Psychol. Behav. 2012, 15, 514–524. [Google Scholar] [CrossRef]
  17. Heinen, E. Identity and travel behaviour: A cross-sectional study on commute mode choice and intention to change. Transp. Res. Part F Traffic Psychol. Behav. 2016, 43, 238–253. [Google Scholar] [CrossRef]
  18. Van der Werff, E.; Steg, L.; Keizer, K. I am what I am, by looking past the present: The influence of biospheric values and past behavior on environmental self-identity. Environ. Behav. 2014, 46, 626–687. [Google Scholar] [CrossRef]
  19. Mannetti, L.; Pierro, A.; Livi, S. Recycling: Planned and self-expressive behaviour. J. Environ. Psychol. 2004, 24, 227–236. [Google Scholar] [CrossRef]
  20. Scheiner, J.; Holz-Rau, C. Changes in travel mode use after residential relocation: A contribution to mobility biographies. Transportation 2012, 40, 431–458. [Google Scholar] [CrossRef]
  21. Poku-Boansi, M. Contextualizing urban growth, urbanization and travel behavior in Ghanaian cities. Cities 2021, 110, 103083. [Google Scholar] [CrossRef]
  22. Guo, J.Y.; Chen, C. The built environment and travel behavior: Making the connection. Transportation 2007, 34, 529–533. [Google Scholar] [CrossRef]
  23. Lin, T.; Wang, D.; Zhou, M. Residential relocation and changes in travel behavior: What is the role of social context change? Transp. Res. A. Policy. Pr. 2018, 111, 360–374. [Google Scholar] [CrossRef]
  24. Ettema, D.; Gärling, T.; Olsson, L.E.; Friman, M. Out-of-home activities, daily travel, and subjective well-being. Transp. Res. A. Policy. Pr. 2010, 44, 723–732. [Google Scholar] [CrossRef]
  25. Paez, A.; Scott, D.M. Social Influence on Travel Behavior: A Simulation Example of the Decision to Telecommute. Environ. Plan. A Econ. Space 2007, 39, 647–665. [Google Scholar] [CrossRef]
  26. Arentze, T.; Timmermans, H. Social networks, social interactions, and activity-travel behavior: A framework for microsimulation. Environ. Plann. B. Plann. Des 2008, 35, 1012–1027. [Google Scholar] [CrossRef]
  27. Bassolas, A.; Barbosa-Filho, H.; Dickinson, B.; Dotiwalla, X.; Eastham, P.; Gallotti, R.; Ghoshal, G.; Gipson, B.; Hazarie, S.A.; Kautz, H.; et al. Hierarchical organization of urban mobility and its connection with city livability. Nat. Commun. 2019, 10, 4817. [Google Scholar] [CrossRef]
  28. Mwale, M.; Luke, R.; Pisa, N. Factors that affect travel behavior in developing cities: A methodological review. Transp. Res. Interdiscip. Perspect 2022, 16, 100683. [Google Scholar]
  29. Dissanayake, D.; Morikawa, T. Household Travel Behavior in Developing Countries: Nested Logit Model of Vehicle Ownership, Mode Choice, and Trip Chaining. Transp. Res. Rec. J. Transp. Res. Board 2002, 1805, 45–52. [Google Scholar] [CrossRef]
  30. Lisinge, R.T.; van Dijk, M.P. Regional transport infrastructure programmes in Africa: What factors influence their performance? Can. J. Afr. Stud. 2022, 56, 99–121. [Google Scholar] [CrossRef]
  31. Noor, N.F.M.; Kadir Shahar, H.; Hamid, T.A.; Zainalaludin, Z.; Ahmad, S.A.; Rokhani, F.Z.; Akahbar, S.A.N. Understanding Travel Behavior and Sustainability of Current Transportation System for Older Adults in Malaysia: A Scoping Review. Sustainability 2022, 14, 14140. [Google Scholar] [CrossRef]
  32. Etminani-Ghasrodashti, R.; Ardeshiri, M. Modeling travel behavior by the structural relationships between lifestyle, built environment and non-working trips. Transp. Res. Part A Policy Pr. 2015, 78, 506–518. [Google Scholar] [CrossRef]
  33. Ma, J.; Mitchell, G.; Heppenstall, A. Daily travel behaviour in Beijing, China: An analysis of workers’ trip chains, and the role of socio-demographics and urban form. Habitat Int. 2014, 43, 263–273. [Google Scholar] [CrossRef]
  34. Mendiate, C.J.; Nkurunziza, A.; Machanguana, C.A.; Bernardo, R. Pedestrian travel behavior and urban form: Comparing two small Mozambican cities. J. Transp. Geogr. 2022, 98, 103245. [Google Scholar] [CrossRef]
  35. Hosseini, V.; Shahbazi, H. Urban Air Pollution in Iran. Iran. Stud. 2016, 49, 1029–1046. [Google Scholar] [CrossRef]
  36. Bayat, R.; Ashrafi, K.; Motlagh, M.S.; Hassanvand, M.S.; Daroudi, R.; Fink, G.; Künzli, N. Health impact and related cost of ambient air pollution in Tehran. Environ. Res. 2019, 176, 108547. [Google Scholar] [CrossRef] [PubMed]
  37. Heger, M.; Sarraf, M. Air Pollution in Tehran: Health Costs, Sources, and Policies; Environment and Natural Resources Global Practice Discussion Paper; World Bank: Washington, DC, USA, 2018; Volume 6, Available online: https://openknowledge.worldbank.org/handle/10986/29909 (accessed on 18 April 2018).
  38. Air Quality Control Company (ACCC). Tehran Annual Air Quality Report. 2022. Available online: http://air.tehran.ir (accessed on 20 May 2022).
  39. Mojtehedzadeh, M. Assessment of Urban Transport System in Tehran. Suti Report; United Nation Economic and Social Commission for Asia and Pacific (ESCAP): Bangkok, Thailand, 2019; Available online: https://www.unescap.org/sites/default/files/Tehran.pdf (accessed on 17 July 2019).
  40. Meng, Z.; Zhang, D.; Li, G.; Yu, B. An importance learning method for non-probabilistic reliability analysis and optimization. Struct. Multidiscip. Optim. 2018, 59, 1255–1271. [Google Scholar] [CrossRef]
  41. Field, A. Discovering Statistics Using SPSS: Introducing Statistical Method, 3rd ed.; Sage: Thousand Oaks, CA, USA, 2009. [Google Scholar]
  42. De Vos, J. Do people travel with their preferred travel mode? Analyzing the extent of travel mode dissonance and its effect on travel satisfaction. Transp. Res. A Policy. Pr. 2018, 117, 261–274. [Google Scholar] [CrossRef]
  43. Chapleau, R.; Gaudette, P.; Spurr, T. Application of machine learning to two large-sample household travel surveys: A characterization of travel modes. Transp. Res. Rec. 2019, 2673, 173–183. [Google Scholar] [CrossRef]
  44. Li, T.; Chen, P.; Tian, Y. Personalized incentive-based peak avoidance and drivers’ travel time-savings. Trans. Policy 2021, 100, 68–80. [Google Scholar] [CrossRef]
  45. Muller, T.H.; Furth, P.G. Trip time analyzers: Key to transit service quality. Transp. Res. Rec. 2001, 1760, 10–19. [Google Scholar] [CrossRef]
  46. Lam, T.; Hsu, C.H. Predicting behavioral intention of choosing a travel destination. Tour. Manag. 2006, 27, 589–599. [Google Scholar] [CrossRef]
  47. Qiu, R.T.; Masiero, L.; Li, G. The psychological process of travel destination choice. J. Travel. Tour. Mark 2018, 35, 691–705. [Google Scholar] [CrossRef]
  48. Dehman, A.; Brijs, T.; Drakopoulos, A. Replication of Daily and Monthly Freeway Demand Variations for Travel Time Reliability Procedures. Transp. Res. Rec. 2020, 2674, 727–741. [Google Scholar] [CrossRef]
  49. Yang, W.; Chen, H.; Wang, W. The path and time efficiency of residents’ trips of different purposes with different travel modes: An empirical study in Guangzhou, China. J. Transp. Geogr. 2020, 88, 102829. [Google Scholar] [CrossRef]
  50. Dėdelė, A.; Miškinytė, A.; Andrušaitytė, S.; Nemaniūtė-Gužienė, J. Dependence between travel distance, individual socioeconomic and health-related characteristics, and the choice of the travel mode: A cross-sectional study for Kaunas, Lithuania. J. Transp. Geogr. 2020, 86, 102762. [Google Scholar] [CrossRef]
  51. Du, M.; Cheng, L.; Li, X.; Yang, J. Factors affecting the travel mode choice of the urban elderly in healthcare activity: Comparison between core area and suburban area. Sustain. Cities Soc. 2020, 52, 101868. [Google Scholar] [CrossRef]
  52. Pojani, D.; Stead, D. Sustainable Urban Transport in the Developing World: Beyond Megacities. Sustainability 2015, 7, 7784–7805. [Google Scholar] [CrossRef]
  53. Cohen, B. Urbanization in developing countries: Current trends, future projections, and key challenges for sustainability. Technol. Soc. 2006, 28, 63–80. [Google Scholar] [CrossRef]
  54. Srinivasan, S.; Guan, C.; Nielsen, C.P. Built environment, income and travel behavior: Change in the city of Chengdu, China 2005–2016. Int. J. Sustain. Transp. 2019, 14, 749–760. [Google Scholar] [CrossRef]
  55. Salavati, A.; Haghshenas, H.; Ghadirifaraz, B.; Laghaei, J.; Eftekhari, G. Applying AHP and clustering approaches for public transportation decisionmaking: A case study of Isfahan city. J. Public Transp. 2016, 19, 3. [Google Scholar] [CrossRef]
  56. Sharifi, A.; Khavarian-Garmsir, A.R.; Allam, Z.; Asadzadeh, A. Progress and prospects in planning: A bibliometric review of literature in Urban Studies and Regional and Urban Planning, 1956–2022. Prog. Plan. 2023, 167, 100740. [Google Scholar] [CrossRef]
Figure 1. Geographical location of Tehran.
Futuretransp 03 00014 g001
Figure 2. Conceptual models of the study variables.
Futuretransp 03 00014 g002
Figure 3. Structural results for the impacts of sociodemographic characteristics on TBCs.
Futuretransp 03 00014 g003
Table 1. Socio-demographic characteristics of the participants.
FeatureIndexDescriptionN%
Gender G 1 Male42351%
G 2 Female39949%
Age A 1 18–19 9912%
A 2 20–3022227%
A 3 31–4024229%
A 5 41–5018122%
A 6 Over 507809%
Family Structure 1 F 1 Solitaries7009%
F 2 Single parent8911%
F 3 Nuclear family62876%
F 4 Extended family3504%
Job J 1 Educational/Academic19924%
J 2 Official17621%
J 3 Industrial7509%
J 4 Public services25231%
J 5 Healthcare services9411%
J 6 Military2603%
Education E 1 Diploma6708%
E 2 * Post-diploma5807%
E 3 Bachelor’s Degree25631%
E 4 Master’s Degree34542%
E 5 PhD9612%
* Note: In Iran’s education system, holders of post-diploma degrees are those who have spent two years at a university. 1 In the family structure classification, solitaries are those who live alone. A single parent is a person who lives with a child or children and who does not have a spouse or a live-in partner. A nuclear family is a family group consisting of parents and their children (one or more). An extended family is a family that extends beyond the nuclear family, consisting of parents like the father, mother, and their children, aunts, uncles, grandparents, and cousins, all living in the same household.
Table 2. Questionnaire containing components of travel behavior.
TBCsQuestionsIndexOptionsReference
Travel ModeWhich one of the following travel modes do you prefer? T M 1 Private transportation[42,43,44,45,46,47,48,49,50,51]
T M 2 Public transportation
T M 3 Smart transportation
T M 4 Walking and cycling
Travel TimeHow long does your trip usually take? T T 1 Less than 1 h
T T 2 1 to 2 h
T T 3 2 to 3 h
T T 4 More than 3 h
Travel DestinationWhere is your usual travel destination? T D 1 In the city
T D 2 Suburbs
T D 3 Other cities
Travel FrequencyHow often do you travel? T F 1 Daily
T F 2 Weekly
T F 3 More than a week
T F 4 Monthly
Travel Choice What factors play the main role in your travel mode choice? T C 1 Comfortability
T C 2 Safety
T C 3 Cost
T C 4 City travel facilities
Travel PurposeWhat is the purpose of your travel? T P 1 Work
T P 2 Recreation
Table 3. Priorities of TBCs from the lens of gender groups.
OptionsMaleFemale
TM140%38%
TM229%30%
TM320%14%
TM411%24%
TT169%31%
TT227%65%
TT32%3%
TT42%1%
TD169%54%
TD221%29%
TD310%17%
TF178%80%
TF211%13%
TF37%6%
TF44%1%
TC130%20%
TC230%32%
TC323%32%
TC417%16%
TP179%81%
TP221%19%
Table 4. Priorities of TBCs from the lens of age groups.
OptionsOlder Than 1820–3031–4041–50Over 50
TM138%42%41%40%33%
TM239%35%33%32%10%
TM313%12%17%18%40%
TM410%11%9%10%17%
TT150%49%54%63%82%
TT230%34%26%27%12%
TT316%13%16%5%7%
TT44%4%4%5%3%
TD150%49%54%70%82%
TD230%34%26%15%12%
TD316%13%16%10%7%
TF181%79%80%83%88%
TF212%12%10%10%7%
TF35%7%7%6%3%
TF42%2%3%1%2%
TC128%27%29%24%35%
TC231%30%30%32%27%
TC331%28%29%29%18%
TC410%15%12%15%20%
TP173%74%86%80%78%
TP227%26%14%20%22%
Table 5. Priorities of TBCs from the lens of family structure groups.
OptionSolitariesSingle ParentNuclear FamilyExtended Family
TM130%48%49%24%
TM234%23%21%43%
TM326%11%13%20%
TM410%18%17%13%
TT143%46%58%61%
TT247%47%36%34%
TT37%5%5%4%
TT43%2%1%1%
td168%67%76%78%
td227%28%32%29%
td35%5%2%3%
TF168%69%71%70%
TF224%24%20%19%
TF37%6%8%8%
TF42%2%1%3%
TC117%15%31%30%
TC234%35%34%35%
TC336%35%20%21%
TC413%15%15%14%
TP186%87%83%79%
TP214%13%17%21%
Table 6. Priorities of TBCs from the lens of job groups.
OptionEducationalOfficialIndustrialPublic ServicesHealth ServicesMilitary
TM130%34%38%43%48%75%
TM226%22%28%35%43%25%
TM322%19%30%14%5%0
TM422%25%6%7%5%0
TT143%18%12%45%41%25%
TT235%40%41%35%37%50%
TT313%23%27%14%18%25%
TT49%19%20%6%4%0
TD165%57%56%78%76%58%
TD235%34%37%19%10%0
TD309%7%3%14%42%
TF170%62%89%87%68%75%
TF217%19%6%9%16%25%
TF39%11%4%4%12%0
TF44%7%2%04%0
TC122%22%21%42%48%25%
TC270%34%43%36%24%50%
TC34%35%28%15%22%25%
TC44%9%8%7%6%0
TP183%82%87%87%89%75%
TP217%18%13%13%11%25%
Table 7. Priorities of TBCs from the lens of educational groups.
DiplomaPost-DiplomaBachelorMasterPhD
TM144%43%45%42%48%
TM233%28%34%33%28%
TM315%18%10%15%14%
TM48%11%11%10%10%
TT151%54%52%48%41%
TT223%26%31%45%32%
TT318%14%12%5%18%
TT48%6%4%3%9%
TD167%70%69%78%68%
TD215%09/%8%13%23%
TD318%22%23%10%9%
TF164%58%57%73%45%
TF226%26%28%20%41%
TF38%7%7%3%9%
TF43%10%9%5%5%
TC133%36%30%33%32%
TC236%41%39%35%41%
TC323%16%28%23%18%
TC48%7%4%10%9%
TP186%86%85%80%68%
TP214%14%15%20%32%
Table 8. Travel mode preferences between males and females in the Tehran metropolitan area.
Travel ModeFemaleMale
I Prefer It Because ofARF *I Do Not Prefer It Because ofARFI Prefer It Because ofARFI Do Not Prefer It Because ofARF
Private transportationBeing comfortable
More freedom
Quick access to the workplace
87%Creating traffic congestion
Creating air pollution
88%Being comfortable
Freedom of action
Quick access to the workplace
88%Creating traffic congestion
Creating air pollution
80%
Public transportationReducing urban traffic
Reducing pollutant emission
More security
Supporting sustainability
88%Lacking proper accessibility
Old vehicles and infrastructure
Crowded travel conditions
87%Low cost
Reducing urban traffic
Reducing pollutant emissions
Supporting sustainability
85%Lacking proper accessibility
Old vehicles and infrastructure
Crowded travel conditions
83%
Smart transportationLow energy consumption
Being up to date
Moving toward sustainability
Supporting clean environment
90%Lacking access to proper infrastructure
Not familiar with how to use
Lacking awareness of being safe
86%Being up to date
Speed in movement
Low energy consumption
81%Lacking access to proper infrastructure
Not familiar with how to use
Lacking awareness of being safe
80%
Walking and CyclingBeing comfortable
Being cheap
Supporting healthy and clean urban environment
Ease of movement
91%Lacking access to proper infrastructure and spaces
Low security due to congestion and high traffic in the city
93%Being comfortable
Being cheap
Supporting healthy and clean urban environment
Ease of movement
Considered a daily sport
96%Lacking proper access to its infrastructure and spaces
Low security due to congestion and high traffic in the city
95%
Note: ARF: Average of Relative Frequency. ARF * means Average of Relative Frequency
Table 9. Challenges affecting urban travel behavior in the Tehran metropolitan area.
ChallengeNumber of Responses Containing the ChallengesPercent
1Lacking diverse options for urban travel70786%
2Old vehicles and infrastructure66681%
3Traffic congestion65780%
4Unequal access to travel facilities in city areas 62576%
Table 10. The results of model goodness-of-fit indexes.
IndexAcceptable ThresholdResult
x 2 /df2 ≤ x 2 /df ≤ 32.43
Goodness-of-Fit Index (GFI)>0.90.9
Adjusted Goodness-of-Fit Index (AGFI)>0.90.9
Normed Fit Index (NFI)>0.90.91
Comparative Fit Index (CFI)>0.90.91
Root Mean Square Error of Approximation (RMSEA)0.05 ≤ RMSEA ≤ 0.080.0701
Table 11. The results of testing the impacts of sociodemographic characteristics on TBCs in the structural equation modeling.
Standardized Regression Weights (β)S.E.C.R.Direct EffectIndirect EffectTotal Effectp-Value
Gender A0.8380.05730.1050.838-0.8380.000
Gender B0.8870.02937.6590.887-0.8870.000
Gender C0.6490.04116.6980.649-0.6490.000
Gender D0.4660.06410.2990.466-0.4660.000
Gender E0.7810.05724.4530.781-0.7810.000
Gender F0.5060.03511.4830.506-0.5060.000
Age A0.8380.00955.0460.942-0.9420.000
Age B0.8870.00929.0770.830-0.8300.000
Age C0.6490.00826.3480.803-0.8030.000
Age D0.4660.01319.6350.708-0.7080.000
Age E0.7810.00850.3430.932-0.9320.000
Age F0.5060.00720.9170.730-0.7300.000
Family structure A0.7660.04023.3030.766-0.7660.000
Family structure B0.6630.02917.3300.663-0.6630.000
Family structure C0.6740.02417.8370.674-0.6740.000
Family structure D0.6820.03218.2280.682-0.6820.000
Family structure E0.7710.03425.0280.771-0.7710.000
Family structure F0.6820.01818.2620.682-0.6820.000
Job A0.9400.01253.9840.940-0.9400.000
Job B0.8760.01035.5340.876-0.8760.000
Job C0.7330.01221.0610.733-0.7330.000
Job D0.6820.01818.2360.682-0.6820.000
Job E0.9170.01244.9790.917-0.9170.000
Job F0.6360.01116.1130.636-0.6360.000
Education A0.8930.02338.8680.893-0.8930.000
Education B0.7900.01925.1880.790-0.7900.000
Education C0.6760.02017.9600.676-0.6760.000
Education D0.6140.02815.2270.614-0.6140.000
Education E0.8710.02234.7340.871-0.8710.000
Education F0.5890.01614.2470.589-0.5890.000
Note: p: < 0.001; S.E. Standardized Error; C.R.: Critical Ratio, A: travel mode; B: travel time; C: travel destination; D: travel frequency; E: travel choice; F: travel purpose.
Disclaimer/Publisher’s Note: The statements, opinions and data contained in all publications are solely those of the individual author(s) and contributor(s) and not of MDPI and/or the editor(s). MDPI and/or the editor(s) disclaim responsibility for any injury to people or property resulting from any ideas, methods, instructions or products referred to in the content.

