Article

Assessment of the Impact of Advertising in Promoting Sustainable Mobility and Multimodality in the Urban Transport System

by
Margarita Išoraitė
1,
Aldona Jarašūnienė
2,* and
Kristina Samašonok
1
1
Faculty of Business Management, University of Applied Sciences, Didlaukio 49, LT-08303 Vilnius, Lithuania
2
Faculty of Transport Engineering, Vilnius Gediminas Technical University, Plytinės Str. 27, LT-10105 Vilnius, Lithuania
*
Author to whom correspondence should be addressed.
Future Transp. 2023, 3(1), 210-235; https://doi.org/10.3390/futuretransp3010013
Submission received: 9 December 2022 / Revised: 12 January 2023 / Accepted: 17 January 2023 / Published: 6 February 2023

Abstract

:
Advertising can influence and change consumers’ attitudes, habits, and behaviour and can therefore be a way to promote sustainable mobility and multimodality in urban transport systems. This paper focuses on the following questions: what is the impact of advertising on consumer behaviour in the context of sustainable mobility and multimodal decision making in urban transport systems? This paper assesses the impact of advertising on consumer behaviour in the context of the scientific literature, and discusses the methods and effectiveness of advertising in promoting sustainable mobility and multimodality in urban transport systems. Thus, this study examines the role of advertising and its impact on consumer behaviour, and provides a framework for the use of advertising to promote sustainable mobility and multimodality in urban transport systems. The study involved 396 inhabitants of major Lithuanian cities. Analytical descriptive, quantitative, and statistical research methods were applied. A quantitative research strategy was used to better understand the expression of advertising and its impact on the development of sustainable mobility and multimodality in urban transport. The results show that advertisements promoting sustainable mobility do not have a significant impact and only a small proportion of respondents associate advertisements with the development of sustainable mobility and multimodality in urban transport. This provides an opportunity to improve the information system of advertisements by exploiting the originality, text, content, and idea of the advertisement, which the study found to be one of the most influential factors in changing consumers’ attitudes and encouraging them to make travel decisions based on the principles of sustainable mobility and multimodality. In addition, television, the internet (including e-mail advertising), radio, and outdoor billboards can be among the most effective means of providing information in anticipation of the development of sustainable mobility and multimodality in urban transport. The results of the study will therefore have long-term value for the scientific debate on the impact of advertising on the promotion of sustainable mobility and multimodality in urban transport, and a practical relevance for providing guidelines for the development of sustainable mobility and multimodality in urban transport in the information advertising system.

1. Introduction

Today’s society is unimaginable without rapidly developing transport services [1]. Every year, the increasing number of cars, not only in Lithuania but also globally, leads to growing urban congestion, traffic congestion, pollution and health problems. Various attempts have been made to address these problems, but in practice none of them have yielded tangible benefits [2]. In order to implement the idea of sustainable development, promote sustainable mobility and reduce the level of pollution caused by the transport sector, it is important to increase people’s awareness. It is important to emphasise attention to new, alternative ways of traveling and to inform about the possibility of changing cars for other vehicles during trips [3]. One of the systems for raising awareness and informing consumers could be advertising, which plays an important role in communication through various media and is likely to contribute to raising public awareness of environmental issues by encouraging consumers to choose environmentally and human-friendly transport systems, encouraging people to use public transport, to cycle or walk, and to choose and combine several modes of transport when travelling. Sustainable mobility and multimodality would not only ensure the quality of these services but also reduce the ever-increasing levels of pollution generated by the transport sector. Therefore, this paper focuses on the importance of sustainable mobility and multimodality and the impact of advertising on this solution, examines the impact of advertising as a communication tool on consumer behaviour when making sustainable mobility and multimodality decisions in the urban transport system, and discusses ways of addressing transport system problems in the context of sustainable mobility and multimodality. In addition, the advertising concept and green marketing are described.
Transport activities focus on the movement of passengers and freight. According to Baltrėnas et al. [4], as the demand for movement grows, so does the traffic intensity and congestion. According to Bignal, et al. [5], despite the increasing number of hybrid vehicles on the road and the development of measures to control emissions, vehicle pollution remains a major concern. Vehicle exhaust emissions are considered to be one of the main sources of air and environmental pollution. Air pollution is also linked to various diseases and infections that affect human health and quality of life. Transport is therefore linked to environmental problems.
In their book The Geography of Transport Systems, Rodrigue et al. [6] highlighted the main impacts of transport on climate warming, air and water quality, and human health. The road transport sector is responsible for more than fifty percent of CO2 emissions worldwide. Carbon dioxide is one of the greenhouse gases that prevent electromagnetic radiation from leaving the earth’s surface, contributing to global warming and climate change. Cars also emit nitrogen oxides, which are the main cause of acid rain. Nitrogen oxides in the exhaust gases mix with water vapour in the air to form acid rain. Acid rain has a negative impact on the environment, reducing agricultural yields, causing deforestation and plant degradation, and reducing the quality of drinking water. Toxic substances and noise emissions from vehicles affect air quality and human health. Polluted air increases the likelihood of cancer, cardiovascular and respiratory diseases, and can cause allergic reactions. According to the World Health Organization [7], around three million people die from pollution-related illnesses worldwide each year. The European Commission [8] predicts that air pollution from road transport will not decrease in the near future due to persistent congestion and the expected even higher growth in transport demand. The current transport system will therefore remain unsustainable [6].
Taking into account people’s daily transport needs, advertising could aim to change mobility patterns by creating a high quality, well-developed, widely accessible, green transport network, promoting optional mobility and limiting the use of private transport in the city, which is a source of pollution and has a significant negative impact on people’s health and lives. Advertising would also help to encourage people to use public transport, cycle, or walk. All of these measures would help to create an environmentally and human-friendly and attractive urban transport system.
The paper addresses the following questions: what is the impact of advertising on consumer behaviour in the context of sustainable mobility and multimodal decision-making in urban transport systems? What is the potential effectiveness of advertising in promoting sustainable mobility and multimodality in urban transport systems?
The aim of the study is to examine the role of advertising and its impact on consumer behaviour and to identify the prerequisites for the use of advertising in promoting sustainable mobility and multimodality in urban transport.
Objectives of the study:
  • To identify the role of advertising in promoting sustainable mobility and multimodality in the urban transport system by analysing the scientific and methodological literature on the topic.
  • To examine the role of advertising in promoting sustainable mobility and multimodality in the urban transport system, based on the participants’ assessment.
  • To identify opportunities for promoting developing sustainable mobility and multimodality in the urban transport system through the use of an advertising information system.
Considering that advertising can be an important way not only to contribute to the modern world of commerce and business, but also to contribute to the development of sustainable mobility and multimodality, to encourage consumers to use combined public transport services, to contribute to sustainability, and to contribute to the reduction of the increasing pollution in the transport sector, this paper presents the authors’ research, which consists of an analytical description, quantitative and statistical methods, and the results of the study.
The contribution of this study is the development of a model based on theoretical and empirical arguments. It can be used to predict the preconditions for the use of advertising in promoting sustainable mobility and multimodality in urban transport systems. In addition, the possibilities of promoting and developing sustainable mobility and multimodality in the urban transport system through the use of advertising have been comprehensively examined. This includes elements influencing the decision to travel on the basis of sustainable mobility and multimodality, and groups of information tools and media channels.
The results of the study and the identified components of the model can be easily extrapolated to other contexts to optimally anticipate the development of sustainable mobility and multimodality in the urban transport system through the use of an advertising information system. On the other hand, the study has highlighted the role of advertising in the development of sustainable mobility and multimodality in urban transport, and the most effective channels and means of delivery that can be used to develop sustainable mobility and multimodality in urban transport.
Researchers focus on the quality and attractiveness of public transport services, as well as on identifying the factors that ensure that users’ needs for public transport services are met. Various aspects of sustainable mobility and multimodality are also addressed. Meanwhile, the role of advertising and its influence on consumer behaviour and its role in promoting sustainable mobility and multimodality in urban transport systems has not yet been explored. Moreover, there is a lack of research that examines the preconditions for the use of advertising in promoting sustainable mobility and multimodality.
More research is therefore needed and encouraged looking at the role of advertising and its impact on consumer behaviour, and the prerequisites for the use of advertising in promoting sustainable mobility and multimodality in urban transport systems. The results of the study would contribute to a better understanding of the preconditions for the use of advertising in promoting sustainable mobility and multimodality and to the search for the information tools and channels and advertising elements that would be most effective in promoting the principles of sustainable mobility and multimodality.
The remainder of the paper is organised as follows. Section 2 provides an overview of the scientific literature. In Section 2.1 is proposed the problem of decreasing demand for public transport. In Section 2.2 is integrating public transport with other modes of transport. Section 2.3 is the proposed advertising concept and green marketing features.
Section 3 of the article describes the research methodology and analyses the research data. Section 4 of the article presents conclusions and recommendations.

2. Literature Review

The urban transport system is defined as a whole, including the structural layout of the city, the city’s population, different means of transport, and the infrastructure necessary for their movement [2]. In this way, the urban transport system can be defined as the totality of pedestrians, passengers, and vehicles and the infrastructure, information, and traffic control measures necessary for their movement [9].
The choice of which means of transport to use is up to the individual, taking into account factors such as time, cost, comfort, quality, and safety [1,2]. The aim of public transport is to integrate different modes of transport with each other, ensuring that passengers have as much choice as possible to travel without using cars [3]. However, there are many factors that directly influence the demand for public transport, such as time, cost, speed, accessibility, comfort, safety, and image. Vytautas and Andrius Jaržemskiai [10] argue that owning your own car has become the guarantee of a comfortable and convenient journey.
Problems in the transport system arise when the transport infrastructure is no longer able to satisfy the growing demands of consumers [9]. The urban transport system is adversely affected by the malfunctioning of the urban transport system. This has a negative impact on economic and social aspects, on people’s quality of life, and on the environment [11].

2.1. The Problem of Decreasing Demand for Public Transport

One of the many strands of the European Union’s transport strategy focuses on a sustainable, environmentally friendly, and safe urban transport system. Travelling by public transport is considered too complicated compared to private transport. In addition to the reasons listed above, insufficient availability of public transport, long journey times, unreliability of the service, insufficient frequency, insufficient information, inadequate infrastructure, and overcrowding may also have an impact [3].
Transportation systems consist not only of the physical and organisational elements that interact with each other to produce transportation opportunities, but also of the demand that takes advantage of such opportunities to travel from one place to another. This travel demand, in turn, is the result of interactions among the various economic and social activities located in a given area, according to Cascetta [12].
The main focus of the transport system is on people’s mobility needs [13]. The need for the system grows as cities grow and expand. The larger the urban area, the more difficult it is to maintain and regulate the entire transport system. A poorly functioning transport system leads to problems of congestion, traffic accidents, pollution, and constant noise, which directly affect not only the inhabitants or visitors to the city, but also nature and the environment, according to Ceder [14].
Traffic congestion. Private transport has contributed significantly to the growing problem of congestion in cities [10]. Agyapong and Ojo [15] argue that there are many circumstances that cause and amplify congestion.
Congestion is caused by an imbalance between the demand for travel and the supply of the transport system [16].
Caballini et al. [17] mentioned that mass use of private transport, insufficient infrastructure capacity, and reduction of green spaces are the main consequences of the urban structure of recent years concerning mobility problems.
The problem of urban environmental pollution. According to the World Health Organization [7], around three million people die worldwide every year from pollution-related diseases. The European Commission [8] predicts that air pollution from road transport will not decrease in the near future due to persistent congestion problems and the expected even higher growth in transport demand. The current transport system will therefore remain unsustainable [6].
The problem of motor vehicle parking. The parking problem in cities is caused by an imbalance between supply and demand for parking spaces. This problem arises because most cities, especially large ones, miscalculate the probability of parking demand. Cities can no longer meet the ever-increasing demand for parking infrastructure [11].
Addressing transport system problems in the context of sustainable mobility and multimodality. Leung et al. [18] mentioned that the increased awareness of global climate change and air pollution has provided a strong impetus around the world to develop sustainable e-mobility cities. Chamier-Gliszczyński [19] mentioned that sustainable transport is environmentally sustainable mobility that involves behavioural change and an unconventional approach across all sectors of the economy. Vitetta [20] mentioned that: “in recent decades, transport services have developed, i.e.: integration of provided services according to prices and schedules; sharing vehicles and services; information before the trip (before the trip) and during the trip (on the way); technologies that describe vehicles (type of traction, driving support systems, etc.) and infrastructures (control systems, smart road, etc.).” Making cities more environmentally and human friendly requires continuous investment in the renewal, improvement, and development of transport infrastructure, as well as raising awareness, with constant reminders of the problems caused by cars and their impact on the environment and human health [1]. Many researchers have identified the following measures and techniques in their research that need to be improved in order to successfully tackle the problems caused by transport.
Bassi et al. [21] mentioned that transport is one of the main factors of development. It connects communities, enables the trade of goods between territories, and provides equal access to public services. Inturri et al. [22] stated that sustainable mobility is one of the main concerns of policy makers. Roman [23] mentioned that sustainable transport or, as it is also often called, green transport, as this emphasises environmental aspects, is created from a sustainable perspective development.
Making public transport more attractive. To improve the image and attractiveness of public transport, people’s need must be taken into account. Increasing demand for public transport can be achieved by expanding the public transport network, providing concessions for public transport vehicles in traffic, upgrading the vehicle fleet, and integrating intelligent transport systems into the public transport sector.

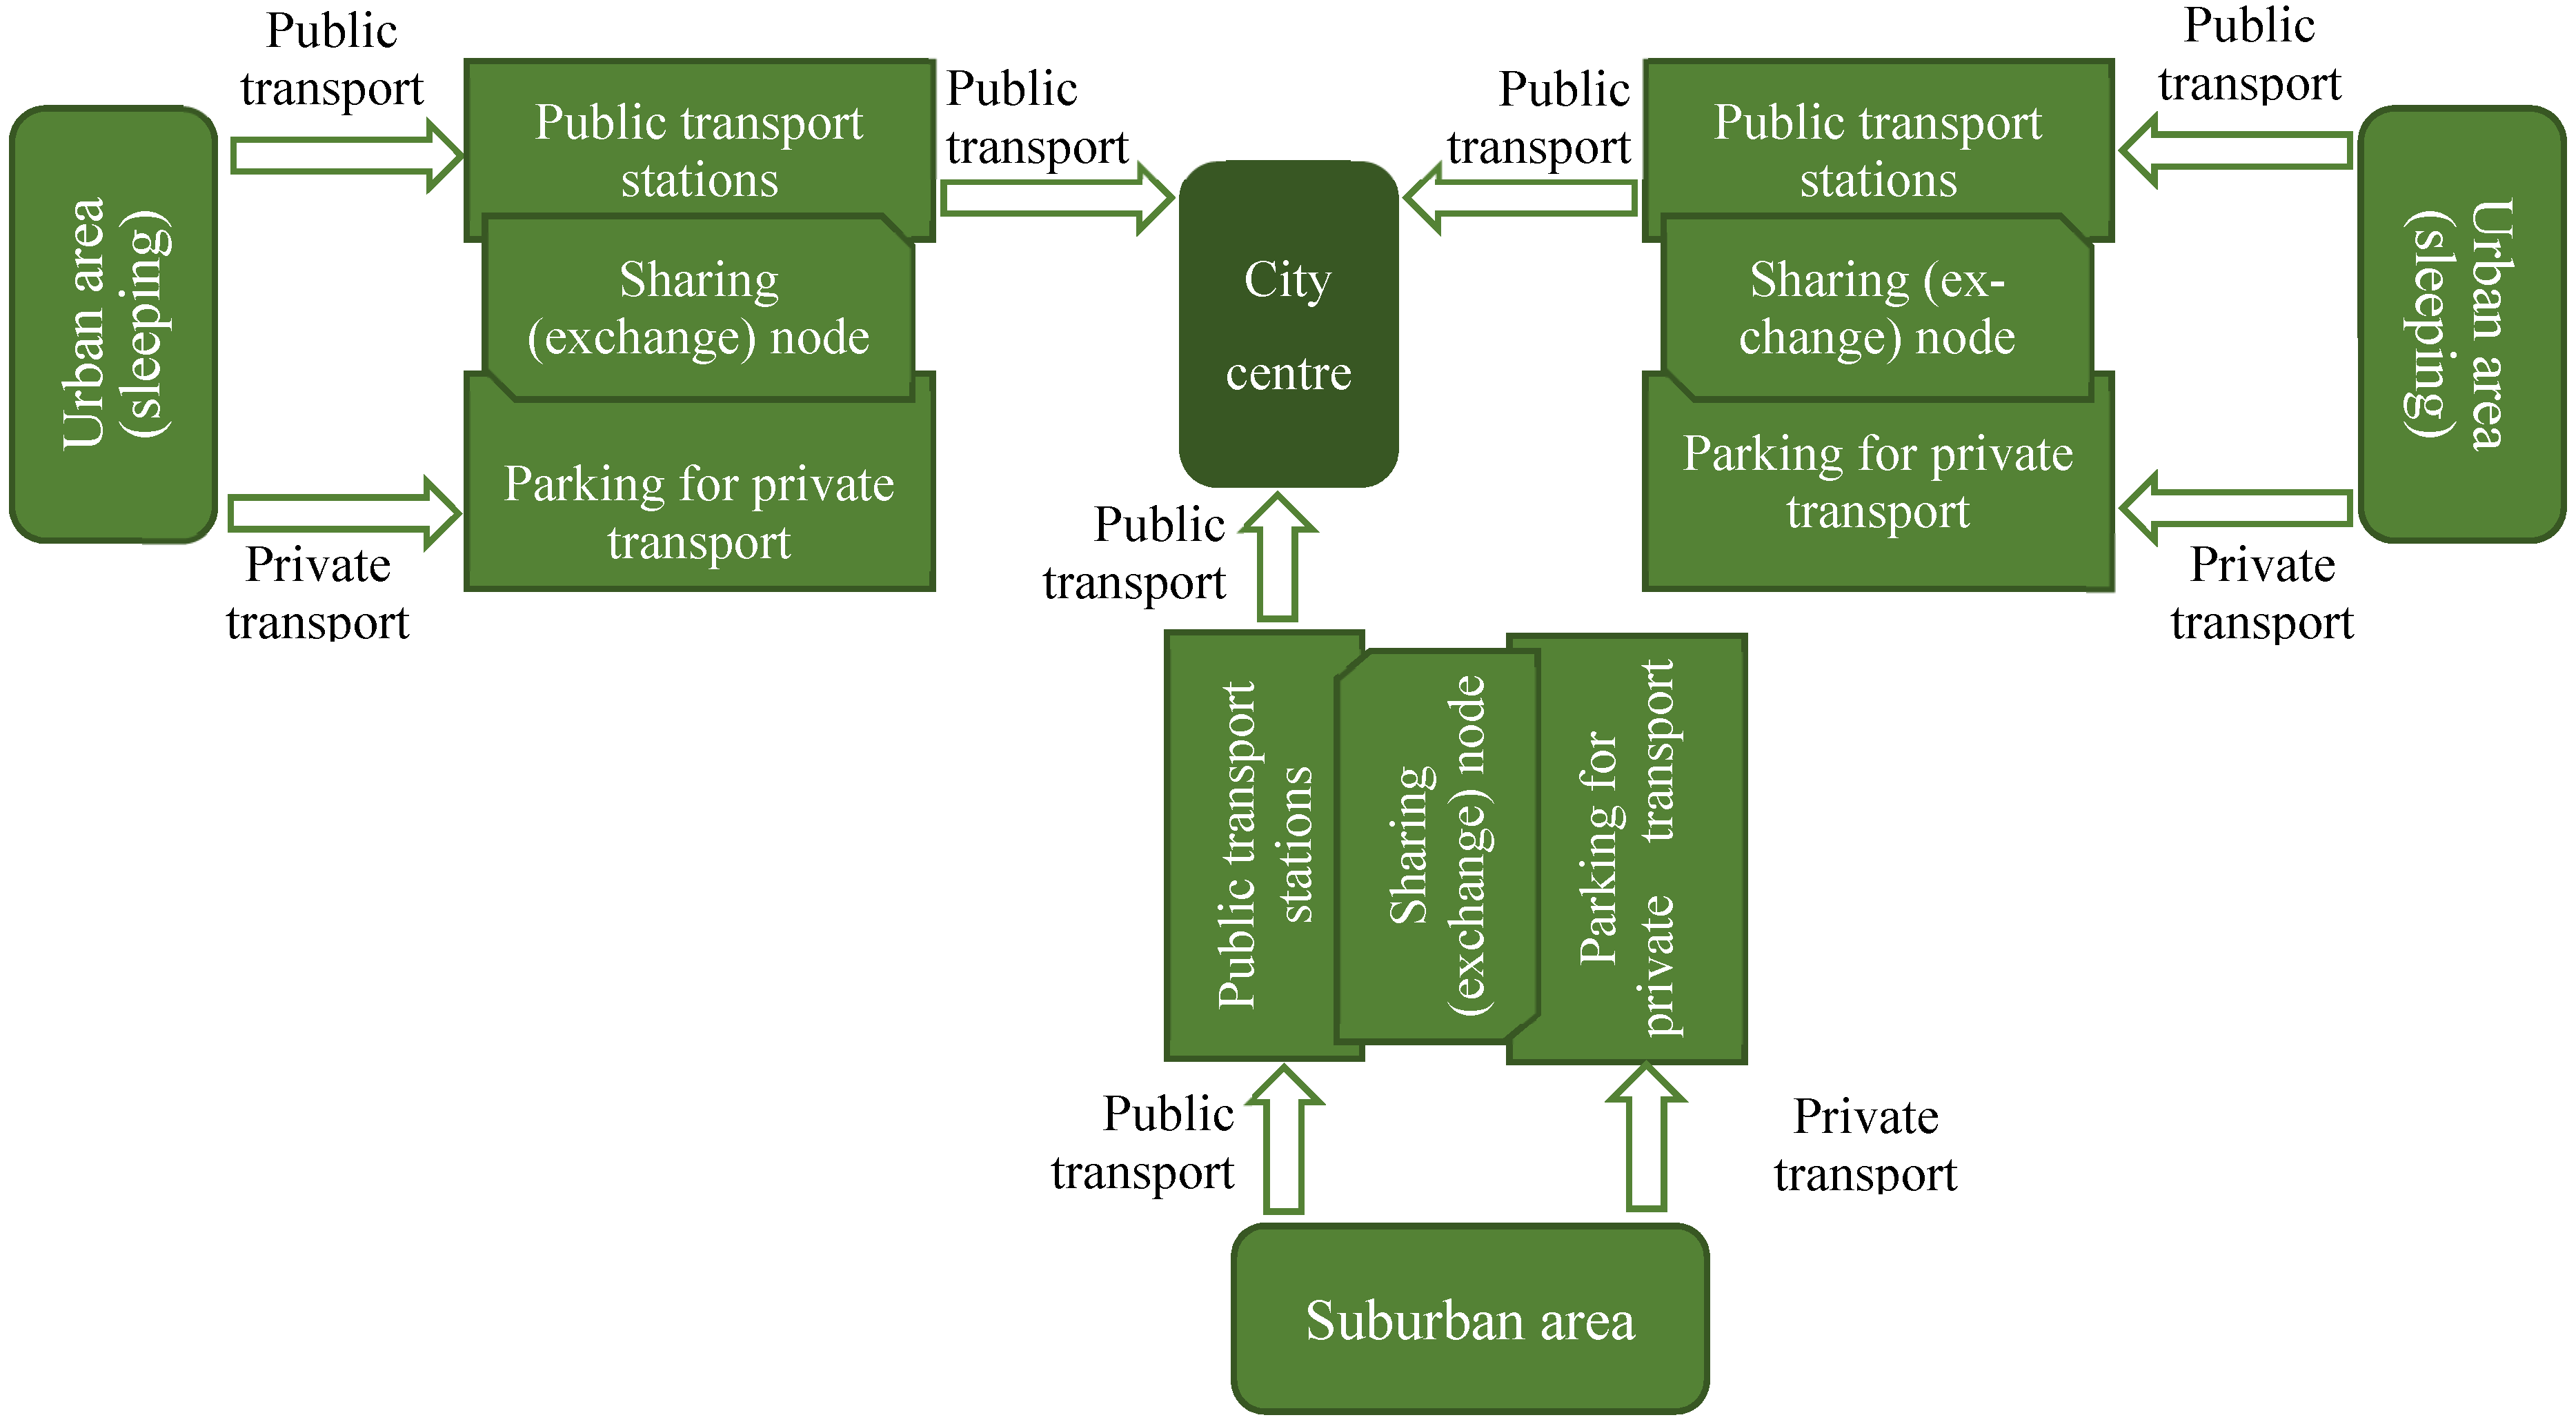
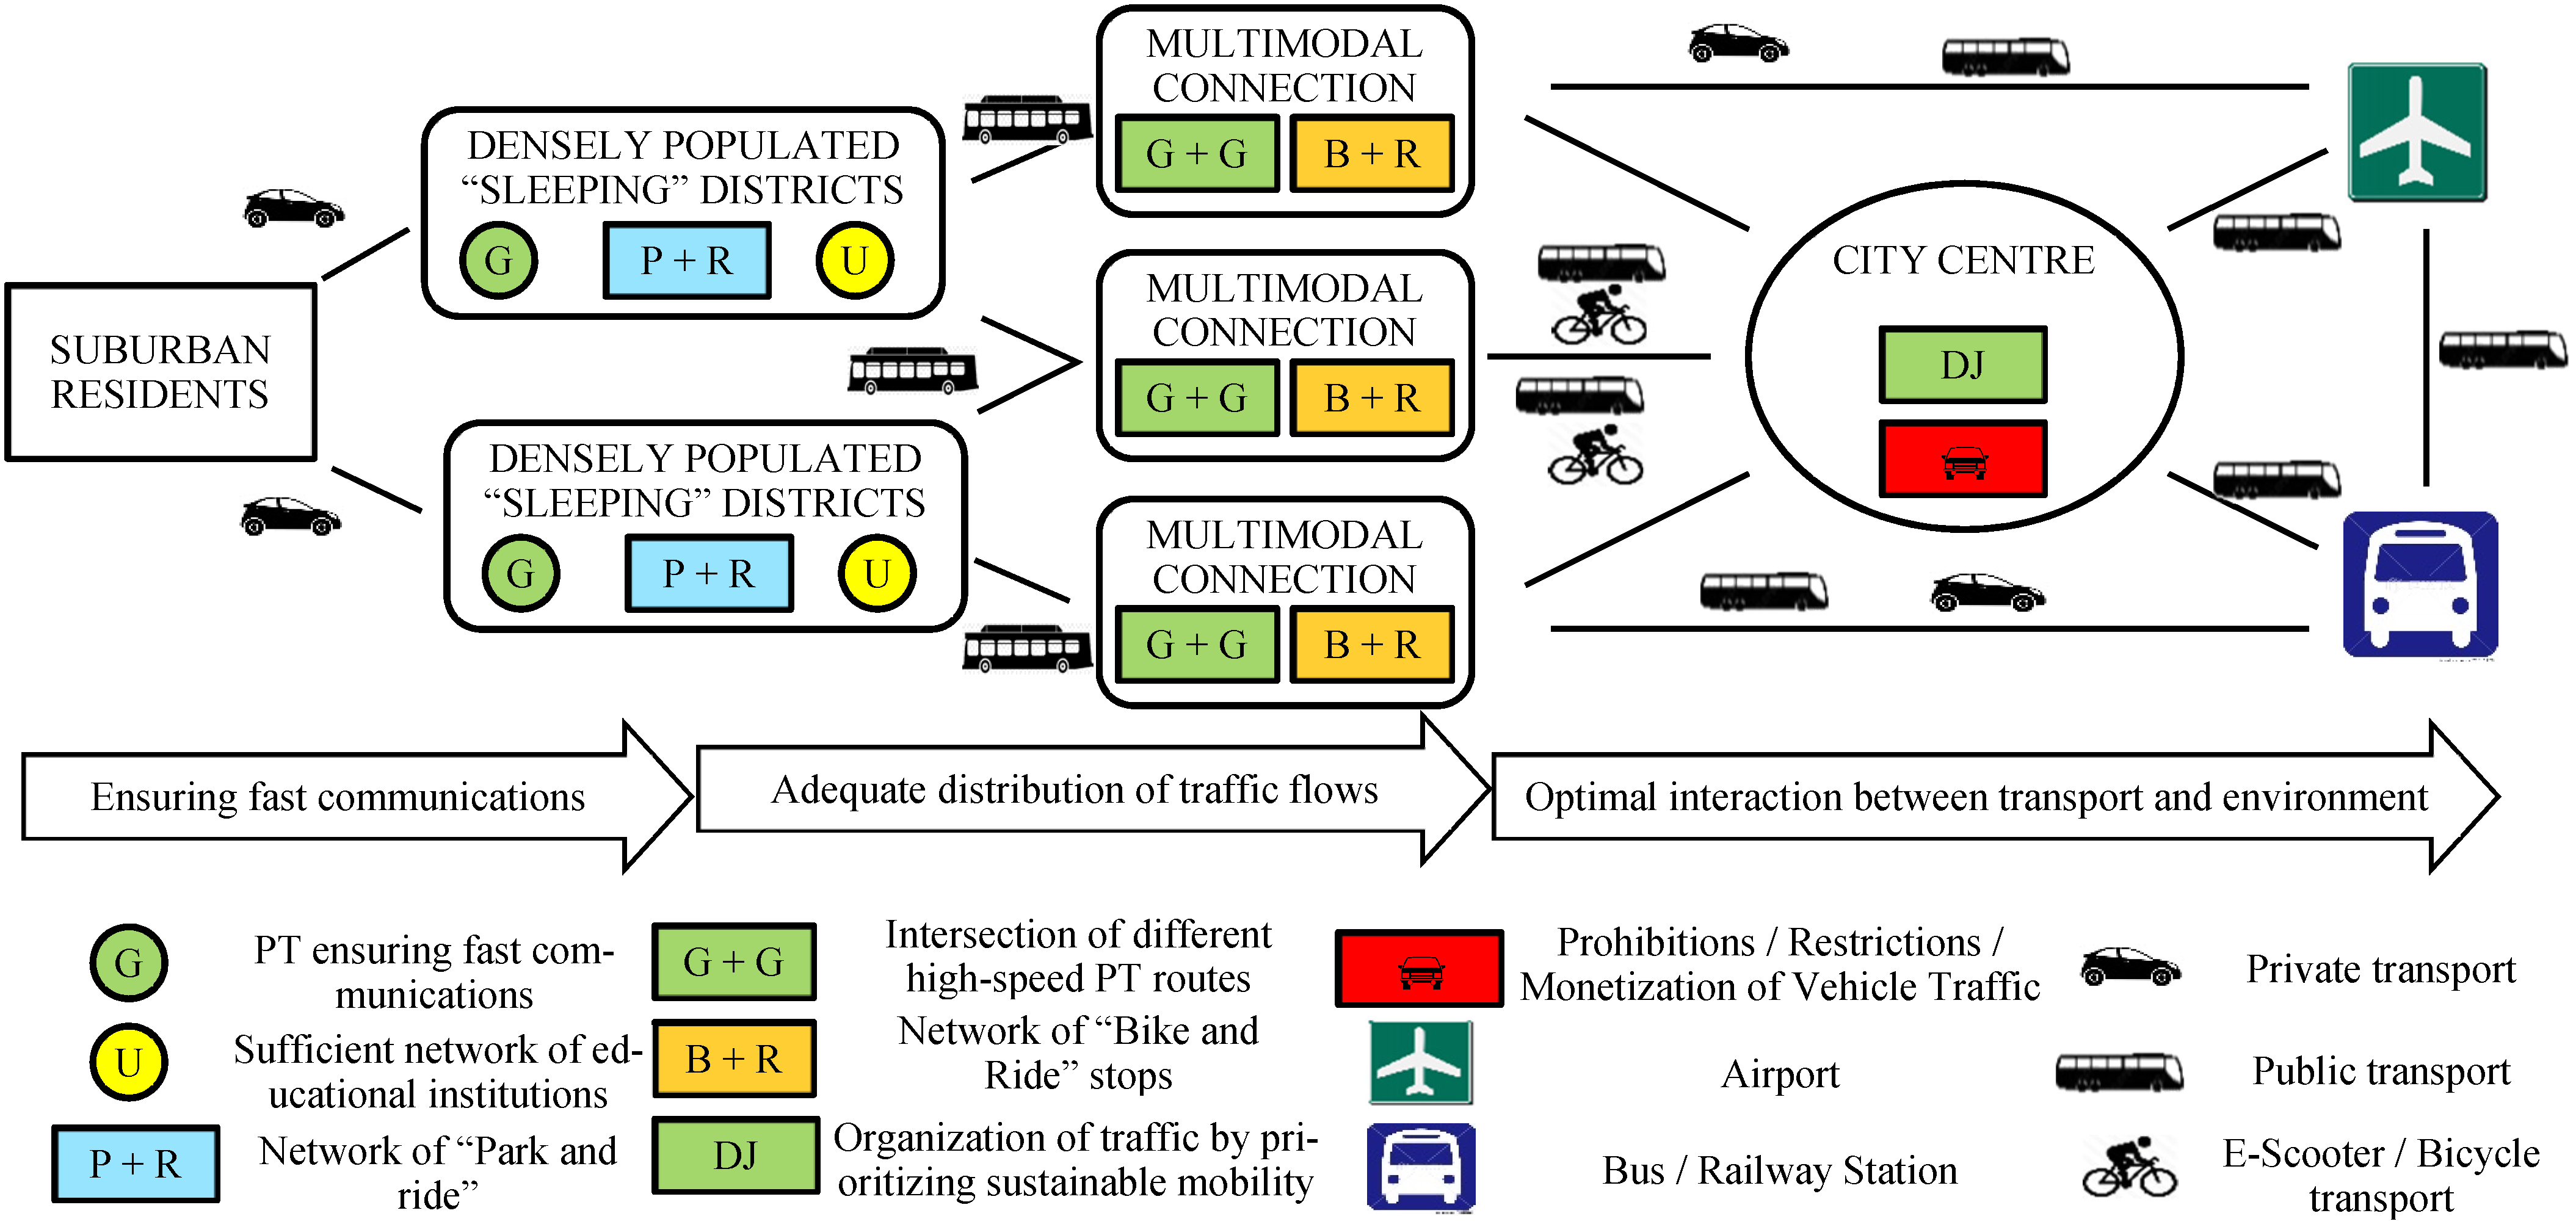
2.2. Integrating Public Transport with Other Modes of Transport

Implementing a green transport policy requires that the urban transport system includes quality public transport services capable of providing sufficient capacity and a competitive level of service [24,25].
It is important to pay attention to the integration of the public transport system with the private car. “Park and ride” is a way to reduce congestion in the central part of the city, thus protecting the city from severe congestion, traffic accidents, parking, and pollution problems [26].
The distance from the parking lot to the final destination should be covered by bus, train or other public transport (Figure 1). It is cheaper to use than travelling by private car alone. “Park and ride” increases the number of parking spaces, avoiding the construction of new car parks in the city centre and reducing negative transport impacts [24,27]. High traffic volumes in cities often lead to road congestion. Dense buildings and other terrain restrictions often do not allow further development of the street network [24]. These conditions lead to the search and implementation of solutions aimed at limiting the number of passenger cars entering the city centre. In many cities around the world, there is a tendency to build “Park and ride” (P&R) parking locations on the outskirts. They are designed to enable users to combine travel using their transport means of public transport, thus contributing to reducing the number of passenger cars entering the city centre (Figure 1).
Implementing and improving the Intelligent Transport System. Intelligent transport systems (ITS) are the main technological solutions related to the urban transport system currently being pursued by cities around the world [28]. ITS can help to solve certain transport related problems such as traffic congestion, traffic accidents, and others. Further deployment and development of intelligent transport systems is necessary to improve road traffic conditions and alleviate connectivity problems, especially in large, congested cities [29,30].
Promoting cycling. In order to promote this mode of transport, authorities have started to focus more on bicycle infrastructure by redesigning and upgrading the street network, creating cycle lanes, and developing bicycle parking or integrating bicycles into public transport, as well as by developing public bicycle sharing systems. Studies show that these measures can increase the number of cyclists in cities [31,32].
Car restrictions in cities. Urban traffic calming can be achieved through the use of speed limits and physical barriers such as speed humps. These is the most popular and regularly used method of speed limitation, but they are usually ineffective. Studies show that they have a positive effect on reducing congestion, air pollution, and accidents in cities [31].
Transport infrastructure development. Vaičiute et al. [33] mentioned that the growing needs of the customers of transport companies and the rapidly expanding cooperation between transport companies require the creation and implementation of technological innovation immediately. The problems can be managed by means of road engineering: building bypasses, reconstructing roads, or streets, and so on. Diverting at least most of the city’s transit traffic to bypasses can significantly reduce the level of pollution in the city [1]. The idea of the proposed conceptual model is broken down into three key processes (Figure 2).
Ensuring fast connections. People living in the suburbs or on the outskirts of cities usually travel by private transport. Due to the long distances to the city centre, convenient public transport in the suburbs is practically impossible. For this reason, it is proposed to provide public transport in the suburbs only to meet the basic transport needs and to allow private transport without any restrictions. It is proposed to introduce at least one rapid public transport line. A network of “Park and ride” sites is proposed to be added to rapid public transport routes and bottlenecks to provide convenience, encouragement, and a speed advantage. The model also highlights the need to ensure a sufficient number of quality educational facilities in residential areas.
Proper allocation of flows. There is already a significant number of passengers travelling by public transport from the residential districts towards the city centre. It is therefore proposed to create multimodal interchanges (stations) along this stretch of the road, providing convenient opportunities for modal shift, with a focus on the intersection of rapid public transport routes. This would help to better distribute the flow of passengers. The multimodal connections being developed also include Bike & Ride sites and other infrastructure development for sustainable cycling and e-scooters.
Optimal interaction between transport and the environment. The proposed model would impose strict traffic rules in the city centre. In and around the city centre, priority would be given to sustainable mobility-public transport, bicycles, e-scooters, and pedestrians. Private car owners would be subject to bans, restrictions, or surcharges when travelling in the city centre, depending on the city’s transport policy. It is envisaged that the boundaries of the central urban area would be extended over time to make it even more difficult for private transport owners and to progressively discourage the use of cars in the city centre. The model also proposes avoiding passing traffic in the central part of the city if travelling to other important destinations. Therefore, the model provides direct connections between multimodal stations and points of interest for the city, such as the airport, bus, or railway stations. These connections should provide convenient and fast access for both public transport and private transport, allowing for a better distribution of passenger flows and reducing the already high traffic in the central part of the city. In this way, the synergies between several different solutions could potentially yield greater benefits, which is the essence of the concept of sustainable mobility and multimodality.
Unnecessary mobility. An indirect way to reduce congestion is to introduce regulations that oblige employers to introduce teleworking where feasible, or to introduce a more flexible work schedule that allows employees to commute to and from work at different times during the day, while dealing with all other matters via the internet or other telecommunication methods [32,34].
The core of the model for improving the efficiency of the urban transport system presented below is to exploit the strengths of each transport mode, to increase the synergies between the different modes of transport, and to integrate sustainable mobility and multimodality solutions for their use in strategically convenient urban locations. This model can be adapted to include the effect of advertising on the modality and multimodality of the urban transport system. This would include the selection of advertising channels, originality of advertising, harmony of colors, and advertising images. The model would also include education, forming awareness and a positive attitude towards the choice of innovative alternative ways of traveling in the city, informing about the vehicles used (TP) and their options, combining several types of TP, encouraging traveling on foot.

2.3. Advertising Concept and Green Marketing Features

Advertising concept. Advertising shapes interests, fashions, habits, traditions, and opinion, performs cultural, aesthetic, and sometimes scientific public education, and defines the benefits of goods/services, their meaning, price, and quality. Melgar and Elsner [35] stated that advertising must make the customer feel either hedonic or utilitarian and maybe both at the same time. Onișor and Ioniță [36] mentioned that advertising is an important tool that organisations use in their marketing communications process. To promote a product, service, or idea, advertisers need to reach consumers. Korenkova et al. [37] stated that customers face a lot of advertising every day. Wright et al. [38] notice that television, radio, and even online advertising can reach large numbers of people in the short term, but this type of advertising is too general to target connections, mavens, and sellers. Nouzovský et al. [39] mentioned that the impact of advertising on road safety has been a topic of debate for many years for both the general public and experts. However, the advertising risk devices arise not only by fixing the driver’s eye and limiting his attention to the traffic flow, but they also pose a risk from the point of view of construction, because their supporting structure can be a fixed obstacle that can increase the consequences of a traffic accident. Eram [40] mentioned that the advert is taking on an important role in the modern world of trade and business. Everyone wants to take first place in the race. Sinclair [41] stated that with the ever-expanding internet, it is becoming clear that advertising is only the most visible and the societal dimension of a much broader but still quite familiar set of practices which use their lifestyles for commercial purposes. This practice includes sponsorship, especially in the fields of sport and the arts, store displays, sales promotion, contests, gifts, and direct marketing, such as telemarketing. Busen and Mustaffa [42] notice that advertising basically seeks to “turn people’s minds around”, looking at the Latin that makes up the word for advertising. In principle, this is achieved through six stages, namely exposure, attention, understanding, acceptance, retention, and action. It is important to note that in the surviving literature, advertising has clearly overshadowed the brand capital as sought after the research area. Małecki el al. [43] mentioned that outdoor media transit advertising can be considered an underutilised medium. Advertisements can be displayed on the exterior and interior of taxis, buses, and trains. Ziółkowska [44] notices that digital marketing is defined as the achievement of marketing objectives through the use of digital technologies and media. Schütze et al. [45] observe that passenger information is a key communication element in public transport marketing. The function of informing passengers is to use the guide for using public transport. It aims to create trust, orientation, and encourage potential users to use public transport. Information for passengers should be understood as a key component of public transport accessibility.
The importance of word-of-mouth on consumer opinion (brand attitude, etc.) is based on various studies. Morfoulaki et al. [46] notice that word of mouth is considered the main means of effective dissemination. A major modification of the traditional word-of-mouth concept is user-to-user transmission of information over the internet. In word-of-mouth marketing, companies “use” customers who strongly believe in a product or service to convince others to buy and use it. Customers become volunteer sponsors by actively promoting a product or service on behalf of the company.
Green marketing. Jones et al. [30] note that more and more companies are looking to emphasise their commitment to sustainability in an attempt to differentiate themselves from competitors and strengthen the company’s brand and reputation. The goal is to systematically incorporate sustainability into a company’s strategy throughout the supply chain, from product and service development to consumption. By re-examining the social and environmental impact of their marketing strategies, companies can begin to prepare for more sustainable growth. Krstić et al. [47] mentioned that advertising through various media plays an important role in communication and raising public awareness of environmental issues and stimulates market demand for organic products [48]. This type of advertising is often referred to as green advertising and it is a communication about the products made in an environmentally friendly way (made from recycled and recyclable components or made more energy efficient) or communication about the organisation’s overall commitment to sustainability certain brands. There needs to be more focus on re-evaluating your product and service portfolio, as well as these products and services being developed, produced, and marketed [49].
Wang [50] states that green advertising is a new advertising concept that includes environmental protection and human health as a theme, and uses green products and green consumption concepts as the main object of communication to convey environmentally friendly messages, e.g., as ecological protection and resource conservation for consumers.
Segev et al. [51] and Primožič et al. [52] mentioned that whilst many companies use advertising to announce their genuine efforts to reduce the environmental impact of their brands and products, others exaggerate or even imagine the environmental impact of their proposals. Nadanyiova [53] stated that green marketing as part of environmental management has become a new marketing of the philosophy of many companies. The scope of green marketing tools is quite wide, starting with environmental protection, production and sales of products, and services with ecological conditions and requirements for the end use of organic products, which affects the quality of life and health of society as a whole [53,54]. Bernyte [55] mentioned that marketing strategy and communication with consumers have been largely based on the assumption that resources are endless and have no impact on the environment. No need to review product development, pricing distribution, and integrated marketing communication or language used. The emphasis on the environment was created and encourage greater willingness to consume. Moravcikova et al. [56] mentioned that organic marketing is the study of the positive and negative aspects of marketing activities related to pollution, energy consumption, and non-energy consumption. This definition includes the following characteristics: green marketing as a subset of all marketing activities is examined positive and negative activities and only a limited range of environmental problems. Waqas et al. [57] notice that the increased use of motor vehicles has become a serious cause of environmental and health problems, leading to noise pollution, air pollution, and the emission of greenhouse gases. Sustainable transport, such as green public buses, metros, and public transport cycling, has begun to improve the quality of the environment.
Majeed et al. [58] mentioned that marketers develop a green marketing model to improve green purchasing behaviour by examining key elements: “Green labelling, green packaging and branding, green products, premium goods and pricing, green brand image and customer beliefs about the environment.” Consumers’ perceptions of risk and value associated with products have been studied in the past, but no one has studied them in relation to green marketing and environmental challenges.
Vilkaite-Vaitone et al. [59] notice that green marketing is a key factor in successful business operations. García-Salirrosas et al. [60] notice that GM practices implemented by companies to promote a responsible consumer society are divided into five categories: (a) green products and services, (b) green business image, (c) ecological advertising, (d) green purchasing experience, (e) and organic marketing mix.
Yang et al. [61] note that green marketing, also known as ecologically responsible marketing, is a business management method that aims to both increase revenue and ensure the long-term viability of an organisation. Ktisti et al. [62] note that the need for business to promote its green strategy and green products, among other things, emphasises green advertising techniques. Shabbir et al. [63] notice that for the sustainability of business enterprises, green marketing and related strategies become an important tool for achieving better business results. However, the concept of green marketing has evolved over time with growing environmental sustainability and consumer segmentation. Green marketing is the process of trying to develop different strategies to target consumers who are more environmentally conscious. Mercade Mele et al. [64] mentioned that consumers prefer to buy products and services that are environmentally friendly and have the least harmful impact on the environment. In this sense, as well as taking into account their environmental obligations, companies use the GM idea to create and present any changes aimed at meeting the environmental needs of consumers.
The literature review suggests that an urban transport system is usually defined as the sum of people and vehicles and the infrastructure needed to move them. The main focus of a transport system is on the needs of people’s movement. The larger the urban area, the more difficult it is to maintain and regulate the entire transport system. A poorly functioning transport system leads to problems of congestion, traffic accidents, pollution, and constant noise, which directly affect not only the inhabitants or visitors to the city, but also nature and the environment. Green marketing is solutions that include everything related to marketing activities. The goal of green marketing is to meet the needs of consumers with minimum costs, having a less negative impact on the environment.
Making cities more environmentally and human friendly requires a radical transformation of mobility patterns by creating a high-quality, well-developed, widely accessible, and environmentally friendly transport network, promoting non-compulsory mobility, limiting the use of private cars in the city, and thus encouraging people to use public transport, cycle, and walk. Advertising is one of the tools that should influence people’s behaviour. By studying the impact of advertising on consumer behaviour, it would be possible to predict the extent of its impact on the promotion of a sustainable mobility and multimodality platform.

3. Research Methodology and Analysis of the Results

3.1. Research Methodology

Research logic. The following systematic logic was followed in organising the research: (1) analysing, evaluating, and synthesising scientific and methodological literature close to the topic under consideration and the results of the related scientific research related, which helped to clarify the role of advertising in promoting the development of sustainable mobility and multimodality in the urban transport system and to design the research instrument; (2) conducting a diagnostic study, which allowed us to investigate the participants’ attitudes towards the meaning of advertising and its impact on consumer behaviour, and to anticipate the possible prerequisites for the use of advertising in promoting sustainable mobility and multimodality in the urban transport system, with an online survey was chosen as the method of questionnaire distribution; and (3) formulating conclusions based on the scientific literature and the survey data analysis to foresee the possibilities of developing sustainable mobility and multimodality in the urban transport system using an advertising information system.
Research methods. Analytical descriptive: the scientific literature related to the topic was analysed, and the results were summarised. Quantitative method: based on the theoretical insights and criteria identified in the scientific literature, a questionnaire was constructed. The variables selected for the analysis were the participant attitudes towards the meaning of advertising and its impact on consumer behaviour and how advertising can be used to promote the development of sustainable mobility and multimodality in urban transport systems. A questionnaire survey was used to analyse the prerequisites for advertising to promote sustainable mobility and multimodality in the transport system, identify problem areas, and identify opportunities for advertising promotion and transport management. This data collection method allowed for interviewing more respondents in a shorter time. The questionnaire was constructed based on theoretical insights and criteria identified in the scientific literature. The questionnaire was developed following the theoretical findings and distinguishing criteria found in the literature. The questionnaire consisted of closed questions. The indicators were identified to reflect best and allow to assess participants’ attitudes towards advertising and its impact on sustainable mobility and multimodality, to identify the most preferred channels and means of information and the aspects that most attract the attention of consumers in advertising, and to clarify the prerequisites for the use of advertising in the promotion of sustainable mobility and multimodality. In the view of most scholars (Eram [40]; Melgar et al. [35]), advertising plays an important role in today’s world of commerce and business and in shaping consumer attitudes, and the study sought to explore respondents’ attitudes towards advertising. The following advertising aspects were identified to attract the attention of the study participants the most (Jones et al. [65]; Korenkova et al. [37]). It is likely that images, colours and combinations of colours, text, and the idea of the advertisement, originality, etc., can influence a person’s decision to travel based on sustainable mobility and multimodality, and therefore the questionnaire aimed to find out what in the advertisement influences the respondents’ decisions to travel based on sustainable mobility and multimodality. According to Korenkova et al. [37], advertising uses a variety of media and channels, such as television, outdoor billboards, shop windows, radio, etc. Thus, the questionnaire aimed to find out which media and channels are most acceptable to the respondents and which media are good for promoting sustainable mobility and multimodality. According to Nadanyiova [35] and Parkhurst et al. [28], sustainable mobility and multimodality principles are most often identified with health benefits, ecological improvement, reduction of air pollution, etc. Consequently, the questionnaire included statements that allowed the assessment of the factors encouraging respondents to travel in a way consistent with sustainable mobility and multimodality. Researchers Leung et al. [18] and Bassi et al. [21] looked at the possibilities of implementing sustainable mobility and multimodality and focused on increasing the attractiveness of public transport, with advertising as one of the ways. Therefore, aiming to identify the prerequisites for advertising in promoting sustainable mobility and multimodality in urban transport, the questionnaire provided statements that allowed to investigate the participants’ attitudes to the advertisements most likely to promote sustainable mobility and multimodality.
The questionnaire consists of five question groups with 71 statements, 64 of which have five levels of response, ranging from 1 “strongly disagree” to 5 “strongly agree”. After checking the internal consistency of the questionnaire groups with Cronbach’s alpha, the results of the statistical data analysis show that the questionnaire statements (number of variables = 64) have a high degree of internal consistency (Cronbach’s alpha = 0.9830), varying from 0.9825 to 0.9833. The internal consistency of the variables was also checked for each group of questionnaires separately. The Cronbach’s alpha values for the frequency of attention to advertisements in the group of seven statements were calculated; Cronbach’s alpha = 0.8414 and varies between 0.8009 and 0.8303. For the definition of the main elements of the advertising elements influencing the decision to travel based on the principle of sustainable mobility and multimodality, the Cronbach’s alpha values of the group consisting of 14 statements was calculated; Cronbach’s alpha = 0.9657 and varies between 0.9612 and 0.9636. The estimated internal consistency of the statements in the group of elements promoting sustainable mobility and multimodality in the advertisement (number of variables = 14) has a Cronbach’s alpha of 0.9707 and varies from 0.9677 to 0.9720, and the estimated internal consistency of the statements in the group of information means and channels used for advertisements most likely to promote sustainable mobility and multimodality (number of variables = 18) has a Cronbach’s alpha of 0.9524 and varies from 0.9483 to 0.9515. The Cronbach’s alpha for the group of 11 statements in the evaluation of the advertisements promoting sustainable mobility and multimodality shows Cronbach’s alpha = 0.9635 and varies from 0.9584 to 0.89621. Based on the fact that internal consistency should be between 0 and 1 and that a Cronbach’s alpha value of 0.60 is considered appropriate for research, the Cronbach’s alphas calculated in this study indicate that the groups of questions are consistent with each other and that the variables included in the questionnaire are representative of the topic under investigation and are oriented towards the same subject matter.
Statistical: descriptive statistics (statistical means and standard deviations) and internal consistency (Cronbach’s alpha) test were statistical analysis methods used to process the data collected during the study. The mean (M) and its standard deviation (SD) were used to describe the Likert scale variables, and the Student’s t-test was used to compare the means of the Likert scale variables in two independent samples. If the significance level was less than 0.05, the difference was considered statistically significant. The percentage distribution (frequency) was also calculated. Statistical analysis of the data was performed using SPSS software version 17.
Sample of subjects. The survey was carried out among 396 Lithuanian citizens, the vast majority of whom were women (n = 303 (76.5%)) and only 86 (21.7%) were men; 3 (0.8%) respondents indicated “Other”, and 4 (1%) did not indicate their gender. The analysis of the age distribution shows that more than two-thirds (n = 264 (66.7%)) of the respondents belonged to the age group 46–65, while one-third (n = 124 (31.3%)) of the respondents were aged under 45. Only a small proportion (n = 5 (1.3%)) of the Lithuanian population was aged 66 and over, and 3 (0.8%) did not specify their age. For further analysis, respondents were divided by age into two groups; those aged under 45 accounted for 31.3% and those aged 46 and over accounted for 68% of the population of Lithuania’s major cities. Three participants (0.7%) did not specify their age. The convenience sampling method was used. The ethical principles of voluntariness, anonymity, and free choice to participate in the survey were respected.
Research procedure. In order to find out how many inhabitants of Lithuania’s major cities needed to be surveyed, the sample size of the survey was determined using the Paniotto sample size formula. A non-probability random sampling method was used to select the respondents for the Lithuanian metropolitan population, whereby the required number of members of the population group is randomly selected from the Lithuanian metropolitan population. The sample size is 396 inhabitants of Lithuanian cities (with 95% probability and 5% margin of error). This is assumed to be the smallest number of respondents that would allow statistically significant conclusions to be drawn about the phenomenon and the population under study. However, it should be acknowledged that this study is small in size and the results may not be fully representative of the population as a whole, but the results of a study of this nature may be reliable and not biased beyond the population. However, regarding further research, in order to be more representative and to be able to use the results to judge the general population, it would be appropriate to broaden the scope of this topic beyond the population of the major Lithuanian cities.
The online survey was distributed among the residents of Lithuanian cities. In order to obtain reliable data, a margin of error of 5 percent was chosen. Based on the sample size formula, the required number respondents to be surveyed was calculated (384 people in total).
The minimum number of respondents (research sample) required for the study, in order to obtain statistically significant conclusions, can be calculated according to Paniotto’s formula [66]:
n = 1 Δ 2 + 1 N = 384
n—sample size (number of respondents); —error size (0.05); N—general set (population), 2,794,000.
The questionnaires were completed electronically. The study took place for three weeks. The questionnaire survey was conducted from 2022 September 26 until 2022 October 17. During the three weeks in which the questionnaire was available, 396 people in Lithuania responded to the call. The 396 questionnaires were used for further data analysis and are considered suitable for statistical analysis. The results obtained have been processed and presented in a summarised form, respecting data confidentiality. Respondents completed the questionnaire online. A total of 550 invitations—requests to participate in the survey—were sent out to residents of Lithuania’s major cities via e-mail addresses published on information platforms, of which 200 were sent to organisations, companies, or institutions, while the rest of the questionnaires (250) were sent directly to employers, social partners, and private individuals. Of the 550 questionnaires sent out, 396 were returned (i.e., a return rate of 72%). The survey followed the principle of quality control, i.e., an internal verification of the survey (completeness of the questionnaire and consistency and duration of the survey). An external check was also carried out on the conduct of the survey, i.e., that it was carried out in line with the purpose of the survey, in accordance with the methodological guidelines, and in compliance with the principles of selection of respondents and research ethics.
The results of the research presented in this paper, which confirm the impact of advertising on consumer behaviour and suggest the prerequisites for the use of advertising in promoting sustainable mobility and multimodality in urban transport systems, can also be applied in other European countries in the context of transport management, in order to create public awareness and change harmful travel habits, and to promote the implementation of sustainable mobility and multimodality. In the future, the authors’ research could be developed by applying a qualitative research approach and analysing in more detail the possibilities of applying advertising to address the issues of sustainable mobility and multimodality in the transport system. On the other hand, regarding further research, it would be appropriate to carry out a regression analysis study and to investigate in a regression equation which information methods and tools, as well as advertising elements, have a statistically significant predictive value in shaping consumer attitudes towards sustainable mobility and multimodality.
In order to analyse in more detail the distribution of the population of the big cities of Lithuania who participated in the study according to demographic data, they are presented in Table 1.
After summarising the demographic characteristics of the residents of the big cities of Lithuania, it can be seen that the survey was completed by people of various demographic groups, which made it possible to obtain a sufficiently objective opinion of the respondents about the meaning of advertising and its impact on consumer behavior, and, based on the results of the study, to predict the assumptions of the application of advertising in promoting the development of sustainable mobility and multimodality in the big cities of Lithuania in the urban transport system.

3.2. Survey Results

The analysis of the participants’ attitudes towards advertising (see Figure 3) shows that more than two thirds of the respondents believe that advertising provides information about the goods and services on offer (63.9%) and informs potential consumers about new goods or services (64.1%). It also found that half of the respondents associate advertising with increasing brand awareness (58.3%) or sales (50.7%) of a product or service, and acknowledge that advertising encourages consumers to choose/buy the advertised product or service (50%). On the other hand, while there is a growing recognition that advertising shapes consumers’ opinions and habits and can have an educational function, the survey showed that only a minority of the survey respondents perceive that advertising has an impact on the development of sustainable mobility and multimodality (18.4%). It also found that only a third of respondents acknowledge that advertising provides information on innovative/alternative ways of travelling in cities (32.8%), while less than a quarter of respondents consider that advertising provides information on the importance of sustainable mobility and multimodality (20.9%) and shapes passengers’ attitudes towards innovative/alternative modes of travel (25.5%) and encourages passengers to choose innovative/alternative modes of travel in urban areas (27.3%).
Summarising the results of the study, it can be seen that the goals of advertising are basically related to increasing sales, raising brand awareness, informing consumers about new goods or services, encouraging quick response to changes in the market situation. Advertising as a way to develop sustainable mobility and multimodality is not used enough.
Advertising is one of the tools used in communication processes and plays an important role in shaping the opinions and interests of existing or potential users, developing sustainable mobility and multimodality and improving the quality of travel, reducing the negative impact of travel on the environment and reducing congestion in cities, public education becomes an important aspect.
When analysing which advertisements are the most popular with the participants, the highest mean scores (see Table 2) were found for advertisements related to entertainment and leisure, travel or events (M = 3.47) and advertisements related to education (training or courses) (M = 3.24). A more detailed analysis of the data and the calculation of the percentage distribution (frequency) (see Table 2) revealed similar trends, showing that almost half of the respondents n = 179 (46.9%) often and very often pay attention to advertisements related to education. Thus, in today’s society, some of the most relevant advertisements are those that provide consumers with educational content and offers, and that convey a message about education-related services.
The results also showed that 52.9% of the participants in the survey very often and frequently pay attention to advertisements related to leisure, entertainment, etc. As the results show, despite the recent increased focus on reducing environmental pollution, promoting sustainable mobility and multimodality, advertisements promoting sustainable mobility are less often paid attention to (M = 2.86). The latter results are supported by a more detailed analysis of the data, which shows that more than one third (37.7%) of the respondents rarely or completely ignore advertisements promoting sustainable mobility (18.6% rarely and 19.1% completely). These results show the need to explore possible ways of applying the advertising information system and selecting appropriate communication tools to develop the implementation of sustainability and sustainability messages by continuously identifying and assessing consumers’ needs and expectations, in order to make advertising more effective and attention-grabbing.
When analysing what the participants in the study identify with advertisements promoting sustainable mobility and multimodality, the highest mean scores were found (see Figure 4), indicating that respondents associate these types of advertisements with the promotion of healthier lifestyles (M = 3.27). Similarly, the participants in the study believe that advertisements promoting sustainable mobility and multimodality are oriented towards promoting car-free travel (M = 3.24) and the choice to use less polluting modes of transport (M = 3.23). Meanwhile, the lowest mean scores indicate that these types of advertisements are least identified by the participants with promoting safe travel (M = 2.78), using public transport when travelling (M = 2.9) and combining multiple modes of transport (M = 2.93). These results suggest that, in order to create a sense of social responsibility, to promote respect for the environment, and to contribute to reducing air pollution, advertisements promoting sustainable mobility and multimodality should go beyond promoting healthy living and the use of less polluting means of transport when travelling, but also focus on providing information on the variety of modes of transport used and the choice of modes of transport when travelling, encouraging the use of public transport when travelling by opting out of the private car, and providing information on the possibility of travelling safely in a more environmentally friendly way by switching to more environmentally friendly and more sustainable modes of transport systems.
A comparative analysis of the data by age showed that, although respondents in the age group under 45 years identified advertisements promoting sustainable mobility and multimodality with promoting healthier lifestyles (M = 3.34) and safe travel (M = 2.89), they had higher mean scores for such advertisements as being oriented towards encouraging a combination of modes of transport when travelling (M = 3.04) and the use of public transport (M = 3.0) or less polluting means of transport (M = 3.38) and car-free travel (M = 3.35) and reducing the use of private cars (M = 3.15), compared to the ratings of the respondents aged 46 years and over in the study (respectively: (M = 3.24), (M = 2.72), (M = 2.87) and (M = 2.84)), but a t-test showed no statistically significant differences in means (see Table 3). The statistical analysis also showed that, although the group of respondents aged under 45 years had higher mean values, indicating that the latter perceived that such advertisements promote awareness of the need to switch to more environmentally friendly and sustainable modes of transport (M = 3, 34), as well as providing information on the possibility of combining different modes of transport during journeys (M = 3.21) and on the possibility of choosing more environmentally friendly ways of travelling (M = 3.25), compared to the scores given by the older age group (aged 46+) (respectively: (M = 3.13), (M = 3.09), (M = 3.13) and (M = 3.09)), but the differences were only marginal and the t-test showed no statistically significant (see Table 3) differences in the means of these groups. This indicates that the participants in the study, regardless of age, have a similar level of appreciation of advertisements promoting sustainable mobility and multimodality.
To be effective, advertising requires thought and appropriate presentation of its content, the use of well-considered colours and their combinations, the selection of clear image and text compositions and appropriate combinations of these. In addition, one of the more important factors is the originality of the advertisement: its unusual design, which would attract the attention of the individual. Given that influencing human thinking and behaviour is a complex process, it is important to tap into the human emotion factor when designing advertisements aimed at developing sustainable mobility and multimodality, and to reinforce the individual’s awareness and understanding, which will lead to a willingness to take action.
When analysing the extent to which advertising plays a role in the decision of the participants in the study to prioritise travel based on the principle of sustainable mobility and multimodality, the highest mean scores were found (see Figure 5). That the idea (M = 3.13), the originality (M = 3.11), the informativeness (M = 3.11), and the text and content (M = 3.03) of an advertisement are among the factors with the highest influence on the participants’ decision to travel on the basis of the principles of sustainable mobility and multimodality. In contrast, the familiar faces (M = 2.33) and the frequency with which the advertisement appears (M = 2.34) are the least influential factors in the respondents’ decision to travel on the basis of the principles of sustainable mobility and multimodality. In addition, the lowest mean score (M = 2.22) for the assessment that nothing in the advertisement attracts attention suggests that the advertisement does serve a function in some way or other and draws the attention of the individual.
A comparative analysis (see Table 4) of the data for the different age groups showed that for participants under 45 years of age, the visual text, font, letter size, etc. of the advertisement was not the most important element of the advertisement (M = 2.89), the colours and combinations of colours (M = 2.84), as well as the originality of the advertisement (M = 3.34) and the frequency with which the advertisement is shown (M = 2.54), have a greater influence on the decision to travel on the basis of the principles of sustainable mobility and multimodality than for older respondents (aged 46 and over), for which statistically significant lower mean values were found (respectively: (M = 2.53), (M = 2.43), (M = 3.01) and (M = 2.24)).
In terms of the other elements of advertising that influence the decision of the participants to travel based on the principles of sustainable mobility and multi-modality, the statistical analysis of the data showed that there was no statistically significant difference in the ratings of the respondents irrespective of their age (see Table 4), although those aged under 45 rated the images (M = 2.93), the headline (M = 2.92), the text and content of (M = 3.15), the idea (M = 3.33) and the informativeness (M = 3.23) of the ad, as well as the familiar faces (M = 2.49), the novelty of the service (M = 2.82), video (M = 2.91), or audio (M = 2.81) have a greater impact on the latter’s decision to travel on the basis of the principles of sustainable mobility and multi-modality than the older age group (46+), which has a lower average score (see Table 4).
The results of the study show that the promotion of sustainable mobility and multimodality must also take into account the characteristics of older people. It is likely that the choice of appropriate means and methods to convey information, such as the originality of the advertisement and the choice of the visual text and frequency of the advertisement, which are also appealing to older people, would be more likely to attract their attention, This is likely to increase their involvement in the development of sustainable mobility and multimodality, change their habitual beliefs, and encourage them to adopt more sustainable and multimodal travel modes.
When analysing how advertising would most promote sustainable mobility and multimodality, the content (M = 3.53), originality (M = 3.56), and informativeness (M = 3.54), as well as the idea (M = 3.52), of the advertising are some of the aspects that can have an impact on changing consumers’ attitudes and on the promotion of sustainable mobility and multimodality, as assessed by the participants in the study (see Table 5). The latter results are supported by a more detailed analysis of the data, which shows that almost two-thirds of the participants in the study agree that the content (57.6%), the originality (57%), and the idea (57%) of the advertisement would be very likely to promote or encourage sustainable mobility and multimodality. The informativeness of the advertisement was also identified by the participants as one of the factors promoting sustainable mobility and multimodality (32.2% would very much promote it, 23.6% would promote it, respectively), while more than half of the respondents considered that the storyline of the advertisement would very much promote sustainable mobility and multimodality (24.4%) and promote it (28.7%). In contrast, the presence of familiar faces or pictures in the advertisement (M = 2.71), the combination of colours in the advertisement (M = 2.99), and the size of the advertising poster (M = 2.98) were considered by the participants to be the least likely to promote sustainable mobility and multimodality. A more detailed analysis of the data confirmed that almost half (45.7%) of the participants in the study considered that the presence of familiar faces or pictures in the advertisement would not (18.8%) or not at all (26.9%) promote sustainable mobility and multimodality. Furthermore, only one third of respondents associate the colour combinations in advertising (32.5%) and the size of the advertisement or poster (31.9%) with the potential for promoting sustainable mobility and multimodality.
A comparative analysis of the data for different age groups showed that younger respondents in the age group under 45 years had a statistically significant higher mean score for the importance of familiar faces or pictures in the advertisements (M = 2.91) as a way of promoting sustainable mobility and multimodality than older respondents aged 46 years and over (M = 2.61) (see Table 6). On the other hand, despite the fact that respondents aged under 45 gave higher scores to images (M = 3.3), visual text (M = 3.18), colours and combinations of colours (M = 3.13), design (M = 3.37), content (M = 3.62), or headline (M = 3.34), and the originality of the ad (M = 3.61), idea (M = 3.62), storyline (M = 3.56) and presentation (M = 3.37) as more important factors in promoting sustainable mobility and multimodality than the older age group (aged 46+) (respectively: (M = 3.16), (M = 2.95), (M = 2.93), (M = 3.24), (M = 3.49), (M = 3.26), (M = 3.54), (M = 3.47), (M = 3.34), and (M = 3.3)), no statistically significant differences were found by t-test (see Table 6). These results suggest that, irrespective of age, the factors promoting sustainable mobility and multimodality were rated at a similar level by the participants.
When analysing which media and channels are most likely to promote sustainable mobility and multimodality (see Table 7), the highest mean scores indicate that TV (M = 3.71), the internet, including email advertising (M = 3.4), radio (M = 3.28), and outdoor billboards (M = 3.18) are among the most effective media for promoting sustainable mobility and multi-modality, according to the survey participants. In contrast, telephone text messages (M = 2.35), promotional leaflets or flyers (M = 2.29), and direct mail (M = 2.13) are seen as the least effective channels for promoting sustainable mobility and multimodality. The latter results are supported by a more detailed analysis of the data, which shows that more than two thirds (61.4%) of the participants in the study, of whom 38.4% strongly agree and 23% agree, rate TV advertising as one of the more effective channels for promoting sustainable mobility and multimodality. In addition, the survey results showed that more than half of the respondents (52.6%) consider that radio advertising would strongly promote or promote sustainable mobility and multimodality, while information tools such as leaflets or flyers (58.4%) and mailings (63%) would not promote or not at all promote sustainable mobility and multimodality. The survey also showed that more than half of the respondents considered that short telephone messages (56.9%) and advertising by opinion leaders (53.1%) were the least effective advertising channels for promoting sustainable mobility and multimodality (see Table 7).
In summary, the results of the study show that TV, internet, radio, and outdoor billboards are among the most effective information tools for the development of sustainable mobility and multimodality implementation options.
A comparative analysis of the data by age showed that the channels most likely to promote sustainable mobility and multimodality, such as public transport advertising (M = 2.93) and opinion leaders (M = 2.95), were rated statistically significantly (see Table 8) more by respondents aged under 45 years than by those aged 46 years or older, as follows (M = 2.61) and (M = 2.2)). Statistical analysis of the data showed that while print (M = 2.71), leaflets and flyers (M = 2.39), posters (M = 2.96), direct mail (M = 2.22), internet (including email advertising) (M =3,54), or by SMS by telephone (M = 2.47), as well as radio (M = 3.32), television (M = 3.75), newsletters (M = 2.67), advertising at public transport stops (M = 3, 04), or on public transport (M = 3.01) were rated by younger participants in the study under the age of 45 with higher mean scores as the channels where advertising would be most likely to promote sustainable mobility and multi-modality than the effectiveness of advertising on these channels in developing sustainable mobility was rated by participants aged 46 and over (respectively: (M = 2.62), (M = 2.24), (M = 2.88), (M = 2.09), (M = 3.33), (M = 2.29), (M = 3.25), (M = 3.68), (M = 2.5), (M = 2.83) and (M = 2.83)), but there were no statistically significant differences in the means (see Table 8). This indicates that, irrespective of age, these information tools and channels where advertising would contribute to the development of sustainable mobility and multimodality are rated at similar levels.
The results of the study show that the current situation in terms of social, economic, and environmental wellbeing calls for the optimal use of transport modes individually and for the development of synergies between modes of transport for the carriage of passengers, as well as for the possibility of combining the different modes of transport during journeys. In the development of sustainable mobility and multimodality services, the comprehensiveness of the information provided to users on the variety of modes of transport and their choices is a key aspect. On the other hand, the analysis of the determinism of consumer activity in the use of services, which includes human thoughts, choices, and actions determined by events and external factors, in a general sense, highlights the special role of external factors such as the quality, clarity, completeness, informativeness, usefulness, etc. of the information provided, as these are what activate the individual for a specific activity and are the drivers of his or her behaviour in a particular direction.
One such tool could be the use of advertising. Good advertising can not only increase the awareness of a service or the number of users, but can also raise people’s awareness by constantly reminding them of the problems caused by cars and their impact on the environment and on human health, and by informing them about the variety of modes of transport and the possibilities of combining different means of transport when travelling. The development of advertising on topics of interest to consumers and the choice of appropriate communication tools are likely to contribute more to shaping consumers’ attitudes and values by changing the public’s everyday transport behaviour. In the context of the use of advertising to promote sustainable mobility and multimodality and its future development in the urban transport system, the authors present a concept (see Figure 6) linked to the type of advertising and its impact on changing consumer behaviour and on addressing environmental issues.

4. Conclusions

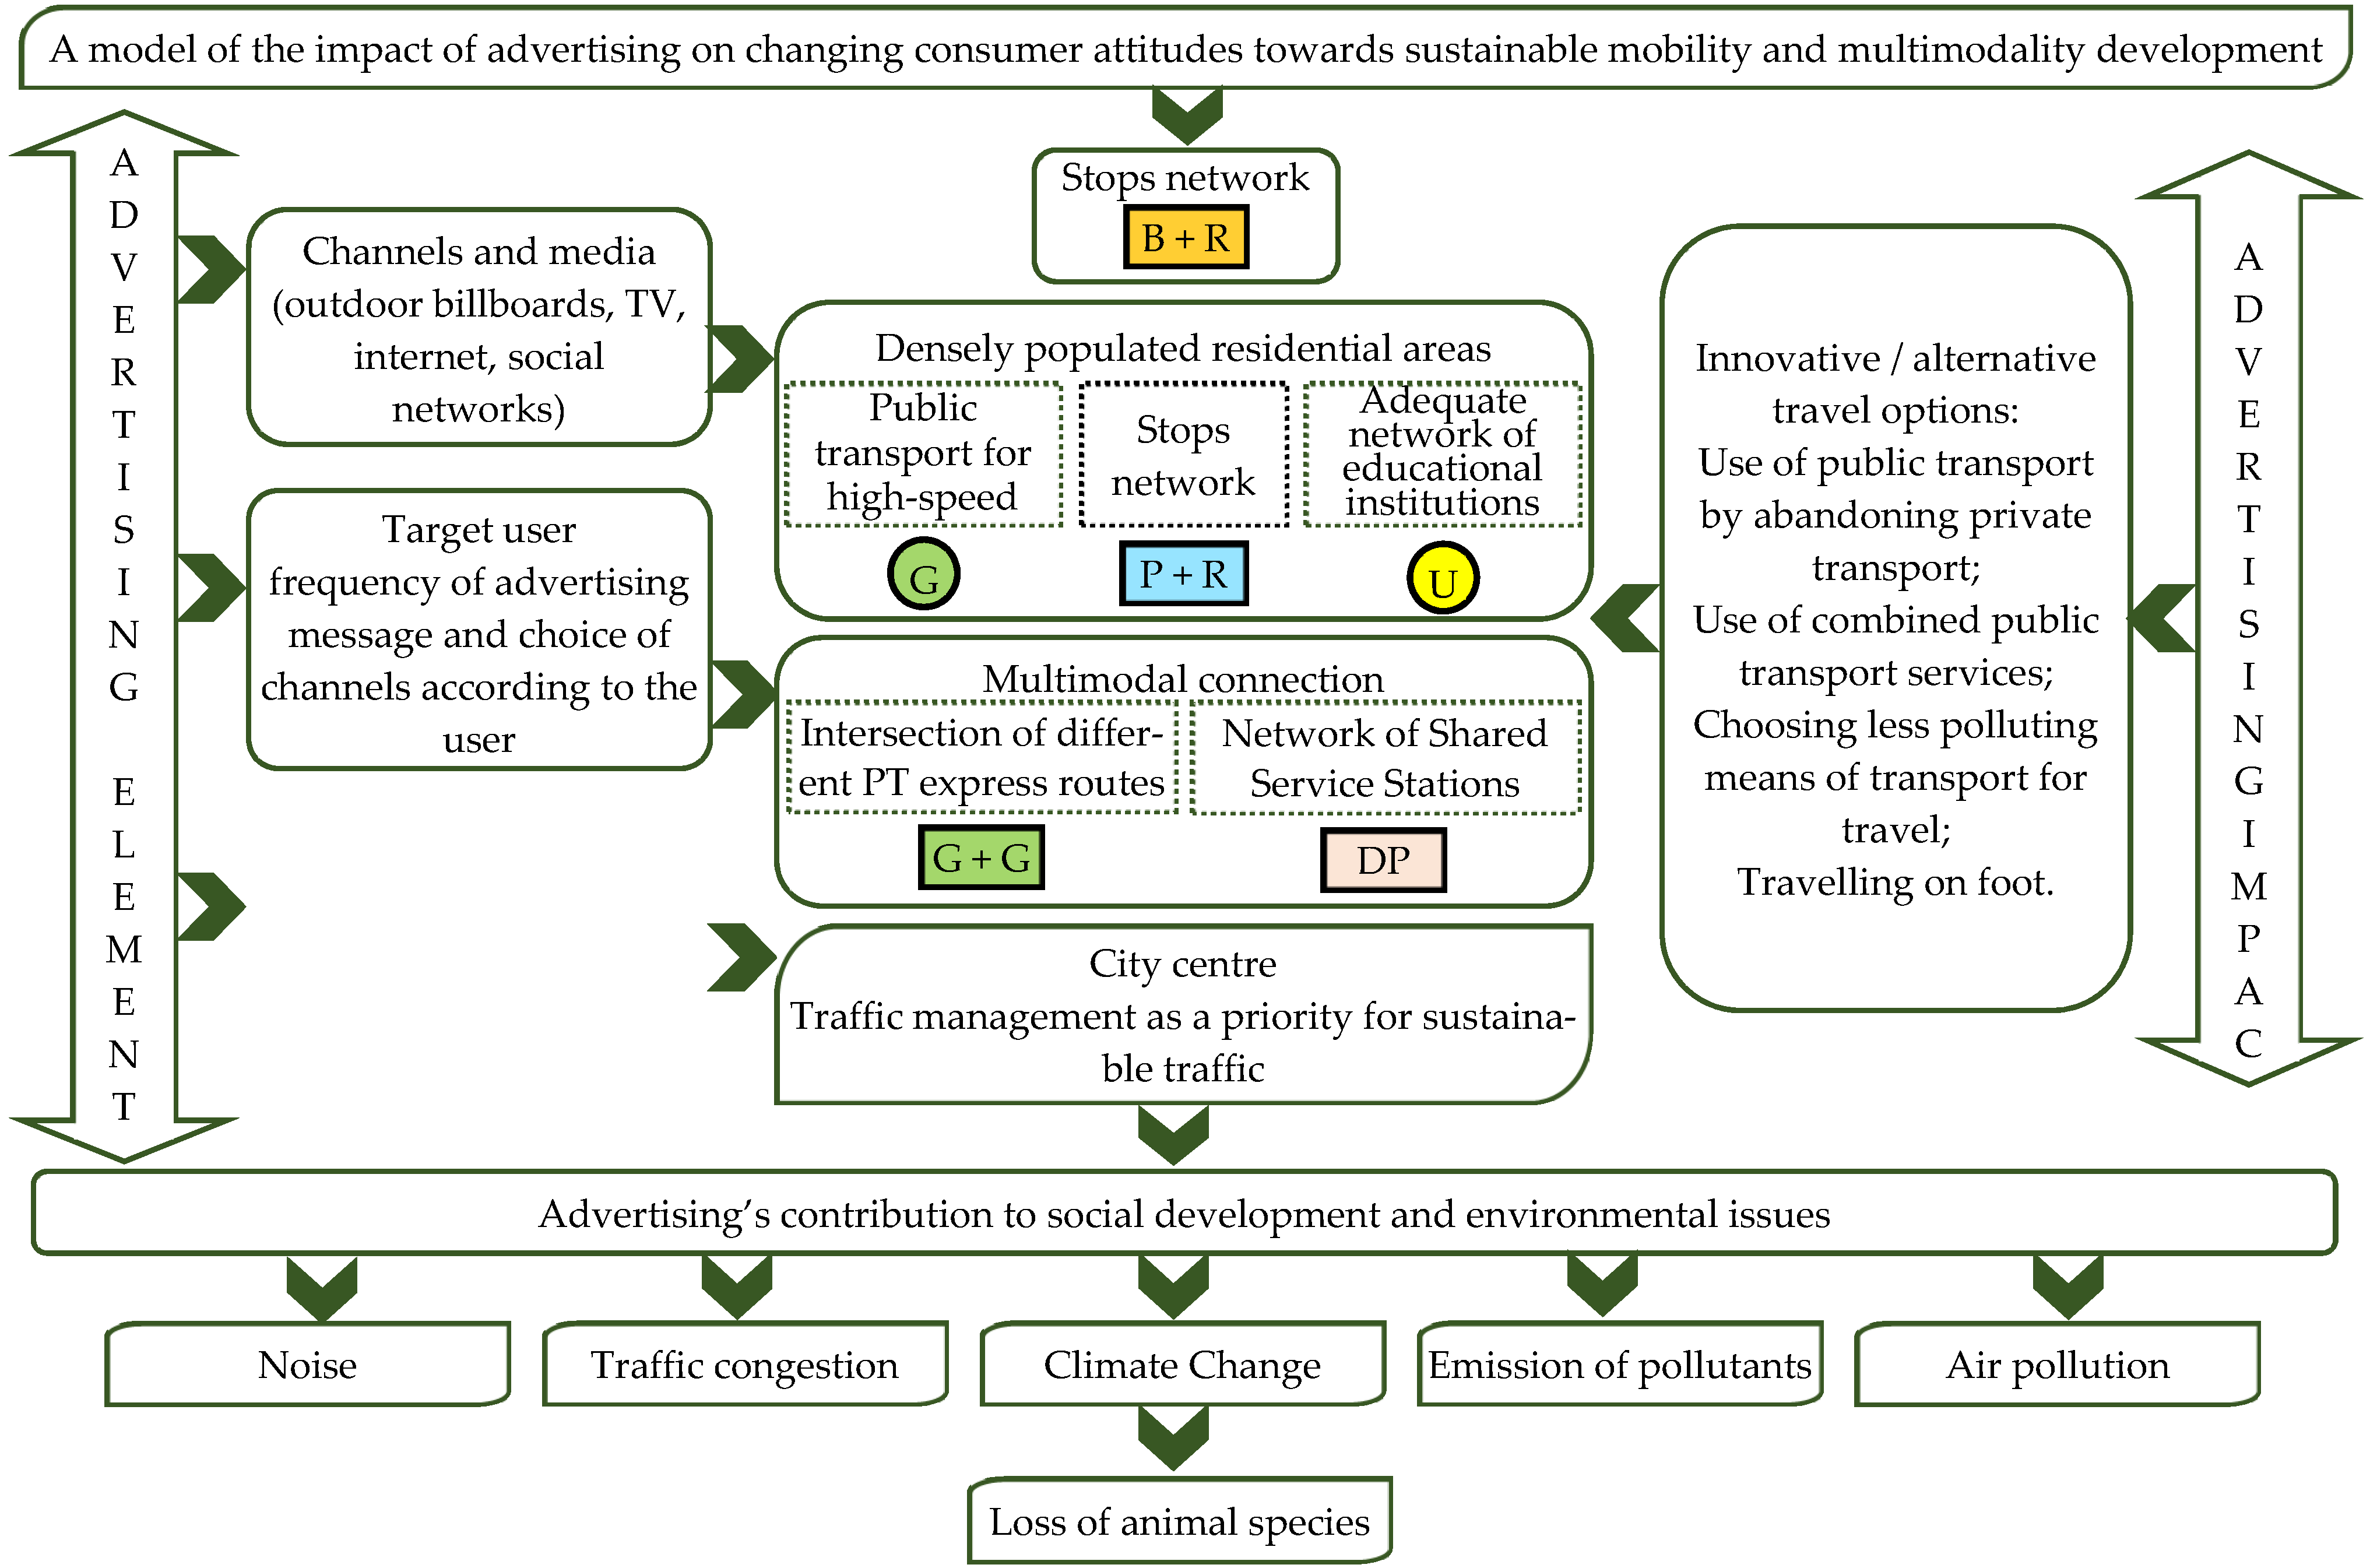
  • The literature review has shown that advertising can be an important tool not only in the modern world of trade and business, but can also contribute to the development of sustainable mobility and multimodality, encourage consumers to use combined public transport services, contribute to sustainability, and help to reduce the level of pollution generated by the ever-growing transport sector by tackling environmental issues and problems. The literature analysis showed that green marketing and information campaigns in public transport help passengers to make informed decisions that can contribute to environmental protection. This is important; conscious passengers pay attention to the services they buy and use, which will increase sales. Green marketing raises awareness of important environmental or social issues.
  • The study shows the importance of advertising in the development of sustainable mobility and multimodality in the urban transport system:
    -
    The study found that advertisements promoting sustainable mobility receive the least attention and only a small proportion of the participants in the study associate advertisements with the development of sustainable mobility and multimodality in the urban transport system;
    -
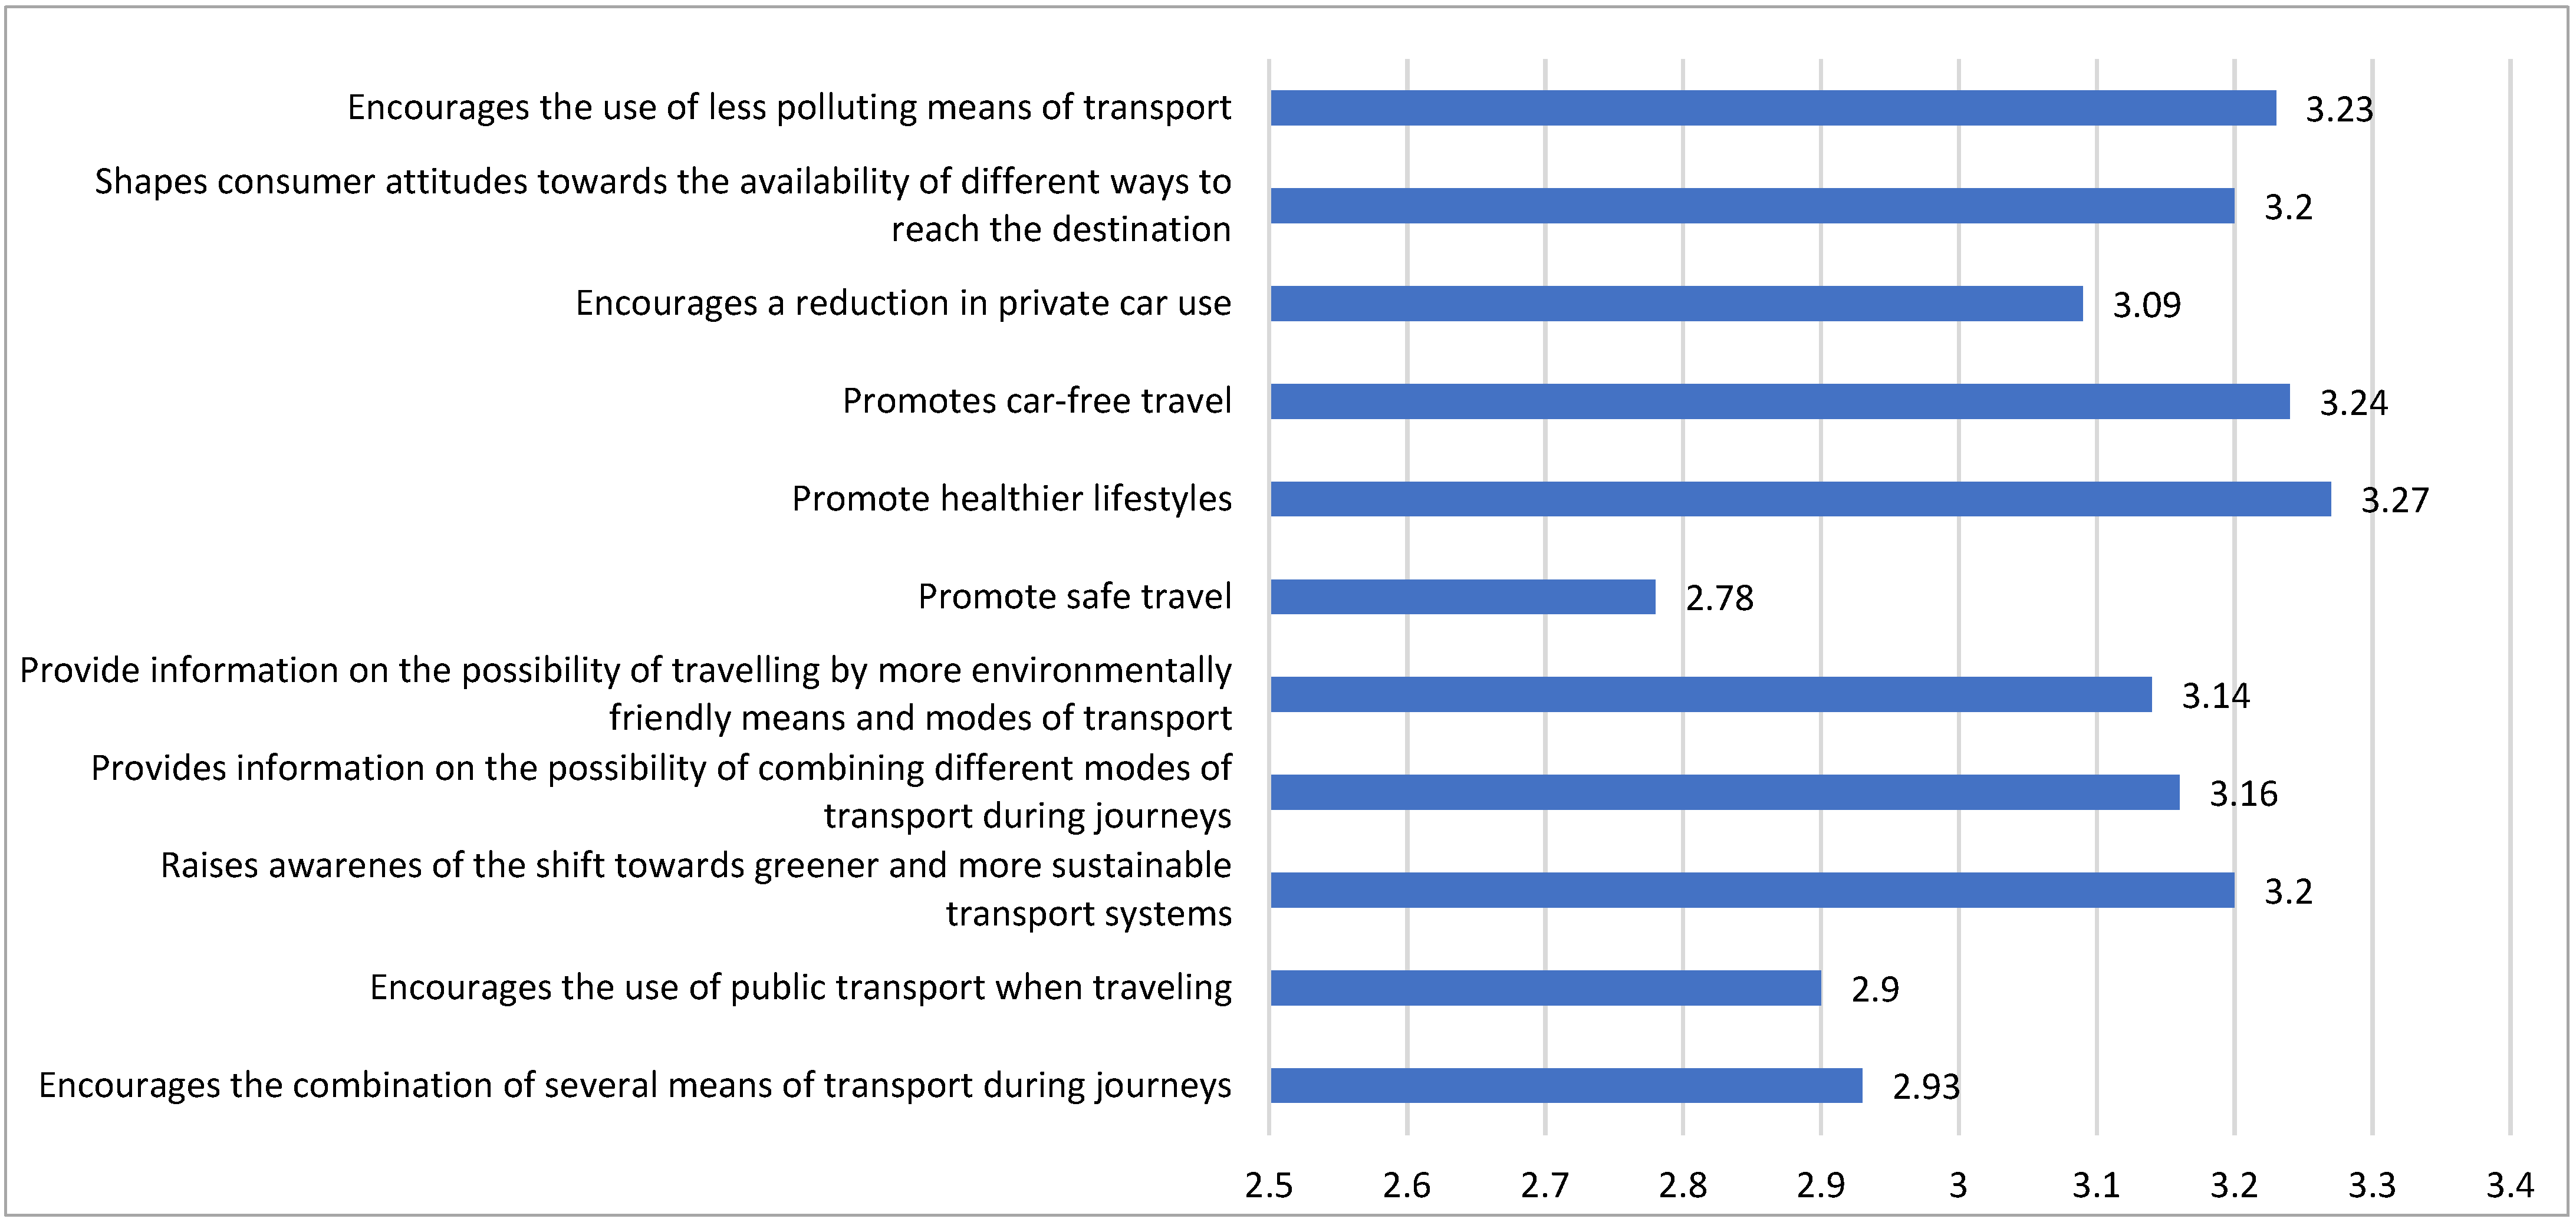
    The results of the study showed that advertisements promoting sustainable mobility and multimodality are most often associated with promoting healthier lifestyles, travel, and the choice to use less polluting means of transport, while advertisements of this type are least often identified with promoting safe travel, using public transport during journeys, and combining several modes of transport;
    -
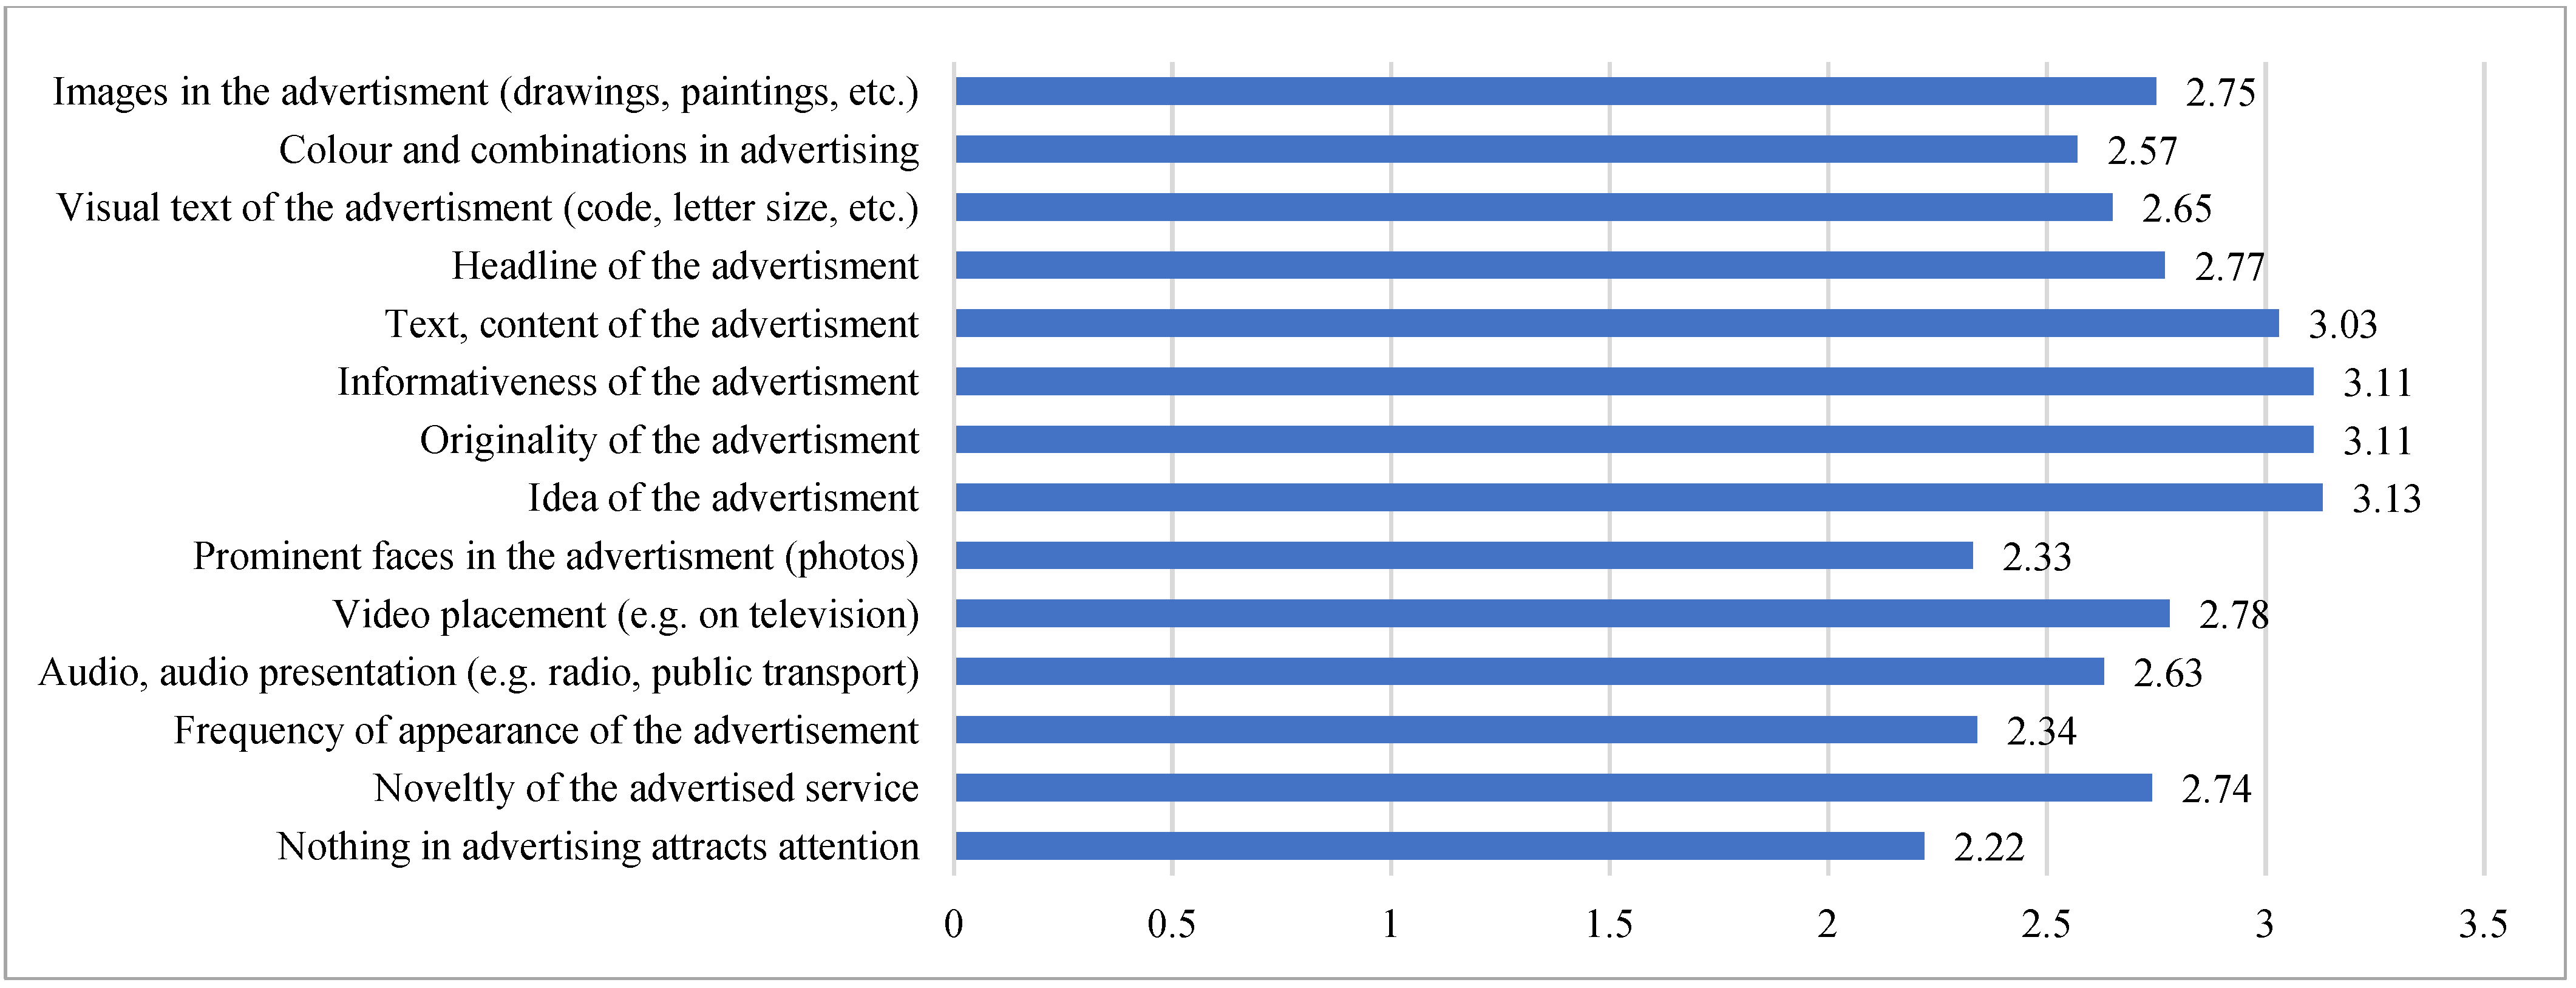
    Statistical analysis of the data showed that the idea of the advertisement, its originality, informativeness and the text and content of the advertisement are the most influential factors in the decision to travel based on sustainable mobility and multimodality, while the familiar faces in the advertisement and the frequency with which the advertisement is displayed were identified as the least influential factors in the decision to travel based on sustainable mobility and multimodality.
3.
In order to anticipate the development of sustainable mobility and multimodality in the urban transport system through the use of an advertising information system, it was found that:
-
The content, originality and informativeness of the advertisement, as well as the idea of the advertisement, are the most important factors in promoting sustainable mobility and multimodality, while the presence of familiar faces or pictures in the advertisement, the colour combinations in the advertisement, and the size of the poster in the advertisement are the least important factors in promoting sustainable mobility and multimodality;
-
TV, internet, including e-mail advertising, radio, and outdoor billboards are among the most effective communication tools for promoting sustainable mobility and multimodality, while telephone text messages, leaflets or flyers, and mail advertising are rated as the least effective advertising channels for promoting sustainable mobility and multimodality.
4.
It is recommended that the Association of Lithuanian Municipalities, in cooperation with Lithuanian municipalities, engage in the dissemination of sustainable mobility and multimodality, to solve the problems of sustainable mobility and multimodality in the urban transport system by carrying out research.
5.
In the future, the research carried out by the authors could be developed by applying the qualitative research method and analyse in more detail the possibilities of applying advertising in solving the problem of ensuring sustainable mobility and multimodality in the transport system.

Author Contributions

Conceptualization, A.J. and M.I.; methodology, A.J., M.I. and K.S.; validation, A.J., M.I. and K.S.; formal analysis, A.J. and K.S.; investigation, A.J., M.I. and K.S.; resources, A.J. and M.I.; data curation, A.J., M.I. and K.S.; writing—original draft preparation, A.J.; writing—review and editing, A.J., M.I. and K.S.; visualization, A.J.; supervision, K.S. and M.I. All authors have read and agreed to the published version of the manuscript.

Funding

This research received no external funding.

Institutional Review Board Statement

Not applicable.

Informed Consent Statement

Written informed consent has been obtained from the patient(s) to publish this paper.

Data Availability Statement

Not applicable.

Conflicts of Interest

The authors declare no conflict of interest.

References

  1. Jarašūnienė, A.; Česnulaitis, D. Improving the Efficiency of the Vilnius City Transport System in the Context of Sustainable Mobility and Multimodality. Balt. J. Road Bridge Eng. 2021, 16, 31–46. [Google Scholar] [CrossRef]
  2. Juškevičius, P.; Valeika, V. Transport Systems of Lithuanian Cities [Lietuvos Miestų Susisiekimo Sistemos]; Technika: Vilnius, Lithuania, 2019. [Google Scholar] [CrossRef]
  3. Samašonok, K.; Jarašūnienė, A.; Išoraitė, M. A study of the satisfaction of the population of major Lithuanian cities with public transport services. Bus. Theory Pract. 2021, 22, 392–405. [Google Scholar] [CrossRef]
  4. Baltrėnas, P.; Vaitiekūnas, P.; Jordaneh, S.; Vasarevičius, S. Modelling of motor transport exhaust gas influence on the atmosphere. J. Environ. Eng. Landsc. 2008, 16, 65–75. [Google Scholar] [CrossRef]
  5. Bignal, K.L.; Ashmore, M.R.; Headley, A.D. Effects of air pollution from road transport on growth and physiology of six transplanted bryophyte species. Environ. Pollut. 2008, 156, 332–340. [Google Scholar] [CrossRef] [PubMed]
  6. Rodrigue, J.P.; Comtois, C.; Slack, B. The Geography of Transport Systems; Routledge: London, UK, 2006. [Google Scholar]
  7. World Health Organizacion. 2020. Available online: https://www.who.int/phe/health_topics/outdoorair/databases/en/ (accessed on 10 September 2022).
  8. European Commission. Transport in the European Union: Current Trends and Issues. April 2018. Available online: https://ec.europa.eu/transport/sites/transport/files/2018-transport-in-the-eu-current-trends-and-issues.pdf (accessed on 11 September 2022).
  9. Barauskas, A. Assessment and Modelling of Urban Bypasses’ Influence on Transport Flows Distribution in Street Network [Miesto Aplinkkelių Poveikio Transporto Srautų Pasiskirstymui Gatvių Tinkle Vertinimas ir Modeliavimas]; Technika: Vilnius, Lithuania, 2019. [Google Scholar] [CrossRef]
  10. Jeržemskis, A.; Jaržemskis, V. Passenger Transport [Keleivinis Transportas]; Technika: Vilnius, Lithuania, 2017. [Google Scholar] [CrossRef]
  11. Bazaras, D.; Jarašūnienė, A.; Norkūnas, M. Improvement of the Urban Transport System by Developing the Platform “Park and Ride” in Vilnius City. In Proceedings of the International Conference TRANSBALTICA: Transportation Science and Technology, Vilnius, Lithuania, 15–16 September 2022; Springer: Cham, Switzerland, 2022. [Google Scholar] [CrossRef]
  12. Cascetta, E. Modeling Transportation Systems: Preliminary Concepts and Application Areas. Transp. Syst. Anal. 2009, 29, 1–27. [Google Scholar] [CrossRef]
  13. de Dios Ortuzar, J.; Willumsen, L.G. Modelling Transport; John Wiley & Sons Ltd.: London, UK, 2009. [Google Scholar]
  14. Ceder, A. Public Transit Planning and Operation: Theory, Modeling and Practice; Butterworth-Heinemann: Oxford, UK, 2007. [Google Scholar]
  15. Agyapong, F.; Ojo, T.K. Managing traffic congestion in the Accra Central Market, Ghana. J. Urban Manag. 2018, 7, 85–96. [Google Scholar] [CrossRef]
  16. Koźlak, A.; Wach, D. Causes of traffic congestion in urban areas. Case of Poland. In Proceedings of the SHS Web of Conferences, Samara, Russia, 26–27 November 2018; EDP Sciences: Les Ulis, France, 2018; Volume 57, p. 01019. [Google Scholar] [CrossRef]
  17. Caballini, C.; Corazza, M.V.; Costa, V.; Delponte, I.; Olivari, E. Assessing the Feasibility of MaaS: A Contribution from Three Italian Case Studies. Sustainability 2022, 14, 16743. [Google Scholar] [CrossRef]
  18. Leung, D.Y.C.; Mok, W.C.; Lee, Y.L. Challenges and Considerations in Migrating towards a Sustainable e-Mobility City. In Proceedings of the 2021 9th International Conference on Smart Grid and Clean Energy Technologies (ICSGCE), Sarawak, Malaysia, 15–17 October 2021; IEEE: Piscataway, NJ, USA, 2021; pp. 62–67. [Google Scholar] [CrossRef]
  19. Chamier-Gliszczyński, N. Modeling system mobility in urban areas. In Proceedings of the 11th Carpathian Logistics Congress—Wellness Hotel Step, Bojnice, Slovakia, 7–9 November 2012; TANGER Ltd.: Ostrava, Czech Republic, 2012; pp. 501–508. [Google Scholar]
  20. Vitetta, A. Sustainable Mobility as a Service: Framework and Transport System Models. Information 2022, 13, 346. [Google Scholar] [CrossRef]
  21. Bassi, A.M.; Pallaske, G.; Niño, N.; Casier, L. Does Sustainable Transport Deliver Societal Value? Exploring Concepts, Methods, and Impacts with Case Studies. Future Transp. 2022, 2, 115–134. [Google Scholar] [CrossRef]
  22. Inturri, G.; Giuffrida, N.; Le Pira, M.; Fazio, M.; Ignaccolo, M. Linking Public Transport User Satisfaction with Service Accessibility for Sustainable Mobility Planning. Int. J. Geo-Inf. 2021, 10, 235. [Google Scholar] [CrossRef]
  23. Roman, M. Sustainable Transport: A State-of-the-Art Literature Review. Energies 2022, 15, 8997. [Google Scholar] [CrossRef]
  24. Macioszek, E.; Kurek, A. The use of a park and ride system a case study based on the City of Cracow (Poland). Energies 2020, 13, 3473. [Google Scholar] [CrossRef]
  25. Dijk, M.; Montalvo, C. Policy frames of Park-and-Ride in Europe. J. Transp. Geogr. 2011, 19, 1106–1119. [Google Scholar] [CrossRef]
  26. Karamychev, V.; van Reeven, P. Park-and-ride: Good for the city, good for the region? Reg. Sci. Urban Econ. 2011, 41, 455–464. [Google Scholar] [CrossRef]
  27. Parkhurst, G.; Meek, S. The Effectiveness of Park-and-Ride as a Policy Measure for More Sustainable Mobility. Transp. Sustain. 2014, 5, 185–211. [Google Scholar] [CrossRef]
  28. Cheng, Z.A.; Pang, M.-S.; Pavlou, P.A. Mitigating Traffic Congestion: The Role of Intelligent Transportation Systems. Inf. Syst. Res. 2020, 31, 653–674. [Google Scholar] [CrossRef]
  29. Janušová, L.; Čičmancová, S. Improving Safety of Transportation by Using Intelligent Transport Systems. Procedia Eng. 2016, 134, 14–22. Available online: https://www.researchgate.net/publication/293195159_Improving_Safety_of_Transportation_by_Using_Intelligent_Transport_Systems (accessed on 1 April 2020). [CrossRef]
  30. Khorasani, G.; Tatari, A.; Yadollahi, A.; Rahimi, M. Evaluation of Intelligent Transport System in Road Safety. IJCEBS 2013, 1, 110–118. Available online: https://www.researchgate.net/profile/Ashkan-Tatari/publication/309189024_Evaluation_of_Intelligent_Transport_System_in_Road_Safety/links/5803f30708ae6c2449f962f9/Evaluation-of-Intelligent-Transport-System-in-Road-Safety.pdf (accessed on 10 September 2022).
  31. Fishman, E. Cycling as transport. Transp. Rev. 2016, 36, 1–8. [Google Scholar] [CrossRef]
  32. Pojani, D.; Stead, D. Sustainable Urban Transport in the Developing World: Beyond Megacities. Sustainability 2015, 7, 7784–7805. [Google Scholar] [CrossRef]
  33. Vaiciute, K.; Katiniene, A.; Bureika, G. The Synergy between Technological Development and Logistic Cooperation of Road Transport Companies. Sustainability 2022, 14, 14561. [Google Scholar] [CrossRef]
  34. Malasek, J.; Jaździk-Osmólska, A. Decalogue for sustainable urban transport strategy. In WIT Transactions on the Built Environment. Urban Transport XVIII; WIT Press: Southampton, UK, 2012; Volume 128, pp. 109–117. [Google Scholar] [CrossRef]
  35. Melgar, L.M.B.; Elsner, R.J.F. A Review of Advertising in the 21st Century. Int. J. Bus. Adm. 2016, 7, 67–78. [Google Scholar] [CrossRef]
  36. Onișor, L.-F.; Ioniță, D. How advertising avoidance affects visual attention and memory of advertisements. J. Bus. Econ. Manag. 2021, 22, 656–674. [Google Scholar] [CrossRef]
  37. Korenkova, M.; Maros, M.; Levicky, M.; Fila, M. Consumer Perception of Modern and Traditional Forms of Advertising. Sustainability 2020, 12, 9996. [Google Scholar] [CrossRef]
  38. Wright, E.; Khanfar, N.M.; Harrington, C.; Kizer, L.E. The Lasting Effects of Social Media Trends on Advertising. J. Bus. Econ. 2010, 8, 73–80. [Google Scholar] [CrossRef]
  39. Nouzovský, L.; Vrtal, P.; Kohout, T.; Svatý, Z. Using the Eye Tracking Method to Determine the Risk of Advertising Devices on Drivers’ Cognitive Perception. Appl. Sci. 2022, 12, 6795. [Google Scholar] [CrossRef]
  40. Eram, M. Importance and Efficacious of Advertisement. J. Emerg. Technol. Innov. Res. (JETIR) 2020, 7, 285–291. [Google Scholar]
  41. Sinclair, J. Advertising, the Media, and Globalization. Media Ind. J. 2015, 1, 43–47. [Google Scholar] [CrossRef]
  42. Busen, S.M.S.; Mustaffa, C.S. The Role of Interactive Advertisements in Developing Consumerbased Brand Equity: A Conceptual Discourse. Procedia Soc. Behav. Sci. 2014, 155, 98–103. [Google Scholar] [CrossRef]
  43. Małecki, K.; Jankowski, J.; Szkwarkowski, M. Modelling the Impact of Transit Media on Information Spreading in an Urban Space Using Cellular Automata. Symmetry 2019, 11, 428. [Google Scholar] [CrossRef]
  44. Ziółkowska, M. Digital Transformation and Marketing Activities in Small and Medium-Sized Enterprises. Sustainability 2021, 13, 2512. [Google Scholar] [CrossRef]
  45. Schütze, C.; Schmidt, N.; Liimatainen, H.; Siefer, T. How to Achieve a Continuous Increase in Public Transport Ridership?—A Case Study of Braunschweig and Tampere. Sustainability 2020, 12, 8063. [Google Scholar] [CrossRef]
  46. Morfoulaki, M.; Myrovali, G.; Chatziathanasiou, M. Exploiting Marketing Methods for Increasing Participation and Engagement in Sustainable Mobility Planning. Sustainability 2022, 14, 4820. [Google Scholar] [CrossRef]
  47. Krstić, J.; Kostić-Stanković, M.; Cvijović, J. Green advertising and its impact on environmentally friendly consumption choices—A review. Industrija 2021, 49, 93–108. [Google Scholar] [CrossRef]
  48. Grillo, N.; Tokarczyk, J.; Hansen, E. Green advertising developments in the U.S. forest sector: A follow-up. For. Prod. J. 2008, 58, 40–46. [Google Scholar]
  49. Charter, M.; Peattie, K.; Ottman, J.; Polonsky, M. Marketing and Sustainability; Centre for Business Relationships, Accountability, Sustainability and Society (BRASS) Farnham: UK, 2002; Available online: http://www.cfsd.org.uk/smart-know-net/links/smart-know-net.pdf (accessed on 12 September 2022).
  50. Wang, J.; Li, A. The Impact of Green Advertising Information Quality Perception on Consumers’ Response: An Empirical Analysis. Sustainability 2022, 14, 13248. [Google Scholar] [CrossRef]
  51. Segev, S.; Fernandes, J.; Hong, C. Is Your Product Really Green? A Content Analysis to Reassess Green Advertising. J. Advert. 2016, 45, 85–93. [Google Scholar] [CrossRef]
  52. Primožič, L.; Kutnar, A. Sustainability Communication in Global Consumer Brands. Sustainability 2022, 14, 13586. [Google Scholar] [CrossRef]
  53. Nadanyiova, M. Green Marketing and its Use in a Transport Company. LOGI–Sci. J. Transp. Logist. 2018, 9, 58–69. [Google Scholar] [CrossRef]
  54. Redman, L.; Friman, M.; Gärling, T.; Hartig, T. Quality attributes of public transport that attract car users: A research review. Transp. Policy 2013, 25, 119–127. [Google Scholar] [CrossRef]
  55. Bernyte, S. Sustainability marketing communications based on consumer values and principles. Rev. Urban Reg. Dev. Stud. 2018, 3, 26–34. [Google Scholar] [CrossRef]
  56. Moravčíková, D.; Križanová, A.; Kliestikova, J.; Rypáková, M. Green Marketing as the Source of the Competitive Advantage of the Business. Sustainability 2017, 9, 2218. [Google Scholar] [CrossRef]
  57. Waqas, M.; Dong, Q.-L.; Ahmad, N.; Zhu, Y.; Nadeem, M. Understanding Acceptability towards Sustainable Transportation Behavior: A Case Study of China. Sustainability 2018, 10, 3686. [Google Scholar] [CrossRef]
  58. Majeed, M.U.; Aslam, S.; Murtaza, S.A.; Attila, S.; Molnár, E. Green Marketing Approaches and Their Impact on Green Purchase Intentions: Mediating Role of Green Brand Image and Consumer Beliefs towards the Environment. Sustainability 2022, 14, 11703. [Google Scholar] [CrossRef]
  59. Vilkaite-Vaitone, N.; Skackauskiene, I.; Díaz-Meneses, G. Measuring Green Marketing: Scale Development and Validation. Energies 2022, 15, 718. [Google Scholar] [CrossRef]
  60. García-Salirrosas, E.E.; Rondon-Eusebio, R.F. Green Marketing Practices Related to Key Variables of Consumer Purchasing Behavior. Sustainability 2022, 14, 8499. [Google Scholar] [CrossRef]
  61. Yang, S.; Chai, J. The Influence of Enterprises’ Green Marketing Behavior on Consumers’ Green Consumption Intention—Mediating Role and Moderating Role. Sustainability 2022, 14, 15478. [Google Scholar] [CrossRef]
  62. Ktisti, E.; Hatzithomas, L.; Boutsouki, C. Green Advertising on Social Media: A Systematic Literature Review. Sustainability 2022, 14, 14424. [Google Scholar] [CrossRef]
  63. Shabbir, M.S.; Bait Ali Sulaiman, M.A.; Hasan Al-Kumaim, N.; Mahmood, A.; Abbas, M. Green Marketing Approaches and Their Impact on Consumer Behavior towards the Environment—A Study from the UAE. Sustainability 2020, 12, 8977. [Google Scholar] [CrossRef]
  64. Mercade Mele, P.; Molina Gomez, J.; Garay, L. To Green or Not to Green: The Influence of Green Marketing on Consumer Behaviour in the Hotel Industry. Sustainability 2019, 11, 4623. [Google Scholar] [CrossRef]
  65. Jones, P.; Clarke-Hill, C.; Comfort, D.; Hillier, D. Marketing and sustainability. Mark. Intell. Plan. 2007, 26, 123–130. [Google Scholar] [CrossRef]
  66. Valackienė, A.; Mikėnė, S. Sociological Research: Methodology and Performative Methodology [Sociologinis Tyrimas: Metodologija ir Atlikimo Metodika; Technologija: Kaunas, Lithuania, 2010. [Google Scholar]
Figure 1. Making journeys using “Park and ride” (based on [24]).
Futuretransp 03 00013 g001
Figure 2. Model for improving the efficiency of the urban transport system (based on [1]).
Futuretransp 03 00013 g002
Figure 3. Attitudes towards advertising (n = 396; %). 1 Advertising provides information about the goods/services offered; 2 Advertising provides information about new goods/services; 3 Advertising keeps in mind the potential need for the product/service; 4 Advertising increases brand awareness of the product/service; 5 Advertising increases sales of the product/service; 6 Advertising encourages consumers to choose/buy the advertised product/service; 7 Advertising shapes your attitudes as a consumer towards product/service features and consumption; 8 Advertising influences the development of sustainable mobility and multimodality in cities; 9 Advertising provides information on the importance of sustainable mobility and multimodality; 10 Advertising provides information on innovative/alternative ways of travelling in cities; 11 Advertising encourages passengers to choose innovative/alternative ways of travelling in cities; 12 Advertising shapes passenger attitudes towards innovative/alternative travel modes; 13 Advertising has no benefit; 14 Advertising is not needed.
Futuretransp 03 00013 g003
Figure 4. Evaluation of advertisements promoting sustainable mobility and multimodality (n = 396; mean values (M), max = 5).
Futuretransp 03 00013 g004
Figure 5. Evaluation of advertising elements influencing the decision to travel based on sustainable mobility and multimodality (n = 396; mean values (M), max = 5).
Futuretransp 03 00013 g005
Figure 6. The advertising impact model.
Futuretransp 03 00013 g006
Table 1. Demographic assessments of subjects (n = 396; %).
GenderAge GroupResidence
Men n = 86 (21.7%)
Women n = 303 (76.5%)
Other n = 3 (0.8%)
Gender not specified n = 4 (1%)
Up to 45 years n = 124 (31.3%)
From the age of 46 up to 65 n = 264 (66.7%)
From 66 and older n = 5 (1.3%)
Age not specified n = 3 (0.7%)
Vilnius n = 185 (46.8%)
Kaunas n = 92 (23.2%)
Klaipeda n = 53 (13.4%)
Šiauliai n = 37 (9.3%)
Panevezys n = 29 (7.3%)
Table 2. Rating of the frequency of attention-grabbing advertisements (n = 396; mean values (M; max = 5), (%)).
Average Value (M)Attention Is Very Often PaidFrequent AttentionAttention Is Sometimes DrawnAttention Is Rarely PaidTotally Ignored
Advertisements promoting health, personal hygiene, etc.3.153 (14)106 (28)100 (26.4)67 (17.7)53 (14)
Advertising to promote sustainable mobility (reducing pollution, encouraging use of public transport, etc.)2.8641 (10.9)81 (21.5)113 (30)70 (18.6)72 (19.1)
Education-related advertising (e.g., training, courses, etc.)3.2479 (20.7)100 (26.2)97 (25.5)47 (12.3)58 (15.2)
Advertisements related to sales promotions (sales, discounts, etc.)3.1782 (21.6)86 (22.7)91 (24)55 (14.5)65 (17.2)
Adverts related to entertainment, leisure, travel, events, etc.3.4797 (25.5)104 (27.4)97 (25.5)48 (12.6)34 (8.9)
Advertising that promotes consumer behaviour (e.g., avoiding harmful habits, etc.)2.4728 (7.5)64 (17.1)84 (22.5)81 (21.7)117 (31.3)
Advertisements promoting food products3.0879 (20.9)75 (19.8)93 (24.6)62 (16.4)69 (18.3)
Table 3. Evaluation of advertisements promoting sustainable mobility and multimodality in different age groups (t-test for independent samples).
Up to 45 Years of Age Group46 years Old Aged and Over Grouptp
Encourages the combination of several means of transport during journeys3.041.342.871.381.1460.253
Encourages the use of public transport when travelling3.01.312.841.371.0390.3
Raises awareness of the shift towards greener and more sustainable transport systems3.341.343.131.421.3340.183
Provides information on the possibility of combining different modes of transport during journeys3.211.273.131.350.5410.589
Provides information on the possibility of travelling by more environmentally friendly means and modes of transport3.251.253.091.391.0170.31
Promotes safe travel2.891.332.721.331.1450.253
Promotes healthier lifestyles3.341.313.241.430.6620.508
Encouraging car-free travel3.351.343.191.520.9820.327
Encourages the reduction of own-vehicle flows3.151.293.051.430.6330.527
Shapes the consumer’s perception of the possibility of different ways of reaching the destination3.41.253.091.42.0020.052
Encourages the use of less polluting means of transport3.381.313.161.461.3950.164
Table 4. Evaluation of advertising elements influencing the decision to travel on the basis of sustainable mobility and multimodality for different age groups (t-test for independent samples).
Up to 45 Years of Age Group46 Years Old Aged and Over Grouptp
Images (drawings, paintings, etc.) in advertising2.931.392.661.41.7110.088
Colour and combinations in advertising2.841.372.431.332.6430.009
The visual text of the advertisement (font, letter size, etc.)2.891.372.531.322.3850.018
Advertising headline2.921.442.691.391.390.165
Advertising text, content3.151.492.971.461.0960.274
Informativeness of advertising3.231.483.051.481.070.286
Originality of advertising3.341.483.011.491.9670.05
Advertising idea3.331.53.041.491.6940.091
Famous faces in advertising (photos)2.491.32.251.291.6010.11
Video presentation (e.g., on TV)2.911.442.721.461.1520.25
Audio, audio presentation (e.g., radio, public transport)2.811.342.531.41.7660.078
Frequency of advertising message2.541.282.241.232.10.036
Novelty of the advertised service2.821.322.71.390.7250.469
Nothing in the ad grabs my attention2.171.242.251.32−0.5430.587
Table 5. Evaluation of elements in advertising that promote sustainable mobility and multimodality.
Average Value (M)I Would Very Much EncourageEncourageNeither Encourage nor DiscourageWould Not EncourageTotally Discourage
The images (drawings, paintings, etc.) in the advertisement3.2173 (20.8)87 (24.8)91 (25.9)41 (11.7)59 (16.8)
The visual text of the advertisement (font, letter size, etc.)3.0354 (15.5)81 (23.3)99 (28.4)48 (13.8)66 (19)
Famous faces in advertising (photos)2.7146 (13.3)59 (17.1)83 (24)65 (18.8)93 (26.9)
Combinations of colours in advertising2.9942 (12.2)87 (25.2)104 (30.1)51 (14.8)61 (17.7)
Advertising (poster) size2.9845 (13.2)82 (24)106 (31)40 (11.7)69 (20.2)
Advertising design3.2868 (19.7)93 (27)101 (29.3)34 (9.9)49 (14.2)
Advertising content3.53103 (29.1)101 (28.5)78 (22)24 (6.8)48 (13.6)
Advertising headline3.2981 (23.3)91 (26.1)83 (23.9)32 (9.2)61 (17.5)
Advertising storyline3.4185 (24.4)100 (28.7)83 (23.9)33 (9.5)47 (13.5)
Informativeness of advertising3.54113 (32.2)83 (23.6)84 (23.9)22 (6.3)49 (14)
Originality of advertising3.56113 (31.9)89 (25.1)82 (23.2)24 (6.8)46 (13)
Advertising idea3.52109 (31.9)86 (24.6)81 (23.2)23 (6.6)50 (14.3)
Video presentation3.3281 (23.5)97 (28.1)79 (22.9)28 (8.1)60 (17.4)
Audio presentation (e.g., background music)3.1560 (17.5)89 (26)95 (27.8)37 (10.8)61 (17.8)
Table 6. Evaluation of advertising elements promoting sustainable mobility and multimodality in different age groups (t-test for independent samples).
Up to 45 Years of Age Group46 Years Old Aged and Over Grouptp
The images (drawings, paintings, etc.) in the advertisement3.31.363.161.350.8910.374
The visual text of the advertisement (font, letter size, etc.)3.181.342.951.321.5360.126
Familiar faces in the advertisements (photos)2.911.372.611.371.9420.05
Colours and combinations of colours in the advertisements3.131.282.931.261.4110.159
Size of advertisement (poster)3.141.252.91.331.5850.114
Design of the advertisement3.371.283.241.290.8850.377
Content of the advertisement3.621.353.491.330.8840.377
Headline of the advertisement3.341.393.261.380.5180.605
Storyline of the advertisement3.561.363.341.291.4470.149
Informativeness of the advertisement3.531.363.541.37−0.060.953
Originality of the advertisement3.611.343.541.350.4950.621
Idea of the advertisement3.621.43.471.350.9610.337
Video presentation3.371.343.31.40.460.646
Audio presentation (e.g., background music)3.231.273.11.360.8430.4
Table 7. Assessment of the means and channels through which advertising promotes sustainable mobility and multimodality.
Average Value (M)I Would Very Much EncourageEncourageNeither Encourage nor DiscourageWould Not EncourageTotally Discouraged
Press (newspapers, magazines, etc.)2.6535 (9.9)50 (14.2)109 (30.9)75 (21.2)84 (23.8)
Promotional leaflets, flyers2.2919 (5.4)36 (10.3)90 (25.8)88 (25.2)116 (33.2)
Posters2.8236 (10.2)72 (20.3)106 (29.9)71 (20.1)69 (19.5)
Placards2.949 (14.1)67 (19.3)105 (30.2)56 (16.1)71 (20.4)
Postal advertising2.1315 (4.3)26 (7.5)88 (25.3)81 (23.3)138 (39.7)
Outdoor billboards3.1861 (17.2)93 (26.3)102 (28.8)44 (12.4)54 (15.3)
Notice boards2.6227 (7.7)52 (14.9)116 (33.1)72 (20.6)83 (23.7)
Radio3.2881 (22.7)80 (22.4)105 (29.4)38 (10.6)53 (14.8)
Television3.71140 (38.4)84 (23)74 (20.3)27 (7.4)40 (11)
Newsletters2.5629 (8.3)53 (15.2)106 (30.4)56 (16)105 (30.1)
Internet (including e-mail advertising)3.4105 (29.4)83 (23.2)74 (20.7)37 (10.4)58 (16.2)
Short messages by phone2.3525 (7.2)49 (14.1)76 (21.8)69 (19.8)129 (37.1)
Shop displays3.0148 (13.6)80 (22.7)109 (31)57 (16.2)58 (16.5)
Various events (promotions, exhibitions, fairs)3.1563 (17.8)83 (23.5)106 (30)47 (13.3)54 (15.3)
Advertising at public transport stops2.947 (13.4)70 (20)97 (27.7)75 (21.4)61 (17.4)
Advertising on public transport2.8952 (14.7)66 (18.7)98 (27.8)66 (18.7)71 (20.1)
Advertising in public transport2.7237 (10.7)64 (18.4)96 (27.7)67 (19.3)83 (23.9)
Advertising by opinion formers2.4636 (10.3)41 (11.8)86 (24.7)69 (19.8)116 (33.3)
Table 8. Evaluation of the information tools and channels where advertising would most promote sustainable mobility and multimodality, for different age groups (t-test for independent samples).
Up to 45 Years of Age Group46 Years Old Aged and Over Grouptp
Print (newspapers, magazines etc.)2.711.352.621.220.6770.499
Leaflets and flyers2.391.242.241.161.1230.262
Banners2.771.262.841.25−0.5120.609
Posters2.961.322.881.320.5420.588
Direct mail2.221.232.091.110.9880.324
Outdoor billboards3.341.313.11.281.6610.098
Noticeboards2.571.252.651.2−0.5560.579
Radio3.321.313.251.340.4180.676
Television3.751.293.681.360.4390.661
Newsletters2.671.342.51.261.1190.264
Internet (including email advertising)3.541.413.331.421.3140.19
SMS by telephone2.471.332.291.281.210.227
Shop windows3.021.313.01.240.0870.93
Various events (promotions, exhibitions, fairs)3.281.283.081.31.4180.157
Advertising at public transport stops3.041.292.831.271.4690.143
Advertisements on public transport3.011.32.831.341.2050.229
Public transport advertising2.931.312.611.282.1690.031
Opinion leaders’ advertising2.951.42.21.235.1740.001
Disclaimer/Publisher’s Note: The statements, opinions and data contained in all publications are solely those of the individual author(s) and contributor(s) and not of MDPI and/or the editor(s). MDPI and/or the editor(s) disclaim responsibility for any injury to people or property resulting from any ideas, methods, instructions or products referred to in the content.

