
Benefits of Shared-Fleet Horizontal Logistics Collaborations: A Case Study of Patient Service Vehicles Collecting Pathology Samples in a Public Sector Healthcare Setting

Abstract
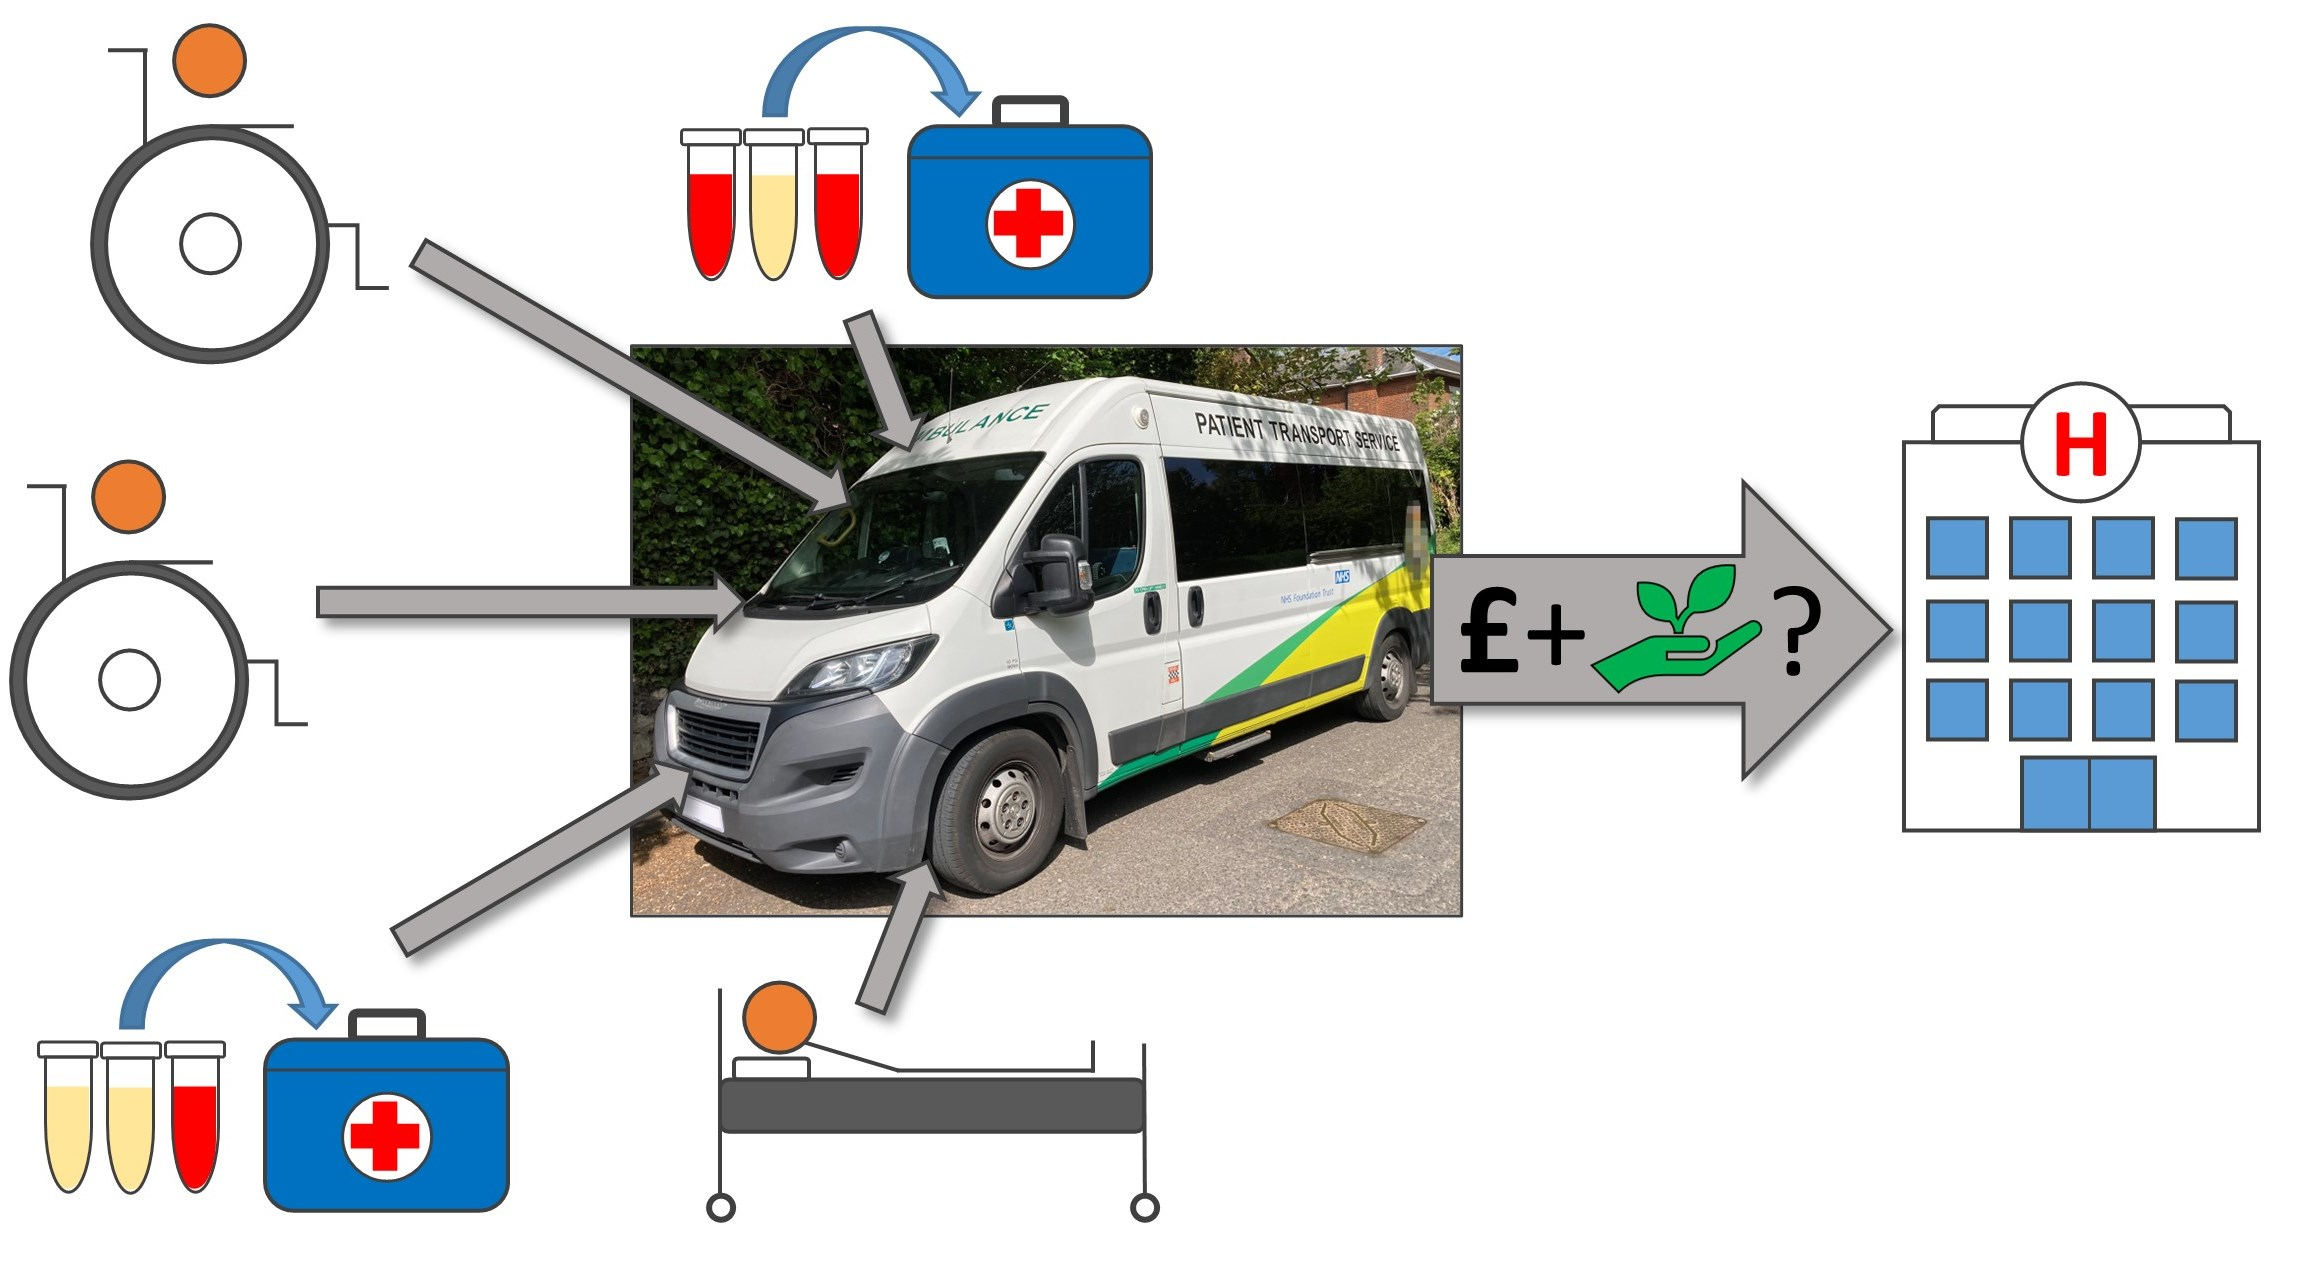
:1. Introduction
2. Previous Research
2.1. Shared-Fleet Collaborations
2.2. Benefits of Shared-Fleet Collaborations
2.3. Review Summary
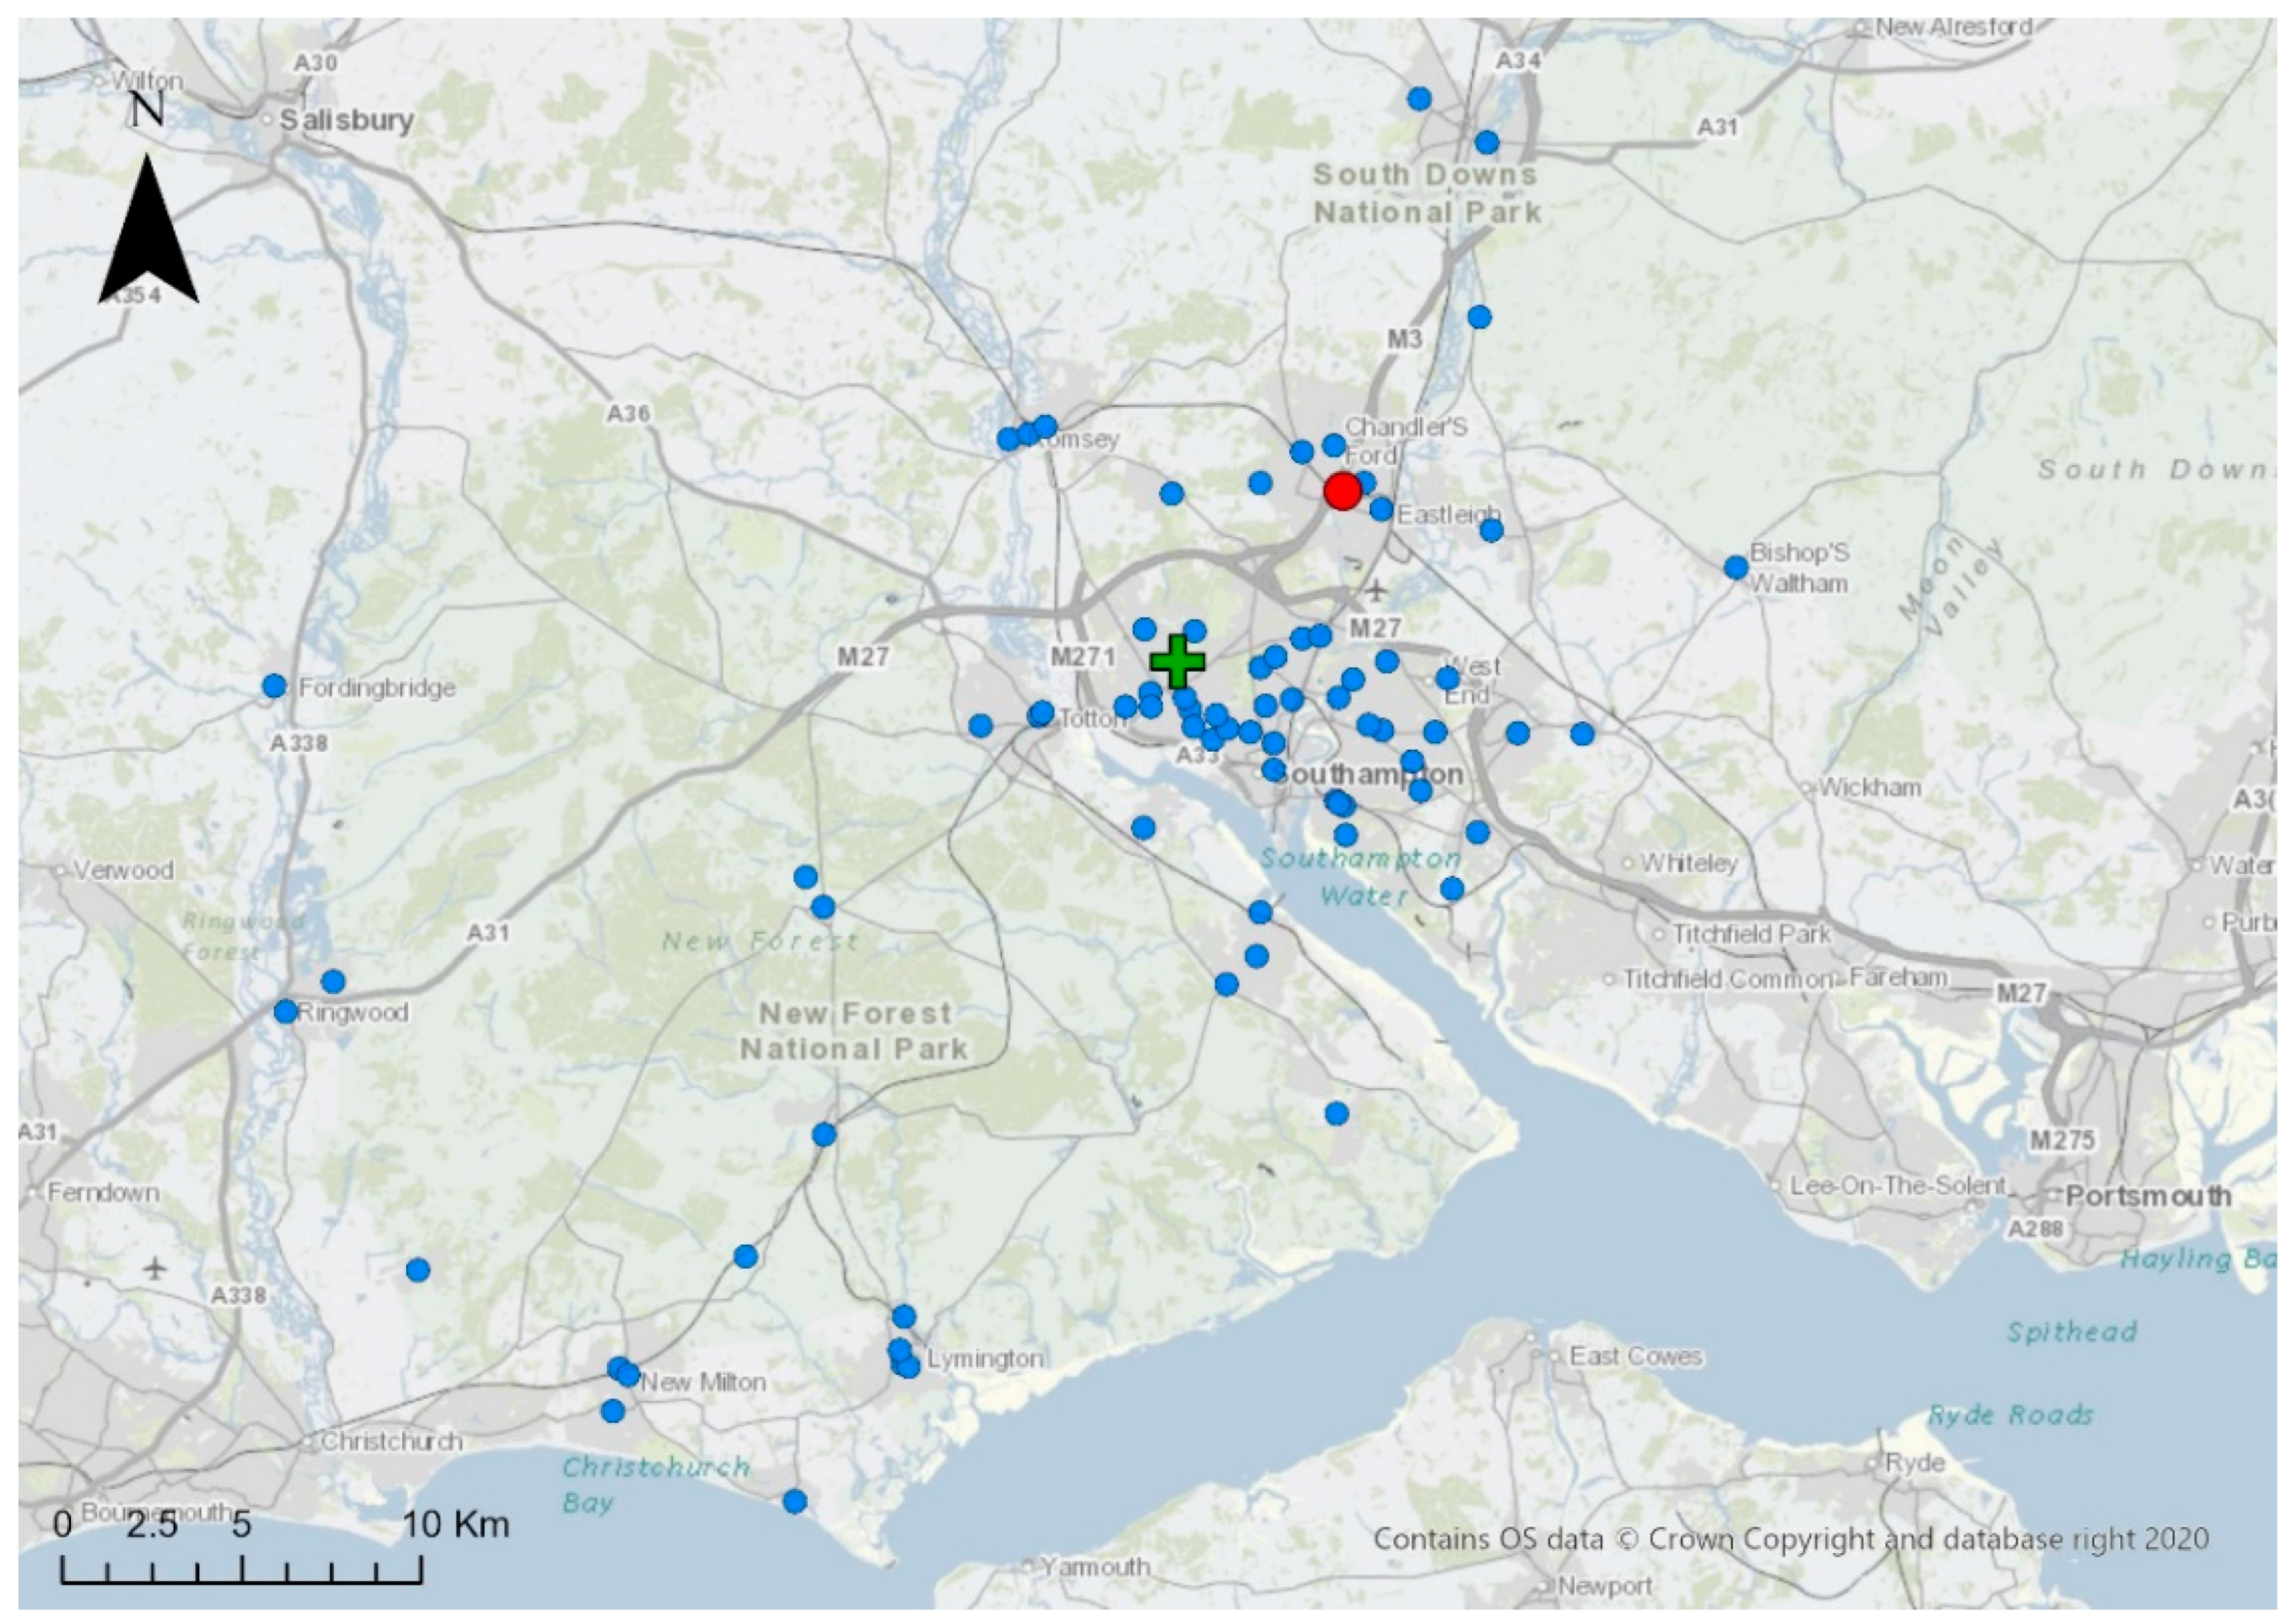
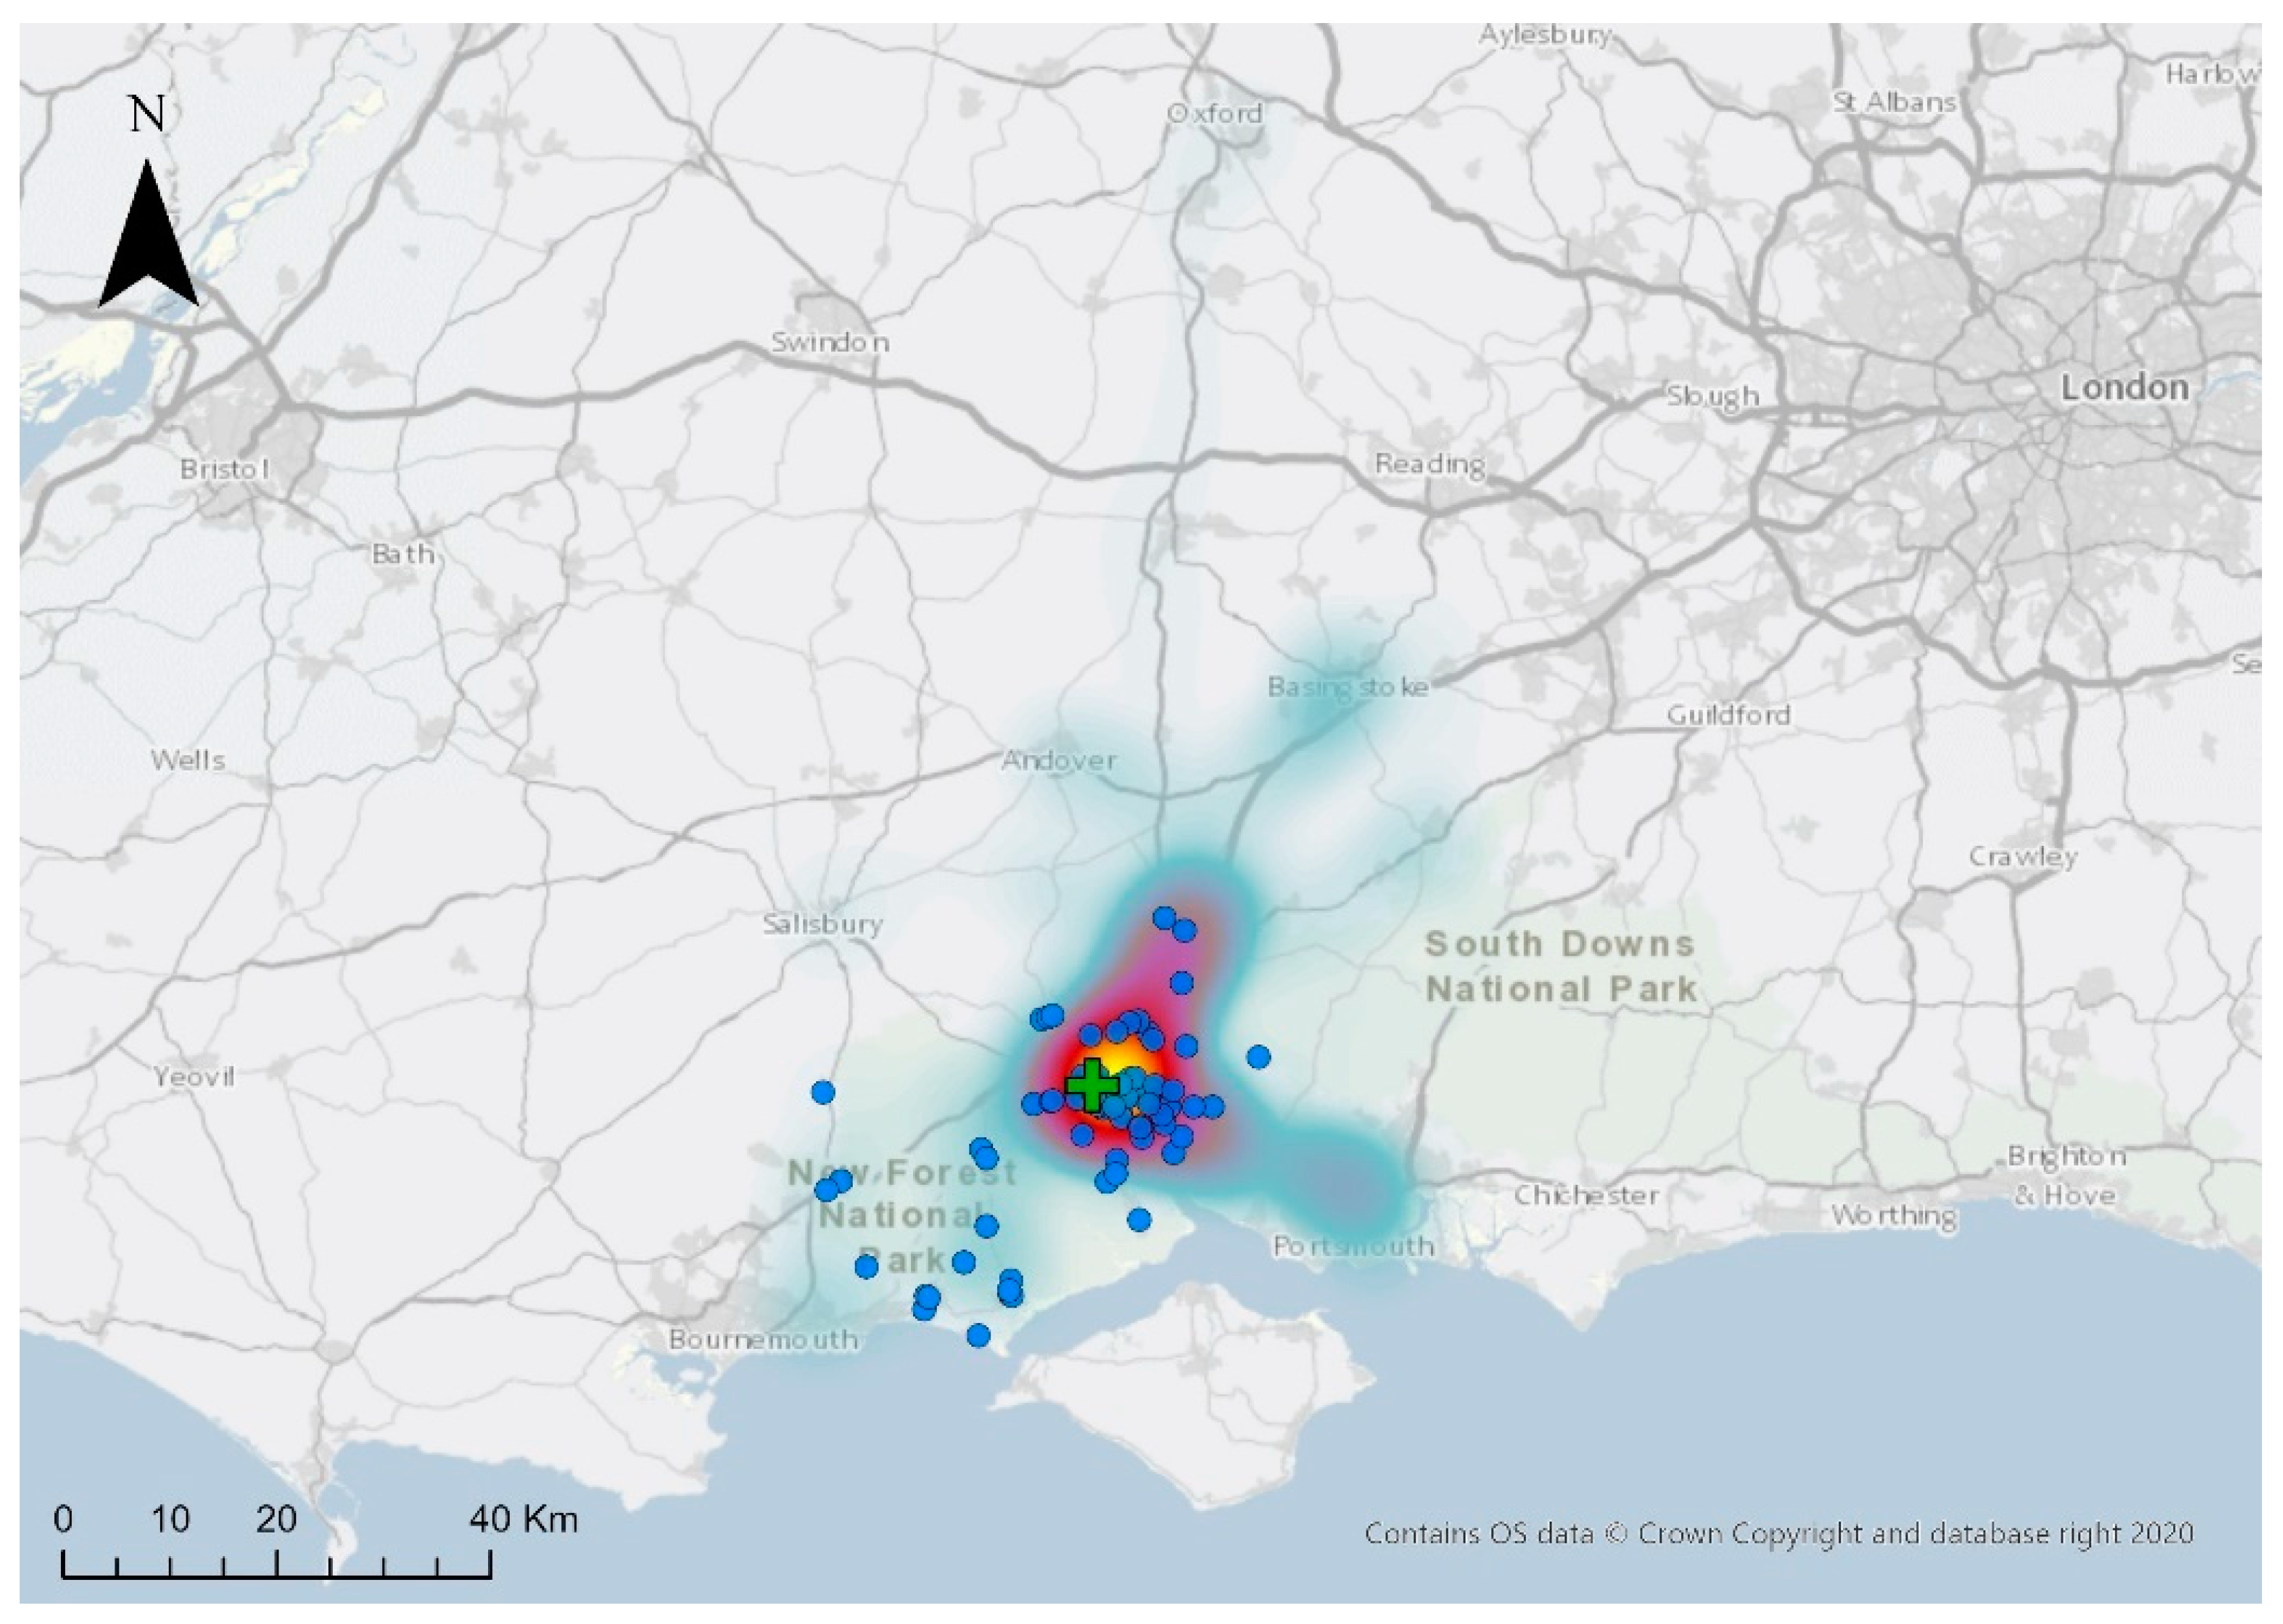
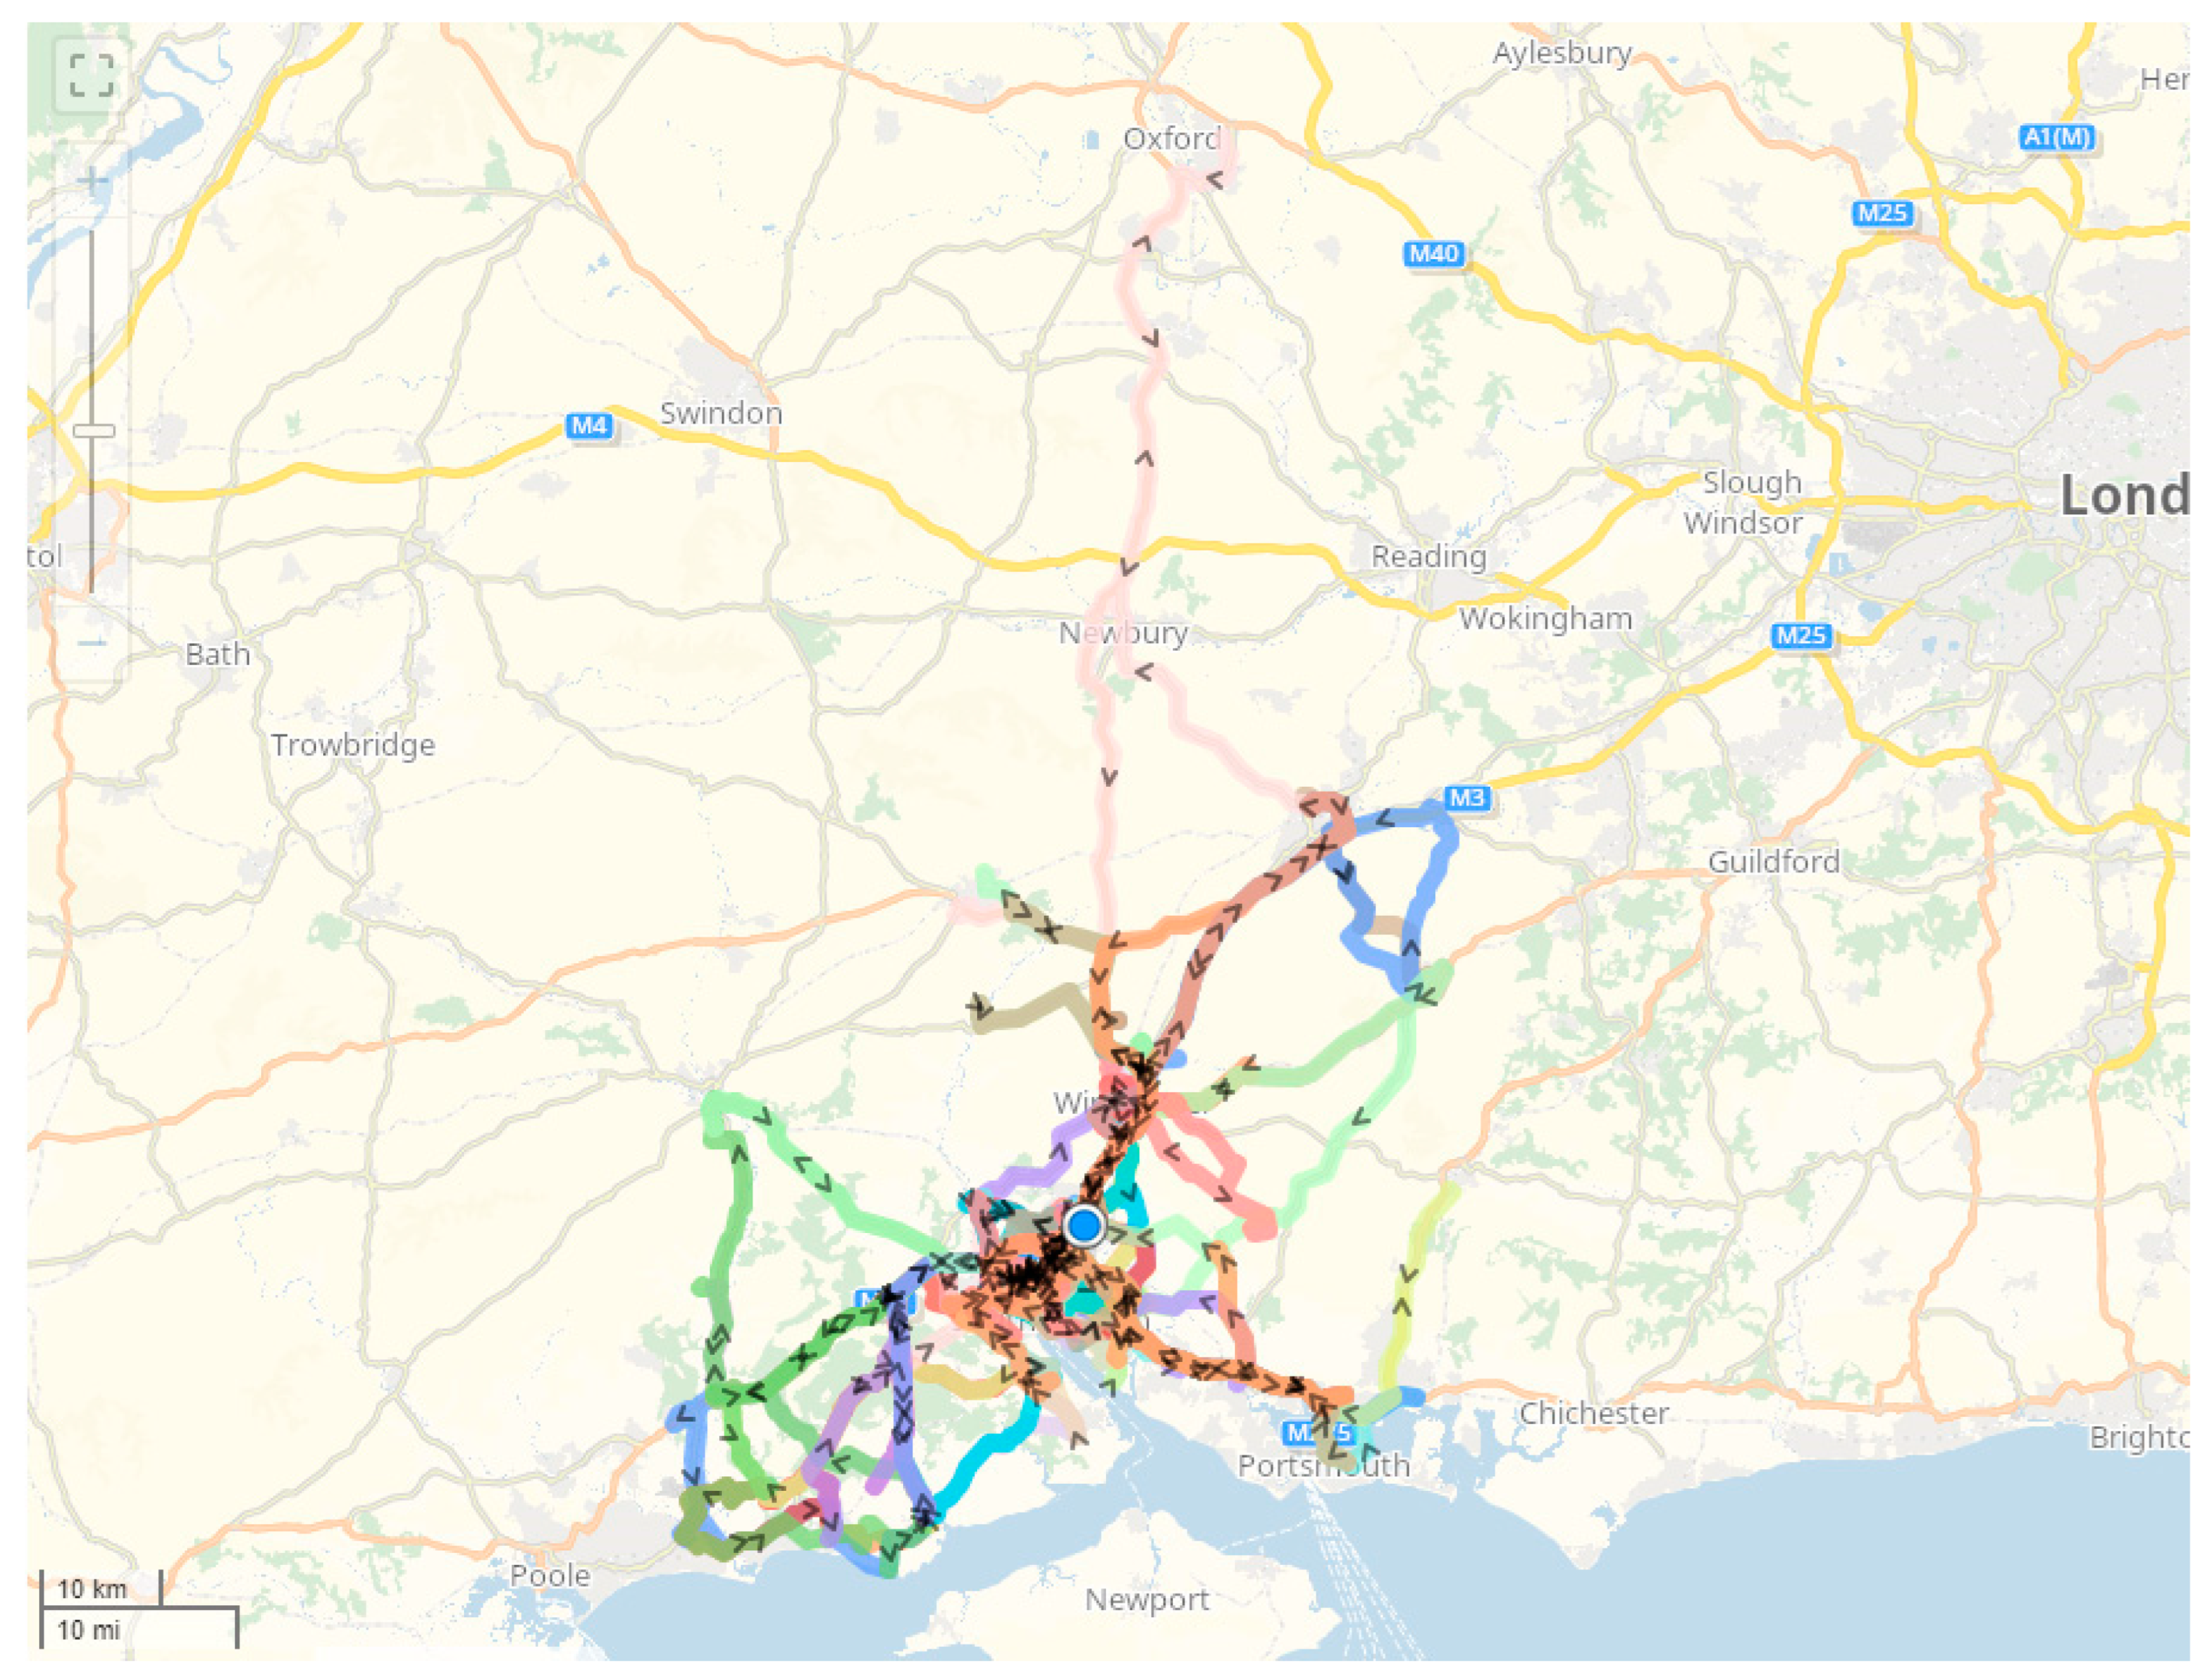
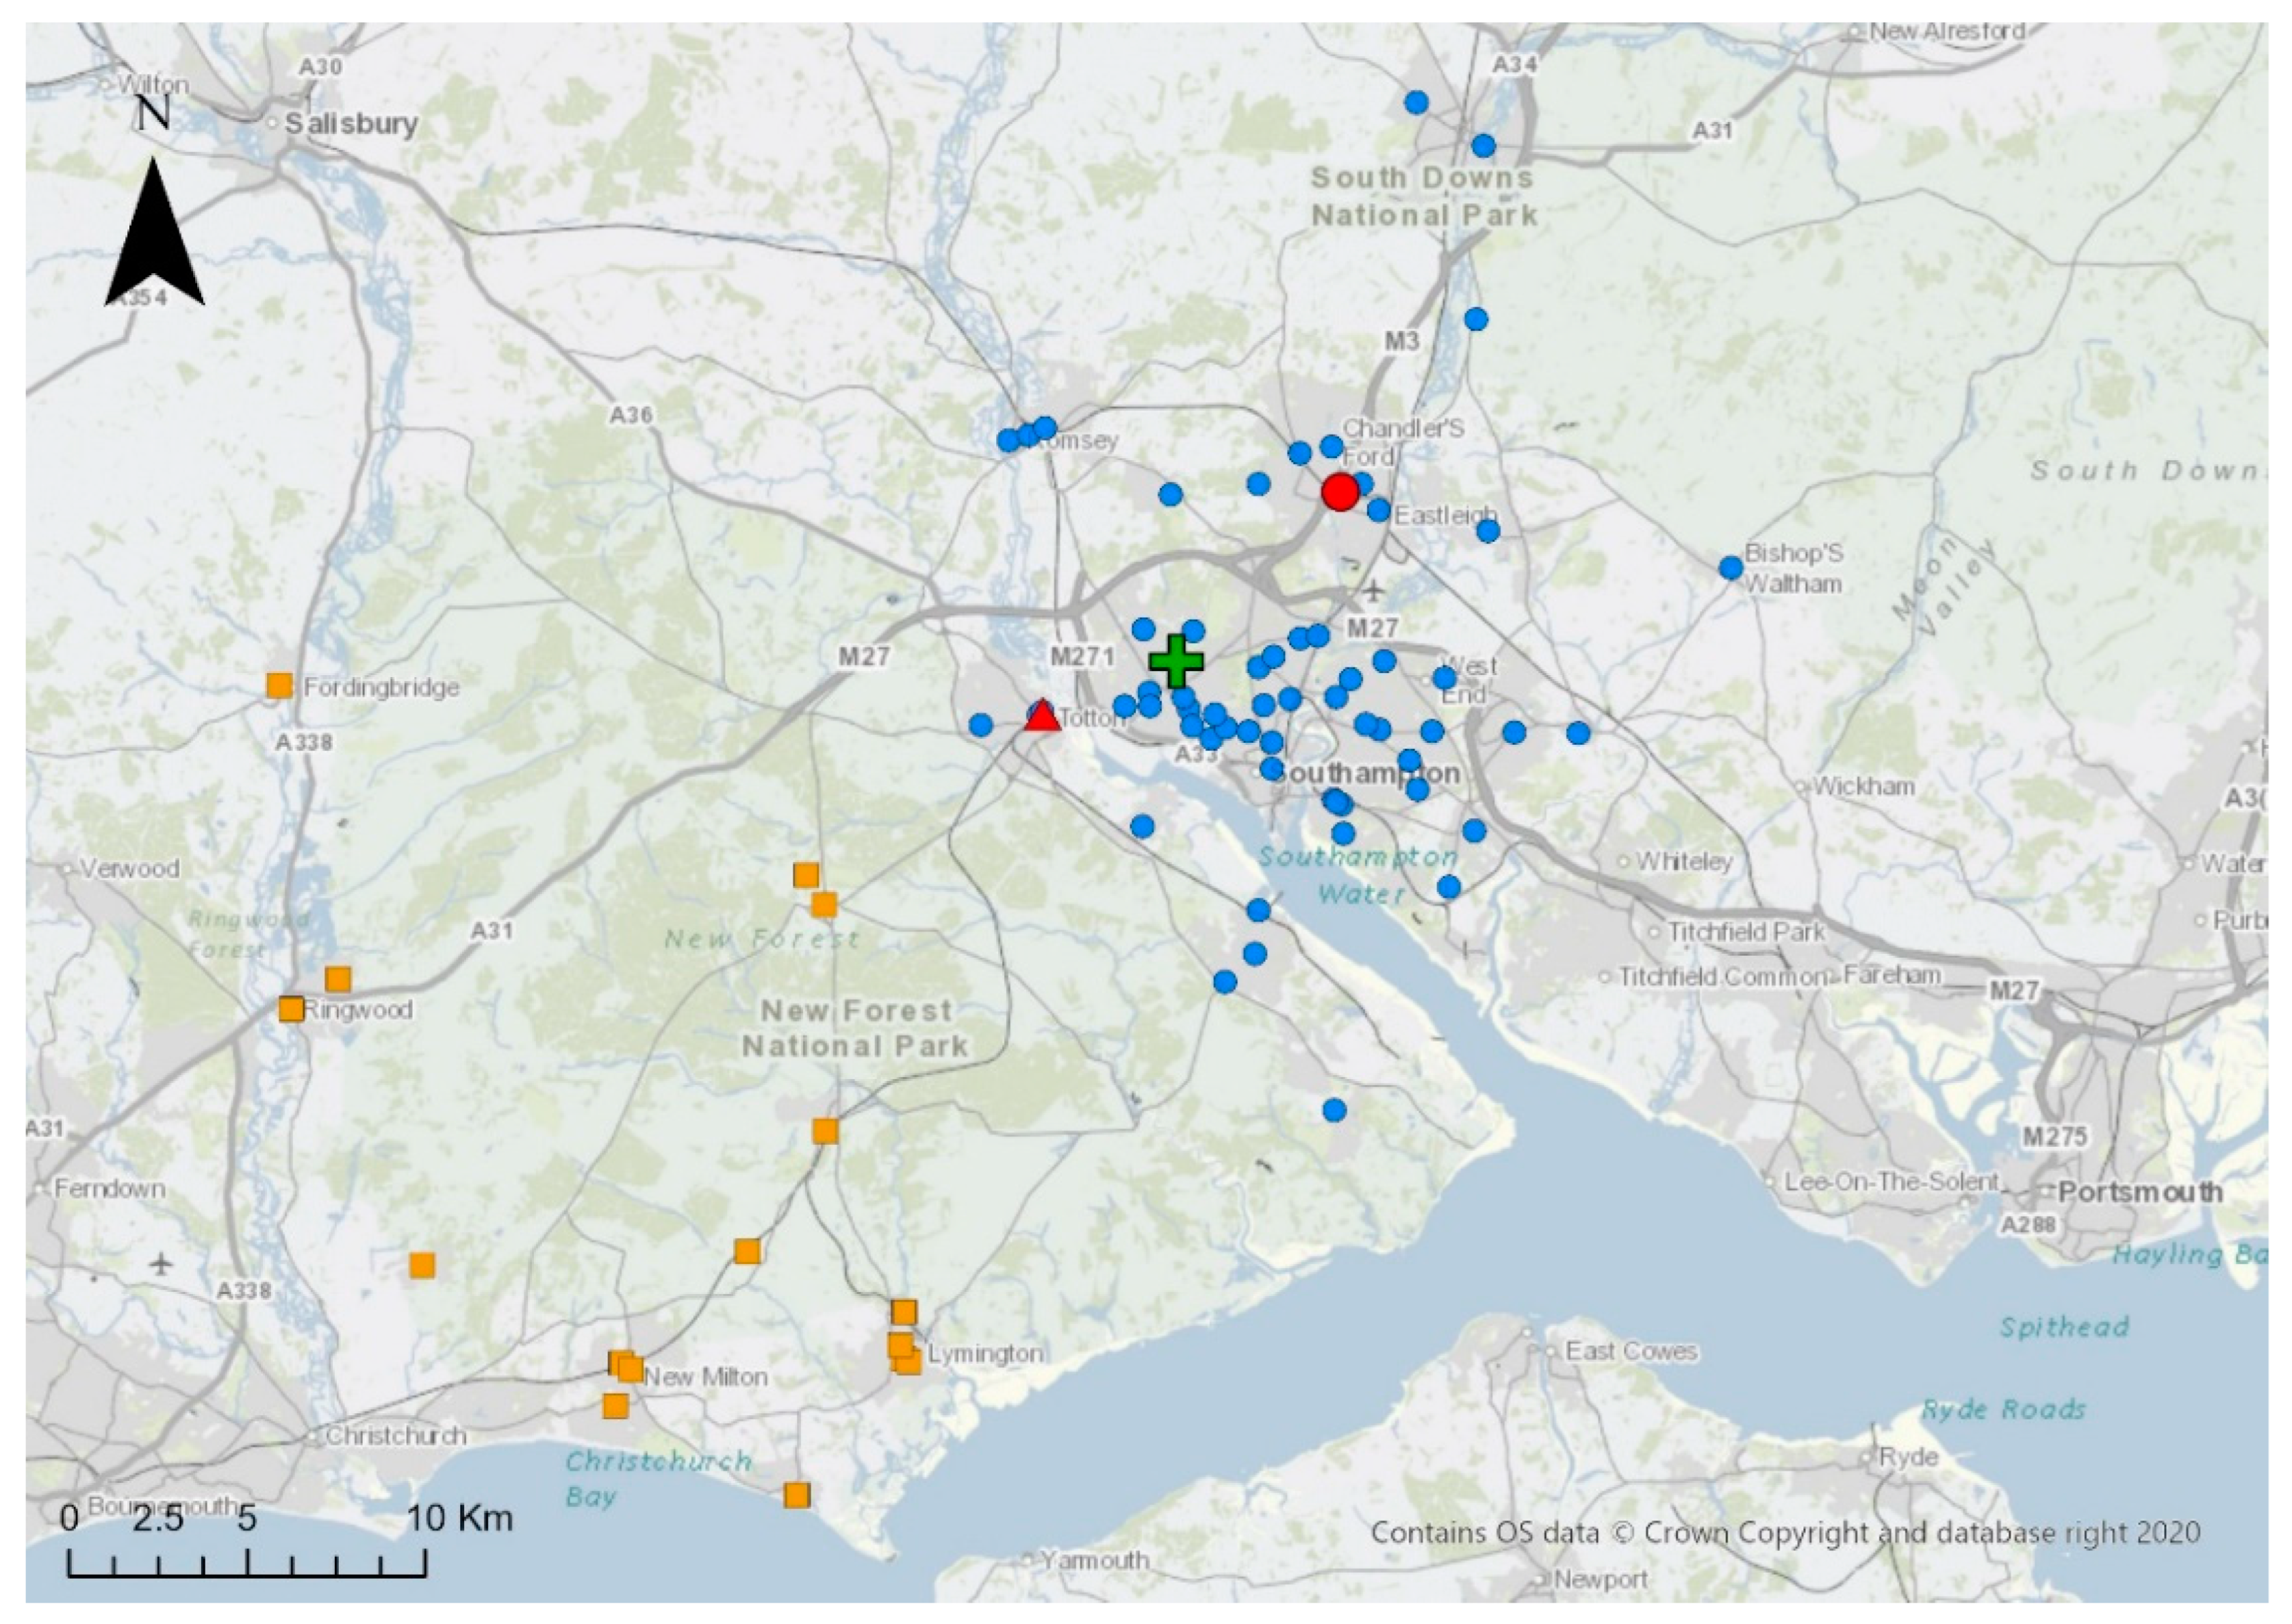
3. Materials and Methods
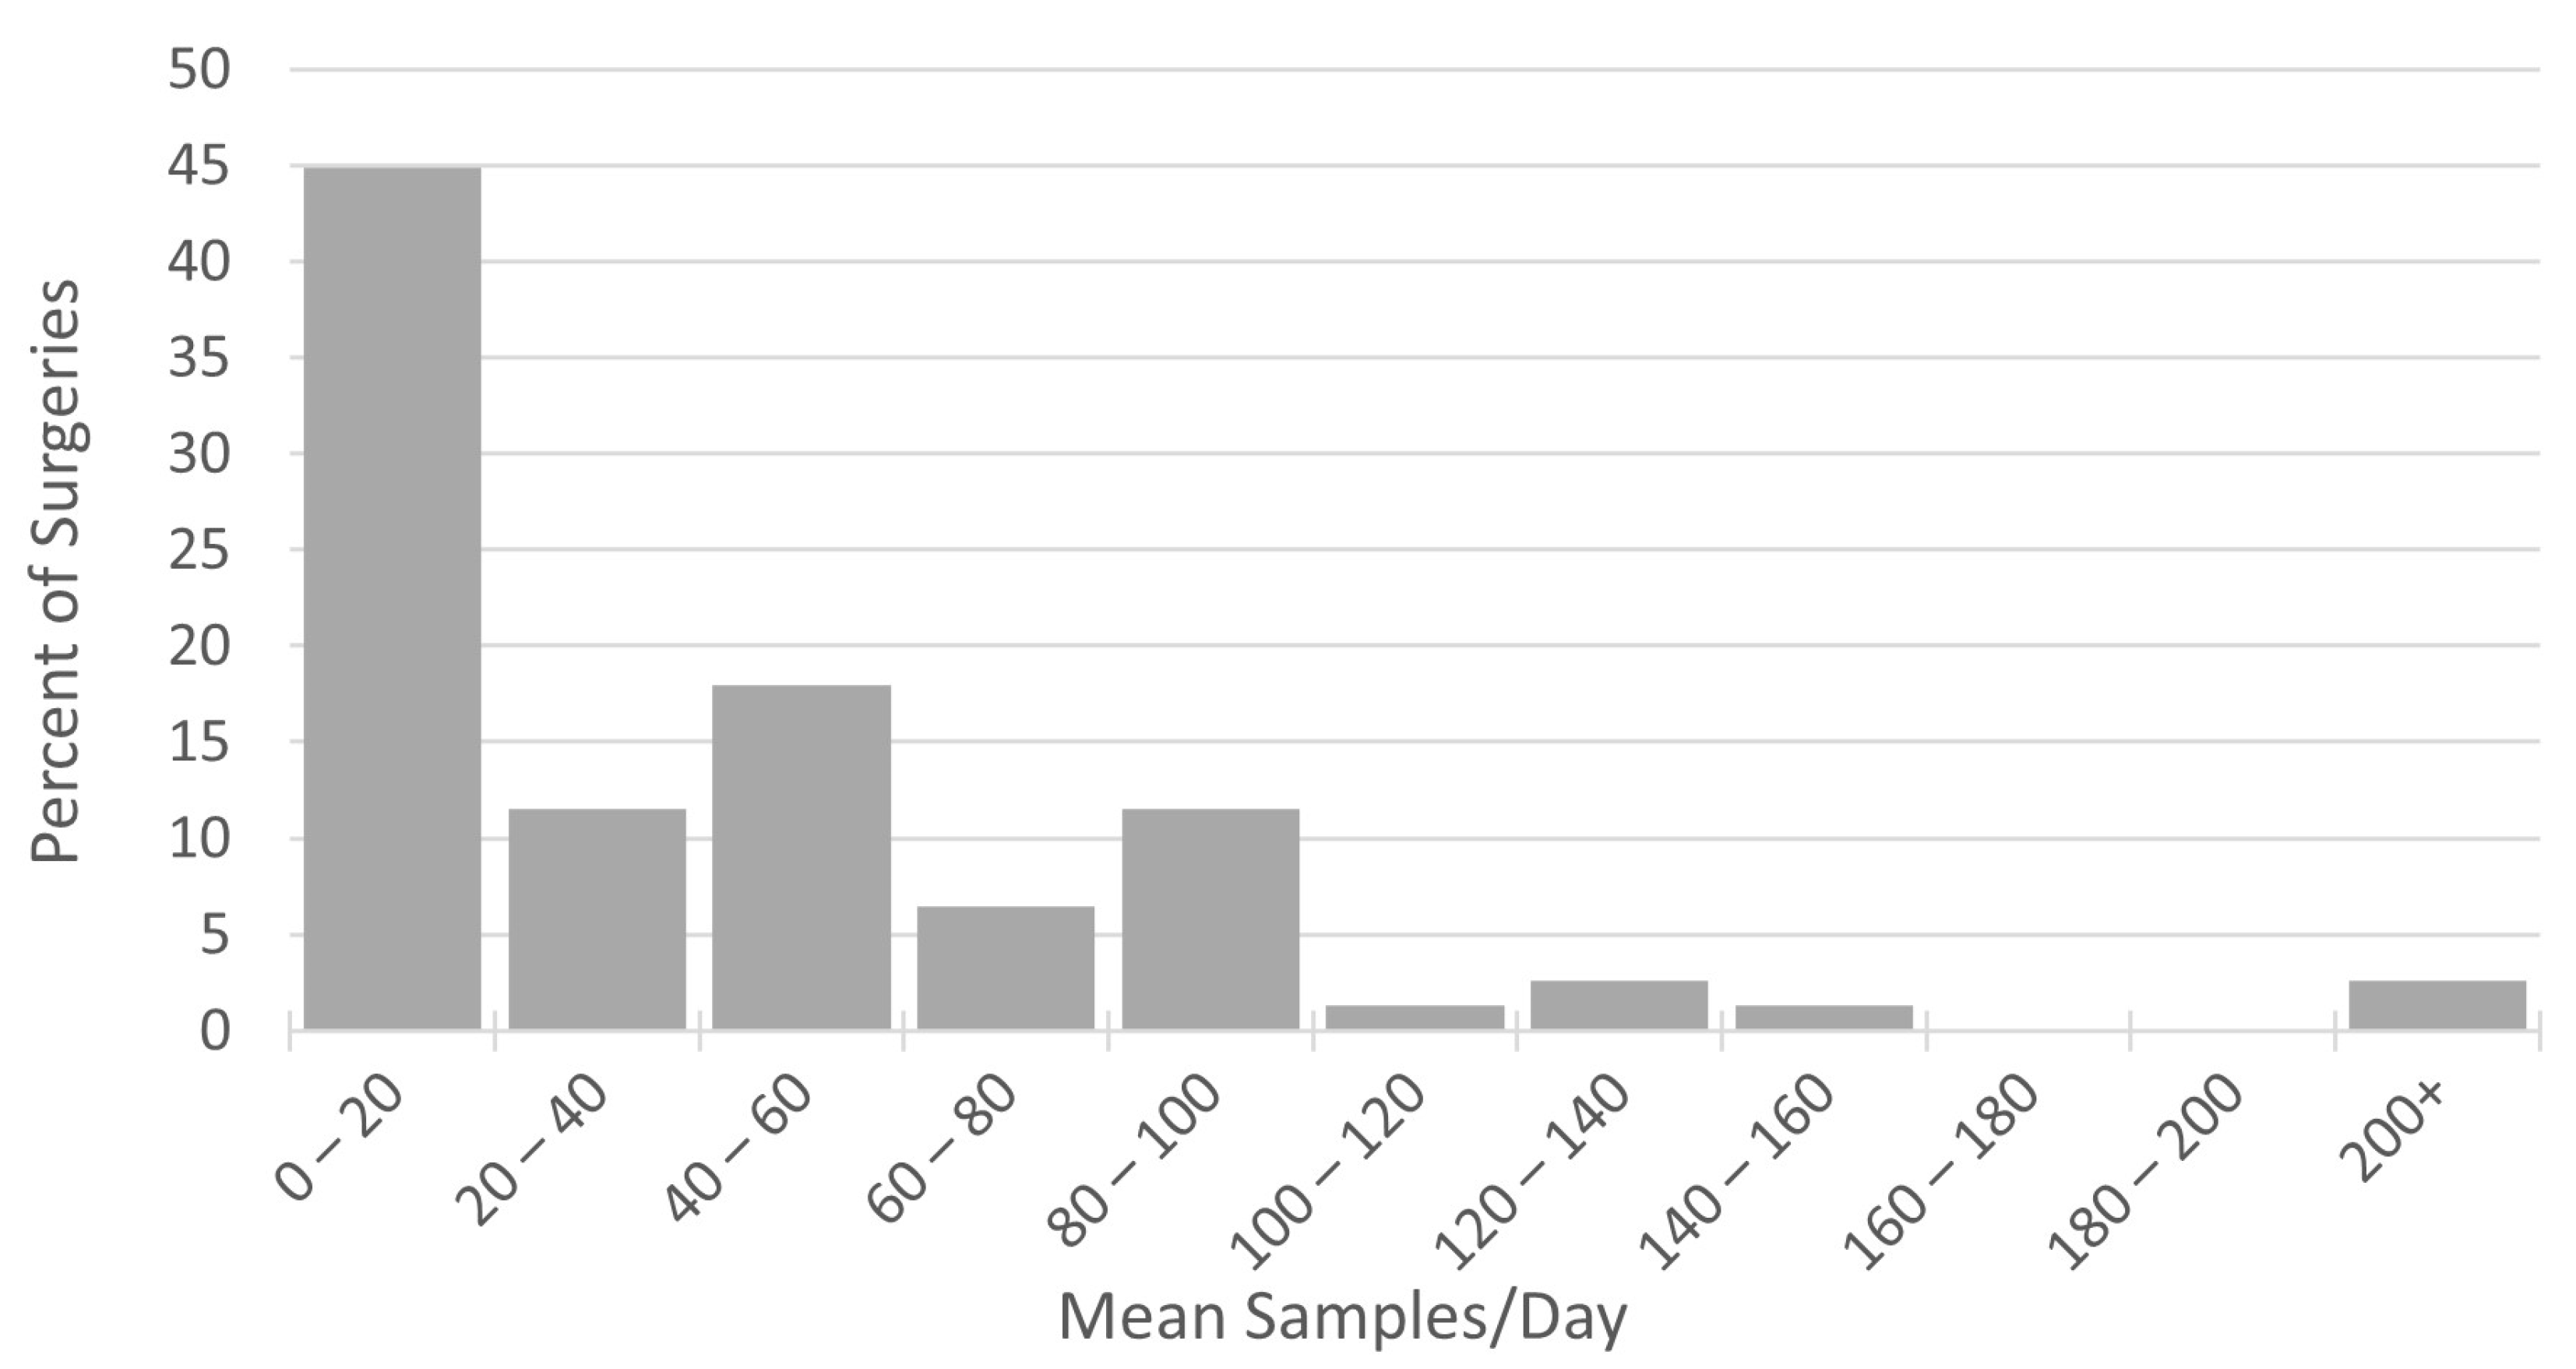
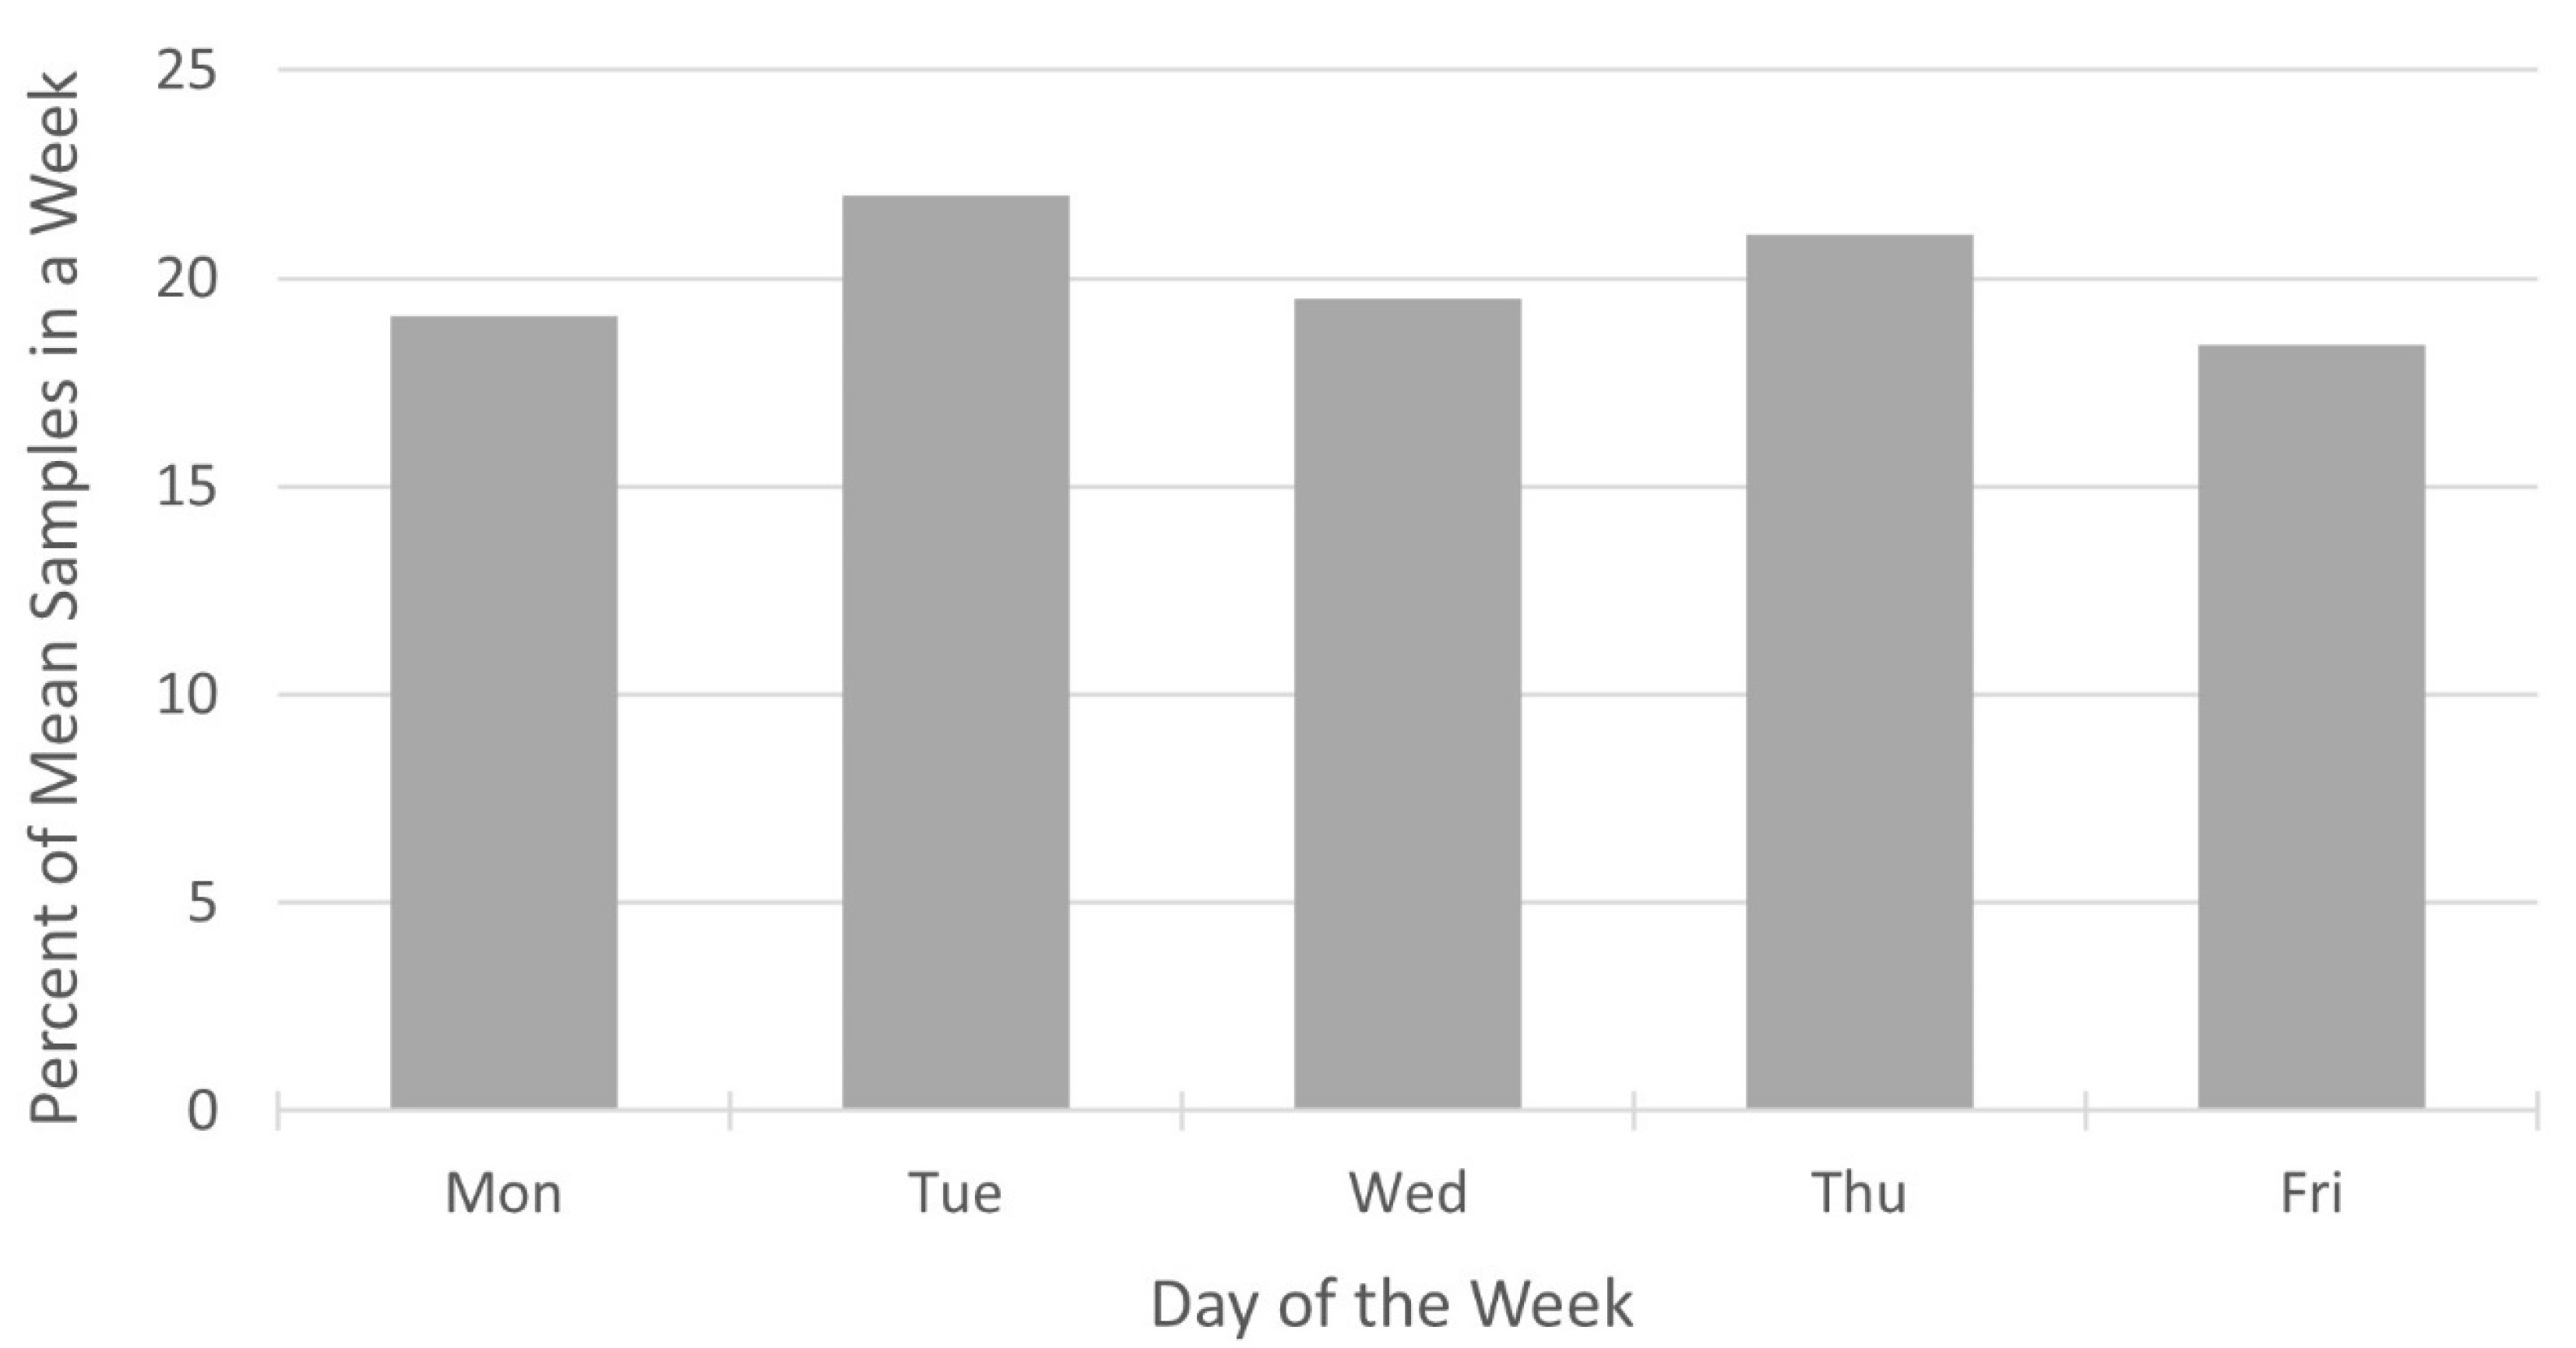
3.1. Business-As-Usual (BAU) Analysis
3.2. Intervention Scenario
4. Results
5. Discussion
- (i)
- preferred collection/delivery times;
- (ii)
- effects of unforeseen vehicle delays;
- (iii)
- the need to meet existing service level agreements;
- (iv)
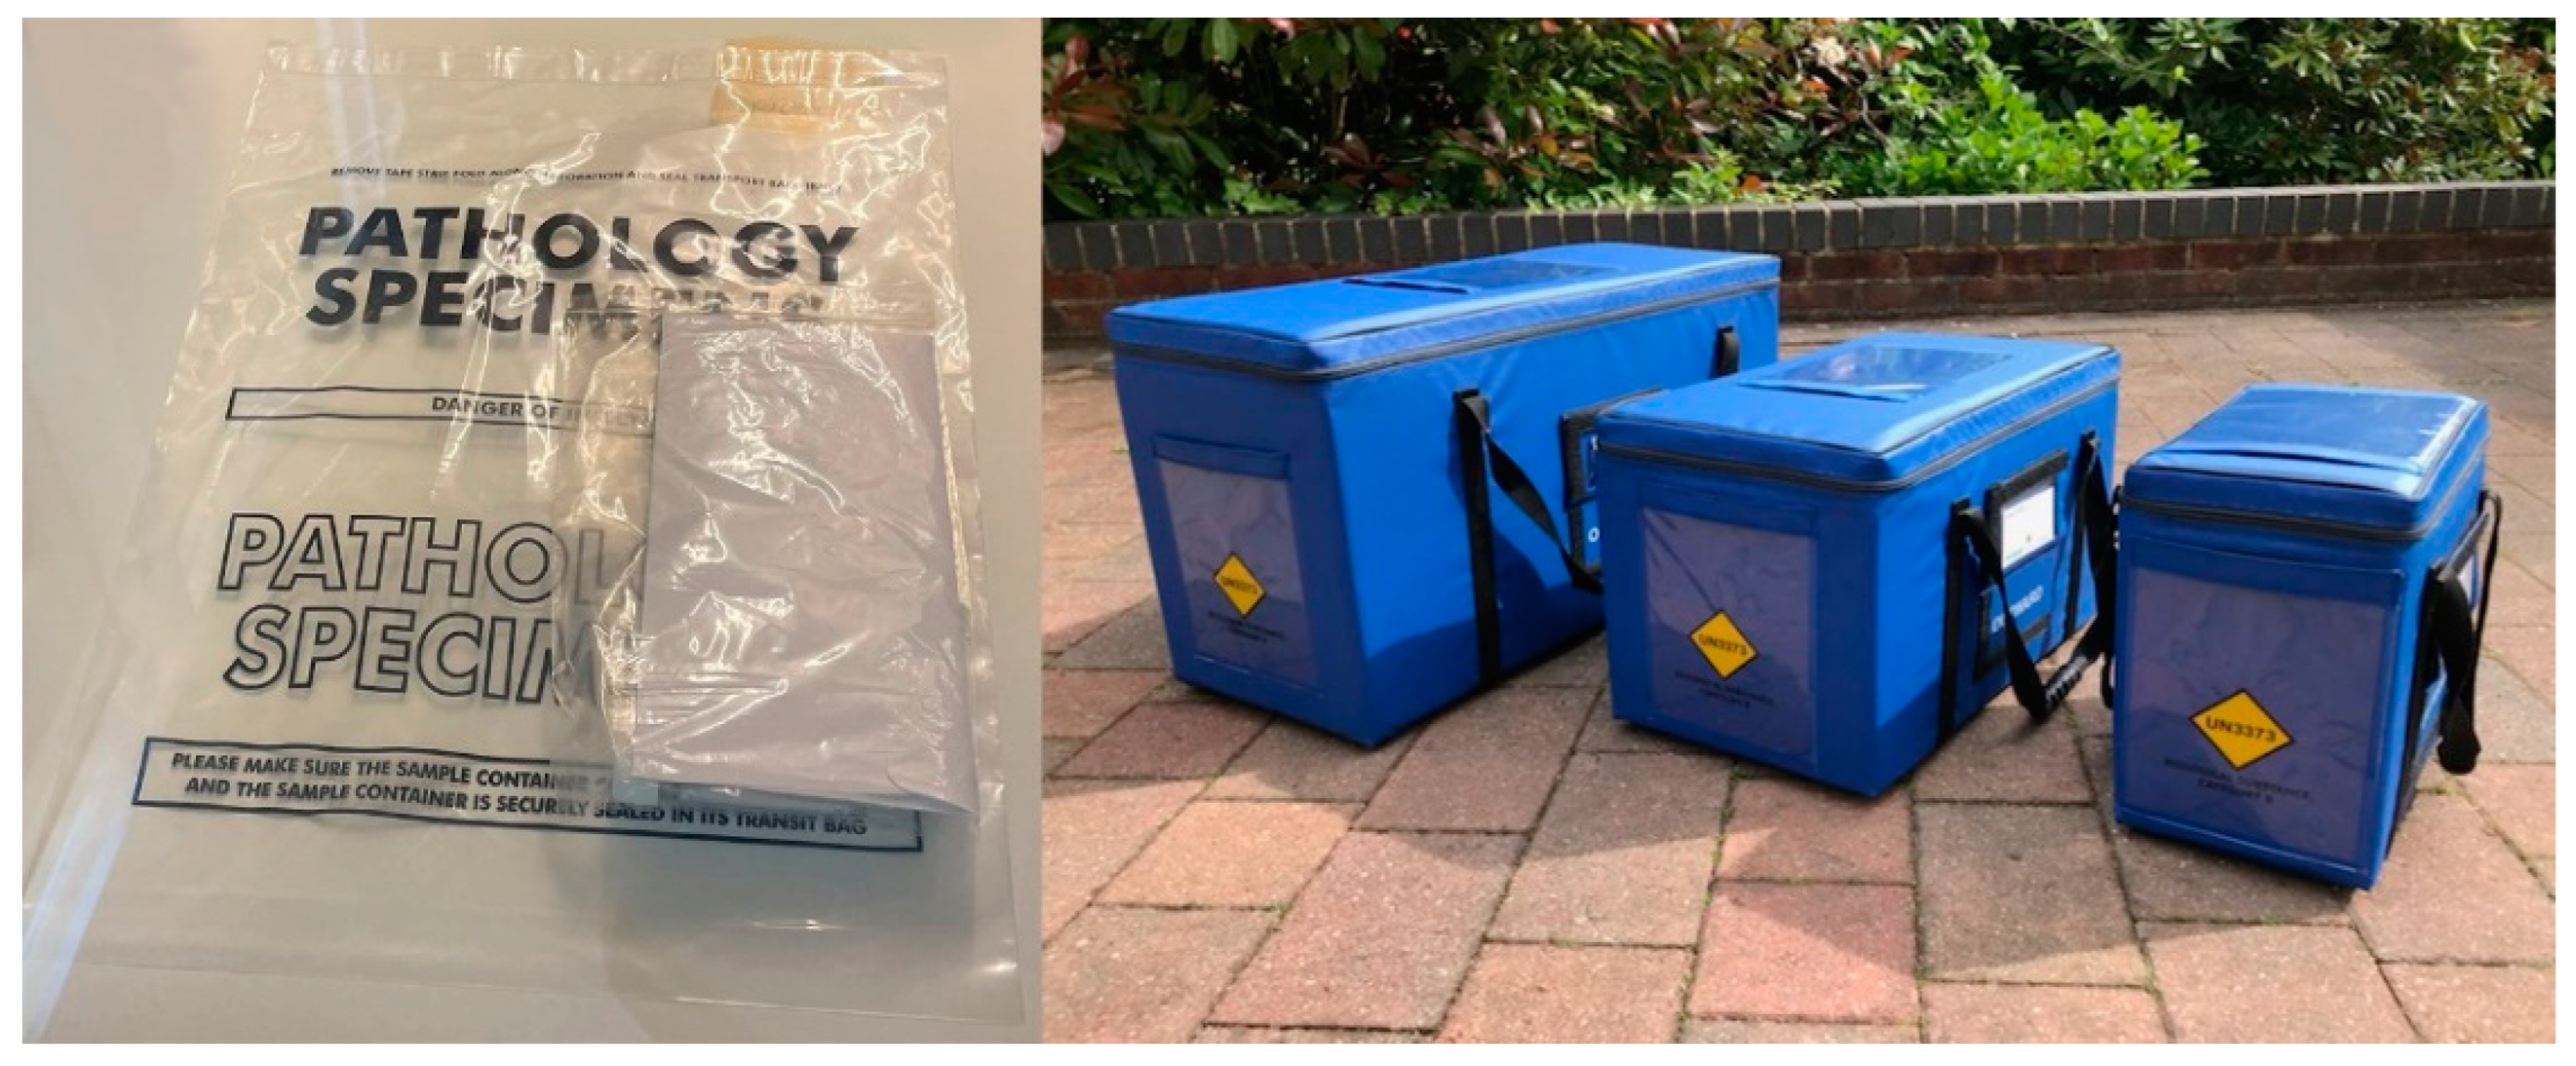
- safe on-board stowage of samples;
- (v)
- quality control for sample transport (e.g., monitoring detrimental in-vehicle conditions such as high temperature or vibration);
- (vi)
- liability for injury to patients or loss/damage of samples;
- (vii)
- overcoming reluctance to use an alternative transport provider and convincing all parties (e.g., GP surgeries, PTS vehicle drivers, SCS and PTS management staff, pathology laboratory personnel) of the benefits of participation;
- (viii)
- availability of spare capacity in PTS vehicles;
- (ix)
- allocating responsibility for route scheduling;
- (x)
- developing a new business model to procure transport internally on an inter-departmental basis (i.e., between the PTS and SCS, both departments within the NHS), rather than externally from a commercial courier company, including agreements on the cost allocation and management processes involved.
6. Conclusions
Author Contributions
Funding
Institutional Review Board Statement
Informed Consent Statement
Data Availability Statement
Acknowledgments
Conflicts of Interest
References
- Ferrell, W.; Ellis, K.; Kaminsky, P.; Rainwater, C. Horizontal collaboration: Opportunities for improved logistics planning. Int. J. Prod. Res. 2020, 58, 4267–4284. [Google Scholar] [CrossRef]
- Gansterer, M.; Hartl, R.F.; Vetschera, R. The cost of incentive compatibility in auction-based mechanisms for carrier collaboration. Networks 2019, 73, 490–514. [Google Scholar] [CrossRef]
- Gansterer, M.; Hartl, R.F. Shared resources in collaborative vehicle routing. TOP Off. J. Span. Soc. Stat. Oper. Res. 2020, 28, 1–20. [Google Scholar] [CrossRef]
- Gansterer, M.; Hartl, R.F.; Wieser, S. Assignment constraints in shared transportation services. Ann. Oper. Res. 2020, 305, 513–539. [Google Scholar] [CrossRef]
- Bean, W.L.; Joubert, J.W. An agent-based implementation of freight receiver and carrier collaboration with cost sharing. Transp. Res. Interdiscip. Perspect. 2021, 11, 100416. [Google Scholar] [CrossRef]
- Grote, M.; Cherrett, T.; Whittle, G.; Tuck, N. Environmental benefits from shared-fleet logistics: Lessons from a public-private sector collaboration. Int. J. Logist. Res. Appl. 2021, 1–27. [Google Scholar] [CrossRef]
- Karam, A.; Reinau, K.H.; Østergaard, C.R. Horizontal collaboration in the freight transport sector: Barrier and decision-making frameworks. Eur. Transp. Res. Rev. 2021, 13, 53. [Google Scholar] [CrossRef]
- Nataraj, S.; Ferone, D.; Quintero-Araujo, C.; Juan, A.A.; Festa, P. Consolidation centers in city logistics: A cooperative approach based on the location routing problem. Int. J. Ind. Eng. Comput. 2019, 10, 393–404. [Google Scholar] [CrossRef]
- Yao, X.; Cheng, Y.; Song, M. Assessment of collaboration in city logistics: From the aspects of profit and CO2 emissions. Int. J. Logist. Res. Appl. 2019, 22, 576–591. [Google Scholar] [CrossRef]
- Vargas, A.; Fuster, C.; Corne, D. Towards Sustainable Collaborative Logistics Using Specialist Planning Algorithms and a Gain-Sharing Business Model: A UK Case Study. Sustainability 2020, 12, 6627. [Google Scholar] [CrossRef]
- Aloui, A.; Hamani, N.; Derrouiche, R.; Delahoche, L. Systematic literature review on collaborative sustainable transportation: Overview, analysis and perspectives. Transp. Res. Interdiscip. Perspect. 2021, 9, 100291. [Google Scholar]
- Amiri, M.; Farvaresh, H. Carrier collaboration with the simultaneous presence of transferable and non-transferable utilities. Eur. J. Oper. Res. 2022; in press. [Google Scholar]
- Venturini, G.; Iris, Ç.; Kontovas, C.A.; Larsen, A. The multi-port berth allocation problem with speed optimization and emission considerations. Transp. Res. Part D Transp. Environ. 2017, 54, 142–159. [Google Scholar] [CrossRef]
- Wen, M.; Larsen, R.; Ropke, S.; Petersen, H.L.; Madsen, O.B.G. Centralised horizontal cooperation and profit sharing in a shipping pool. J. Oper. Res. Soc. 2019, 70, 737–750. [Google Scholar] [CrossRef]
- Wang, Y.; Peng, S.; Xu, C.; Assogba, K.; Wang, H.; Xu, M.; Wang, Y. Two-echelon logistics delivery and pickup network optimization based on integrated cooperation and transportation fleet sharing. Expert Syst. Appl. 2018, 113, 44–65. [Google Scholar] [CrossRef]
- Wang, Y.; Zhang, J.; Assogba, K.; Liu, Y.; Xu, M.; Wang, Y. Collaboration and transportation resource sharing in multiple centers vehicle routing optimization with delivery and pickup. Knowl.-Based Syst. 2018, 160, 296–310. [Google Scholar] [CrossRef]
- Wang, Y.; Zhang, S.; Assogba, K.; Fan, J.; Xu, M.; Wang, Y. Economic and environmental evaluations in the two-echelon collaborative multiple centers vehicle routing optimization. J. Clean. Prod. 2018, 197, 443–461. [Google Scholar] [CrossRef]
- Chabot, T.; Bouchard, F.; Legault-Michaud, A.; Renaud, J.; Coelho, L. C Service level, cost and environmental optimization of collaborative transportation. Transp. Res. Part E Logist. Transp. Rev. 2018, 110, 1–14. [Google Scholar] [CrossRef]
- Konstantakopoulos, G.D.; Gayialis, S.P.; Kechagias, E.P.; Papadopoulos, G.A.; Tatsiopoulos, I.P. An algorithmic approach for sustainable and collaborative logistics: A case study in Greece. Int. J. Inf. Manag. Data Insights 2021, 1, 100010. [Google Scholar]
- Quintero-Araujo, C.L.; Gruler, A.; Juan, A.A.; de Armas, J.; Ramalhinho, H. Using simheuristics to promote horizontal collaboration in stochastic city logistics. Prog. Artif. Intell. 2017, 6, 275–284. [Google Scholar]
- Aloui, A.; Hamani, N.; Derrouiche, R.; Delahoche, L. Assessing the benefits of horizontal collaboration using an integrated planning model for two-echelon energy efficiency-oriented logistics networks design. Int. J. Syst. Sci. Oper. Logist. 2021, 9, 302–323. [Google Scholar]
- Su, Z.; Li, W.; Li, J.; Cheng, B. Heterogeneous fleet vehicle scheduling problems for dynamic pickup and delivery problem with time windows in shared logistics platform: Formulation, instances and algorithms. Int. J. Syst. Sci. Oper. Logist. 2021, 9, 199–223. [Google Scholar] [CrossRef]
- Deng, S.; Yuan, Y.; Wang, Y.; Wang, H.; Koll, C. Collaborative multicenter logistics delivery network optimization with resource sharing. PLoS ONE 2020, 15, e0242555. [Google Scholar] [CrossRef]
- Mrabti, N.; Hamani, N.; Delahoche, L. The pooling of sustainable freight transport. J. Oper. Res. Soc. 2021, 72, 2180–2195. [Google Scholar] [CrossRef]
- Abou Mjahed, M.; Ben Abdelaziz, F.; Tarhini, H. Coalition Formation for Horizontal Supply Chain Collaboration: A Multiobjective Approach. In Proceedings of the 3rd International Conference on Decision Aid Sciences and Applications (DASA 2022), Chiang Rai, Thailand, 23–25 March 2022; Institute of Electrical and Electronics Engineers (IEEE): New York, NY, USA, 2022. [Google Scholar]
- Mrad, M.; Bamatraf, K.; Alkahtani, M.; Hidri, L. Genetic Algorithm Based on Clark & Wright’s Savings Algorithm for Reducing the Transportation Cost in a Pooled Logistic System. In Proceedings of the 2nd South American International Conference on Industrial Engineering and Operations Management, Sao Paulo, Brazil, 5–8 April 2021; Industrial Engineering and Operations Management (IEOM) Society International: Detroit, MI, USA, 2021. [Google Scholar]
- Ouhader, H.; El Kyal, M. Assessing the economic and environmental benefits of horizontal cooperation in delivery: Performance and scenario analysis. Uncertain Supply Chain. Manag. 2020, 8, 303–320. [Google Scholar]
- Aktas, E.; Bourlakis, M.; Zissis, D. Collaboration in the last mile: Evidence from grocery deliveries. Int. J. Logist. Res. Appl. 2020, 24, 227–241. [Google Scholar]
- Serrano-Hernandez, A.; de la Torre, R.; Cadarso, L.; Faulin, J. Urban e-Grocery Distribution Design in Pamplona (Spain) Applying an Agent-Based Simulation Model with Horizontal Cooperation Scenarios. Algorithms 2021, 14, 20. [Google Scholar] [CrossRef]
- Ballot, E.; Fontane, F. Reducing transportation CO2 emissions through pooling of supply networks: Perspectives from a case study in French retail chains. Prod. Plan. Control 2010, 21, 640–650. [Google Scholar] [CrossRef]
- Versapak. Medium Insulated Medical Carrier—Pathology (PYTB2); Versapak: London, UK, 2021; Available online: https://www.versapak.co.uk/new-medium-insulated-medical-carrier-pathology (accessed on 25 January 2022).
- Freight Transport Association (FTA). Manager’s Guide to Distribution Costs; Freight Transport Association Limited: Tunbridge Wells, UK, 2020. [Google Scholar]
- Baniasadi, P.; Foumani, M.; Smith-Miles, K.; Ejov, V. A transformation technique for the clustered generalized traveling salesman problem with applications to logistics. Eur. J. Oper. Res. 2020, 285, 444–457. [Google Scholar] [CrossRef]
- Oakey, A.; Grote, M.; Smith, A.; Cherrett, T.; Pilko, A.; Dickinson, J.; Ait Bihi Ouali, L. Integrating drones into NHS patient diagnostic logistics systems: Flight or fantasy? PLoS ONE 2022, 17, e0264669. [Google Scholar]


| Study | Methodological Approach/Complexity | Potential Benefits |
|---|---|---|
| Wang et al. [15] | Assessment of optimisation algorithm Sharing: vehicle capacity Network: five firms, city-wide | Costs −32% |
| Wang et al. [16] | Assessment of optimisation algorithm Sharing: vehicle capacity Network: five firms, city-wide | Costs −68% Vehicles −23% |
| Wang et al. [17] | Assessment of optimisation algorithm Sharing: vehicle capacity Network: five firms, city-wide | Costs −74% Emissions −47% |
| Chabot et al. [18] | Assessment of optimisation algorithm Sharing: vehicle capacity Network: three firms, international | Costs −52% Emissions −80% |
| Amiri and Farvaresh [12] | Assessment of optimisation algorithm Sharing: vehicle capacity Network: three firms, theoretical | Profits +15% |
| Gansterer et al. [4] | Assessment of optimisation algorithm Sharing: vehicle capacity Network: three firms, theoretical | Costs −25% |
| Konstantakopoulos et al. [19] | Assessment of optimisation algorithm Sharing: vehicle capacity Network: three firms, city-wide | Vkm −10% Costs −3% Vehicles −6% Emissions −2% |
| Yao et al. [9] | Assessment of optimisation algorithm Sharing: vehicle capacity Network: two firms, city-wide | Profits +3% Emissions −1% |
| Quintero-Araujo et al. [20] | Assessment of optimisation algorithm Sharing: vehicle capacity, storage facilities Network: nine firms, nine storage facilities, theoretical | Costs −4% Emissions −3% |
| Aloui et al. [21] | Assessment of optimisation algorithm Sharing: vehicle capacity, storage facility locations, inventory planning Network: four firms, four storage facilities, theoretical | Costs −67% Emissions −58% |
| Nataraj et al. [8] | Assessment of optimisation algorithm Sharing: vehicle capacity, storage facility locations Network: five firms, five storage facilities, theoretical | Costs −47% Emissions −42% |
| Su et al. [22] | Assessment of optimisation algorithm Sharing: vehicle capacity Network: up to 500 requests for transport, theoretical | Improvement on benchmark solutions |
| Deng et al. [23] | Assessment of optimisation algorithm Sharing: vehicle capacity, storage facilities, customer services Network: four firms, four storage facilities, city-wide | Costs −41% Vehicles −36% |
| Mrabti et al. [24] | Assessment of optimisation algorithm Sharing: vehicle capacity, storage facilities Network: four firms, four storage facilities, theoretical | Costs −1% Vkm −20% Emissions −17% |
| Abou Mjahed et al. [25] | Assessment of optimisation algorithm Sharing: vehicle capacity, storage facilities Network: four firms, eight storage facilities, theoretical | Costs −12% |
| Mrad et al. [26] | Assessment of optimisation algorithm Sharing: vehicle capacity, storage facilities Network: seven firms, nine storage facilities, theoretical | Costs −34% Vkm −39% |
| Ouhader and El Kyal [27] | Assessment of optimisation algorithm Sharing: vehicle capacity, storage facilities Network: three firms, five storage facilities, theoretical | Costs −9% Emissions −45% |
| Aktas et al. [28] | Assessment of on-line grocery deliveries Sharing: vehicle capacity Network: two firms, city-wide | Vkm −17% Vehicle routes −22% |
| Serrano-Hernandez et al. [29] | Assessment of on-line grocery deliveries Sharing: vehicle capacity Network: four firms, city-wide | Vkm −43% Service level +46% |
| Vargas et al. [10] | Assessment of horizontal collaboration platform Sharing: vehicle capacity Network: two firms, national | Costs −11% Vkm −12% |
| Ballot and Fontane [30] | Assessment of supply chains in French retail sector Sharing: vehicle capacity, storage facilities Network: two firms, 223 storage facilities, national | Emissions −25% |
| Grote et al. [6] | Assessment of supply chain for cruise ship company Sharing: vehicle capacity Network: one firm, one public sector organisation (Local Government Authority; LGA), regional | Vkm −29% Emissions −36% LGA profit +GBP 3800/week |
| PTS Vehicle Type ID | No. of Vehicles at Depot | Capacity for Patients Travelling in Vehicle Seats | Capacity for Patients Travelling in Standard Wheelchairs | Capacity for Patients Travelling in Extra-Large Wheelchairs | Capacity for Patients Travelling on Stretchers |
|---|---|---|---|---|---|
| Seated_4 | 3 | 3 | 0 | 0 | 0 |
| Seated_6 | 1 | 5 | 0 | 0 | 0 |
| Seated_7 | 9 | 6 | 0 | 0 | 0 |
| WAV_5 1 | 5 | 2 | 2 | 0 | 0 |
| Stretcher_4 | 8 | 3 | 0 | 0 | 1 |
| Stretcher_6 | 4 | 5 | 0 | 0 | 1 |
| Stretcher_7 | 1 | 6 | 0 | 0 | 1 |
| Bariatric_5 | 2 | 2 | 0 | 2 | 0 |
| Scenario & Service | No. of Vehicle Routes | Cost (GBP) | Vkm (km) | Duty Time (h:m) | CO2 (kg) |
|---|---|---|---|---|---|
| BAU Daily Average: 1 | |||||
| PTS | 26 | GBP 6315 | 4682 | 247:43 | 1426 |
| SCS | 10 | GBP 782 | 1137 | 42:10 | 318 |
| PTS + SCS Total | 36 | GBP 7097 | 5820 | 289:53 | 1743 |
| BAU Monthly Total: 2 | |||||
| PTS | 595 | GBP 145,249 | 107,695 | 5697:35 | 32,790 |
| SCS | 230 | GBP 17,991 | 26,156 | 969:50 | 7309 |
| PTS + SCS Total | 825 | GBP 163,240 | 133,851 | 6667:25 | 40,099 |
| Int. Daily Average: 3 | |||||
| PTS/SCS Shared-Fleet | 24 | GBP 5941 | 5053 | 221:48 | 1538 |
| Int. Monthly Total: | |||||
| PTS/SCS Shared-Fleet | 558 | GBP 136,644 | 116,215 | 5101:40 | 35,384 |
| Net Effect per Day: | |||||
| BAU Daily–Int. Daily (% reduction) | 12 (32%) | GBP 1156 (16%) | 767 (13%) | 68:04 (23%) | 205 (12%) |
Disclaimer/Publisher’s Note: The statements, opinions and data contained in all publications are solely those of the individual author(s) and contributor(s) and not of MDPI and/or the editor(s). MDPI and/or the editor(s) disclaim responsibility for any injury to people or property resulting from any ideas, methods, instructions or products referred to in the content. |
© 2023 by the authors. Licensee MDPI, Basel, Switzerland. This article is an open access article distributed under the terms and conditions of the Creative Commons Attribution (CC BY) license (https://creativecommons.org/licenses/by/4.0/).
Share and Cite
Grote, M.; Cherrett, T.; Oakey, A.; Martinez-Sykora, A.; Aydemir, I. Benefits of Shared-Fleet Horizontal Logistics Collaborations: A Case Study of Patient Service Vehicles Collecting Pathology Samples in a Public Sector Healthcare Setting. Future Transp. 2023, 3, 169-188. https://doi.org/10.3390/futuretransp3010011
Grote M, Cherrett T, Oakey A, Martinez-Sykora A, Aydemir I. Benefits of Shared-Fleet Horizontal Logistics Collaborations: A Case Study of Patient Service Vehicles Collecting Pathology Samples in a Public Sector Healthcare Setting. Future Transportation. 2023; 3(1):169-188. https://doi.org/10.3390/futuretransp3010011
Chicago/Turabian StyleGrote, Matt, Tom Cherrett, Andy Oakey, Antonio Martinez-Sykora, and Ismail Aydemir. 2023. "Benefits of Shared-Fleet Horizontal Logistics Collaborations: A Case Study of Patient Service Vehicles Collecting Pathology Samples in a Public Sector Healthcare Setting" Future Transportation 3, no. 1: 169-188. https://doi.org/10.3390/futuretransp3010011