Article

Transcriptome Analysis Identifies Tumor Immune Microenvironment Signaling Networks Supporting Metastatic Castration-Resistant Prostate Cancer

by
Lawrence P. McKinney
1,
Rajesh Singh
1,
I. King Jordan
2,
Sooryanarayana Varambally
3,
Eric B. Dammer
4 and
James W. Lillard, Jr.
1,*
1
Department of Microbiology, Biochemistry, and Immunology, Morehouse School of Medicine, Atlanta, GA 30310, USA
2
School of Biological Sciences, Georgia Institute of Technology, Atlanta, GA 30332, USA
3
Division of Molecular and Cellular Pathology, Department of Pathology, The University of Alabama at Birmingham, Birmingham, AL 35233, USA
4
Department of Biochemistry Emory, University School of Medicine, Atlanta, GA 30329, USA
*
Author to whom correspondence should be addressed.
Onco 2023, 3(2), 81-95; https://doi.org/10.3390/onco3020007
Submission received: 8 March 2023 / Revised: 23 March 2023 / Accepted: 23 March 2023 / Published: 10 April 2023

Abstract

:

Simple Summary

Metastatic castration-resistant prostate cancer (mCRPC) is potentially lethal and often spreads to the bones through a biological mechanism we do not completely understand. A previous study sequenced RNA from patients with mCRPC, and in this study, we have identified 10 genes associated with mCRPC that spread to the bones; two of those genes are novel discoveries that could serve as new biomarkers for diagnosis or molecular targets for treatment. However, future studies are required to validate these genes’ molecular role in mCRPC progression.

Abstract

Prostate cancer (PCa) is the second most common cause of cancer death in American men. Metastatic castration-resistant prostate cancer (mCRPC) is the most lethal form of PCa and preferentially metastasizes to the bones through incompletely understood molecular mechanisms. Herein, we processed RNA sequencing data from patients with mCRPC (n = 60) and identified 14 gene clusters (modules) highly correlated with mCRPC bone metastasis. We used a novel combination of weighted gene co-expression network analysis (WGCNA) and upstream regulator and gene ontology analyses of clinically annotated transcriptomes to identify the genes. The cyan module (M14) had the strongest positive correlation (0.81, p = 4 × 10⁻¹⁵) with mCRPC bone metastasis. It was associated with two significant biological pathways through KEGG enrichment analysis (parathyroid hormone synthesis, secretion, and action and protein digestion and absorption). In particular, we identified 10 hub genes (ALPL, PHEX, RUNX2, ENPP1, PHOSPHO1, PTH1R, COL11A1, COL24A1, COL22A1, and COL13A1) using cytoHubba of Cytoscape. We also found high gene expression for collagen formation, degradation, absorption, cell-signaling peptides, and bone regulation processes through Gene Ontology (GO) enrichment analysis.

1. Introduction

The 5-year relative survival rate for prostate cancer (PCa) decreases from >99% to 31% once the disease has metastasized to distant sites [1]. The bones are the most common site for disease spread for metastatic castration-resistant prostate cancer (mCRPC), suggesting that the bone microenvironment is conducive to mCRPC growth and survival.
To date, the molecular mechanisms of mCRPC remain incompletely described. Many studies have examined the clinical characteristics of mCRPC, especially in terms of genetic alterations and the role of the tumor immune microenvironment (TIME) in dynamic tumor evolution. Still, few have fully characterized the mCRPC transcriptome [2,3,4,5].
This study captures a global picture of mCRPC cellular function and TIME-related signaling networks in bone tissue. We analyzed mRNA expression data from the Database of Genotypes and Phenotypes (dbGAP) using WGCNA. We critically assessed the relevance of genes differentially expressed in mCRPC by matching clinical annotations with biological gene functions that positively correlate with bone mCRPC through functional enrichment, pathway, and protein–protein interaction (PPI) analyses. These results further elucidate the biological pathways, molecular functions, and clinical events that underpin mCRPC cell migration, survival, and bone metastasis.

2. Materials and Methods

2.1. Patient Samples and Quality Control Measures

We retrieved the raw RNA-Seq data and matched clinical annotations for 150 mCRPC samples from the 2019 Metastatic Prostate Adenocarcinoma-Standup2Cancer/Prostate Cancer Foundation Dream Team: Precision Therapy for Advanced Prostate Cancer study (dbGaP Study Accession: phs000915.v2.p2). We used the SRA toolkit version 2.9.6.1 to download data with controlled access from the Cbioportal [6] and GitHub [7].
We performed a quality control assessment on all raw sequence reads ahead of alignment to the human reference genome using Fastp v0.20.1 [8]. We removed bad-quality base pairs and contaminated adaptors from the dataset and then used Fastp to check for the presence or absence of overrepresented sequences, the guanine and cytosine (GC) percent distribution, and the proportion of GC base pairs across all reads. Fastp scores the overall sequence quality and overrepresentation to diagnose potential sequence quality issues.
We then mapped 269 patient transcriptomes to the human reference genome (GRCh.38.p13) using STAR v2.7.3a [9]. We performed a quality control assessment on read alignment using FASTQC v0.11.9 by visualization with MULTIQC v1.11 [10]. Low-quality samples, samples possessing no matched clinical data, and RNA-Seq samples not prepared using a hybrid selection or capture method of enrichment were filtered out and removed. Samples prepared using poly-A selection were filtered out because this method would not detect non-coding RNAs such as miRNAs and some lncRNAs needed for future analysis; 198 samples remained.
We then filtered for duplicates/replicates to preserve the integrity of analysis. This reduced our sample size, and 89 samples remained. Samples were originally sequenced using Illumina HiSeq 2000. Years later, samples were re-sequenced using Illumina HiSeq 2500. For consistency, we filtered out the 20 samples that were sequenced using only Illumina HiSeq2000 and proceeded with the samples that were sequenced using Illumina HiSeq2500; 69 samples remained. Finally, we filtered the remaining samples for tissue sites that had n < 10, as we needed at least 10 samples in each group to detect differences by tissue site in our analysis. This resulted in our team proceeding with three mCRPC tissue types (liver, lymph node, and bone).
After applying quality control and normalization measures featured in the DESeq2 package [11], we retained 60 mCRPC samples for analyzing RNA-Seq data and clinical characteristics (Table 1). The patients’ median age was 65, and Gleason scores (GS) ranged from 6–10, with 24 samples labeled as unknown (UNK). Four patients had a UNK hormone therapy status. Less than half of the samples (n = 25) were exposed to abiraterone and enzalutamide, whereas the remaining patients (n = 31) were treatment-naïve. The majority of patients (n = 37) were treatment-naïve for taxanes. For our final study total, we only included patient samples retrieved from single metastatic tissue sites in the bone (n = 15), lymph node (n = 34), or liver (n = 11). Other metastatic sites were excluded due to there being so few cases.

2.2. Normalization and Gene Expression Quantification

We used featureCounts v1.5.0-p3 to quantify counts from the RNA-Seq data and imported that data in R Studio version 3.6.3 [12]. We normalized read counts with respect to library size using DESeq2 [11] and applied log2 scale transformations to minimize differences between sample rows with <10 counts.

2.3. Co-Expression Network Analysis and Module Identification

We transformed the data frame to match the WGCNA format, with samples arrayed across rows and genes across columns. We found no gene or sample outliers that did not pass the criteria on the maximum number of 50% or less missing or low weight values when executing the function goodSamplesGenes(). We then uploaded gene expression and clinical data as a matrix data table, with read count data across rows and clinical annotations across columns. We clustered samples by expression level using signed network connectivity with default parameters. We then produced a heatmap and dendrogram of the sample clusters and clinical traits to visually identify any sample outliers, one of which we removed (sampleID: SRR8311618). We segmented the resultant dataset into three matrices that discerned gene clusters by tissue site (bone, liver, or lymph nodes). In each matrix, we coded samples with a “1” if they were positive for the respective tissue site, whereas all others were assigned a “0”.
We constructed a matrix to correlate tissue sites with co-expression amongst genes in the network. We used a manual block-wise network to facilitate WGCNA and perform module detection. We chose an appropriate soft threshold power of β for the network topology analysis based on the scale-free topology criterion [13]; we chose the lowest β that crossed the R2 cut-off of 0.90 to yield an approximately scale-free topology, as measured by the scale-free topology fitting index. For the analysis type, we used a signed network adjacency calculation to translate the adjacency into a topological overlap matrix (TOM) and calculated the corresponding dissimilarity as dissTOM = 1-TOM [14]. We generated a cluster tree based on TOM dissimilarity and controlled the minimum number of genes clustered in a module by setting minModuleSize/minClusterSize to 30 and deepSplit to 4, imbuing high sensitivity to cluster splitting. We finally used the Dynamic Cut Tree method to show the eigengene network heatmap and gene cluster dendrogram tree for the 14 eigengene clusters (Figures 1A and 1B, respectively).
We calculated module eigengenes (MEs) based on a vector of color assignments with the same length as the number of gene rows in the data frame. The calculation is the first principal component of the variance for all members of each respective module. We then ranked modules by the number of genes in each module (i.e., the size). We used the function signedkME to reassign membership to the MEs based on connectivity and the Pearson correlation function to calculate the ME co-expression similarity. We saved the resultant consensus kME (eigengene-based connectivity) values and created a heatmap for each clinical trait using the first principal component of each module (Figure 2). These MEs were representatives of all genes in each module [14,15].

2.4. Enrichment Analysis, Differential Expression Analysis, and Hub Gene Identification

We used functional annotation approaches to explore the biological function of ME genes, including Gene Ontology (GO) and Kyoto Encyclopedia of Genes and Genomes (KEGG) pathway analyses. We conducted a pathway enrichment analysis for genes co-expressed in the cyan module (Module 14, M14), which had a high corr222-elation with bone tissues metastases, using the Database for Annotation, Visualization, and Integrated Discovery (DAVID version 6.8) [16]. The cyan (M14) module contained 37 genes, from which we identified the top three highly enriched GO terms for each GO subdomain and KEGG pathway. In Table 2, we outline a list of significant genes and signaling pathway terms from the KEGG pathway analysis.
We adapted a method for differential gene expression analysis [5] to identify upregulated or downregulated genes in the MEs and to analyze differences between the metastatic sites. For example, Figure 3 shows differential gene expression for bone metastases versus other metastatic sites (lymph node and liver).
We constructed a protein–protein interaction (PPI) network for genes found in the cyan (M14) module (Figure 4). For visualization purposes, we constructed a gene co-expression network map based on the relationship and connectivity of genes using STRINGdb, a database consisting of known and predicted protein–protein interactions [17]. We chose genes with a score ≥0.4 to build a network model with 18 gene nodes (proteins) that we visualized with Cytoscape version 3.9.0 [18].
We selected candidate hub genes using the Cytoscape plugin called cytoHubba [19], which ranks nodes in the PPI network by their network features and scores each node gene by the top 10 algorithms: Maximal Clique Centrality (MCC), Density of Maximum Neighborhood Component (DMNC), Maximum Neighborhood Component (MNC), Degree, Edge Percolated Component (EPC), BottleNeck, EcCentricity, Closeness, Radiality, and Betweenness.

2.5. Statistical Analysis

To compare differential expression among tumor sample conditions, we performed statistical analyses using an unpaired two-tailed t-test in R Studio version 3.6.3 and considered p < 0.001 statistically significant.

2.6. Transcriptome Deconvolution and Tissue Expression Correlation Analysis

To estimate the proportion of immune and cancer cell make-up within the TIME from our bulk mCRPC RNA-Seq samples, we conducted bulk tissue transcriptome deconvolution analysis using a web-based tool called EPIC. A tab-deiminated text file displaying mCRPC samples with corresponding bulk gene expression counts given in fragments per kilobase per million mapped reads (FPKM) was used as the input into the tool (Table S1).
Finally, we employed GTEx, a web-based tool used to calculate the correlations between genotype and tissue-specific gene expression levels. We performed a multi-gene query using the genes most differentially expressed in our analysis. These genes included ALPL, CDH15, COL11A1, COL11A2, COL13A1, COL22A1, COL24A1, ENPP1, FOXF1, ITGA10, MAMDC2, OMD, PHEX, PHOSPHO1, PTH1R, PTX3, and RUNX2. GTEx did not have a bone tissue in their dataset for comparison, but upon comparison of our hub genes in prostate versus other tissue sites, we observed expression levels to be lower, on average, when compared to other tissue sites such as kidney, lung, whole blood, and spleen (Figure 5b).

3. Results

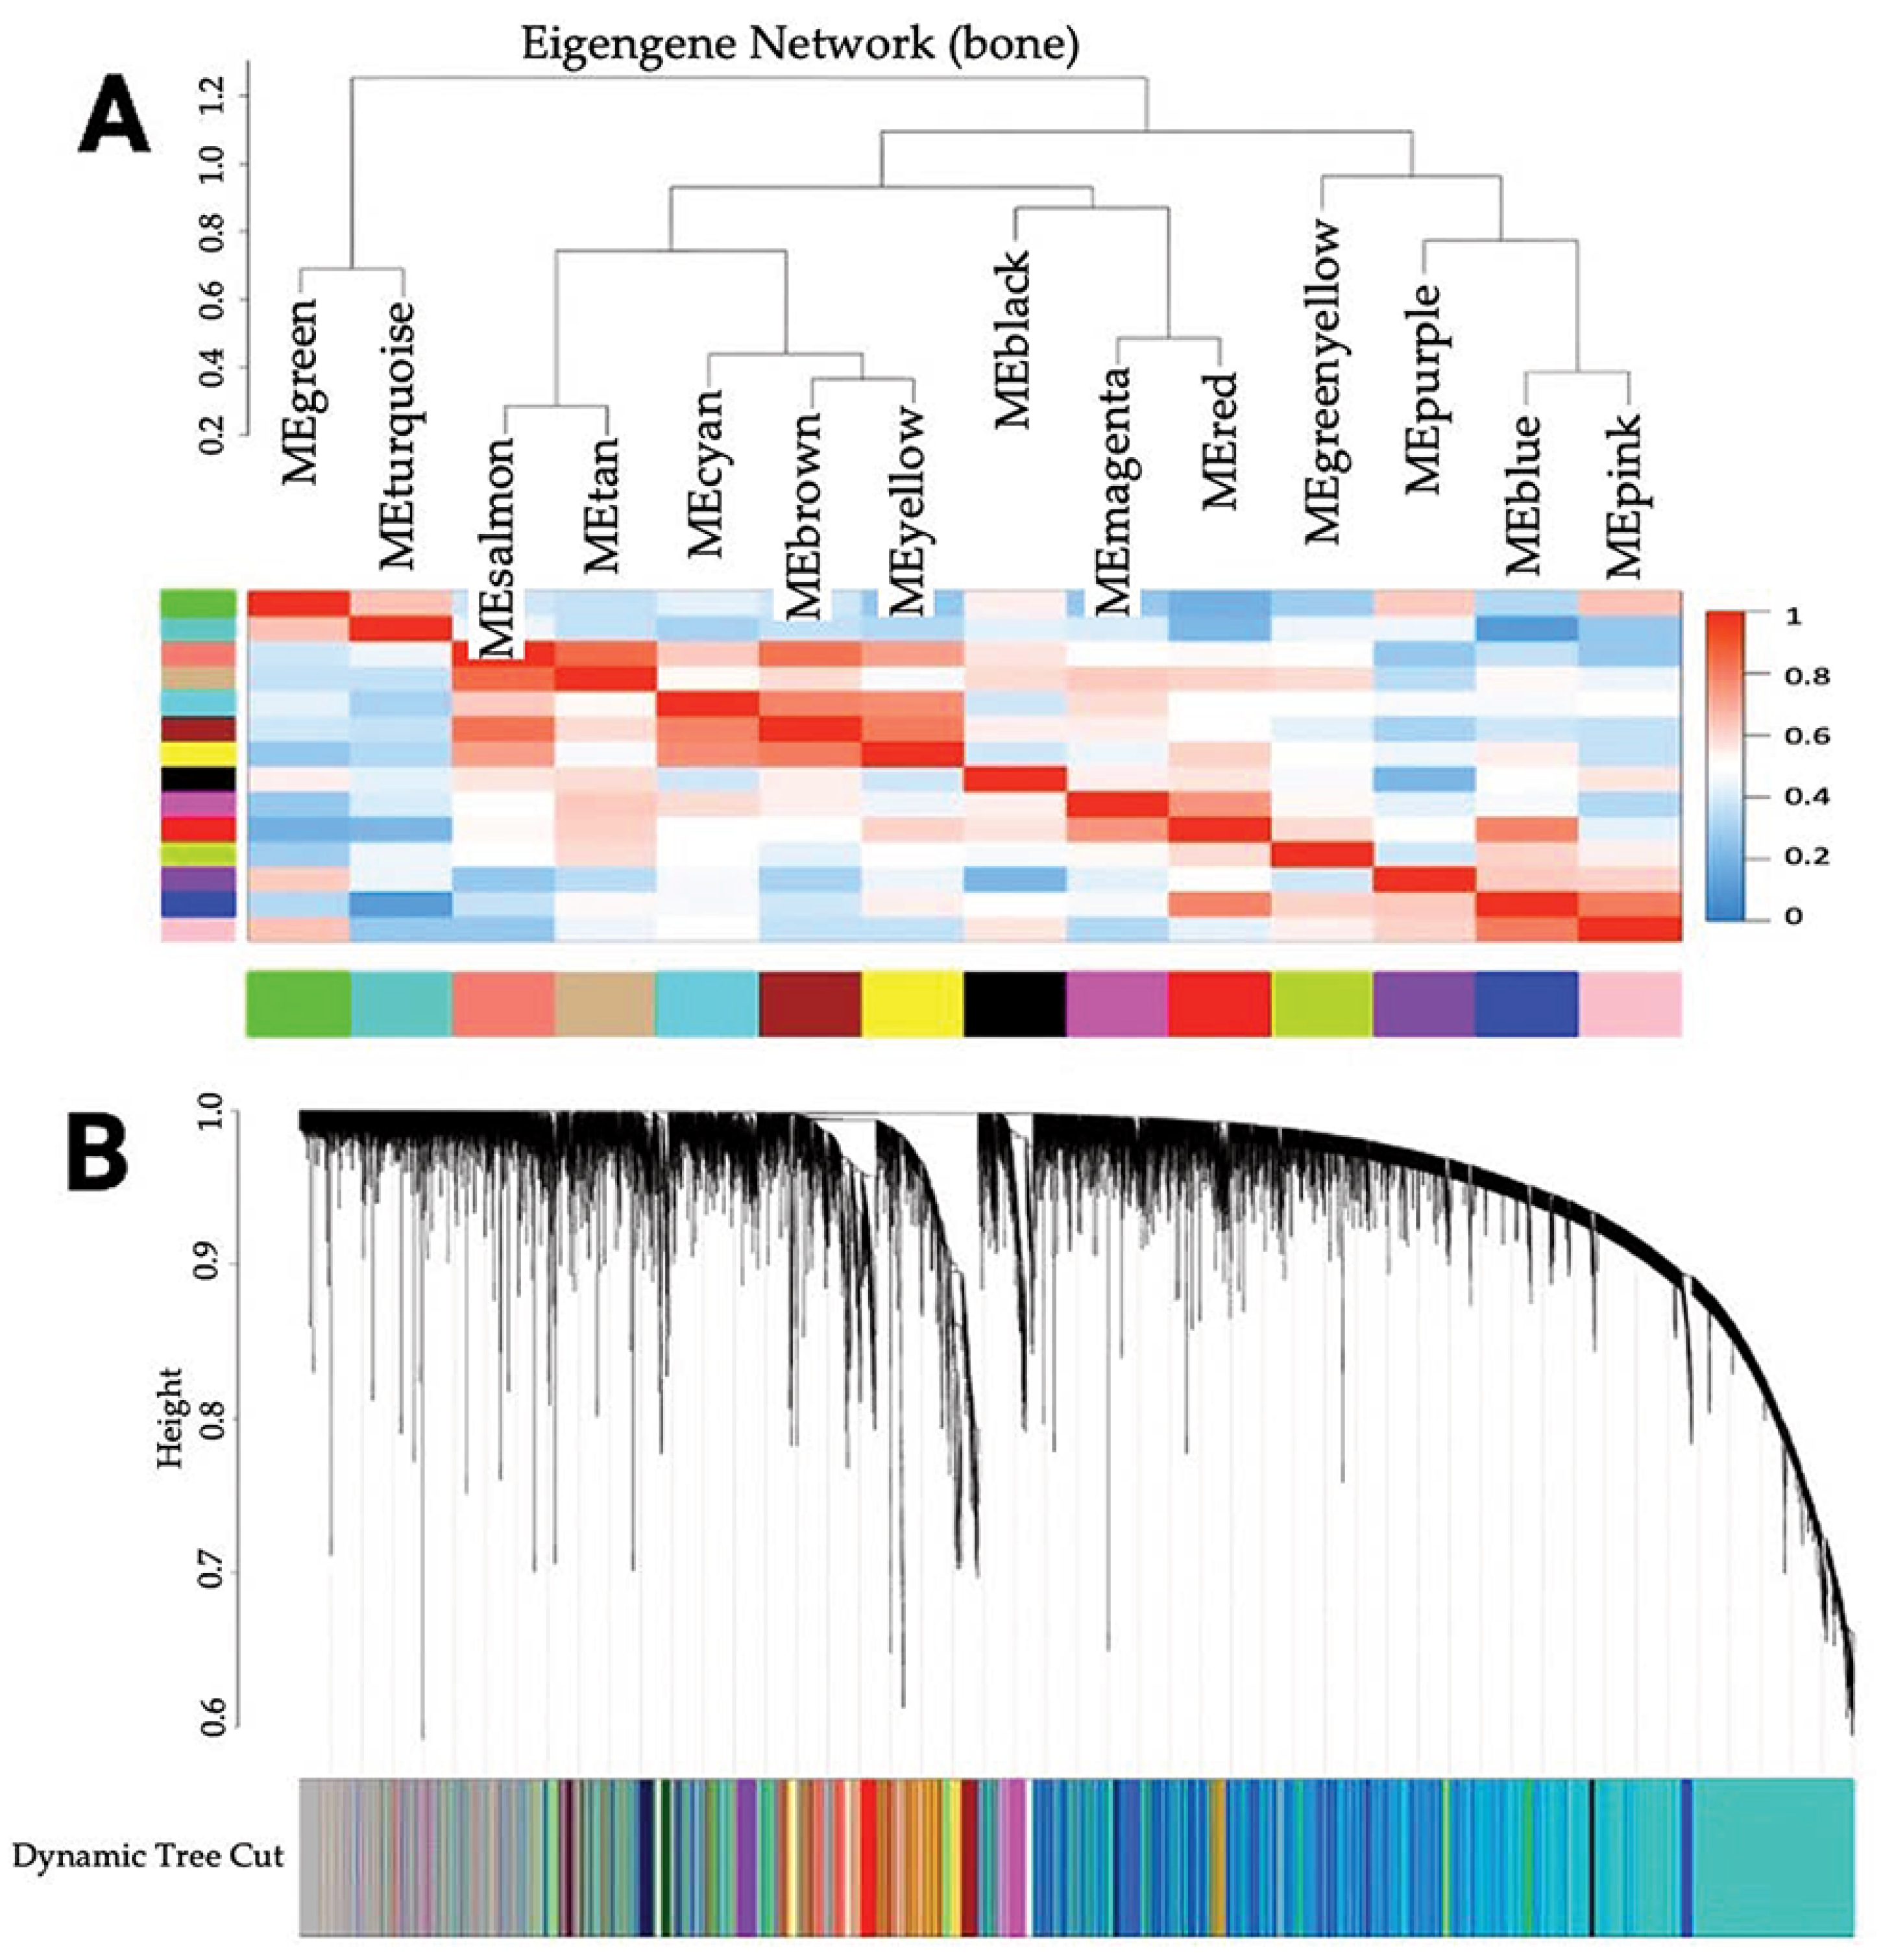
3.1. Identification of Co-Expressed Genes

We studied the transcriptomics of 60 mCRPC patient samples with matched clinical annotations. We chose the power of β = 9 (scale-free R2 = 0.90) to ensure scale independence for the scale-free network. We performed hierarchical clustering and Dynamic Tree Cutting to cluster co-expressed genes into modules (Figure 1).
We identified 14 modules from the construction of the eigengene network. These modules contained ≥30 genes per module: 5444 genes in the turquoise module (M1); 2174 genes in the blue module (M2); 1670 genes in the brown module (M3); 837 genes in the yellow module (M4); 556 genes in the green module (M5); 553 genes in the red module (M6); 385 genes in the black module (M7); 324 genes in the pink module (M8); 271 genes in the magenta module (M9); 125 genes in the purple module (M10); 82 genes in the green-yellow module (M11); 77 genes in the tan module (M12); 58 genes in the salmon module (M13); and 37 genes in the cyan module (M14).

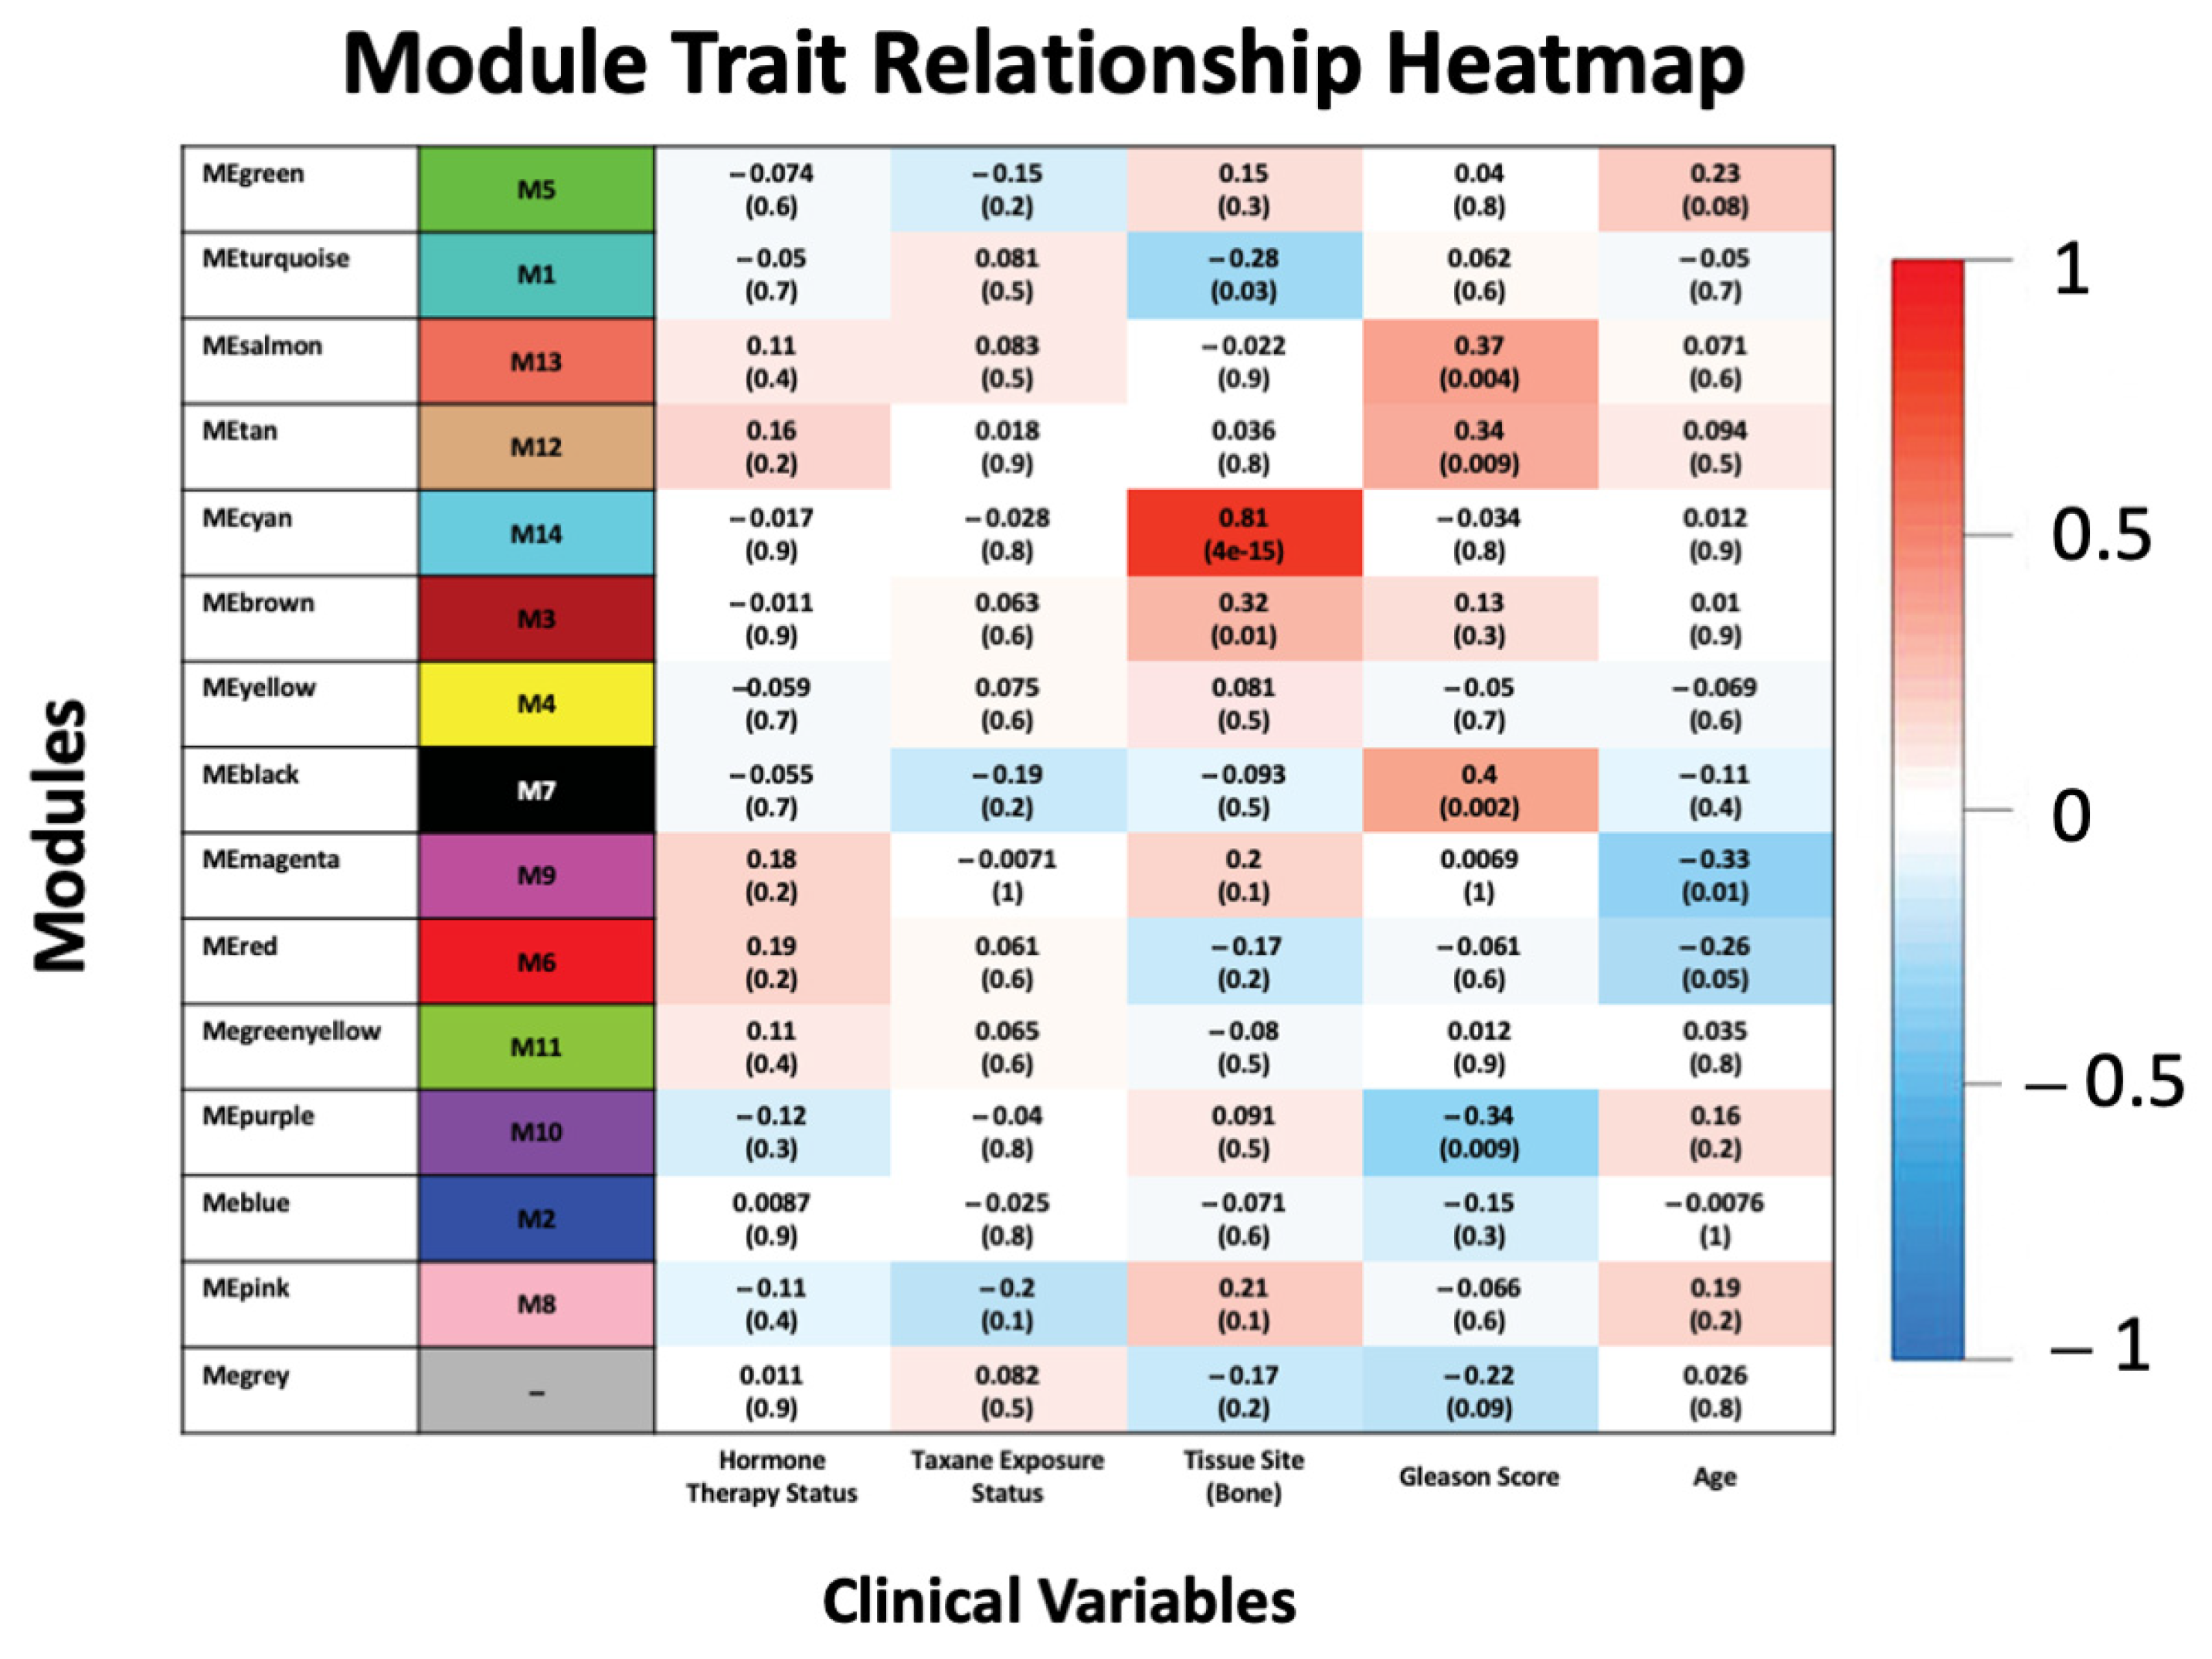
3.2. Association of Modules with Clinical Traits

Figure 2 relates the clustered dendrogram to the matched clinical annotations, including age, tissue site, GS, taxane status, and hormone therapy status. The cyan module (M14) was most positively correlated with the presence of bone metastases (r = 0.81, p < 4 × 10⁻¹⁵). We found that other modules were positively correlated with the GS, such as the salmon module (M13; r = 0.37, p < 0.004), the tan module (M12; r = 0.34, p < 0.009), and the black module (M7, r = 0.4, p < 0.002).

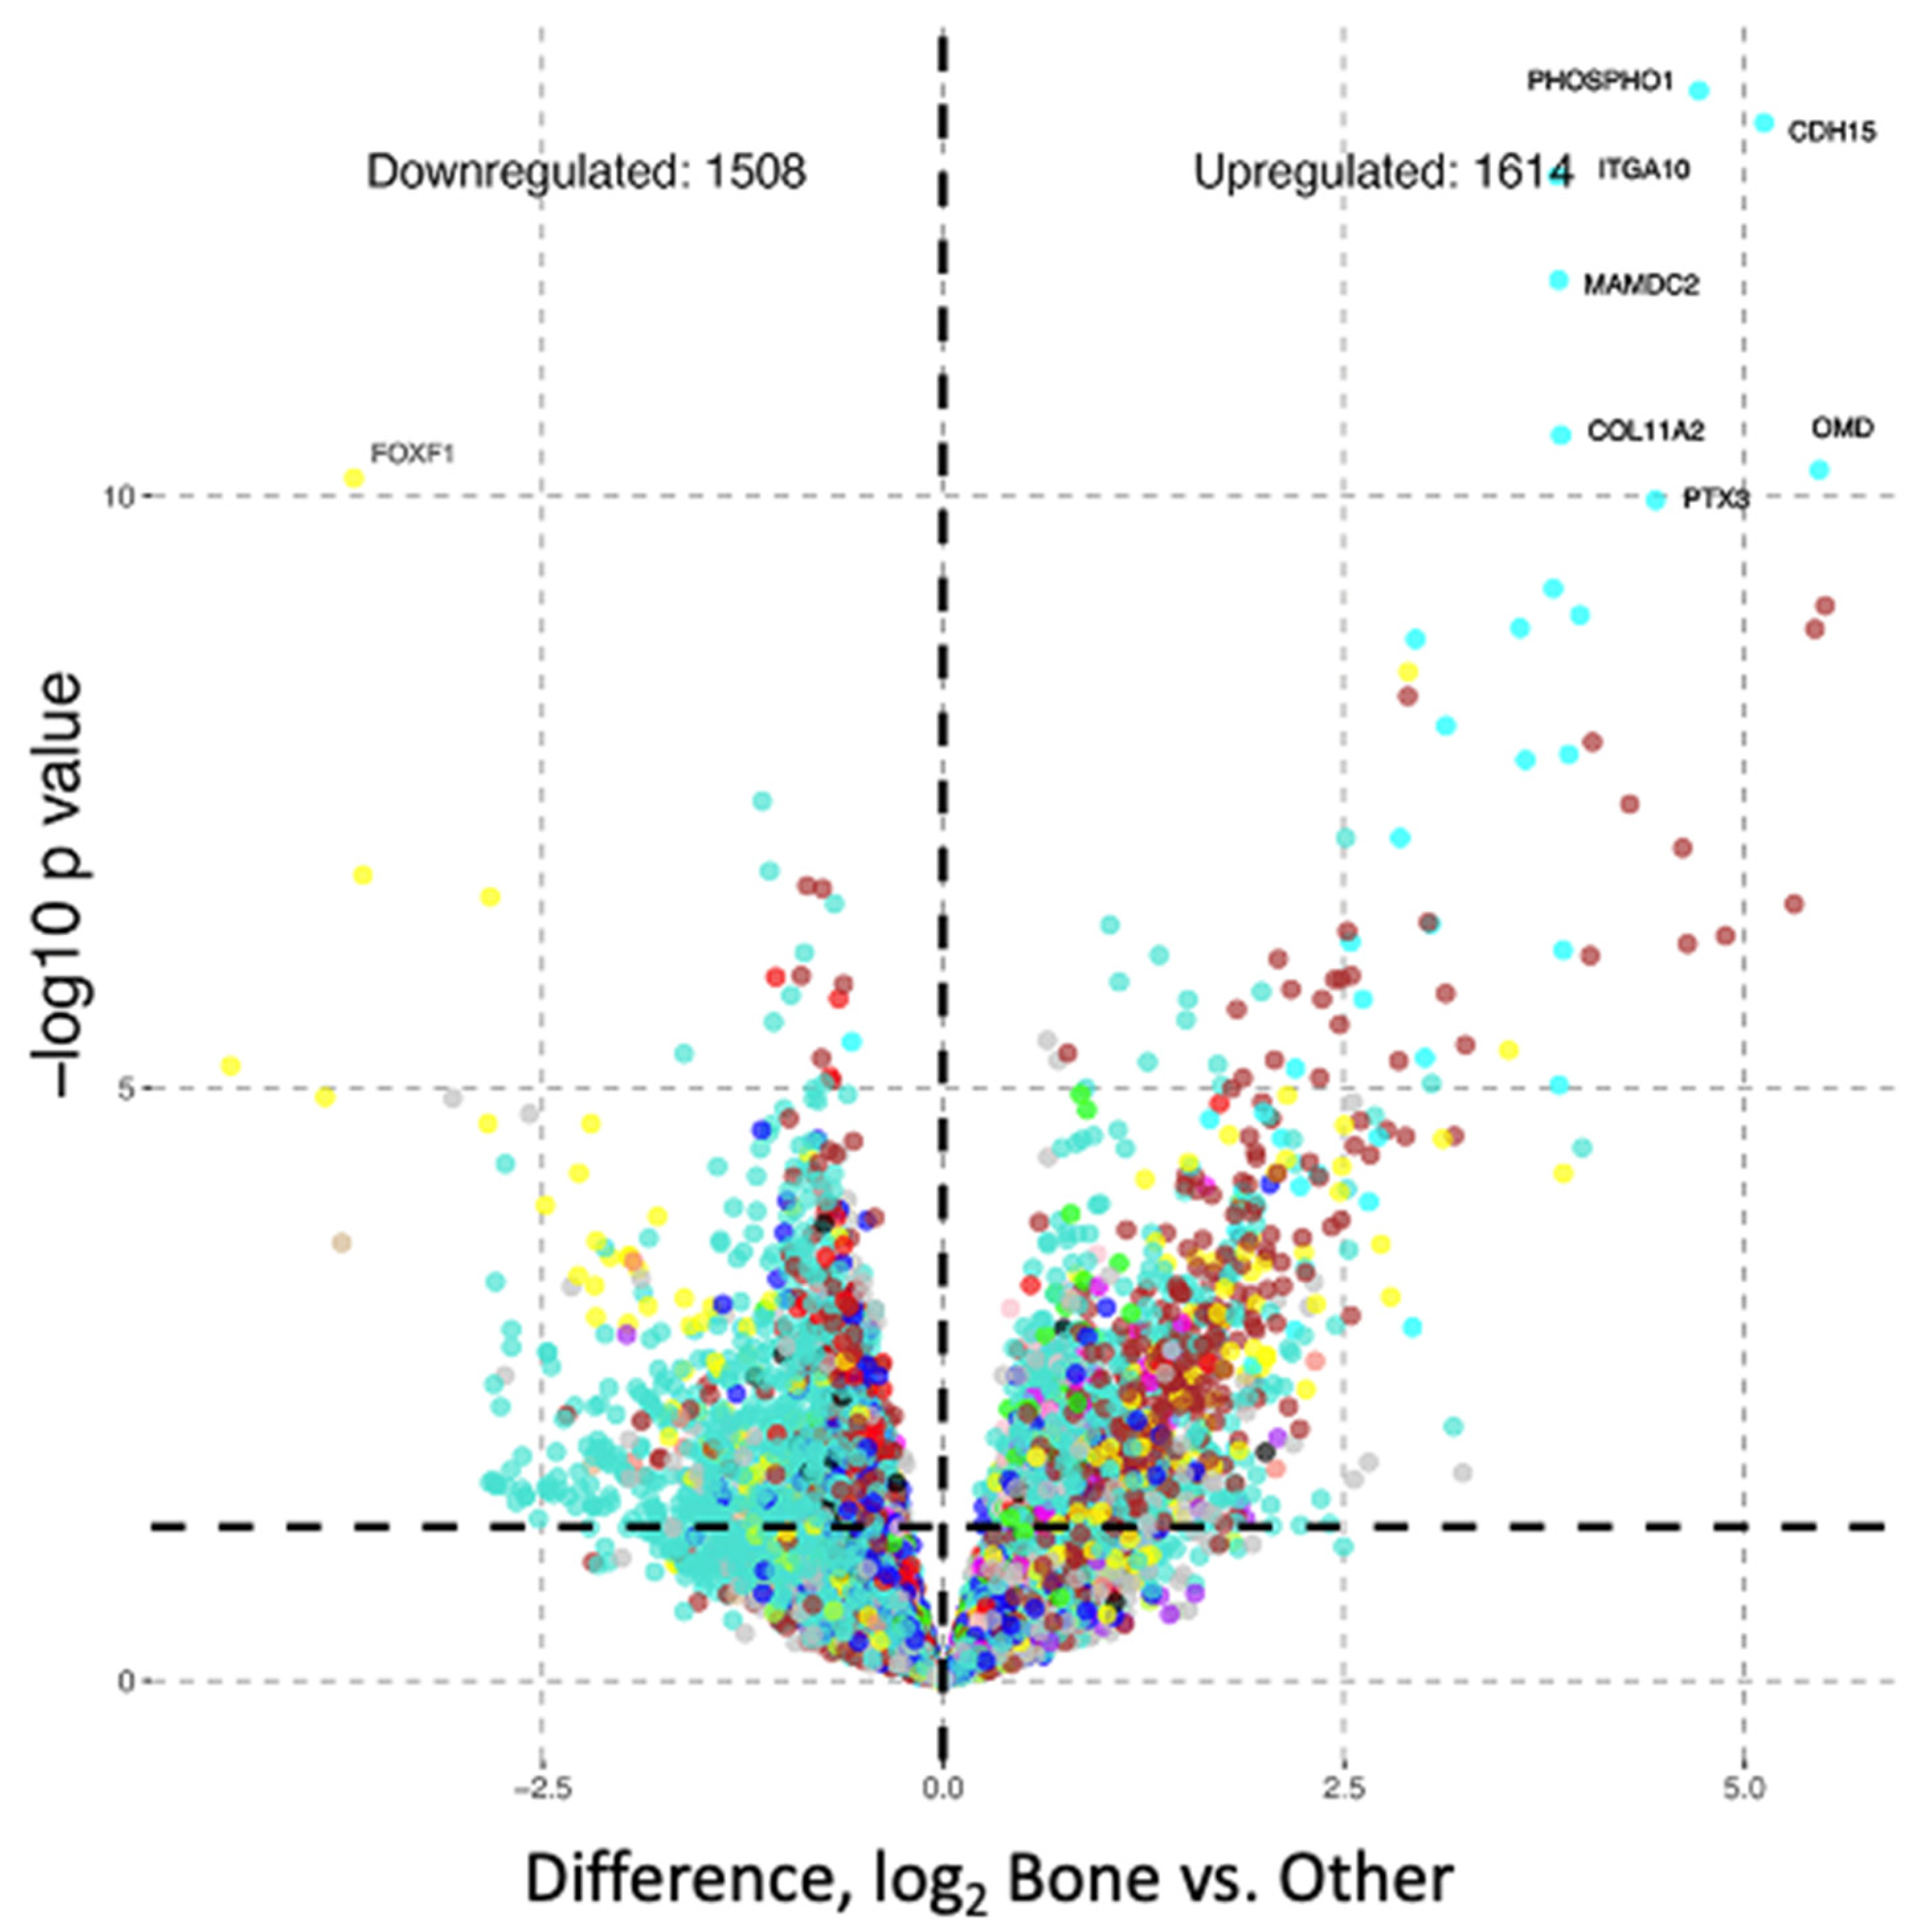
3.3. Differential Gene Expression Analysis

We identified 3122 differentially expressed genes in the study dataset (Figure 3). We modeled our analysis to compare bone metastases with the other two metastatic sites, the lymph nodes and liver. We observed seven upregulated genes (p < 1 × 10⁻¹⁰) within the cyan module (M14) and one downregulated gene (FOXF1) in the yellow module (M11).

3.4. Enrichment Analysis of Biological Features

In the cyan module (M14), 23 of the 37 genes had >0.70 consensus kME values: MAMDC2, PHOSPHO1, ITGA10, PTH1R, OMD, RUNX2, CTSK, CLMP, COL11A1, COL24A1, SHANK1, PTX3, CDH15, PLPP7, ALPL, COL22A1, MMP16, COL13A1, ADAMTS6, SATB2, ENPP2, EXTL1, and PHEX. Two genes (NMT1 and PSMD3) were negatively correlated with the presence of bone metastases and thus had low connectivity of membership to the cyan module (M14). We assessed comparisons with unpaired two-tailed t-tests and found p < 0.001 for all.
We used DAVID for GO and KEGG pathway analyses to afford a high-level view of the molecular signaling pathways that may drive gene co-expression in the cyan module (M14). We divided GO results into subdomains that represented biological processes, cellular components, and molecular functions, and we analyzed the top three GO terms for molecular functions with p < 0.01. The cyan module (M14) genes were mainly associated with endochondral ossification, skeletal system development, and collagen catabolic processes. KEGG enrichment analysis identified (p < 0.001) two signaling pathways involved in protein digestion and absorption and parathyroid hormone synthesis, secretion, and action.

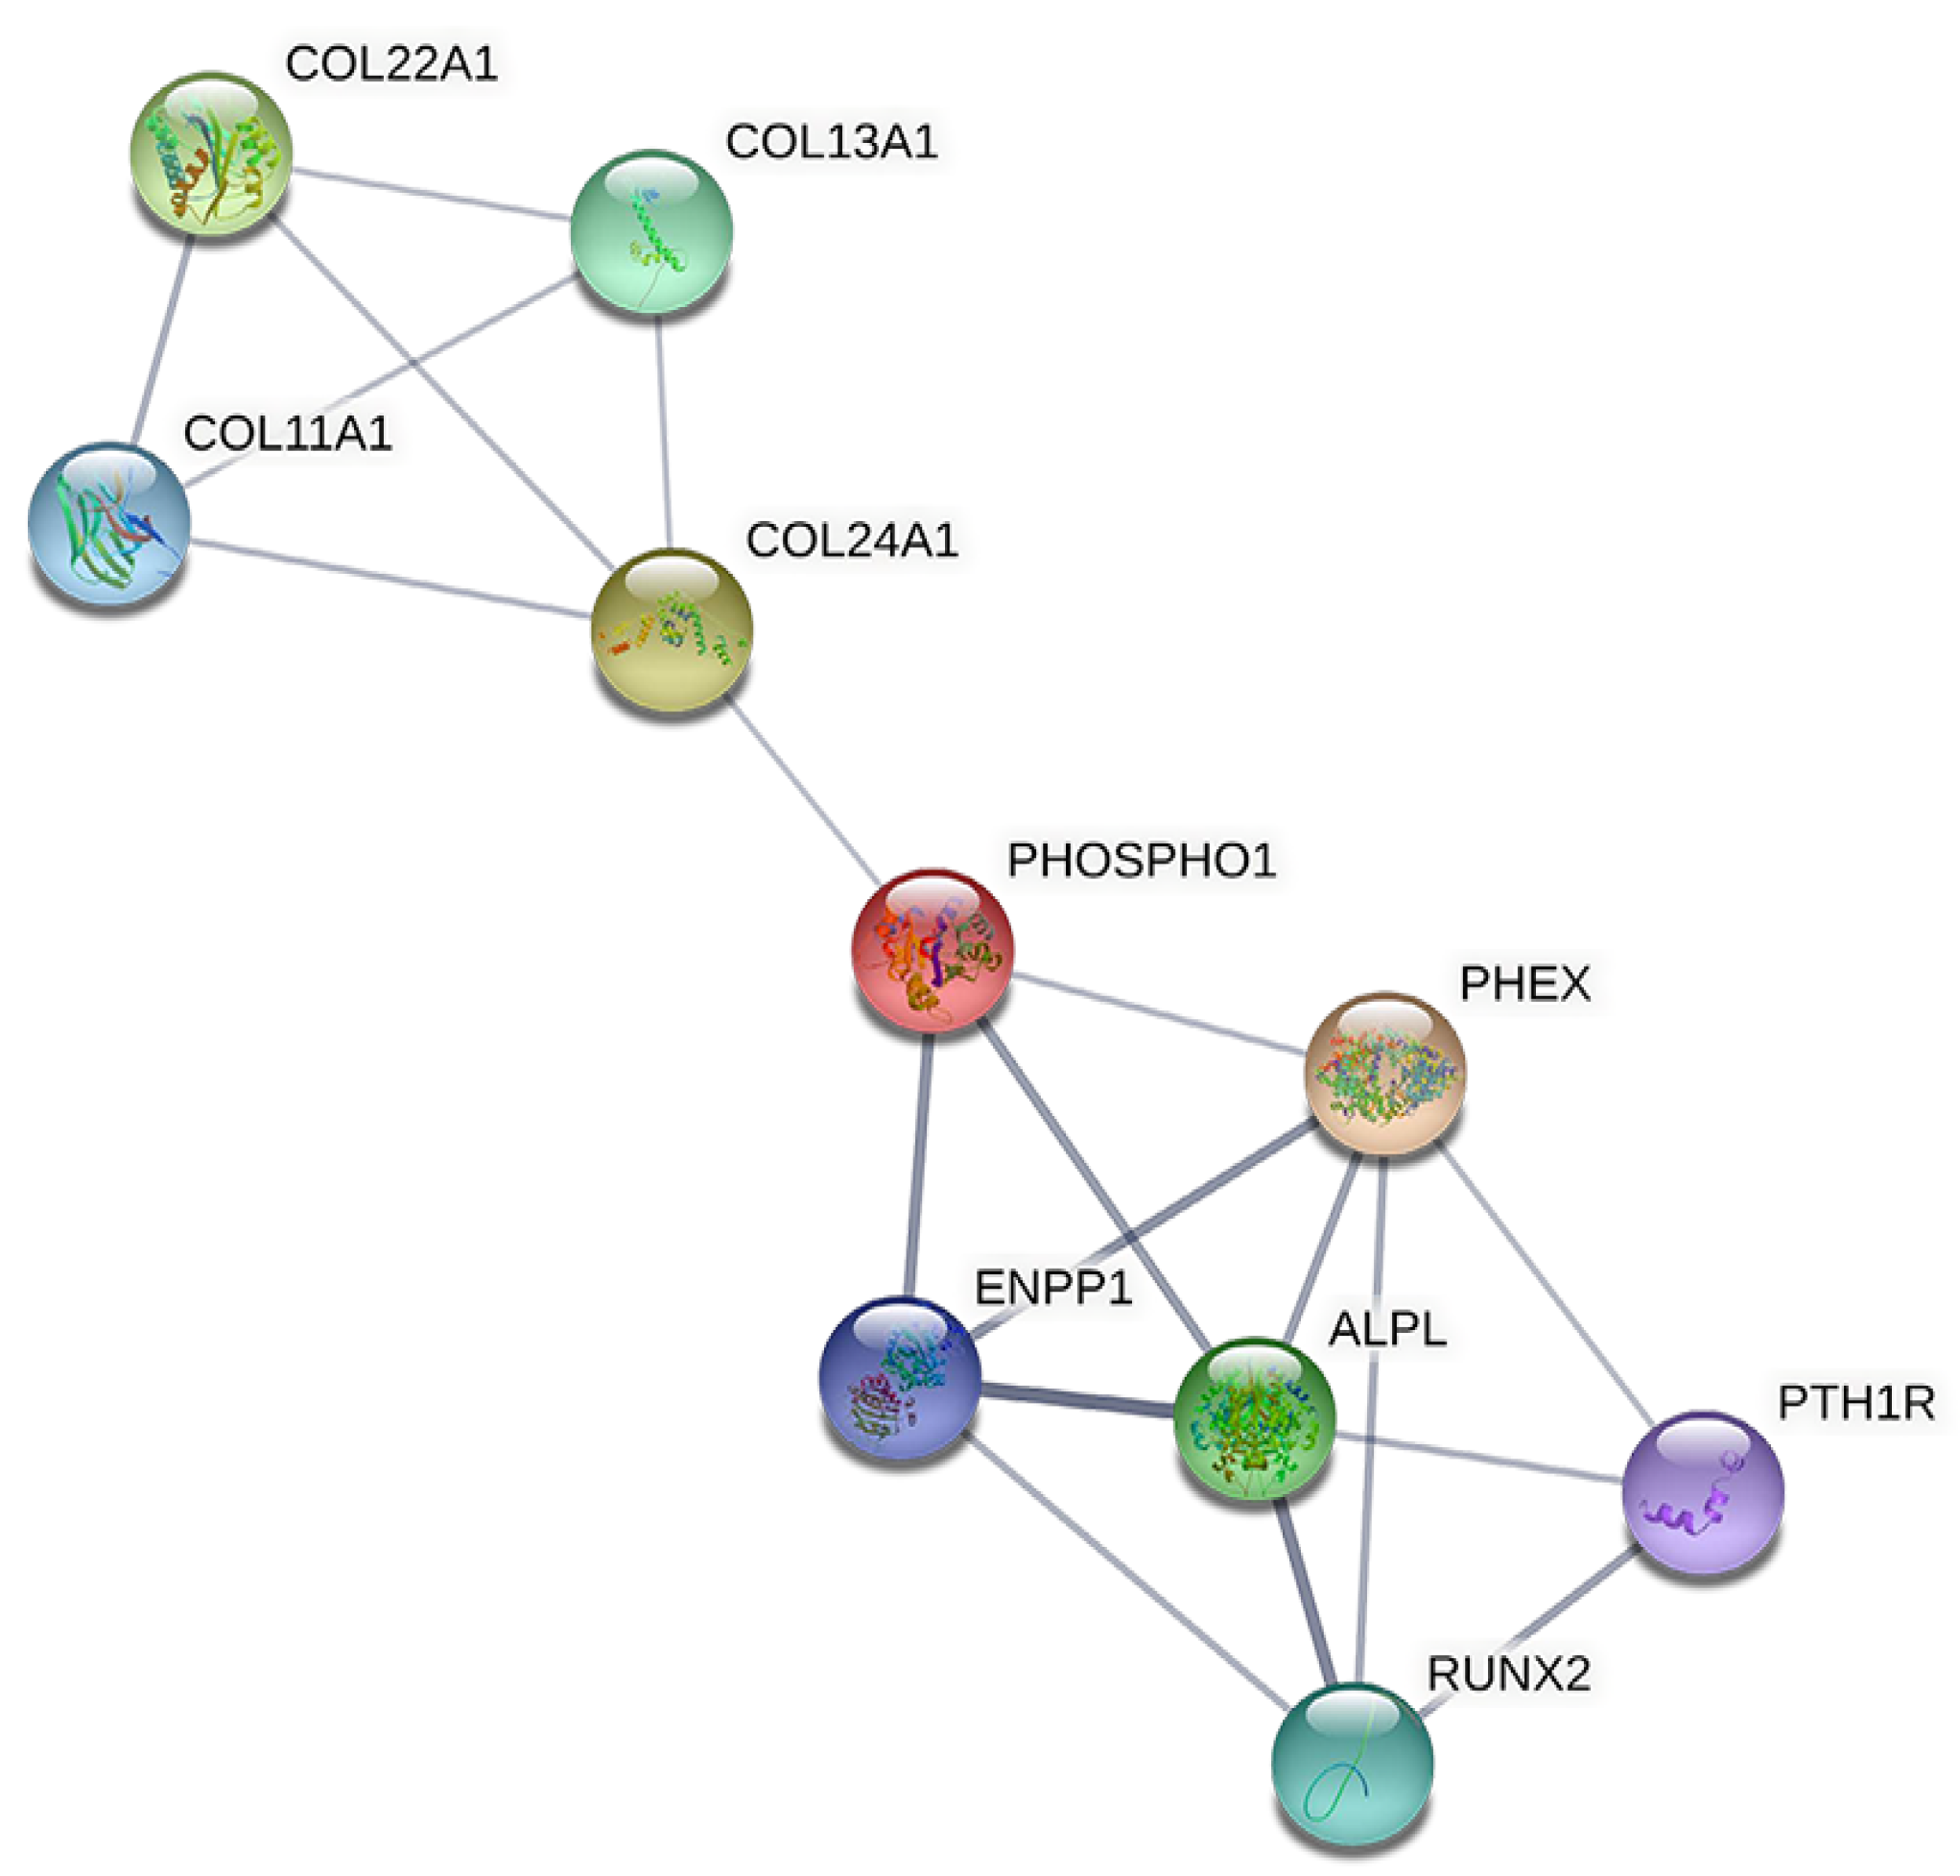
3.5. Identification of Hub Genes

PPI network analysis provides protein-level context to biological processes and helps predict the functional interactions of key genes in pathogenic molecular processes. Our PPI network had an enrichment p-value of <1 × 10⁻¹⁶ and contained 18 nodes (proteins) with 31 edges. We used cytoHubba to rank the nodes by their network features. We generated a list of ranked candidate hub genes in the PPI network using Maximum Clique Centrality as a topological analysis method [19,20]. The top 10 candidate hub genes were ALPL, PHEX, RUNX2, ENPP1, PHOSPHO1, COL24A1, PTH1R, COL12A1, and COL11A1 (Figure 4).

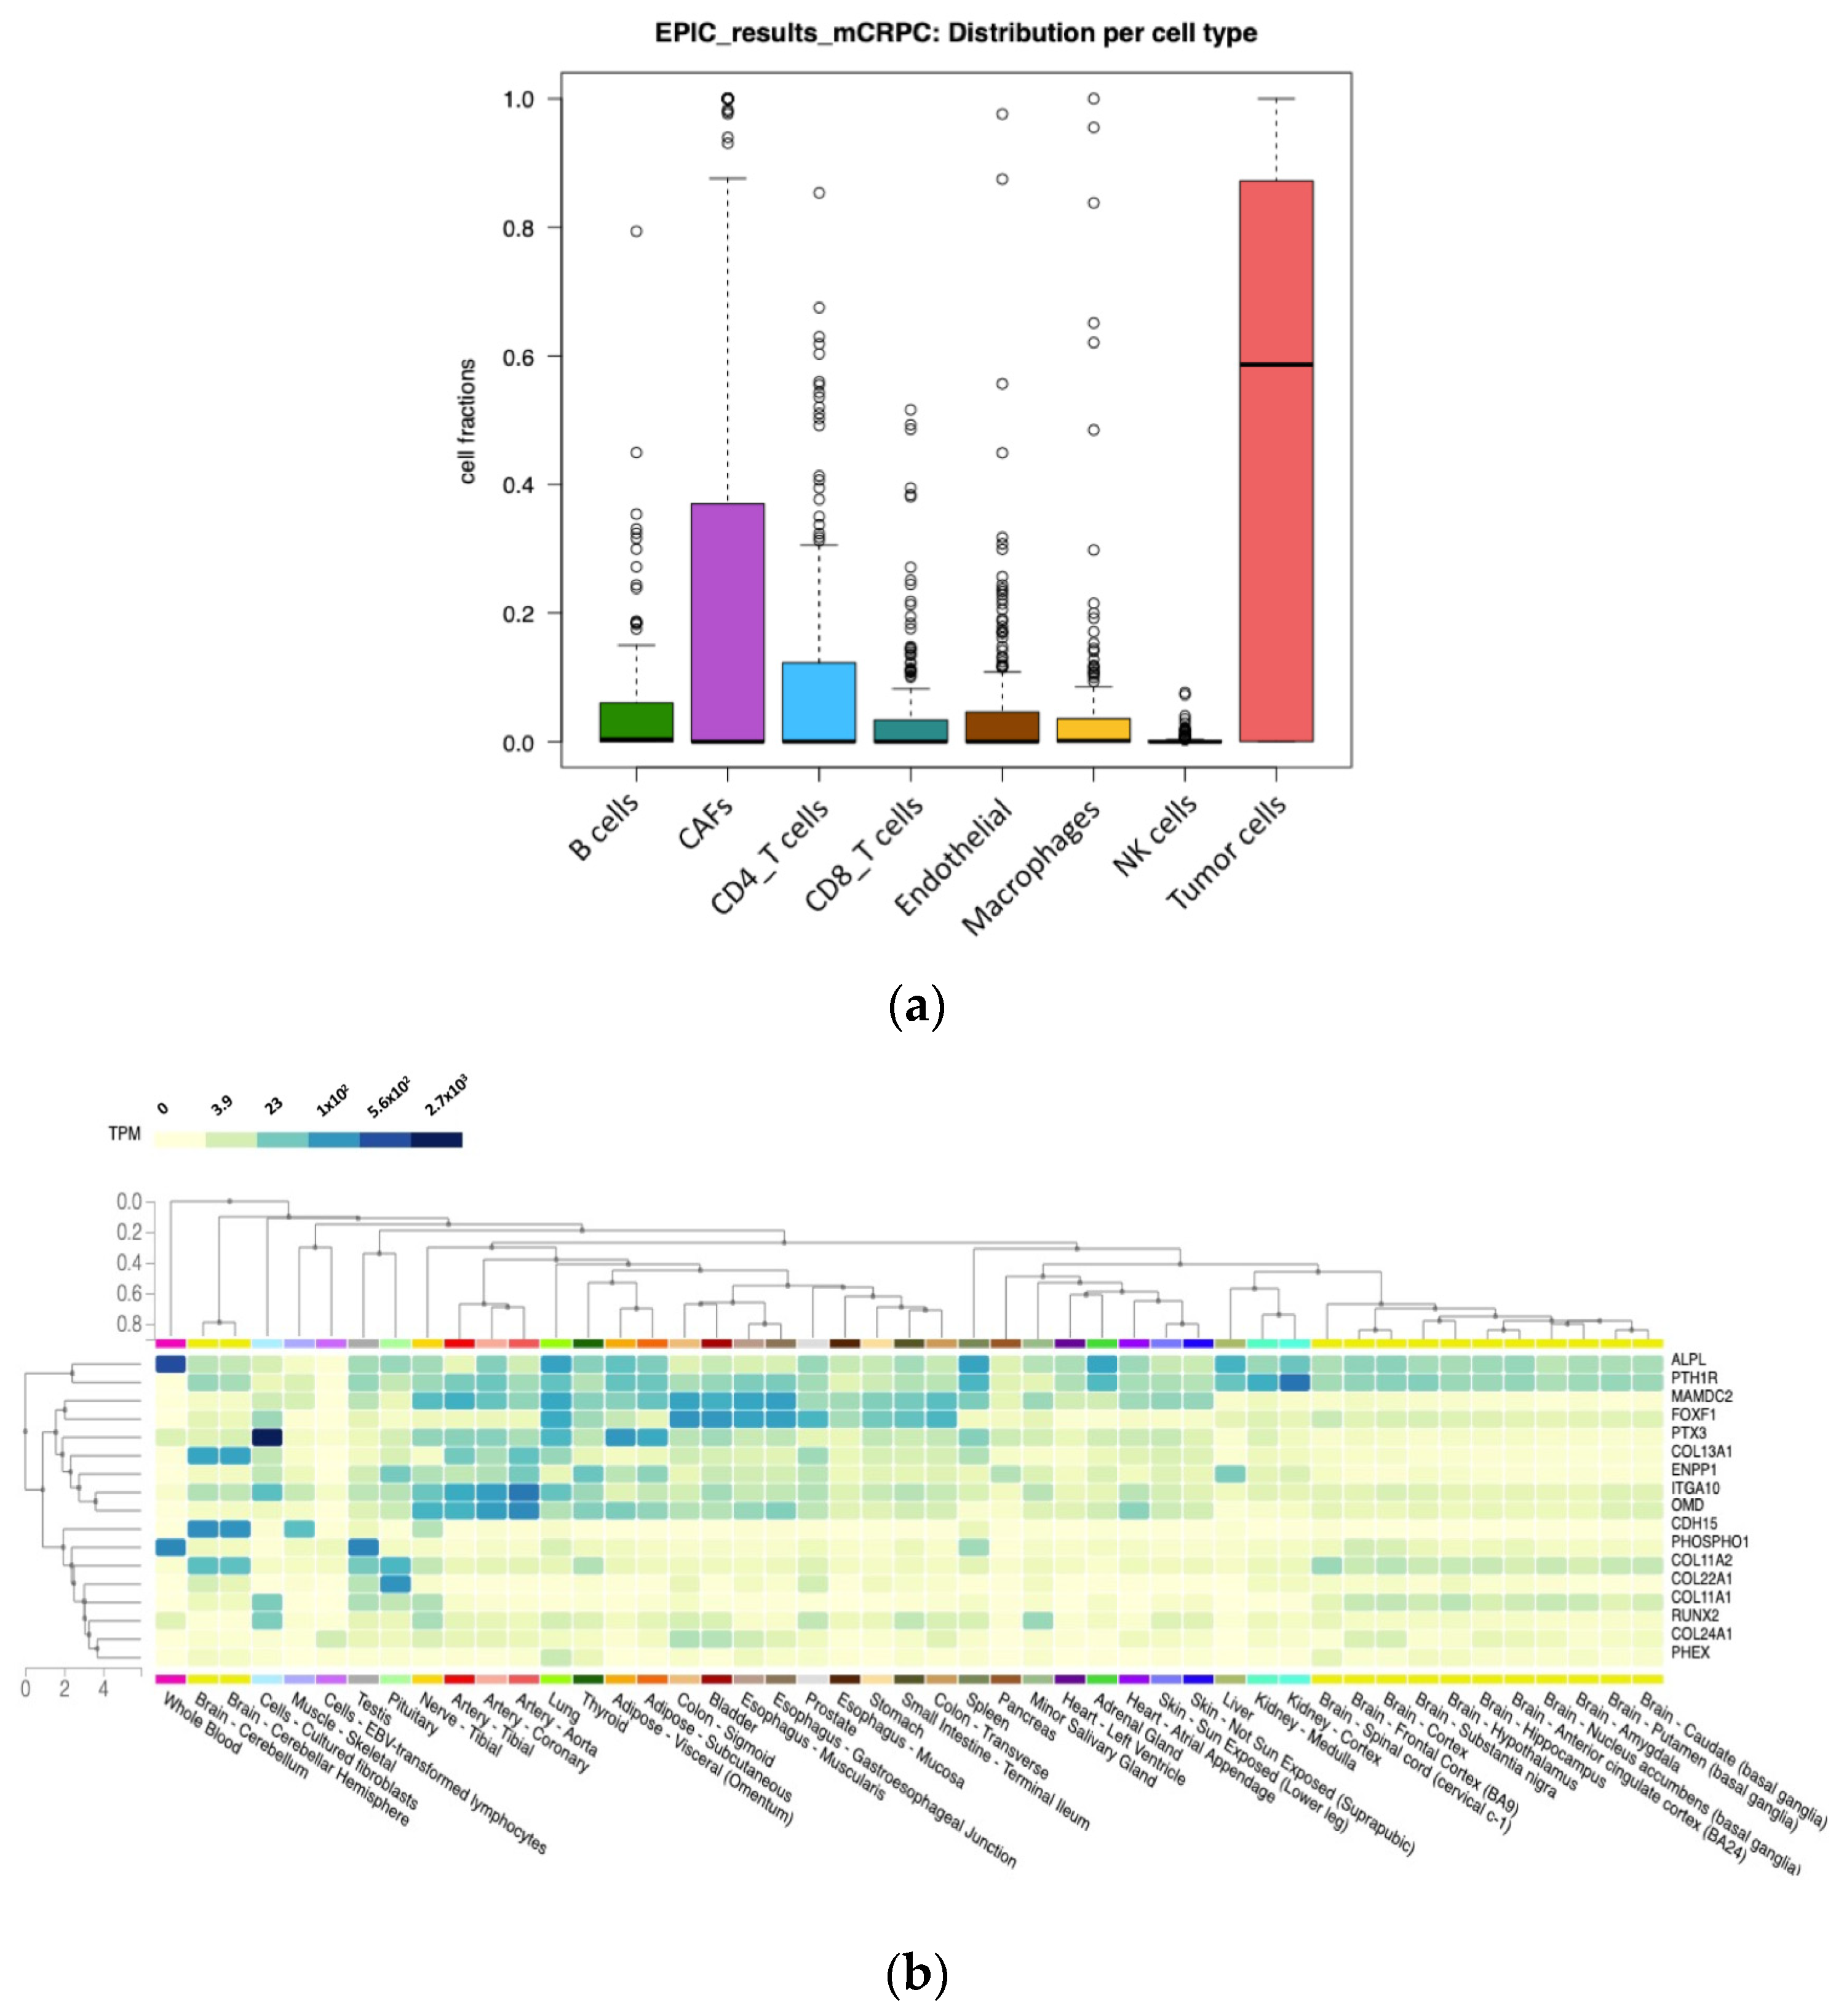
3.6. Transcriptome Deconvolution and Tissue Gene Expression Analysis
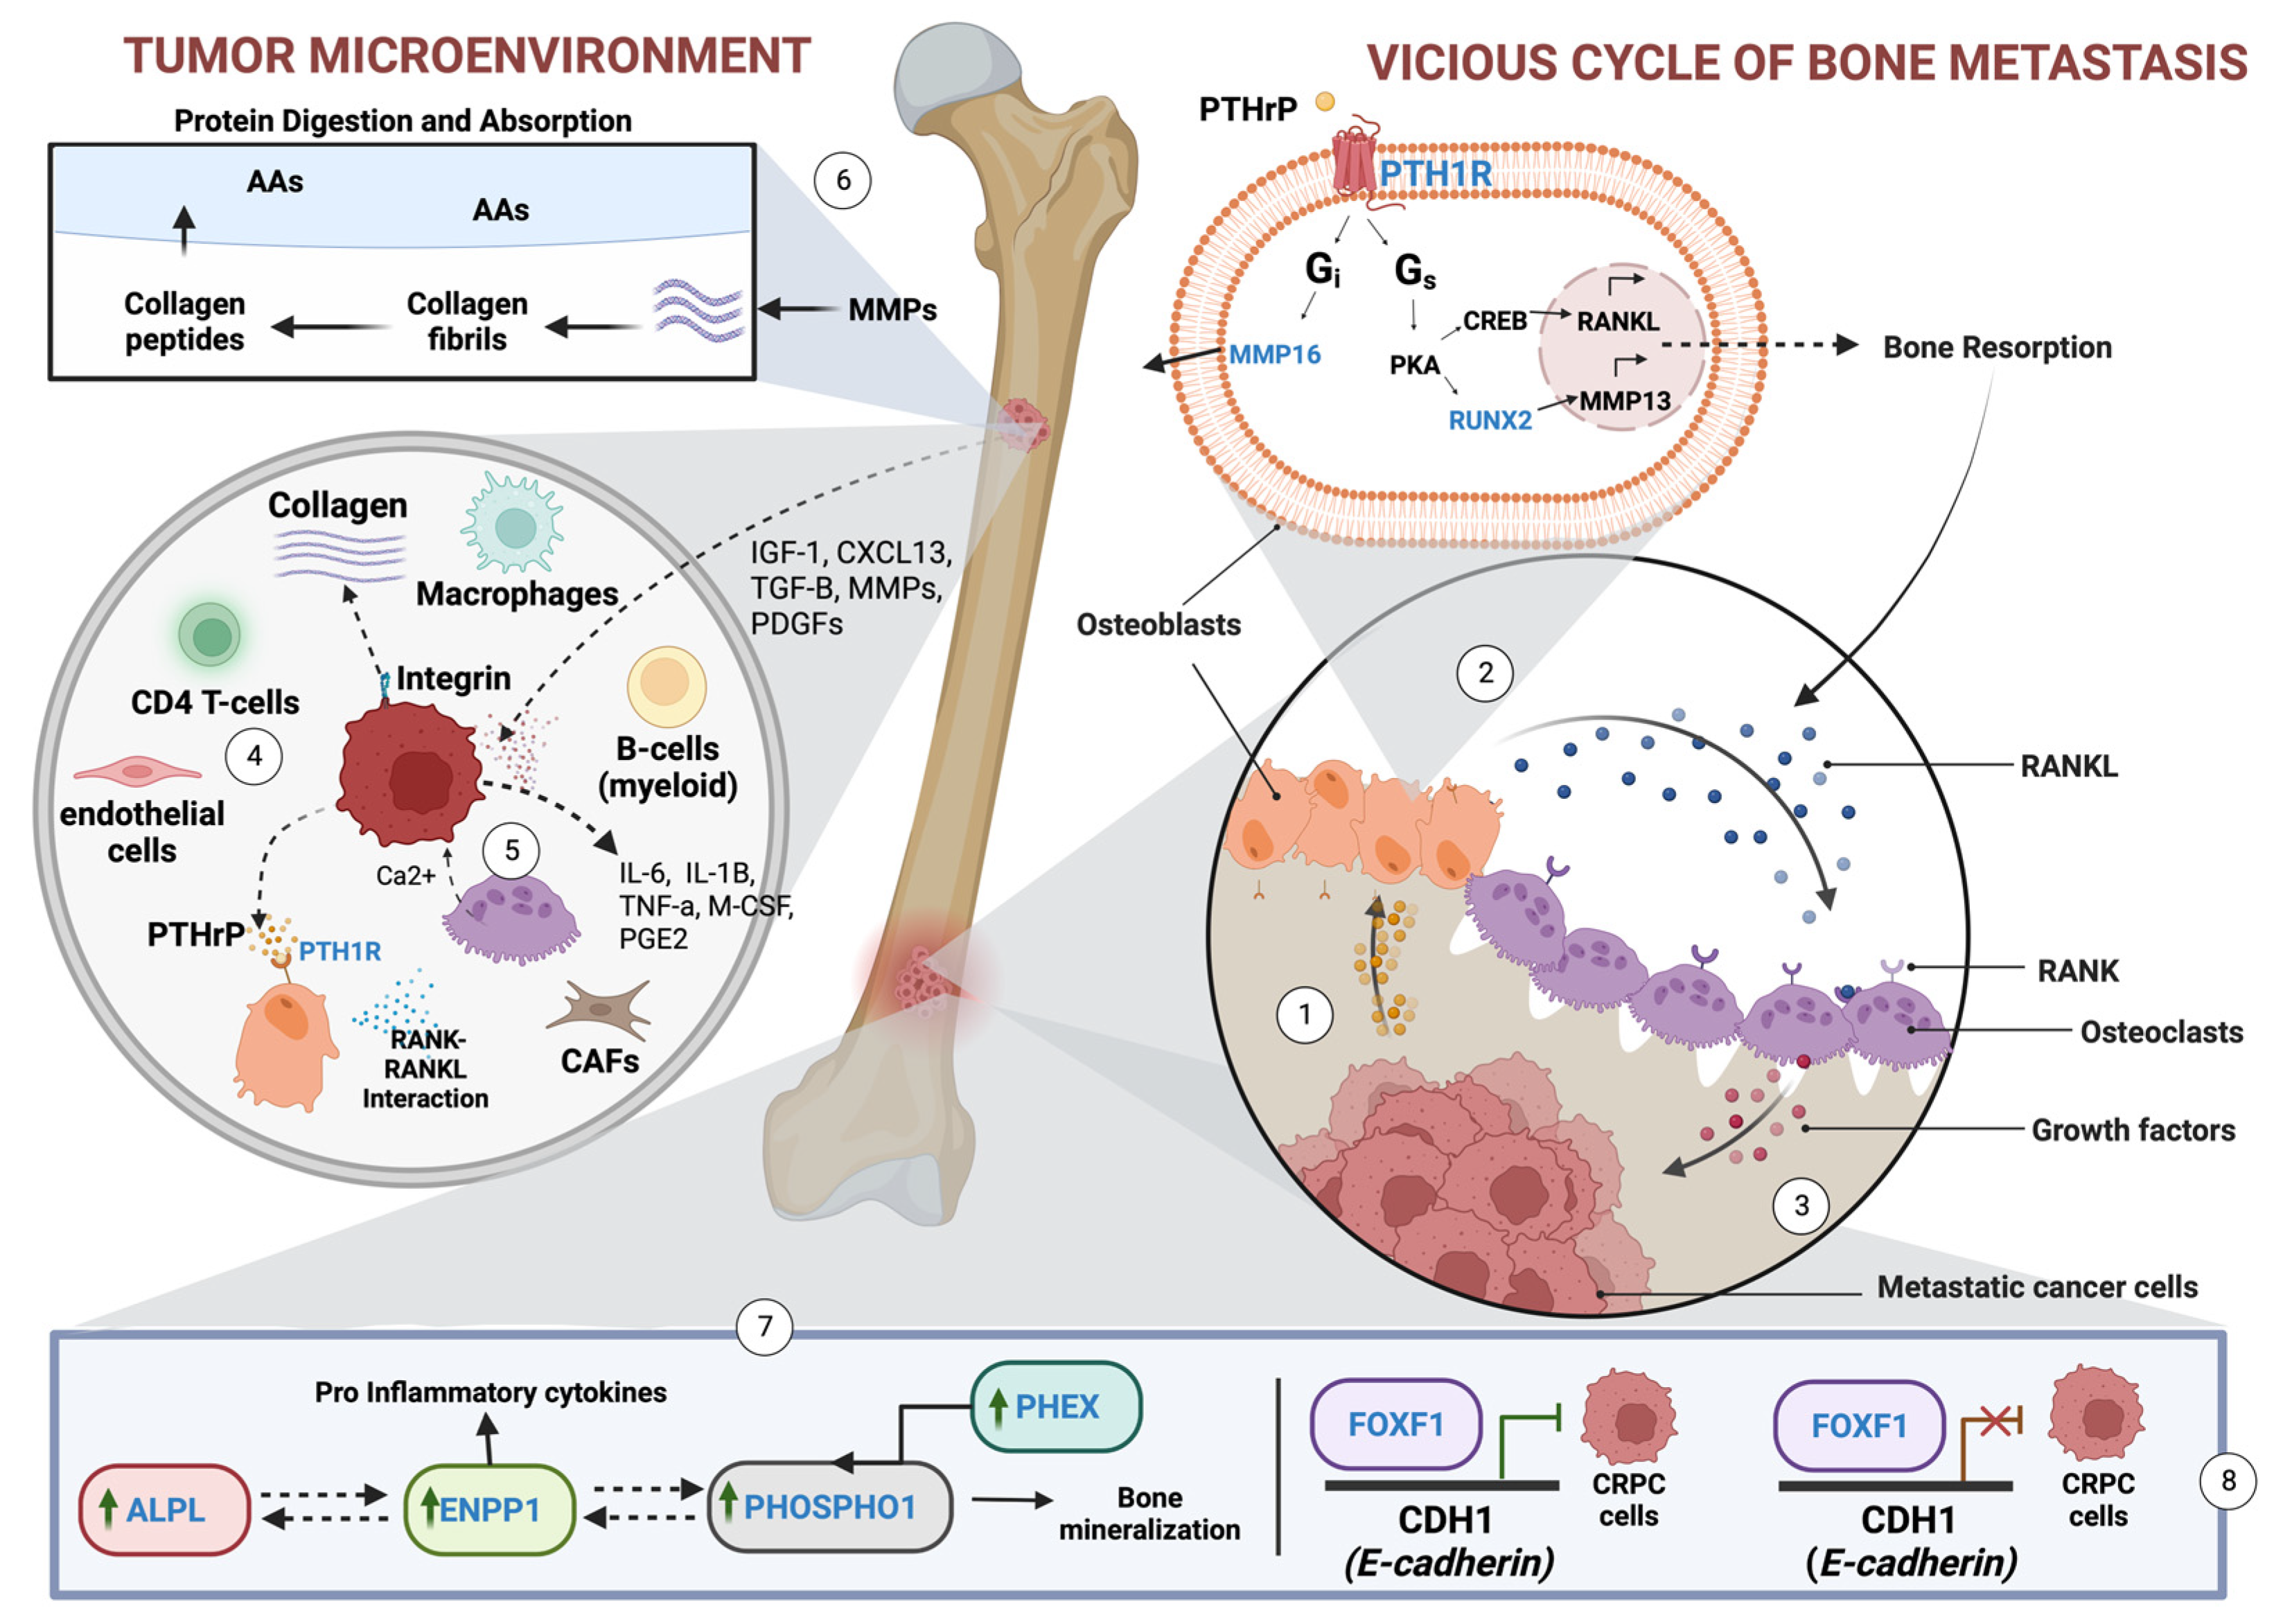
Results of our transcriptome deconvolution analysis showed a heterogenous mix of B-cells, cancer-associated fibroblasts (CAFs), T-cells, endothelial cells, macrophages, NK cells, and tumor cells (Table S2). Cell fractions per patient sample, on average, contained more than 60% tumor cells, followed by CAFs (~35%) (Figure 5a). GTEx analysis was performed to determine whether genes significantly differentially expressed in our WGCNA analysis were highly expressed in normal prostate tissue. Results show that our selected genes were not overexpressed in prostate tissue. However, ALPL was highly expressed in whole blood, PTX3 in cultured fibroblasts, and PHOSPHO1 in testis, spleen, and a few other tissue types.

4. Discussion

4.1. Key Findings in the Study

WGCNA holds great promise as a tool to interrogate human transcriptome data and elucidate molecular and signaling mechanisms for complex diseases, including PCa. In this study, we have characterized gene expression networks that may contribute to the heterogeneity and complexity of bone metastasis in mCRPC.
We identified 14 MEs positively or negatively correlated with age, GS, tumor site, hormone therapy status, and taxane exposure status. The cyan module (M14) was most positively correlated to the presence of bone metastases (R = 0.81, p-value = 4 × 10⁻¹⁵), and it contained 37 genes with potential clinical value. Enrichment analysis showed biological associations with absorption and reabsorption biological processes (e.g., endochondral ossification, replacement ossification, and endochondral bone morphogenesis) and signaling pathways involved in protein digestion and absorption parathyroid hormone synthesis, secretion, and action.
Our analyses revealed 10 hub genes with statistical correlation to bone metastasis in patients with mCRPC: ALPL, PHEX, RUNX2, ENPP1, PHOSPHO1, PTH1R, COL11A1, COL24A1, COL22A1, and COL13A1. Two of these genes (PHEX and PHOSPHO1) have not been previously associated with mCRPC, while all other hub genes have some verified association with mCRPC or PCa [21,22,23,24,25,26,27,28]. Together, our analysis showed an interplay between the tumor microenvironment, the bone metastatic niche, and our hub genes. Results from both EPIC and GTEx show that the tumor leverages the overexpression of genes and associated genes to establish, maintain, and survive in an environment suitable for its growth and further metastasis. Here, we propose a model to show the vicious cycle of bone metastasis, driven, in part, by genes found significant in our study (Figure 6).

4.2. Hub Genes Not Previously Associated with mCRPC

The PHEX gene codes for an enzyme (phosphate regulating endopeptidase homolog X-linked) that helps regulate phosphate balance. PHEX has been hypothesized to regulate fibroblast growth factor-23 (FGF23), which inhibits 1,25 (OH)2D synthesis and may negatively regulate parathyroid hormone (PTH) secretion [29]. We are the first to report that PHEX overexpression may be involved with the dysregulated mineralization of skeletal tissue during mCRPC bone metastasis. We hypothesize that mCRPC cells may leverage the PHEX function to maintain the TIME and impede wound healing in bone.
PHOSPHO1 is well known in wound healing [30] but has not been described within the TIME for mCRPC in bone. Our study is the first to suggest that PHOSPHO1 overexpression, enabled by ALPL and ENPP1 crosstalk, may be involved in mCRPC bone metastasis through the dysregulated mineralization of skeletal tissue. PHOSPHO1 is an attractive drug target, particularly for a series of benzoisothiazolinone inhibitors that have passed medicinal chemistry criteria and pose no cellular toxicity [31], but to our knowledge, there have been no therapeutic interventions with PHOSPHO1 inhibitors to date.
Hub genes associated with collagen (COL11A1, COL24A1, COL22A1, and COL13A1) and protein digestion and absorption signaling were upregulated in mCRPC samples with bone metastases. Cancer cells are known to reversibly reshape collagen to advance progression in a reinforcing cell–collagen loop [22], and our findings support and further resolve these molecular mechanisms. Further, research suggests that COL11A1 upregulation is associated with decreased recurrence-free survival in PCa and could be targeted as a prognostic biomarker [32], but we could not expand these findings as survival data were not available in this study’s data set.

4.3. Hub Genes Previously Associated with mCRPC

The remaining hub genes (ALPL, RUNX2, ENPP1, and PTH1R) are involved in the overexpressed pathway of parathyroid hormone synthesis, secretion, and action signaling. A parathyroid hormone-related peptide, PTHrP, is believed to initiate bone resorption by upregulating RANKL and releasing other growth factors that promote the vicious cycle of bone metastasis into the bone TIME (Figure 6) [33]. The underlying mechanism remains poorly understood. Here, we outline the possible mechanisms involved in prostate cancer bone metastasis, driven, in part, by the hub genes.

4.3.1. ALPL and RUNX2

ALPL plays a significant role in cell death and epithelial plasticity through its association with runt-related transcription factor 2 (RUNX2) and the receptor activator of nuclear factor kappa-b ligand (RANKL) signaling, both of which are downstream factors of parathyroid hormone signaling in the bone. Localized PCa cells express ALPL and significantly upregulate the ALPL gene for metastasis [24].
RUNX2 and RANKL signaling promotes the tumorigenesis of mCRPC in bone [24,34,35]. RUNX2 overexpression increases matrix metalloproteinase (MMP) expression and the invasion activity of the tumor, leading to PCa progression and metastasis [36,37]. The connective tissue growth factor (CTGF) reduces the ubiquitination-dependent degradation of RUNX2 and promotes RUNX2 acetylation in cancer cells, stabilizing RUNX2 and thereby increasing the production of RANKL and MMPs. If left unchecked, RUNX2 and RANKL signaling promotes osteoclasts to engage in a vicious cycle of bone matrix resorption and growth factor release that favors tumor growth and survival [38].
Taken together, our study further correlates ALPL and RUNX2 signaling with the molecular signaling of RANKL and MMP, a modulation that affects the tumor cell invasiveness and phenotypic plasticity.

4.3.2. ENPP1

Ectonucleotide pyrophosphatase/phosphodiesterase 1 (ENPP1) codes a transmembrane protein upregulated in many cancers, suppresses the innate immune response, and promotes tumor cell migration, proliferation, metastasis, and angiogenesis [26,39]. ENPP1 inhibits pro-inflammatory cytokine production, stimulates anti-inflammatory cytokine synthesis, and leverages two GPCR receptors (A2a A2b) to hydrolyze ATP, contributing to increased adenosine signaling in the hypoxic tumor microenvironment of metastatic PCa [40,41,42]. Our GO enrichment indicated that phosphodiesterase I activity is highly enriched in the cyan module, results that are supported by the ENPP1-to-adenosine signaling axis. Researchers are currently investigating the clinical utility of ENPP1 inhibitors in many cancers [25].

4.3.3. PTH1R

The parathyroid hormone 1 receptor (PTH1R) and calcium-sensing receptor (CaSR) create a favorable metastatic niche in bone through parathyroid hormone synthesis, secretion, and action. Yang and Wang showed that in breast cancer cells, which also metastasize to bone, CaSR activation upregulates the parathyroid hormone-related protein (PTHrP) and subsequently activates the Gs/cAMP pathway that furthers PTHrP production in a “feed-forward” loop. Cancer cells release PTHrP, which binds to PTH1R in stromal cells or osteoblasts and causes RANKL production. RANKL then binds to the RANK receptor and spurs the maturation of osteoclasts, which reabsorb the bone matrix and release the calcium that binds to membrane-bound CaSR on tumor cells [28]. PTHrP ablation leads to a significant decrease in tumor growth and metastasis as well as the reduced expression of several factors known to support tumor progression, including: CXCR4, Ki67, Bcl-2, AKT1, and Cyclin D1 [27]. Our identification of PTH1R as a hub gene further supports its role in forming a tumor microenvironment in bone.

4.4. FOXF1

The forkhead box protein F1 (FOXF1) gene codes for a protein that is thought to transactivate CDH1 and upregulate the expression of the associated membrane protein, E-cadherin. When combined with a mutated or deleted p53 gene, common in PCa progression cases, downregulated FOXF1 may reduce E-cadherin expression and promote metastasis by creating a survival advantage for motile and invasive tumor cells [6]. Our analysis observed FOXF1 downregulation when RUNX2 was upregulated in patients with mCRPC in bone.

4.5. Study Limitations

This study generates novel insights into the biological pathways associated with bone metastasis in mCRPC. However, we used bioinformatic analysis for our study, so future research is required to validate the role of hub genes in tumorigenesis and progression. Furthermore, our analysis was not able to determine the direction of signaling effects. Our characterization of signaling and pathways differences was solely assessed based on current literature, gene ontology, and protein–protein interaction analysis. Lastly, although the validation and replication of these discoveries are important processes that serve to support the conclusions made in the current study, the datasets needed for the analysis of metastatic prostate tissue to bone are currently not available in a sample size large enough for robust comparison.

5. Conclusions

We present a novel and comprehensive systems biology approach to further our understanding of the molecular and biological mechanisms involved in the TIME niche for mCRPC. We used WGCNA to construct a network and identified 14 modules, and the cyan module (M14) was enriched with genes that were positively correlated to bone metastasis. We discovered two novel hub genes that warrant further investigation for their molecular role in mCRPC, especially as candidate hub genes may serve as molecular targets or diagnostic biomarkers for precise diagnosis or cancer treatment.

Supplementary Materials

The following supporting information can be downloaded at: https://www.mdpi.com/article/10.3390/onco3020007/s1, Table S1: mRNA data for EPIC; Tab delimited file containing the bulk data for mCRPC patient samples; Table S2: EPIC results for mCRPC samples; Results data output from EPIC tool.

Author Contributions

Conceptualization; L.P.M. and J.W.L.J.; methodology, L.P.M.; software, L.P.M.; validation, L.P.M., I.K.J. and E.B.D.; formal analysis, L.P.M.; investigation, L.P.M.; resources, J.W.L.J.; data curation, L.P.M. and J.W.L.J.; writing—original draft preparation, L.P.M.; writing—review and editing, L.P.M., R.S., I.K.J., E.B.D., S.V. and J.W.L.J.; visualization, L.P.M.; supervision, J.W.L.J.; project administration, J.W.L.J.; funding acquisition, J.W.L.J. All authors have read and agreed to the published version of the manuscript.

Funding

This research was funded by an MSM/TU/UAB Partnership grant (U54CA118638), and the facilities were supported by MSM (1G12RR026250-03), NIH (RR03034, 1C06 RR18386), and the partnership of NIH and NCI (R25CA056452).

Institutional Review Board Statement

Not applicable.

Informed Consent Statement

Not applicable.

Data Availability Statement

The data presented in this study are openly available in Cbioportal [6,43], GitHub [7], and dbGaP [44].

Acknowledgments

I wish to express my sincere thanks to Martin G. Sanda of the Department of Urology at Emory University as well as the co-authors of this paper for providing support, challenging me to produce my best work, and providing me with continuous encouragement. The Genotype-Tissue Expression (GTEx) Project was supported by the Common Fund of the Office of the Director of the National Institutes of Health and by NCI, NHGRI, NHLBI, NIDA, NIMH, and NINDS. The data used for the analyses described in this manuscript were obtained from: https://www.gtexportal.org, the GTEx portal, on 14 February 2023.

Conflicts of Interest

The authors declare no conflict of interest. The funders had no role in the design of the study; in the collection, analyses, or interpretation of data; in the writing of the manuscript; or in the decision to publish the results.

References

  1. Singh, S.K.; Lillard, J.W., Jr.; Singh, R. Molecular basis for prostate cancer racial disparities. Front. Biosci. 2017, 22, 428–450. [Google Scholar] [CrossRef] [PubMed] [Green Version]
  2. Kwan, E.M.; Wyatt, A.W. Androgen receptor genomic alterations and treatment resistance in metastatic prostate cancer. Prostate 2022, 82 (Suppl. S1), S25–S36. [Google Scholar] [CrossRef]
  3. Robinson, D.; Van Allen, E.M.; Wu, Y.-M.; Schultz, N.; Lonigro, R.J.; Mosquera, J.-M.; Montgomery, B.; Taplin, M.-E.; Pritchard, C.C.; Attard, G.; et al. Integrative Clinical Genomics of Advanced Prostate Cancer. Cell 2015, 161, 1215–1228. [Google Scholar] [CrossRef] [PubMed] [Green Version]
  4. Abida, W.; Cyrta, J.; Heller, G.; Prandi, D.; Armenia, J.; Coleman, I.; Cieslik, M.; Benelli, M.; Robinson, D.; Van Allen, E.M.; et al. Genomic correlates of clinical outcome in advanced prostate cancer. Proc. Natl. Acad. Sci. USA 2019, 116, 11428–11436. [Google Scholar] [CrossRef] [Green Version]
  5. Ohandjo, A.Q.; Liu, Z.; Dammer, E.B.; Dill, C.D.; Griffen, T.L.; Carey, K.M.; Hinton, D.E.; Meller, R.; Lillard, J.W., Jr. Transcriptome Network Analysis Identifies CXCL13-CXCR5 Signaling Modules in the Prostate Tumor Immune Microenvironment. Sci. Rep. 2019, 9, 14963. [Google Scholar] [CrossRef] [PubMed] [Green Version]
  6. Gao, J.; Aksoy, B.A.; Dogrusoz, U.; Dresdner, G.; Gross, B.; Sumer, S.O.; Sun, Y.; Jacobsen, A.; Sinha, R.; Larsson, E.; et al. Integrative analysis of complex cancer genomics and clinical profiles using the cBioPortal. Sci. Signal 2013, 6, pl1. [Google Scholar] [CrossRef] [Green Version]
  7. prad_su2c_2019. Available online: https://github.com/cBioPortal/datahub/tree/master/public/prad_su2c_2019 (accessed on 7 October 2022).
  8. Chen, S.; Zhou, Y.; Chen, Y.; Gu, J. fastp: An ultra-fast all-in-one FASTQ preprocessor. Bioinformatics 2018, 34, i884–i890. [Google Scholar] [CrossRef]
  9. Dobin, A.; Davis, C.A.; Schlesinger, F.; Drenkow, J.; Zaleski, C.; Jha, S.; Batut, P.; Chaisson, M.; Gingeras, T.R. STAR: Ultrafast universal RNA-seq aligner. Bioinformatics 2013, 29, 15–21. [Google Scholar] [CrossRef]
  10. Ewels, P.; Magnusson, M.; Lundin, S.; Käller, M. MultiQC: Summarize analysis results for multiple tools and samples in a single report. Bioinformatics 2016, 32, 3047–3048. [Google Scholar] [CrossRef] [Green Version]
  11. Love, M.I.; Huber, W.; Anders, S. Moderated estimation of fold change and dispersion for RNA-seq data with DESeq2. Genome Biol. 2014, 15, 550. [Google Scholar] [CrossRef] [Green Version]
  12. Liao, Y.; Smyth, G.K.; Shi, W. feature Counts: An efficient general purpose program for assigning sequence reads to genomic features. Bioinformatics 2014, 30, 923–930. [Google Scholar] [CrossRef] [Green Version]
  13. Zhang, B.; Horvath, S. A General Framework for Weighted Gene Co-Expression Network Analysis. Stat. Appl. Genet. Mol. Biol. 2005, 4, Article17. [Google Scholar] [CrossRef] [PubMed]
  14. Langfelder, P.; Horvath, S. WGCNA: An R package for weighted correlation network analysis. BMC Bioinform. 2008, 9, 559. [Google Scholar] [CrossRef] [PubMed] [Green Version]
  15. Chen, X.; Wang, J.; Peng, X.; Liu, K.; Zhang, C.; Zeng, X.; Lai, Y. Comprehensive analysis of biomarkers for prostate cancer based on weighted gene co-expression network analysis. Medicine 2020, 99, e19628. [Google Scholar] [CrossRef]
  16. Huang, D.W.; Sherman, B.T.; Tan, Q.; Kir, J.; Liu, D.; Bryant, D.; Guo, Y.; Stephens, R.; Baseler, M.W.; Lane, H.C.; et al. DAVID Bioinformatics Resources: Expanded annotation database and novel algorithms to better extract biology from large gene lists. Nucleic Acids Res. 2007, 35, W169–W175. [Google Scholar] [CrossRef] [PubMed] [Green Version]
  17. Szklarczyk, D.; Gable, A.L.; Nastou, K.C.; Lyon, D.; Kirsch, R.; Pyysalo, S.; Doncheva, N.T.; Legeay, M.; Fang, T.; Bork, P.; et al. The STRING database in 2021: Customizable protein-protein networks, and functional characterization of user-uploaded gene/measurement sets. Nucleic Acids Res. 2021, 49, D605–D612. [Google Scholar] [CrossRef]
  18. Otasek, D.; Morris, J.H.; Bouças, J.; Pico, A.R.; Demchak, B. Cytoscape Automation: Empowering workflow-based network analysis. Genome Biol. 2019, 20, 185. [Google Scholar] [CrossRef] [Green Version]
  19. Chin, C.-H.; Chen, S.-H.; Wu, H.-H.; Ho, C.-W.; Ko, M.-T.; Lin, C.-Y. cytoHubba: Identifying hub objects and sub-networks from complex interactome. BMC Syst. Biol. 2014, 8 (Suppl. S4), S11. [Google Scholar] [CrossRef] [Green Version]
  20. Li, C.Y.; Cai, J.-H.; Tsai, J.J.P.; Wang, C.C.-N. Identification of Hub Genes Associated with Development of Head and Neck Squamous Cell Carcinoma by Integrated Bioinformatics Analysis. Front. Oncol. 2020, 10, 681. [Google Scholar] [CrossRef]
  21. Ge, C.; Zhao, G.; Li, Y.; Li, H.; Zhao, X.; Pannone, G.; Bufo, P.; Santoro, A.; Sanguedolce, F.; Tortorella, S.; et al. Role of Runx2 phosphorylation in prostate cancer and association with metastatic disease. Oncogene 2016, 35, 366–376. [Google Scholar] [CrossRef] [Green Version]
  22. Xu, S.; Xu, H.; Wang, W.; Li, S.; Li, H.; Li, T.; Zhang, W.; Yu, X.; Liu, L. The role of collagen in cancer: From bench to bedside. J. Transl. Med. 2019, 17, 309. [Google Scholar] [CrossRef] [PubMed] [Green Version]
  23. Zhao, W.; Yang, H.; Chai, J.; Xing, L. RUNX2 as a promising therapeutic target for malignant tumors. Cancer Manag. Res. 2021, 13, 2539–2548. [Google Scholar] [CrossRef] [PubMed]
  24. Rao, S.R.; Snaith, A.E.; Marino, D.; Cheng, X.; Lwin, S.T.; Orriss, I.R.; Hamdy, F.C.; Edwards, C.M. Tumour-derived alkaline phosphatase regulates tumour growth, epithelial plasticity and disease-free survival in metastatic prostate cancer. Br. J. Cancer 2017, 116, 227–236. [Google Scholar] [CrossRef] [PubMed]
  25. Onyedibe, K.I.; Wang, M.; Sintim, H.O. ENPP1, an Old Enzyme with New Functions, and Small Molecule Inhibitors—A STING in the Tale of ENPP1. Molecules 2019, 24, 4192. [Google Scholar] [CrossRef] [PubMed] [Green Version]
  26. Roberts, F.; Zhu, D.; Farquharson, C.; Macrae, V.E. ENPP1 in the Regulation of Mineralization and Beyond. Trends Biochem. Sci. 2019, 44, 616–628. [Google Scholar] [CrossRef]
  27. Li, J.; Karaplis, A.C.; Huang, D.C.; Siegel, P.M.; Camirand, A.; Yang, X.F.; Muller, W.J.; Kremer, R. PTHrP drives breast tumor initiation, progression, and metastasis in mice and is a potential therapy target. J. Clin. Investig. 2011, 121, 4655–4669. [Google Scholar] [CrossRef] [PubMed] [Green Version]
  28. Yang, Y.; Wang, B. PTH1R-CaSR Cross Talk: New Treatment Options for Breast Cancer Osteolytic Bone Metastases. Int. J. Endocrinol. 2018, 2018, 7120979. [Google Scholar] [CrossRef]
  29. Bergwitz, C.; Jüppner, H. Regulation of Phosphate Homeostasis by PTH, Vitamin D, and FGF23. Annu. Rev. Med. 2010, 61, 91–104. [Google Scholar] [CrossRef] [Green Version]
  30. Morcos, M.W.; Al-Jallad, H.; Li, J.; Farquharson, C.; Millan, J.L.; Hamdy, R.C.; Murshed, M. PHOSPHO1 is essential for normal bone fracture healing: An Animal Study. Bone Joint Res. 2018, 7, 397–405. [Google Scholar] [CrossRef]
  31. Dillon, S.; Staines, K.A.; Millán, J.L.; Farquharson, C. How to Build a Bone: PHOSPHO1, Biomineralization, and Beyond. JBMR Plus 2019, 3, e10202. [Google Scholar] [CrossRef] [Green Version]
  32. Zhang, Y.; Fu, Y. Comprehensive Analysis and Identification of an Immune-Related Gene Signature with Prognostic Value for Prostate Cancer. Int. J. Gen. Med. 2021, 14, 2931–2942. [Google Scholar] [CrossRef]
  33. Renema, N.; Navet, B.; Heymann, M.F.; Lezot, F.; Heymann, D. RANK-RANKL signalling in cancer. Biosci. Rep. 2016, 36, e00366. [Google Scholar] [CrossRef] [PubMed] [Green Version]
  34. Huang, J.; Thulin, M.H.; Damber, J.-E.; Welén, K. The roles of RUNX2 and osteoclasts in regulating expression of steroidogenic enzymes in castration-resistant prostate cancer cells. Mol. Cell. Endocrinol. 2021, 535, 111380. [Google Scholar] [CrossRef]
  35. Kim, B.; Kim, H.; Jung, S.; Moon, A.; Noh, D.Y.; Lee, Z.H.; Kim, H.J.; Kim, H.H. A CTGF-RUNX2-RANKL Axis in Breast and Prostate Cancer Cells Promotes Tumor Progression in Bone. J. Bone Miner. Res. 2020, 35, 155–166. [Google Scholar] [CrossRef]
  36. Ashe, H.; Krakowiak, P.; Hasterok, S.; Sleppy, R.; Roller, D.G.; Gioeli, D. Role of the runt-related transcription factor (RUNX) family in prostate cancer. FEBS J. 2021, 288, 6112–6126. [Google Scholar] [CrossRef] [PubMed]
  37. Zhang, X. Interactions between cancer cells and bone microenvironment promote bone metastasis in prostate cancer. Cancer Commun. 2019, 39, 76. [Google Scholar] [CrossRef] [PubMed] [Green Version]
  38. Li, J.; Duran, M.A.; Dhanota, N.; Chatila, W.K.; Bettigole, S.E.; Kwon, J.; Sriram, R.K.; Humphries, M.P.; Salto-Tellez, M.; James, J.A.; et al. Metastasis and Immune Evasion from Extracellular cGAMP Hydrolysis. Cancer Discov. 2021, 11, 1212–1220. [Google Scholar] [CrossRef]
  39. Gao, Z.-G.; Jacobson, K.A. A2B Adenosine Receptor and Cancer. Int. J. Mol. Sci. 2019, 20, 5139. [Google Scholar] [CrossRef] [Green Version]
  40. Mousavi, S.; Panjehpour, M.; Izadpanahi, M.H.; Aghaei, M. Expression of adenosine receptor subclasses in malignant and adjacent normal human prostate tissues. Prostate 2015, 75, 735–747. [Google Scholar] [CrossRef]
  41. Vijayan, D.; Young, A.; Teng, M.W.L.; Smyth, M.J. Targeting immunosuppressive adenosine in cancer. Nat. Rev. Cancer 2017, 17, 709–724. [Google Scholar] [CrossRef]
  42. Tamura, M.; Sasaki, Y.; Koyama, R.; Takeda, K.; Idogawa, M.; Tokino, T. Forkhead transcription factor FOXF1 is a novel target gene of the p53 family and regulates cancer cell migration and invasiveness. Oncogene 2014, 33, 4837–4846. [Google Scholar] [CrossRef] [PubMed] [Green Version]
  43. Stand Up to Cancer East Coast Prostate Cancer Research Group. Available online: https://www.ncbi.nlm.nih.gov/projects/gap/cgi-bin/study.cgi?study_id=phs000915.v2.p2 (accessed on 1 May 2020).
  44. Tryka, K.A.; Hao, L.; Sturcke, A.; Jin, Y.; Wang, Z.Y.; Ziyabari, L.; Lee, M.; Popova, N.; Sharopova, N.; Kimura, M.; et al. NCBI’s Database of Genotypes and Phenotypes: dbGaP. Nucleic Acids Res. 2014, 42, D975–D979. [Google Scholar] [CrossRef] [PubMed]
Figure 1. Bone eigengene network/cluster dendrogram. (A) Eigengene network and heatmap of clustered dissimilarity based on consensus topological overlap (14 modules) and eigengene heatmap. (B) Based on consensus topological overlap, a cluster dendrogram of clustered dissimilarity and module colors.
Onco 03 00007 g001
Figure 2. Module trait relationship. Listed in the heatmap are Pearson rho correlations and p-values (in parentheses) defining the relationship between ME expression and clinical traits. Each row in the table corresponds to a module with the color shown on the left, and each column corresponds to a specific clinical trait.
Onco 03 00007 g002
Figure 3. Differential gene expression analysis identified 3122 genes that were upregulated or downregulated when comparing mCRPC samples with bone metastases to samples with other metastatic tissue sites (lymph nodes and liver). Differentially expressed genes with p < 1 × 10⁻¹⁰ are labeled.
Onco 03 00007 g003
Figure 4. A Protein–protein interaction (PPI) network of statistically significant hub genes is identified, where the thickness of the edge (line) that connects associated nodes (circles) represents the strength of association between nodes. Note that node colors have no meaning and do not represent biological significance.
Onco 03 00007 g004
Figure 5. Distribution of tissue cell types and gene expression levels of hub genes across various tissue types. (a) The distribution of each cell type (B-cells, cancer-associated fibroblasts (CAFs), CD4 T-cells, CD8 T-cells, endothelial cells, macrophages, NK cells, and tumor cells) among mCRPC samples in the current dataset; (b) the hierarchical clustering of the diseases is shown as a dendrogram by column. The hierarchical clustering of the select differentially expressed genes is shown as a dendrogram by row. The center plot shows a correlation heat map of gene expression levels by genotype-tissue expression (GTEx) profiles. Gene and transcript expressions on the GTEx portal are shown in transcripts per million (TPM).
Onco 03 00007 g005
Figure 6. CRPC bone model of tumor microenvironment. Model displays the vicious cycle of bone metastasis driven by invading tumor cells. (1) PCa cells induce osteoblasts (OBs) to secrete RANKL. (2) RANKL binds to osteoclasts (OCs) and increases proliferation. (3) OCs promote increased resorption and pro-tumorigenic growth factors. (4) Tumor cells release PTHrP to reprogram OBs. (5) PCa cells release several other growth factors to promote OC proliferation and differentiation. Cancer-associated fibroblasts (CAFs), endothelial cells, myeloid B-cells, macrophages, T-cells, and other immune cell types interact with the tumor and the bone metastatic niche to promote tumorigenic activities. (6) PCa cells secrete factors that degrade the extracellular matrix, such as MMPs, composed mainly of collagen. Collagen may be reshaped, remodeled, or broken down into smaller peptides and proteins to be endocytosed via macrophages and fibroblasts to advance tumor growth, recycle amino acids, or be used for other functions that are favorable to the TIME. (7) PCa cells promote the overexpression of ALPL ENPP1, PHOSPHO1, and PHEX to create a favorable tumor microenvironment. (8) FOXF1 transcriptionally regulates cancer cell invasion and migration through the repression or silencing of the E-cadherin coding gene, CDH1. The downregulation or mutation of the FOXF1 gene increases the expression of E-cadherins, which promotes cancer cell invasion and motility. Created with BioRender.com.
Onco 03 00007 g006
Table 1. Clinical data for mCRPC patient samples.
Clinical Variable Total Number
Total 60
AgeMedian (range)65 (50–85)
UNK8
Tissue Site
Bone15
Lymph Node34
Liver11
Abiraterone and Enzalutamide Exposure (Hormone Therapy) Status
Naïve31
Exposed25
UNK4
Taxane Exposure Status
Naïve37
Exposed21
UNK2
Gleason Score
63
78
88
916
105
UNK20
Five clinical traits serve as the variables for this study, as shown in the first column. They include age, tissue site, hormone therapy status, taxane exposure status, and Gleason score. In the second column, taxane exposure and hormone therapy status were recoded as binary (0 and 1, Naïve and Exposed, respectively). Gleason score was coded as discrete values, and age was coded as continuous values. Tissue site was segmented to be binary (0 and 1). For example, bone = 0 for non-bone and 1 for bone. UNK = unknown. A total of 60 patient samples were used in this study, as shown in the third top column.
Table 2. Signaling pathways from KEGG pathway analysis, including pathway names, gene names, percentage of all genes (n = 37), p-values, and Benjamini–Hochberg procedure values.
PathwayGenes%p-ValueBenjamini–Hochberg Value
Protein digestion and absorptionCOL11A1
COL13A1
COL22A1
COL24A1
10.82.2 × 10−31.3 × 10⁻¹
Parathyroid hormone synthesis, secretion, and actionRUNX2
MMP16
PTH1R
8.18.6 × 10−18.6 × 10⁻¹
Disclaimer/Publisher’s Note: The statements, opinions and data contained in all publications are solely those of the individual author(s) and contributor(s) and not of MDPI and/or the editor(s). MDPI and/or the editor(s) disclaim responsibility for any injury to people or property resulting from any ideas, methods, instructions or products referred to in the content.

