Article

CT Radiomics and Clinical Feature Model to Predict Lymph Node Metastases in Early-Stage Testicular Cancer

by
Catharina Silvia Lisson
1,2,3,*,
Sabitha Manoj
1,3,4,
Daniel Wolf
1,3,4,
Jasper Schrader
5,
Stefan Andreas Schmidt
1,2,3,
Meinrad Beer
1,2,3,6,7,
Michael Goetz
1,3,8,*,
Friedemann Zengerling
5,† and
Christoph Gerhard Sebastian Lisson
1,†
1
Department of Diagnostic and Interventional Radiology, University Hospital of Ulm, Albert-Einstein-Allee 23, 89081 Ulm, Germany
2
ZPM—Center for Personalized Medicine, University Hospital of Ulm, Albert-Einstein-Allee 23, 89081 Ulm, Germany
3
XAIRAD—Artificial Intelligence in Experimental Radiology, University Hospital of Ulm, Albert-Einstein-Allee 23, 89081 Ulm, Germany
4
Visual Computing Group, Institute of Media Informatics, Ulm University, James-Franck-Ring, 89081 Ulm, Germany
5
Department of Urology, University Hospital of Ulm, Albert-Einstein-Allee 23, 89081 Ulm, Germany
6
MoMan—Center for Translational Imaging, Department of Internal Medicine II, University Hospital of Ulm, Albert-Einstein-Allee 23, 89081 Ulm, Germany
7
i2SouI—Innovative Imaging in Surgical Oncology Ulm, University Hospital of Ulm, Albert-Einstein-Allee 23, 89081 Ulm, Germany
8
Division Medical Image Computing, DKFZ—German Cancer Research Center, 69120 Heidelberg, Germany
*
Authors to whom correspondence should be addressed.
These authors contributed equally to this work.
Onco 2023, 3(2), 65-80; https://doi.org/10.3390/onco3020006
Submission received: 20 February 2023 / Revised: 29 March 2023 / Accepted: 3 April 2023 / Published: 10 April 2023
(This article belongs to the Topic Artificial Intelligence in Cancer, Biology and Oncology)

Abstract

:

Simple Summary

Testicular germ cell tumour (TGCT) is the most common solid cancer in men below 40. The majority present with disease confined to the testis (stage 1), with its primary treatment being radical orchiectomy. Despite the multiple options for managing stage 1 tumours, optimal management is controversial, with further treatment options including active surveillance, chemotherapy and retroperitoneal lymph node dissection or low dose radiotherapy of the paraaortic region. In this study, the authors incorporated quantitative imaging features and clinical risk factors to stratify patients according to lymph node metastases, thus promoting precision imaging in clinical oncology.

Abstract

Accurate retroperitoneal lymph node metastasis (LNM) prediction in early-stage testicular germ cell tumours (TGCTs) harbours the potential to significantly reduce over- or undertreatment and treatment-related morbidity in this group of young patients as an important survivorship imperative. We investigated the role of computed tomography (CT) radiomics models integrating clinical predictors for the individualised prediction of LNM in early-stage TGCT. Ninety-one patients with surgically proven testicular germ cell tumours and contrast-enhanced CT were included in this retrospective study. Dedicated radiomics software was used to segment 273 retroperitoneal lymph nodes and extract features. After feature selection, radiomics-based machine learning models were developed to predict LN metastasis. The robustness of the procedure was controlled by 10-fold cross-validation. Using multivariable logistic regression modelling, we developed three prediction models: a radiomics-only model, a clinical-only model, and a combined radiomics–clinical model. The models’ performances were evaluated using the area under the receiver operating characteristic curve (AUC). Finally, decision curve analysis was performed to estimate the clinical usefulness of the predictive model. The radiomics-only model for predicting lymph node metastasis reached a greater discrimination power than the clinical-only model, with an AUC of 0.87 (±0.04; 95% CI) vs. 0.75 (±0.08; 95% CI) in our study cohort. The combined model integrating clinical risk factors and selected radiomics features outperformed the clinical-only and the radiomics-only prediction models, and showed good discrimination with an area under the curve of 0.89 (±0.03; 95% CI). The decision curve analysis demonstrated the clinical usefulness of our proposed combined model. The presented combined CT-based radiomics–clinical model represents an exciting non-invasive tool for individualised LN metastasis prediction in testicular germ cell tumours. Multi-centre validation is required to generate high-quality evidence for its clinical application.

1. Introduction

Testicular germ cell tumours (TGCTs) are the most common malignancy among men aged 15–40 [1,2]. Its characteristic patient population and high cure rate make this disease unique, constituting one of the few success stories in cancer care [3,4]. Besides cure, reducing the amount of therapy-related acute and long-term toxicity is the goal of care due to the young age of the TGCT patients and the long life expectancy following curative therapy [5,6,7,8,9,10]. The main risk factors for TGCTs include cryptorchidism, family or personal history of TGCT and contact with organochlorine compounds [11,12]. TGCTs are classified histologically into seminoma and non-seminoma, including pure non-seminoma and mixed germ cell tumours, with seminoma accounting for approximately 55% of all cases with an average age at diagnosis in the fourth decade of life, about eight years later than non-seminoma [12]. TGCT are diagnosed by physical examination, testicular ultrasound and specific tumour markers, such as alpha-fetoprotein (AFP), beta-hCG (β-hCG) and lactate dehydrogenase (LDH) [13,14].
Ninety-five percent of all metastases from TGCTs involve the ipsilateral retroperitoneal lymph nodes. Thus the present German guidelines recommend that in early-stage seminoma, patients with certain criteria, such as a tumour with a diameter >4 cm, an adjuvant therapy be applied, consisting of either one to two cycles of carboplatin or radiotherapy of the paraaortic region with 20 Gy [15]. However, retroperitoneal lymph node dissection (RPLND) is the only treatment modality to correctly stage the nodal status of early testicular cancer. Unfortunately, due to the short- and long-term complications, such as retrograde ejaculation, the implementation of adjuvant chemotherapy regimens, and the excellent prognosis with surveillance approaches in stage I disease, RPLND plays a negligible role as the primary treatment of early-stage TGCTs [16]. The most commonly used tumour markers, AFP, β-HCG, and LDH, are not very specific and are present in only about 60% of men with testicular cancer [14,17]. Worse, some conditions lead to false-positive elevation of testicular markers, such as liver disease or genetic reasons [18].
Due to its exceptional spatial resolution, CT imaging is regarded as well suited for identifying pathologically enlarged lymph nodes; in clinical practice, a short axis larger than 7–8 mm is considered pathologic (AUC with a sensitivity and specificity approaching 70%) [19]. Nonetheless, CT cannot distinguish between affected and normal lymph nodes in small lymph nodes [20].
Suboptimal therapeutical management, however, jeopardises the excellent outcomes of TGCT patients, with either over- or undertreatment being equally harmful.
Advanced medical imaging integrating high-resolution image acquisition, powerful computational technologies and artificial intelligence (AI)-based image analysis enabled researchers to develop the field of radiomics [21,22]. This way, data characterisation algorithms can detect specific diagnostic image patterns and convert them into quantitative mineable “big data” [23,24].
In the era of precision medicine, AI-based image analysis addresses the challenges of biopsy with the advantages of being non-invasive, repeatable, and applicable to hard-to-reach lesions within the body by analysing texture features of a region of interest (ROI) that reflect tumour physiology and radiologic phenotype according to current data [25,26].
Many studies have evaluated the diagnostic potential of radiomics for classifying lymph nodes in different cancer types, including gastric, rectal, and bladder cancer, with promising results [27,28,29,30]. AI-based advanced imaging could provide new imaging biomarkers or radiomic signatures to combat the urgent problem of under- or overtreatment of TGCT patients.
Our study is the first to investigate computed tomography (CT) radiomics models integrating clinical risk factors for the individualised prediction of lymph node metastasis in patients with early-stage TGCT, thus promoting precision imaging in clinical oncology.
Based on the findings above, we hypothesised that:
(1)
The radiomics features extracted from retroperitoneal lymph nodes might potentially predict TGCT recurrence.
(2)
Integrating important clinical factors, including age, histotype, AFP, ß-HCG, and BMI, into a combined clinical-radiomics model might add an incremental value to predict TGCT recurrence.

2. Materials and Methods

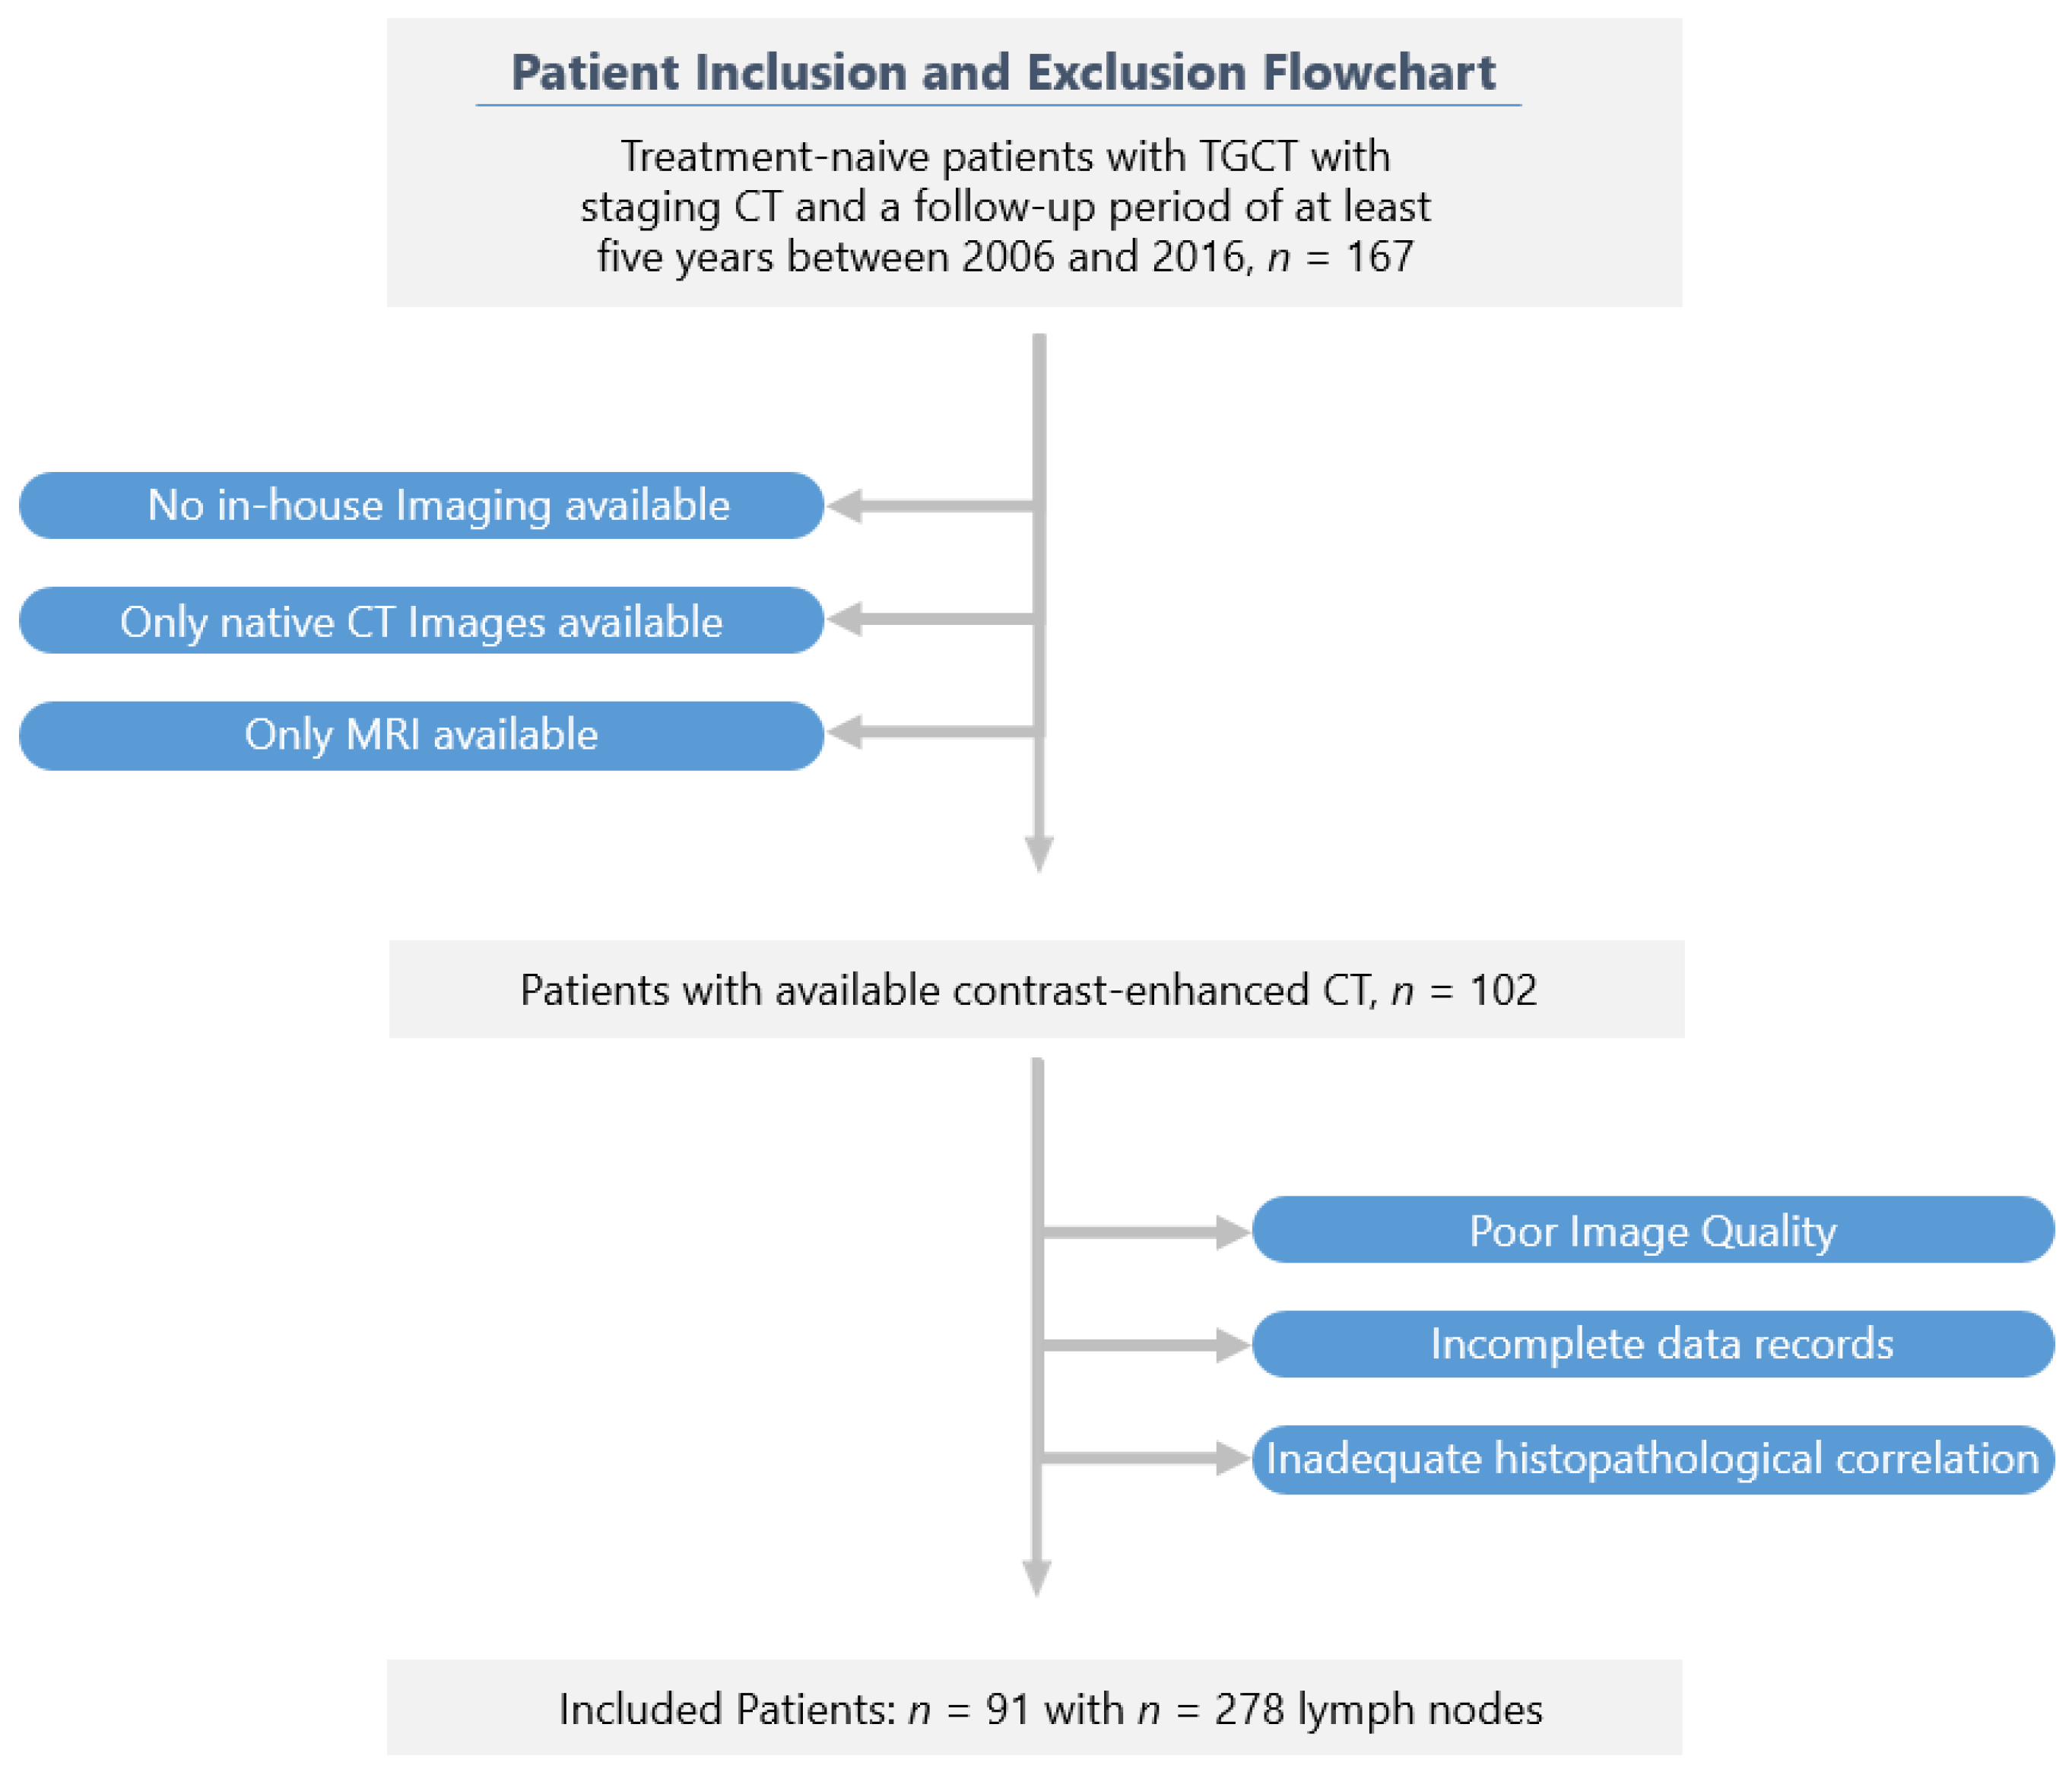
2.1. Patients and Imaging Protocol

Ninety-one treatment-naive patients with surgically proven stage I TGCT who underwent contrast-enhanced CT scans at our institution between January 2006 and December 2016 were included in this retrospective study.
Patient demographic, laboratory and clinical data were collected through a careful review of electronic medical records and the radiology information system. Exclusion criteria included incomplete clinical or imaging records and no histologic confirmation after surgery.
The primary endpoint of our study was retroperitoneal LN metastases from TGCT based on subsequent clinical and imaging examinations determined from records in electronic medical records.
Of the 167 patients originally screened, 91 could be included in the final study cohort according to the selection criteria. The patients in the final study cohort were followed up for at least six years after orchiectomy.
A flowchart of the cohort selection is shown in Figure 1.
CT scans were conducted before orchiectomy (+/−2 weeks) (mean time 3 ± 11 days, range 2–24) to determine disease status. Images were obtained as part of the routine staging on the Philips Brilliance CT 16-channel multi-row detector CT or Philips Brilliance CT 64-channel scanner (Philips Healthcare, Cleveland, OH, USA). CT scans were performed using acquisition and reconstruction parameters by the standard protocol after intravenous contrast injection of Ultravist® 370 (Bayer Schering Pharma, Berlin, Germany) at a weight-matched dose with a delay of 70–80 s for the portovenous phase of the chest and abdomen (tube voltage 100 kV–120 kV with automatically calculated tube current, matrix of 512 × 512, in-plane resolution between 0.62 × 0.62 mm and 0.86 × 0.86 mm, section thickness of 2.0–5.0 mm). Using two different CT scanners, a heterogeneous data set was generated to represent a routine clinical scenario as well as possible.

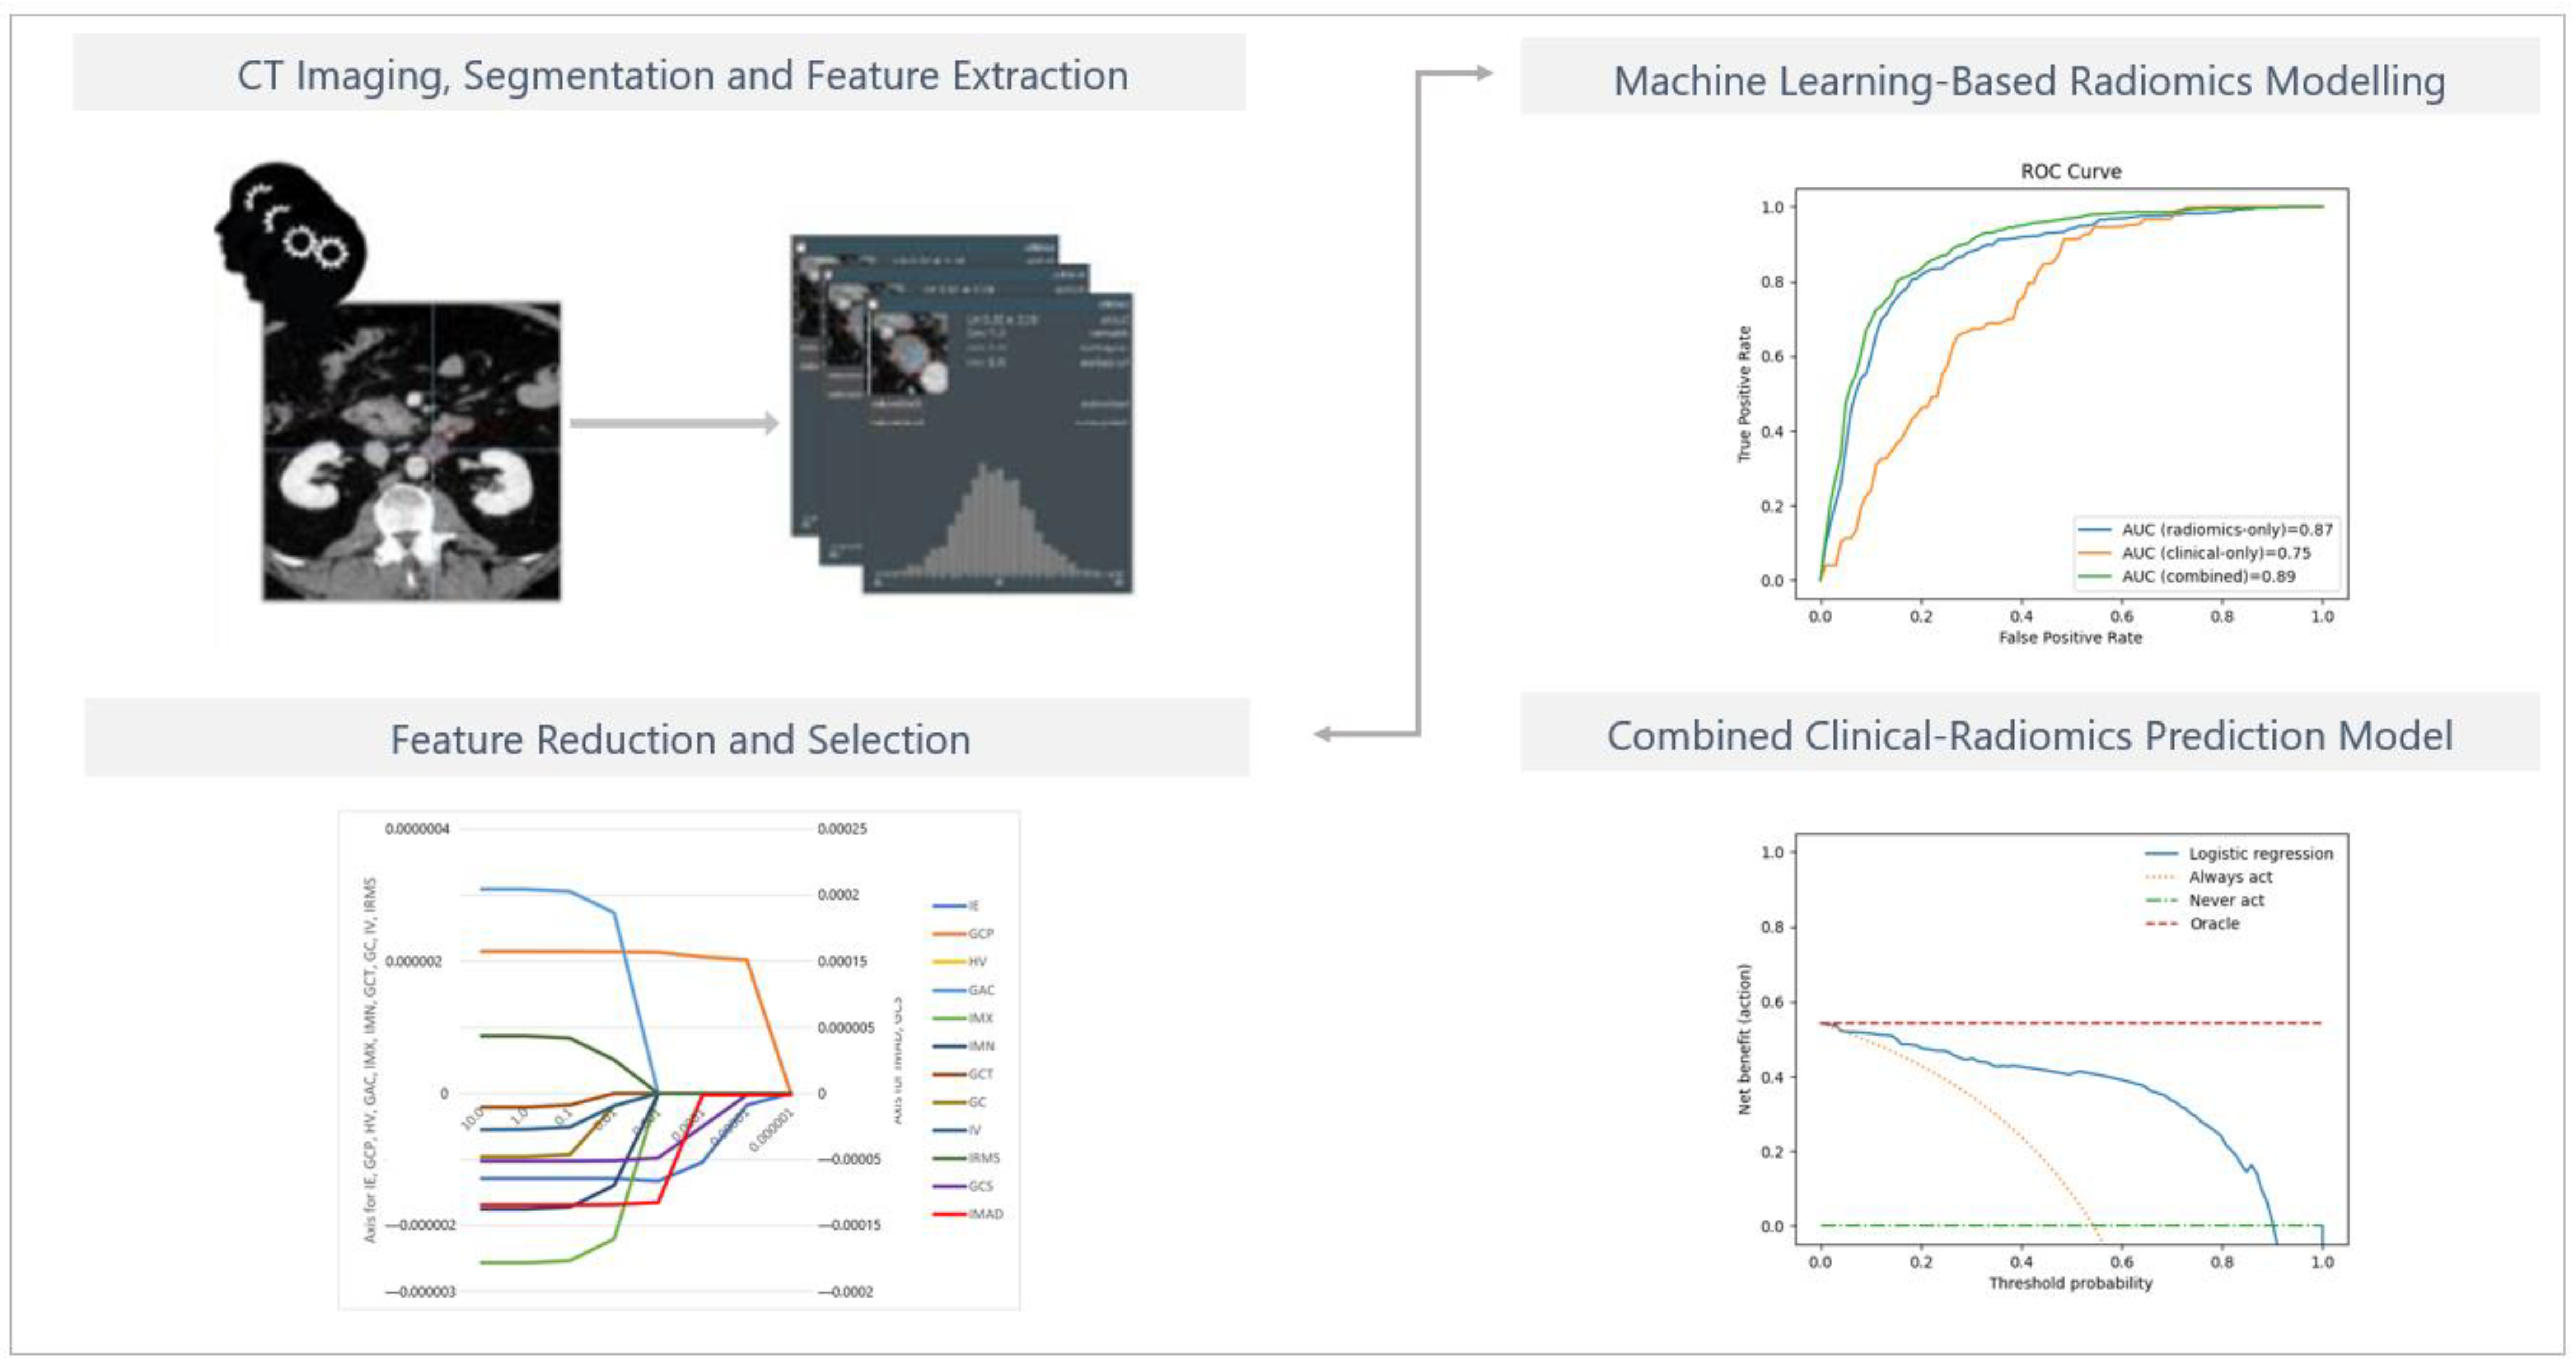
2.2. Segmentation and Radiomic Feature Extraction

First introduced by Haralick et al. in 1973 [31], image feature extraction, such as histogram features or features from the co-occurrence matrix, has demonstrated eminent potential in various questions in different cancers [22,32].
Three-dimensional region-of-interest segmentation, texture analysis, and feature extraction were conducted using mint Lesion™ software (version 3.8.4, mint Medical GmbH, Heidelberg, Germany). Details of the extraction settings are given in Appendix A, Table A1. The schematic diagram for ROI segmentation and feature extraction for model development is shown in Figure 2.
Two board-certified radiologists, with over 10 years of experience in oncologic imaging and over 8 years’ experience in texture analysis, analysed all images.
Three retroperitoneal lymph nodes along the infrarenal aorta were segmented per patient, resulting in 273 eligible samples randomly divided into a training set (n = 191) and a testing set (n = 82) at a ratio of 70:30.
Radiomic features were quantified regarding their distinctive pattern of grey levels within the ROI using texture feature descriptors according to the Image Biomarker Standardization Initiative (IBSI) guidelines [24].
Eighty-five imaging features were extracted from each ROI: features related to the 3D size and shape, first-order statistics characterising the distribution of voxel intensities within the selected region, and features relating to the grey-level co-occurrence matrix (see Table A2 and Table A3 in Appendix A).

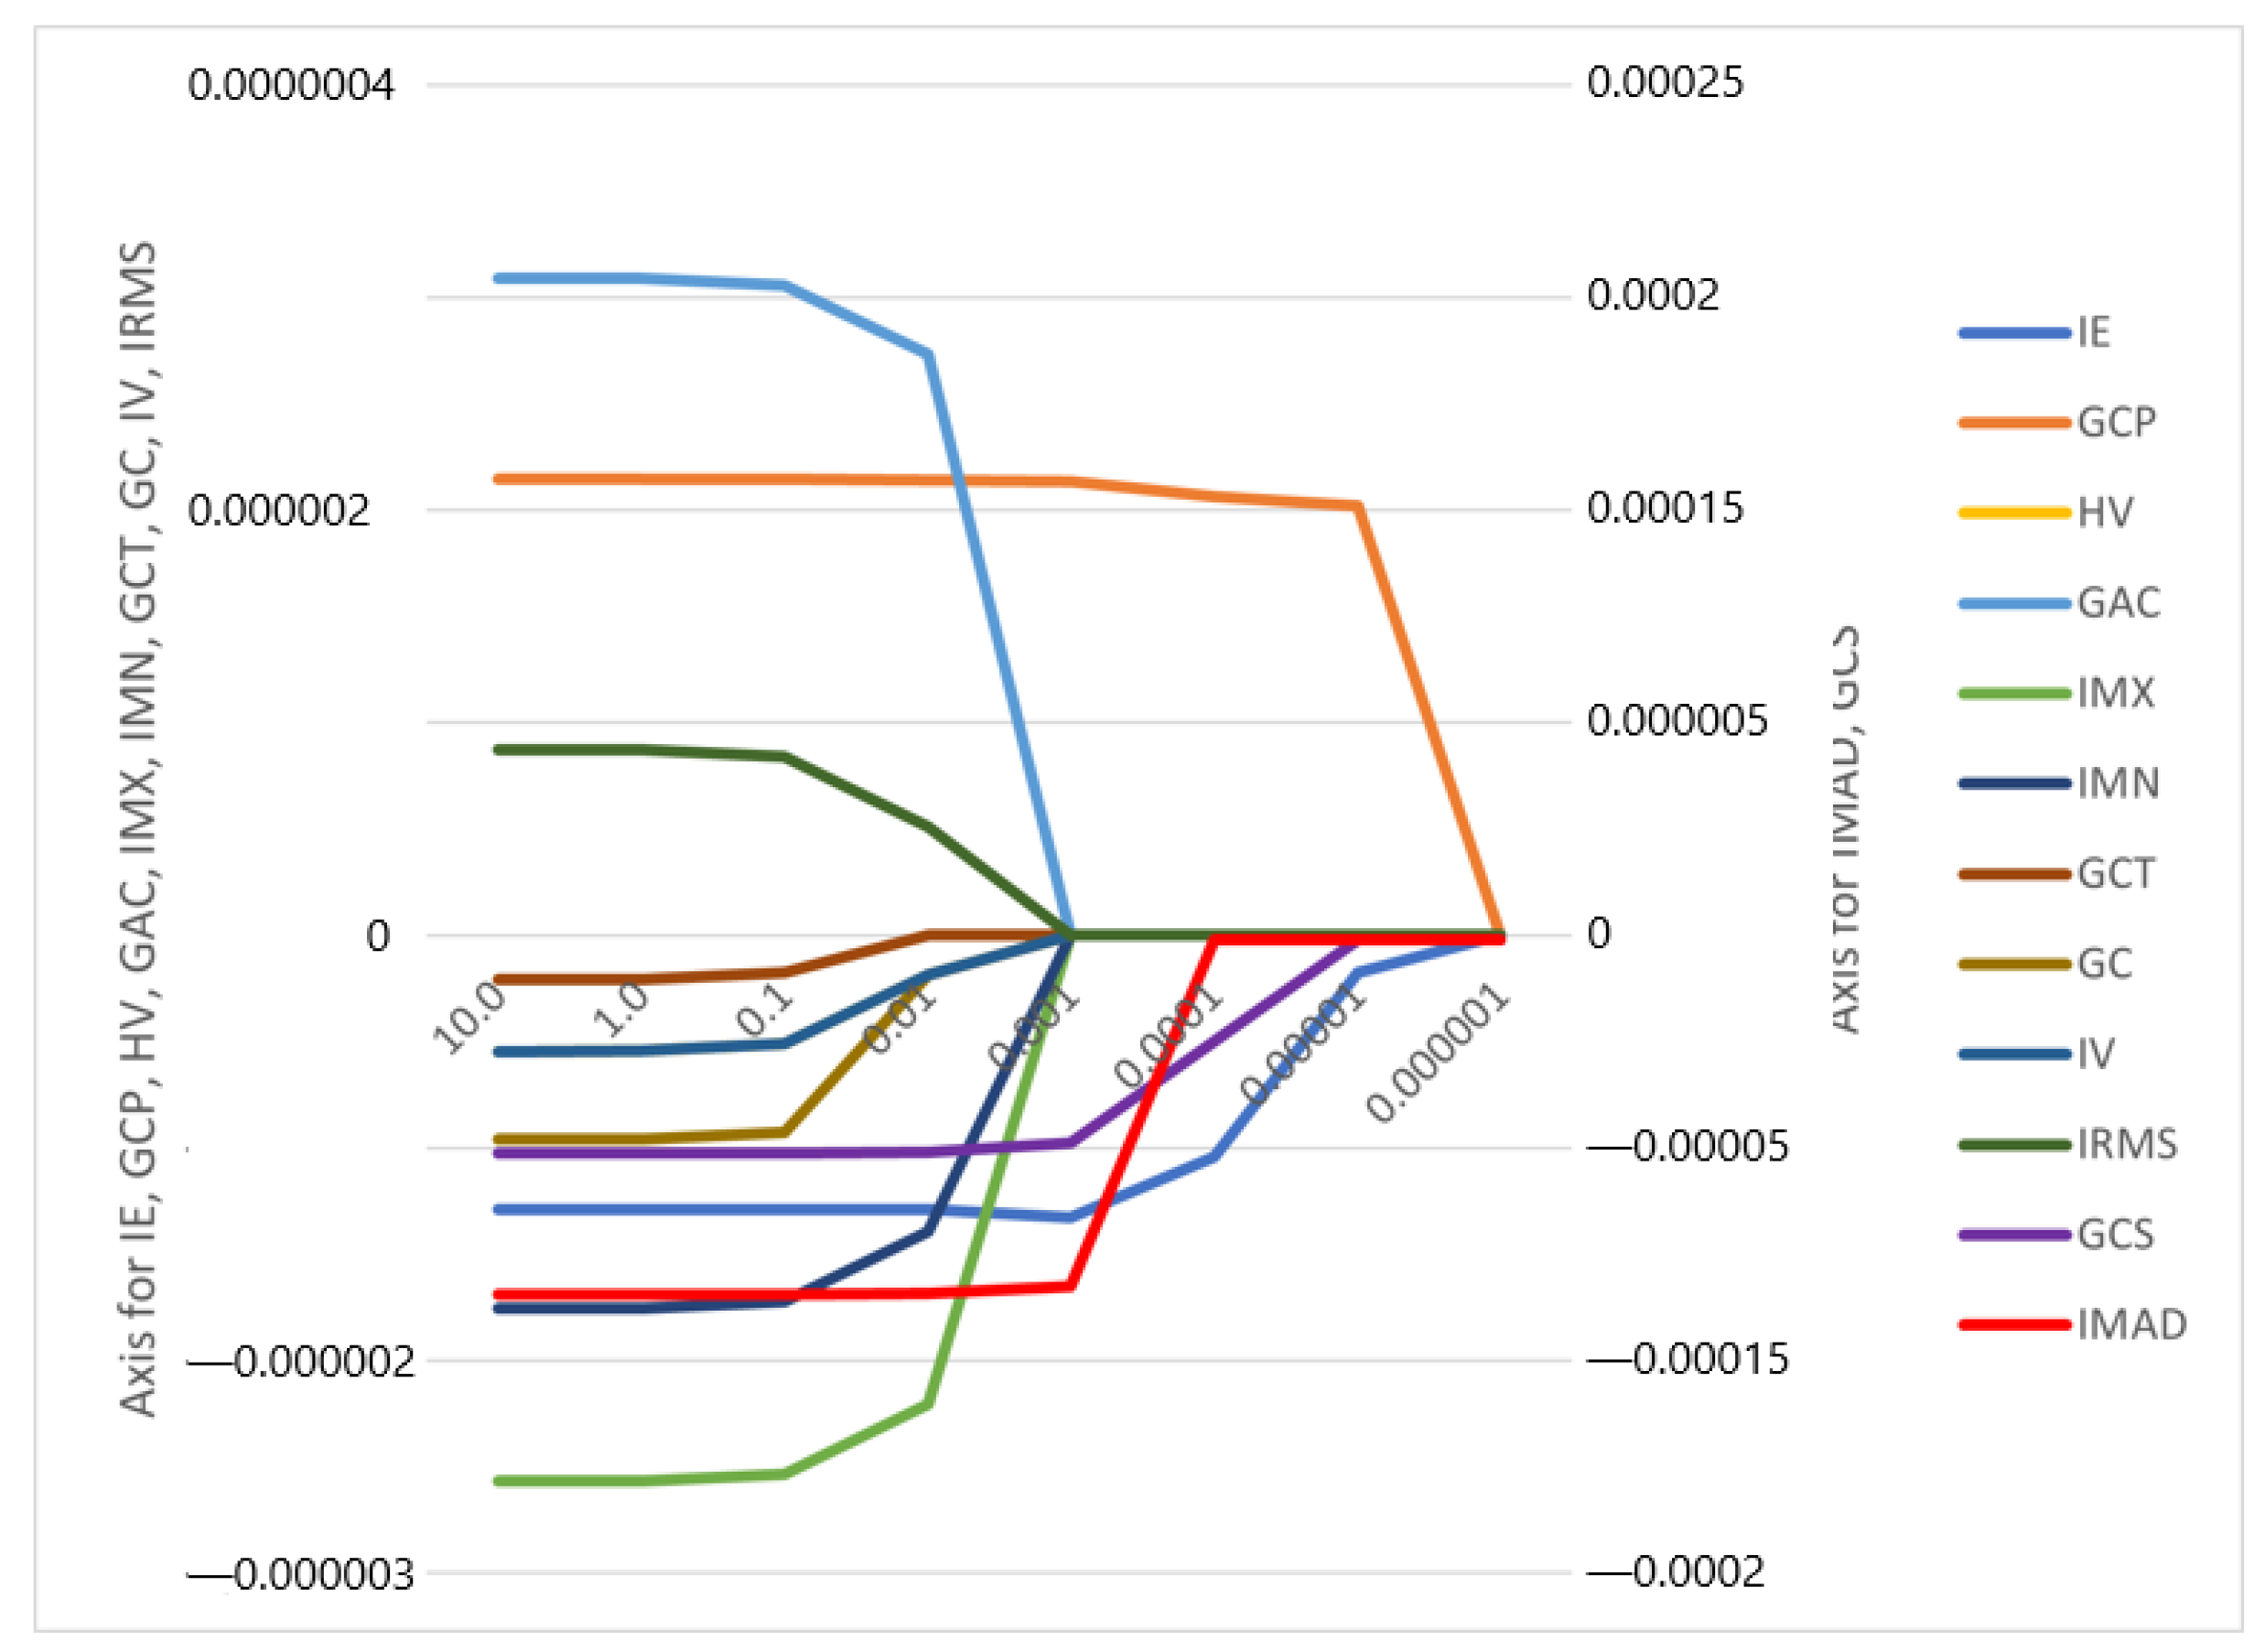
2.3. Feature Selection and Development of the Predictive Radiomics Model

Analogous to other data mining applications, radiomics extracts many texture features from the regions of interest [33].
For more generalisable, powerful, and faster modelling and reduced overfitting, we selected optimal features using the logistic regression model with the smallest absolute shrinkage and the selection operator (lasso) [34,35]. Each feature had an associated covariate coefficient. With a continuous increase in λ-value, some regression coefficients continuously declined and tended to 0. The remaining variables with non-zero values were chosen as the best-performing predictors. The optimal hyperparameter λ = 0.001 was found by grid search [36,37].
Multivariable logistic regression developed the most appropriate radiomics model by using the selected radiomic features as the input variables to classify between the binary output variables.
Patients with LN metastases within the 6-year observation period were assigned to the high-risk group, whereas those with complete remission were classified in the low-risk group.
To handle the imbalance between LN metastases (negative vs. positive, 81/10) and avoid bias toward majority class cases to achieve a high classification rate, we applied the synthetic minority over-sampling technique (SMOTE) to the training cohort. SMOTE is an approach in which the minority class is over-sampled by creating “synthetic” examples rather than over-sampling with replacement. Thus, more related minority class samples to learn from are provided, allowing the learner to carve broader decision regions, leading to more coverage of the minority class limitations [38]. For greater generalisability of our results, we performed a stratified 10-fold cross-validation on the under-sampled data in all experiments to train and test the model resulting in a train and test partition of 90% and 10%, respectively, for each fold. We performed patient-specific splits to ensure that each patient’s lymph nodes remained together in either the training or test set. We reported the mean and standard deviation of the area under the ROC-curve, accuracy, precision, recall, and F1-sore over the test set results of the ten runs. Furthermore, receiver operating characteristic (ROC) curves were plotted for each cohort. To ensure that our model was more than just a complicated surrogate for volume, we ran our experiments using only Volume and Mean Intensity as input features.
The correlation coefficients and constant of the model were computed (Figure 3, Appendix A, Figure A1). It is worth mentioning that the feature selection and the model construction were all from the date of the training cohort.
Discrimination performance was assessed by the Harrell concordance index (C-index).
The feature selection and the construction of the radiomics signature model were performed using our in-house software programmed with the Python Scikit-learn package (Python version 3.10, Scikit-learn version Scikit-learn 0.23.3, http://scikit-learn.org/) [36,39].
The features IMAD (Intensity Median Absolute Deviation) and GCS (GLCM Cluster Shade) use the secondary axis; all other features use the primary axis.
The following are the abbreviations used for the features:
IE—Intensity Energy
IMAD—Intensity Median Absolute Deviation
GCP—Glcm Cluster Prominence
GCS—Glcm Cluster Shade
HV—Histogram Variance
GAC—Glcm Auto Correlation
IMX—Intensity Maximum
IMN—Intensity Mean
GCT—Glcm Cluster Tendency
GC—Glcm Contrast
IV—Intensity Variance
IRMS—Root Mean Square

2.4. Development of the Clinical and the Combined Prediction Models

The clinical factors included in our analysis were age, AFP level, Β-HCG level, histotype (seminoma and non-seminoma), and body mass index (BMI). These factors were included as they have all been suggested to be prognostic in TGCT [40,41,42,43].
Our study included purely clinical and laboratory chemistry parameters to represent a real-life scenario for the individualised preoperative prediction of LNM at the time of the CT scan.
The selected clinical features and their relationship to lymph node metastasis were assessed with a univariable logistic regression algorithm in the training set. Variables with p < 0.2 from the univariable analysis were included for further application in a multivariable logistic regression algorithm using forward stepwise selection. A cutoff value of 0.25 is supported by the literature [44,45].
Then, multivariable logistic regression analysis built three prediction models—a radiomics-only model, a clinical-only model and a combined clinical-radiomics model, incorporating the selected radiomics and clinical features.
Their predictive performance for detecting LN metastasis was assessed using the receiver operating characteristic curve (ROC) analysis, in which the areas under the curve (AUC), accuracy, precision, and F1-Score were established.
The clinical utility was demonstrated by decision curve analysis (DCA) to evaluate the net benefits of the prediction models at different threshold probabilities in the training cohort and compare their discriminatory performance.

3. Results

3.1. Clinical Features

The study flowchart is presented in Figure 1.
Ninety-one consecutive patients with histologically-proven TGCT (mean age 35.2 ± 9.4 years, range 18–63) met the criteria for participation in the study. In this cohort, 10 patients (9.1%) relapsed within the six-year observation period (mean 9.8, 35.2 ± 9.4 years, range 18–63); there were no statistically significant differences in clinical characteristics between the LNM-positive group and LNM-negative group. After univariable LR analysis, age, AFP level, Β-HCG level, histotype, and body mass index (BMI) were independent predictors in the clinical model.
All patients’ baseline clinical characteristics are summarised in Table 1.
In total, the dataset consisted of 273 sample instances (three LN ROIs/patient), with 33 instances in the category “relapse of disease” (minority class) and 240 instances in the category “without relapse of disease” (majority class). According to a proportion of 7:3, the 273 sample instances were randomly divided into a training cohort (n = 191) and a test cohort (n = 82).
Due to the class imbalance in the dataset, the under-sampling technique called “Instance Hardness Threshold” was used to balance the data. The balanced data were used for the logistic regression machine learning mode.

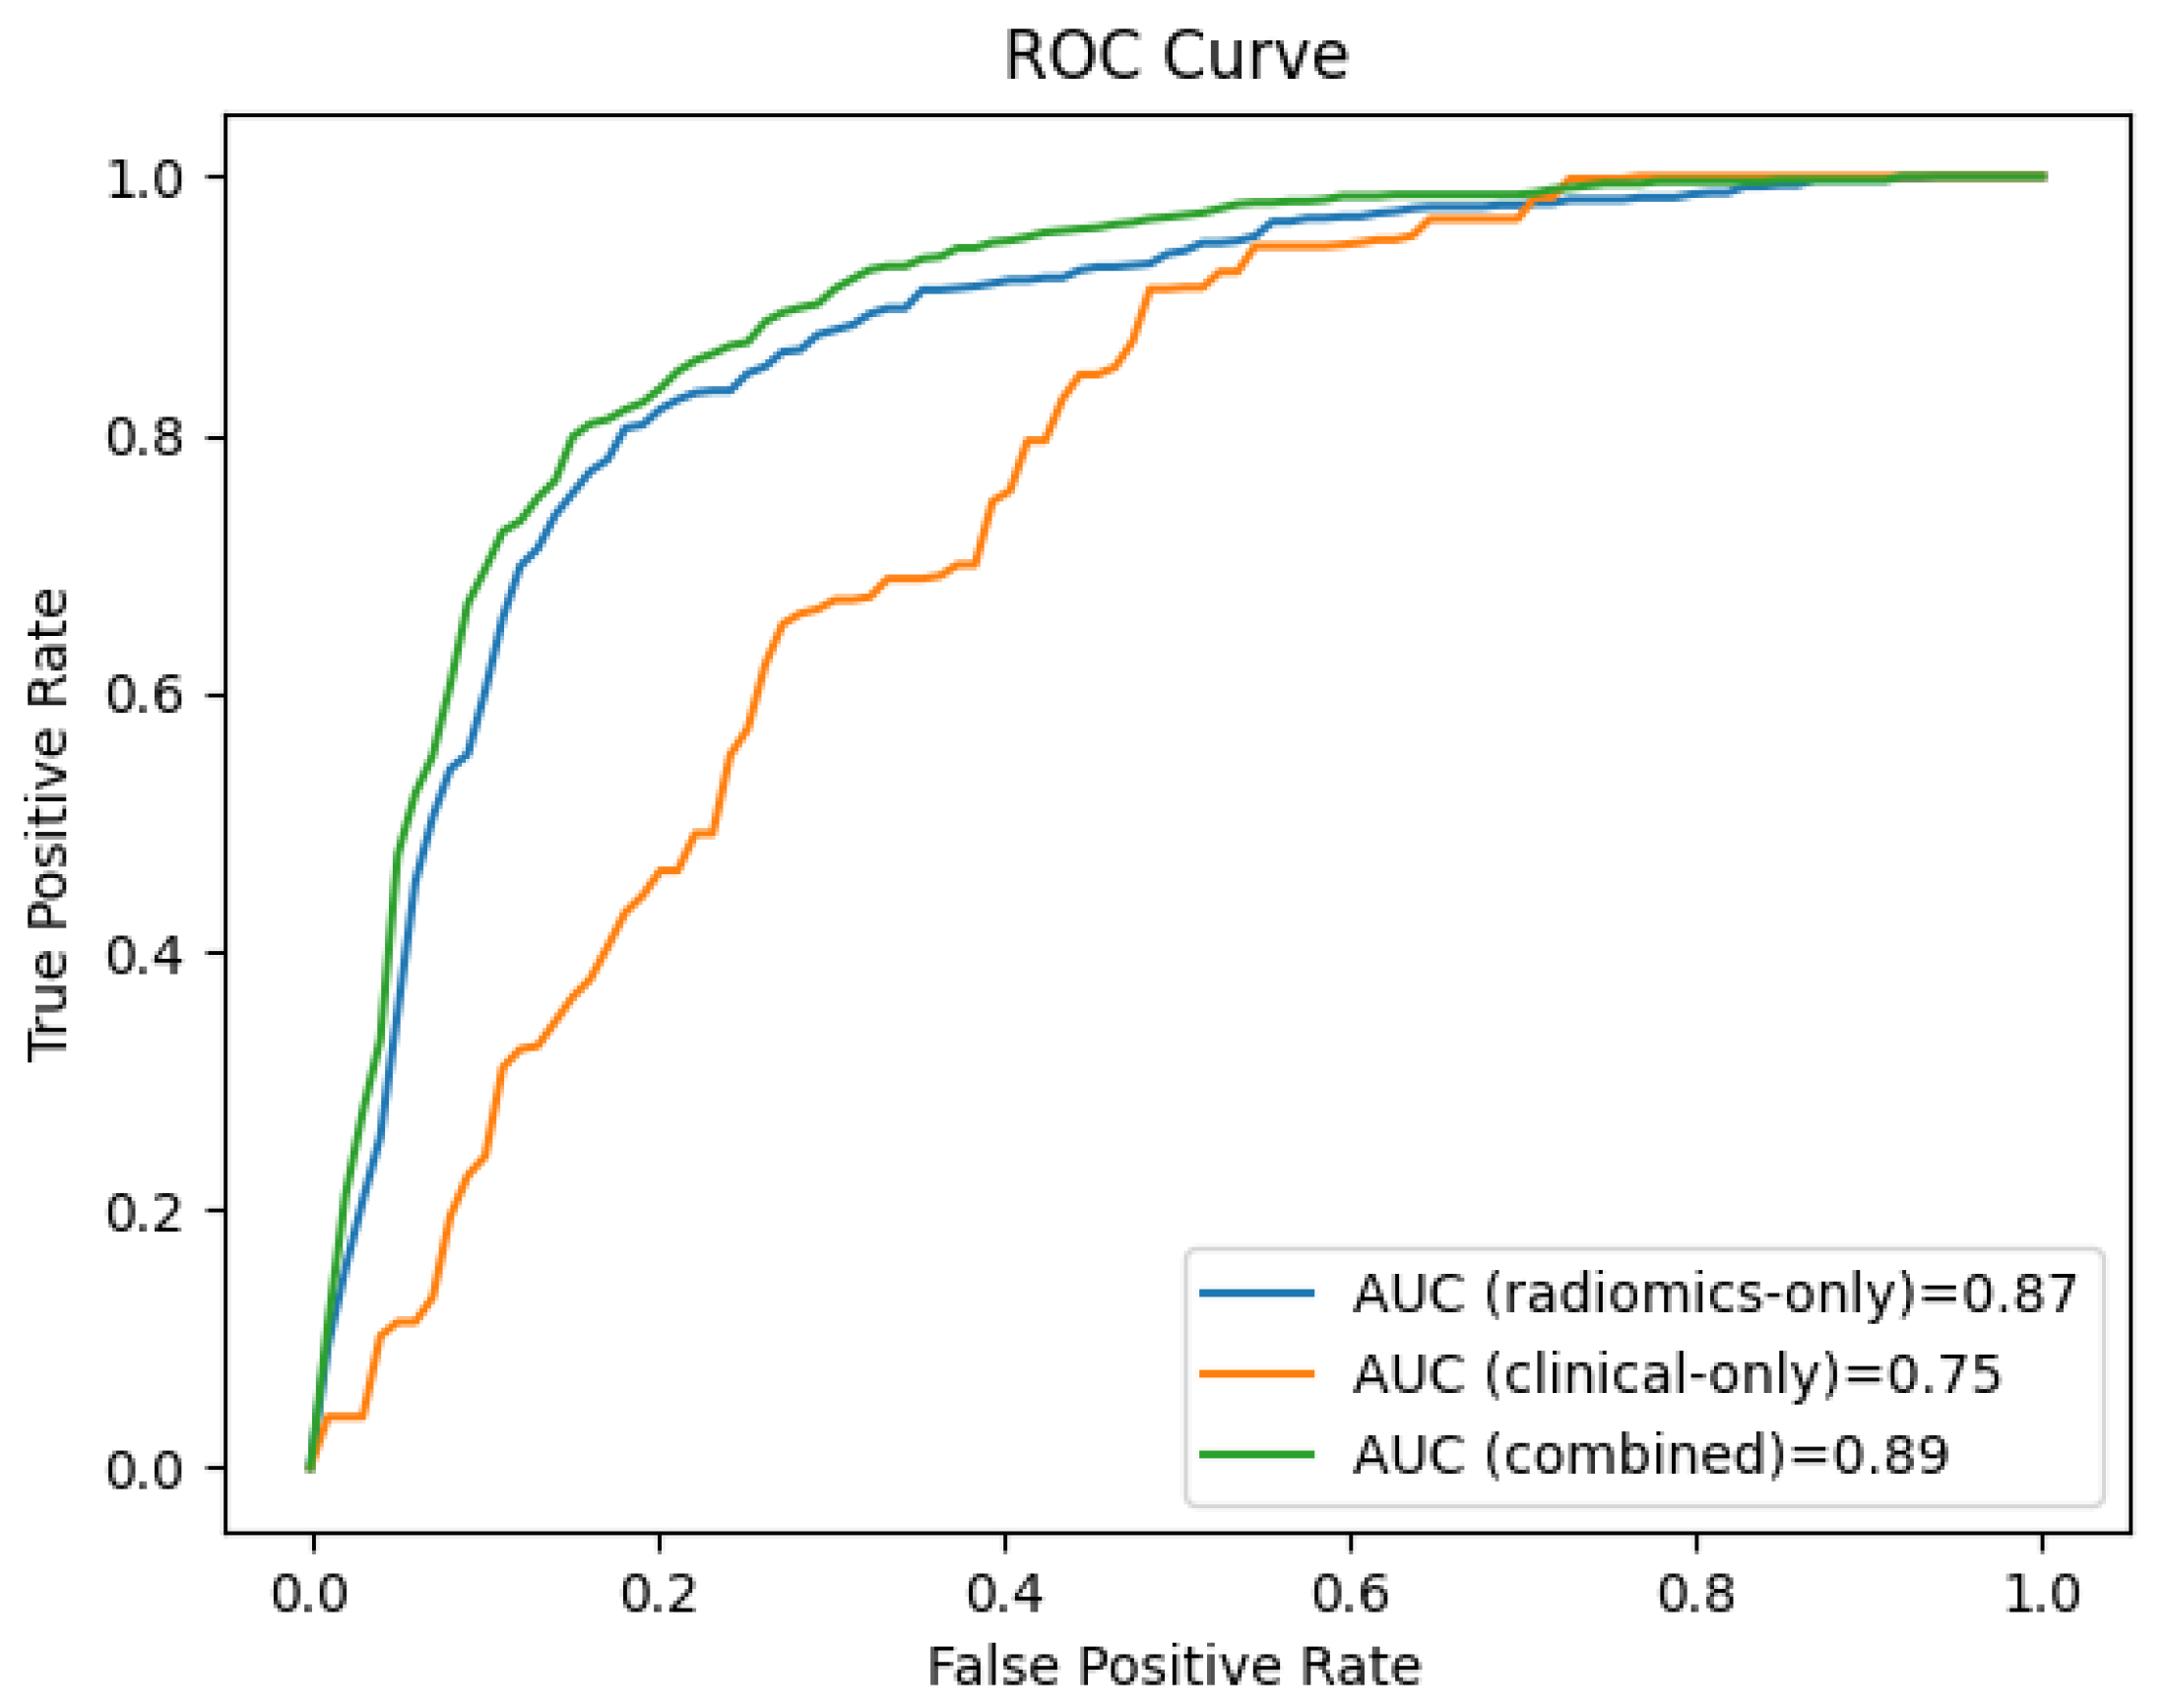
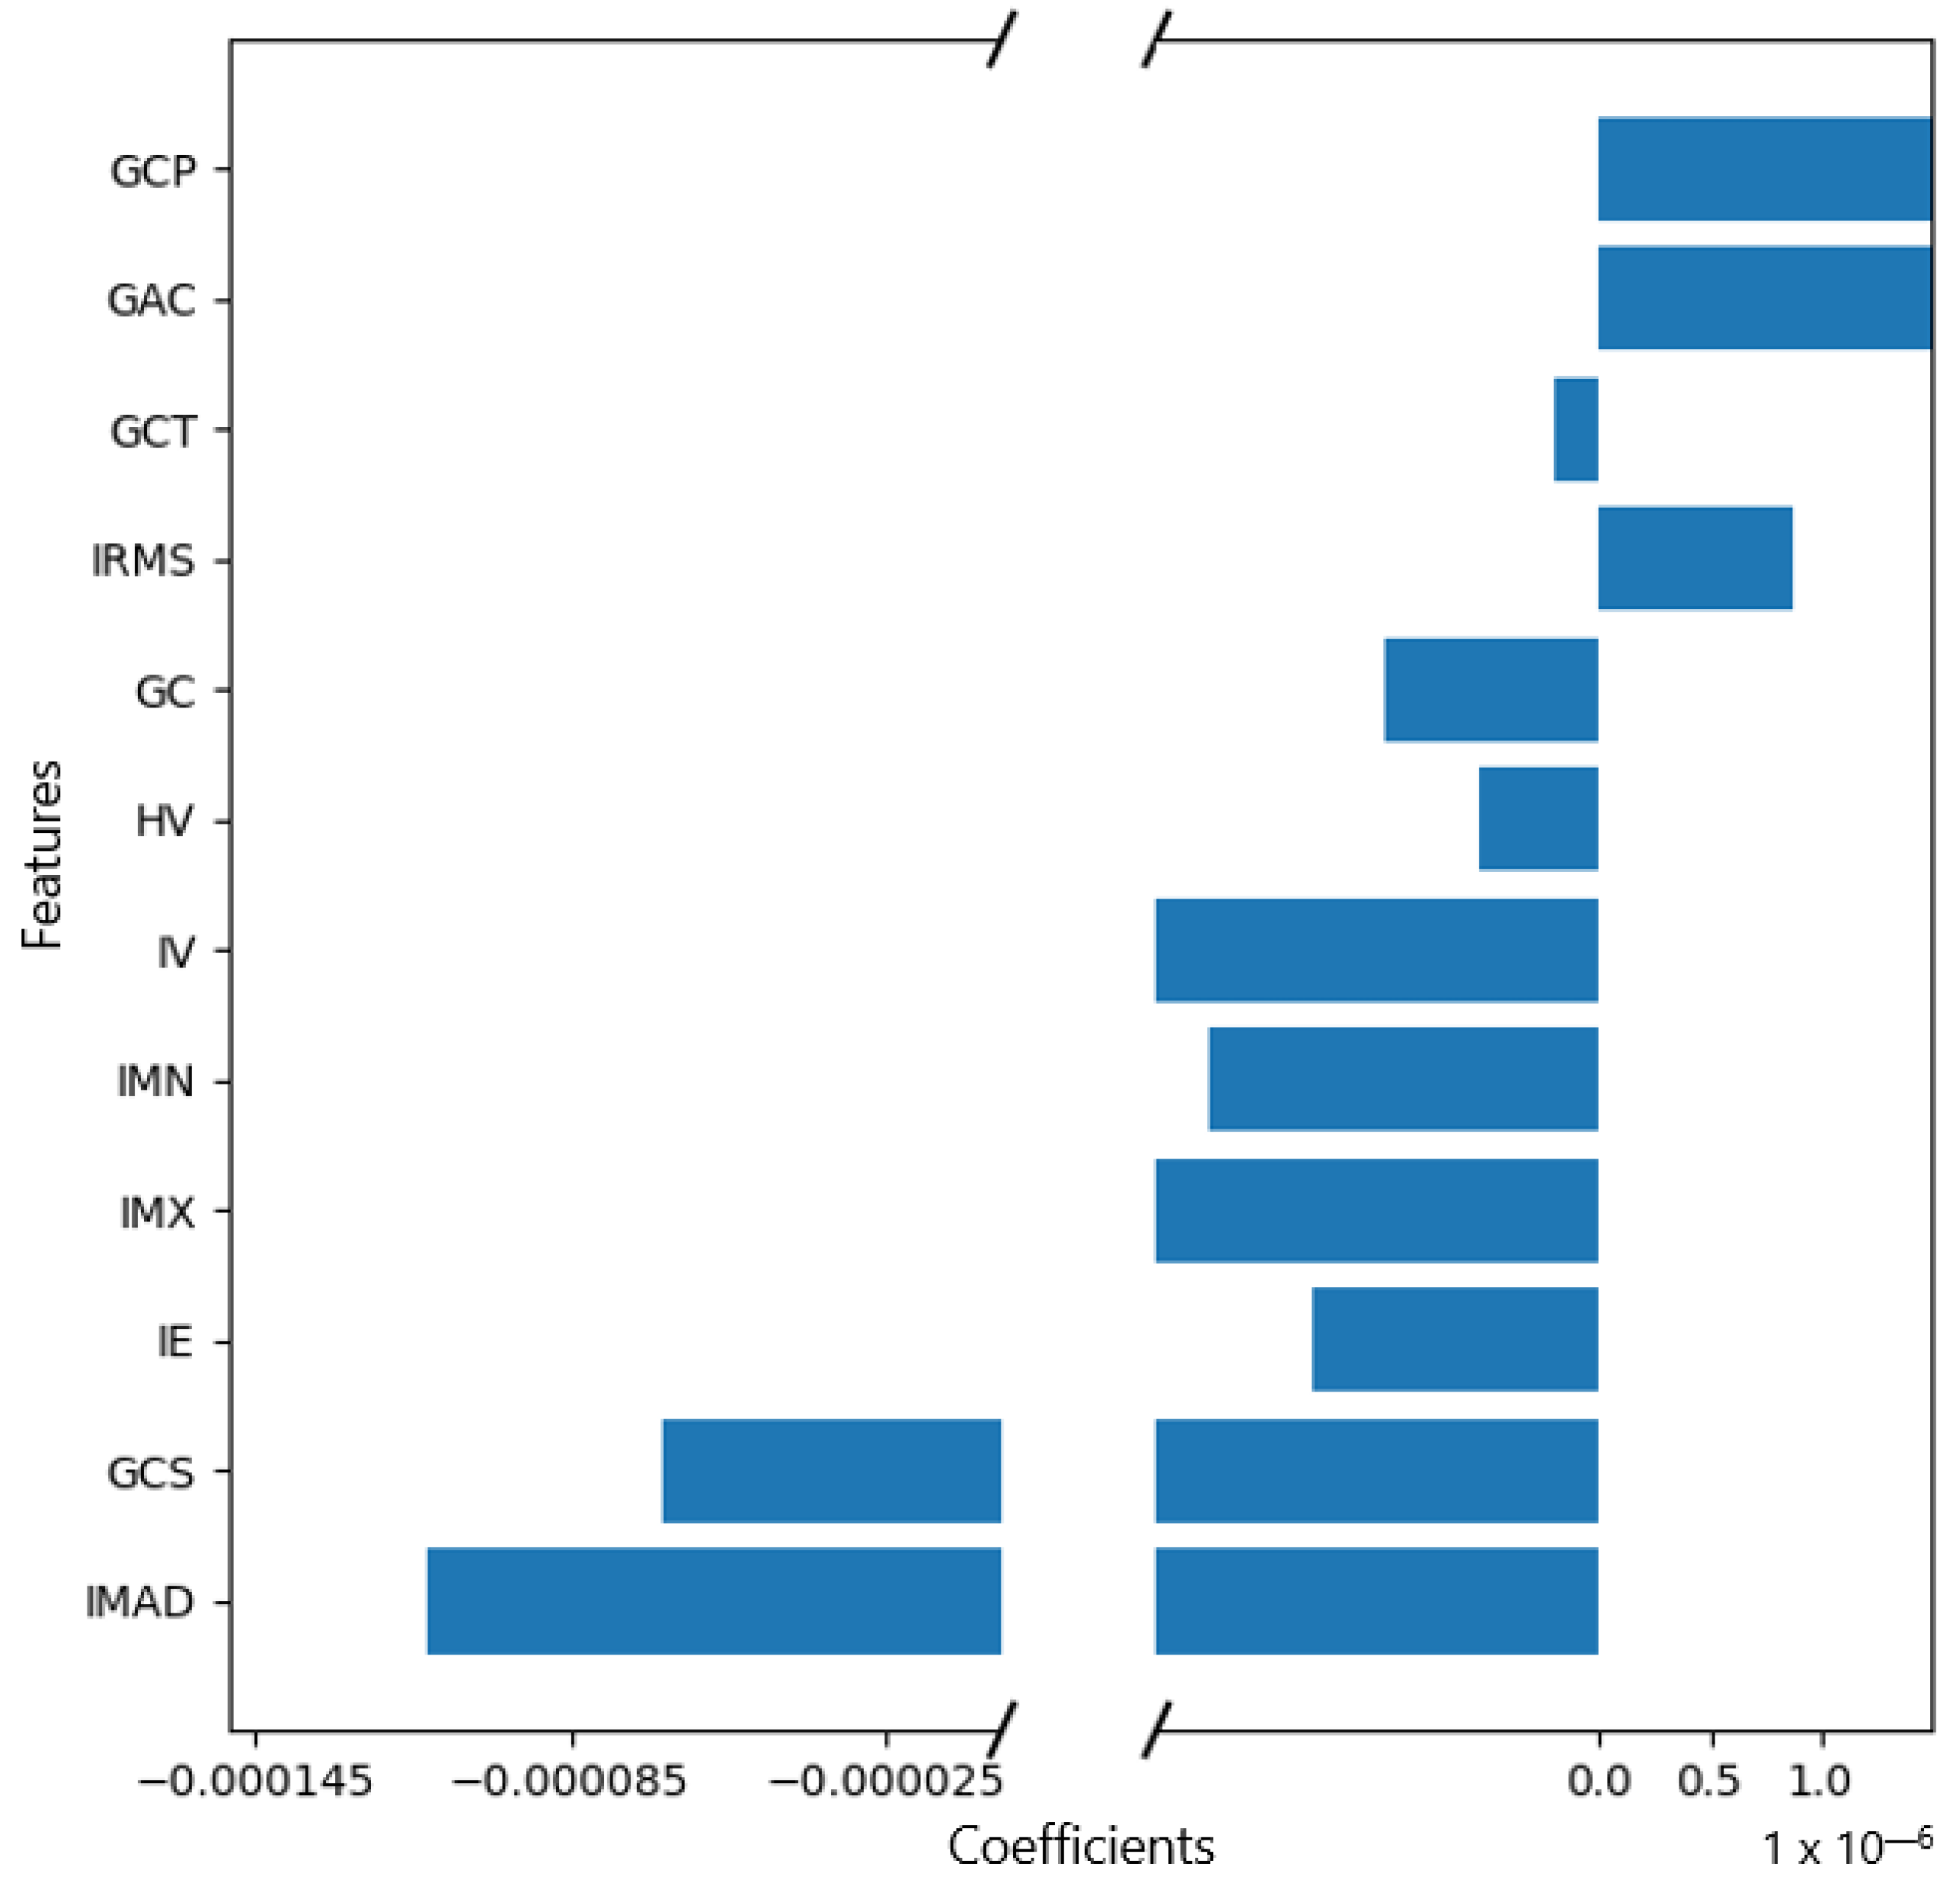
3.2. Feature Selection and Performance of the Radiomics Prediction Model

A total of 85 radiomics features were extracted from the venous-phase CT images of the training cohort (Appendix A, Table A2). After screening these features, we chose the 12 radiomics features that had non-zero coefficients using the LASSO logistic regression model as the best-performing predictors for LN metastasis (Figure 3; Appendix A, Table A3).
These features were used as input volume for the machine learning-based radiomics modelling. Traditional measurements of machine learning-based modelling were used, including accuracy, precision, F1-Score, and the area under the ROC curve (AUC), to assess the performance of predicting lymph node metastases.
All tests were two-sided; p < 0.05 was considered statistically significant.
In the ROC analysis of the radiomics model, the classification evaluation metrics of the 10-fold cross-validation were AUC 0.84 ± 0.17, accuracy 0.76 ± 0.12, precision 0.80 ± 0.18, recall 0.72 ± 0.23, and F1 score 0.73 ± 0.17 in the training cohort (Table 2).
Using only Volume and Intensity Mean as input features led to inferior results with an accuracy of 0.58 ± 0.16, with a precision and recall of 0.11 ± 0.07 and 0.43 ± 0.27, respectively.

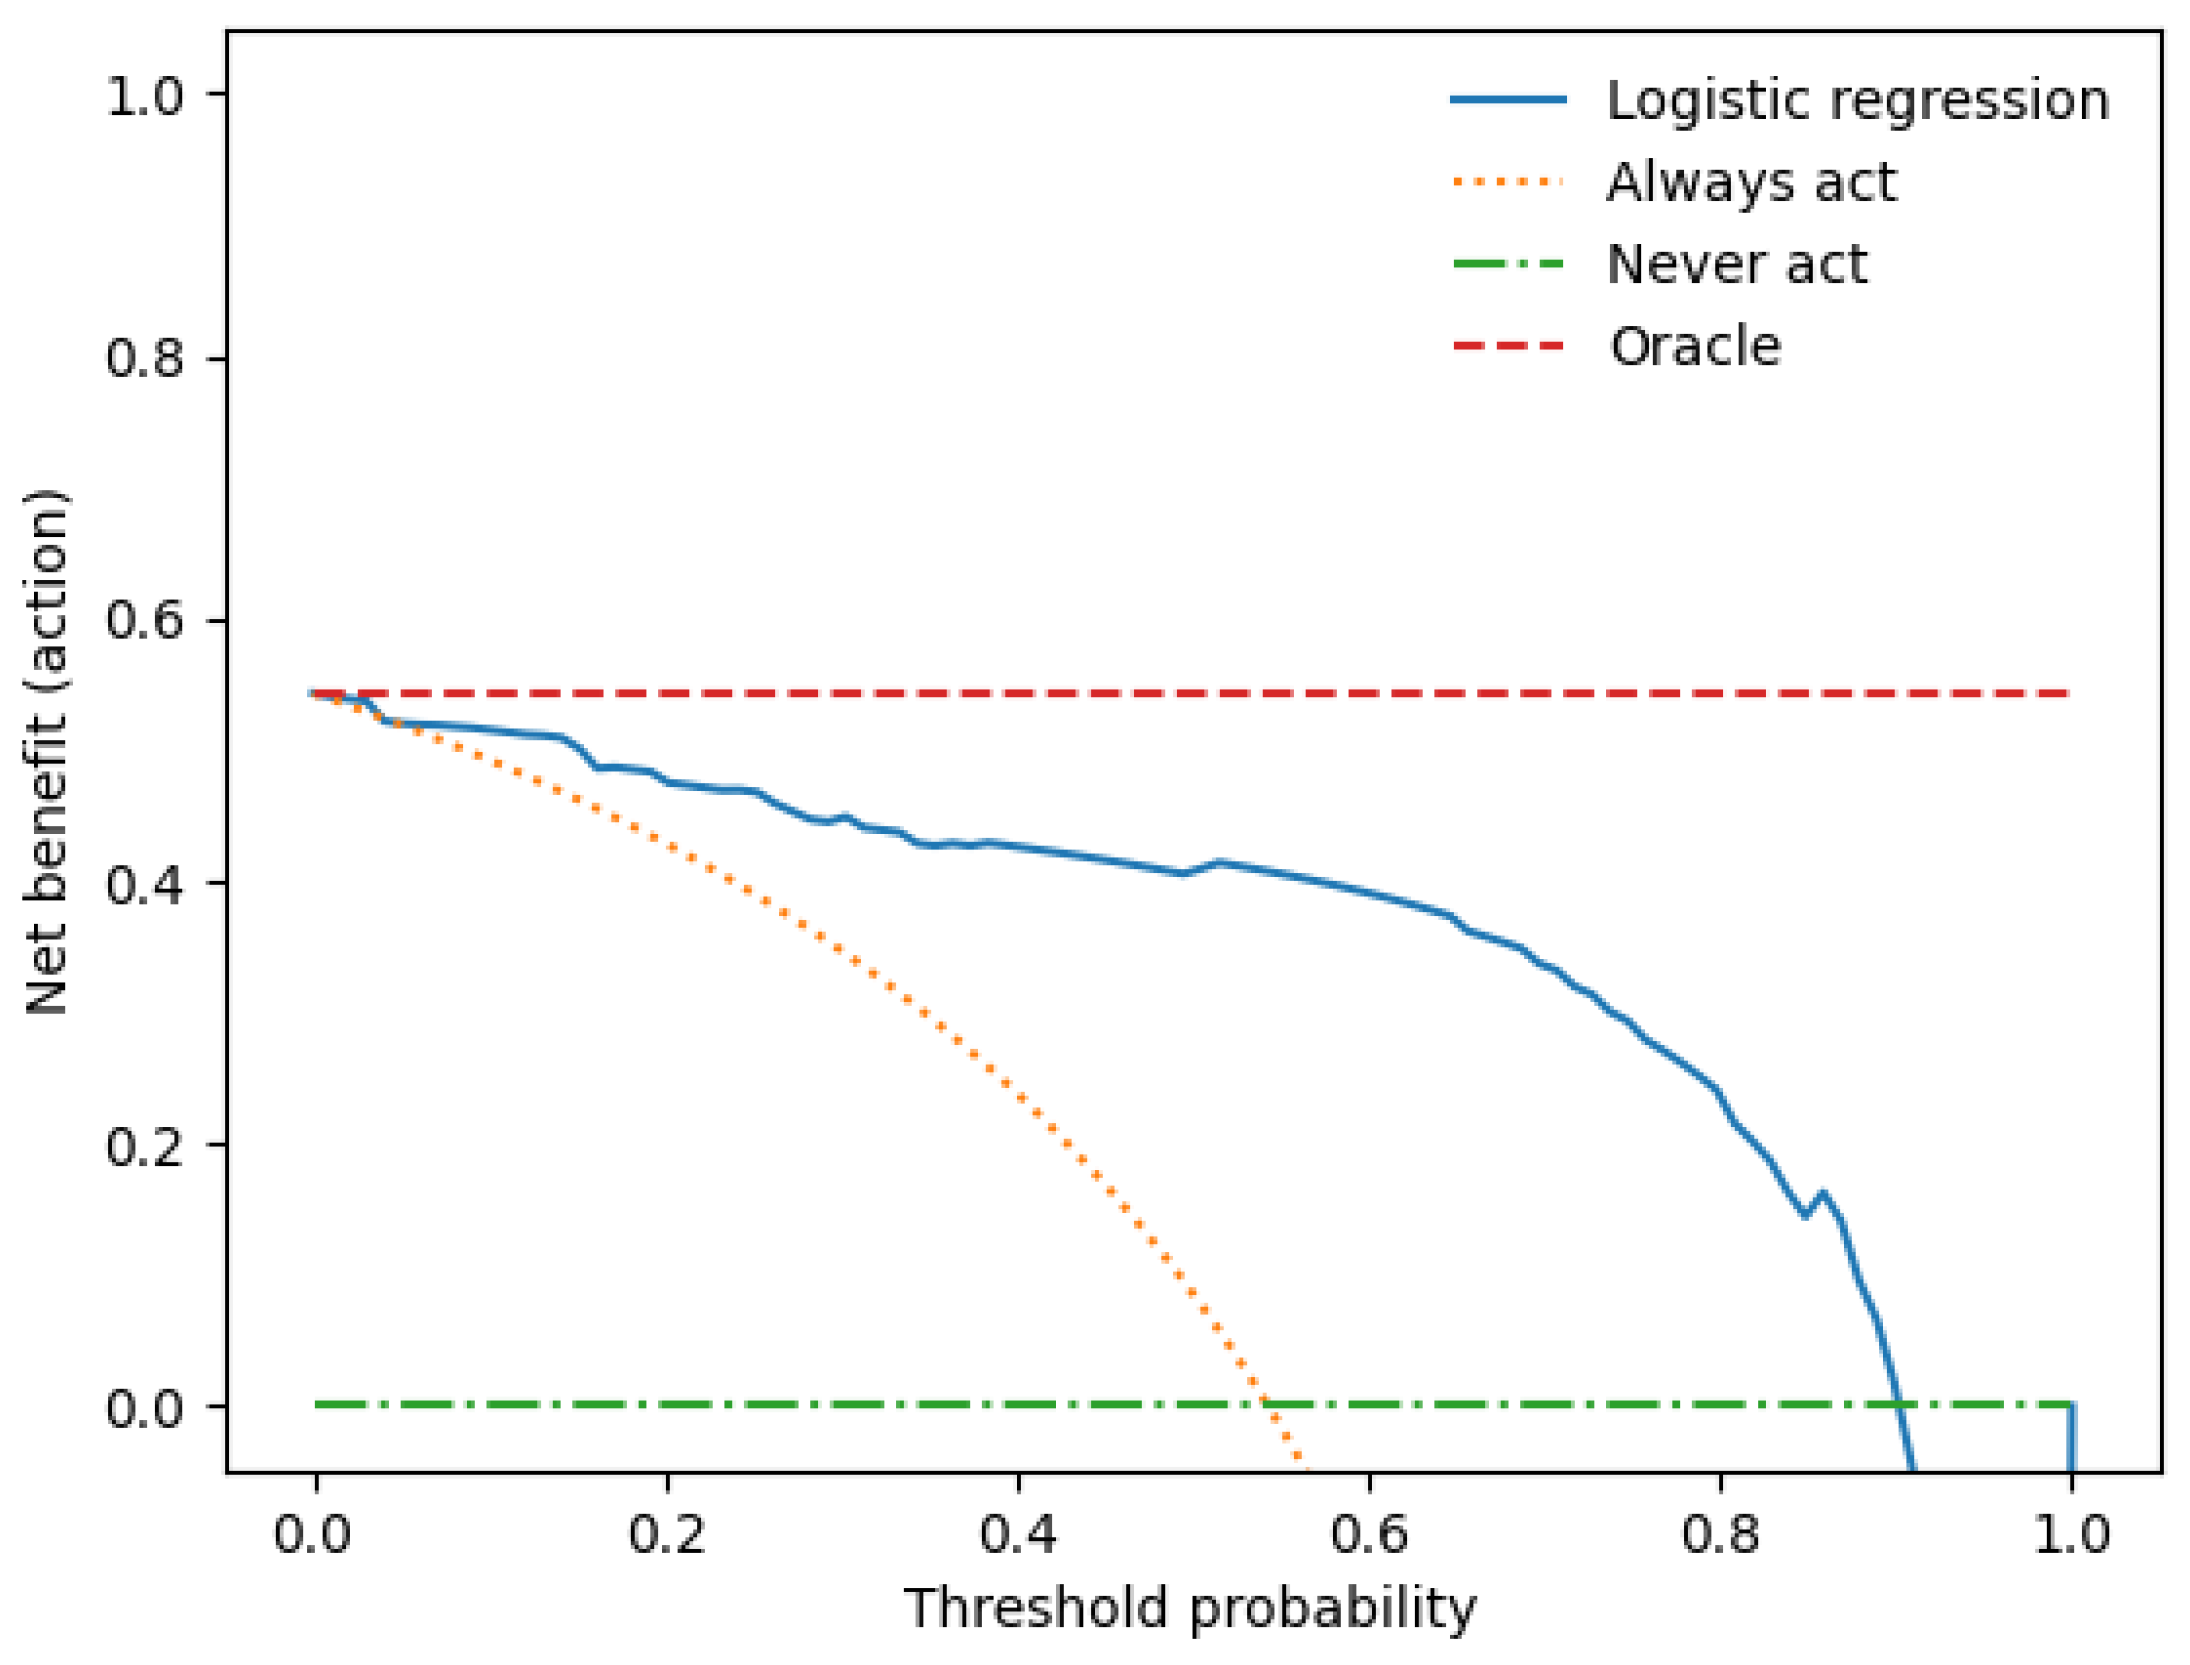
3.3. Performance of the Clinical and the Combined Prediction Model

The clinical-only and combined clinical-radiomics models were built by applying multivariable logistic regression analysis.
The predictive performances of the radiomics-only, the clinical-only and the combined clinical-radiomics models on the training cohort are shown in Table 2.
The different models’ overall accuracy and F1 score for predicting LN metastases were 77% (range: 65–90%, AUC = 0.60–0.94) and 61% (range: 20–90%).
The combined clinical-radiomics model showed the best prediction accuracy with 90% (AUC 0.94–0.10), indicating that adding radiomics features could improve the predictive performance.
Figure 4 shows the receiver operating characteristic (ROC) curves for the clinical, the radiomics, and the combined clinical-radiomics models on the training cohort.
We performed a decision curve analysis to assess the clinical value of the combined clinical-radiomics model. With threshold probability on the x-axis and net benefit on the y-axis, the decision curve analysis graph illustrates the trade-offs between true and false positives (describing benefit and harm) as the threshold probability changes (see Figure 5).
The x-axis represents the threshold probability, the y-axis the net benefit, and the blue line shows the combined prediction model. The green line represents the hypothesis that no patients had LN metastases, and the orange line that all patients had LN metastases. The threshold probability is where the treatment’s expected benefit equals the benefit of avoiding treatment. If the possibility of LN metastasis is over the threshold probability, then a therapeutical strategy for LN metastases should be adopted. The DCA of the combined model shows that if the threshold possibility is between 0 and 0.13, then using the combined model to predict LNM adds more benefit than treating either or all patients.

4. Discussion

We developed a clinical-radiomics model for the individualised preoperative prediction of LNM in testicular germ cell tumour (TGCT) patients that consisted of clinical risk factors and radiomics features to identify the stage I (TGCT) patients who required adjuvant therapy and those who did not.
Our main findings can be summarised by the following:
Using multivariable logistic regression analysis, we constructed a radiomics-only model, a clinical-only model, and a combined predictive model integrating clinical and radiomics features. The combined radiomics–clinical model showed the highest accuracy in predicting LNM (AUC = 0.89 ± 0.03; 95% CI); accuracy: 81%, precision 80%, recall 83%, and F1 score 81%.
Most TGCT patients initially present with stage I disease, and >95% of all stage I seminoma or non-seminoma patients are cured regardless of the therapeutical strategy [46,47,48], resulting in controversies regarding adjuvant chemotherapy, radiotherapy, or retroperitoneal lymph node dissection following orchiectomy due to short- and long-term side effects, such as secondary malignancies, cardiovascular disease, peripheral neuropathy, and loss of antegrade ejaculation [5,6,7,49].
The serum biomarkers AFP, β-hCG, and LDH are substantial instruments for diagnosing, prognostication, and monitoring testicular cancer, which is reflected in the International Germ Cell Cancer Consensus Group prognostic index [17,50,51]. However, sensitivity is limited; up to 40% of patients with recurrence have “normal” values [52].
Several studies have proposed further prognostic clinical risk factors, including age and BMI, but their roles have not yet been sufficiently clarified, with somewhat controversial discussion [40,41,42,43].
To date, neither imaging nor serum tumour markers have been proven to be suitable predictors of the presence of lymph node metastases [53,54]. However, the inherently excellent prognosis can be put at risk by suboptimal treatment, with over- and undertreatment being equally detrimental.
Several studies demonstrate the ability of radiomics based on MR- or CT-imaging to detect lymph node metastasis, including lung, oesophagal, breast, cervical, bladder, and colorectal cancer [28,29,55,56,57,58]. Classification accuracy in these studies ranged from 76% to 84%, which is lower than the results of our study.
Until now, few studies have been performed to distinguish between benign and malignant LN in testicular cancer.
In their study, Baessler et al. showed that a machine-learning classifier based on (CT) radiomics could predict the histopathology of lymph nodes after LN dissection following chemotherapy in patients with metastatic non-seminomatous germ cell tumours of the testis [59]. This single-centre retrospective study included eighty patients with a total of 204 lesions classified by a support vector model and achieved 81% classification accuracy.
Nevertheless, in contrast to our study, they did not include clinical variables in their radiomics approach to further increase diagnostic performance.
Furthermore, they split the study cohort, which was altogether of moderate size, into three subgroups, with only 19 patients in the test group and with an overall reduction in statistical significance as a result. To address the moderate dataset, we used a cross-validation approach, which involves repeated data splitting to prevent overfitting while obtaining accurate estimates of the model coefficients [60]. Lewin et al. achieved in their retrospective, single-centre study on 77 metastatic TGCT patients with 102 lesions a classification accuracy of only 72% [61].
Lewin et al. used only one single CT scanner. In contrast, our study analysed data from two scanners, thus being more representative of data acquired during routine clinical practice. Like Baessler et al., Lewin et al. did not integrate clinical factors into a combined clinical-radiomics model.
Given our 10-fold cross-validation approach, the a priori inhomogeneity of our dataset, and the integration of clinical risk factors, we are convinced that our combined prediction model is more generalisable, and forthcoming investigations should further validate our trained model in prospective studies.
Beyond radiomics-based models, several clinical models exist to predict the occurrence of LNM in TGCT. However, these models yielded conflicting results and could not be included in today’s clinical decision-making [53,62,63,64].
Taken together, identifying and implementing novel biomarkers might be helpful for early diagnosis and monitoring of disease relapse.
Our study is the first to use a combined CT-based radiomics model integrating clinical predictors for the individualised preoperative prediction of LNM in early-stage TGCT to reduce overtreatment in this group of young patients.
However, we acknowledge some limitations in the present study.
As a retrospective study with a modest cohort size, there may be inevitable selection bias. Furthermore, classes were highly unbalanced, in line with the normal distribution, with 80% of all stage 1 TGCT patients showing an excellent outcome. Nevertheless, unlike prior radiomics investigations on LN metastasis that mostly extracted features from the largest cross-sectional area, our study performed whole lesion analysis by considering all available CT slices, thus providing abundant information about tumour heterogeneity.
Second, our case was a single-institution study. Due to our patient population’s high cure rate, it is challenging to power studies to examine prognostic and predictive factors adequately. However, prospective and multicenter validation is warranted to obtain higher-quality evidence for clinical use.
Moreover, only one (imaging) modality and the circulating tumour markers β-HCG and AFP were used in this study. Among other prognostic factors, such as lymphovascular or rete testis invasion, tumour size is the most valuable prognostic factor for early-stage seminoma relapse [65,66]. Our study included solely clinical and laboratory parameters that can be collected easily, quickly, and non-invasively so that a preoperative risk assessment of the individual patient can already be made at the time of CT.
In addition to the known serum markers, studies show the potential of non-coding RNAs as biomarkers with stem cell-associated microRNAs (miR-371a-3p and miR-302/367 clusters) outperforming the conventional tumour markers in detecting newly diagnosed TGCT patients [67,68].
If more modalities were combined as a multi-omics approach, the obtained feature pool might increase the ability to predict LNM in patients with testicular cancer.
Our presented CT-based radiomics–clinical model represents an exciting non-invasive prediction tool for individualised prediction of LN metastasis in testicular germ cell tumours to reduce overtreatment in this young group of patients. Multi-centre, retrospective validations and prospective randomised clinical trials should be undertaken to gain high-quality evidence for clinical applications in subsequent studies.

5. Conclusions

In conclusion, our combined clinical-radiomics model applied on preoperative CT imaging represents an exciting new tool for improved prediction of lymph node metastases in early-stage testicular germ cell tumour (TGCT) patients to reduce overtreatment in this group of young patients. The presented approach should be combined with novel clinical biomarkers, such as microRNAs (miR-371a-3p and miR-302/367 cluster) and further validated in larger, prospective clinical trials.

Author Contributions

Conceptualisation, C.S.L., F.Z. and C.G.S.L.; methodology, C.S.L., C.G.S.L. and M.G.; software, S.M., D.W. and M.G.; formal analysis, C.S.L. and C.G.S.L.; investigation, C.S.L., J.S. and C.G.S.L.; resources, C.S.L.; data curation, C.S.L., S.A.S. and C.G.S.L., writing—original draft preparation, C.S.L.; writing—review and editing, F.Z., S.A.S., M.B., D.W. and M.G.; visualisation, C.S.L., S.M., D.W. and C.G.S.L.; supervision, M.B.; project administration, C.S.L. All authors have read and agreed to the published version of the manuscript.

Funding

Radiological Cooperative Network (RACOON).

Institutional Review Board Statement

The study was conducted in accordance with the Declaration of Helsinki and approved by the ethics committee of the medical faculty of the University of Ulm (protocol code 155/18, 25 April 2018).

Informed Consent Statement

Informed consent was obtained from all subjects involved in the study.

Data Availability Statement

Data sharing is not applicable to this article.

Conflicts of Interest

The authors declare no conflict of interest.

Abbreviations

AFPAlpha-fetoprotein
AUCArea under the curve
CTComputed tomography
β-HCGBeta human chorionic gonadotropin
LNsLymph nodes
LNMLymph node metastases
LRLogistic regression
MLMachine learning
ROCReceiver operating curve
ROIRegion of interest
TGCTTesticular germ cell tumour

Appendix A

Table A1. Settings of the radiomics feature extraction.
SettingDetermination
Bin MethodFBN
Bin Amount32
LoG Filter0
LoG Sigma2
Matrix Aggregation3D Average
MethodDirections
Resample Filter1
Resample Spacing X1
Resample Spacing Y1
Resample Spacing Z1
Second-Order Distance1
Threshold Filter0
Table A2. Radiomics features extracted for model development.
Radiomics Features of First OrderRadiomics Features of Second Order:
Gray Level Co-Occurrence Matrix (GLCM)
Histogram MinimumJoint Maximum
Histogram MaximumJoint Average
Histogram RangeStandart Deviation
Histogram MeanJoint Variance
Histogram VarianceJoint Entropy
Histogram Standart DeviationDifference Average
Histogram SkewnessDifference Variance
Histogram KurtosisDifference Entropy
Histogram EntropySum of Averages
Histogram UniformitySum of Variance
Histogram Mean Absolute DeviationSum of Entropy
Histogram Robust Mean Absolute DeviationAngular Second Moment
Histogram Median Absolute DeviationContrast
Histogram Coefficient VariationDissimilarity
Histogram Quartile Coefficient DispersionInverse Difference
Histogram Interquartile RangeInverse Difference Normalised
Histogram P10thInverse Difference Moment
Histogram P25thInverse Difference Moment Normalised
Histogram P50thJoint Maximum
Histogram P75thJoint Average
Histogram P90thStandart Deviation
Histogram Minimum Histogram Gradient IntensityJoint Variance
Histogram MaximumHistogram Gradient IntensityJoint Entropy
Intensity MinimumDifference Average
Intensity MaximumDifference Variance
Intensity RangeDifference Entropy
Intensity MeanSum of Averages
Intensity VarianceSum of Variance
Intensity Standart DeviationSum of Entropy
Intensity SkewnessAngular Second Moment
Intensity KurtosisContrast
Intensity EnergyDissimilarity
Intensity P10thInverse Variance
Intensity P25thCorrelation
Intensity P50thAuto Correlation
Intensity P75thCluster Shade
Intensity P90thCluster Prominence
Intensity Root Mean SquareCluster Tendency
Intensity Mean Absolute DeviationInformation Correlation 1
Intensity Robust Mean Absolute DeviationInformation Correlation 2
Intensity Median Absolute DeviationInverse Variance 41
Intensity Coefficient Variation
Intensity Quartile Coefficient Dispersion
Intensity Interquartile Range 44
Table A3. Radiomics features selected by LASSO.
Radiomics Features of First OrderRadiomics Features of Second Order:
Gray Level Co-Occurrence Matrix (GLCM)
Histogram VarianceAuto Correlation
Intensity MaximumCluster Shade
Intensity MeanCluster Prominence
Intensity VarianceCluster Tendency
Intensity EnergyContrast
Intensity Root Mean Square
Intensity Median Absolute Deviation
Figure A1. Feature weights generated by the coefficients of the logistic regression model indicating positive or negative correlation with lymph node metastasis.
Onco 03 00006 g0a1

References

  1. Ruf, C.G.; Isbarn, H.; Wagner, W.; Fisch, M.; Matthies, C.; Dieckmann, K.P. Changes in Epidemiologic Features of Testicular Germ Cell Cancer: Age at Diagnosis and Relative Frequency of Seminoma Are Constantly and Significantly Increasing; Elsevier: Amsterdam, The Netherlands, 2014; p. 33-e1. [Google Scholar]
  2. Bray, F.; Richiardi, L.; Ekbom, A.; Pukkala, E.; Cuninkova, M.; Møller, H. Trends in testicular cancer incidence and mortality in 22 European countries: Continuing increases in incidence and declines in mortality. Int. J. Cancer 2006, 118, 3099–3111. [Google Scholar] [CrossRef] [PubMed]
  3. Einhorn, L.H. Treatment of testicular cancer: A new and improved model. J. Clin. Oncol. 1990, 8, 1777–1781. [Google Scholar] [CrossRef] [PubMed]
  4. Kollmannsberger, C.; Tandstad, T.; Bedard, P.L.; Cohn-Cedermark, G.; Chung, P.W.; Jewett, M.A.; Powles, T.; Warde, P.; Daneshmand, S.; Protheroe, A.; et al. Patterns of relapse in patients with clinical stage I testicular cancer managed with active surveillance. J. Clin. Oncol. 2015, 33, 51–57. [Google Scholar] [CrossRef]
  5. Fung, C.; Sesso, H.D.; Williams, A.M.; Kerns, S.L.; Monahan, P.; Zaid, M.A.; Feldman, D.; Hamilton, R.J.; Vaughn, D.J.; Beard, C.J.; et al. Multi-institutional assessment of adverse health outcomes among North American testicular cancer survivors after modern cisplatin-based chemotherapy. J. Clin. Oncol. 2017, 35, 1211. [Google Scholar] [CrossRef]
  6. Huddart, R.; Norman, A.; Shahidi, M.; Horwich, A.; Coward, D.; Nicholls, J.; Dearnaley, D.P. Cardiovascular disease as a long-term complication of treatment for testicular cancer. J. Clin. Oncol. 2003, 21, 1513–1523. [Google Scholar] [CrossRef] [PubMed]
  7. Travis, L.B.; Ng, A.K.; Allan, J.M.; Pui, C.H.; Kennedy, A.R.; Xu, X.G.; Purdy, J.A.; Applegate, K.; Yahalom, J.; Constine, L.S.; et al. Second malignant neoplasms and cardiovascular disease following radiotherapy. J. Natl. Cancer Inst. 2012, 104, 357–370. [Google Scholar] [CrossRef]
  8. Kerns, S.L.; Fung, C.; Monahan, P.O.; Ardeshir-Rouhani-Fard, S.; Zaid, M.I.A.; Williams, A.M.; Stump, T.E.; Sesso, H.D.; Feldman, D.R.; Hamilton, R.J.; et al. Cumulative burden of morbidity among testicular cancer survivors after standard cisplatin-based chemotherapy: A multi-institutional study. J. Clin. Oncol. 2018, 36, 1505. [Google Scholar] [CrossRef]
  9. Agrawal, V.; Dinh, P.C., Jr.; Fung, C.; Monahan, P.O.; Althouse, S.K.; Norton, K.; Cary, C.; Einhorn, L.; Fossa, S.D.; Adra, N.; et al. Adverse health outcomes among US testicular cancer survivors after cisplatin-based chemotherapy vs surgical management. JNCI Cancer Spectr. 2020, 4, pkz079. [Google Scholar] [CrossRef] [Green Version]
  10. Tandstad, T.; Kollmannsberger, C.K.; Roth, B.J.; Jeldres, C.; Gillessen, S.; Fizazi, K.; Daneshmand, S.; Lowrance, W.T.; Hanna, N.H.; Albany, C.; et al. Practice makes perfect: The rest of the story in testicular cancer as a model curable neoplasm. J. Clin. Oncol. 2017, 35, 3525. [Google Scholar] [CrossRef] [Green Version]
  11. Rajpert-De Meyts, E.; McGlynn, K.A.; Okamoto, K.; Jewett, M.A.; Bokemeyer, C. Testicular germ cell tumours. Lancet 2016, 387, 1762–1774. [Google Scholar] [CrossRef]
  12. Cheng, L.; Albers, P.; Berney, D.M.; Feldman, D.R.; Daugaard, G.; Gilligan, T.; Looijenga, L.H. Testicular cancer. Nat. Rev. Dis. Prim. 2018, 4, 29. [Google Scholar] [CrossRef]
  13. Dieckmann, K.P.; Simonsen-Richter, H.; Kulejewski, M.; Anheuser, P.; Zecha, H.; Isbarn, H.; Pichlmeier, U. Serum tumour markers in testicular germ cell tumours: Frequencies of elevated levels and extents of marker elevation are significantly associated with clinical parameters and with response to treatment. BioMed Res. Int. 2019, 2019, 5030349. [Google Scholar] [CrossRef] [PubMed]
  14. Gilligan, T.D.; Hayes, D.F.; Seidenfeld, J.; Temin, S. ASCO clinical practice guideline on uses of serum tumor markers in adult males with germ cell tumors. J. Oncol. Pract. 2010, 6, 199. [Google Scholar] [CrossRef] [PubMed] [Green Version]
  15. Kliesch, S.; Schmidt, S.; Wilborn, D.; Aigner, C.; Albrecht, W.; Bedke, J.; Beintker, M.; Beyersdorff, D.; Bokemeyer, C.; Busch, J.; et al. Management of germ cell tumours of the testis in adult patients. German clinical practice guideline part I: Epidemiology, classification, diagnosis, prognosis, fertility preservation, and treatment recommendations for localized stages. Urol. Int. 2021, 105, 169–180. [Google Scholar] [CrossRef]
  16. Patel, H.D.; Joice, G.A.; Schwen, Z.R.; Semerjian, A.; Alam, R.; Srivastava, A.; Allaf, M.E.; Pierorazio, P.M. Retroperitoneal lymph node dissection for testicular seminomas: Population-based practice and survival outcomes. World J. Urol. 2018, 36, 73–78. [Google Scholar] [CrossRef] [PubMed]
  17. Murray, M.J.; Huddart, R.A.; Coleman, N. The present and future of serum diagnostic tests for testicular germ cell tumours. Nat. Rev. Urol. 2016, 13, 715–725. [Google Scholar] [CrossRef] [Green Version]
  18. Albers, P.; Albrecht, W.; Algaba, F.; Bokemeyer, C.; Cohn-Cedermark, G.; Fizazi, K.; Horwich, A.; Laguna, M.P.; Nicolai, N.; Oldenburg, J. Guidelines on testicular cancer: 2015 update. Eur. Urol. 2015, 68, 1054–1068. [Google Scholar] [CrossRef]
  19. Hudolin, T.; Kastelan, Z.; Knezevic, N.; Goluza, E.; Tomas, D.; Coric, M. Correlation between retroperitoneal lymph node size and presence of metastases in nonseminomatous germ cell tumors. Int. J. Surg. Pathol. 2012, 20, 15–18. [Google Scholar] [CrossRef]
  20. Hale, G.R.; Teplitsky, S.; Truong, H.; Gold, S.A.; Bloom, J.B.; Agarwal, P.K. Lymph node imaging in testicular cancer. Transl. Androl. Urol. 2018, 7, 864. [Google Scholar] [CrossRef]
  21. Obermeyer, Z.; Emanuel, E.J. Predicting the future—Big data, machine learning, and clinical medicine. N. Engl. J. Med. 2016, 375, 1216. [Google Scholar] [CrossRef] [Green Version]
  22. Lambin, P.; Leijenaar, R.T.; Deist, T.M.; Peerlings, J.; De Jong, E.E.; Van Timmeren, J.; Sanduleanu, S.; Larue, R.T.H.M.; Even, A.J.G.; Jochems, A.; et al. Radiomics: The bridge between medical imaging and personalised medicine. Nat. Rev. Clin. Oncol. 2017, 14, 749–762. [Google Scholar] [CrossRef] [PubMed] [Green Version]
  23. Gillies, R.J.; Kinahan, P.E.; Hricak, H. Radiomics: Images are more than pictures, they are data. Radiology 2016, 278, 563. [Google Scholar] [CrossRef] [Green Version]
  24. Zwanenburg, A.; Vallières, M.; Abdalah, M.A.; Aerts, H.J.; Andrearczyk, V.; Apte, A.; Ashrafinia, S.; Bakas, S.; Beukinga, R.J.; Boellaard, R.; et al. The image biomarker standardisation initiative: Standardised quantitative radiomics for high-throughput image-based phenotyping. Radiology 2020, 295, 328–338. [Google Scholar] [CrossRef] [PubMed] [Green Version]
  25. Sollini, M.; Antunovic, L.; Chiti, A.; Kirienko, M. Towards clinical application of image mining: A systematic review on artificial intelligence and radiomics. Eur. J. Nucl. Med. Mol. Imaging 2019, 46, 2656–2672. [Google Scholar] [CrossRef] [Green Version]
  26. Ibrahim, A.; Primakov, S.; Beuque, M.; Woodruff, H.; Halilaj, I.; Wu, G.; Refaee, T.; Granzier, R.; Widaatalla, Y.; Hustinx, R.; et al. Radiomics for precision medicine: Current challenges, future prospects, and the proposal of a new framework. Methods 2021, 188, 20–29. [Google Scholar] [CrossRef]
  27. Dong, D.; Tang, L.; Li, Z.Y.; Fang, M.J.; Gao, J.B.; Shan, X.H.; Ying, X.-J.; Sun, Y.-S.; Fu, J.; Wang, X.-X.; et al. Development and validation of an individualised nomogram to identify occult peritoneal metastasis in patients with advanced gastric cancer. Ann. Oncol. 2019, 30, 431–438. [Google Scholar] [CrossRef]
  28. Huang, Y.; Liang, C.; He, L.; Tian, J.; Liang, C.; Chen, X.; Ma, Z.-L.; Liu, Z.-Y. Development and validation of a radiomics nomogram for preoperative prediction of lymph node metastasis in colorectal cancer. J. Clin. Oncol. 2016, 34, 2157–2164. [Google Scholar] [CrossRef]
  29. Wu, S.; Zheng, J.; Li, Y.; Yu, H.; Shi, S.; Xie, W.; Liu, H.; Su, Y.; Huang, J.; Lin, T.; et al. A Radiomics Nomogram for the Preoperative Prediction of Lymph Node Metastasis in Bladder CancerA Radiomics Nomogram for Bladder Cancer. Clin. Cancer Res. 2017, 23, 6904–6911. [Google Scholar] [CrossRef] [Green Version]
  30. Gao, J.; Han, F.; Jin, Y.; Wang, X.; Zhang, J. A radiomics nomogram for the preoperative prediction of lymph node metastasis in pancreatic ductal adenocarcinoma. Front. Oncol. 2020, 10, 1654. [Google Scholar] [CrossRef]
  31. Haralick, R.M.; Shanmugam, K.; Dinstein, I.H. Textural features for image classification. IEEE Trans. Syst. Man Cybern. 1973, SMC-3, 610–621. [Google Scholar] [CrossRef] [Green Version]
  32. Shen, C.; Liu, Z.; Guan, M.; Song, J.; Lian, Y.; Wang, S.; Tang, Z.; Dong, D.; Kong, L.; Wang, M.; et al. 2D and 3D CT radiomics features prognostic performance comparison in non-small cell lung cancer. Transl. Oncol. 2017, 10, 886–894. [Google Scholar] [CrossRef]
  33. Duin, R.P.; Pekalska, E. Dissimilarity Representation for Pattern Recognition. In Foundations And Applications; World Scientific: Singapore, 2005; Volume 64. [Google Scholar]
  34. Tibshirani, R. The lasso method for variable selection in the Cox model. Stat. Med. 1997, 16, 385–395. [Google Scholar] [CrossRef]
  35. Tibshirani, R. Regression shrinkage and selection via the lasso: A retrospective. J. R. Stat. Soc. Ser. B 2011, 73, 273–282. [Google Scholar] [CrossRef]
  36. Pedregosa, F.; Varoquaux, G.; Gramfort, A.; Michel, V.; Thirion, B.; Grisel, O.; Blondel, M.; Prettenhofer, P.; Weiss, R.; Dubourg, V.; et al. Scikit-learn: Machine learning in Python. J. Mach. Learn. Res. 2011, 12, 2825–2830. [Google Scholar]
  37. Agrawal, T. Hyperparameter Optimization Using Scikit-Learn. In Hyperparameter Optimization in Machine Learning: Make Your Machine Learning and Deep Learning Models More Efficient [Internet]; Apress: Berkeley, CA, USA, 2021; pp. 31–51. [Google Scholar] [CrossRef]
  38. Chawla, N.V.; Bowyer, K.W.; Hall, L.O.; Kegelmeyer, W.P. SMOTE: Synthetic minority over-sampling technique. J. Artif. Intell. Res. 2002, 16, 321–357. [Google Scholar] [CrossRef]
  39. van Rossum, G.; Drake, F.L. Python/C API Manual-Python 2.6; CreateSpace: Scotts Valley, CA, USA, 2009. [Google Scholar]
  40. Fosså, S.D.; Cvancarova, M.; Chen, L.; Allan, A.L.; Oldenburg, J.; Peterson, D.R.; Travis, L.B. Adverse prognostic factors for testicular cancer–specific survival: A population-based study of 27,948 patients. J. Clin. Oncol. 2011, 29, 963–970. [Google Scholar] [CrossRef]
  41. Parker, C.; Milosevic, M.; Panzarella, T.; Banerjee, D.; Jewett, M.; Catton, C.; Tew-George, B.; Gospodarowicz, M.; Warde, P. The prognostic significance of the tumour infiltrating lymphocyte count in stage I testicular seminoma managed by surveillance. Eur. J. Cancer 2002, 38, 2014–2019. [Google Scholar] [CrossRef] [PubMed]
  42. Lerro, C.; McGlynn, K.; Cook, M. A systematic review and meta-analysis of the relationship between body size and testicular cancer. Br. J. Cancer 2010, 103, 1467–1474. [Google Scholar] [CrossRef] [PubMed] [Green Version]
  43. Dieckmann, K.P.; Hartmann, J.T.; Classen, J.; Diederichs, M.; Pichlmeier, U. Is increased body mass index associated with the incidence of testicular germ cell cancer? J. Cancer Res. Clin. Oncol. 2009, 135, 731–738. [Google Scholar] [CrossRef]
  44. Mickey, R.M.; Greenland, S. The impact of confounder selection criteria on effect estimation. Am. J. Epidemiol. 1989, 129, 125–137. [Google Scholar] [CrossRef] [PubMed]
  45. Bendel, R.B.; Afifi, A.A. Comparison of stopping rules in forward “stepwise” regression. J. Am. Stat. Assoc. 1977, 72, 46–53. [Google Scholar]
  46. Powles, T.B.; Bhardwa, J.; Shamash, J.; Mandalia, S.; Oliver, T. The changing presentation of germ cell tumours of the testis between 1983 and 2002. BJU Int. 2005, 95, 1197–1200. [Google Scholar] [CrossRef] [PubMed]
  47. Albers, P.; Siener, R.; Kliesch, S.; Weissbach, L.; Krege, S.; Sparwasser, C.; Schulze, H.; Heidenreich, A.; de Riese, W.; Loy, V.; et al. Risk factors for relapse in clinical stage I nonseminomatous testicular germ cell tumors: Results of the German Testicular Cancer Study Group Trial. J. Clin. Oncol. 2003, 21, 1505–1512. [Google Scholar] [CrossRef] [PubMed]
  48. Oldenburg, J.; Fosså, S.; Nuver, J.; Heidenreich, A.; Schmoll, H.J.; Bokemeyer, C.; Horwich, A.; Beyer, J.; Kataja, V. Testicular seminoma and non-seminoma: ESMO Clinical Practice Guidelines for diagnosis, treatment and follow-up. Ann. Oncol. 2013, 24, vi125–vi132. [Google Scholar] [CrossRef]
  49. Kier, M.G.; Hansen, M.K.; Lauritsen, J.; Mortensen, M.S.; Bandak, M.; Agerbaek, M.; Holm, N.V.; Dalton, S.O.; Andersen, K.K.; Johansen, C.; et al. Second malignant neoplasms and cause of death in patients with germ cell cancer: A Danish nationwide cohort study. JAMA Oncol. 2016, 2, 1624–1627. [Google Scholar] [CrossRef]
  50. von Eyben, F.E. Laboratory markers and germ cell tumors. Crit. Rev. Clin. Lab. Sci. 2003, 40, 377–427. [Google Scholar] [CrossRef] [PubMed]
  51. Lobo, J.; Leão, R.; Jerónimo, C.; Henrique, R. Liquid biopsies in the clinical management of germ cell tumor patients: State-of-the-art and future directions. Int. J. Mol. Sci. 2021, 22, 2654. [Google Scholar] [CrossRef]
  52. Trigo, J.M.; Tabernero, J.M.; Paz-Ares, L.; García-Llano, J.L.; Mora, J.; Lianes, P.; Esteban, E.; Salazar, R.; López-López, J.J.; Cortés-Funes, H.; et al. Tumor markers at the time of recurrence in patients with germ cell tumors. Cancer 2000, 88, 162–168. [Google Scholar] [CrossRef]
  53. Steyerberg, E.; Gerl, A.; Fossa, S.; Sleijfer, D.; de Wit, R.; Kirkels, W.; Schmeller, N.; Clemm, C.; Habbema, J.D.; Keizer, H.J. Validity of predictions of residual retroperitoneal mass histology in nonseminomatous testicular cancer. J. Clin. Oncol. 1998, 16, 269–274. [Google Scholar] [CrossRef]
  54. Vergouwe, Y.; Steyerberg, E.W.; Foster, R.S.; Habbema, J.D.F.; Donohue, J.P. Validation of a prediction model and its predictors for the histology of residual masses in nonseminomatous testicular cancer. J. Urol. 2001, 165, 84–88. [Google Scholar] [CrossRef]
  55. Andersen, M.B.; Harders, S.W.; Ganeshan, B.; Thygesen, J.; Torp Madsen, H.H.; Rasmussen, F. CT texture analysis can help differentiate between malignant and benign lymph nodes in the mediastinum in patients suspected for lung cancer. Acta Radiol. 2016, 57, 669–676. [Google Scholar] [CrossRef] [Green Version]
  56. Tan, X.; Ma, Z.; Yan, L.; Ye, W.; Liu, Z.; Liang, C. Radiomics nomogram outperforms size criteria in discriminating lymph node metastasis in resectable esophageal squamous cell carcinoma. Eur. Radiol. 2019, 29, 392–400. [Google Scholar] [CrossRef]
  57. Zhang, X.; Yang, Z.; Cui, W.; Zheng, C.; Li, H.; Li, Y.; Lu, L.; Mao, J.; Zeng, W.; Yang, X.; et al. Preoperative prediction of axillary sentinel lymph node burden with multiparametric MRI-based radiomics nomogram in early-stage breast cancer. Eur. Radiol. 2021, 31, 5924–5939. [Google Scholar] [CrossRef] [PubMed]
  58. Xiao, M.; Ma, F.; Li, Y.; Li, Y.; Li, M.; Zhang, G.; Qiang, J. Multiparametric MRI-Based Radiomics Nomogram for Predicting Lymph Node Metastasis in Early-Stage Cervical Cancer. J. Magn. Reson. Imaging 2020, 52, 885–896. [Google Scholar] [CrossRef] [PubMed]
  59. Baessler, B.; Nestler, T.; Pinto dos Santos, D.; Paffenholz, P.; Zeuch, V.; Pfister, D.; Maintz, D.; Heidenreich, A. Radiomics allows for detection of benign and malignant histopathology in patients with metastatic testicular germ cell tumors prior to post-chemotherapy retroperitoneal lymph node dissection. Eur. Radiol. 2020, 30, 2334–2345. [Google Scholar] [CrossRef] [PubMed]
  60. Harrell, F.E., Jr.; Lee, K.L.; Mark, D.B. Multivariable prognostic models: Issues in developing models, evaluating assumptions and adequacy, and measuring and reducing errors. Stat. Med. 1996, 15, 361–387. [Google Scholar] [CrossRef]
  61. Lewin, J.; Dufort, P.; Halankar, J.; O’Malley, M.; Jewett, M.A.; Hamilton, R.J.; Gupta, A.; Lorenzo, A.; Traubici, J.; Nayan, M.; et al. Applying radiomics to predict pathology of postchemotherapy retroperitoneal nodal masses in germ cell tumors. JCO Clin. Cancer Inform. 2018, 2, 1–12. [Google Scholar] [CrossRef]
  62. Leão, R.; Nayan, M.; Punjani, N.; Jewett, M.A.S.; Fadaak, K.; Garisto, J.; Lewin, J.; Atenafu, E.; Sweet, J.; Anson-Cartwright, L.; et al. A New Model to Predict Benign Histology in Residual Retroperitoneal Masses After Chemotherapy in Nonseminoma. Eur. Urol. Focus 2018, 4, 995–1001. [Google Scholar] [CrossRef]
  63. Vergouwe, Y.; Steyerberg, E.W.; Foster, R.S.; Sleijfer, D.T.; Fosså, S.D.; Gerl, A.; de Wit, R.; Roberts, J.T.; Habbema, J.D.F. Predicting Retroperitoneal Histology in Postchemotherapy Testicular Germ Cell Cancer: A Model Update and Multicentre Validation with More Than 1000 Patients. Eur. Urol. 2007, 51, 424–432. [Google Scholar] [CrossRef]
  64. Peter, A.; Lothar, W.; Susanne, K.; Sabine, K.; Michael, H.; Axel, H.; Walz, P.; Kuczyk, M.; Fimmers, R.; for the German Testicular Cancer Study Group. Prediction of Necrosis After Chemotherapy of Advanced Germ Cell Tumors: Results of a Prospective Multicenter Trial of the German Testicular Cancer Study Group. J. Urol. 2004, 171, 1835–1838. [Google Scholar]
  65. Zengerling, F.; Kunath, F.; Jensen, K.; Ruf, C.; Schmidt, S.; Spek, A. Prognostic factors for tumor recurrence in patients with clinical stage I seminoma undergoing surveillance—A systematic review. Urol. Oncol. Semin. Orig. Investig. 2018, 36, 448–458. [Google Scholar] [CrossRef] [PubMed]
  66. Zengerling, F.; Beyersdorff, D.; Busch, J.; Heinzelbecker, J.; Pfister, D.; Ruf, C.; Winter, C.; Albers, P.; Kliesch, S.; Schmidt, S. Prognostic factors in patients with clinical stage I nonseminoma—Beyond lymphovascular invasion: A systematic review. World J. Urol. 2022, 40, 2879–2887. [Google Scholar] [CrossRef] [PubMed]
  67. Dieckmann, K.P.; Radtke, A.; Spiekermann, M.; Balks, T.; Matthies, C.; Becker, P.; Ruf, C.; Oing, C.; Oechsle, K.; Bokemeyer, C.; et al. Serum Levels of MicroRNA miR-371a-3p: A Sensitive and Specific New Biomarker for Germ Cell Tumours. Eur. Urol. 2017, 71, 213–220. [Google Scholar] [CrossRef] [PubMed] [Green Version]
  68. Bezan, A.; Gerger, A.; Pichler, M. MicroRNAs in testicular cancer: Implications for pathogenesis, diagnosis, prognosis and therapy. Anticancer. Res. 2014, 34, 2709–2713. [Google Scholar] [PubMed]
Figure 1. Recruitment pathway of the study.
Onco 03 00006 g001
Figure 2. The schematic diagram for ROI segmentation and feature extraction for model development. Details regarding the extraction settings are listed in Appendix A, Table A1.
Onco 03 00006 g002
Figure 3. Feature weights generated by the LASSO logistic regression model’s coefficients indicate positive or negative correlation with lymph node metastasis.
Onco 03 00006 g003
Figure 4. The ROC curves of the radiomics-only, the clinical-only, and the combined clinical-radiomics models show that the combined model outperforms the radiomics and the clinical model in predicting LN metastasis (training cohort 94% vs. 84% and 60%, respectively).
Onco 03 00006 g004
Figure 5. The decision curve analysis for the combined prediction model.
Onco 03 00006 g005
Table 1. Baseline demographic and clinical data.
Average age (range)35.2 ± 9.4 Years (18–63)
Histological type
   Seminoma60 Patients (66%)
   Non-seminoma31 Patients (34%)
Tumour classification (T)
   T1a64 (70%)
   T1b27 (30%)
Tumour marker
   AFP positive21 Patients (19%)
   Β-HCG positive40 Patients (44%)
   AFP und Β-HCG positive10 Patients (11%)
BMI (range)25.9 ± 4.6 (19.3–43.9)
Patients’ status in 6-year follow up
   Complete remission (CR)81 (89%)
   Relapse of disease (RD) with metastatic lymph nodes10 (11%)
Table 2. Performance of the radiomics, clinical, and combined models.
ModelAUC (95% CI)AccuracyPrecisionRecallF1 Score
Radiomics-only0.87± 0.040.80 ± 0.060.81 ± 0.060.80 ± 0.080.80 ± 0.06
Clinical-only0.75 ± 0.080.68 ± 0.100.66 ± 0.110.71 ± 0.160.68 ± 0.12
Combined clinical-radiomics0.89 ± 0.030.81 ± 0.040.80 ± 0.070.83 ± 0.060.81 ± 0.04
Disclaimer/Publisher’s Note: The statements, opinions and data contained in all publications are solely those of the individual author(s) and contributor(s) and not of MDPI and/or the editor(s). MDPI and/or the editor(s) disclaim responsibility for any injury to people or property resulting from any ideas, methods, instructions or products referred to in the content.

