
Regulation of Epithelial–Mesenchymal Transition Pathway and Artificial Intelligence-Based Modeling for Pathway Activity Prediction

 ,
,  , and
, and
Abstract
:Simple Summary
Abstract
1. Introduction
2. Materials and Methods
2.1. Data Analysis of Diffuse- and Intestinal-Type GC
2.2. Network Analysis
2.3. AI Prediction Modeling
2.4. Statistical Analysis
3. Results
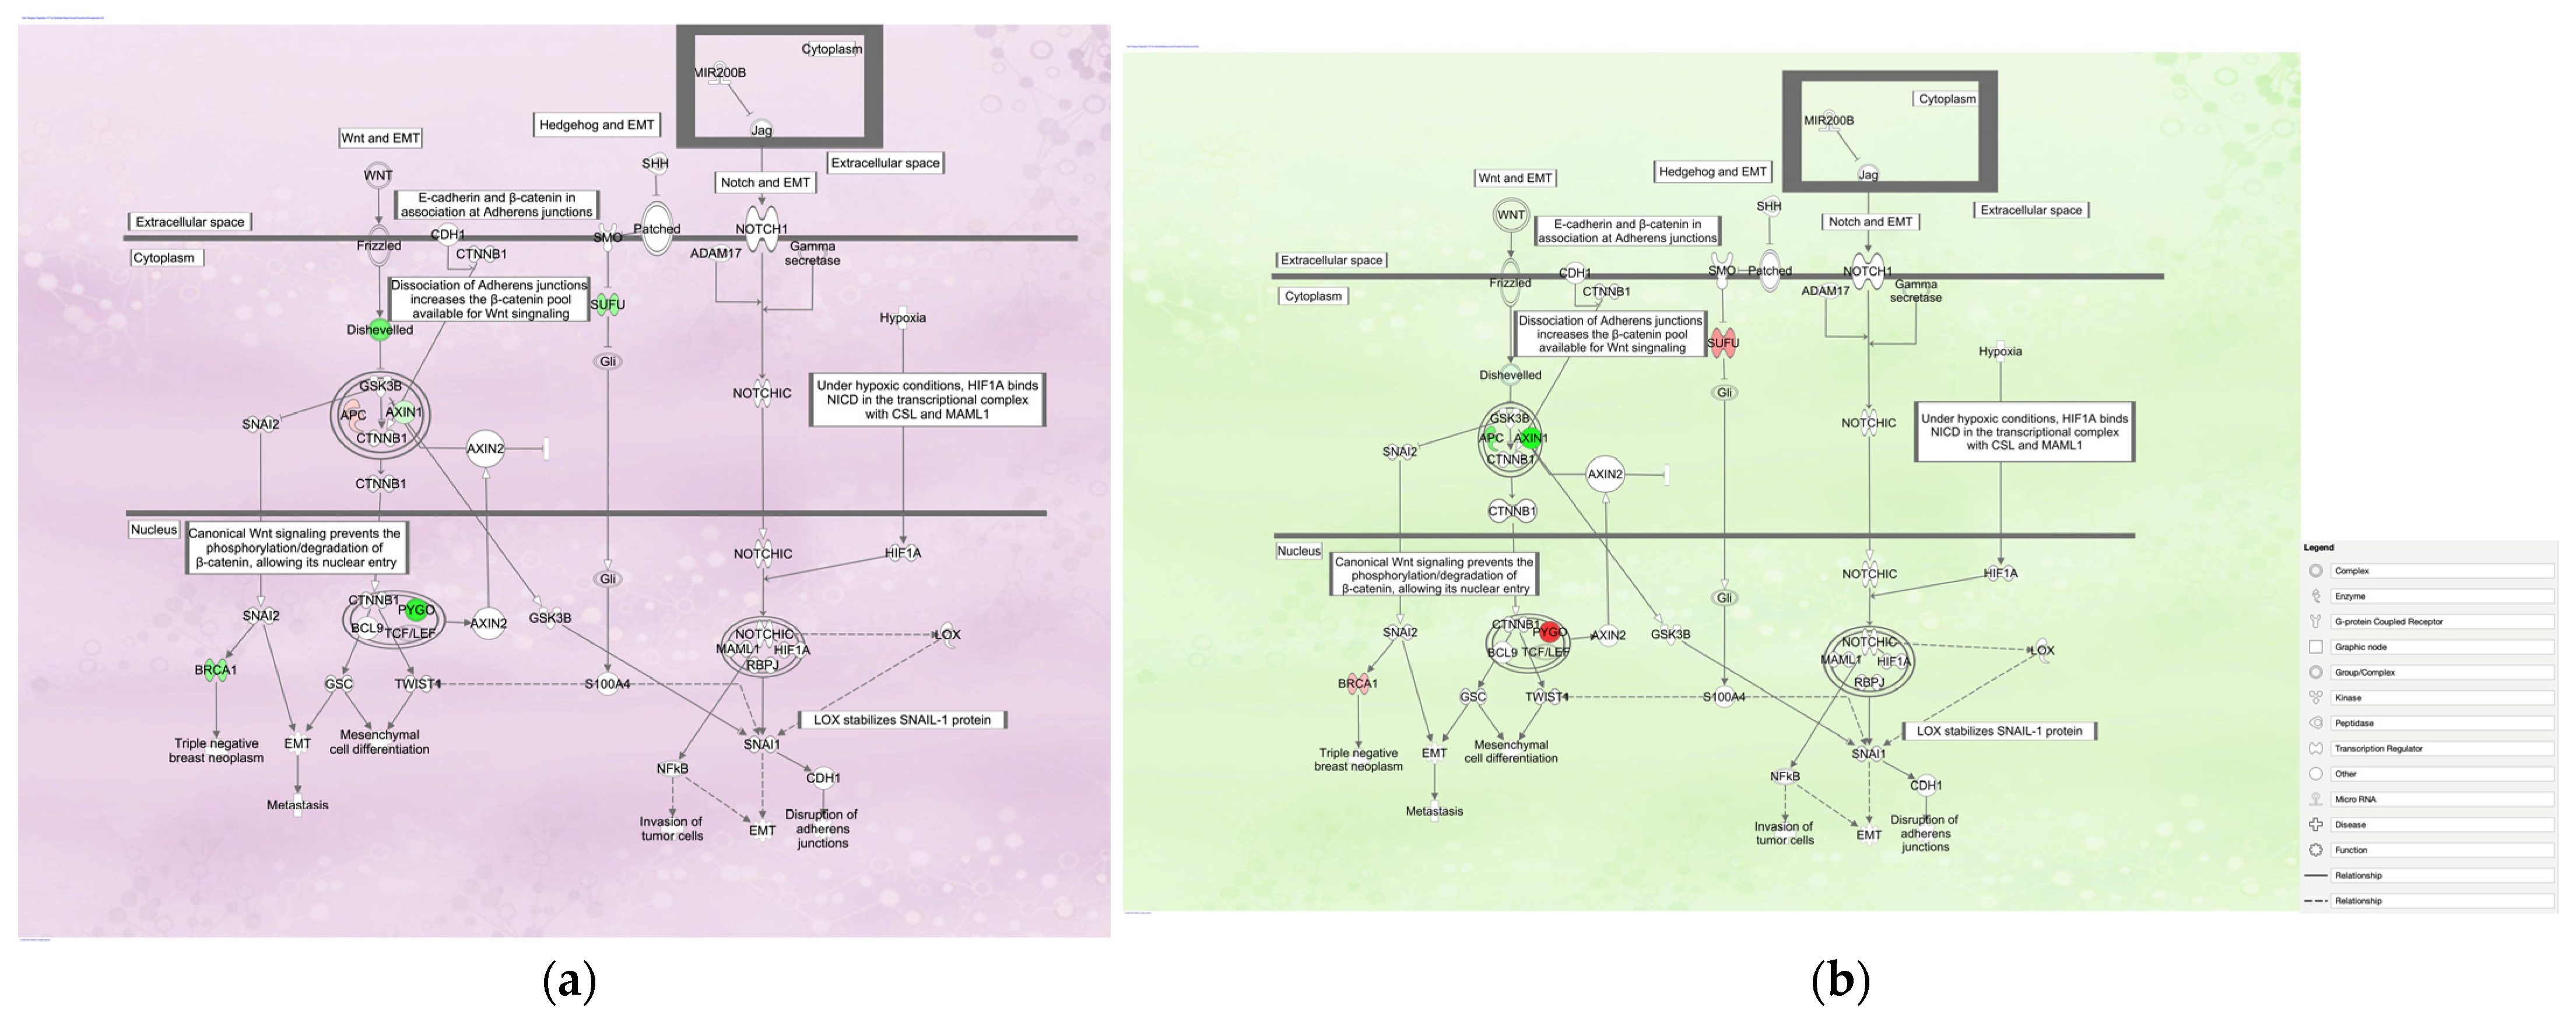
3.1. Regulation of the EMT in Development Pathway in Diffuse- and Intestinal-Type GC
3.1.1. Gene Expression Mapping in Regulation of the EMT in the Development Pathway in Diffuse- and Intestinal-Type GC
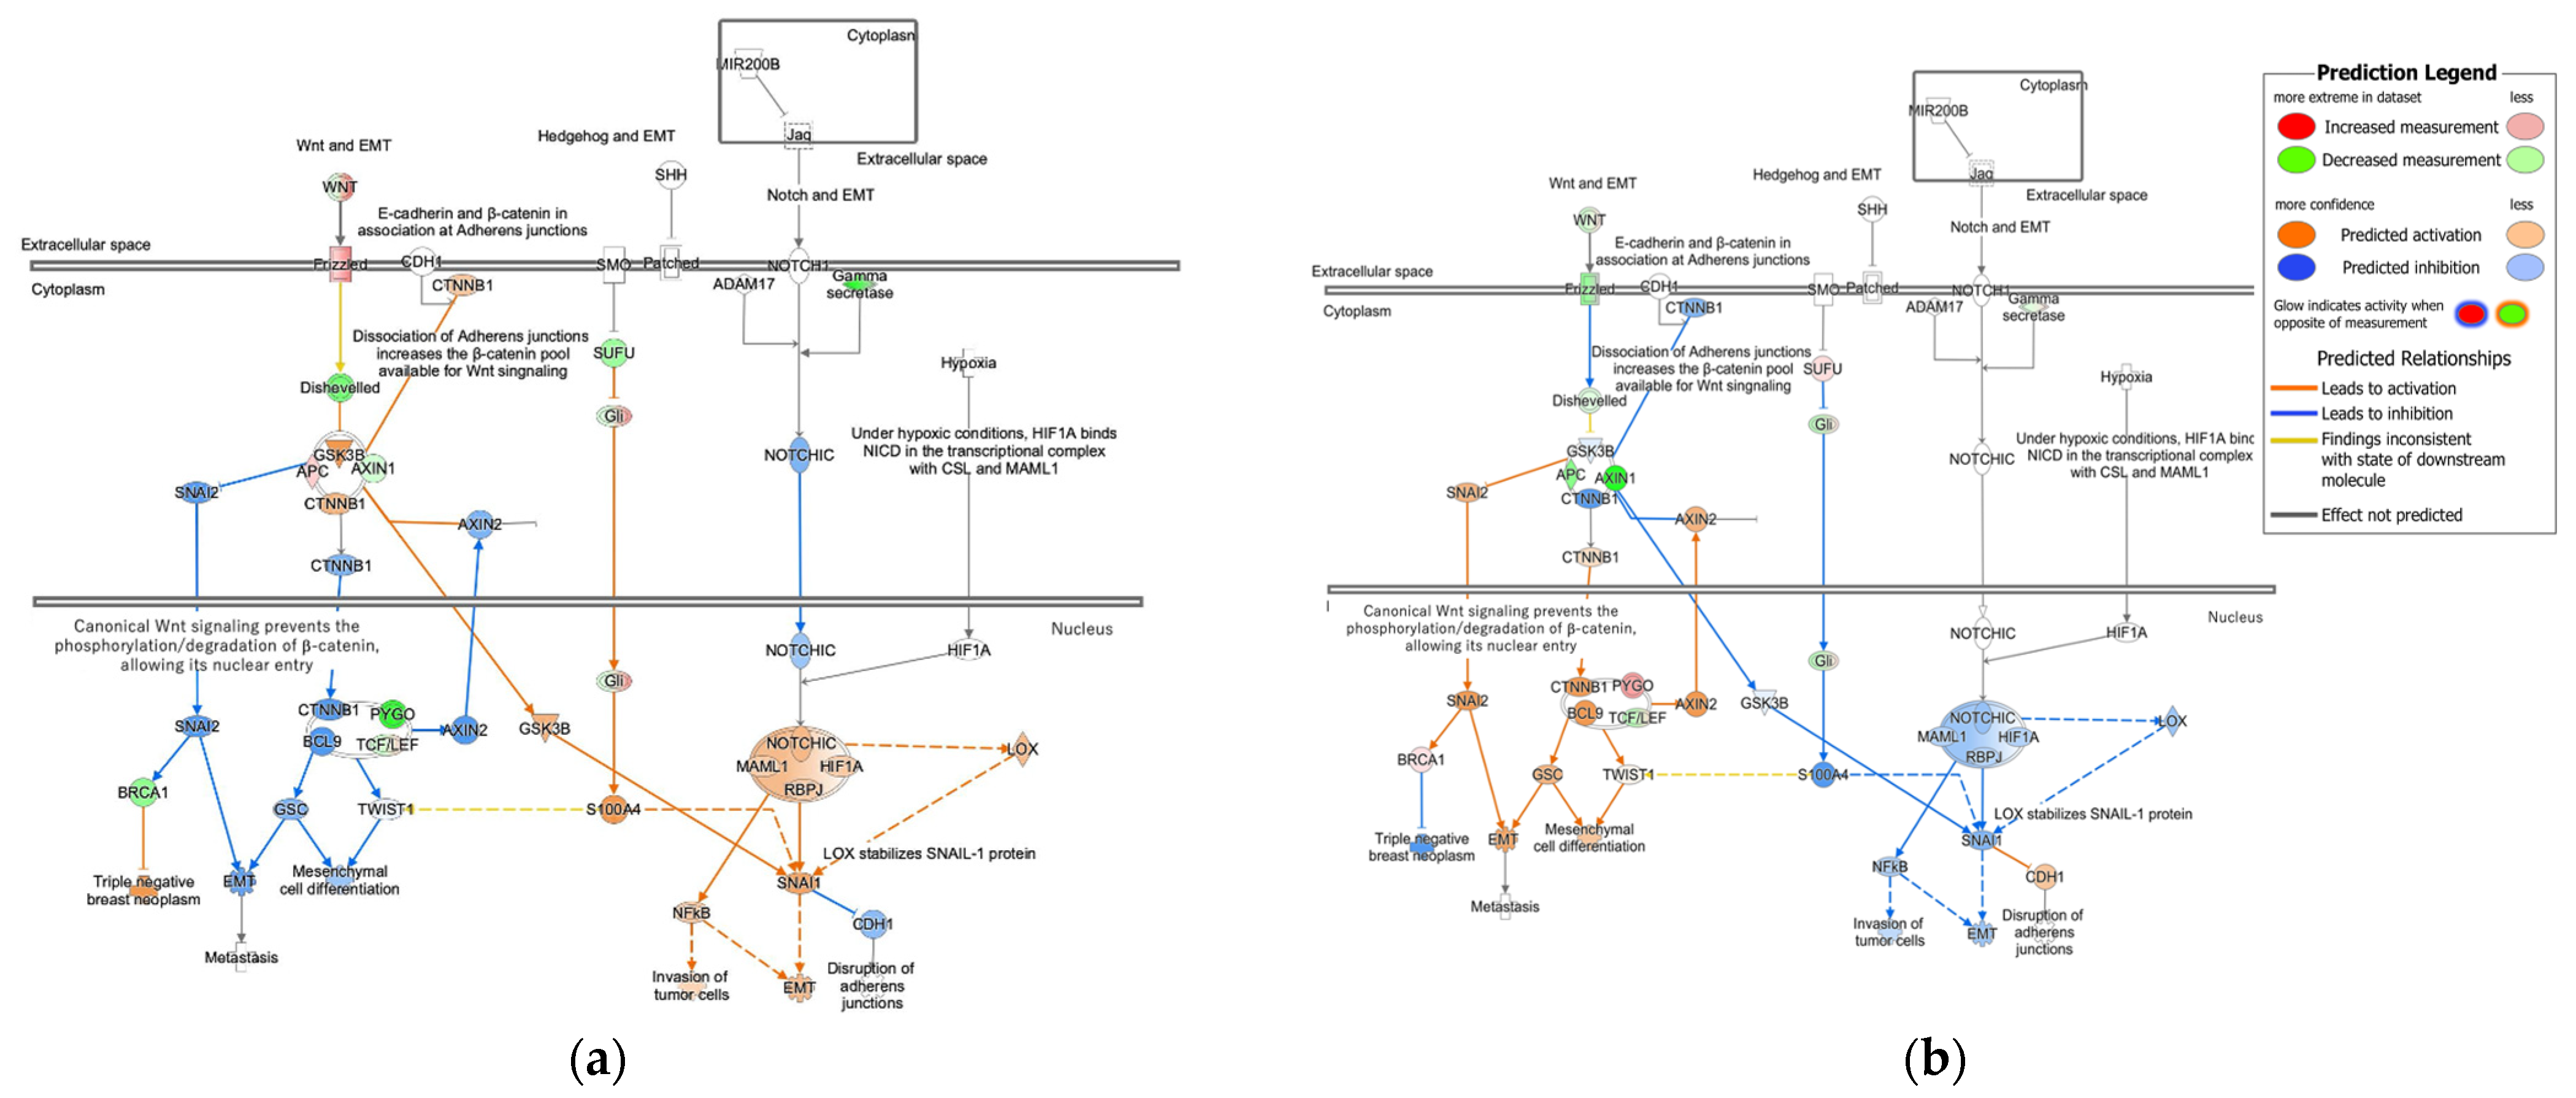
3.1.2. Molecular Activity Prediction in Regulation of the EMT in Development Pathway in Diffuse- and Intestinal-Type GC
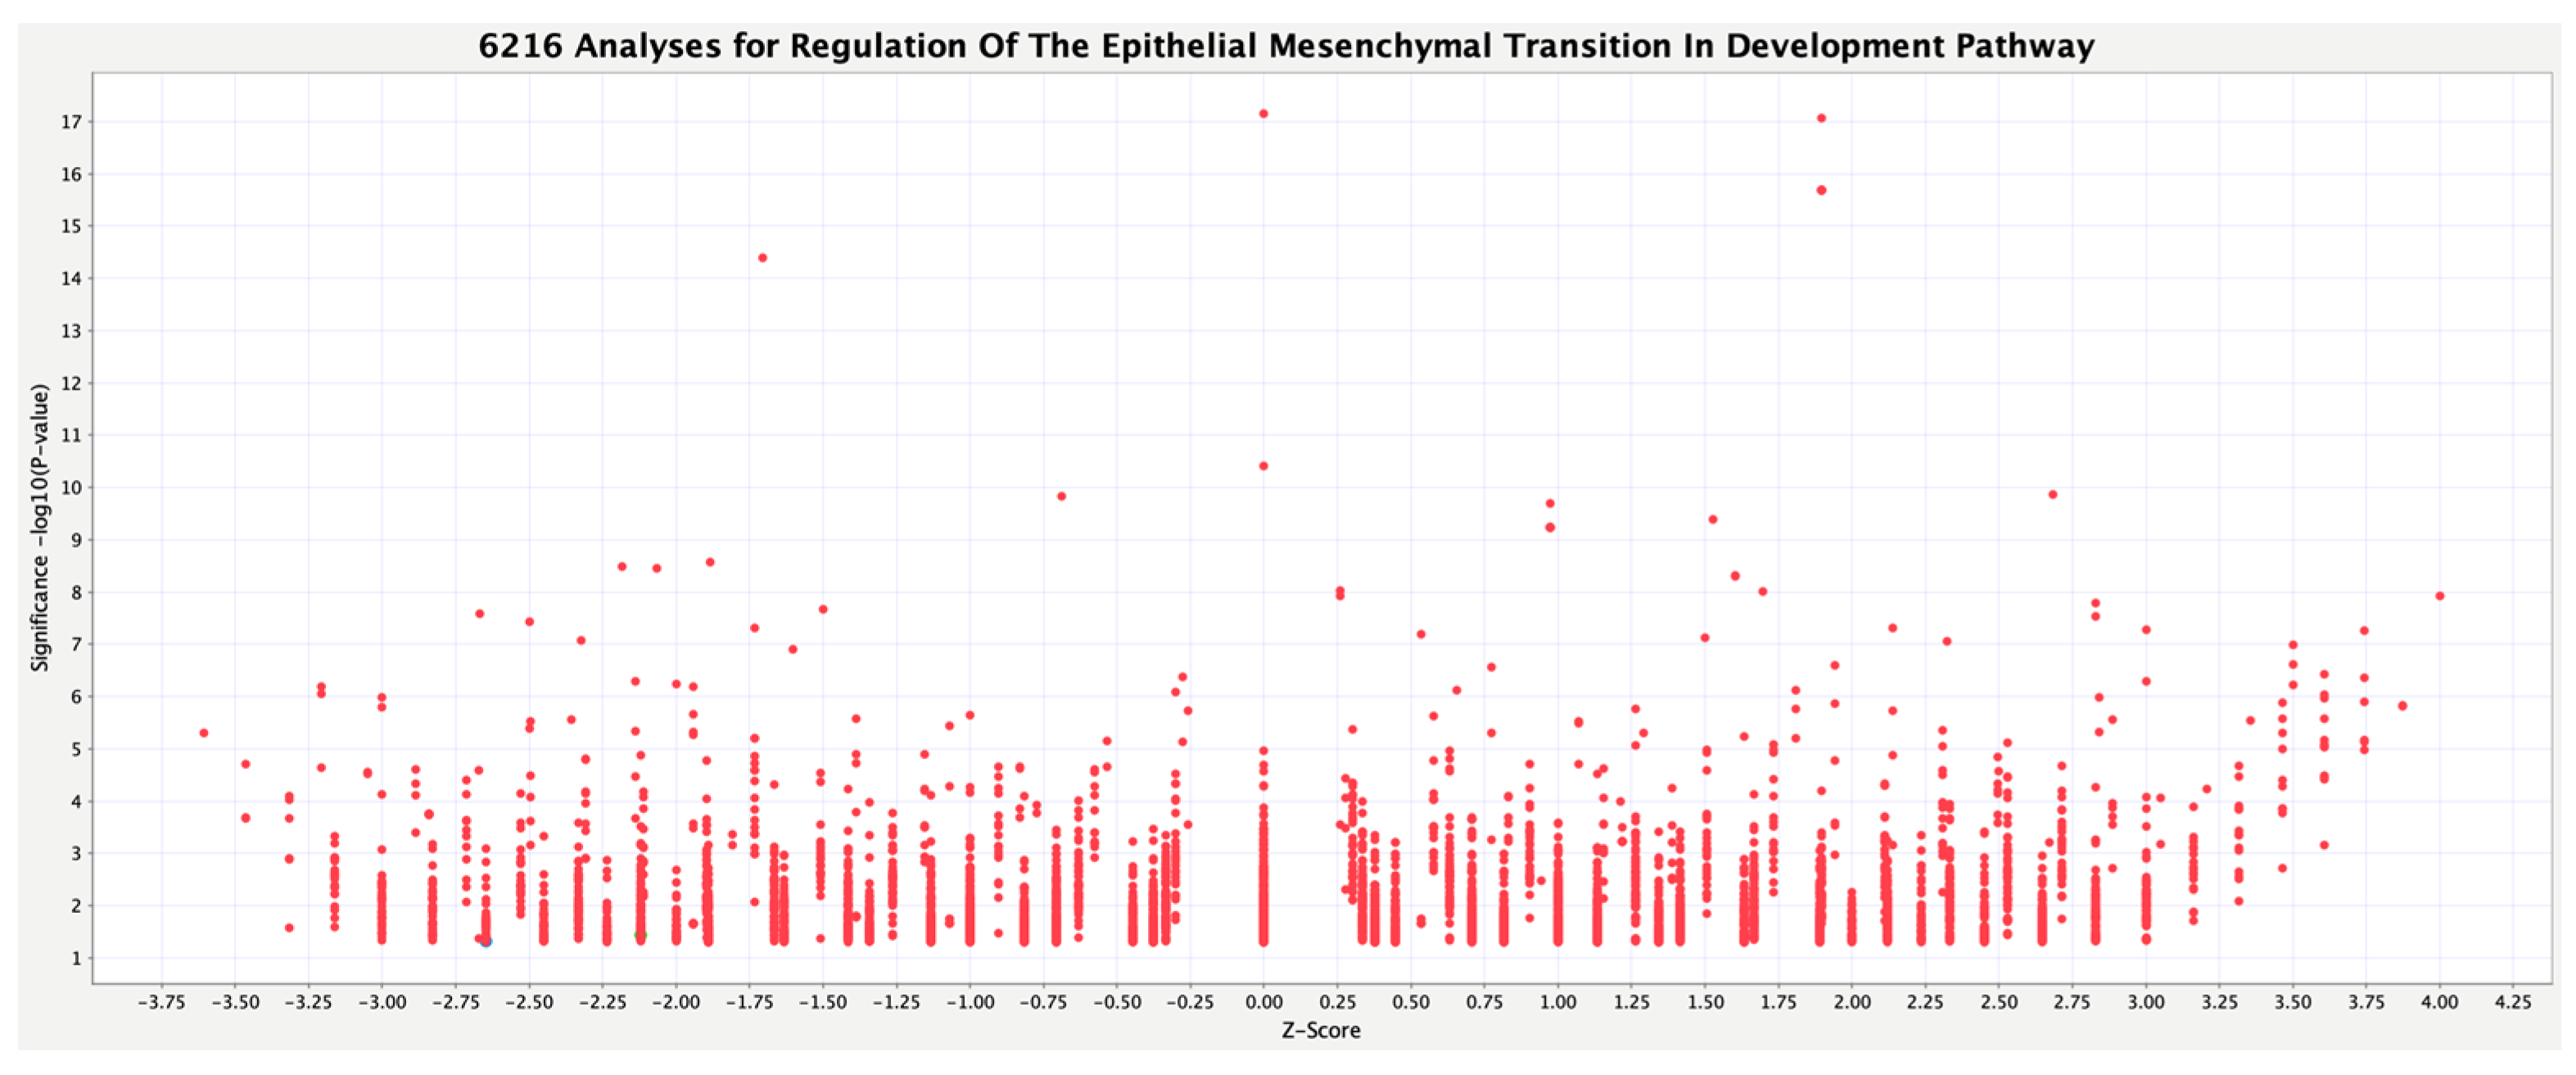
3.2. Activity Plot of Regulation of the EMT in Development Pathway
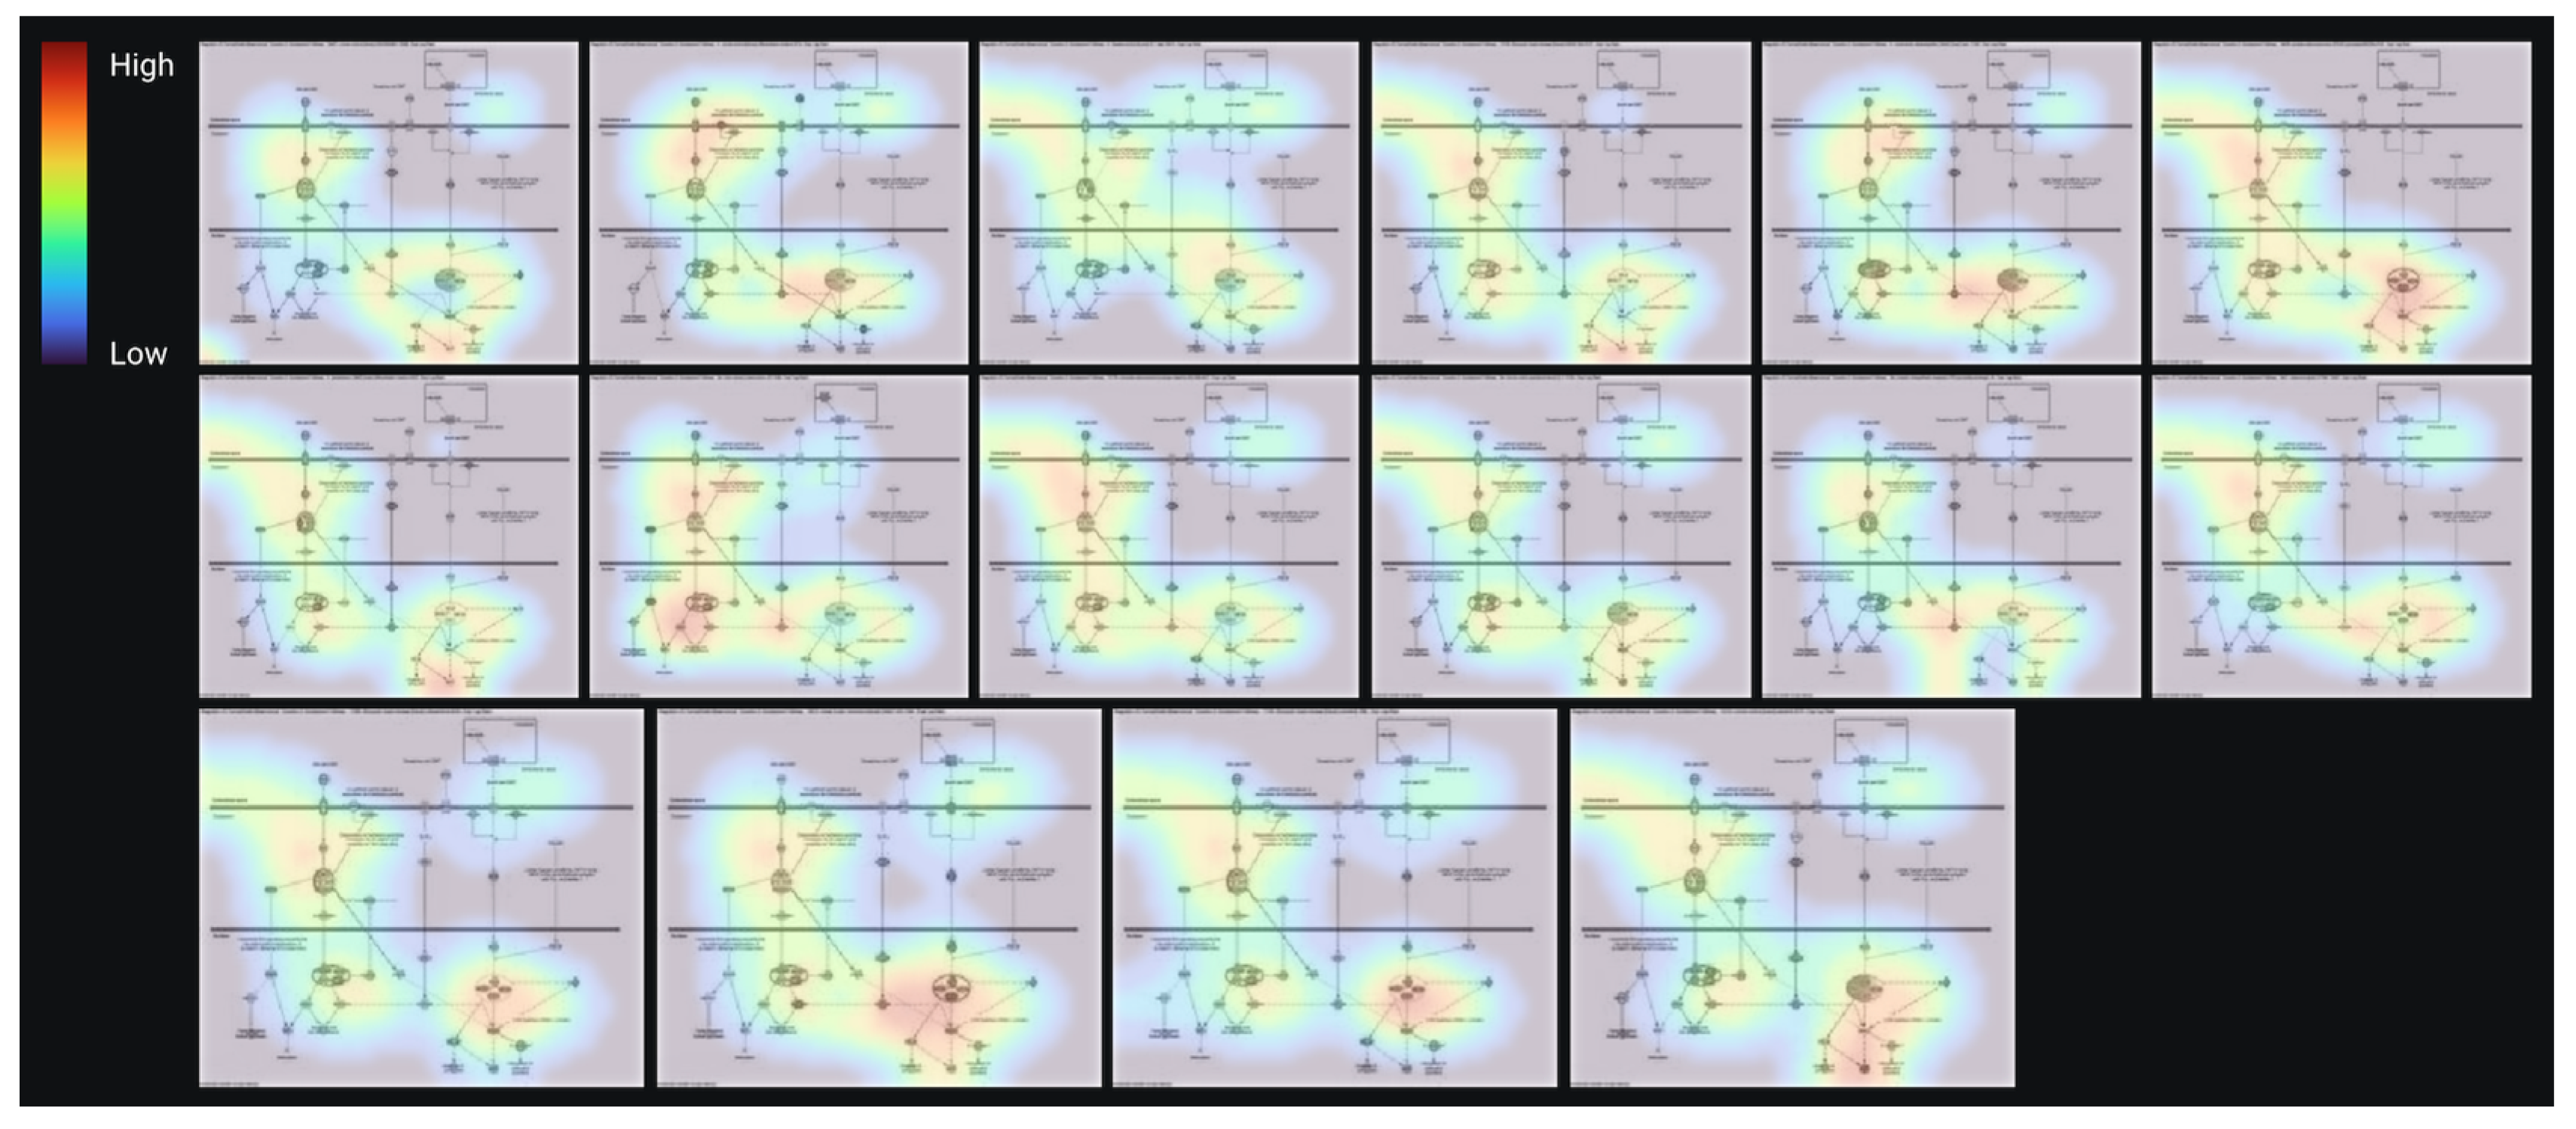
3.3. AI Modeling and Validation of the Prediction Model
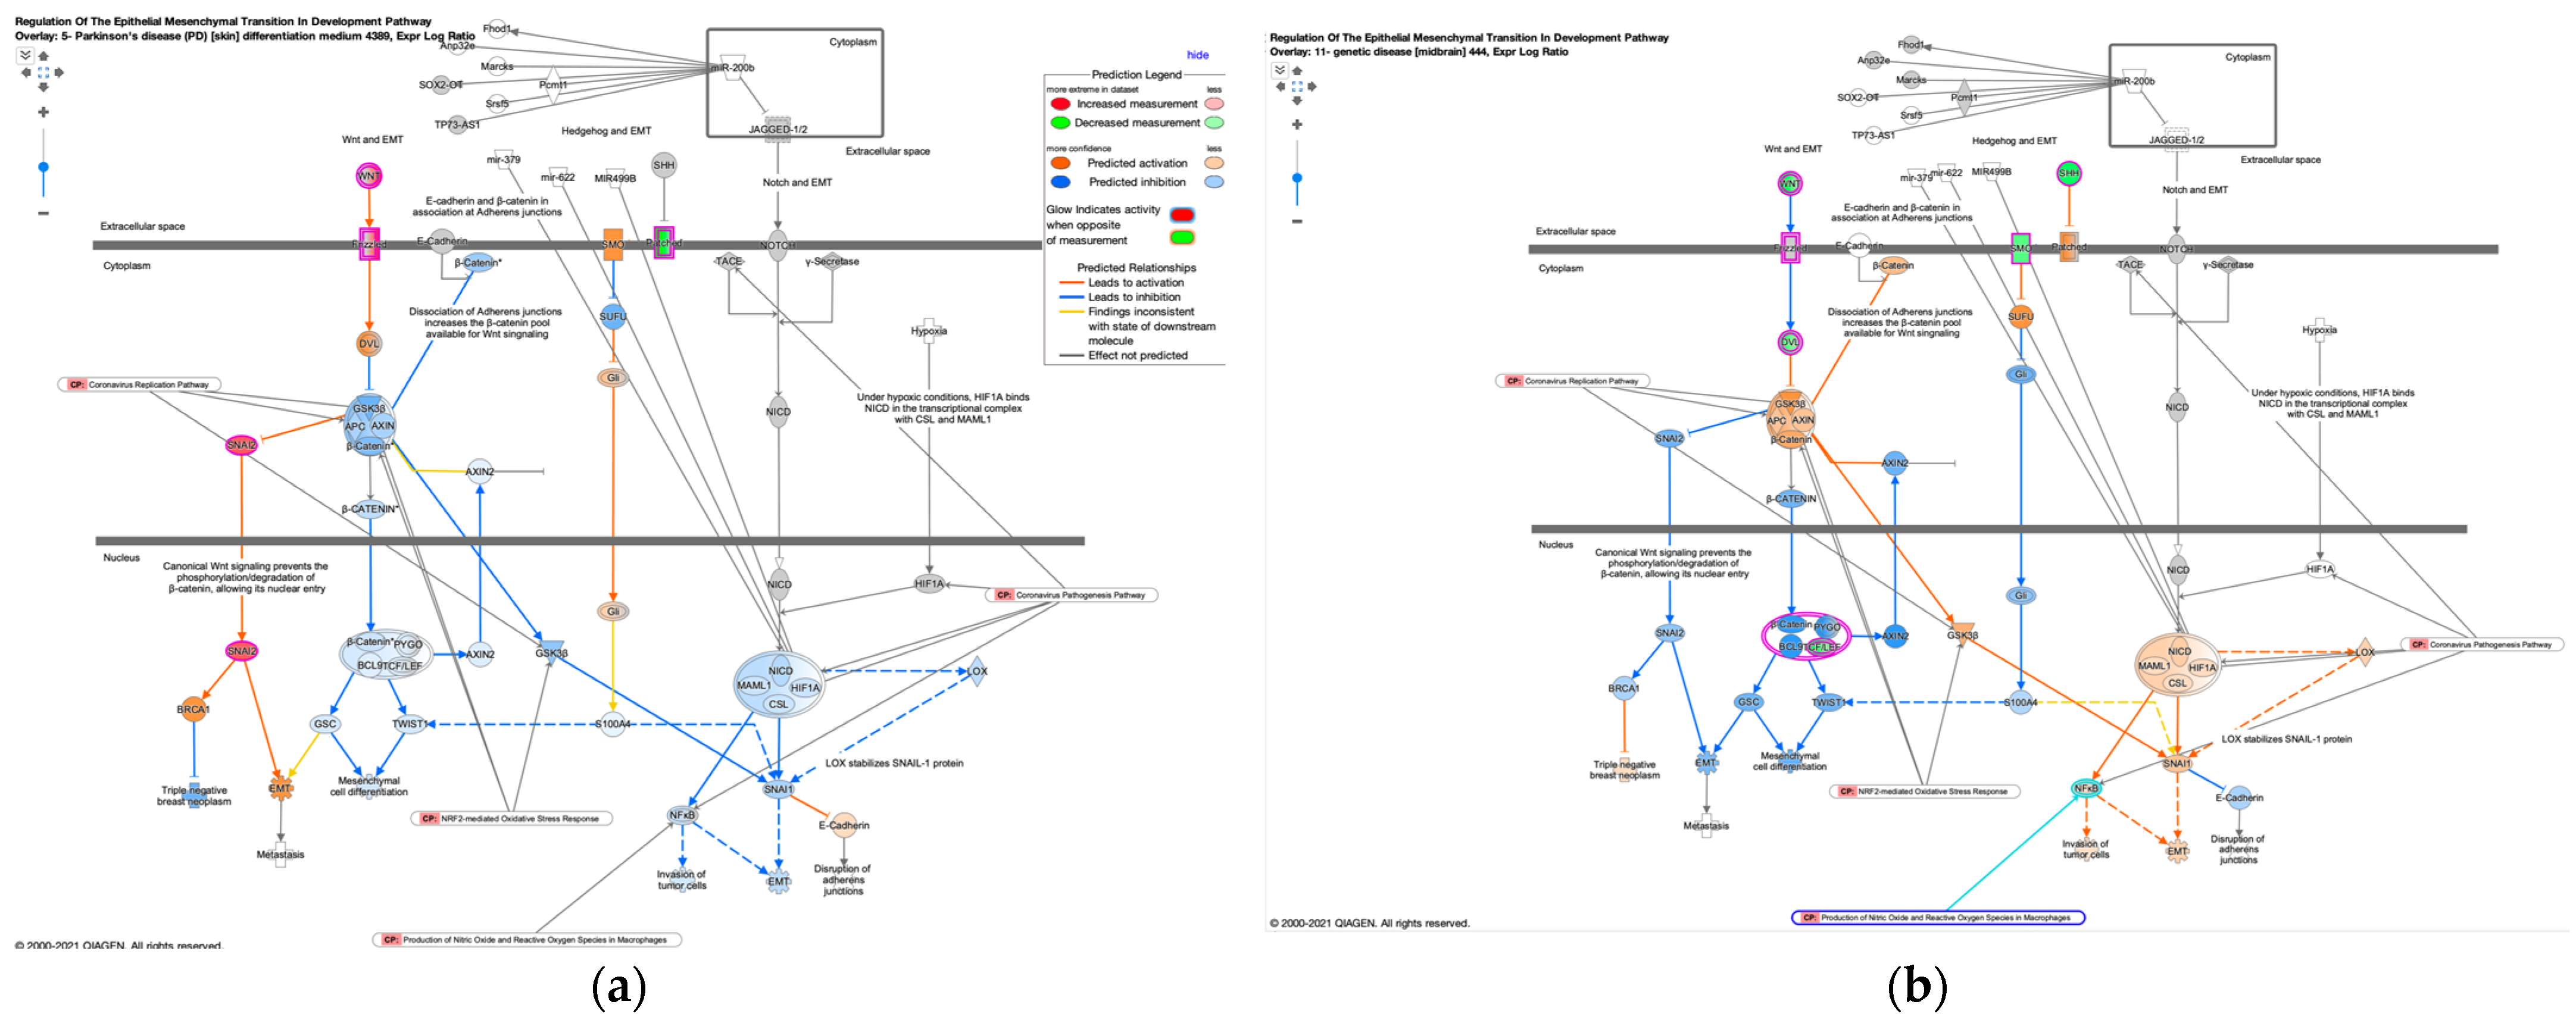
3.4. Regulation of EMT in the Development Pathway in Other Diseases Than Cancer
4. Discussion
5. Conclusions
Author Contributions
Funding
Institutional Review Board Statement
Informed Consent Statement
Data Availability Statement
Acknowledgments
Conflicts of Interest
References
- Tanabe, S.; Quader, S.; Ono, R.; Cabral, H.; Aoyagi, K.; Hirose, A.; Yokozaki, H.; Sasaki, H. Molecular Network Profiling in Intestinal- and Diffuse-Type Gastric Cancer. Cancers 2020, 12, 3833. [Google Scholar] [CrossRef]
- Landeros, N.; Santoro, P.M.; Carrasco-Avino, G.; Corvalan, A.H. Competing Endogenous RNA Networks in the Epithelial to Mesenchymal Transition in Diffuse-Type of Gastric Cancer. Cancers 2020, 12, 2741. [Google Scholar] [CrossRef]
- Perrot-Applanat, M.; Vacher, S.; Pimpie, C.; Chemlali, W.; Derieux, S.; Pocard, M.; Bieche, I. Differential gene expression in growth factors, epithelial mesenchymal transition and chemotaxis in the diffuse type compared with the intestinal type of gastric cancer. Oncol. Lett. 2019, 18, 674–686. [Google Scholar] [CrossRef] [Green Version]
- Tanabe, S.; Quader, S.; Cabral, H.; Ono, R. Interplay of EMT and CSC in Cancer and the Potential Therapeutic Strategies. Front. Pharmacol. 2020, 11, 904. [Google Scholar] [CrossRef]
- Lambert, A.W.; Pattabiraman, D.R.; Weinberg, R.A. Emerging Biological Principles of Metastasis. Cell 2017, 168, 670–691. [Google Scholar] [CrossRef] [Green Version]
- Du, B.; Shim, J.S. Targeting Epithelial-Mesenchymal Transition (EMT) to Overcome Drug Resistance in Cancer. Molecules 2016, 21, 965. [Google Scholar] [CrossRef] [Green Version]
- Zhang, Y.; Weinberg, R.A. Epithelial-to-mesenchymal transition in cancer: Complexity and opportunities. Front. Med. 2018, 12, 361–373. [Google Scholar] [CrossRef] [Green Version]
- Sommers, C.L.; Heckford, S.E.; Skerker, J.M.; Worland, P.; Torri, J.A.; Thompson, E.W.; Byers, S.W.; Gelmann, E.P. Loss of epithelial markers and acquisition of vimentin expression in adriamycin- and vinblastine-resistant human breast cancer cell lines. Cancer Res. 1992, 52, 5190–5197. [Google Scholar]
- Kaimori, A.; Potter, J.; Kaimori, J.Y.; Wang, C.; Mezey, E.; Koteish, A. Transforming growth factor-beta1 induces an epithelial-to-mesenchymal transition state in mouse hepatocytes in vitro. J. Biol. Chem. 2007, 282, 22089–22101. [Google Scholar] [CrossRef] [Green Version]
- Yook, J.I.; Li, X.-Y.; Ota, I.; Fearon, E.R.; Weiss, S.J. Wnt-dependent Regulation of the E-cadherin Repressor Snail*. J. Biol. Chem. 2005, 280, 11740–11748. [Google Scholar] [CrossRef] [Green Version]
- Babaei, G.; Aziz, S.G.; Jaghi, N.Z.Z. EMT, cancer stem cells and autophagy; The three main axes of metastasis. Biomed Pharm. 2021, 133, 110909. [Google Scholar] [CrossRef] [PubMed]
- Hill, C.; Wang, Y. The importance of epithelial-mesenchymal transition and autophagy in cancer drug resistance. Cancer Drug Resist. 2020, 3, 38–47. [Google Scholar] [CrossRef] [PubMed] [Green Version]
- Sanchez-Vega, F.; Mina, M.; Armenia, J.; Chatila, W.K.; Luna, A.; La, K.C.; Dimitriadoy, S.; Liu, D.L.; Kantheti, H.S.; Saghafinia, S.; et al. Oncogenic Signaling Pathways in The Cancer Genome Atlas. Cell 2018, 173, 321–337.e310. [Google Scholar] [CrossRef] [PubMed] [Green Version]
- Bass, A.J.; Thorsson, V.; Shmulevich, I.; Reynolds, S.M.; Miller, M.; Bernard, B.; Hinoue, T.; Laird, P.W.; Curtis, C.; Shen, H.; et al. Comprehensive molecular characterization of gastric adenocarcinoma. Nature 2014, 513, 202–209. [Google Scholar] [CrossRef] [Green Version]
- Cerami, E.; Gao, J.; Dogrusoz, U.; Gross, B.E.; Sumer, S.O.; Aksoy, B.A.; Jacobsen, A.; Byrne, C.J.; Heuer, M.L.; Larsson, E.; et al. The cBio Cancer Genomics Portal: An Open Platform for Exploring Multidimensional Cancer Genomics Data. Cancer Discov. 2012, 2, 401–404. [Google Scholar] [CrossRef] [Green Version]
- Gao, J.; Aksoy, B.A.; Dogrusoz, U.; Dresdner, G.; Gross, B.; Sumer, S.O.; Sun, Y.; Jacobsen, A.; Sinha, R.; Larsson, E.; et al. Integrative Analysis of Complex Cancer Genomics and Clinical Profiles Using the cBioPortal. Sci. Signal. 2013, 6, pl1. [Google Scholar] [CrossRef] [Green Version]
- Grossman, R.L.; Heath, A.P.; Ferretti, V.; Varmus, H.E.; Lowy, D.R.; Kibbe, W.A.; Staudt, L.M. Toward a Shared Vision for Cancer Genomic Data. N. Engl. J. Med. 2016, 375, 1109–1112. [Google Scholar] [CrossRef]
- Tanabe, S.; Quader, S.; Ono, R.; Cabral, H.; Aoyagi, K.; Hirose, A.; Yokozaki, H.; Sasaki, H. Cell Cycle Regulation and DNA Damage Response Networks in Diffuse- and Intestinal-Type Gastric Cancer. Cancers 2021, 13, 5786. [Google Scholar] [CrossRef]
- Krämer, A.; Green, J.; Pollard, J., Jr.; Tugendreich, S. Causal analysis approaches in Ingenuity Pathway Analysis. Bioinformatics 2013, 30, 523–530. [Google Scholar] [CrossRef]
- Pospisil, P.; Iyer, L.K.; Adelstein, S.J.; Kassis, A.I. A combined approach to data mining of textual and structured data to identify cancer-related targets. BMC Bioinform. 2006, 7, 354. [Google Scholar] [CrossRef] [Green Version]
- Breiman, L. Random Forests. Mach. Learn. 2001, 45, 5–32. [Google Scholar] [CrossRef]
- Friedman, J.H. Greedy function approximation: A gradient boosting machine. Ann. Stat. 2001, 29, 1189–1232. [Google Scholar] [CrossRef]
- Liu, D.; Wang, X.; Li, L.; Jiang, Q.; Li, X.; Liu, M.; Wang, W.; Shi, E.; Zhang, C.; Wang, Y.; et al. Machine Learning-Based Model for the Prognosis of Postoperative Gastric Cancer. Cancer Manag. Res. 2022, 14, 135–155. [Google Scholar] [CrossRef]
- Scavo, M.P.; Fucci, L.; Caldarola, L.; Mangia, A.; Azzariti, A.; Simone, G.; Gasparini, G.; Krol, S. Frizzled-10 and cancer progression: Is it a new prognostic marker? Oncotarget 2018, 9, 824–830. [Google Scholar] [CrossRef] [Green Version]
- Cheng, Y.; Li, L.; Pan, S.; Jiang, H.; Jin, H. Targeting Frizzled-7 Decreases Stemness and Chemotherapeutic Resistance in Gastric Cancer Cells by Suppressing Myc Expression. Med. Sci. Monit. 2019, 25, 8637–8644. [Google Scholar] [CrossRef]
- Nusse, R.; Clevers, H. Wnt/β-Catenin Signaling, Disease, and Emerging Therapeutic Modalities. Cell 2017, 169, 985–999. [Google Scholar] [CrossRef] [Green Version]
- Peng, Y.; Zhang, X.; Lin, H.; Deng, S.; Qin, Y.; Yuan, Y.; Feng, X.; Wang, J.; Chen, W.; Hu, F.; et al. SUFU mediates EMT and Wnt/β-catenin signaling pathway activation promoted by miRNA-324-5p in human gastric cancer. Cell Cycle 2020, 19, 2720–2733. [Google Scholar] [CrossRef]
- Chi, Y.; Wang, F.; Zhang, T.; Xu, H.; Zhang, Y.; Shan, Z.; Wu, S.; Fan, Q.; Sun, Y. miR-516a-3p inhibits breast cancer cell growth and EMT by blocking the Pygo2/Wnt signalling pathway. J. Cell Mol. Med. 2019, 23, 6295–6307. [Google Scholar] [CrossRef]
- Wang, Z.X.; Chen, Y.Y.; Li, B.A.; Tan, G.W.; Liu, X.Y.; Shen, S.H.; Zhu, H.W.; Wang, H.D. Decreased pygopus 2 expression suppresses glioblastoma U251 cell growth. J. Neurooncol. 2010, 100, 31–41. [Google Scholar] [CrossRef] [Green Version]
- Zhang, D.; Liu, Y.; Wu, Q.; Zheng, Y.; Kaweme, N.M.; Zhang, Z.; Cai, M.; Dong, Y. Pygo2 as a novel biomarker in gastric cancer for monitoring drug resistance by upregulating MDR1. J. Cancer 2021, 12, 2952–2959. [Google Scholar] [CrossRef]
- Ye, C.; Ho, D.J.; Neri, M.; Yang, C.; Kulkarni, T.; Randhawa, R.; Henault, M.; Mostacci, N.; Farmer, P.; Renner, S.; et al. DRUG-seq for miniaturized high-throughput transcriptome profiling in drug discovery. Nat. Commun. 2018, 9, 4307. [Google Scholar] [CrossRef] [PubMed]
- Hammerich-Hille, S.; Kaipparettu, B.A.; Tsimelzon, A.; Creighton, C.J.; Jiang, S.; Polo, J.M.; Melnick, A.; Meyer, R.; Oesterreich, S. SAFB1 mediates repression of immune regulators and apoptotic genes in breast cancer cells. J. Biol. Chem. 2010, 285, 3608–3616. [Google Scholar] [CrossRef] [PubMed] [Green Version]
- Wyce, A.; Matteo, J.J.; Foley, S.W.; Felitsky, D.J.; Rajapurkar, S.R.; Zhang, X.P.; Musso, M.C.; Korenchuk, S.; Karpinich, N.O.; Keenan, K.M.; et al. MEK inhibitors overcome resistance to BET inhibition across a number of solid and hematologic cancers. Oncogenesis 2018, 7, 35. [Google Scholar] [CrossRef] [PubMed] [Green Version]
- Tanabe, S.; Perkins, E.J.; Ono, R.; Sasaki, H. Artificial intelligence in gastrointestinal diseases. Artif. Intell. Gastroenterol. 2021, 2, 69–76. [Google Scholar] [CrossRef]
- Gonzalez, D.M.; Medici, D. Signaling mechanisms of the epithelial-mesenchymal transition. Sci. Signal. 2014, 7, re8. [Google Scholar] [CrossRef]


| Analysis Name | Disease State | Target Gene | Treatment | EMT |
|---|---|---|---|---|
| 996-Breast ductal carcinoma torin 2 28190 | Breast ductal carcinoma | Mtor | Torin 2 | TRUE |
| 16332-Fibrocystic breast disease neratinib 7038 | Fibrocystic breast disease | Her2; egfr | Neratinib | TRUE |
| 16885-Fibrocystic breast disease erlotinib 7651 | Fibrocystic breast disease | Egfr | Erlotinib | TRUE |
| 116-Bone osteosarcoma (OS) MK2206 2727 | Bone osteosarcoma (OS) | MK2206 | TRUE | |
| 1766-Breast ductal carcinoma brivanib 8512 | Breast ductal carcinoma | Vegfr; fgfr | Brivanib | TRUE |
| 47-Huntington’s disease (HD) haloperidol 12804 | Huntington’s disease (HD) | Haloperidol | TRUE | |
| 4874-Melanoma crizotinib 22540 | Melanoma | Alk and ros1 | Crizotinib | TRUE |
| 6785-Non-small cell lung carcinoma ZSTK474 24663 | Non-small cell lung carcinoma | PI3K | ZSTK474 | TRUE |
| 7-Normal control differentiation medium 10230 | Normal control | Differentiation medium | TRUE | |
| 13972-Prostate adenocarcinoma (PRAD) PI103 4415 | Prostate adenocarcinoma (PRAD) | PI3K | PI103 | TRUE |
| 16046-Prostate adenocarcinoma (PRAD) MK2206 6720 | Prostate adenocarcinoma (PRAD) | AKT | MK2206 | TRUE |
| 7063-Breast adenocarcinoma linifanib 24973 | Breast adenocarcinoma | Rtk; vegf; pdgf | Linifanib | TRUE |
| 7923-Breast adenocarcinoma PF3758309 25928 | Breast adenocarcinoma | PAK4 | PF3758309 | TRUE |
| 2-Breast carcinoma beta-estradiol (E2) 3915 | Breast carcinoma | Β-estradiol (E2) | TRUE | |
| 10974-Breast ductal carcinoma KIN001-043 1084 | Breast ductal carcinoma | GSK3β | KIN001-043 | TRUE |
| 1116-Breast ductal carcinoma QL-X-138 1291 | Breast ductal carcinoma | BTK; MNK | QL-X-138 | TRUE |
| 29-Colon cancer GSK525762A; trametinib 3009 | Colon cancer | GSK525762A; trametinib | TRUE | |
| 35-Colon cancer active JQ1 1658 | Colon cancer | Active JQ1 | TRUE | |
| 13176-Colorectal adenocarcinoma BGJ398 3531 | Colorectal adenocarcinoma | FGFR | BGJ398 | TRUE |
| 12948-Colorectal adenocarcinoma AZ628 3277 | Colorectal adenocarcinoma | BRAF; BRAFV600E; C-RAF-1 | AZ628 | TRUE |
| 12715-Colorectal adenocarcinoma AT7519 3019 | Colorectal adenocarcinoma | CDK | AT7519 | TRUE |
| 6-Disease control IL-1 beta 15814 | Disease control | IL-1β | TRUE | |
| 17104-Fibrocystic breast disease canertinib 7896 | Fibrocystic breast disease | Egfr; her2; erbb4 | Canertinib | TRUE |
| 17239-Fibrocystic breast disease torin 1 8045 | Fibrocystic breast disease | Mtor | Torin 1 | TRUE |
| 16449-Fibrocystic breast disease AZD8330 7167 | Fibrocystic breast disease | MEK | AZD8330 | TRUE |
| 17590-Fibrocystic breast disease mitoxantrone 8435 | Fibrocystic breast disease | Topoisomerase | Mitoxantrone | TRUE |
| 7-Fibrosis DMSO 7394 | Fibrosis | DMSO | TRUE | |
| 20894-Hepatocellular carcinoma (LIHC) chelerythrine chloride 12106 | Hepatocellular carcinoma (LIHC) | PKC | Chelerythrine chloride | TRUE |
| 59-Huntington’s disease (HD) nortriptyline 12817 | Huntington’s disease (HD) | Nortriptyline | TRUE | |
| 2-Lung adenocarcinoma (LUAD) Transfection_HOXC6 631 | Lung adenocarcinoma (LUAD) | Transfection_HOXC6 | TRUE | |
| 3-Major depressive disorder differentiation medium 3130 | Major depressive disorder | Differentiation medium | TRUE | |
| 5612-Melanoma AT7867 23361 | Melanoma | AKT1/2/3; p70s6k/PKA | AT7867 | TRUE |
| 5173-Melanoma lapatinib 22873 | Melanoma | Her2; egfr | Lapatinib | TRUE |
| 91-Non-small cell lung carcinoma BGT226 27235 | Non-small cell lung carcinoma | PI3K; mtor | BGT226 | TRUE |
| 14456-Normal control WYE125132 4953 | Normal control | Mtor | WYE125132 | TRUE |
| 28175-Normal control glesatinib 20196 | Normal control | C-met; tek; vegfr; ron | Glesatinib | TRUE |
| 60-Normal control 567 | Normal control | TRUE | ||
| 2-Normal control culture medium 1187 | Normal control | Culture medium | TRUE | |
| 9914-Normal control EX527 28140 | Normal control | SIRT1 | EX527 | TRUE |
| 4-Normal control suberoylanilide hydroxamic acid (SAHA) 2204 | Normal control | Suberoylanilide hydroxamic acid (SAHA) | TRUE | |
| 27560-Normal control BMS509744 19513 | Normal control | ITK | BMS509744 | TRUE |
| 14256-Normal control AZD8055 4731 | Normal control | Mtor | AZD8055 | TRUE |
| 19-Normal control no serum 3447 | Normal control | No serum | TRUE | |
| 5-Parkinson’s disease (PD) differentiation medium 4389 | Parkinson’s disease (PD) | Differentiation medium | TRUE | |
| 23661-Prostate adenocarcinoma (PRAD) AZD5438 15181 | Prostate adenocarcinoma (PRAD) | CDK | AZD5438 | TRUE |
| 25661-Breast adenocarcinoma omipalisib 17403 | Breast adenocarcinoma | Pi3k | Omipalisib | TRUE |
| 90-Prostate adenocarcinoma (PRAD) monolayer culture 4346 | Prostate adenocarcinoma (PRAD) | Monolayer culture | TRUE | |
| 8-Normal control lipopolysaccharide (LPS) 4907 | Normal control | Lipopolysaccharide (LPS) | TRUE | |
| 2-Acute myeloid leukemia (LAML) lipopolysaccharide (LPS) 9357 | Acute myeloid leukemia (LAML) | Lipopolysaccharide (LPS) | TRUE | |
| 25084-Breast adenocarcinoma CGP60474 16762 | Breast adenocarcinoma | CDK1; CDK2 | CGP60474 | TRUE |
| 20-Non-small cell lung carcinoma IFN gamma 13421 | Non-small cell lung carcinoma | Ifnγ | FALSE | |
| 7-Normal control co-culture 3087 | Normal control | Co-culture | FALSE | |
| 5-Normal control hypoxia 13911 | Normal control | Hypoxia | FALSE | |
| 1-Normal control IFN alpha 4636 | Normal control | Ifnα | FALSE | |
| 11-Normal control differentiation medium 10205 | Normal control | Differentiation medium | FALSE | |
| 3-Normal control Infection_human betaherpesvirus 5 (HHV5) 15858 | Normal control | Infection_human betaherpesvirus 5 (HHV5) | FALSE | |
| 31-Bone osteosarcoma (OS) 1,9-pyrazoloanthrone 2804 | Bone osteosarcoma (OS) | 1,9-pyrazoloanthrone | FALSE | |
| 57-Coronavirus disease 2019 (COVID-19) 96 | Coronavirus disease 2019 (COVID-19) | FALSE | ||
| 17503-Fibrocystic breast disease HG6-64-1 8339 | Fibrocystic breast disease | B-RAF | HG6-64-1 | FALSE |
| 11-Genetic disease 444 | Genetic disease | FALSE | ||
| 4-Glioblastoma (GBM) differentiation medium 6303 | Glioblastoma (GBM) | Differentiation medium | FALSE | |
| 23448-Hepatocellular carcinoma (LIHC) imatinib 14944 | Hepatocellular carcinoma (LIHC) | BCR-ABL | Imatinib | FALSE |
| 86-Huntington’s disease (HD) sodium butyrate 12847 | Huntington’s disease (HD) | Sodium butyrate | FALSE | |
| 21-Mantle cell lymphoma DMSO 3032 | Mantle cell lymphoma | DMSO | FALSE | |
| 5-Non-alcoholic steatohepatitis (NASH) none 11484 | Non-alcoholic steatohepatitis (NASH) | None | FALSE | |
| 10431-Normal control RAF265 482 | Normal control | C-RAF; B-RAF; B-RAFV600E | RAF265 | FALSE |
| 11-Normal control differentiation medium 4490 | Normal control | Differentiation medium | FALSE | |
| 14744-Normal control dasatinib 5273 | Normal control | Src family | Dasatinib | FALSE |
| 65-Normal control IL-3 17225 | Normal control | IL-3 | FALSE | |
| 14639-Normal control saracatinib 5156 | Normal control | Src; bcr-abl | Saracatinib | FALSE |
| 3-Normal control DHA-5-HT 4554 | Normal control | DHA-5-HT | FALSE | |
| 28-Prostatic intraepithelial neoplasia (PIN) plumbagin 49 | Prostatic intraepithelial neoplasia (PIN) | Plumbagin | FALSE | |
| 4-Normal control differentiation medium 3415 | Normal control | Differentiation medium | FALSE | |
| 9-Huntington’s disease (HD) meclizine 12851 | Huntington’s disease (HD) | Meclizine | FALSE | |
| 6-Normal control culture medium 593 | Normal control | Culture medium | FALSE | |
| 22597-Normal control GSK429286A 13998 | Normal control | ROCK1; ROCK2 | GSK429286A | FALSE |
| 8-Normal control 3-D culture; co-culture; differentiation 3017 | Normal control | 3D culture; co-culture; differentiation medium | FALSE | |
| 110-Normal control 109 | Normal control | FALSE | ||
| 26-Bone osteosarcoma (OS) nilotinib 2798 | Bone osteosarcoma (OS) | Nilotinib | FALSE | |
| 26025-Breast adenocarcinoma saracatinib 17808 | Breast adenocarcinoma | Src; bcr-abl | Saracatinib | FALSE |
| 11577-Breast ductal carcinoma crizotinib 1754 | Breast ductal carcinoma | Alk and ros1 | Crizotinib | FALSE |
| 17316-Fibrocystic breast disease KIN001-043 8131 | Fibrocystic breast disease | GSK3β | KIN001-043 | FALSE |
| 2-Fibrosis SB525334 7389 | Fibrosis | SB525334 | FALSE | |
| 52-Huntington’s disease (HD) meclizine 12810 | Huntington’s disease (HD) | Meclizine | FALSE | |
| 1-Normal control culture medium 1186 | Normal control | Culture medium | FALSE | |
| 17-Normal control differentiation medium 4496 | Normal control | Differentiation medium | FALSE | |
| 6-Normal control hypoxia 13912 | Normal control | Hypoxia | FALSE | |
| 2-Major depressive disorder differentiation medium 3129 | Major depressive disorder | Differentiation medium | FALSE | |
| 11-Disease control none 4051 | Disease control | None | FALSE | |
| 10-Normal control 3-D culture; co-culture; differentiation 2995 | Normal control | 3D culture; co-culture; differentiation medium | FALSE | |
| 5-Normal control lipopolysaccharide (LPS) 15704 | Normal control | Lipopolysaccharide (LPS) | FALSE | |
| 1-Normal control differentiation medium 1246 | Normal control | Differentiation medium | FALSE | |
| 6-Normal control 151 | Normal control | 3d culture; none | FALSE | |
| 10-Normal control differentiation medium 4489 | Normal control | Differentiation medium | FALSE | |
| 13-Normal control co-culture 3079 | Normal control | Co-culture | FALSE | |
| 13051-Colorectal adenocarcinoma BMS777607 3393 | Colorectal adenocarcinoma | C-MET; AXL; RON; TYRO3 | BMS777607 | FALSE |
| 27-Huntington’s disease (HD) meclizine 12782 | Huntington’s disease (HD) | Meclizine | FALSE | |
| 8-Normal control GW3965 10098 | Normal control | GW3965 | FALSE | |
| 11-Normal control 368 | Normal control | FALSE | ||
| 6-Normal control culture medium 1191 | Normal control | Culture medium | FALSE |
| Analysis Name | Disease State | Target Gene | Tissue | Treatment | EMT | Prediction | Label |
|---|---|---|---|---|---|---|---|
| 18092-Breast adenocarcinoma CP466722 8993 | breast adenocarcinoma | ATM | Breast | Cp466722 | TRUE | 0.9693884 | 1 |
| 25525-Breast adenocarcinoma celastrol 17252 | breast adenocarcinoma | multiple targets | Breast | Celastrol | TRUE | 0.99966132 | 1 |
| 25083-Breast adenocarcinoma CGP60474 16761 | breast adenocarcinoma | CDK1; CDK2 | Breast | Cgp60474 | TRUE | 0.99881416 | 1 |
| 18267-Breast adenocarcinoma AZD8055 9187 | breast adenocarcinoma | mTOR | Breast | Azd8055 | TRUE | 0.99731849 | 1 |
| 7513-Breast adenocarcinoma OTSSP167 25473 | breast adenocarcinoma | MELK | Breast | Otssp167 | TRUE | 0.9991679 | 1 |
| 18469-Breast adenocarcinoma HG6-64-1 9411 | breast adenocarcinoma | B-RAF | Breast | Hg6-64-1 | TRUE | 0.99314697 | 1 |
| 25636-Breast adenocarcinoma HG6-64-1 17375 | breast adenocarcinoma | B-RAF | Breast | Hg6-64-1 | TRUE | 0.99867832 | 1 |
| 14-Breast carcinoma estradiol 1431 | breast carcinoma | Breast | Estradiol | TRUE | 0.99207239 | 1 | |
| 895-Breast ductal carcinoma GSK1059615 27068 | breast ductal carcinoma | PI3K; mTOR | Breast | Gsk1059615 | TRUE | 0.98180702 | 1 |
| 1263-Breast ductal carcinoma lapatinib 2924 | breast ductal carcinoma | HER2; EGFR | Breast | Lapatinib | TRUE | 0.99916824 | 1 |
| 9-Normal control olive pollen extract 16317 | Normal control | Peripheral blood | Olive pollen extract | FALSE | 0.00276633 | 0 | |
| 37-Normal control 257 | Normal control | Lung | FALSE | 0.00027655 | 0 | ||
| 21926-Normal control rebastinib 13253 | Normal control | BCR-ABL | Kidney | Rebastinib | FALSE | 0.08588748 | 0 |
| 4-Normal control mock 16535 | Normal control | Bone marrow | Mock | FALSE | 0.00030339 | 0 | |
| 15884-Normal control withaferin A 6539 | Normal control | IKKβ | Breast | Withaferin A | FALSE | 0.00271459 | 0 |
| 4-Normal control lipopolysaccharide (LPS) 15703 | Normal control | Embryo | Lipopolysaccharide (LPS) | FALSE | 0.00194256 | 0 | |
| 10-Normal control co-culture 3076 | Normal control | Peripheral blood | Co-culture | FALSE | 0.00115878 | 0 | |
| 6-Normal control actinomycin D 4750 | Normal control | Fetal kidney | Actinomycin D | FALSE | 0.01263976 | 0 | |
| 2-Melanoma 35 | Melanoma | Skin | FALSE | 0.02006465 | 0 | ||
| 490-MYD88 deficiency lipopolysaccharide (LPS); polymyxin 12583 | MYD88 deficiency | Peripheral blood | Lipopolysaccharide (LPS); polymyxin B | FALSE | 0.03955118 | 0 |
Disclaimer/Publisher’s Note: The statements, opinions and data contained in all publications are solely those of the individual author(s) and contributor(s) and not of MDPI and/or the editor(s). MDPI and/or the editor(s) disclaim responsibility for any injury to people or property resulting from any ideas, methods, instructions or products referred to in the content. |
© 2023 by the authors. Licensee MDPI, Basel, Switzerland. This article is an open access article distributed under the terms and conditions of the Creative Commons Attribution (CC BY) license (https://creativecommons.org/licenses/by/4.0/).
Share and Cite
Tanabe, S.; Quader, S.; Ono, R.; Cabral, H.; Aoyagi, K.; Hirose, A.; Perkins, E.J.; Yokozaki, H.; Sasaki, H. Regulation of Epithelial–Mesenchymal Transition Pathway and Artificial Intelligence-Based Modeling for Pathway Activity Prediction. Onco 2023, 3, 13-25. https://doi.org/10.3390/onco3010002
Tanabe S, Quader S, Ono R, Cabral H, Aoyagi K, Hirose A, Perkins EJ, Yokozaki H, Sasaki H. Regulation of Epithelial–Mesenchymal Transition Pathway and Artificial Intelligence-Based Modeling for Pathway Activity Prediction. Onco. 2023; 3(1):13-25. https://doi.org/10.3390/onco3010002
Chicago/Turabian StyleTanabe, Shihori, Sabina Quader, Ryuichi Ono, Horacio Cabral, Kazuhiko Aoyagi, Akihiko Hirose, Edward J. Perkins, Hiroshi Yokozaki, and Hiroki Sasaki. 2023. "Regulation of Epithelial–Mesenchymal Transition Pathway and Artificial Intelligence-Based Modeling for Pathway Activity Prediction" Onco 3, no. 1: 13-25. https://doi.org/10.3390/onco3010002