Article

Fucoxanthinol Promotes Apoptosis in MCF-7 and MDA-MB-231 Cells by Attenuating Laminins–Integrins Axis

1
School of Pharmaceutical Sciences, Health Sciences University of Hokkaido, 1757 Knazawa, Ishikari-Tobetsu 061-0293, Hokkaido, Japan
2
Advanced Research Promotion Center, Health Sciences University of Hokkaido, 1757 Knazawa, Ishikari-Tobetsu 061-0293, Hokkaido, Japan
3
School of Nursing and Social Services, Health Sciences University of Hokkaido, 1757 Knazawa, Ishikari-Tobetsu 061-0293, Hokkaido, Japan
4
Faculty of Agriculture and Life Science, Hirosaki University, 3 Bunkyo-Cho, Hirosaki 036-8561, Aomori, Japan
*
Author to whom correspondence should be addressed.
Onco 2022, 2(3), 145-163; https://doi.org/10.3390/onco2030010
Submission received: 19 June 2022 / Revised: 29 June 2022 / Accepted: 4 July 2022 / Published: 8 July 2022
(This article belongs to the Special Issue Feature Papers in Onco)

Abstract

:

Simple Summary

Carotenoids are potential candidates for preventing breast cancer (BC), a major malignancy affecting women worldwide with high incidence and mortality rates. Some studies have demonstrated that fucoxanthin, a marine carotenoid, and its major metabolite fucoxanthinol (FxOH), promoted apoptosis in representative human BC cells (MCF-7 and MDA-MB-231 cells). However, the effects of Fx and FxOH in those cells still remain fragmentary. Herein, we investigated the comprehensive mechanisms underlying FxOH-induced apoptosis in MCF-7 and MDA-MB-231 cells. Consequently, it was suggested that FxOH promoted apoptosis in MCF-7 and MDA-MB-231 cells by modulating the extracellular matrix–integrin axis, and the downstream signals: cell cycle, STAT, TGF-β, RAS/Rho, MAPK, and/or DNA repair. Thus, FxOH may exert preventive effects on BC by modulating some core signals involved in apoptosis induction.

Abstract

Fucoxanthinol (FxOH), the main metabolite of the marine carotenoid fucoxanthin, exerts anti-cancer effects. However, fragmentary information is available on the growth-inhibiting effects of FxOH on breast cancer (BC). We investigated the growth-inhibiting effects of FxOH on human BC cells (MCF-7 and MDA-MB-231 cells), and the underlying mechanisms, differently from previous studies, by using comprehensive transcriptome analysis. The molecular mechanisms of FxOH were evaluated using flow cytometry, microarray, Western blotting, and gene knockdown analyses. FxOH (20 μM) significantly induced apoptosis in MCF-7 and MDA-MB-231 cells. Transcriptome analysis revealed that FxOH modulated the following 12 signaling pathways: extracellular matrix (ECM), adhesion, cell cycle, chemokine and cytokine, PI3K/AKT, STAT, TGF-β, MAPK, NF-κB, RAS/Rho, DNA repair, and apoptosis signals. FxOH downregulated the levels of laminin β1, integrin α5, integrin β1, integrin β4, cyclin D1, Rho A, phosphorylated (p)paxillin (Tyr31), pSTAT3(Ser727), and pSmad2(Ser465/467), which play critical roles in the 12 signaling pathways mentioned above. Additionally, FxOH upregulated the levels of pERK1/2(Thr202/Tyr204) and active form of caspase-3. Integrin β1 or β4 knockdown significantly inhibited the growth of MCF7 and MDA-MB-231 cells. These results suggest that FxOH induces apoptosis in human BC cells through some core signals, especially the ECM–integrins axis, and the downstream of cell cycle, STAT, TGF-β, RAS/Rho, MAPK, and/or DNA repair signals.

1. Introduction

According to the GLOBOCAN database for 2020, female breast cancer (BC) is estimated to be the most common cancer among newly diagnosed cancer cases worldwide (approximately 2.3 million new cases). In addition, female BC is the leading cause of cancer in women, with high incidence and mortality rates [1]. In the United States, the incidence of BC is increasing, and is estimated to remain higher than that of other cancers by 2040 [2]. The 5 year relative survival rates of BC patients with localized, regional, and distant stages are 99%, 86%, and 29%, respectively (combined survival rates of all stages = 90%) [3].
Carotenoids, which are a category of tetraterpenoids and fat-soluble pigments, are abundant in fruits, vegetables, and algae, and confer health benefits to humans. The pigments are important phytochemicals for antioxidants with radical scavenging [4] and singlet oxygen-quenching potentials [5]. Increasing evidence from human studies suggests that some carotenoids, such as α-carotene, β-carotene, and lycopene, which are found in various fruits and vegetables, exert preventive effects. Therefore, several epidemiological approaches aimed to investigate the preventive effects of carotenoid intake on BC. However, the evaluation of carotenoids as anti-cancer agents is still classified as “Limited-suggestive decreases risk” [6]. On the other hands, carotenoids, including α-carotene, β-carotene, lycopene, lutein, β-cryptoxanthin, violaxanthin, neoxanthin, and fucoxanthin (Fx), ingested by humans exhibit a wide range of polarity. To date, the preventive effects of highly polar carotenoids, such as neoxanthin and Fx, on BC have not been previously investigated.
The highly polar carotenoid Fx is a representative marine carotenoid and exhibits photosynthetic and photoprotective activities in brown algae and microalgae [7]. Fx is abundant in dietary marine algae such as Undaria pinnatifida (Japanese name, wakame) and Himanthalia elongata (sea spaghetti) [8], with a wide range of 0.3–18.6 mg Fx/g dry weight. Previous studies report that Fx does not exert toxic side effects in humans and rodents [9,10]. Intestinal esterases convert ingested Fx into fucoxanthinol (FxOH), a major deacetylated metabolite of Fx (Figure 1) detected in the blood of humans and rodents [11,12,13]. Several studies demonstrate that Fx and/or FxOH exhibit anti-inflammatory [14], anti-obesity [15], antidiabetic [16], antioxidant [17], antiangiogenic [18], and anti-cancer [8,19,20] properties in humans, animal models, and cultured cells.
There is little information available on the interventional studies aimed at cancer prevention using Fx and FxOH in humans and animal models. However, some researchers report on the anti-proliferative and pro-apoptotic effects of Fx and FxOH in BC cells. Treatment with 20 μM FxOH promotes apoptosis in MCF-7 and MDA-MB-231 cells by promoting the cleavage of pro-caspase-3 and/or poly(ADP-ribose) polymerase (PARP). Additionally, the expression and activation levels of nuclear factor-kappa B1 (NFκB1) signaling-related proteins are downregulated in FxOH-treated MDA-MB-231 cells [21,22]. Fx (25–100 μM) suppresses cell viability, migration, and invasion by downregulating the expression levels of the invasion-associated proteins matrix metalloproteinase 2 (MMP2) and MMP9, and the secretion of the lymphangiogenic vascular endothelial growth factor-C (VEGF-C). Fx (100 and 500 μM) administration into the tumor periphery in a xenograft mouse model that was subcutaneously inoculated with MDA-MB-231 cells for 26 days significantly suppresses tumor development and lymphangiogenesis [23]. Combination treatment with Fx (10 μM) and doxorubicin (Dox; 1 μM), an anti-cancer agent, decreases the viability of MDA-MB-231 cells in a three-dimensional culture, by activating caspase-3 and inhibiting MKI67 (proliferative marker) [24]. Fx augments the cytotoxicity of Dox, and induces apoptosis in MCF-7 cells exhibiting a multidrug resistance phenotype by downregulating multidrug resistance-associated protein 1 (MRP1/ABCC1), MRP2/ABCC2, P-glycoprotein (MDR1/ABCB1), CYP3A4, glutathione-S-transferase (GST), and pregnane X receptor (PXR), and enhancing caspase-3, caspase-8, and TP53 [25]. Furthermore, Fx (10 μM) decreases the formation of mammospheres in MCF-7 cells [26]. The anti-proliferative and pro-apoptotic effects of Fx and FxOH in human BC cells and the underlying mechanisms have not yet been elucidated.
This study investigated the effects of FxOH on the transcriptome profiles of MCF-7 and MDA-MB-231 cells, and elucidated the novel molecular mechanisms differently than the previous reports.

2. Materials and Methods
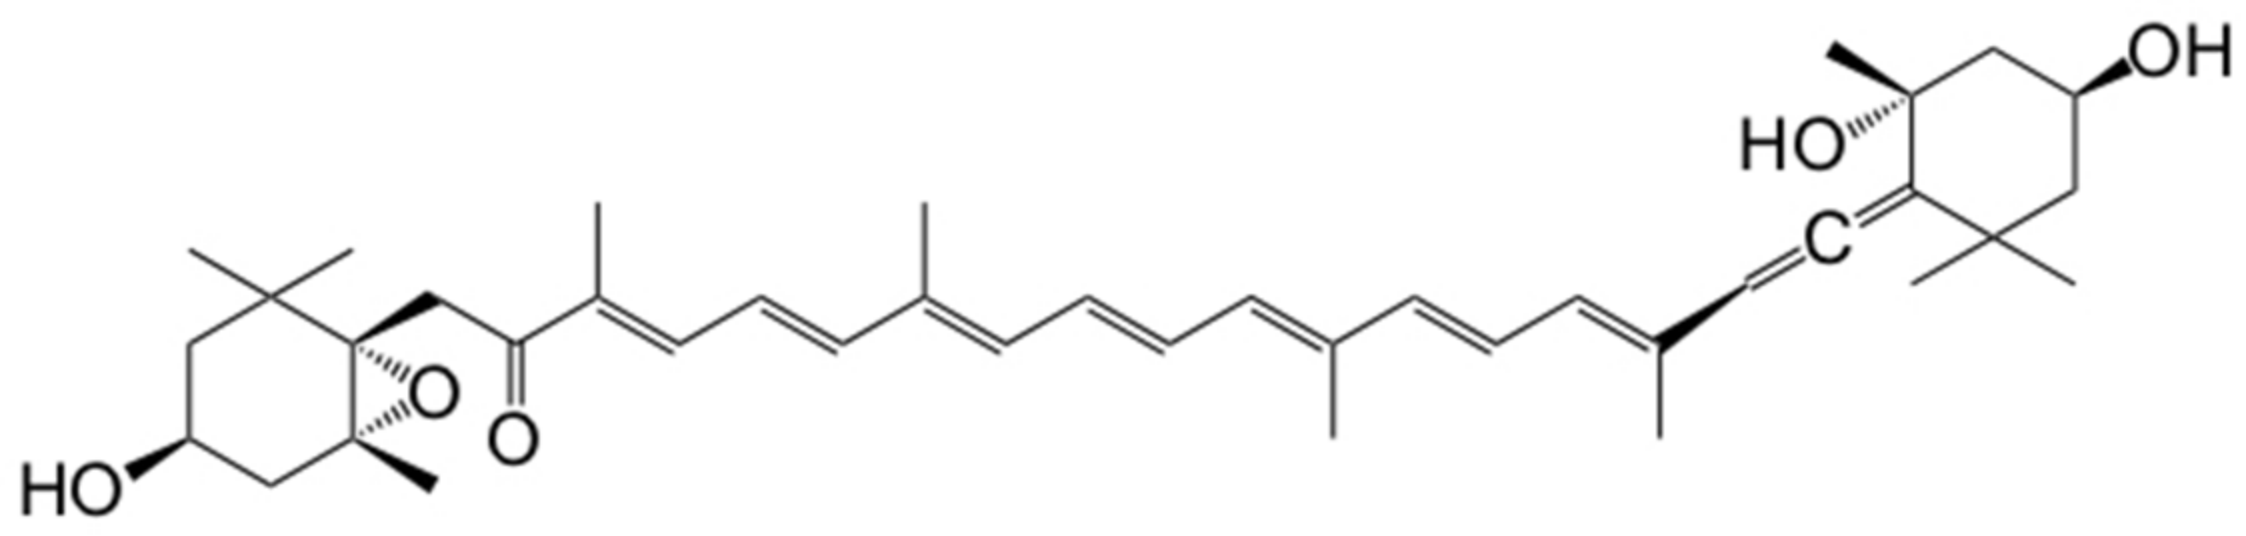
2.1. Chemicals

All-trans-FxOH (purity ≥ 98%) was enzymatically prepared from Fx (Figure 1). Anti-laminin β1, anti-integrin α5, anti-integrin α6, anti-integrin β1, anti-integrin β4, anti-phosphorylated(p)-focal adhesion kinase (FAK) [pFAK(Tyr397)], anti-cyclin B1, anti-pSmad2(Ser465/467), anti-caspase-3, and anti-β-actin antibodies were purchased from GeneTex (Irvine, CA, USA). Anti-chemokine receptor 1 (CCR1), anti-CCR4, anti-CXC chemokine receptor 4 (CXCR4), and anti-breast cancer 1 (BRCA1) antibodies were obtained from BioVision (Milpitas, CA, USA). Anti-Cyclin D1, anti-p-signal transducer and activator of transcription 3 (pSTAT3) (Tyr705), anti-p-mitogen-activated protein kinase 1 and 2 (pMEK1/2) (Ser217/221), and anti-p-mitogen-activated protein kinase 1 and 2 (pERK1/2) (Thr202/Tyr204) antibodies were purchased from Cell Signaling Technology (Danvers, MA, USA). Anti-CCR7, anti-prolactin and receptor (PRLR) antibodies were obtained from Bioss Antibodies (Beijing, China). Anti-p-paxillin (pPaxillin) (Tyr31) and anti-fibronectin antibodies were purchased from Novex (San Diego, CA, USA) and Thermo Scientific (Waltham, MA, USA), respectively. Anti-NFκB p105/p50 and p100/p52 antibodies were obtained from EnoGene Biotech (New York, NY, USA). Fetal bovine serum (FBS) and Dulbecco’s modified Eagle’s medium (D-MEM) were obtained from FUJIFILM Wako Pure Chemicals (Osaka, Japan). Lipofectamine RNAiMAX, Opti-MEM I, RNAlater, penicillin/streptomycin, and GlutaMAX were obtained from Thermo Fisher Scientific (Carlsbad, CA, USA). DynaMarker RNA High for Easy Electrophoresis and premixed water-soluble tetrazolium (WST)-1 reagent were obtained from BioDynamics Laboratory (Tokyo, Japan) and Takara Bio (Shiga, Japan), respectively. MCF-7 and MDA-MB-231 cells were purchased from the American Type Culture Collection (Rockville, MD, USA). The cells were maintained in DMEM supplemented with heat-inactivated FBS (final concentration: 10% (v/v)), GlutaMAX (final concentration: 100-fold dilution), penicillin (final concentration: 40,000 U/L), and streptomycin (final concentration: 40 mg/L). All other reagents and solvents used in this study were of analytical grade.

2.2. Cell Viability Assay

MCF-7 and MDA-MB-231 cells were seeded into a 24-well plate containing culture medium at a density of 5 × 10⁴ cells/mL (2.5 × 10⁴ cells/well). The cells were allowed to adhere for 1 day. The medium was then replaced with fresh culture medium containing FxOH (final concentration: 5.0 or 20.0 μM) or vehicle alone (dimethyl sulfoxide (DMSO)), and the cells were incubated for 1 or 2 days. Cell viability was measured using a WST-1 assay. The absorbance at 450 nm of the mixture was measured using an enzyme-linked immunosorbent assay plate reader TECAN (TECAN Japan, Tokyo, Japan).

2.3. Analysis of Apoptosis-Associated Nuclear Alteration

MCF-7 and MDA-MB-231 cells were seeded into a 24-well plate containing culture medium at a density of 5 × 10⁴ cells/mL (2.5 × 10⁴ cells/well). The cells were allowed to adhere for 1 day. The medium was then replaced with fresh culture medium containing FxOH (final concentration: 20.0 μM) or vehicle alone (DMSO), and the cells were incubated for 2 days. The cells were incubated with Hoechst33342 (Ho342, Dojindo Laboratories, Kumamoto, Japan) at 37 °C for 10 min. Apoptosis-associated chromatin condensation and nuclear fragmentation were assessed using the fluorescence microscope Nikon TE2000 (Nikon, Melville, NY, USA).

2.4. Analyses of Apoptotic-Like Cell Body and Cell Cycle Phases

MCF-7 and MDA-MB-231 cells were seeded into 10 cm plates containing culture medium at a density of 5 × 10⁴ cells/mL (50 × 104 cells/plate). The cells were allowed to adhere for 1 day. The medium was then replaced with fresh culture medium containing FxOH (final concentration: 20.0 μM) or vehicle alone (DMSO), and the cells were incubated for 2 days. The cells were dissociated into a single-cell suspension, fixed with cold 70% ethanol for 30 min, incubated with ribonuclease A (Nacalai Tesque, Kyoto, Japan) at 37 °C for 20 min, and stained with propidium iodide (Sigma-Aldrich, St Louis, MO, USA) at 4 °C for 30 min. The number of cells with apoptosis-like bodies (sub-G1) and at different cell cycle phases (G1, S, and G2/M) were counted using a FACSaria-III flow cytometer (BD Biosciences, San Jose, CA, USA).

2.5. Extraction and Purification of Total RNA

MCF-7 and MDA-MB-231 cells were seeded into 10 cm plates containing cell culture medium at a density of 5 × 10⁴ cells/mL (50 × 104 cells/plate). The cells were allowed to adhere for 1 day. The medium was then replaced with fresh culture medium containing FxOH (final concentration: 20.0 μM) or vehicle alone (DMSO), and the MCF-7 and MDA-MB-231 cells were incubated for 2 and 1 days, respectively. The cells were trypsinized, washed twice with phosphate-buffered saline (PBS), incubated with RNA later overnight at 4 °C, and stored at −80 °C until total RNA extraction. Total RNA was extracted and purified using RNeasy Mini Kit, RNase-Free DNase Set, and QIA shredder (QIAGEN, Valencia, CA, USA), following the manufacturer’s instructions. The concentration of RNA was determined using a NanoDrop ND-1000 (NanoDrop, Wilmington, DE, USA). Additionally, total RNA was quantified using agarose gel electrophoresis with DynaMarker RNA High for Easy Electrophoresis.

2.6. Microarray Analysis

Gene expression was comprehensively analyzed using the microarray Clariom S human assay with an optimal enzyme and reagent kit (Thermo Fisher Scientific, Carlsbad, CA, USA). Total RNA (500 ng) was mixed with poly(A) control RNAs. First-strand complementary DNA (cDNA) was enzymatically synthesized from the total and control RNA mixtures, followed by the synthesis of double-stranded cDNA from the first-strand cDNA. Single-stranded complementary RNA (cRNA) was generated from double-stranded cDNA using an in vitro transcription method. Second-cycle single-strand-cDNA was generated from a single-strand cRNA template. The resulting single-stranded cDNA was enzymatically fragmented, labeled with biotin, and hybridized to a Clariom S Human Array. The microarray was washed, stained with the accessory reagents using Affymetrix Fluidics Station 450 (Affymetrix, Santa Clara, CA, USA), and scanned using the Affymetrix GeneChip Scanner 3000 system (Affymetrix). Gene expression profiles were measured using Transcriptome Analysis Console (TAC) software (version 4.0.2; Applied Biosystems, Foster City, CA, USA). The significant differentially expressed genes between FxOH-treated and control cells were extracted based on the following criteria: fold-change, ≥2.0 or ≤−2.0-fold; p < 0.05 (one-way analysis of variance (ANOVA); exact p values (obtained using an exact test with edge R in the TAC software)). Principal coordinate analysis (PCoA) plots, volcano plots, hierarchical clustering, and the distribution of the top 30 gene sets were displayed using TAC software, based on Kyoto Encyclopedia of Genes and Genomes (KEGG) pathway enrichment analysis. Gene set enrichment analysis (GSEA) was performed using GSEA software (ver. 4.0.3; Broad Institute of Harvard University and Massachusetts Institute of Technology, Cambridge, MA, USA) [27,28].

2.7. Analysis of Protein Expression and Activation

MCF-7 and MDA-MB-231 cells were seeded into 10 cm plates containing culture medium at a density of 5 × 10⁴ cells/mL (50 × 104 cells/plate). The cells were allowed to adhere for 1 day. The medium was then replaced with fresh culture medium containing FxOH (final concentration: 20.0 μM) or vehicle alone (DMSO), and the MCF-7 and MDA-MB-231 cells were incubated for 2 and 1 days, respectively. The cells were trypsinized, washed twice with PBS, and stored at −80 °C until total protein extraction. Whole proteins were lysed using a lysis buffer. The protein concentration in the lysate was determined using Bradford assay (Bio-Rad, Hercules, CA, USA). Whole cellular proteins (10 µg) were subjected to sodium dodecyl sulfate-polyacrylamide gel electrophoresis using a 10% gel. The resolved proteins were transferred onto a Hybond polyvinylidene difluoride membrane (Amersham Bioscience, Little Chalfont, UK). The membrane was washed with Tris-buffered saline containing 0.1% Tween 20 (TBS-T), and incubated with 1% (w/v) bovine serum albumin (BSA) in TBS-T (1% BSA/TBS-T) at room temperature for 1 h. Next, the membrane was incubated with primary antibodies in 1% BSA/TBS-T at 4 °C overnight, followed by incubation with horseradish peroxidase-conjugated anti-mouse or anti-rabbit secondary antibodies in TBS-T at room temperature for 1 h. Immunoreactive bands were visualized using a luminol-enhanced chemiluminescence assay (Millipore, Billerica, MA, USA). After the observation, the membrane was re-probed and washed with TBS-T, and then applied to the next protein measurement. β-actin expression was used as a loading control per proteins set at different membrane.

2.8. Gene Knockdown Experiments

Twenty-seven mer of Dicer-substrate short interfering RNAs (dsiRNAs) targeting the coding sequences of integrin β1 and β4 mRNAs in Homo sapiens were designed by Integrated DNA Technologies (Coralville, IA, USA). The designed integrin β1 and β4 dsiRNAs were as follows: integrin β1 dsRNA, 5′-ACU CUU GUC AGC UAA GGU CAC AUT G-3′; integrin β4 dsiRNA, 5′-CGA GAA GCU UCA CAC CUA UUU CCC T-3′; negative control (NC), 5′-GUG UUC UAC ACC AUU ACU CAA UUC UUA-3′. The dsiRNA/Lipofectamine RNAiMAX complex was prepared in Opti-MEM I, following the manufacturer’s instructions. MCF-7 and MDA-MB-231 cells were seeded into 10 cm plates containing cell culture medium at a density of 6 × 10⁴ cells/mL (60 × 104 cells/plate). The cells were allowed to adhere for 1 day. The dsiRNA or NC/Lipofectamine RNAiMAX complex was added to 10 mL of culture medium (final concentration of dsiRNA or NC: 10 nM) for 1 day. Integrin β1 or β4 knockdown MCF-7 and MDA-MB-231 cells were seeded into a 24-well plate at a density of 5 × 10⁴ cells/mL (2.5 × 10⁴ cells/well), and allowed to adhere for 1 day. The growth of the treated cells was measured using a WST-1 assay.

2.9. Statistical Analysis

All values are presented as mean ± standard error. The means between more than two groups were compared using one-way ANOVA, followed by Tukey–Kramer post hoc tests, while those between two groups were compared using Student’s t-test, except for microarray analysis. Differences were considered significant at * p < 0.05.

3. Results

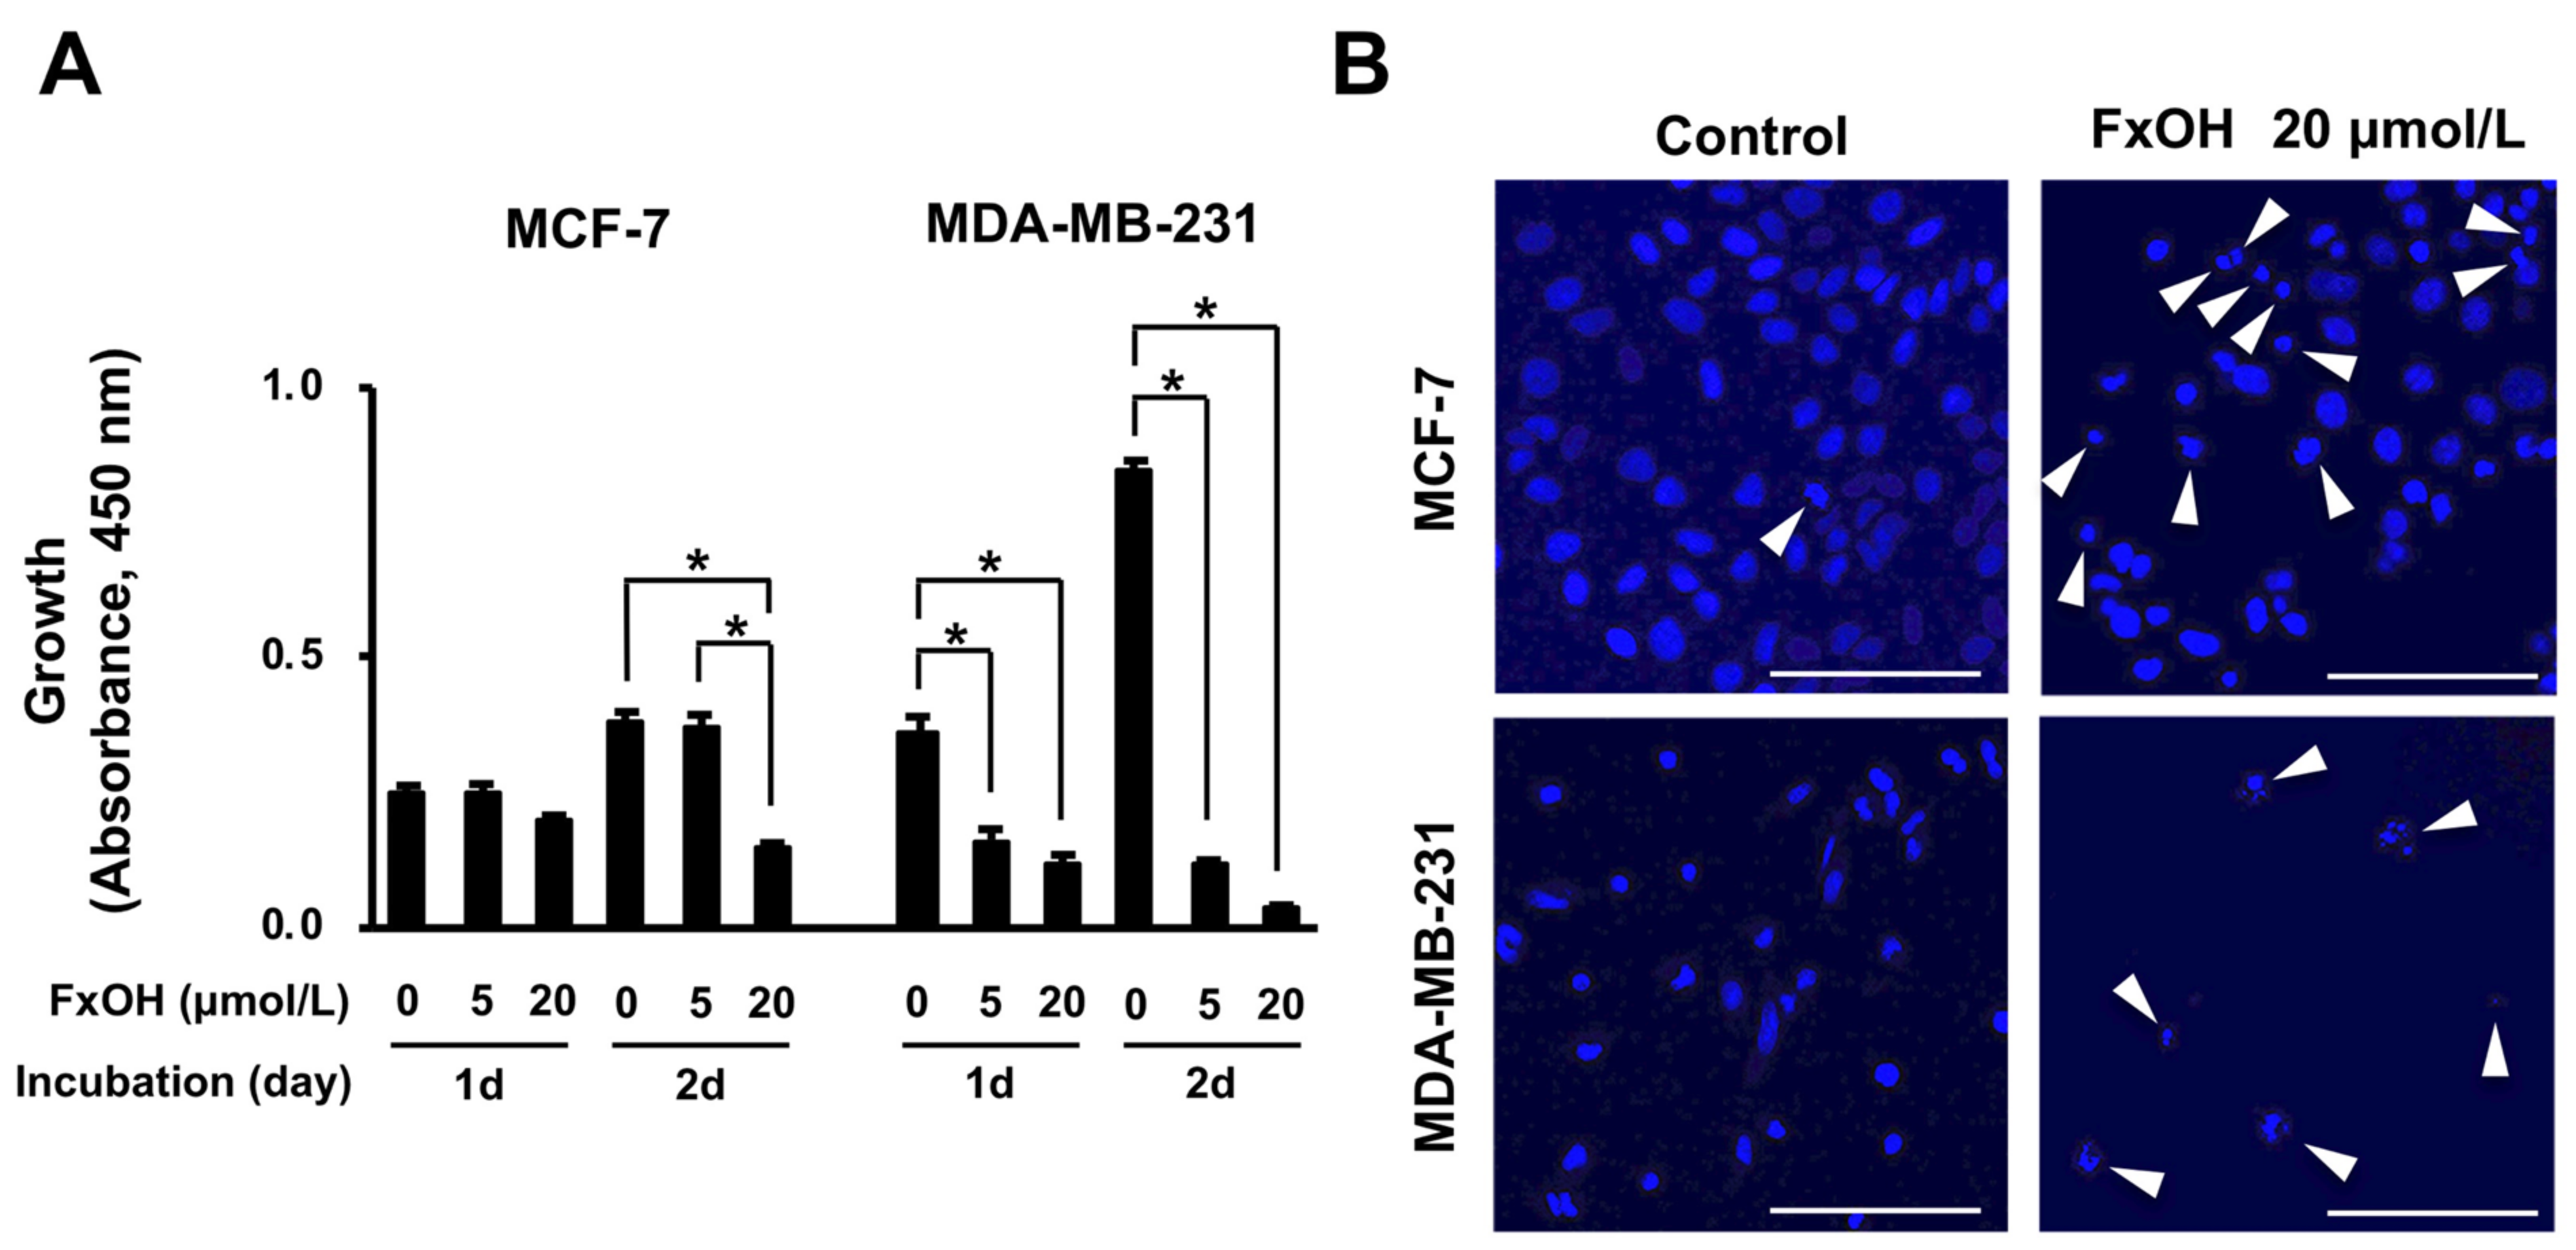
3.1. Effects of FxOH on Cell Growth, Apoptosis, and Cell Cycle in MCF-7 and MDA-MB-231 Cells

The growth of FxOH (20 μM)-treated MCF-7 cells (0.15 ± 0.01) was significantly lower than that of FxOH (5 μM)-treated (0.38 ± 0.02) and control (0.39 ± 0.02) MCF-7 cells at day 2 post-treatment. However, the growth of the control (0.25 ± 0.01), FxOH (5 μM)-treated (0.25 ± 0.02), and FxOH (20 μM)-treated MCF-7 cells (0.20 ± 0.01) was not significantly different at day 1 post-treatment. Compared with that of control MDA-MB-231 cells (0.36 ± 0.03), the growth of FxOH (5 μM)-treated (0.16 ± 0.02) and FxOH (20 μM)-treated (0.12 ± 0.01) MDA-MB-231 cells was significantly lower at day 1 post-treatment. Similarly, the growth of FxOH (5 μM)-treated (0.12 ± 0.01) and FxOH (20 μM)-treated (0.04 ± 0.01) MDA-MB-231 cells was significantly lower than that of control MDA-MB-231 cells (0.85 ± 0.02) at day 2 post-treatment (Figure 2A). Treatment with 20 μM FxOH (both cells were incubated 2 days) increased the frequency of apoptosis-like characteristics (chromatin condensation and nuclear fragmentation) in MCF-7 and MDA-MB-231 cells (Figure 2B). The proportion of MCF-7 cells with apoptotic bodies (sub-G1) in the FxOH (20 μM, 2 days incubation)-treated group (12.2 ± 1.1) was significantly higher than that in the control group (4.6 ± 0.6). Similarly, the proportion of MDA-MB-231 cells with apoptotic bodies (sub-G1) in the FxOH (20 μM, 2 days incubation)-treated group (16.7 ± 1.3) was significantly higher than that in the control group (0.4 ± 0.1) (Figure 2C). Compared with those of MCF-7 cells at the G1 phase (64.3% ± 0.4%) and G2/M phase (26.4% ± 0.2%) in the control group, the percentages of MCF-7 cells at G1 phase (61.0% ± 0.4%) and G2/M phase (25.5% ± 0.1%) were significantly lower in the FxOH (20 μM)-treated group. In contrast, the percentage of MCF-7 cells at the S phase in the FxOH (20 μM)-treated (13.5 ± 0.4%) group was significantly higher than that of MCF-7 cells at the S phase in the control group (9.3 ± 0.3%). Additionally, the percentage of MDA-MB-231 cells at the G1 phase in the FxOH (20 μM)-treated group (43.3% ± 1.4%) was significantly lower than those of MDA-MB-231 cells at the G1 phase in the control group (65.8 ± 0.4%). In contrast, the percentages of MDA-MB-231 cells at the S phase (21.2% ± 2.2%) and the G2/M phase (35.5 ± 1.8%) in the FxOH (20 μM)-treated group were significantly higher than those of MDA-MB-231 cells at the S phase (13.0% ± 0.7%) and the G2/M phase (21.2% ± 0.9%) in the control group (Figure 2D).

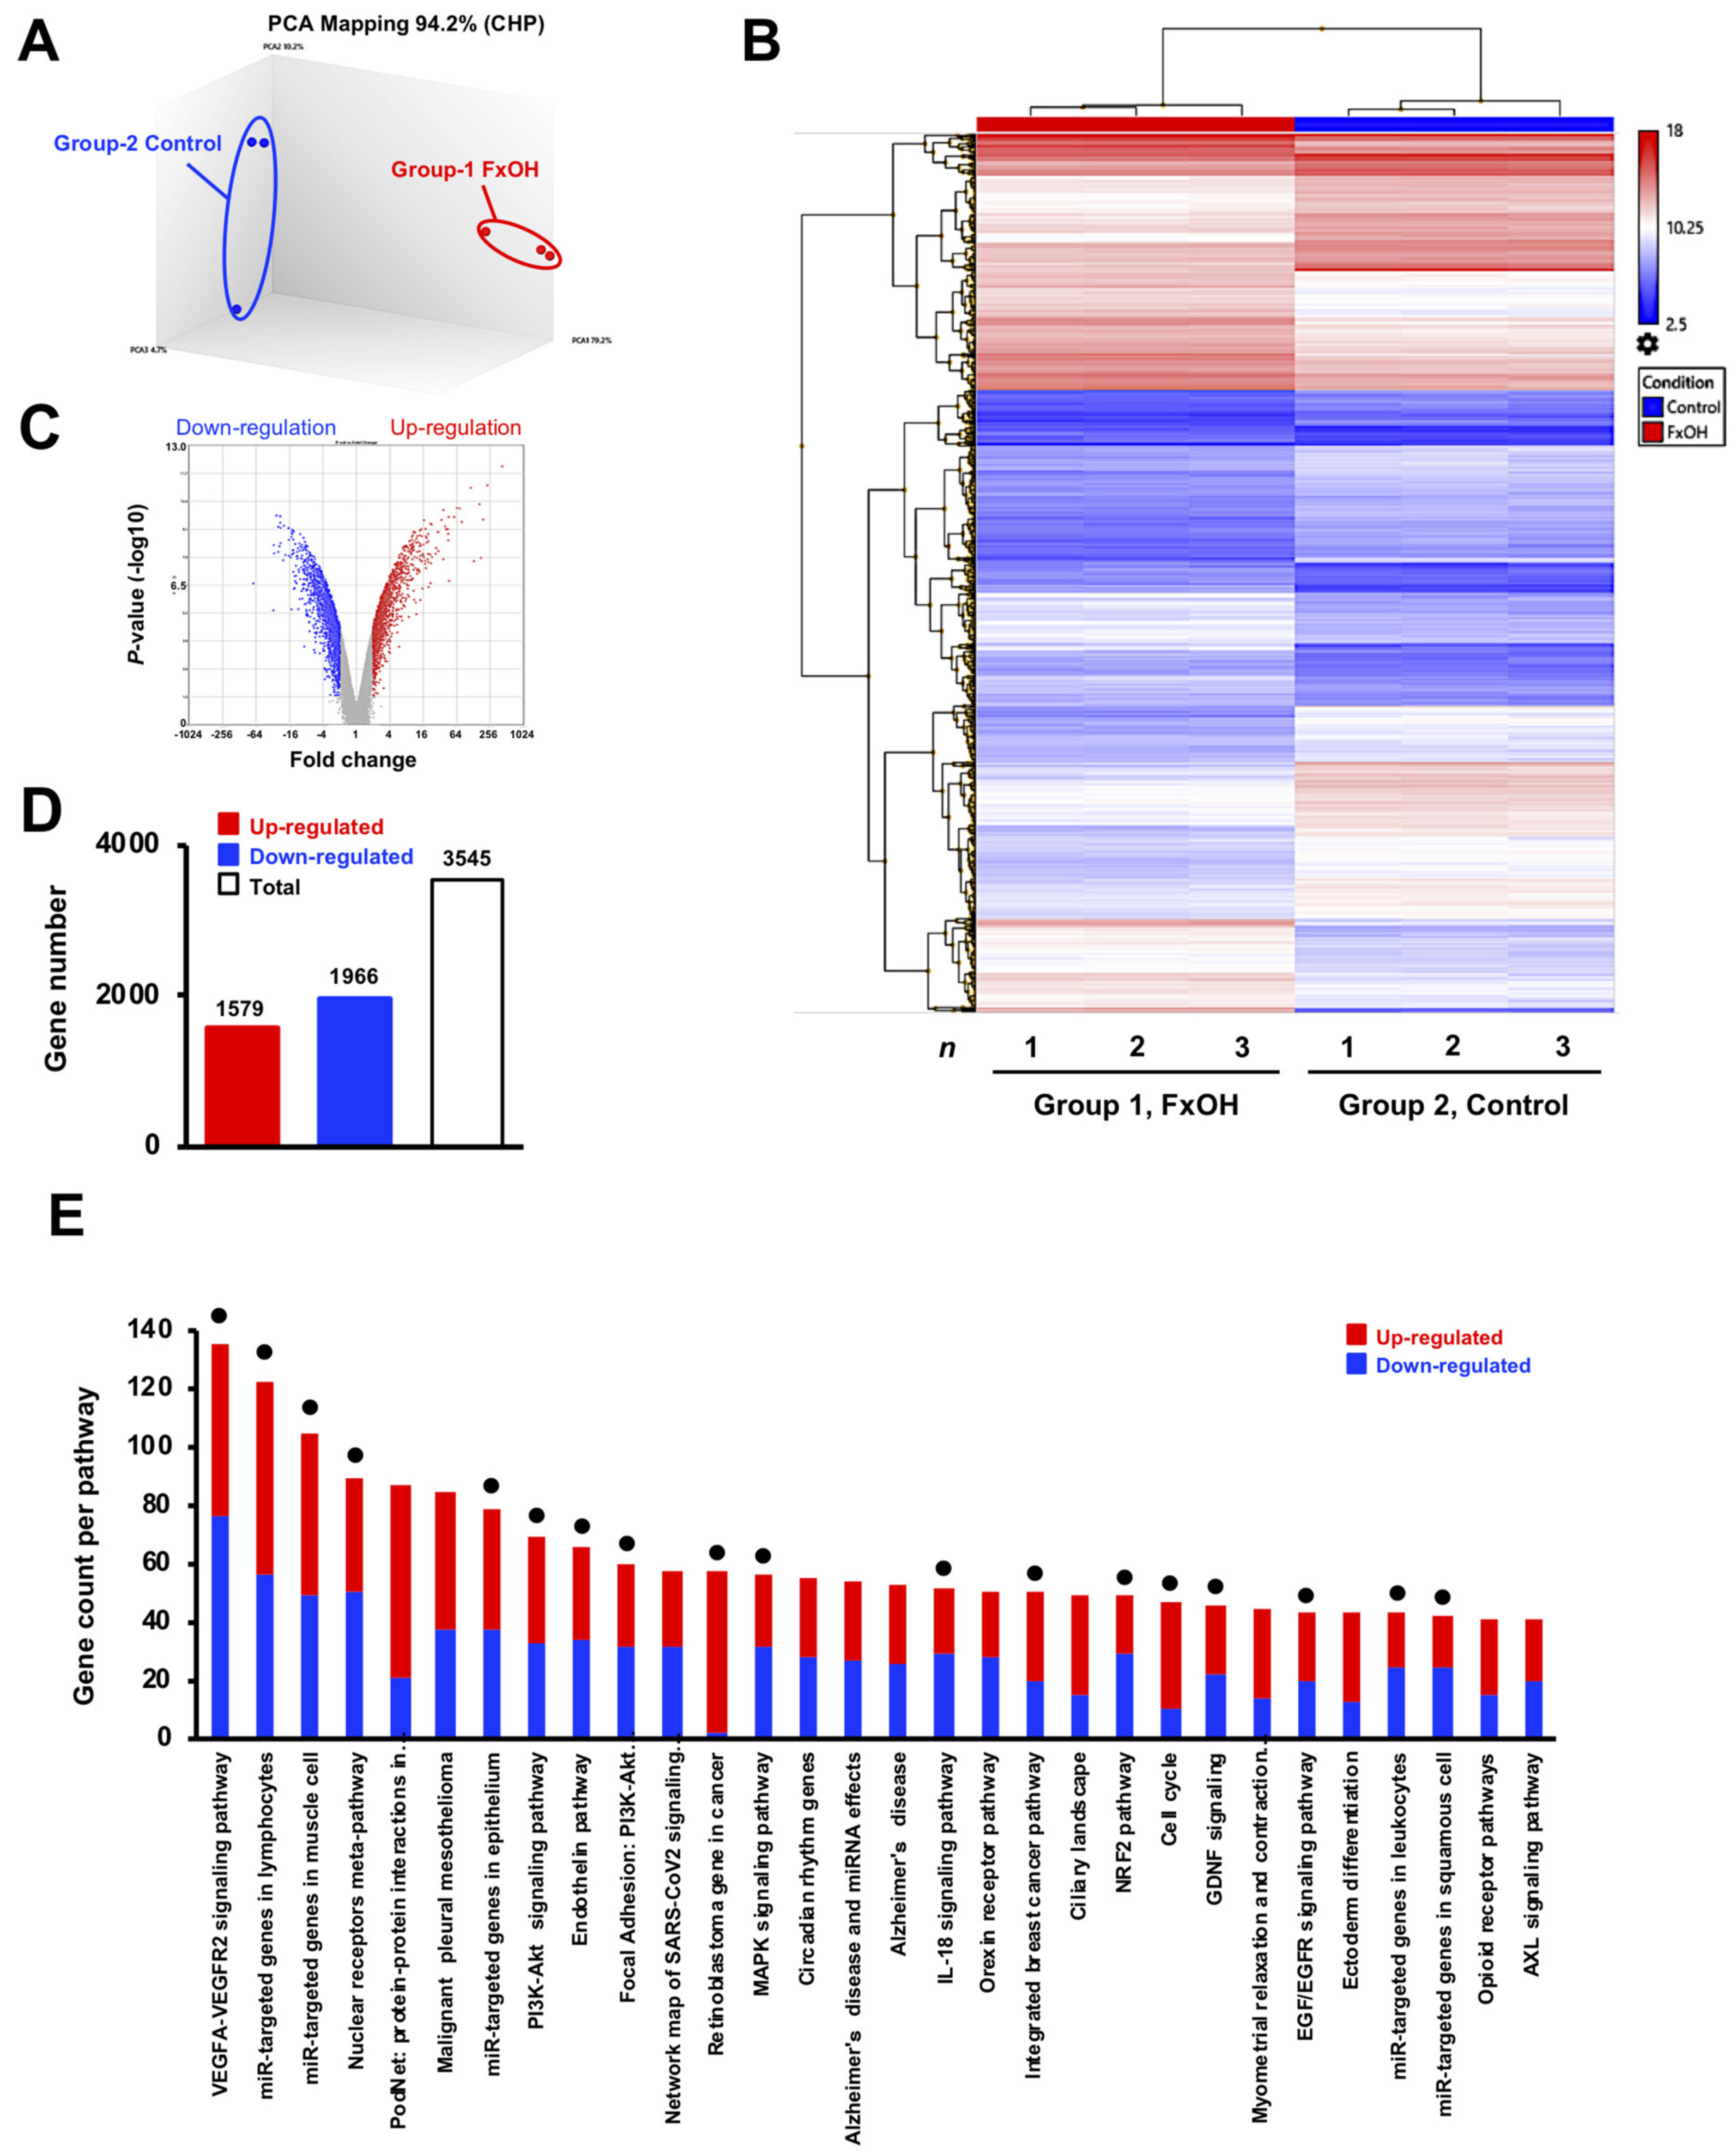
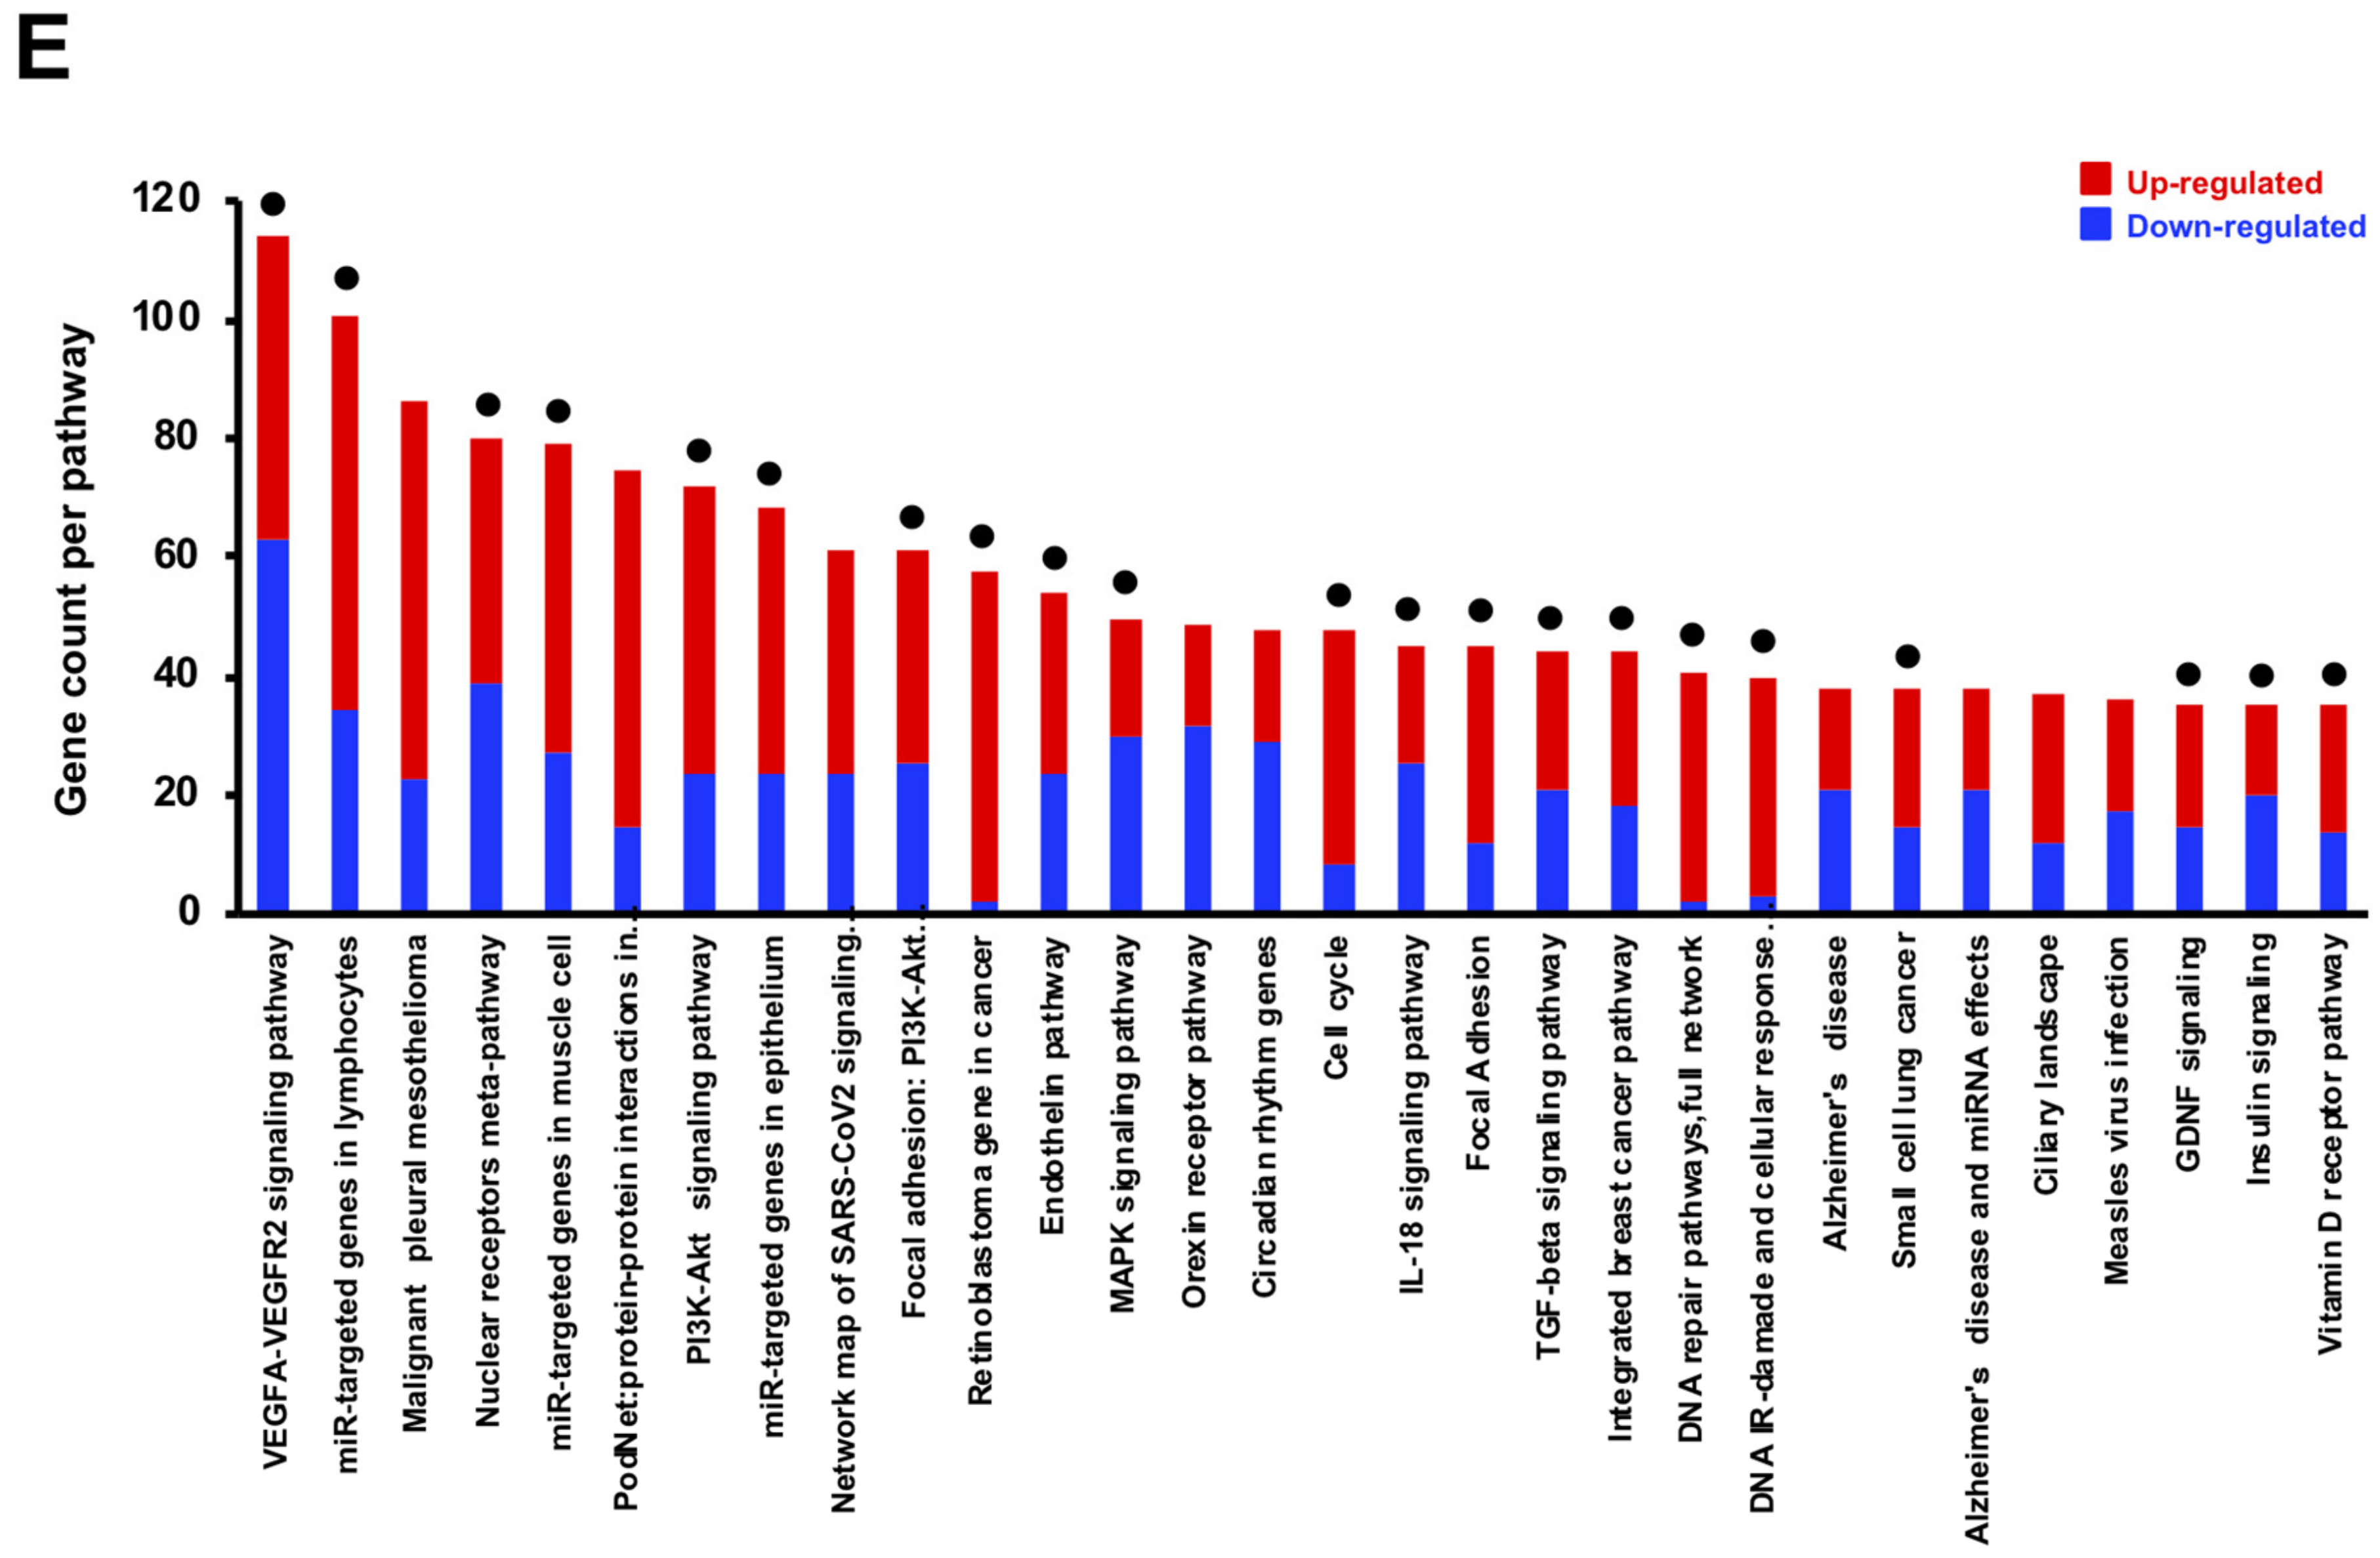
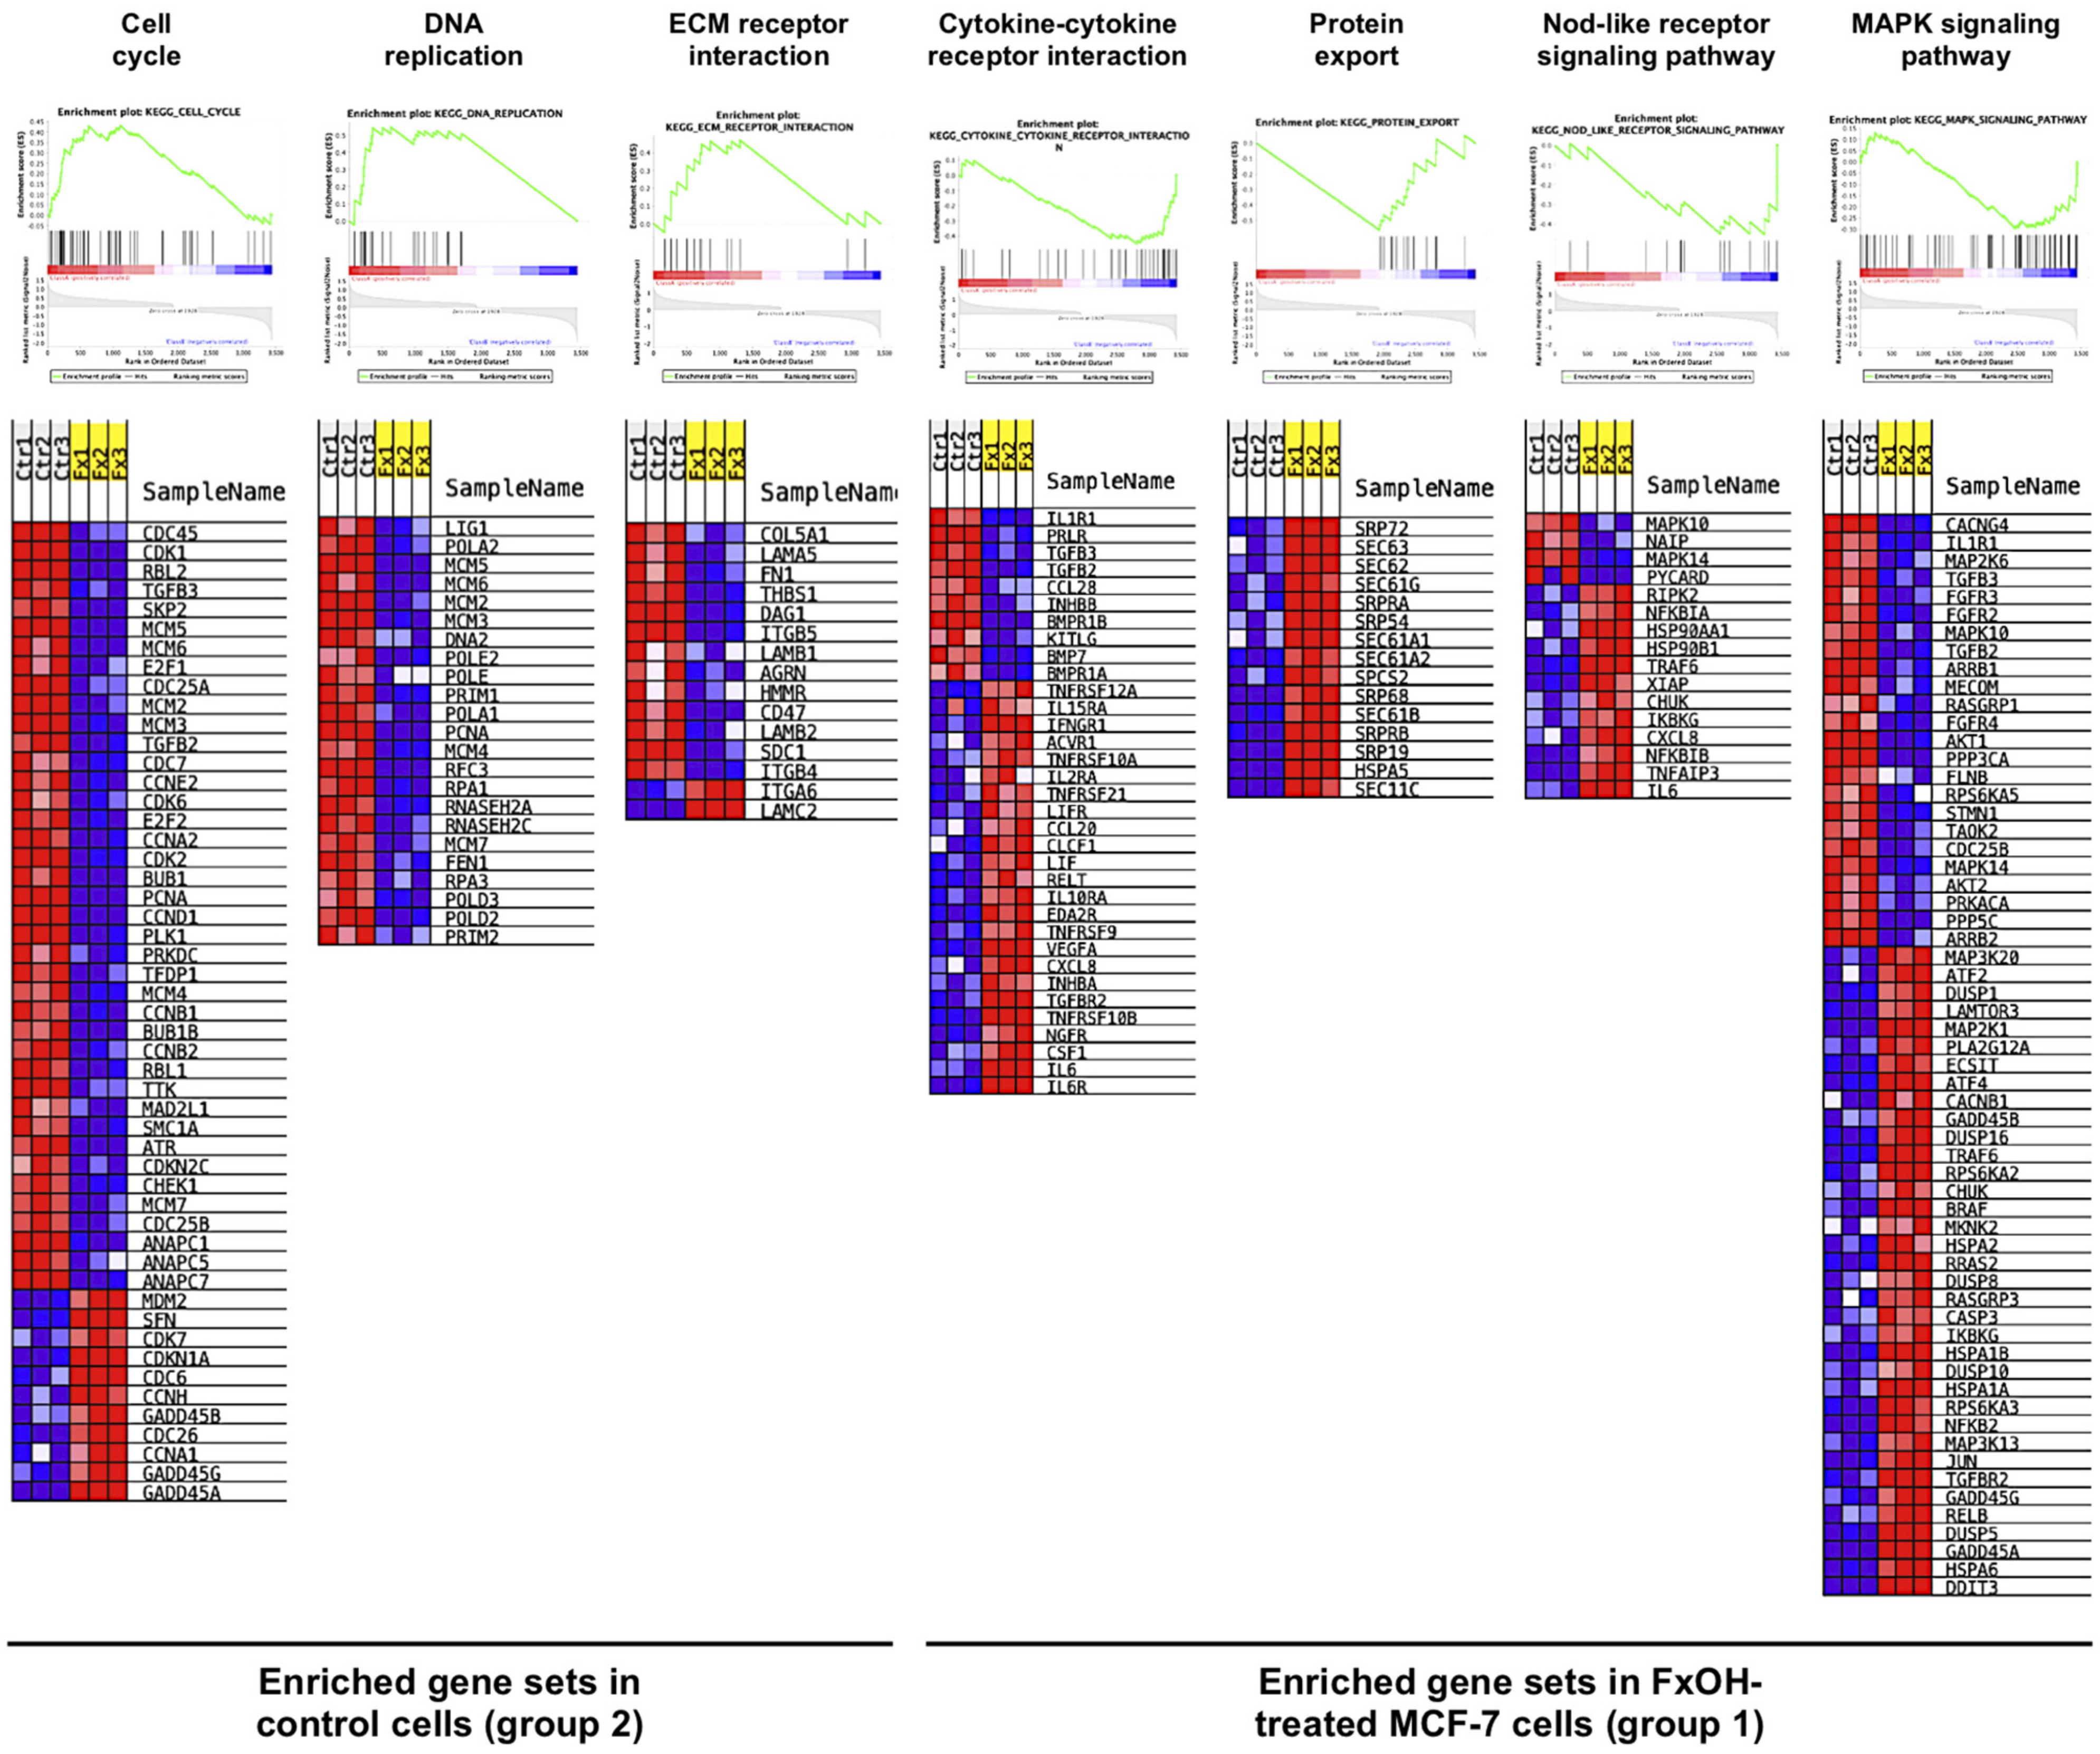
3.2. Effects of FxOH on the Transcriptome Profiles of MCF-7 Cells

Next, the effects of 20 μM FxOH on the transcriptome profiles of MCF-7 cells were evaluated. The PCoA plot revealed that the transcriptome profile of FxOH-treated cells (group 1) was distinct from that of control cells (group 2) (Figure 3A). Hierarchical cluster analysis of 3545 genes revealed different clusters between groups 1 and 2 (Figure 3B). Volcano plots of differentially expressed genes between group 1 and group 2 revealed that the frequency of significantly upregulated genes with both high fold-change and p-value was higher than that of downregulated genes (Figure 3C). However, the number of downregulated genes (1966 genes) was higher than that of upregulated genes (1579 genes) (Figure 3D). Pathway analysis demonstrated that, of the top 30 pathways, 18 were associated with cancer development, including vascular endothelial growth factor receptor (VEGFR), micro RNA regulation (miR), nuclear receptors, phosphatidylinositol-3 kinase/protein kinase B (PI3K/AKT), endothelin, adhesion, cell cycle, mitogen-activated protein kinase (MAPK), interleukin (IL)-18, integrated BC, NF-E2-related factor 2 (NRF2), glia-cell-derived neurotrophic factor (GDNF), and epidermal growth factor receptor (EGFR) (Figure 3E, black circle).

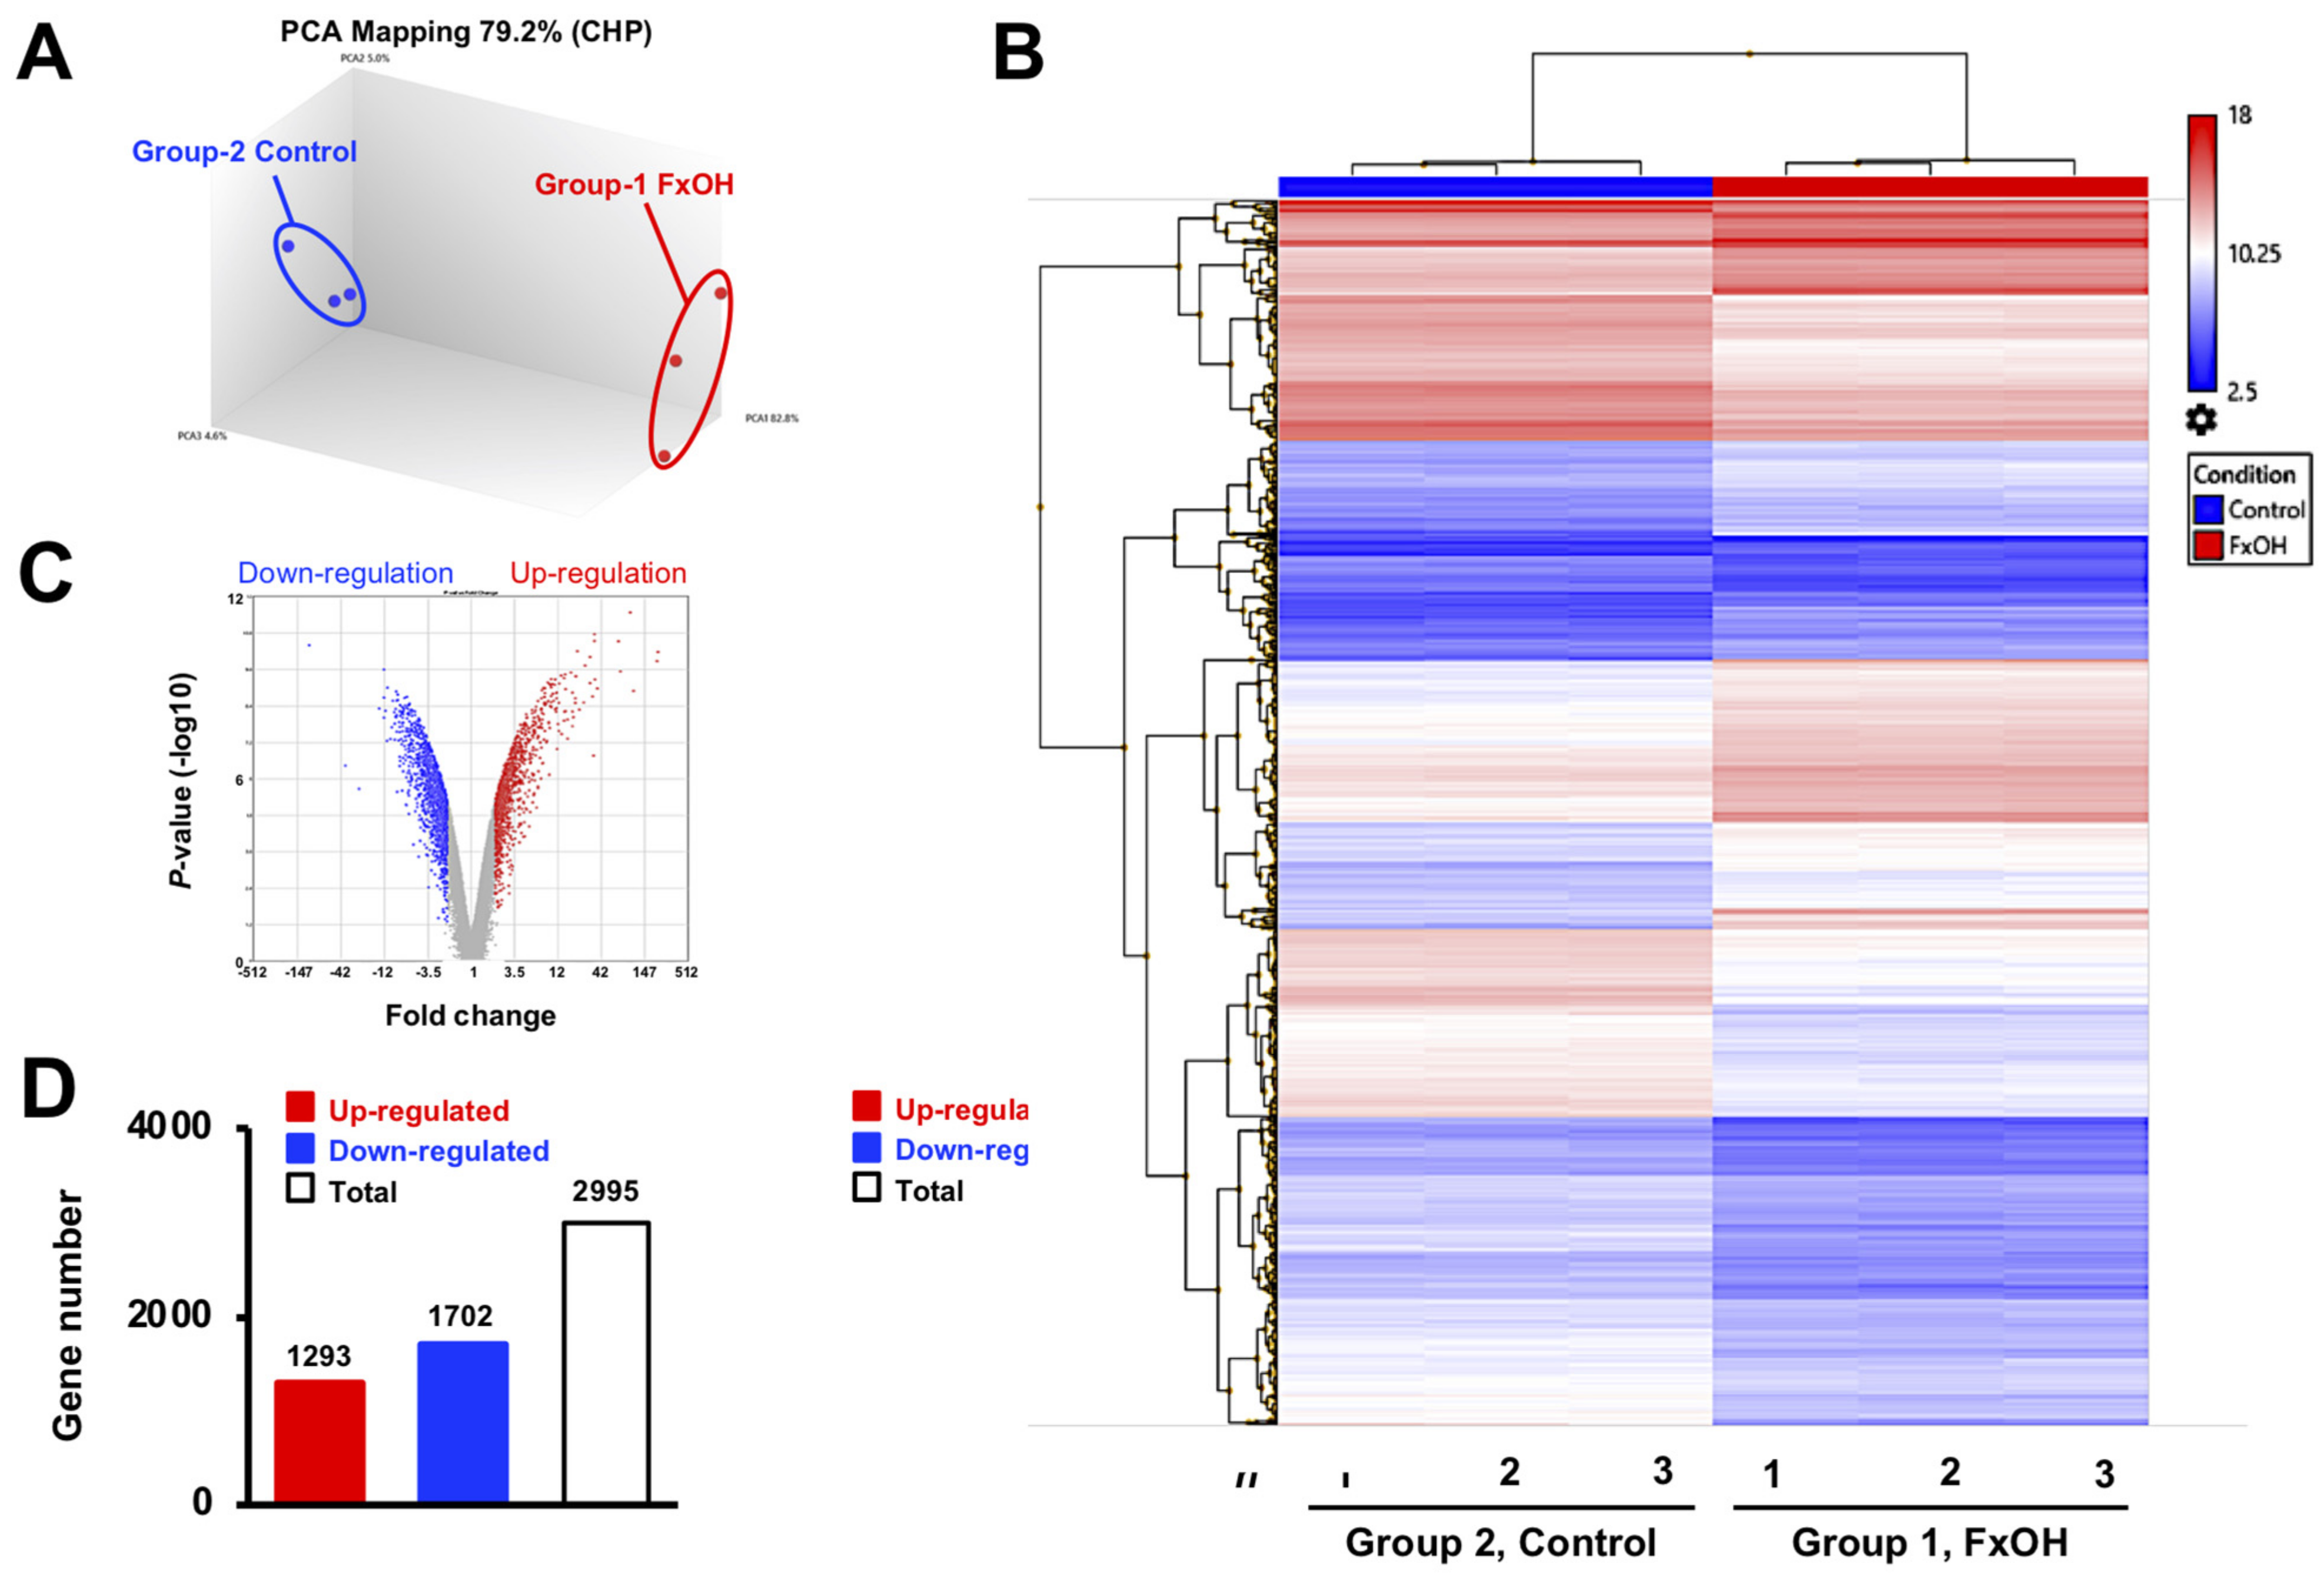
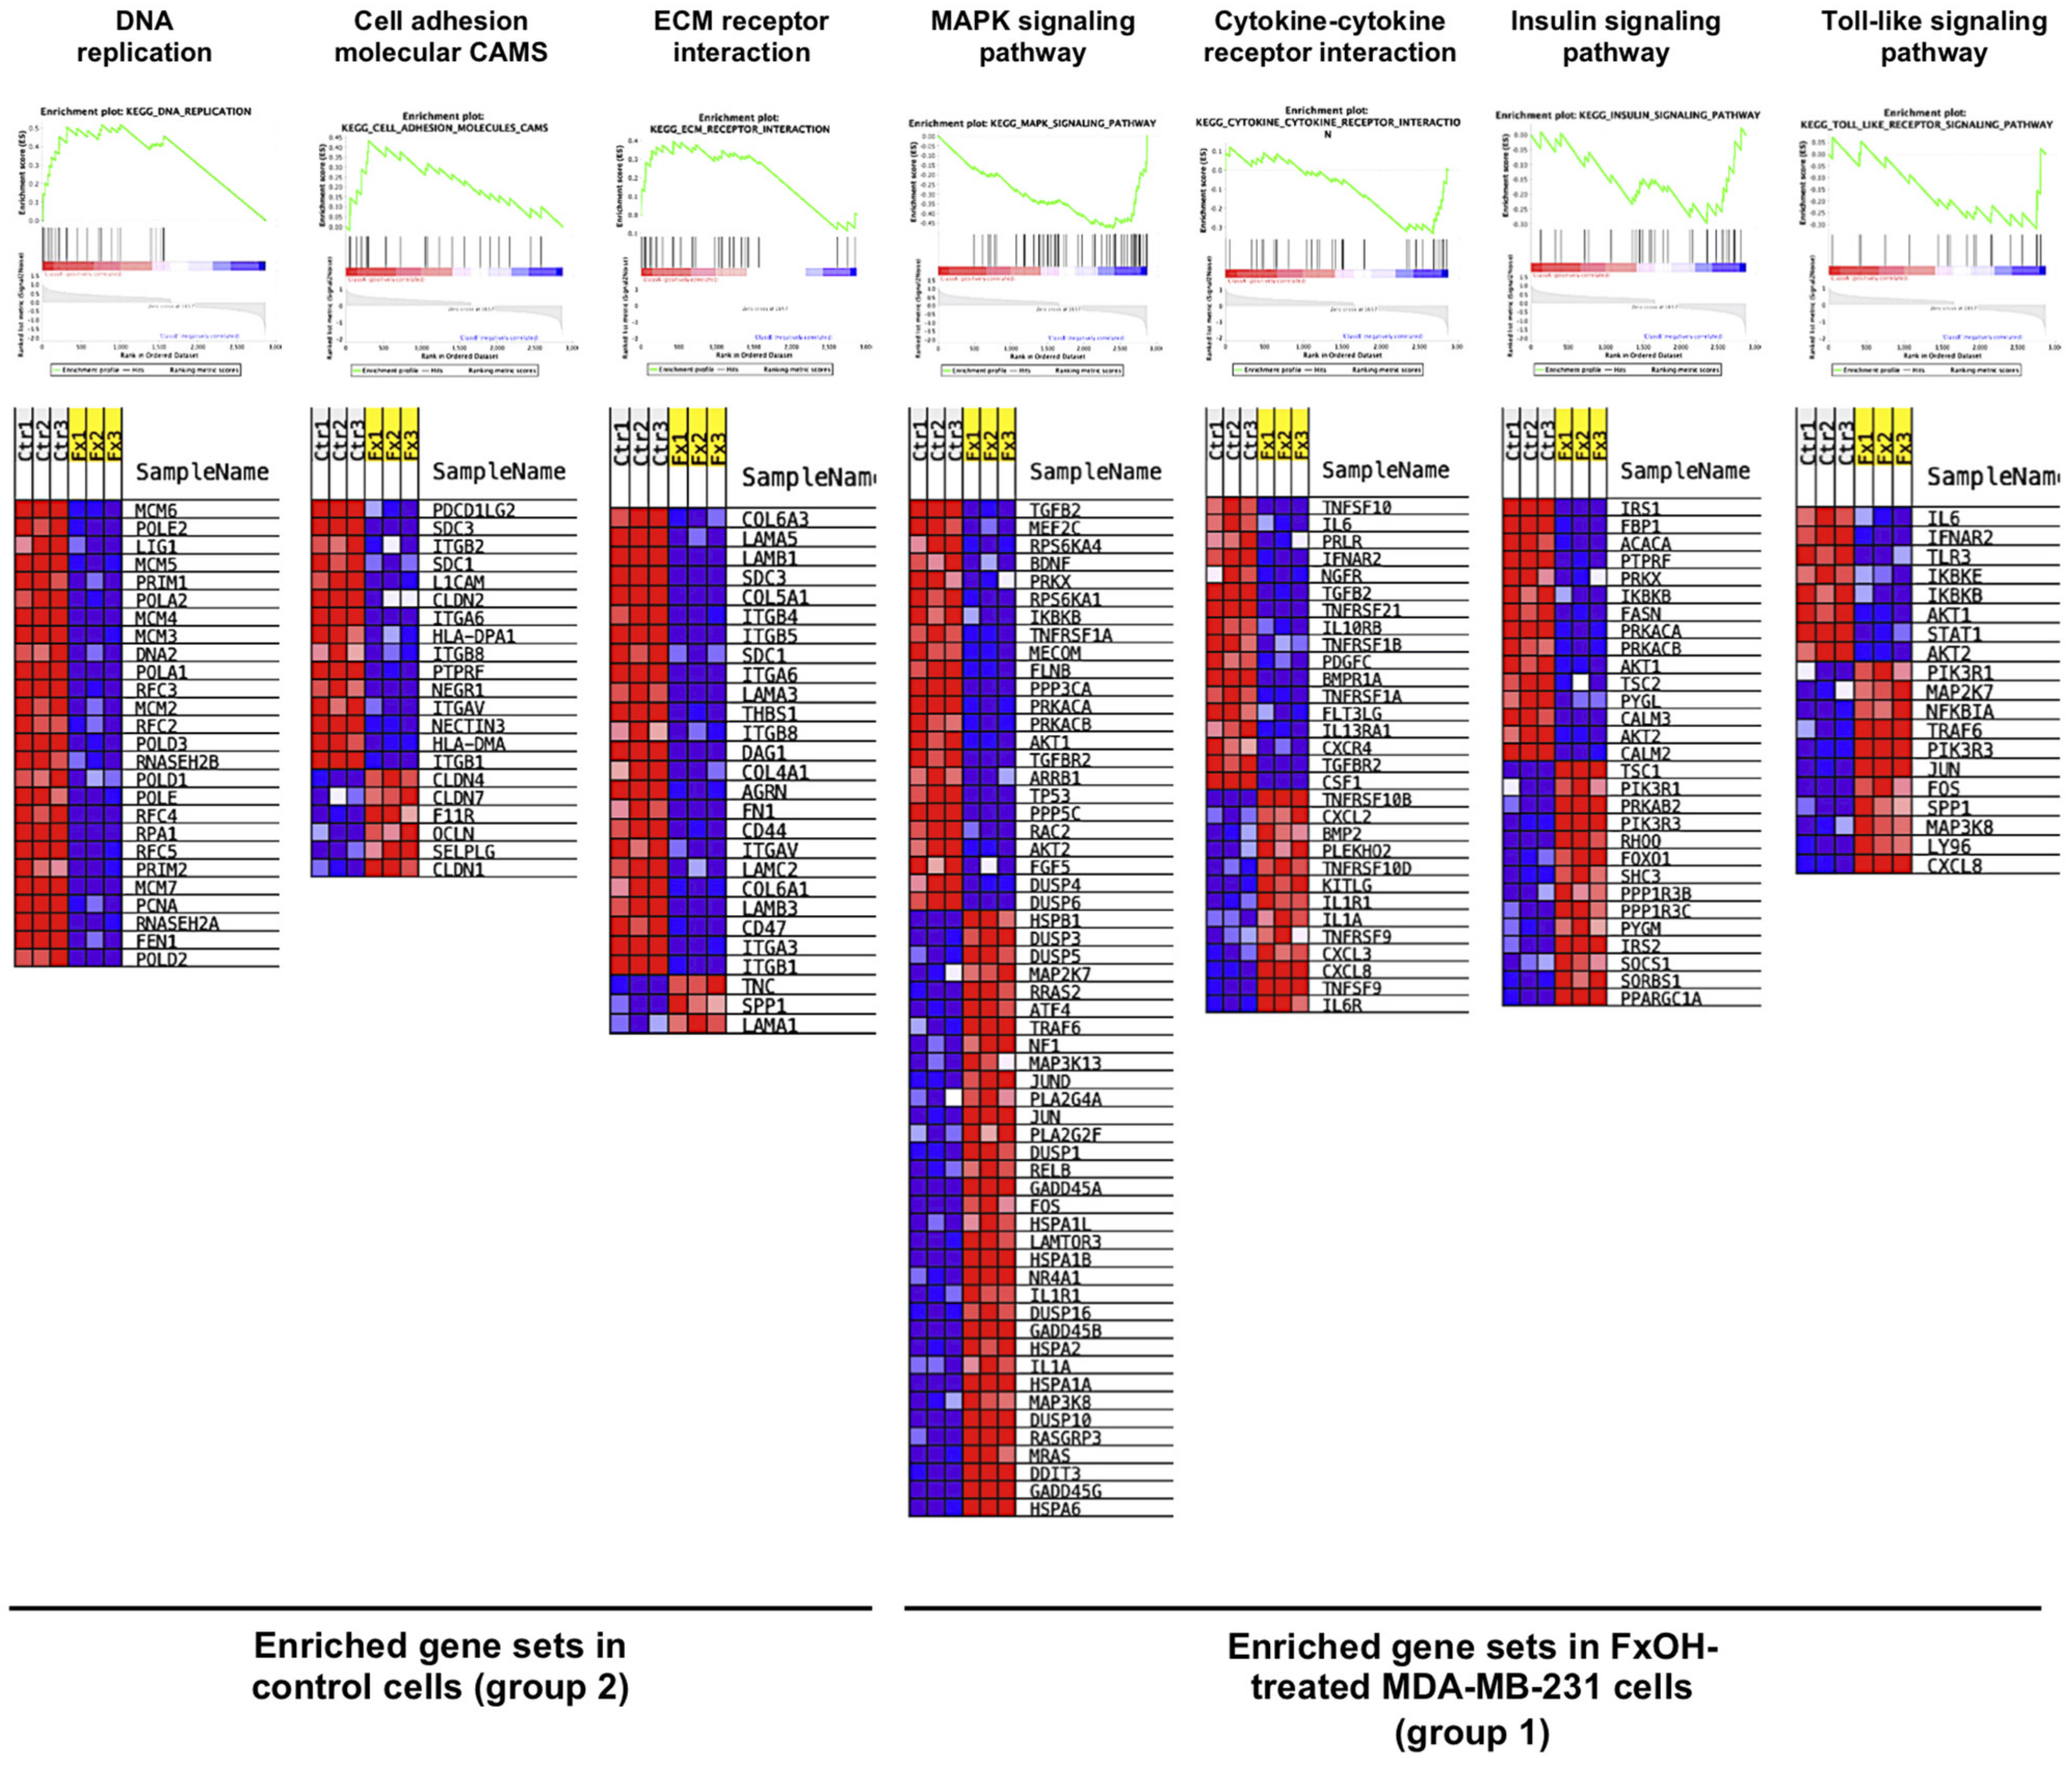
3.3. Effects of FxOH on the Transcriptome Profiles of MDA-MB-231 Cells

The effects of 20 μM FxOH on the transcriptome profiles of MDA-MB-231 cells were also evaluated. The PCoA plot revealed that the transcriptome profile of FxOH-treated cells (group 1) was distinct from that of control cells (group 2) (Figure 4A). Hierarchical clustering analysis of 2995 differentially expressed genes revealed different clusters between groups 1 and 2 (Figure 4B). Volcano plots of differentially expressed genes between groups 1 and 2 revealed that the frequency of significantly upregulated genes with both high fold-change and p-value was higher than that of downregulated genes (Figure 4C). However, the number of downregulated genes (1702 genes) was higher than that of upregulated genes (1293 genes) (Figure 4D). Pathway analysis demonstrated that, of the top 30 pathways, 21 were associated with cancer development, including VEGFR, microRNA regulation, nuclear receptors, PI3K/AKT, adhesion, cell cycle, endothelin, MAPK, IL-18, transforming growth factor (TGF)-β, integrated breast cancer, DNA repair, DNA damage, small cell lung cancer, GDNF, insulin, and vitamin D receptor (Figure 4E, black circle).

3.4. Bioinformatics Analyses of Transcriptome Profiles of FxOH-Treated MCF-7 and MDA-MB-231 Cells

GSEA of 3545 differentially expressed genes in FxOH-treated MCF-7 cells revealed that among cancer-related signaling pathways, cell cycle, DNA replication, cytokine–cytokine receptor interaction, and protein export were strongly enriched, whereas extra cellular matrix (ECM)–receptor interaction, NOD-like receptor signaling pathway, and MAPK signaling pathway were weakly enriched (Table 1 and Figure 5). Meanwhile, GSEA analysis of 2995 differentially expressed genes in FxOH-treated MDA-MB-231 cells revealed that among cancer-related signaling pathways, DNA replication and MAPK signaling pathways were strongly enriched, whereas cell adhesion molecular cell adhesion molecules (CAMS), ECM–receptor interaction, cytokine–cytokine receptor interaction, insulin signaling pathway, and toll-like receptor signaling pathway were weakly enriched (Table 2 and Figure 6).
In particular, this study focused on gene sets involved in DNA replication and ECM receptor interaction in MCF-7 and MDA-MB-231 cells, which were similarly enriched in group 2 (Table 1 and Table 2, and Figure 5 and Figure 6). The top 50 upregulated and downregulated genes in the FxOH-treated MCF-7 and MDA-MB-231 cells (fold vs. control cells) are listed along with the gene lists involved in ECM receptor interaction, in Supplementary Tables S1–S4.

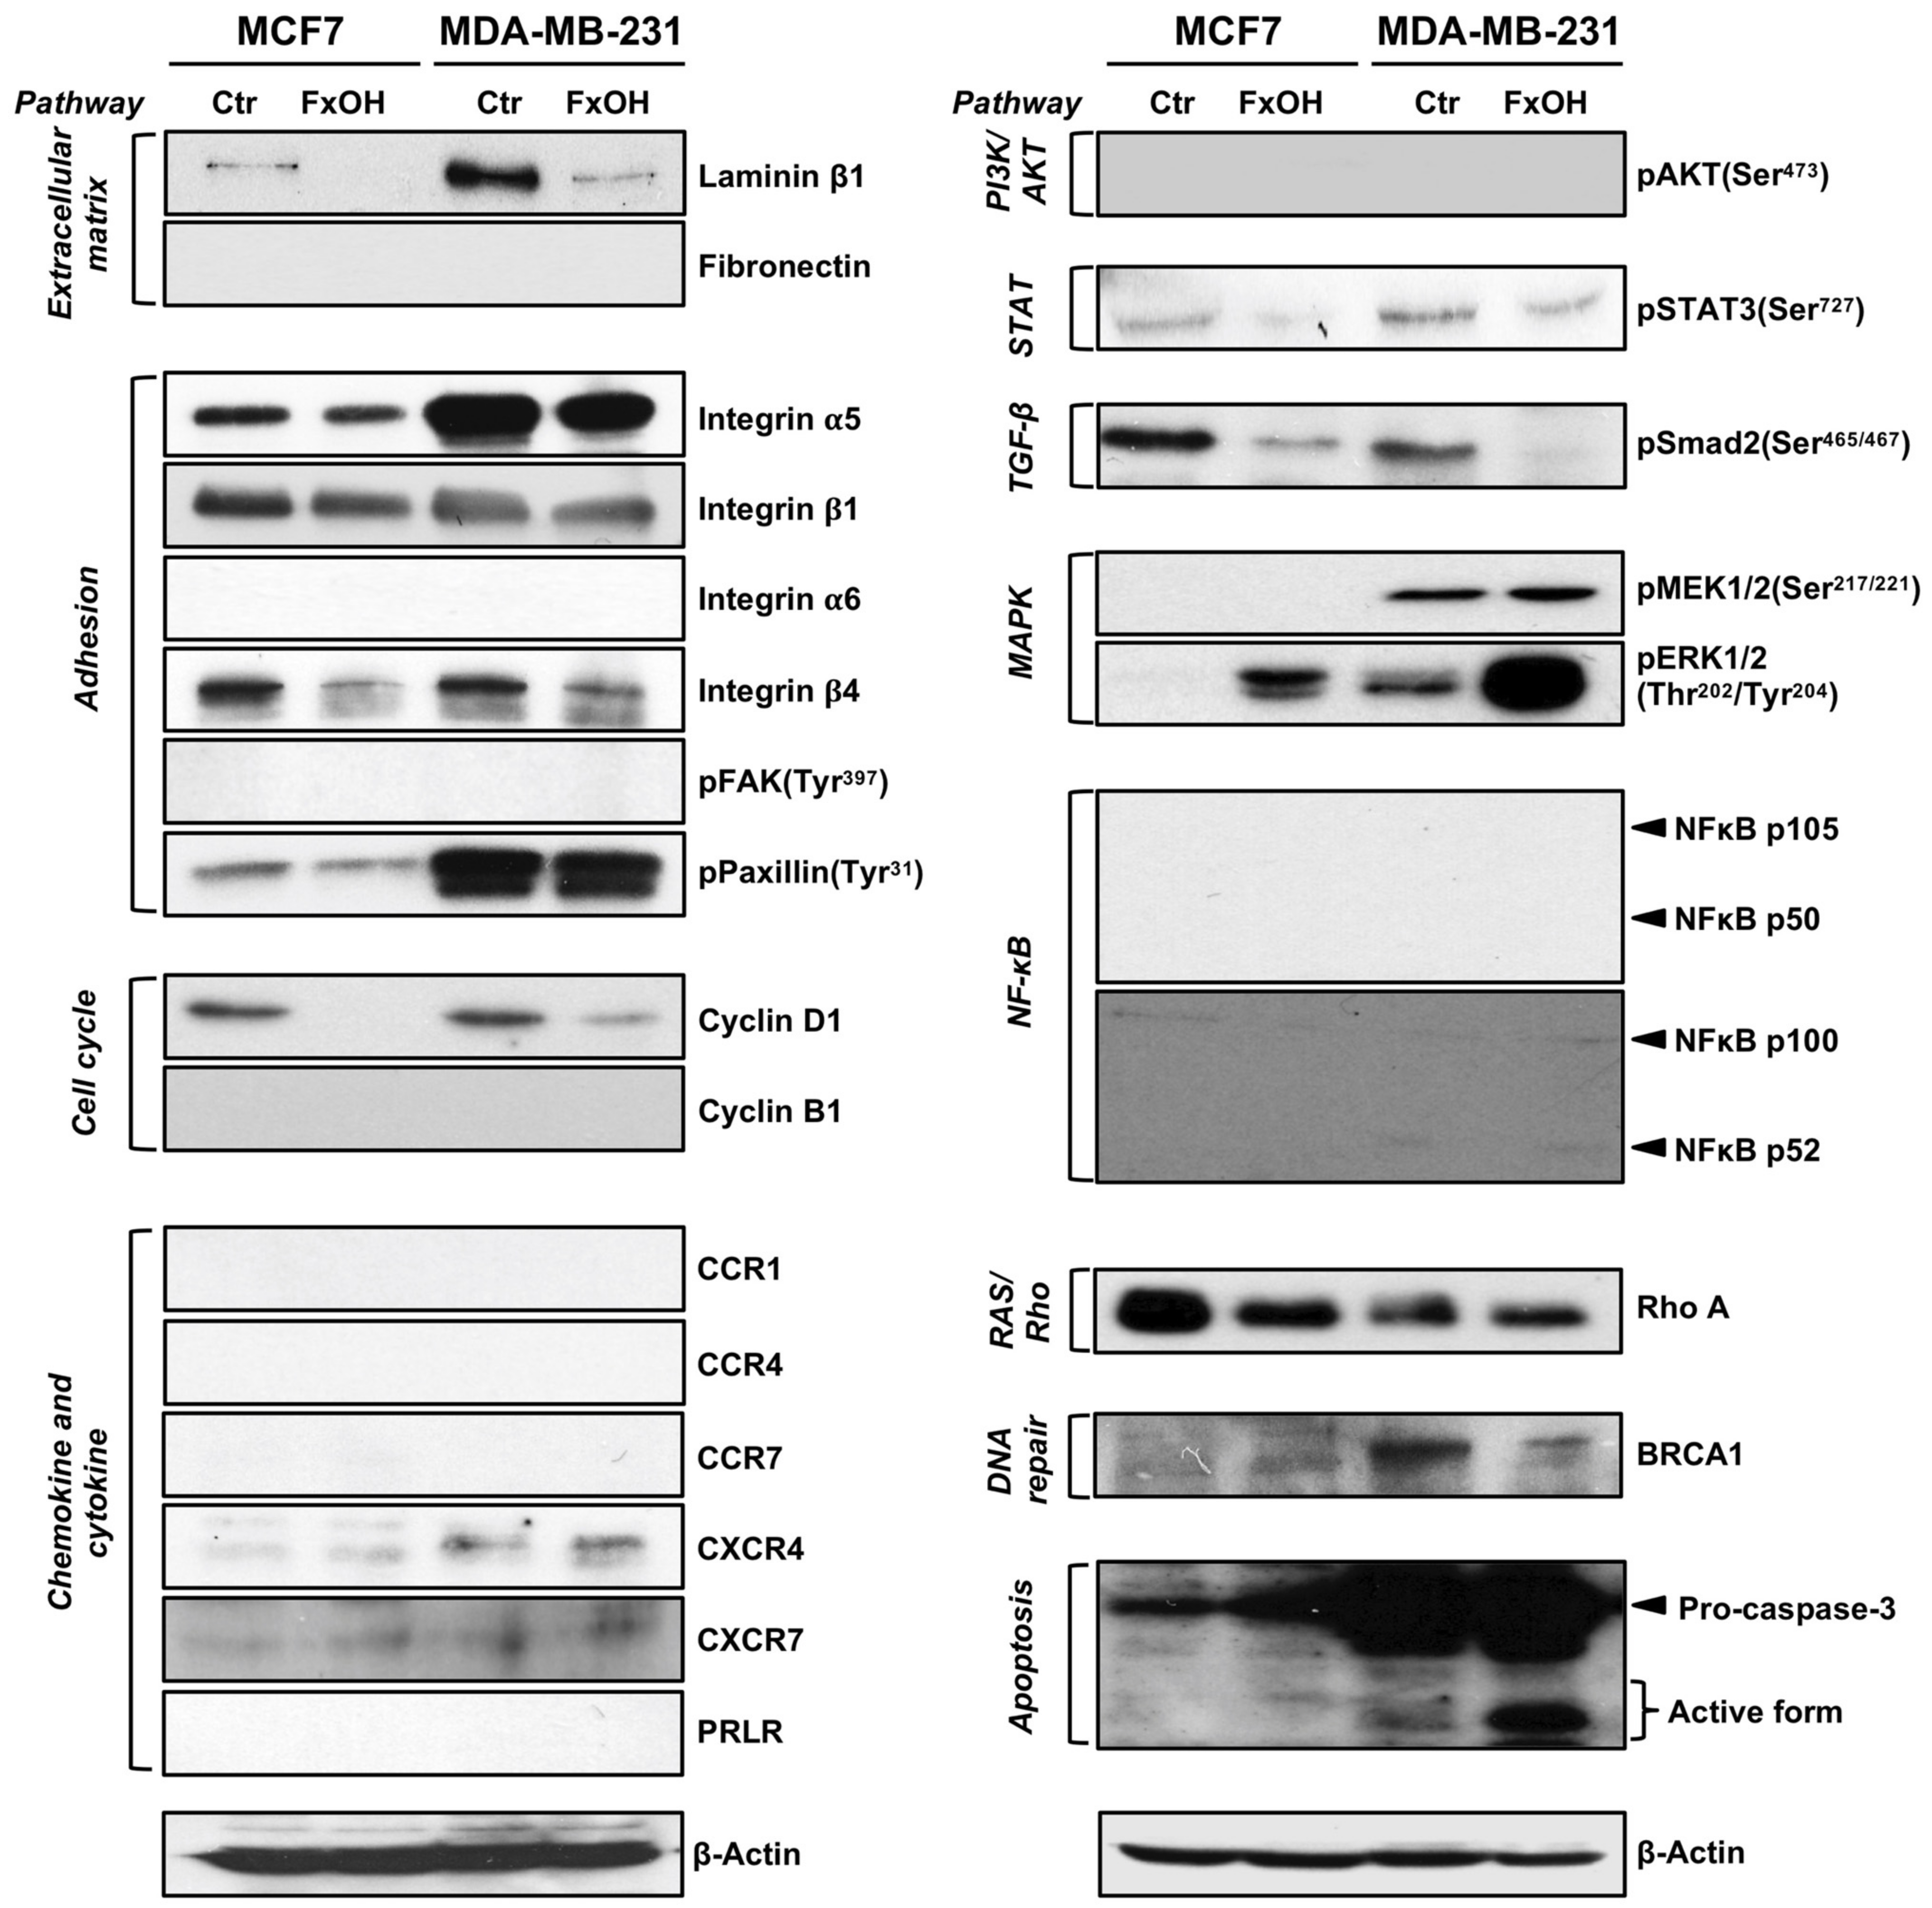
3.5. Effects of FxOH on Protein Expression and Activation in MCF-7 and MDA-MB-231 Cells

Based on the transcriptome profiles and GSEA, we confirmed the effects of FxOH on the expression of proteins relating to the ECM (laminin β1 and fibronectin), adhesion (integrin α5, β1, α6, and β4, and integrin’s downstream of pFAK(Tyr397) and pPaxillin(Tyr31)), cell cycle (cyclin D1 and B1), chemokine and cytokine (PRLR), PI3K/AKT (pAKT(Ser473)), TGF-β (pSmad2(Ser465/467)), MAPK (pMEK1/2(Ser217/221) and pERK1/2(Thr202/Tyr204)), DNA repair (BRCA1), and apoptosis (pro-caspase-3 and its active form) signals in MCF-7 and MDA-MB-231 cells with FxOH treatment. Also, the alterations of some protein relating to the chemokine and cytokine (CCR1, CCR4, CCR7, CXCR4, and CXCR7), STAT (pSTAT3(Ser727)), Ras homolog family member A (Rho A), and NF-κB (NFκB p105/p50 and p100/p52) signals were evaluated to compare with protein alterations in Fx and/or FxOH-treated breast, colorectal, and pancreatic cancer cells by the previous reports [21,22,29,30,31]. Consequently, FxOH downregulated the expression levels of laminin β1, integrin α5, integrin β1, integrin β4, cyclin D1, Rho A, pPaxillin (Tyr31), pSTAT3(Ser727), and pSmad2(Ser465/467) in both MCF-7 and MDA-MB-231 cells. In addition, FxOH upregulated the levels of pERK1/2(Thr202/Tyr204) and active form of caspase-3. FxOH downregulated the expression of BRCA1 in MDA-MB-231 cells, but not in MCF-7 cells. The expression levels of fibronectin, integrin α6, pFAK(Tyr397), cyclin B1, CCR1, CCR4, CCR7, CXCR4, CXCR7, PRLR, pAKT(Ser473), pMEK1/2(Ser217/221), NF-κB(p105/p50), and NF-κB(p100/p52) in FxOH-treated MCF-7 and MDA-MB-231 cells were not altered or detected when compared with those in control cells (Figure 7, Figure S1).

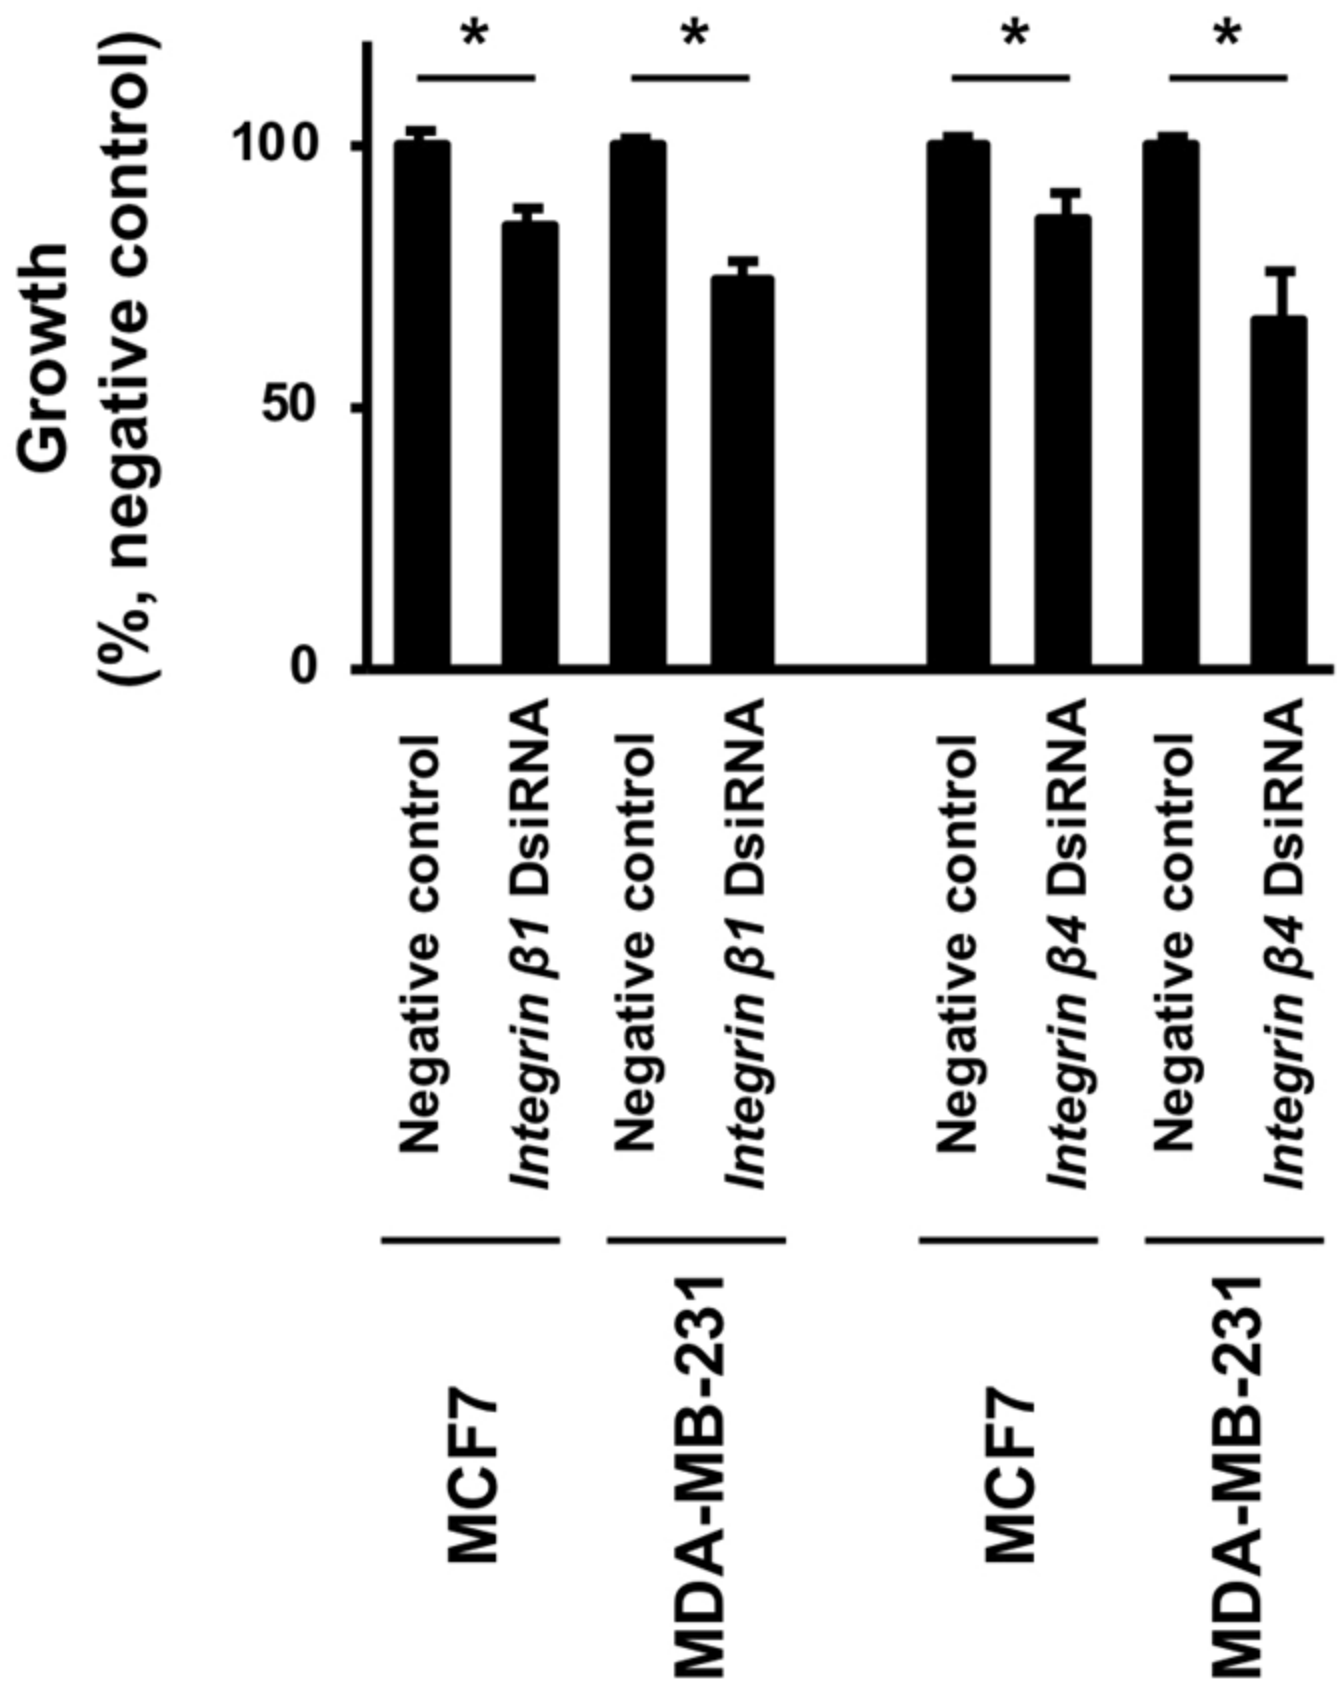
3.6. Effects of FxOH on the Cell Growth of Integrin β1 or β4 Knockdown MCF-7 and MDA-MB-231 Cells

To confirm whether the laminins–integrins axis is significant for the growth of MCF-7 and MDA-MB-231 cells, correlation between growth and integrin β1 and β4, which are central molecules for the activation of the axis, was evaluated using gene knockdown method. To knock down integrin β1 and integrin β4, cells were transfected with integrin β1 and integrin β4 dsiRNAs, respectively, for 1 day. The growth of the integrin β1 dsiRNA-transfected and integrin β4 dsiRNA-transfected groups was significantly lower than that of the NC-transfected group in both MCF-7 and MDA-MB-231 cells. The percentage of cell growth (control 100%) in the two cells were as follows: integrin β1 knockdown MCF-7 cells, 84.2% ± 3.9%; integrin β1 knockdown MDA-MB-231 cells, 74.9% ± 3.1%; integrin β4 knockdown MCF-7 cells, 86.2% ± 4.8%; and integrin β4 knockdown MDA-MB-231 cells, 66.9% ± 9.1% (Figure 8).

4. Discussion

This study demonstrated that FxOH significantly induced apoptosis in MCF-7 and MDA-MB-231 cells by suppressing core genes, proteins, and signaling pathways, especially the laminins/integrins axis. This is a novel report suggesting the comprehensive mechanisms underlying pro-apoptotic effects of FxOH in human BC cells.
To date, the information of molecular mechanisms underlying anti-proliferation and apoptosis induction by Fx and FxOH in human BC cells is fragmentary. This study demonstrated that FxOH modulated various genes and signaling pathways, and induced apoptosis in MCF-7 and MDA-MB-231 cells using microarray analysis and GSEA. These findings indicate that the pro-apoptotic effects of FxOH were modulated by several proteins and signaling pathways when compared with previously reported mediators, such as NF-κB signaling molecules, MMP2 and MMP9, VEGF-C, ABCC1, ABCB1, CYP3A4, GST, PXR, and TP53 [21,22,23,24,25]. Among the previously reported mediators, the following genes were differentially expressed in this study: FxOH-treated MCF-7 cells, NFKB2 (6.3-fold vs. control cells), RELB (4.5-fold), GSTK1 (−3.3-fold), GSTM2 (−2.1-fold), GSTM3 (−6.4-fold), and GSTM4 (−3.5-fold); FxOH-treated MDA-MB-231 cells, SOX9 (−3.2-fold), RELB (2.7-fold), GSTK1 (−3.7-fold), GSTCD (−2.8-fold), GSTM1 (−2.0-fold), GSTM2 (−2.2-fold), and GSTM4 (−2.9-fold) (data not shown in Supplementary Tables S1–S4). In the present study, NFKB2 and RELB were detected as genes containing in MAPK signal based on the KEGG pathway. Meanwhile, GSTK1, GSTCD, GSTM2, GSTM3, and GSTM4 were detected as genes containing in NRF2 signal (Figure 3 and Figure 4). SOX9 was not contained in the top 30 pathways in FxOH-treated MCF-7 or MDA-MB-231 cells. Based on microarray analysis and GSEA, we speculated that FxOH may induce apoptosis in MCF-7 and MDA-MB-231 cells through the following 12 core signals: ECM, adhesion, cell cycle, chemokine and cytokine, PI3K/AKT, STAT, TGF-β, MAPK, NF-κB, RAS/Rho, DNA repair, and apoptosis (Figure 3, Figure 4, Figure 5 and Figure 6, Table 1 and Table 2, and Supplementary Tables S1–S4). The alterations in the levels of these core proteins were confirmed in the two cell lines using microarray, GSEA, Western blotting, and gene knockdown experiments. Consequently, FxOH downregulated the levels of laminin β1, integrin α5, integrin β1, integrin β4, cyclin D1, Rho A, pPaxillin (Tyr31), pSTAT3(Ser727), pSmad2(Ser465/467), and BRCA1 (MDA-MB-231 only), and upregulated the levels of pERK1/2(Thr202/Tyr204) and the active form of caspase-3 (Figure 7 and Figure 8). Our findings suggest that FxOH induces apoptosis in FxOH-treated MCF-7 and MDA-MB-231 cells by altering the ECM–integrin axis, cell cycle, STAT, TGF-β, RAS/Rho, MAPK, and/or DNA repair signals. Previously, we demonstrated that FxOH induces apoptosis and/or anoikis (anchor-dependent cell death) in human colorectal cancer DLD-1 cells, mouse pancreatic cancer KMPC44 cells, and hamster pancreatic cancer HaPC-5 cells, by modulating the nuclear receptor, VEGF, adhesion (containing integrin signals), NRF2, MAPK, PI3K/AKT, insulin, IL-18, EGFR, and cell cycle signals, as well as by regulating microRNAs [29,30,31]. Thus, FxOH may induce apoptosis and anoikis in any cancer cells by altering some core signaling pathways.
Laminin β1, a major component of ECM proteins, forms a heterotrimeric structure with the other laminin chains, such as α and γ chains. In addition to serving as a component of basement membrane, laminin β1 is involved in tumor development, metastasis, and invasion [32,33,34]. The upregulated expression of laminin β1 in BC is positively correlated with malignancy [34]. The laminins–integrins (e.g., α3, α6, and β4) axis plays an essential role in the adhesion of epithelial cells. In particular, integrin β1 functions as a central adhesion molecule in the interactions involving laminins, collagens, and Arg-Gly-Asp (RGD) peptides [35]. The laminins–integrins axis is a critical trigger that positively or negatively regulates downstream molecules and signals, such as microtubule assembly, paxillin, FAK, steroid receptor coactivator, Ras/Rho, PI3K/AKT, MAPK, NF-κB, NRF2, TP53, mitochondrial apoptosis pathway, reactive oxygen species production, and microRNA regulation [36,37,38]. Aberrant regulation of integrin signaling in the tumor microenvironment is associated with the enhancement of stemness, epithelial–mesenchymal transition, and anoikis resistance in cancer epithelial cells, which enables the accumulation of inflammatory cells and cancer-associated fibroblasts in tumor tissues [36,39]. In the present study, the several other genes encoding laminins, collagens, and integrins are downregulated in FxOH-treated MCF-7 and MDA-MB-231 cells, in addition to genes encoding laminin β1, integrin α5, integrin β1, and integrin β4 (Figure 7 and Figure S1, Tables S2 and S4). Therefore, it was suggested that the suppression of the ECM-adhesion signal was a key biological process for apoptosis or anoikis induction in the FxOH-treated MCF-7 and MDA- MB-231 cells. Interestingly, the activation of ERK1/2 was observed in the both FxOH-treated MCF-7 and MDA-MB-231 cells (Figure 7 and Figure S1). Recently, increasing evidence demonstrated that the activation of ERK regulates dual functions of cell growth and apoptosis in cancer cells by various regulatory factors. Sugiura et al. reported that many natural compounds, such as γ-tocotrienol, curcumin, and shikonin, induced apoptosis with ERK activation [40]. The downregulations of some ERK-suppressing phosphatases, such as serine/threonine phosphatases, tyrosine phosphatases, and dual-specificity phosphatases, leads to ERK1/2 activation in the cytoplasm and nucleus, followed by the induction of apoptosis in cancer cells [40,41]. These ERK-suppressing phosphatases may contribute to the ERK1/2 activation in the FxOH-treated MCF-7 and MDA-MB-231 cells. Furthermore, FxOH downregulated BRCA1 expression in MDA-MB-231 cells, but not in MCF-7 cells (Figure 7 and Figure S1). The inheritable mutation in BRCA1, a DNA break repair protein-encoding gene, is a risk factor for BC [42,43,44]. However, the reasons for differential regulation of BRCA1 by FxOH in MDA-MB-231 and MCF-7 cells are unclear. In addition, FxOH enhances the chromatin condensations, nuclear fragmentations, sub-G1 ratios, and caspase-3 activations in both cells, with the significant downregulation of many genes relating to DNA repair and damage (Figure 2B,C, Figure 3E, Figure 4E, Figure 7 and Figure S1). These results were consistent with the previous data on MCF-7 and MDA-MB-231 cells [21,22]. The alteration of DNA damage and repair signals may be the frequently altering signals during apoptosis induction in MDA-MB-231 and MCF-7 cells with FxOH treatment.
BC is classified into different subtypes: luminal A, luminal B, HER2-enriched, normal-like, and several types of triple negative breast cancers (TNBCs), based on the expression status of estrogen receptors (ERα), human epidermal growth factor receptor 2 (HER2), progesterone receptors (PR), and others. The clinical outcome of TNBCs (ERα, HER2, and PR), which constitute 10%–20% of all BCs, is poorer than those of other subtypes [45,46,47,48,49,50,51]. The subtype and molecular characteristics of the cell lines used in this study are as follows: MCF-7 cells, luminal A subtype, ER+, PR+, HER2, BRCA1wildtype, and TP53wildtype; MDA-MB-231 cells, TNBC subtype, BRCA1wildtype, and TP53mutant [52,53]. Additionally, the invasive capacity of MDA-MB-231 cells is higher than that of MCF-7 cells [54]. These findings indicate that the molecular profiles and malignant properties of MCF-7 cells are distinct from those of MDA-MB-231 cells, which may explain the differential susceptibility of the two cell lines to FxOH. The anti-proliferative effect of FxOH on MDA-MB-231 cells was higher than that on MCF-7 cells (Figure 2A). However, we speculated that FxOH induced apoptosis in both cell types through similar mechanisms, irrespective of cellular characteristics, such as ER, PR, HER2, BRCA1, TP53, and invasion. ECM–integrins are key targets for FxOH. FxOH induces apoptosis or anoikis in human colorectal, mouse pancreatic, and hamster pancreatic cancer cells by attenuating integrin signals [29,30,31,55]. Additionally, FxOH downregulates a chloride intracellular channel 4 signal involved in integrin trafficking and cell adhesion [56]. FxOH may also attenuate the ECM–integrin axis by regulating the trafficking of integrins to the cellular membrane. Furthermore, Fx exerts an anti-fibrotic effect in nasal polyp-derived fibroblasts by suppressing ECM, TGF-β, and PI3K/AKT signaling [57]. Fx and FxOH may target the ECM, irrespective of the cell type. Further investigations are needed to elucidate the molecular mechanisms underlying the effects of FxOH on human BC cells.

5. Conclusions

In addition to inducing apoptosis, FxOH modulated the expression levels of 3545 and 2995 genes in MCF-7 and MDA-MB-231 cells, respectively. FxOH modulated some core signaling pathways, such as ECM, adhesion, cell cycle, chemokine and cytokine, PI3K/AKT, STAT, TGF-β, MAPK, NF-κB, RAS/Rho, DNA repair, and apoptosis in MCF-7 and/or MDA-MB-231 cells. In particular, FxOH downregulated the protein expression and activation levels of modulators (laminin β1, integrin α5, integrin β1, integrin β4, cyclin D1, Rho A, pPaxillin (Tyr31), pSTAT3(Ser727), and pSmad2(Ser465/467)) involved in these signals. Additionally, FxOH upregulated the levels of pERK1/2(Thr202/Tyr204) and the active form of caspase-3. BRCA1 expression was reduced only in FxOH-treated MDA-MB-231 cells. Furthermore, integrin β1 and β4 knockdowns significantly inhibited the growth of both cell lines. These results suggest that FxOH induces apoptosis in MCF-7 and MDA-MD-231 cells by modulating several core signals, especially the laminins–integrins axis, and the downstream of cell cycle, STAT, TGF-β, RAS/Rho, MAPK, and/or DNA repair signals.

Supplementary Materials

The following are available online at https://www.mdpi.com/article/10.3390/onco2030010/s1, Figure SI: uncropped western blots, Table S1: Upregulated gene profile in human breast cancer MCF-7 cells with fucoxanthinol (FxOH) treatment, Table S2: Downregulated gene profile in human breast cancer MCF-7 cells with fucoxanthinol (FxOH) treatment, Table S3: Upregulated gene profile in human breast cancer MDA-MB-231 cells with fucoxanthinol (FxOH) treatment, Table S4: Downregulated gene profile in human breast cancer MDA-MB-231 cells with fucoxanthinol (FxOH) treatment.

Author Contributions

A.Y. and M.T. conceived and designed the study. A.Y., W.M., M.W., T.O., H.M. and M.T. performed the experiments. A.Y. prepared the manuscript. A.K., H.K. and J.H. reviewed and edited the manuscript. All authors have read and agreed to the published version of the manuscript.

Funding

This study was partly supported in part by the Japan Society for the Promotion of Science KAKENHI (20K05879).

Institutional Review Board Statement

Not applicable.

Informed Consent Statement

Not applicable.

Data Availability Statement

Most data provided on the study is included in the manuscript. More data is available upon reasonable request.

Conflicts of Interest

The authors declare no conflict of interest.

References

  1. Sung, H.; Ferlay, J.; Siegel, R.; Laversanne, M.; Soerjomataram, I.; Jemal, A.; Bray, F. Global cancer statistics 2020: GLOBOCAN estimates of incidence and mortality worldwide for 36 cancers in 185 countries. CA Cancer J. Clin. 2021, 71, 209–249. [Google Scholar] [CrossRef] [PubMed]
  2. Rahib, L.; Wehner, M.R.; Matrisian, L.M.; Nead, K.T. Estimated projection of US cancer incidence and death to 2040. JAMA Netw. Open 2021, 4, e214708. [Google Scholar] [CrossRef] [PubMed]
  3. American Cancer Society. Breast Cancer; American Cancer Society: Atlanta, GA, USA, 2021; Available online: https://www.cancer.org/cancer/breast-cancer.html (accessed on 3 June 2022).
  4. Miller, N.J.; Sampson, J.; Candeias, L.P.; Bramley, P.M.; Rice-Evans, C.A. Antioxidant activities of carotenes and xanthophylls. FEBS Lett. 1996, 384, 240–242. [Google Scholar] [CrossRef] [Green Version]
  5. Di Mascio, P.; Kaiser, S.; Sies, H. Lycopene as the most efficient biological carotenoid singlet oxygen quencher. Arch. Biochem. Biophys. 1989, 274, 532–538. [Google Scholar] [CrossRef]
  6. World Cancer Research Fund/American Institute for Cancer Research. Diet, Nutrition, Physical Activity and Cancer: A Global Perspective, a Summary of the Third Expert Report; World Cancer Research Fund (WCRF) International; WCRF International: London, UK, 2018; p. 38. [Google Scholar]
  7. Mikami, K.; Hosokawa, M. Biosynthesis pathway and health benefits of fucoxanthin, an algae-specific xanthophyll in brown seaweeds. Int. J. Mol. Sci. 2013, 14, 13763–13781. [Google Scholar] [CrossRef] [Green Version]
  8. Terasaki, M.; Kubota, A.; Kojima, H.; Maeda, H.; Miyashita, K.; Kawagoe, C.; Mutoh, M.; Tanaka, T. Fucoxanthin and colorectal cancer prevention. Cancers 2021, 13, 2379. [Google Scholar] [CrossRef]
  9. Tavares, R.S.N.; Maria-Engler, S.S.; Colepicolo, P.; Debonsi, H.M.; Schäfer-Korting, M.; Marx, U.; Gaspar, L.R.; Zoschke, C. Skin irritation testing beyond tissue viability: Fucoxanthin effects on inflammation, homeostasis, and metabolism. Pharmaceutics 2020, 12, 136. [Google Scholar] [CrossRef] [Green Version]
  10. Beppu, F.; Niwano, Y.; Tsukui, T.; Hosokawa, M.; Miyashita, K. Single and repeated oral dose toxicity study of fucoxanthin (FX), a marine carotenoid, in mice. J. Toxicol. Sci. 2009, 34, 501–510. [Google Scholar] [CrossRef] [Green Version]
  11. Asai, A.; Yonekura, L.; Nagao, A. Low bioavailability of dietary epoxyxanthophylls in humans. Br. J. Nutr. 2008, 100, 273–277. [Google Scholar] [CrossRef] [Green Version]
  12. Hashimoto, T.; Ozaki, Y.; Mizuno, M.; Yoshida, M.; Nishitani, Y.; Azuma, T.; Komoto, A.; Maoka, T.; Tanino, Y.; Kanazawa, K. Pharmacokinetics of fucoxanthinol in human plasma after the oral administration of kombu extract. Br. J. Nutr. 2012, 107, 1566–1569. [Google Scholar] [CrossRef]
  13. Yonekura, L.; Kobayashi, M.; Terasaki, M.; Nagao, A. Keto-carotenoids are the major metabolites of dietary lutein and fucoxanthin in mouse tissues. J. Nutr. 2010, 140, 1824–1831. [Google Scholar] [CrossRef]
  14. Shiratori, K.; Ohgami, K.; Ilieva, I.; Jin, X.H.; Koyama, Y.; Miyashita, K.; Yoshida, K.; Kase, S.; Ohno, S. Effects of fucoxanthin on lipopolysaccharide-induced inflammation in vitro and in vivo. Exp. Eye Res. 2005, 81, 422–428. [Google Scholar] [CrossRef]
  15. Hitoe, S.; Shimoda, H. Seaweed fucoxanthin supplementation improves obesity parameters in mild obese Japanese subjects. Funct. Foods Health Dis. 2017, 7, 246–262. [Google Scholar] [CrossRef]
  16. Mikami, N.; Hosokawa, M.; Miyashita, K.; Sohma, H.; Ito, Y.M.; Kokai, Y. Reduction of HbA1c levels by fucoxanthin-enriched akamoku oil possibly involves the thrifty allele of uncoupling protein 1 (UCP1): A randomised controlled trial in normal-weight and obese Japanese adults. J. Nutr. Sci. 2017, 6, e5. [Google Scholar] [CrossRef] [Green Version]
  17. Sachindra, N.M.; Sato, E.; Maeda, H.; Hosokawa, M.; Niwano, Y.; Kohno, M.; Miyashita, K. Radical scavenging and singlet oxygen quenching activity of marine carotenoid fucoxanthin and its metabolites. J. Agric. Food Chem. 2007, 55, 8516–8522. [Google Scholar] [CrossRef]
  18. Sugawara, T.; Matsubara, K.; Akagi, R.; Mori, M.; Hirata, T. Antiangiogenic activity of brown algae fucoxanthin and its deacetylated product, fucoxanthinol. J. Agric. Food Chem. 2006, 54, 9805–9810. [Google Scholar] [CrossRef]
  19. Nishino, H.; Murakoshi, M.; Tokuda, H.; Satomi, Y. Cancer prevention by carotenoids. Arch. Biochem. Biophys. 2009, 483, 165–168. [Google Scholar] [CrossRef]
  20. Terasaki, M.; Maeda, H.; Miyashita, K.; Tanaka, T.; Miyamoto, S.; Mutoh, M. A marine bio-functional lipid, fucoxanthinol, attenuates human colorectal cancer stem-like cell tumorigenicity and sphere formation. J. Clin. Biochem. Nutr. 2017, 61, 25–32. [Google Scholar] [CrossRef] [Green Version]
  21. Rwigemera, A.; Mamelona, J.; Martin, L.J. Inhibitory effects of fucoxanthinol on the viability of human breast cancer cell lines MCF-7 and MDA-MB-231 are correlated with modulation of the NF-kappaB pathway. Cell Biol. Toxicol. 2014, 30, 157–167. [Google Scholar] [CrossRef]
  22. Rwigemera, A.; Mamelona, J.; Martin, L.J. Comparative effects between fucoxanthinol and its precursor fucoxanthin on viability and apoptosis of breast cancer cell lines MCF-7 and MDA-MB-231. Anticancer Res. 2015, 35, 207–219. [Google Scholar]
  23. Wang, J.; Ma, Y.; Yang, J.; Jin, L.; Gao, Z.; Xue, L.; Hou, L.; Sui, L.; Liu, J.; Zou, X. Fucoxanthin inhibits tumour-related lymphangiogenesis and growth of breast cancer. J. Cell. Mol. Med. 2019, 23, 2219–2229. [Google Scholar] [CrossRef]
  24. Malhão, F.; Macedo, A.C.; Costa, C.; Rocha, E.; Ramos, A.A. Fucoxanthin holds potential to become a drug adjuvant in breast cancer treatment: Evidence from 2D and 3D cell cultures. Molecules 2021, 26, 4288. [Google Scholar] [CrossRef]
  25. Eid, S.Y.; Althubiti, M.A.; Abdallah, M.E.; Wink, M.; El-Readi, M.Z. The carotenoid fucoxanthin can sensitize multidrug resistant cancer cells to doxorubicin via induction of apoptosis, inhibition of multidrug resistance proteins and metabolic enzymes. Phytomedicine 2020, 77, 153280. [Google Scholar] [CrossRef]
  26. De la Mare, J.A.; Sterrenberg, J.N.; Sukhthankar, M.G.; Chiwakata, M.T.; Beukes, D.R.; Blatch, G.L.; Edkins, A.L. Assessment of potential anti-cancer stem cell activity of marine algal compounds using an in vitro mammosphere assay. Cancer Cell Int. 2013, 13, 39. [Google Scholar] [CrossRef] [Green Version]
  27. Subramanian, A.; Tamayo, P.; Mootha, V.K.; Mukherjee, S.; Ebert, B.L.; Gillette, M.A.; Paulovich, A.; Pomeroy, S.L.; Golub, T.R.; Lander, E.S.; et al. Gene set enrichment analysis: A knowledge-based approach for interpreting genome-wide expression profiles. Proc. Natl. Acad. Sci. USA 2005, 102, 15545–15550. [Google Scholar] [CrossRef] [Green Version]
  28. Mootha, V.K.; Lindgren, C.M.; Eriksson, K.F.; Subramanian, A.; Sihag, A.S.; Lehar, J.; Puigserver, P.; Carlsson, E.; Ridderstråle, M.; Laurila, E.; et al. PGC-1alpha-responsive genes involved in oxidative phosphorylation are coordinately downregulated in human diabetes. Nat. Genet. 2003, 34, 267–273. [Google Scholar] [CrossRef]
  29. Terasaki, M.; Takahashi, S.; Nishimura, R.; Kubota, A.; Kojima, H.; Ohta, T.; Hamada, J.; Kuramitsu, Y.; Maeda, H.; Miyashita, K.; et al. A marine carotenoid of fucoxanthinol accelerates the growth of human pancreatic cancer PANC-1 cells. Nutr. Cancer 2022, 74, 357–371. [Google Scholar] [CrossRef] [PubMed]
  30. Terasaki, M.; Inoue, T.; Murase, W.; Kubota, A.; Kojima, H.; Kojoma, M.; Ohta, T.; Maeda, H.; Miyashita, K.; Mutoh, M.; et al. A fucoxanthinol induces apoptosis in a pancreatic intraepithelial neoplasia cell. Cancer Genom. Proteom. 2021, 18, 133–146. [Google Scholar] [CrossRef] [PubMed]
  31. Terasaki, M.; Nishizaka, Y.; Murase, W.; Kubota, A.; Kojima, H.; Kojoma, M.; Tanaka, T.; Maeda, H.; Miyashita, K.; Mutoh, M.; et al. Effect of fucoxanthinol on pancreatic ductal adenocarcinoma cells from an N-nitrosobis(2-oxopropyl)amine-initiated syrian golden hamster pancreatic carcinogenesis model. Cancer Genom. Proteom. 2021, 18 (Suppl. 3), 407–423. [Google Scholar] [CrossRef]
  32. Govaere, O.; Petz, M.; Wouters, J.; Vandewynchel, Y.P.; Scott, E.J.; Topal, B.; Nevens, F.; Verslype, C.; Anstee, Q.M.; Van Vilerberghe, H.; et al. The PDGFR-α-laminin B1-keratin 19 cascade drives tumor progression at the invasive front of human hepatocellular carcinoma. Oncogene 2017, 36, 6605–6616. [Google Scholar] [CrossRef] [PubMed] [Green Version]
  33. Petz, M.; Kozina, D.; Huber, H.; Siwiec, T.; Seipelt, J.; Sommergruber, W.; Mikulits, W. The leader region of Laminin B1 mRNA confers cap-independent translation. Nucleic Acids Res. 2007, 35, 2473–2482. [Google Scholar] [CrossRef] [Green Version]
  34. Fujita, M.; Khazenzon, N.M.; Bose, S.; Sekiguchi, K.; Sasaki, T.; Carter, W.G.; Ljubimov, A.V.; Black, K.L.; Ljubimova, J.Y. Overexpression of beta1-chain-containing laminins in capillary basement memebranes of human breast cancer and its metastasis. Breast Cancer Res. 2005, 7, R411–R421. [Google Scholar] [CrossRef] [Green Version]
  35. Arimori, T.; Miyazaki, N.; Mihara, E.; Takizawa, M.; Taniguchi, Y.; Cabañas, C.; Sekiguchi, K.; Takagi, J. Structural mechanism of laminin recognition by integrin. Nat. Commun. 2021, 12, 4012. [Google Scholar] [CrossRef]
  36. Buchheit, C.L.; Weigel, K.J.; Schafer, Z.T. Cancer cell survival during detachment from the ECM: Multiple barriers to tumour progression. Nat. Rev. Cancer 2014, 14, 632–641. [Google Scholar] [CrossRef]
  37. Paoli, P.; Giannoni, E.; Chiarugi, P. Anoikis molecular pathways and its role in cancer progression. Biochim. Biophys. Acta 2013, 1833, 3481–3498. [Google Scholar] [CrossRef] [Green Version]
  38. Horbinski, C.; Mojesky, C.; Kyprianou, N. Live free or die: Tales of homeless (cells) in cancer. Am. J. Pathol. 2010, 177, 1044–1052. [Google Scholar] [CrossRef]
  39. Alday-Parejo, B.; Stupp, R.; Rüegg, C. Are integrins still practicable targets for anti-cancer therapy? Cancers 2019, 11, E978. [Google Scholar] [CrossRef] [Green Version]
  40. Sugiura, R.; Satoh, R.; Takasaki, T. ERK: A double-edged sword in cancer. ERK-dependent apoptosis as a potential therapeutic strategy for cancer. Cells 2021, 10, 2509. [Google Scholar] [CrossRef]
  41. Wu, P.K.; Becker, A.; Park, J.I. Growth inhibitory signaling of the Raf/MEK/ERK pathway. Int. J. Mol. Sci. 2020, 21, 5436. [Google Scholar] [CrossRef]
  42. Struewing, J.P.; Hartge, P.; Wacholder, S.; Baker, S.M.; Berlin, M.; McAdams, M.; Timmerman, M.M.; Brody, L.C.; Tucker, M.A. The risk of cancer associated with specific mutations of BRCA1 and BRCA2 among Ashkenazi Jews. N. Engl. J. Med. 1997, 336, 1401–1408. [Google Scholar] [CrossRef]
  43. King, M.C.; Marks, J.H.; Mandell, J.B.; New York Breast Cancer Study Group. Breast and ovarian cancer risks due to inherited mutations in BRCA1 and BRCA2. Science 2003, 302, 643–646. [Google Scholar] [CrossRef]
  44. Warner, E.; Plewes, D.B.; Hill, K.A.; Causer, P.A.; Zubovits, J.T.; Jong, R.A.; Cutrara, M.R.; DeBoer, G.; Yaffe, M.J.; Messner, S.J.; et al. Surveillance of BRCA1 and BRCA2 mutation carriers with magnetic resonance imaging, ultrasound, mammography, and clinical breast examination. JAMA 2004, 292, 1317–1325. [Google Scholar] [CrossRef] [Green Version]
  45. Sørlie, T.; Perou, C.M.; Tibshirani, R.; Aas, T.; Geisler, S.; Johnsen, H.; Hastie, T.; Eisen, M.B.; van de Rijn, M.; Jeffrey, S.S.; et al. Gene expression patterns of breast carcinomas distinguish tumor subclasses with clinical implications. Proc. Natl. Acad. Sci. USA 2001, 98, 10869–10874. [Google Scholar] [CrossRef] [Green Version]
  46. Sørlie, T.; Tibshirani, R.; Parker, J.; Hastie, T.; Marron, J.S.; Nobel, A.; Deng, S.; Johnsen, H.; Pesich, R.; Geisler, S.; et al. Repeated observation of breast tumor subtypes in independent gene expression data sets. Proc. Natl. Acad. Sci. USA 2003, 100, 8418–8423. [Google Scholar] [CrossRef] [Green Version]
  47. Lehmann, B.D.; Bauer, J.A.; Chen, X.; Sanders, M.E.; Chakravarthy, A.B.; Shyr, Y.; Pietenpol, J.A. Identification of human triple-negative breast cancer subtypes and preclinical models for selection of targeted therapies. J. Clin. Investig. 2011, 121, 2750–2767. [Google Scholar] [CrossRef] [Green Version]
  48. Dent, R.; Trudeau, M.; Pritchard, K.I.; Hanna, W.M.; Kahn, H.K.; Sawka, C.A.; Lickley, L.A.; Rawlinson, E.; Sun, P.; Narod, S.A. Triple-negative breast cancer: Clinical features and patterns of recurrence. Clin. Cancer Res. 2007, 13, 4429–4434. [Google Scholar] [CrossRef] [Green Version]
  49. Perou, C.M.; Sørlie, T.; Eisen, M.B.; van de Rijn, M.; Jeffrey, S.S.; Rees, C.A.; Pollack, J.R.; Ross, D.T.; Johnsen, H.; Akslen, L.A.; et al. Molecular portraits of human breast tumours. Nature 2000, 406, 747–752. [Google Scholar] [CrossRef]
  50. Morris, G.J.; Naidu, S.; Topham, A.; Guiles, F.; Xu, Y.; McCue, P.; Schwartz, G.F.; Park, P.K.; Rosenberg, A.L.; Brill, K.; et al. Differences in breast carcinoma characteristics in newly diagnosed African-American and Caucasian patients: A single-institution compilation compared with the National Cancer Institute’s Surveillance, Epidemiology, and Endo Results Database. Cancer 2007, 110, 876–884. [Google Scholar] [CrossRef]
  51. Gerratana, L.; Basile, D.; Buono, G.; De Placido, S.; Giuliano, M.; Minichillo, S.; Coinu, A.; Martorana, F.; De Santo, I.; Del Mastro, L.; et al. Androgen receptor in triple negative breast cancer: A potential target for the targetless subtype. Cancer Treat. Rev. 2018, 68, 102–110. [Google Scholar] [CrossRef]
  52. Dai, X.; Cheng, H.; Bai, Z.; Li, J. Breast cancer cell line classification and its relevance with breast tumor subtyping. J. Cancer 2017, 8, 3131–3141. [Google Scholar] [CrossRef] [Green Version]
  53. Leroy, B.; Girard, L.; Hollestelle, A.; Minna, J.D.; Gazdar, A.F.; Soussi, T. Analysis of TP53 mutation status in human cancer cell lines: A reassessment. Hum. Mutat. 2014, 35, 756–765. [Google Scholar] [CrossRef] [PubMed]
  54. Amirabadi, H.E.; Tuerlings, M.; Hollestelle, A.; SahebAli, S.; Luttge, R.; van Donkelaar, C.C.; Martens, J.W.M.; den Toonder, J.M.J. Characterizing the invasion of different breast cancer cell lines with distinct E-cadherin status in 3D using a microfluidic system. Biomed. Microdevices 2019, 21, 101. [Google Scholar] [CrossRef] [PubMed] [Green Version]
  55. Terasaki, M.; Maeda, H.; Miyashita, K.; Mutoh, M. Induction of anoikis in human colorectal cancer cells by fucoxanthinol. Nutr. Cancer 2017, 69, 1043–1052. [Google Scholar] [CrossRef] [PubMed]
  56. Yokoyama, R.; Kojima, H.; Takai, R.; Ohta, T.; Maeda, H.; Miyashita, K.; Mutoh, M.; Terasaki, M. Effects of CLIC4 on fucoxanthinol-induced apoptosis in human colorectal cancer cells. Nutr. Cancer 2021, 73, 889–898. [Google Scholar] [CrossRef]
  57. Jung, H.; Lee, D.S.; Park, S.K.; Choi, J.S.; Jung, W.K.; Park, W.S.; Choi, I.W. Fucoxanthin inhibits myofibroblast differentiation and extracellular matrix production in nasal polyp-derived fibroblasts via modulation of Smad-dependent and Smad-independent signaling pathways. Mar. Drugs 2018, 16, 323. [Google Scholar] [CrossRef] [Green Version]
Figure 1. Chemical structure of fucoxanthinol (FxOH). Molecular weight, 616.87 g/mol (C40H56O5).
Onco 02 00010 g001
Figure 2. Effects of fucoxanthinol (FxOH) on growth and apoptosis in breast cancer MCF-7 and MDA-MB-231 cells. MCF-7 and MDA-MB-231 cells were treated with (A) 5.0 and (AD) 20 µM of FxOH for (A) 1 and (A–D) 2 days. (A) Cell viability was measured using the WST-1 assay. Data were represented as mean ± standard error (SE) (n = 6). (B) Nuclear DNA was observed using a fluorescent microscope. White arrow showed apoptosis-associated chromatin condensation or nuclear fragmentation. White bars were 200 μm. Relative proportions of cells at (C) a sub-G1 (apoptosis-like) phase and (D) different phases of cell cycle (G1, S, and G2/M) were determined using a flow cytometer. Data were represented as mean ± SE (n = 3). * p < 0.05, ** p < 0.01.
Onco 02 00010 g002aOnco 02 00010 g002b
Figure 3. Transcriptome profiles in MCF-7 cells with or without fucoxanthinol (FxOH) treatment. MCF-7 cells were treated with 20 µM of FxOH for 2 days. The gene expression levels between FxOH-treated MCF-7 cells (group 1) and control cells (group 2) were determined using Clariom S human assays with transcriptome analysis console (TAC) software (n = 3). (A) Principal coordinate analysis (PCoA) plots indicating gene set distance between groups 1 and 2. (B) Hierarchical cluster analysis of 3545 differentially expressed genes between groups 1 and 2. (C) Volcano plots of upregulated and down regulated genes between groups 1 and 2. (D) Number of upregulated (≥2.0-fold) and downregulated (≤−2.0-fold) genes in groups 1 relative to group 2. (E) Gene distribution of the top 30 altered pathways in group 1 relative to group 2. Black circle on top of each bar indicates the gene set involved in cancer development.
Onco 02 00010 g003
Figure 4. Transcriptome profiles in MDA-MB-231 cells with or without fucoxanthinol (FxOH) treatment. MDA-MB-231 cells were treated with 20 µM of FxOH for 1 day. The gene expression levels between FxOH-treated MDA-MB-231 cells (group 1) and control cells (group 2) were determined using Clariom S human assays with transcriptome analysis console (TAC) software (n = 3). (A) Principal coordinate analysis (PCoA) plots indicating gene set distance between groups 1 and 2. (B) Hierarchical cluster analysis of 2995 differentially expressed genes between groups 1 and 2. (C) Volcano plots in upregulated and down regulated genes between groups 1 and 2. (D) Number of upregulated (≥2.0-fold) and downregulated (≤−2.0-fold) genes in groups 1 relative to group 2. (E) Gene distribution of the top 30 altered pathways in group 1 relative to group 2. Black circle on top of each bar indicates the gene set involved in cancer development.
Onco 02 00010 g004aOnco 02 00010 g004b
Figure 5. Gene set enrichment profiles in MCF-7 cells with or without fucoxanthinol (FxOH) treatment. The gene set bias of significantly altered genes in FxOH-treated MCF-7 cells (group 1) relative to control cells (group 2) on Transcriptome Analysis Console (TAC) software were estimated using gene set enrichment analysis (GSEA) software. Upper panels showed GSEA diagrams of the gene set bias towards control 1 or 2. Lower panels showed heatmap of each gene between groups 1 (Fx1-3) and 2 (Ctr1-3).
Onco 02 00010 g005
Figure 6. Gene set enrichment profiles in MDA-MB-231 cells with or without fucoxanthinol (FxOH) treatment. The gene set bias of significantly altered genes in FxOH-treated MDA-MB-231 cells (group 1) compared with control cells (group 2) on transcriptome analysis console (TAC) software, estimated using gene set enrichment analysis (GSEA) software. Upper panels showed GSEA diagrams on the gene set bias towards control 1 or 2. Lower panels showed heatmap of each gene between group 1 (Fx1-3) and 2 (Ctr1-3).
Onco 02 00010 g006
Figure 7. Protein expression levels in MCF-7 and MDA-MB-231 cells with or without fucoxanthinol (FxOH) treatment. MCF-7 and MDA-MB-231 cells were treated with 20 µM of FxOH for 2 and 1 days, respectively. Protein levels were measured using Western blotting. β-Actin expression was presented as a loading control per proteins set at each different membrane as follows: membrane 1, extracellular matrix, adhesion, cell cycle, and chemokine and cytokine; membrane 2, PI3K/AKT, STAT, TGF-β, MAPK, NF-κB, RAS/Rho, DNA repair, and apoptosis.
Onco 02 00010 g007
Figure 8. Effect of integrin β1 or integrin β4 knockdown on the viability of MCF-7 and MDA-MB-231 cells. MCF-7 and MDA-MB-231 cells were seeded into a 100 mm dish at a density of 10 × 104 cells/mL and transfected with Dicer-substrate short-interfering RNA (dsiRNA) targeting integrin β1 or integrin β4 for 1 day. The viability of MCF-7 and MDA-MB-231 cells was measured using the WST-1 assay. Data are represented as mean ± standard error (SE) (n = 6). * p < 0.05.
Onco 02 00010 g008
Table 1. GSEA profiles in gene sets on fucoxanthinol (FxOH)-treated MCF-7 cells a.
KEGG Pathway bSize cNES dNOM e
p-Value
FDR f
q-Value
Enriched gene sets in control cells (group 2)
 Cell cycle g512.320.0000.000
 DNA replication232.310.0000.001
 Systemic lupus erythematosus412.240.0000.002
 Valine leucine and isoleucine degradation232.110.0000.009
 Calcium signaling pathway242.030.0000.015
 Purine metabolism411.930.0000.027
 Melanogenesis221.790.0000.075
 Dilated cardiomyopathy171.780.0080.071
 Propanoate metabolism151.750.0080.074
 ECM receptor interaction151.720.0230.083
Enriched gene sets FxOH-treated cells (group 1)
 Cytokine–cytokine receptor interaction342.110.0000.033
 Protein export152.020.0080.033
 Nod-like receptor signaling pathway161.700.0260.203
 MAPK signaling pathway601.640.0120.212
 Amino sugar and nucleotide sugar metabolism151.580.0610.253
 Spliceosome211.540.0500.249
 Natural killer cell mediated cytotoxicity241.540.0560.214
 Metabolism of xenobiotics by cytochrome P450151.430.0970.333
 Epithelial cell signaling in Helicobacter pylori201.410.1110.322
 Rig I-like receptor signaling pathway151.280.1990.506
a The gene set enrichment in significantly different 3545 genes on MCF-7 cells with or without FxOH treatment were determined using GSEA 4.0.3 (Broad Institute of Harvard University and Massachusetts Institute of Technology, MA, USA) with a database (Human_NCBI_Entrez_Gene_ID_MSigDB.v7.1.chip). b The gene sets were extracted from a database (c2.cp.kegg.v7.1.symbols.gmt [Curated]). c Number of gene. d NES, normalized enrichment score. e NOM, nominal. f FDR, false discovery rate. g The KEGG pathways colored with gray were the gene sets that were represented as significant cancer-related pathways in Figure 4.
Table 2. GSEA profiles in gene sets on fucoxanthinol (FxOH)-treated MDA-MB-231 cells a.
KEGG Pathway bSize cNES dNOM e
p-Value
FDR f
q-Value
Enriched gene sets in control cells (group 2)
 Systemic lupus erythematosus372.720.0000.000
 DNA replication g262.380.0000.000
 Purine metabolism372.180.0000.006
 Pyrimidine metabolism321.900.0060.051
 Cell adhesion molecular (CAMS)211.860.0040.055
 ECM–receptor interaction271.820.0080.057
 Nucleotide excision repair151.820.0080.049
 Base excision repair151.740.0190.072
 Arrhythmogenic right ventricular cardiomyopathy (ARVC)151.580.0540.160
 Homologous recombination151.530.0550.188
Enriched gene sets FxOH-treated cells (group 1)
 MAPK signaling pathway572.680.0000.000
 Spliceosome172.120.0020.012
 Epithelial cell signaling in Helicobacter pyrori infection162.000.0040.020
 Cytokine–cytokine receptor interaction301.590.0420.236
 Antigen processing and presentation161.550.0510.230
 Insulin signaling pathway291.410.0980.366
 Endocytosis281.370.1340.379
 Toll-like receptor signaling pathway191.320.1490.417
 T-cell receptor signaling pathway171.290.1790.406
 B-cell signaling pathway161.250.1910.444
a The gene set enrichment in significantly different 2995 genes on MDA-MB-231 cells with or without FxOH treatment, determined using GSEA 4.0.3 (Broad Institute of Harvard University and Massachusetts Institute of Technology, MA, USA) with a database (Human_NCBI_Entrez_Gene_ID_MSigDB.v7.1.chip). b The gene sets are extracted from a database (c2.cp.kegg.v7.1.symbols.gmt [Curated]). c Number of gene. d NES, normalized enrichment score. e NOM, nominal. f FDR, false discovery rate. g The KEGG pathways colored with gray are the gene sets represented as significant cancer-related pathways in Figure 6.
Publisher’s Note: MDPI stays neutral with regard to jurisdictional claims in published maps and institutional affiliations.

