
An Efficient COVID-19 Mortality Risk Prediction Model Using Deep Synthetic Minority Oversampling Technique and Convolution Neural Networks
 , , ,
, , ,
Abstract
:
1. Introduction
1.1. Contributions
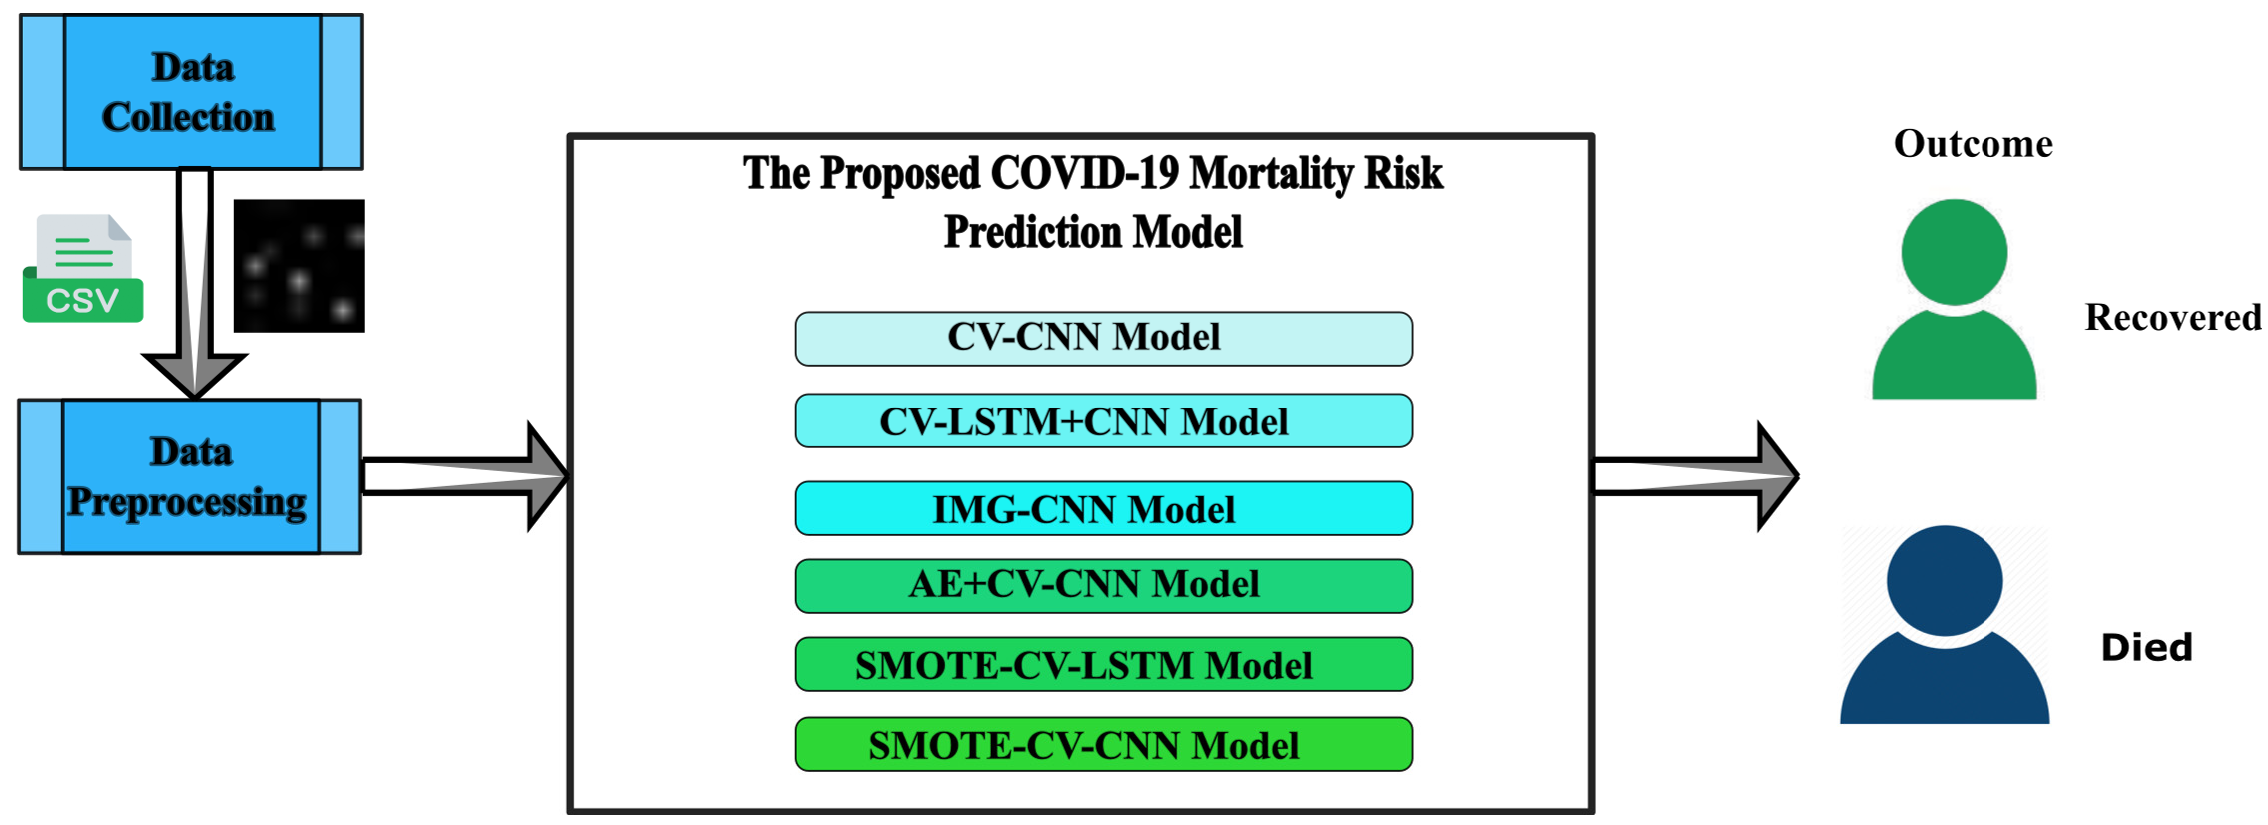
- Generating the following six deep learning predictive models will help identify people with the COVID-19 disease that are at higher risk of mortality.
- i
- CV-CNN: A clinical dataset of 4711 individuals is used in building this model, and it is trained using 10-fold cross-validation.
- ii
- CV-LSTM+CNN: The LSTM method and a CNN model are combined to create this model. Additionally, a 10-fold cross-validation method is utilized in its training.
- iii
- IMG-CNN: This model is a CNN and is trained using converted images of the clinical dataset where each image corresponds to one record.
- iv
- AE+CV-CNN: This model is built by combining an auto-encoder and CNN model with 10-fold cross-validation.
- v
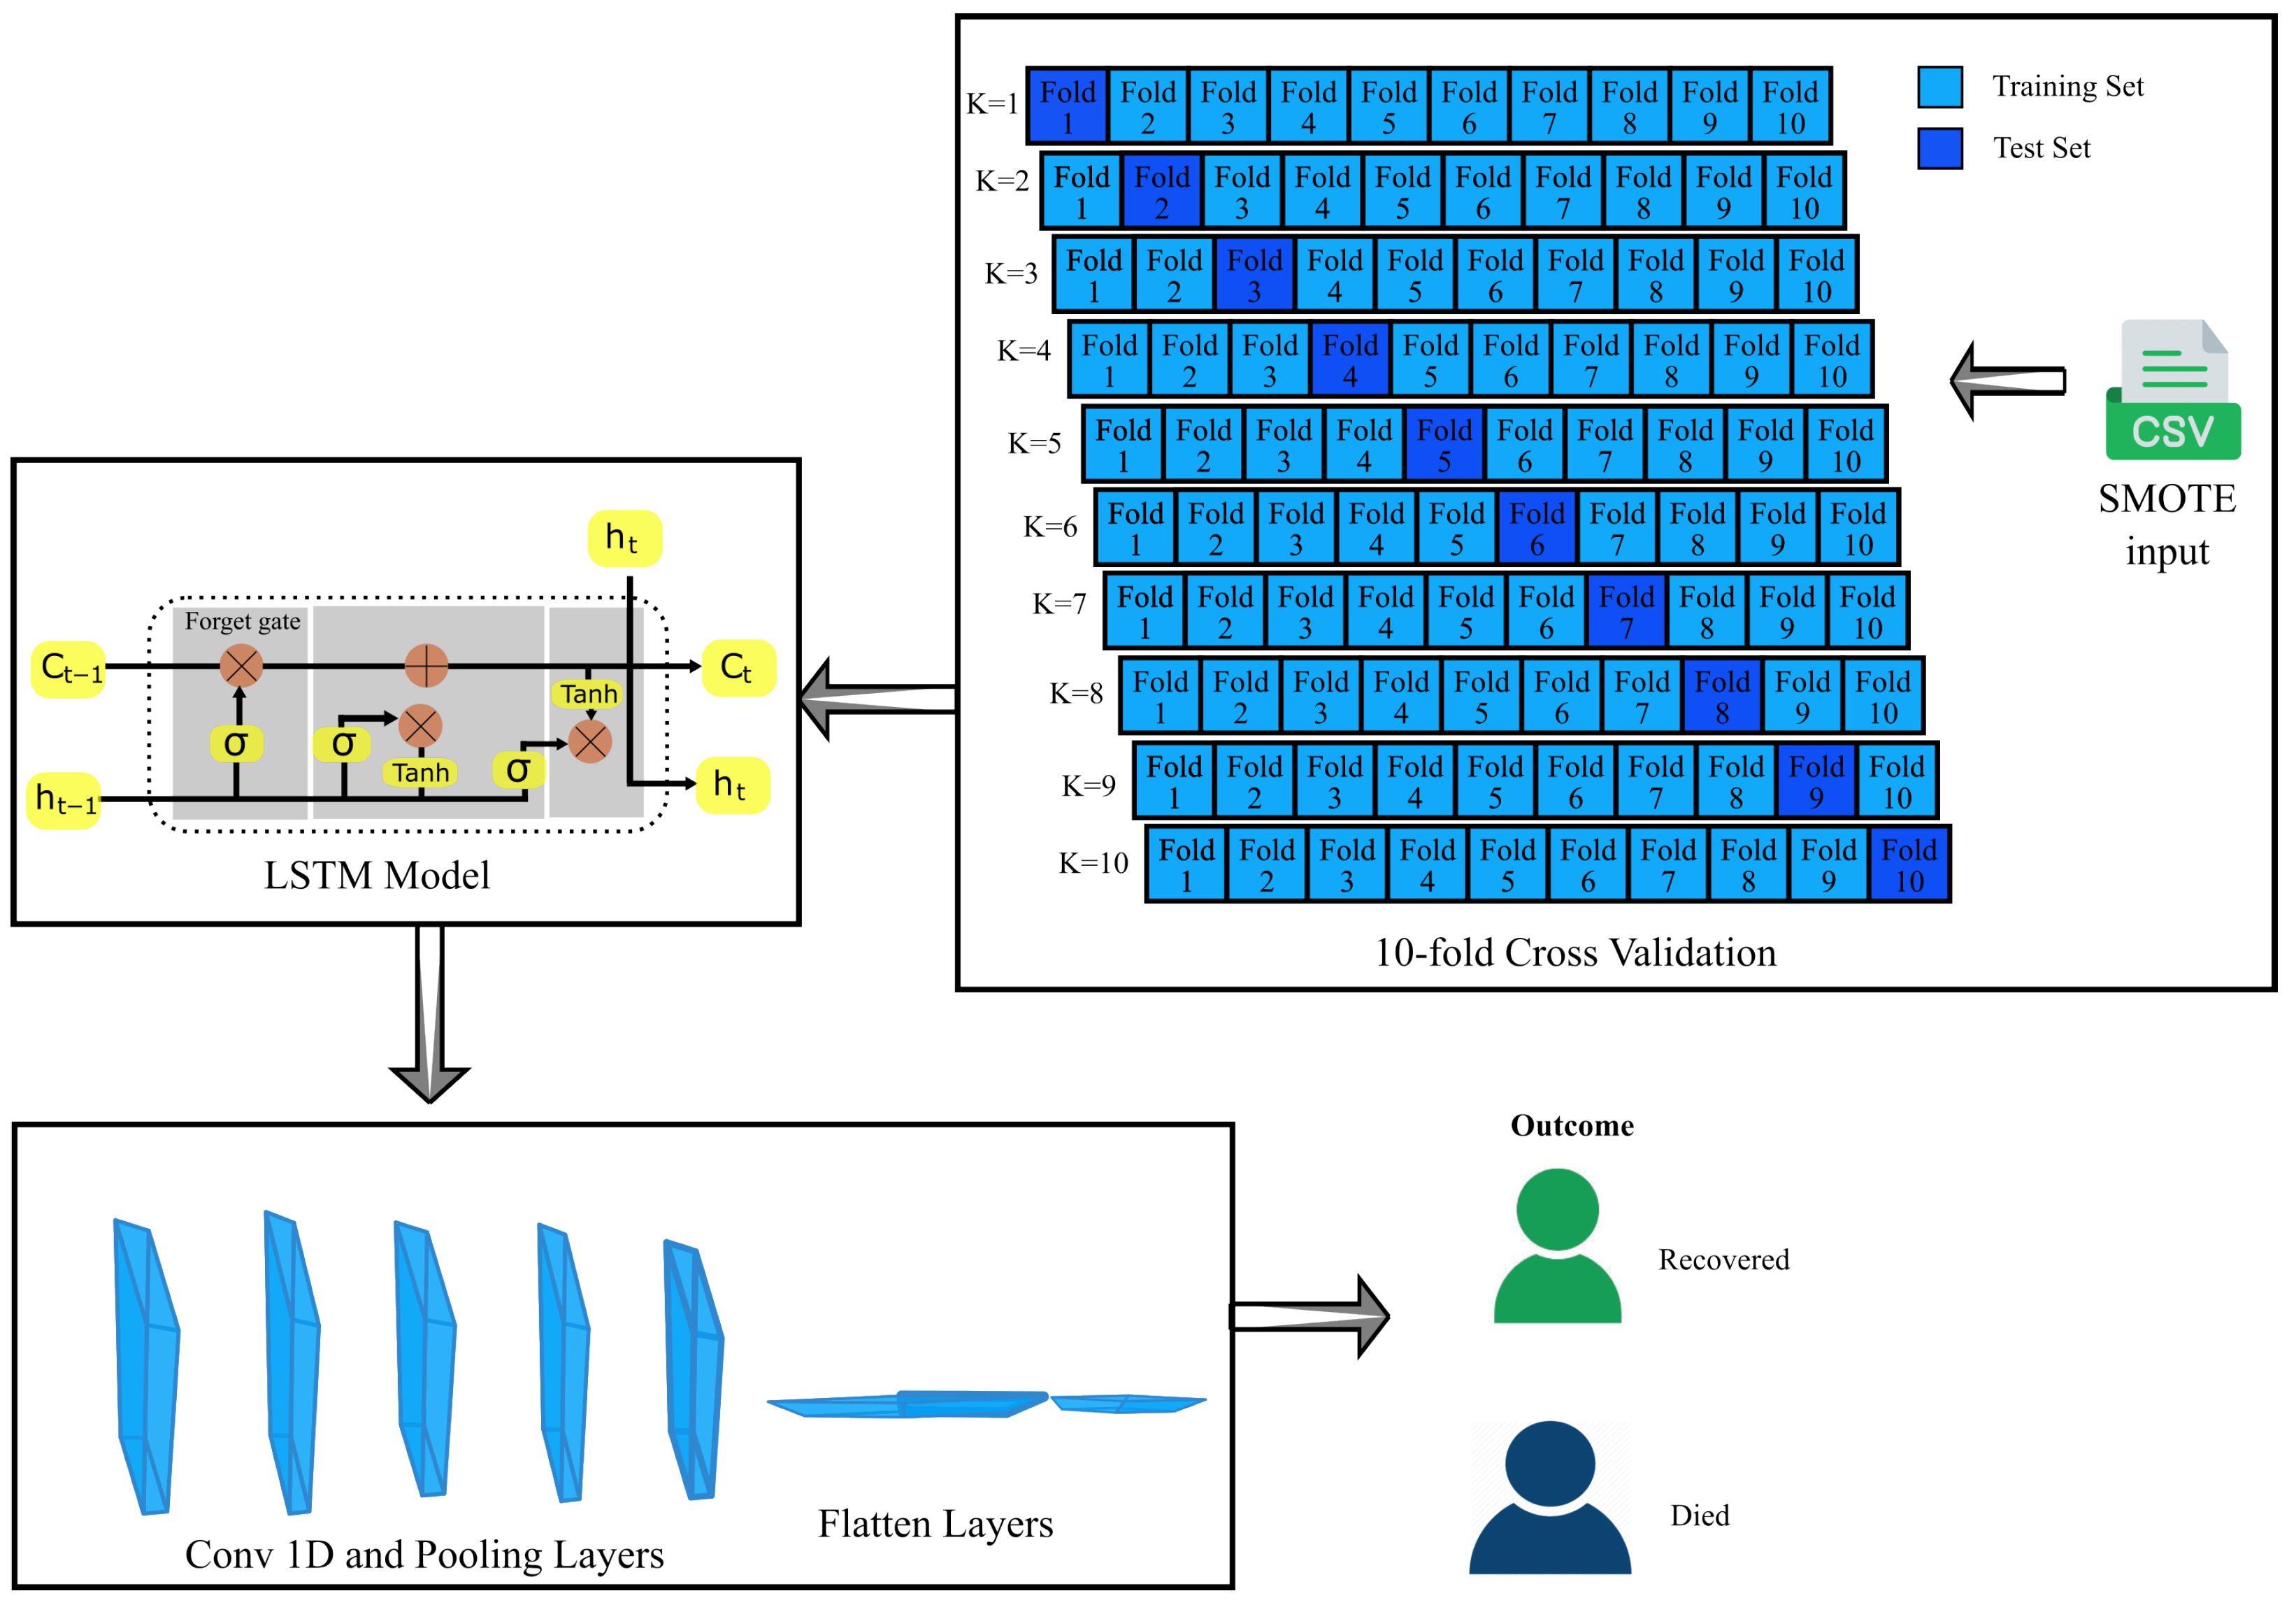
- SMOTE-CV-LSTM: This model is established by integrating SMOTE and LSTM techniques along with 10-fold cross-validation.
- vi
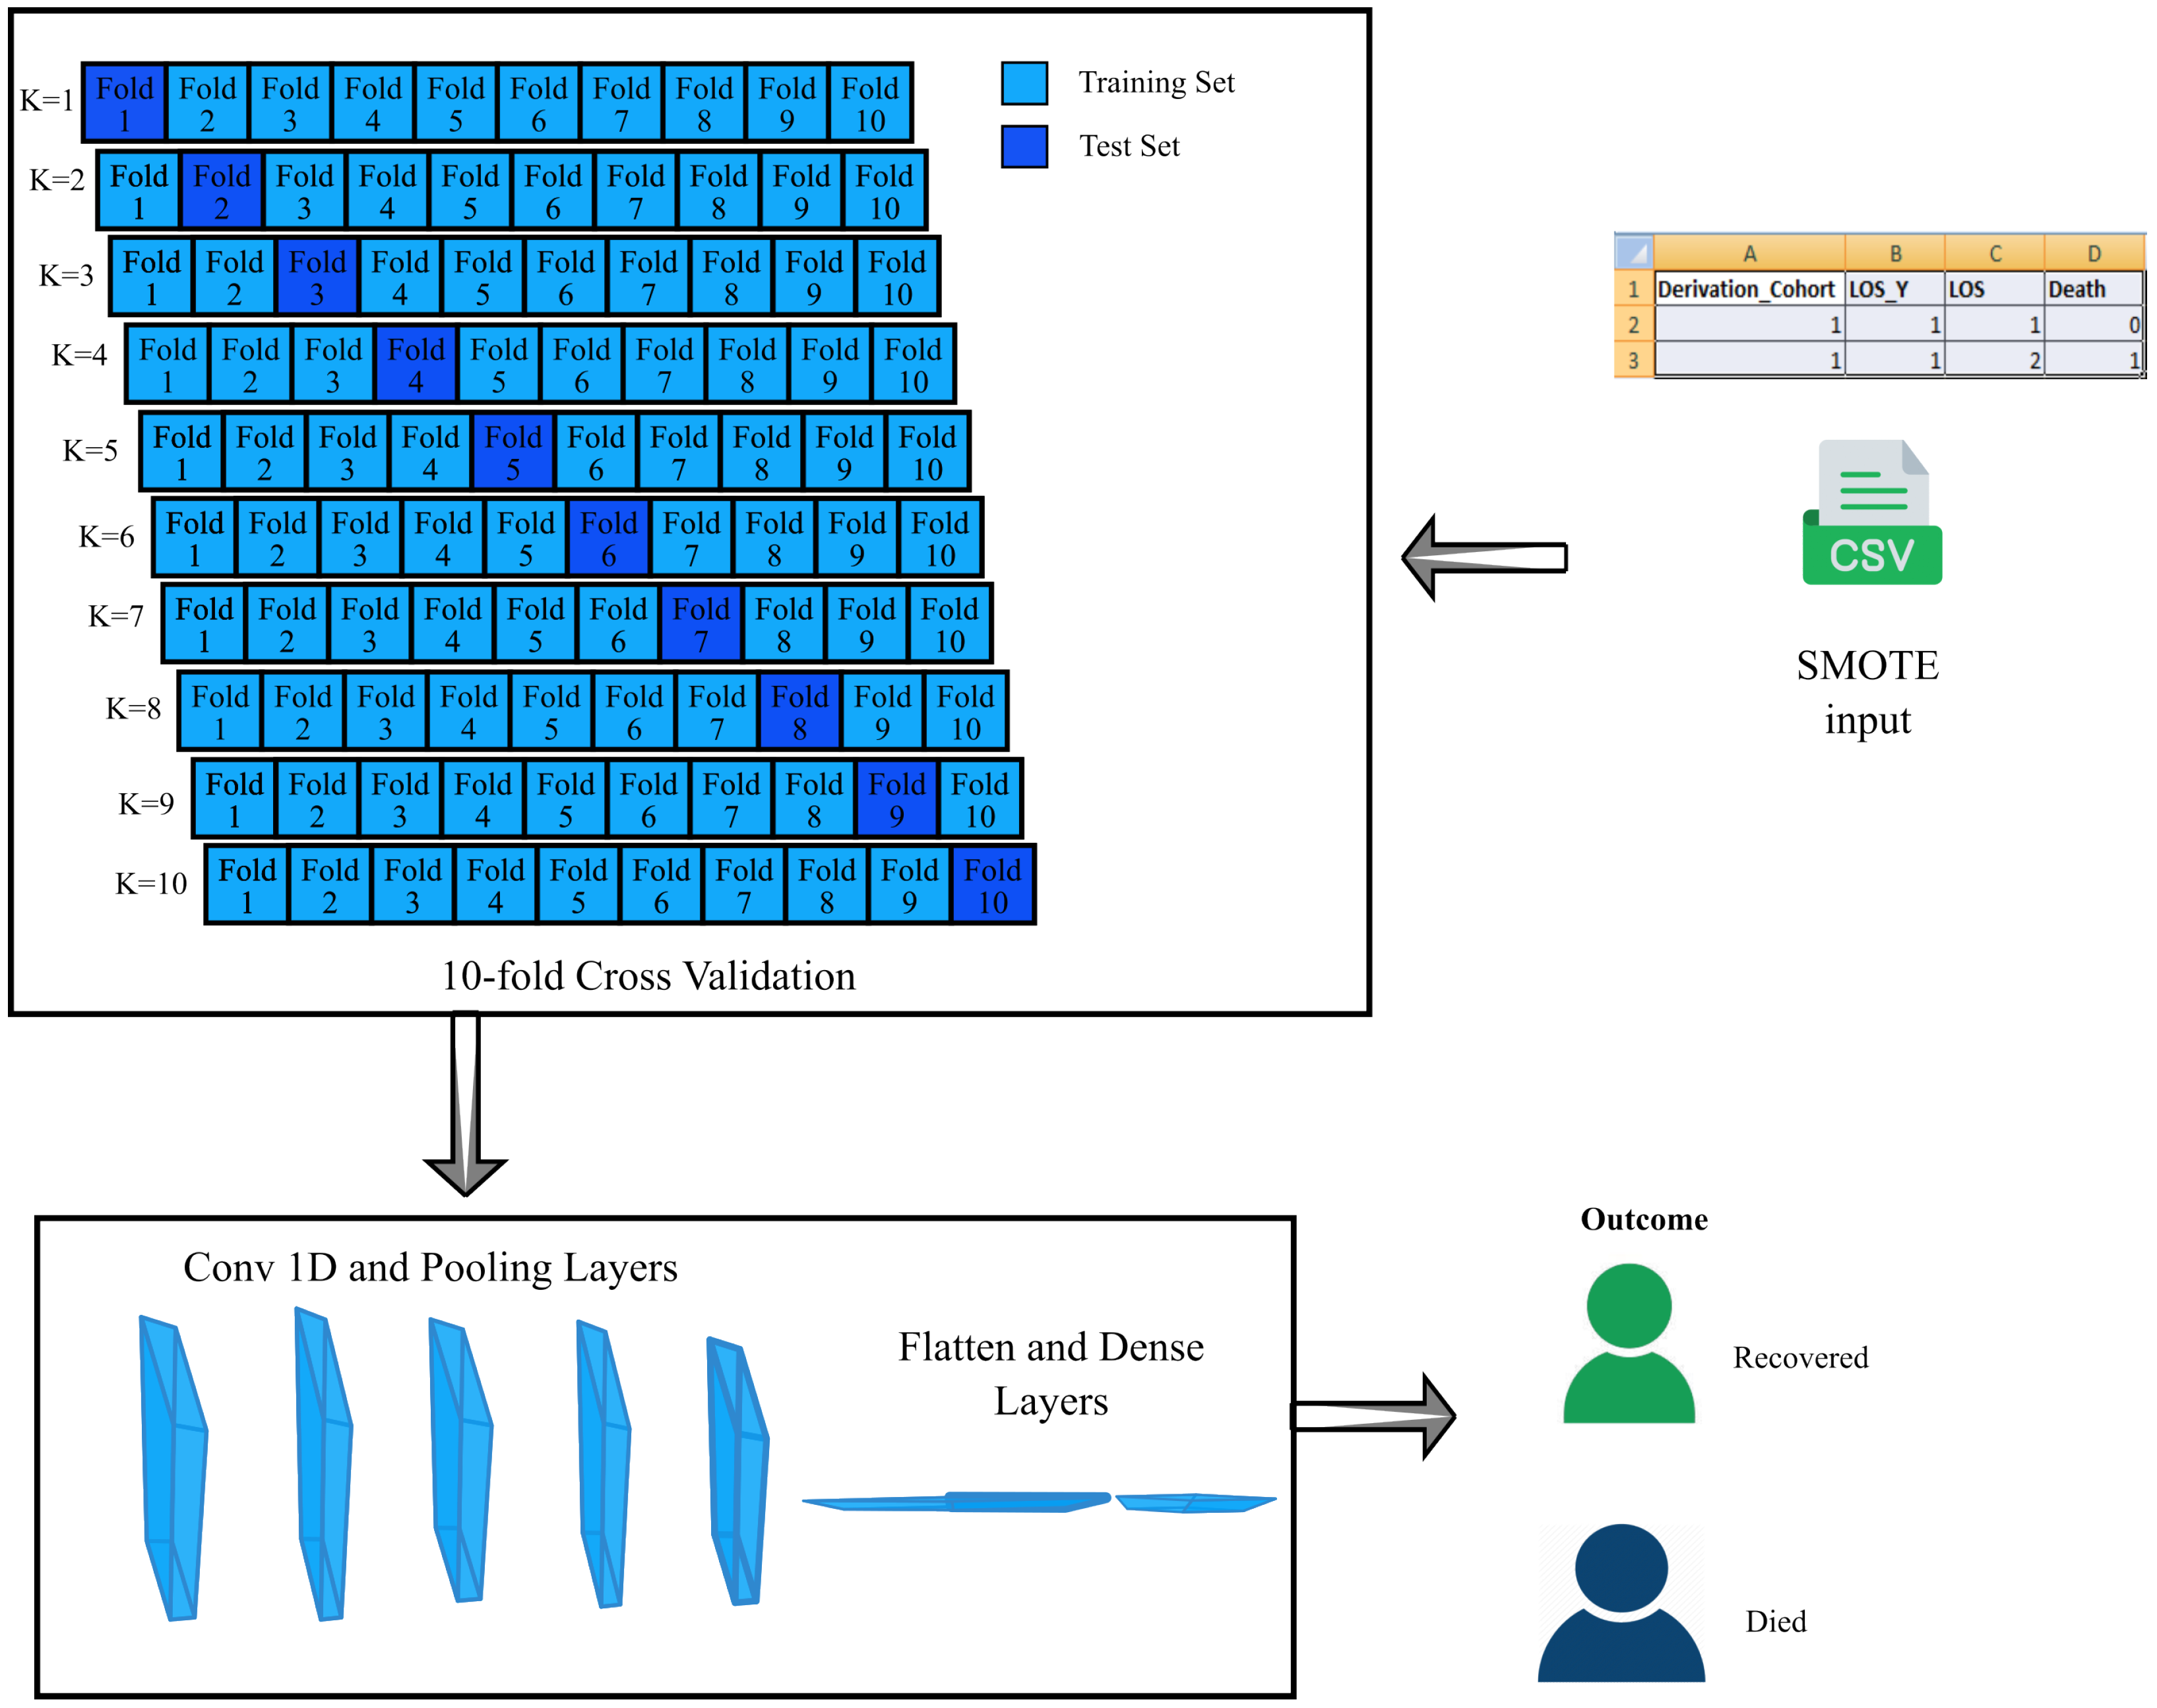
- SMOTE-CV-CNN: This model is established by integrating SMOTE and CNN techniques along with 10-fold cross-validation.
- Estimating a patient’s probability of survival based on their medical records.
- Locating important biomarkers that can tell us the severity of the diseases.
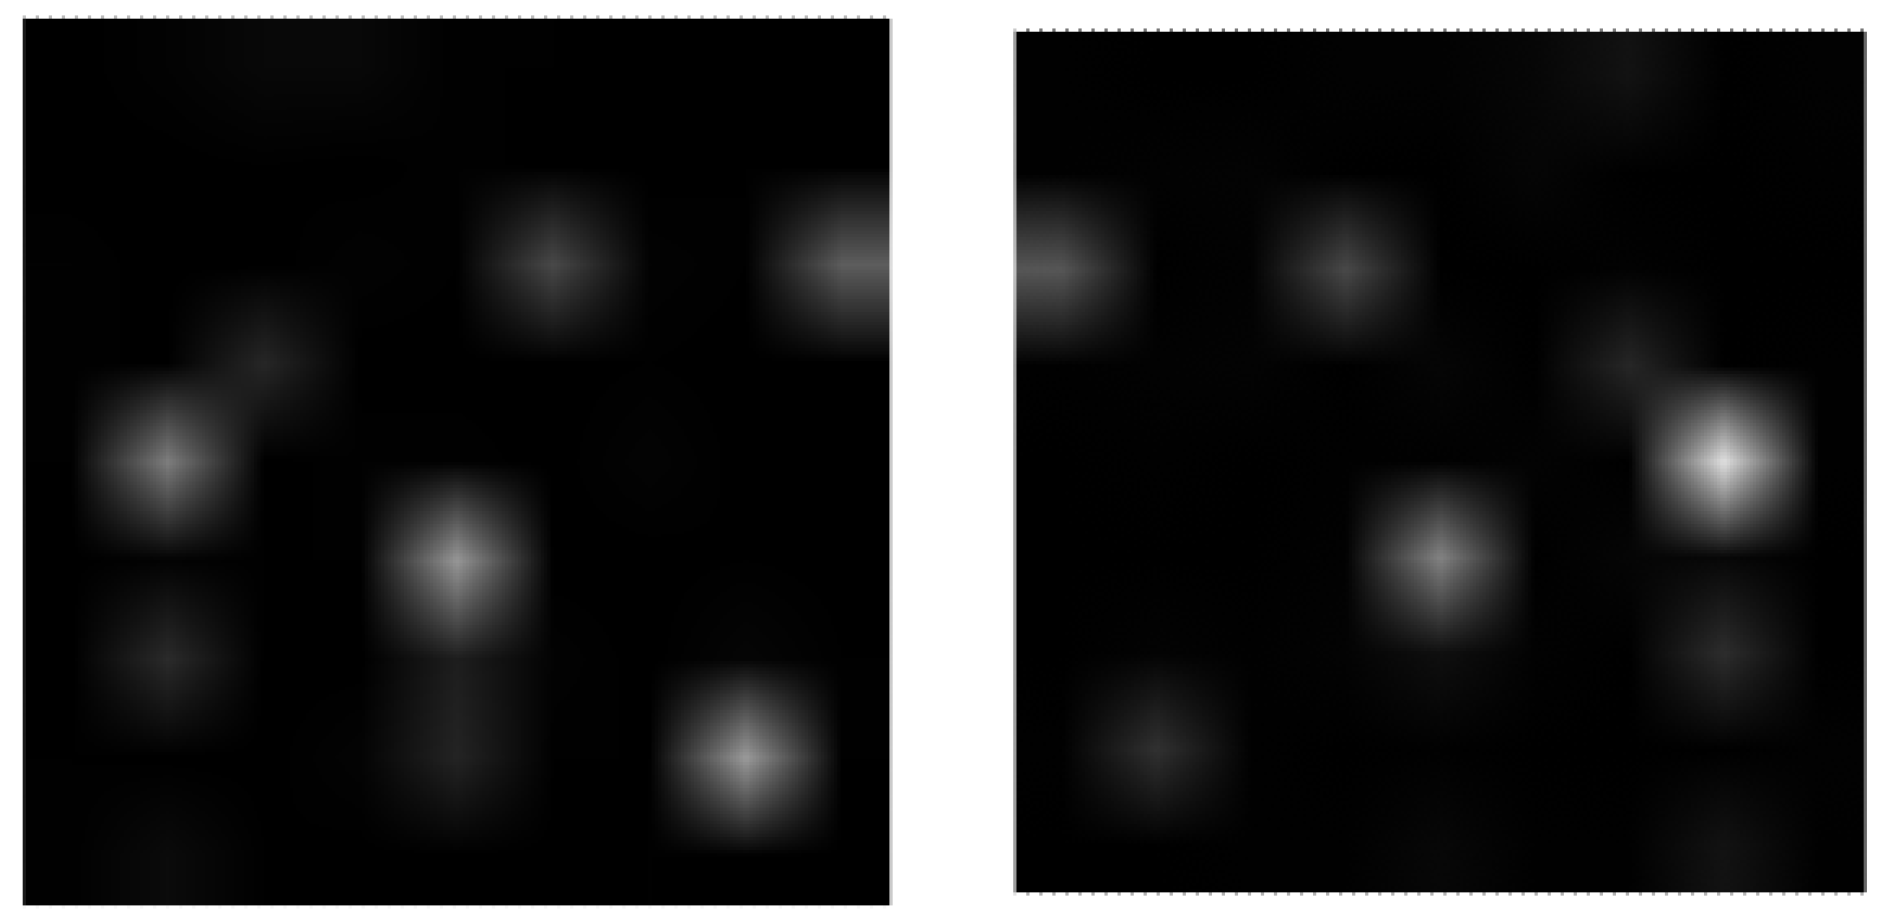
- The medical dataset is transformed as images and is applied to the proposed IMG-CNN algorithm.
- Assessing the suggested model and comparing it with earlier research work.
- Improving the model performance using data-augmentation techniques.
1.2. Organization of Paper
2. Literature Survey
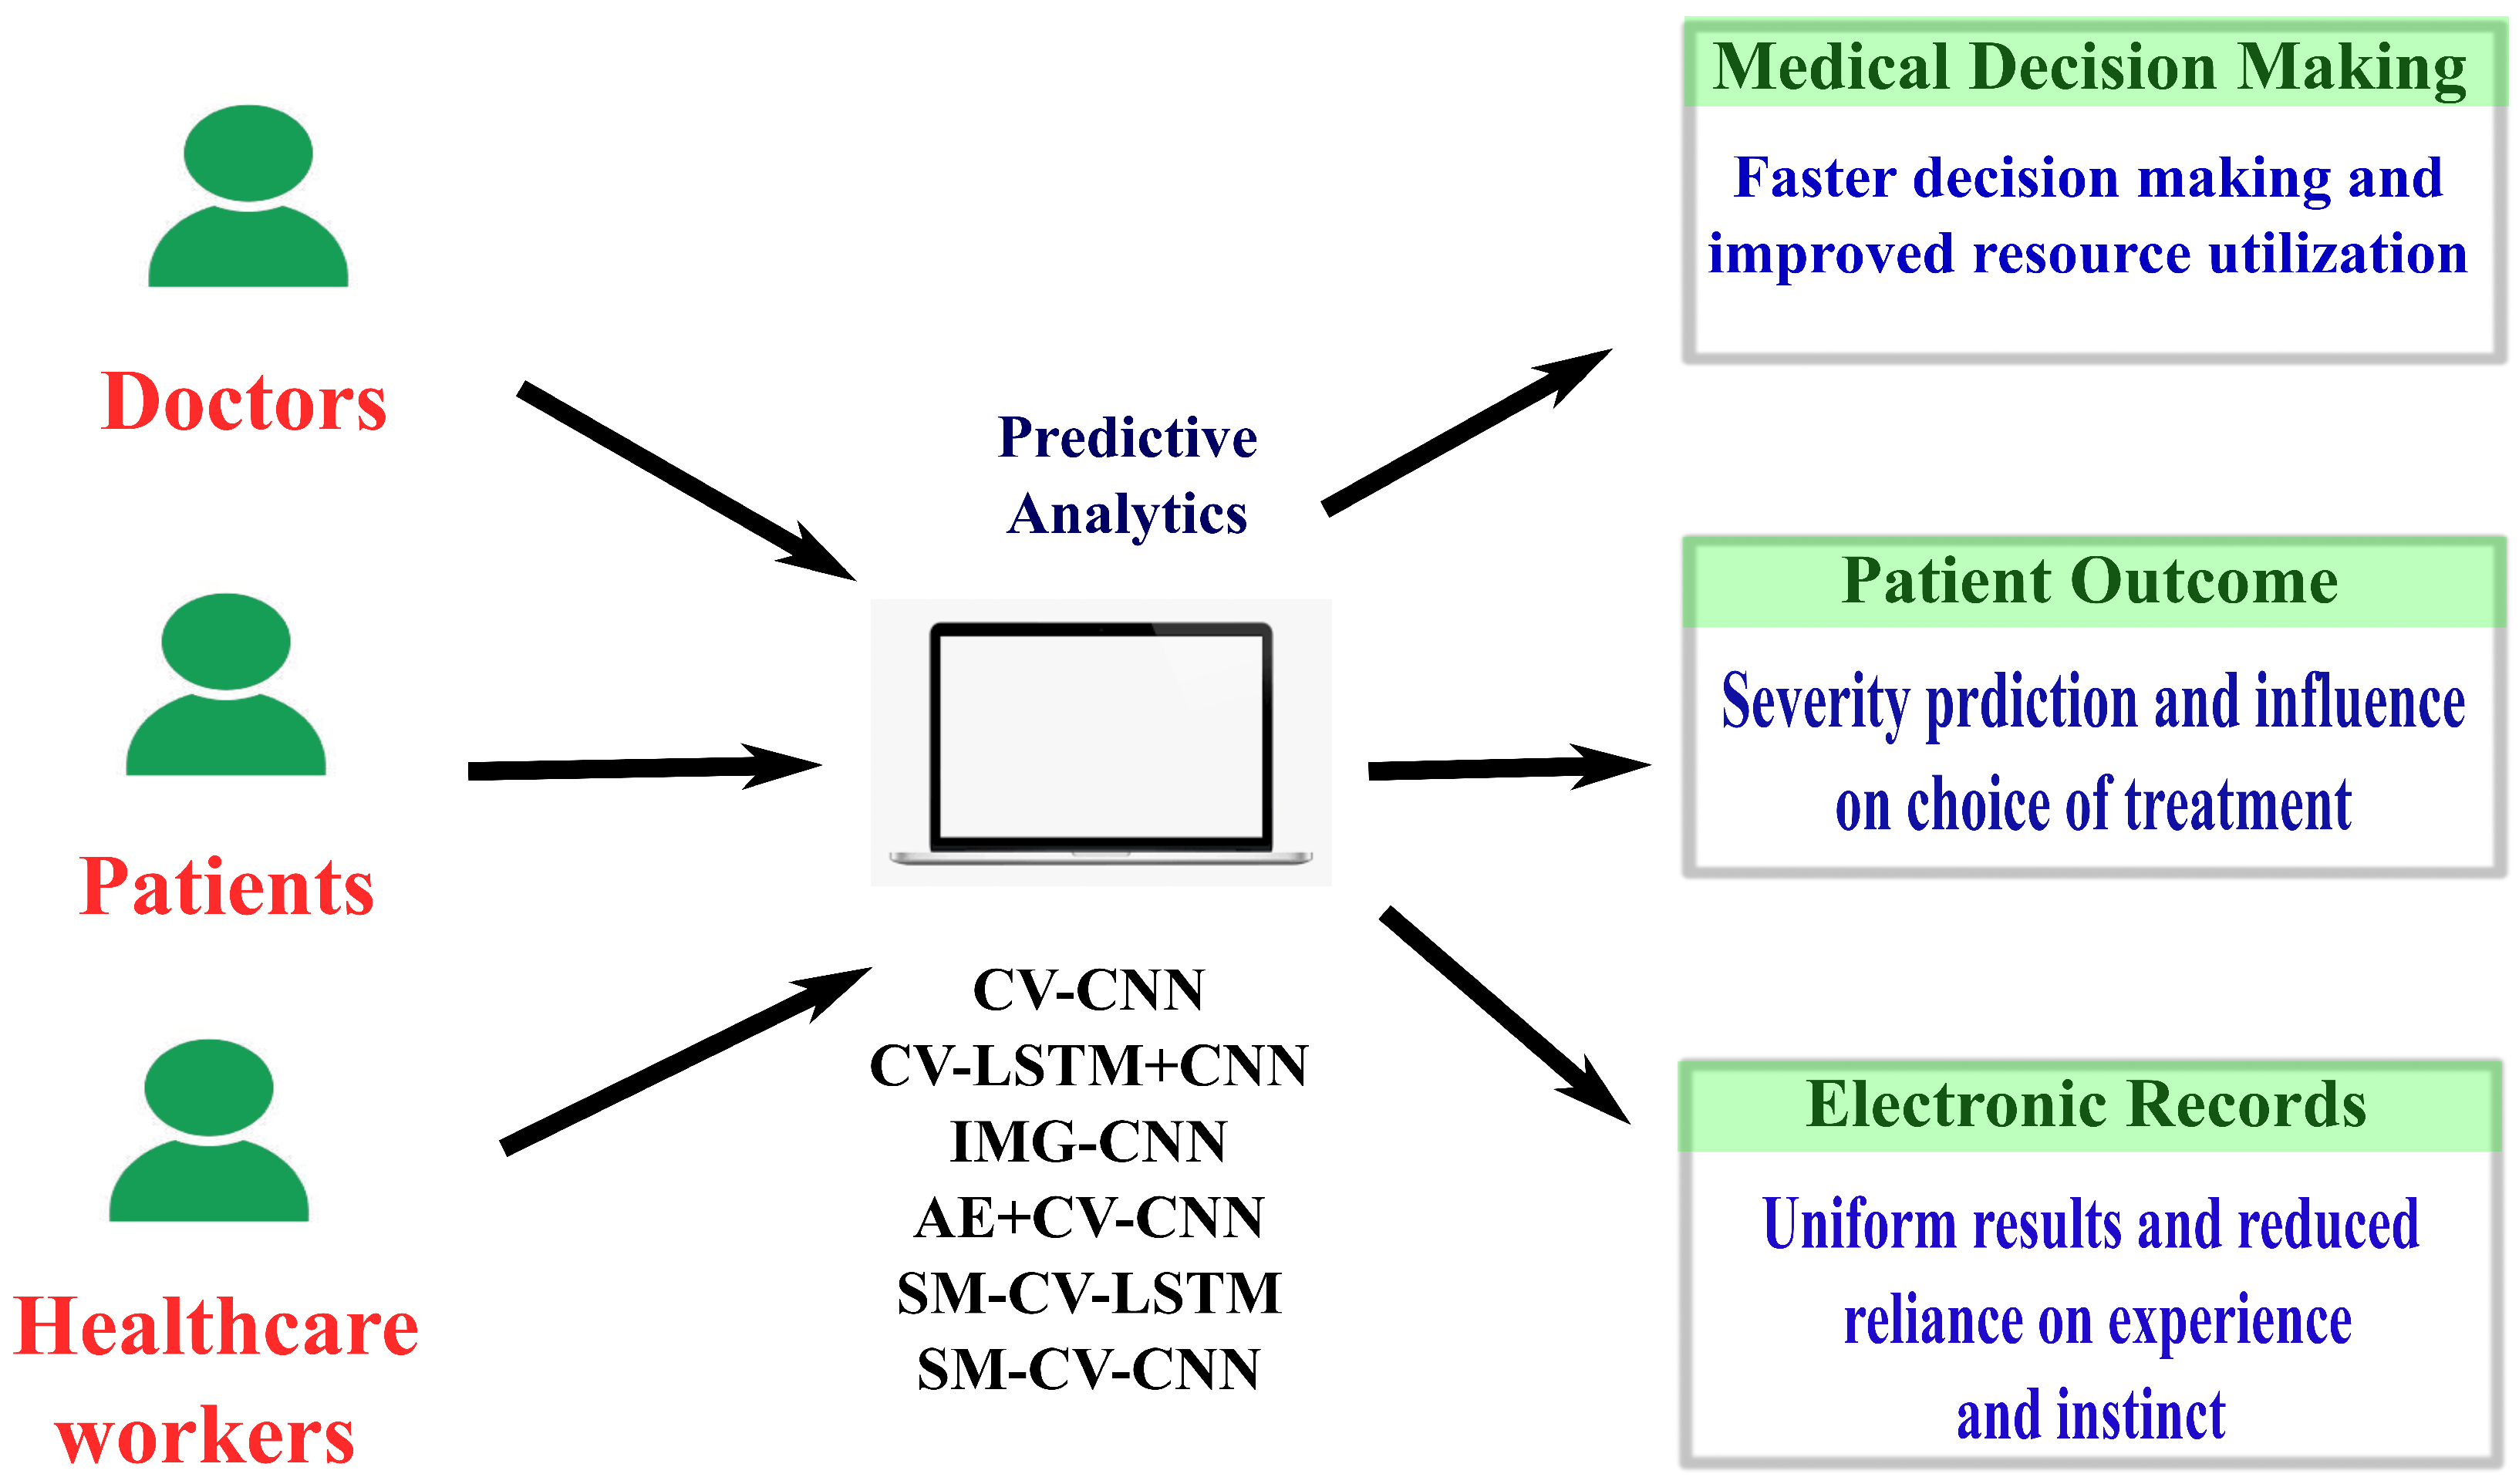
3. Application
3.1. Medical Decision Making
3.2. Improving Patient Outcomes
3.3. Healthcare Workers
4. Methodology
4.1. Dataset
4.2. Preprocessing
4.3. Data Augmentation
4.4. Proposed Models
4.4.1. CV-CNN Model
| Algorithm 1 CV-CNN Model Classification |
Input Clinical dataset DF: (4710 records), training epochs N, number of folds K Output Classification
|
4.4.2. CV-LSTM+CNN Model
| Algorithm 2 CV-LSTM+CNN Model Classification |
Input Clinical dataset DF: (4710 records), training epochs N, number of folds K Output Classification
|
4.4.3. IMG-CNN Model
| Algorithm 3 IMG-CNN Model Classification |
Input Clinical dataset DF: (4710 records), training epochs N, number of folds K Output Classification
|
4.4.4. AE+CV-CNN Model
| Algorithm 4 AE+CV-CNN Model Classification |
Input Clinical dataset DF: (4710 records), auto-encoder training epochs AN, training epochs N, number of folds K Output Classification
|
4.4.5. SMOTE-CV-LSTM Model
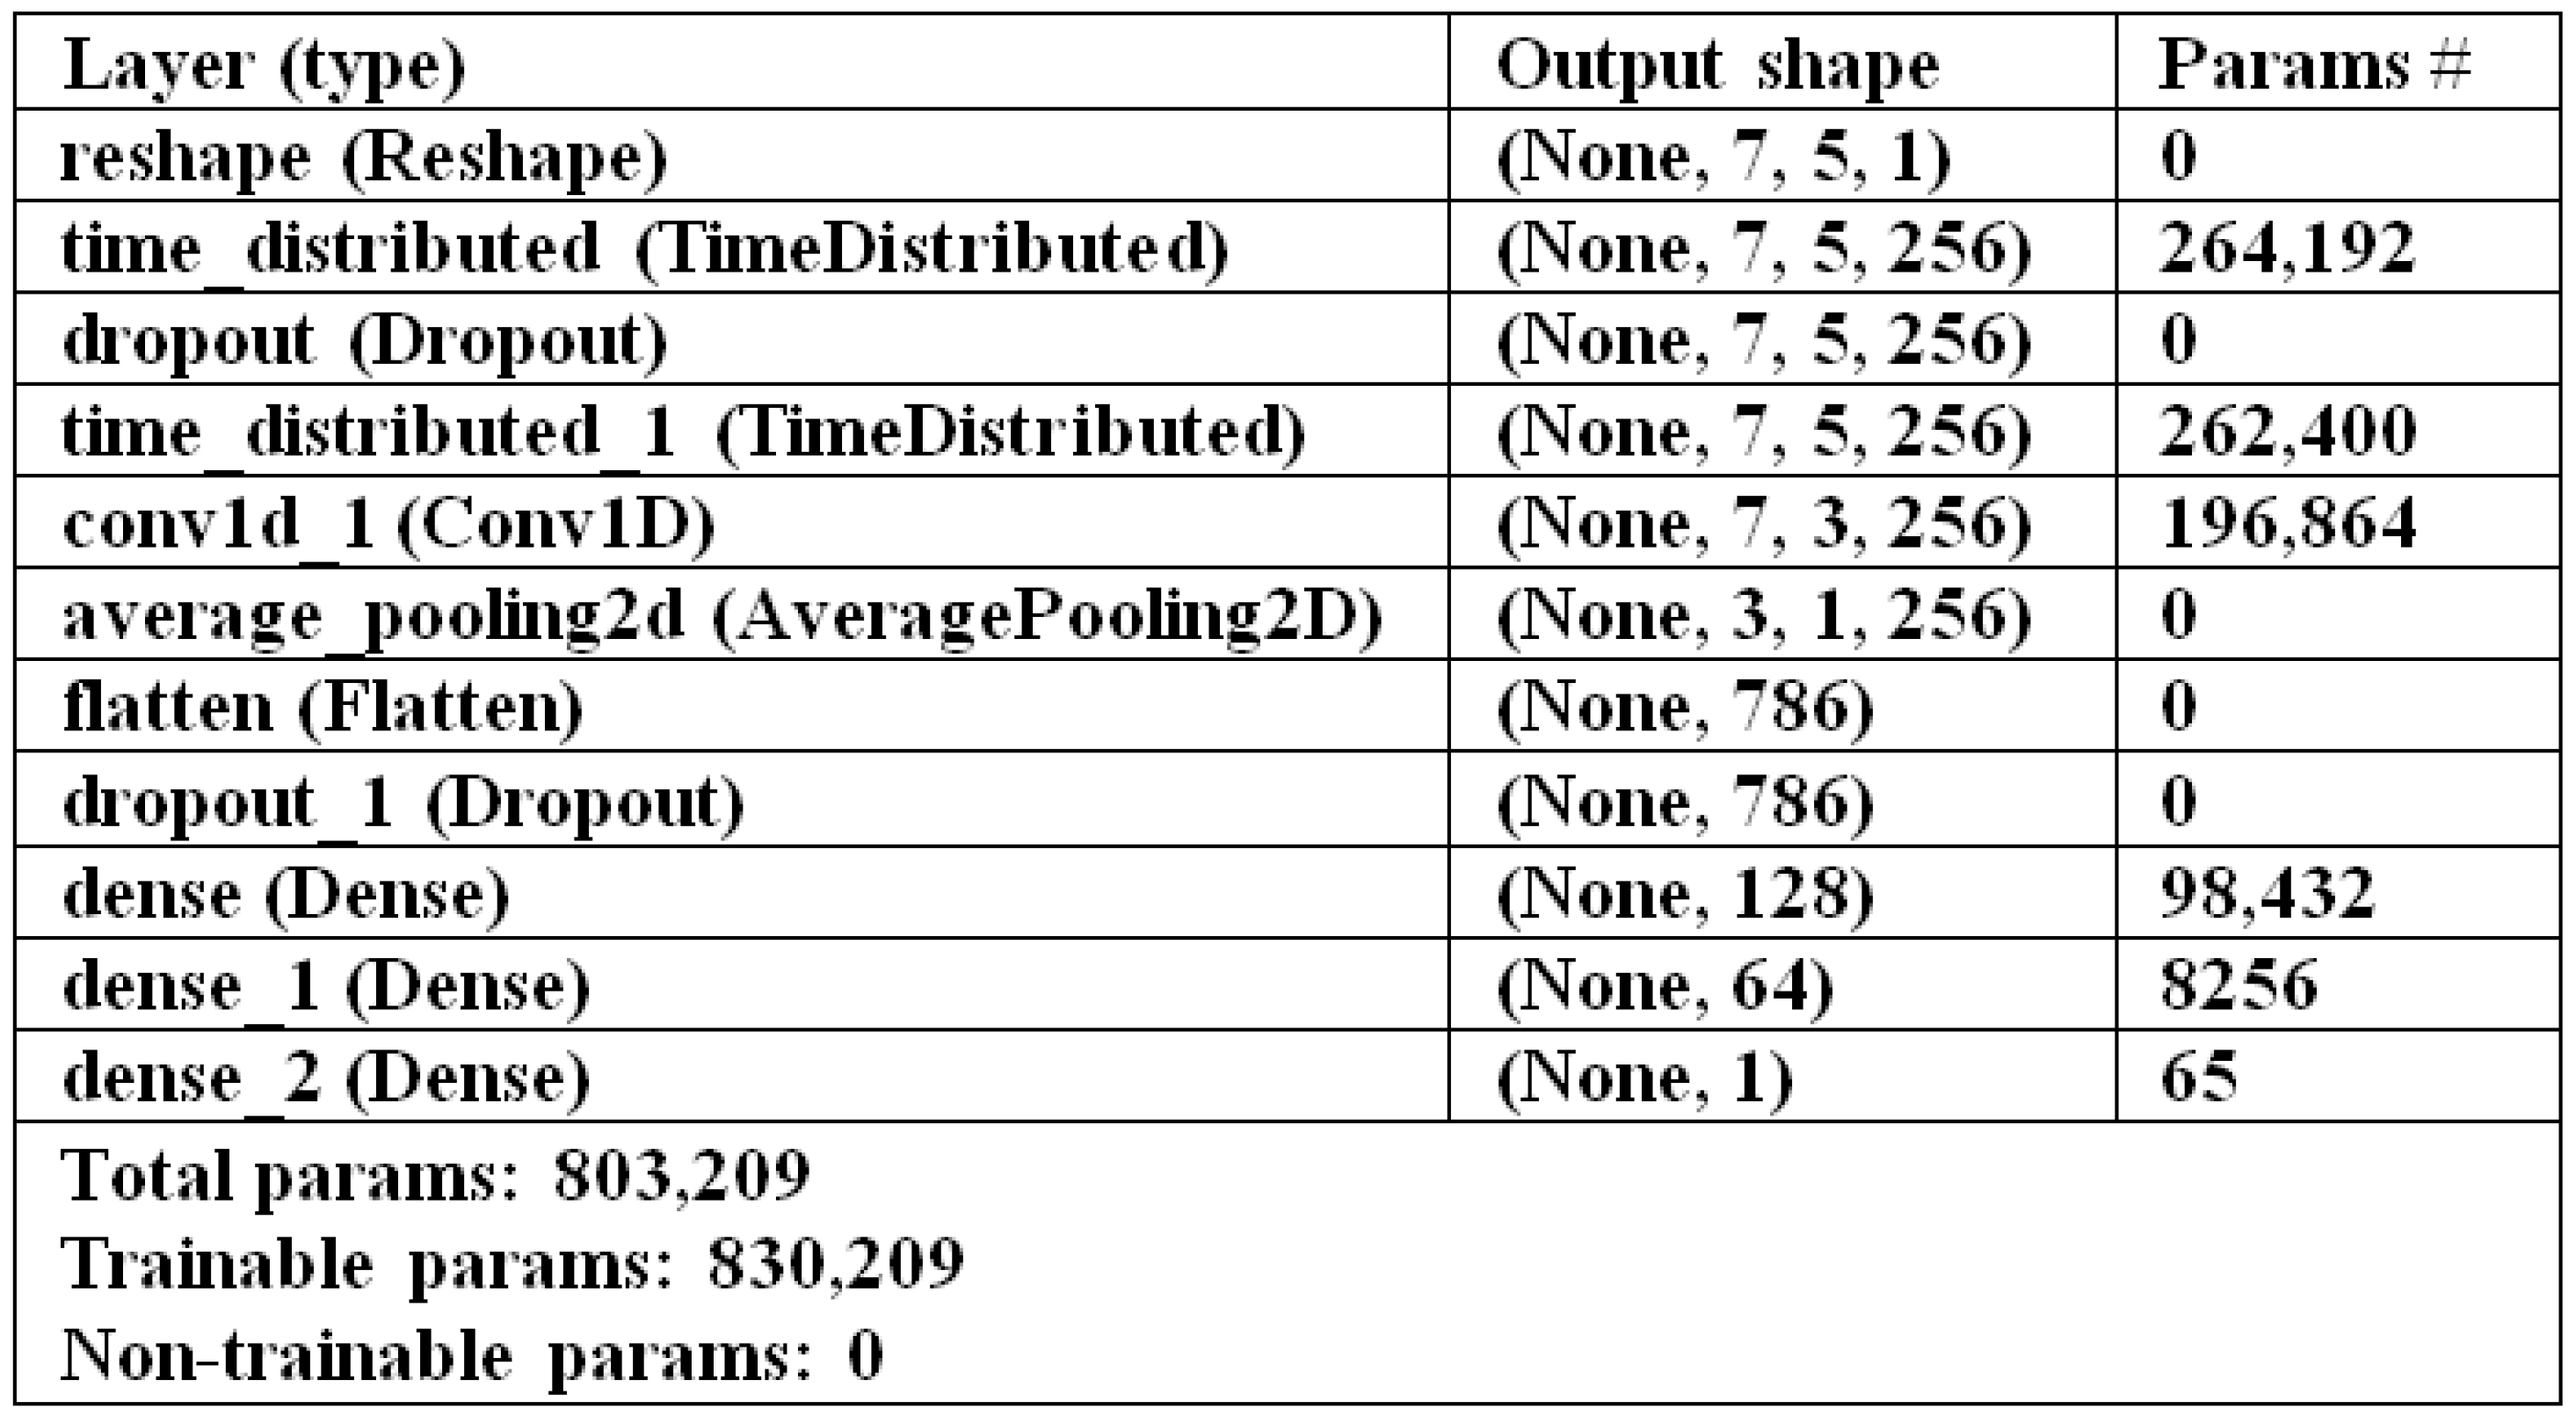
4.4.6. SMOTE-CV-CNN Model
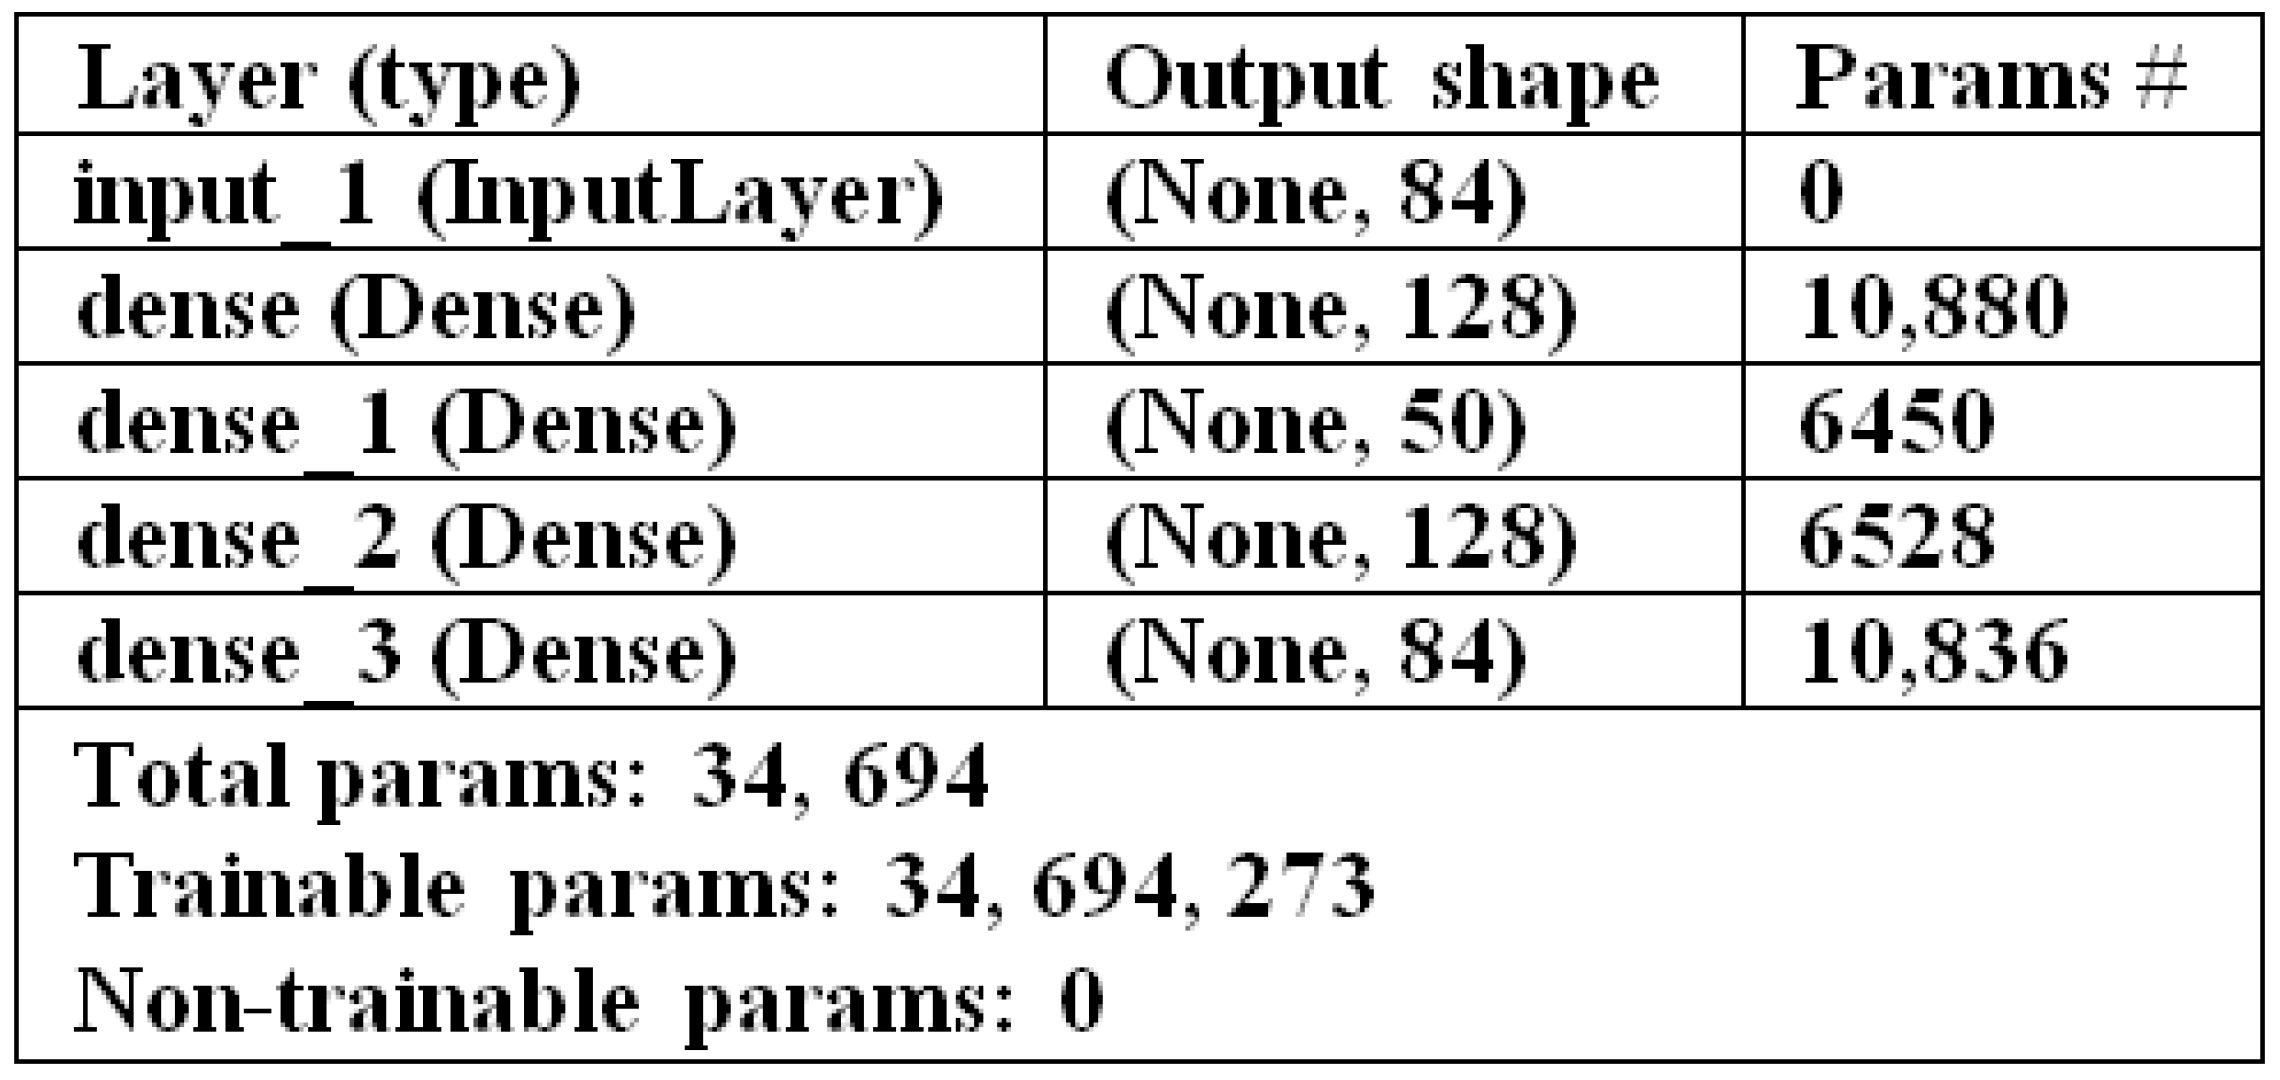
| Algorithm 5 A SMOTE-CV-LSTM Model Classification |
Input SMOTE generated dataset DF: (7124 records), training epochs N, number of folds K Output Classification
|
| Algorithm 6 A SMOTE-CV-CNN Model Classification |
Input SMOTE dataset DF: (7126 records), training epochs N, number of folds K Output Classification
|
5. Experimental Results and Discussions
5.1. Performance Evaluation Metrics
- Accuracy: The number of examples correctly predicted from the total number of examples. It is defined in Equation (1)
- Precision: Represents the number of actual samples and is predicted as positive from the total number of samples predicted as positive. It is given in Equation (2)
- Recall: The number of actual samples and is predicted as positive from the total number of samples that are actually positive. It is presented in Equation (3)
- F1-Score: Harmonic mean of precision, and it is defined in Equation (4)
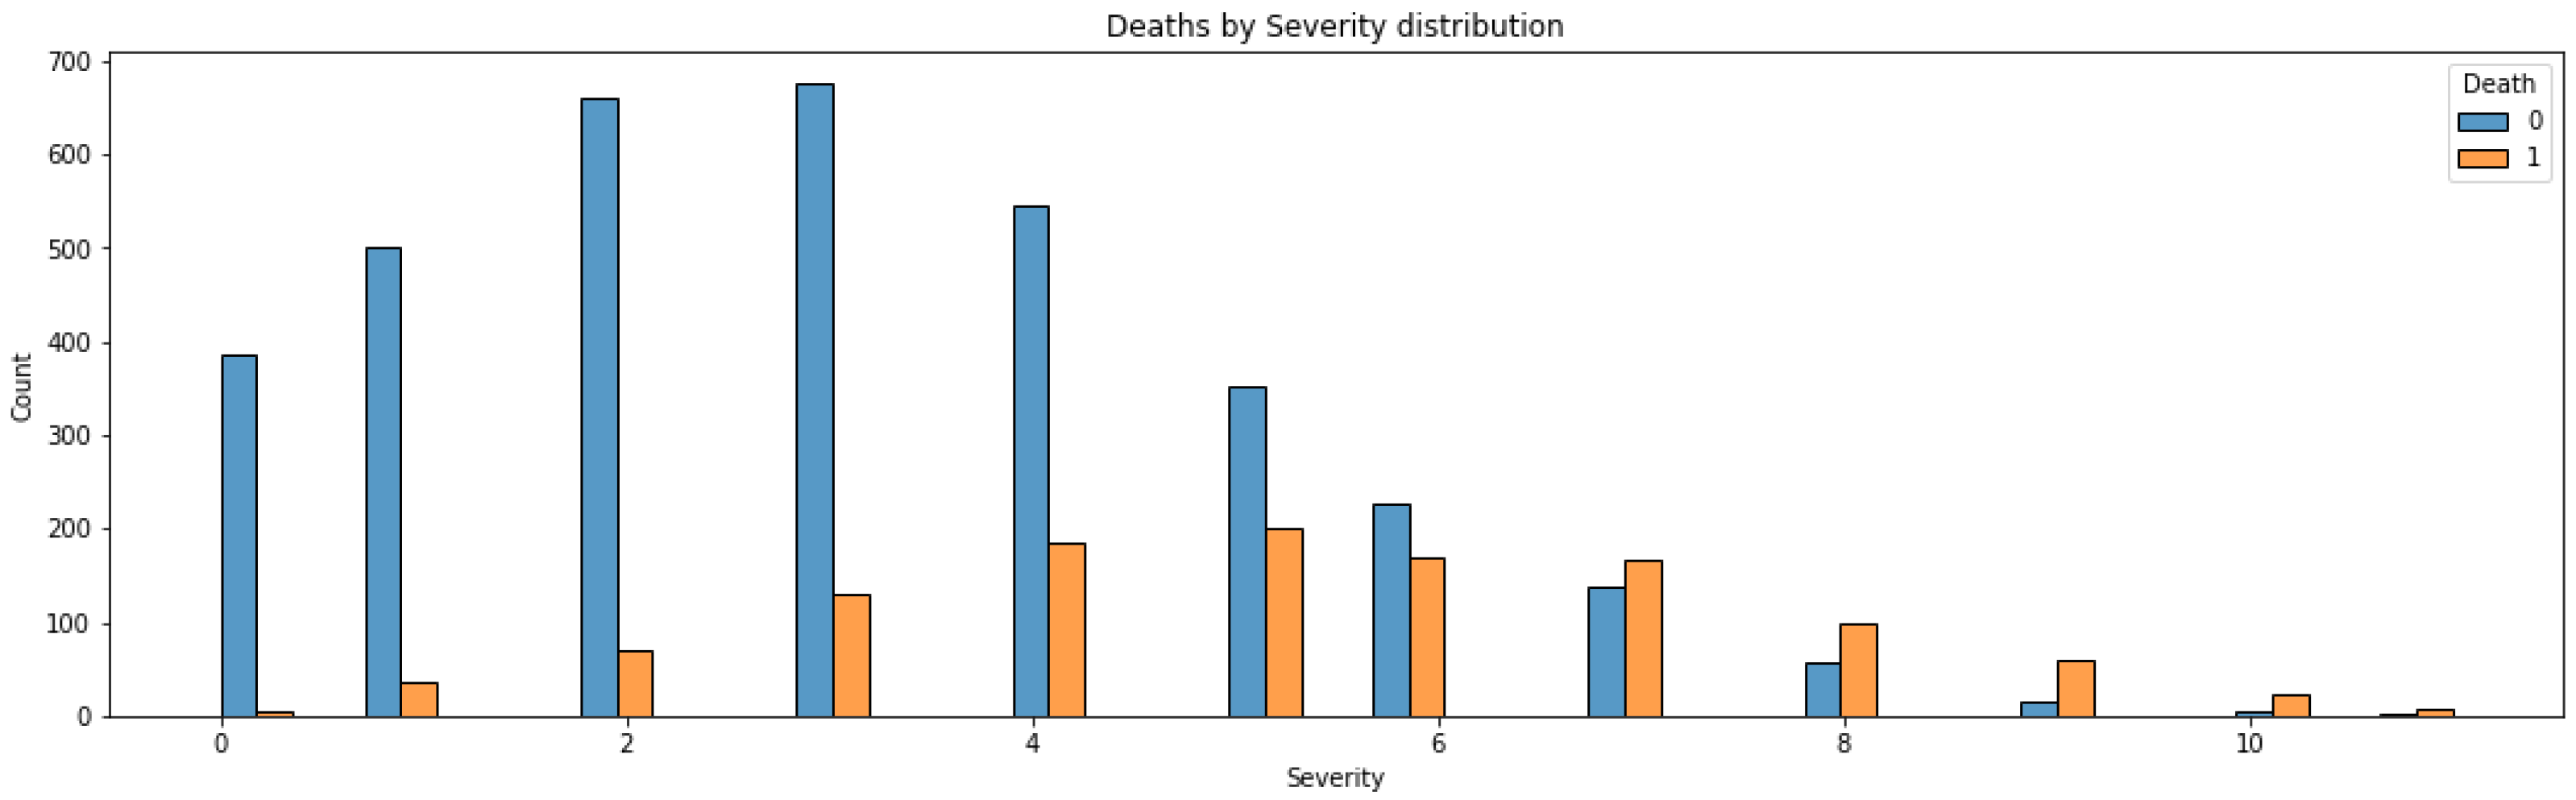
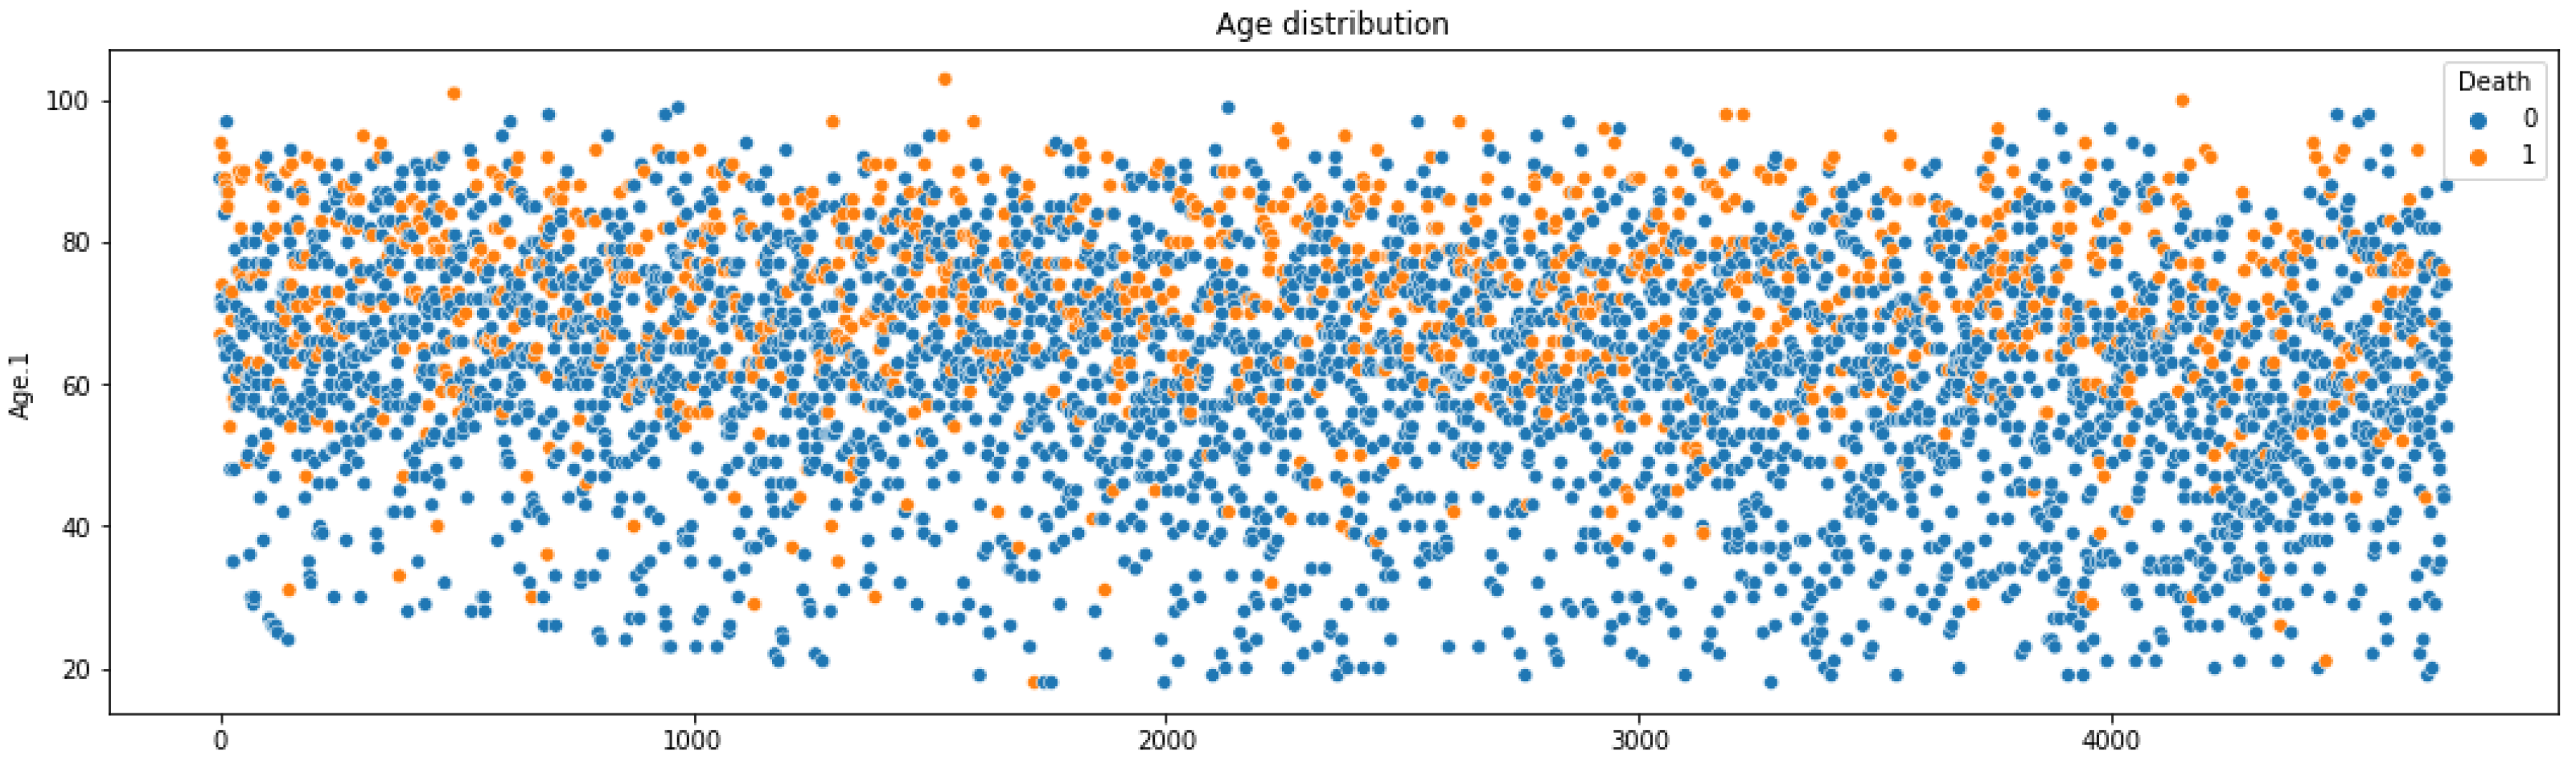
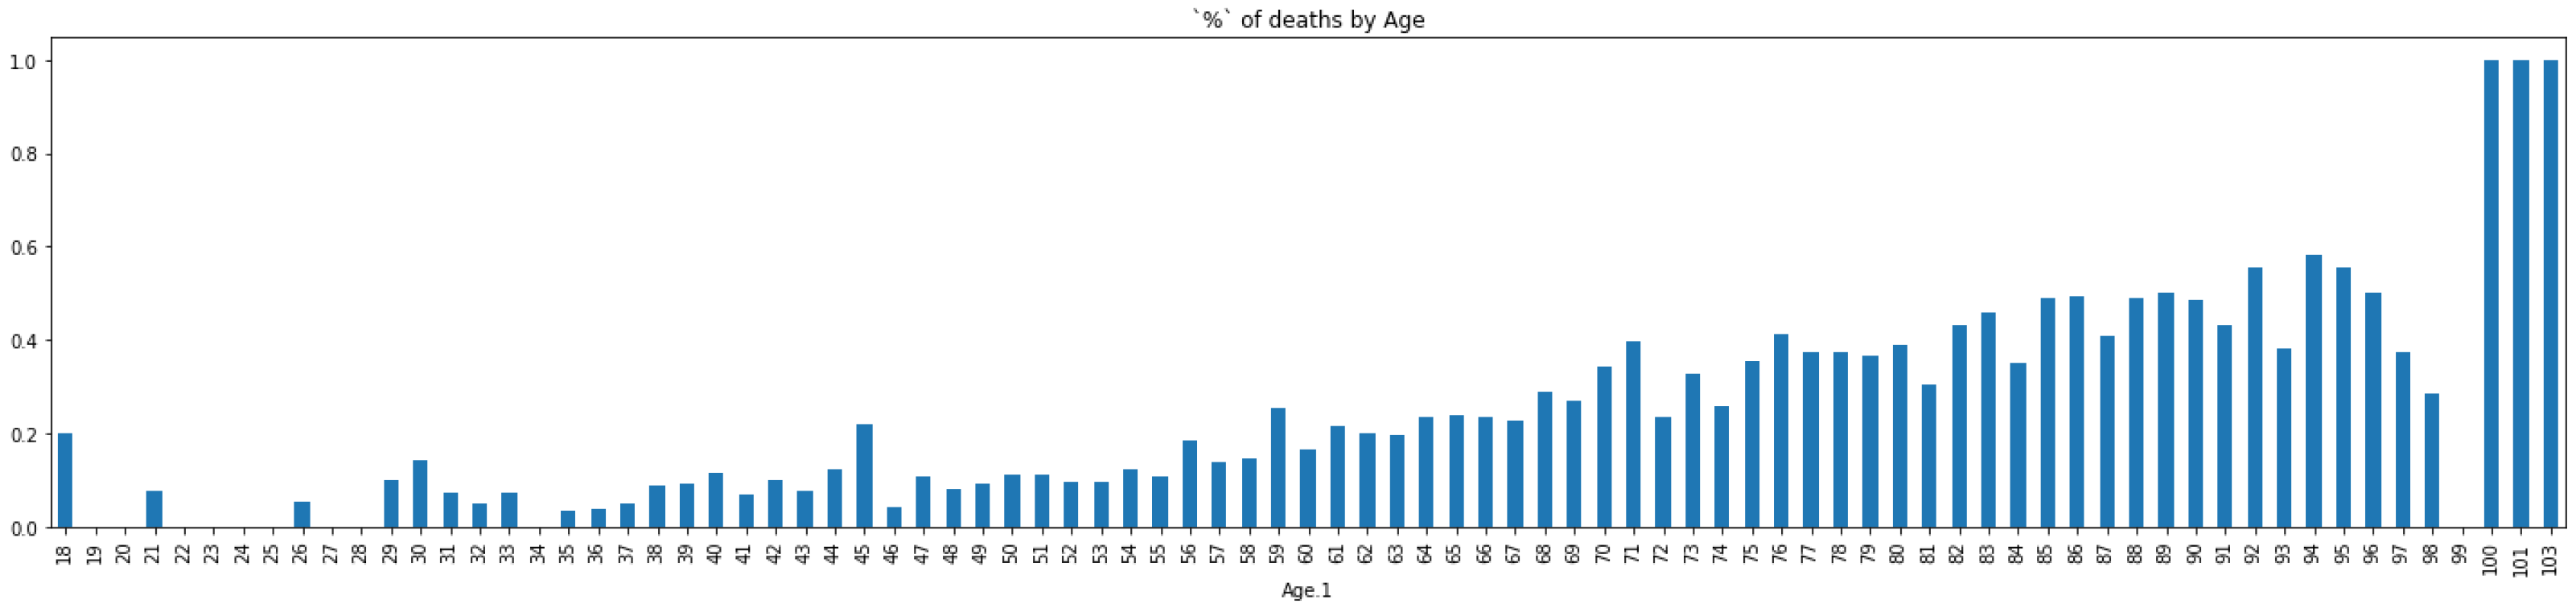
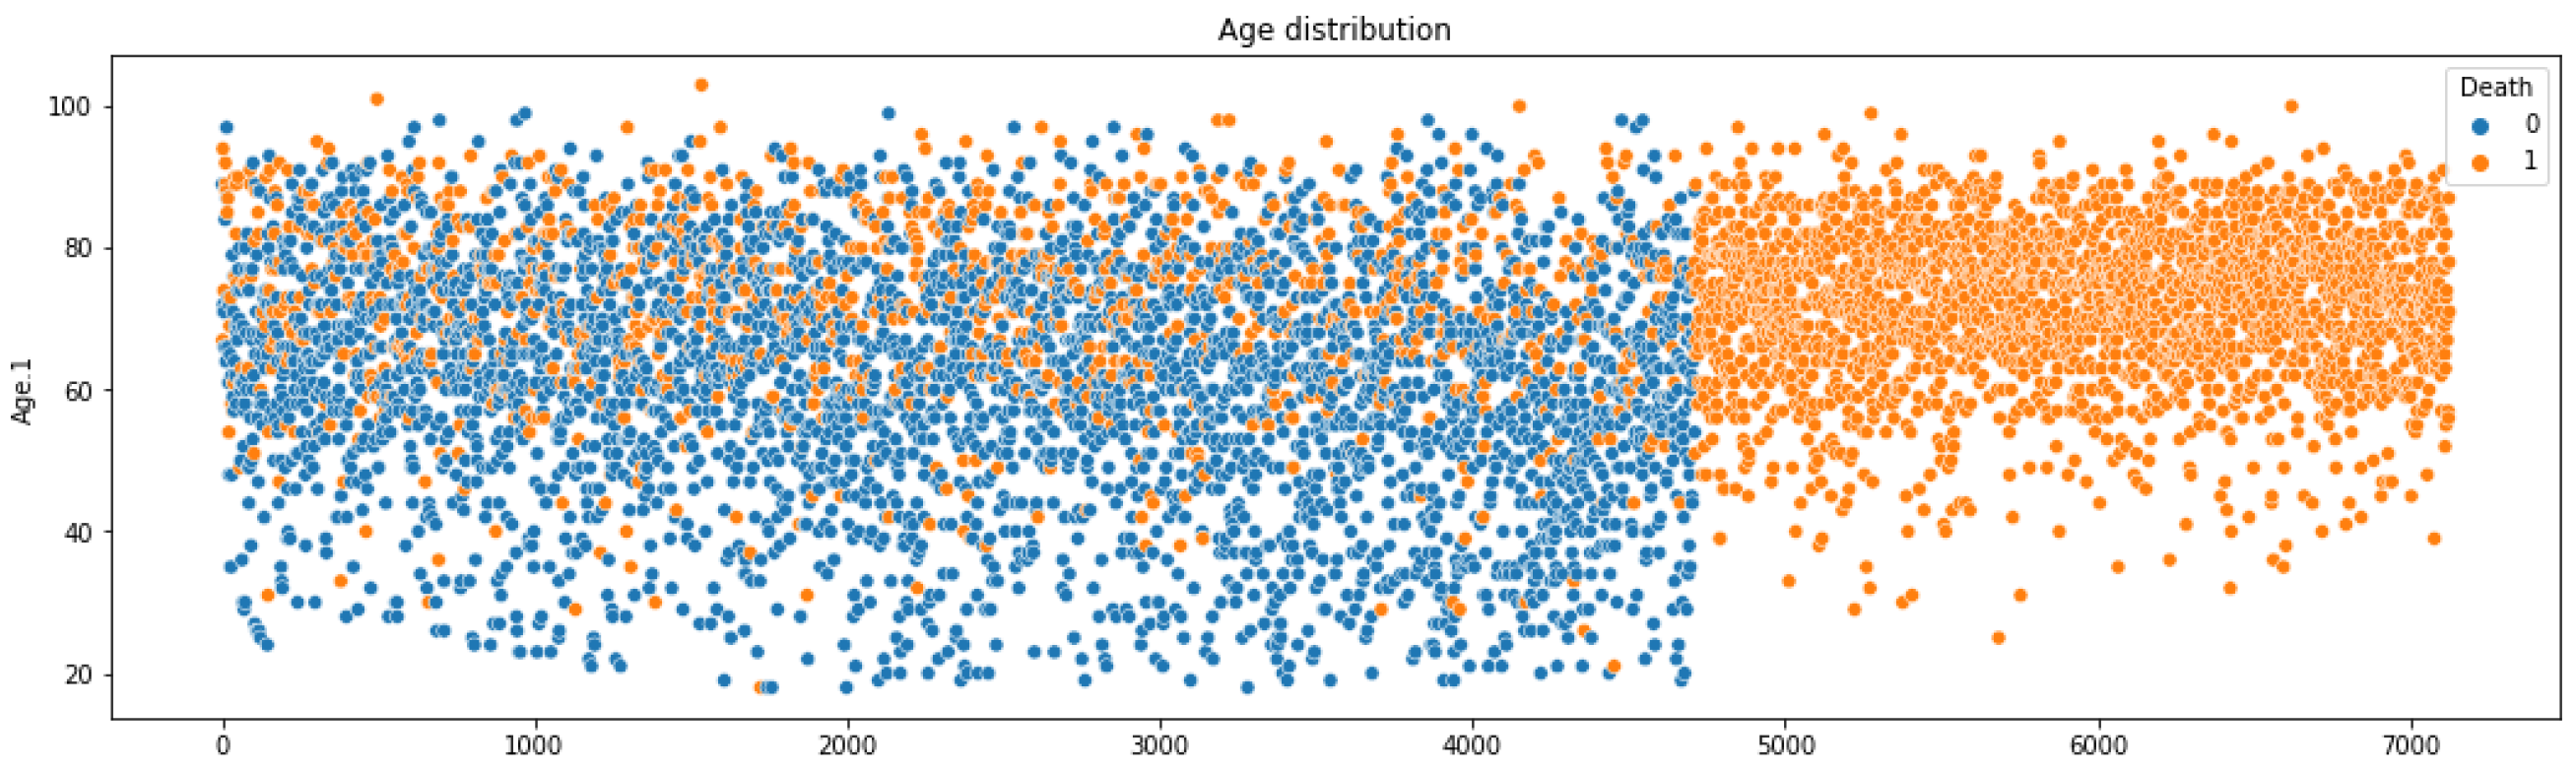
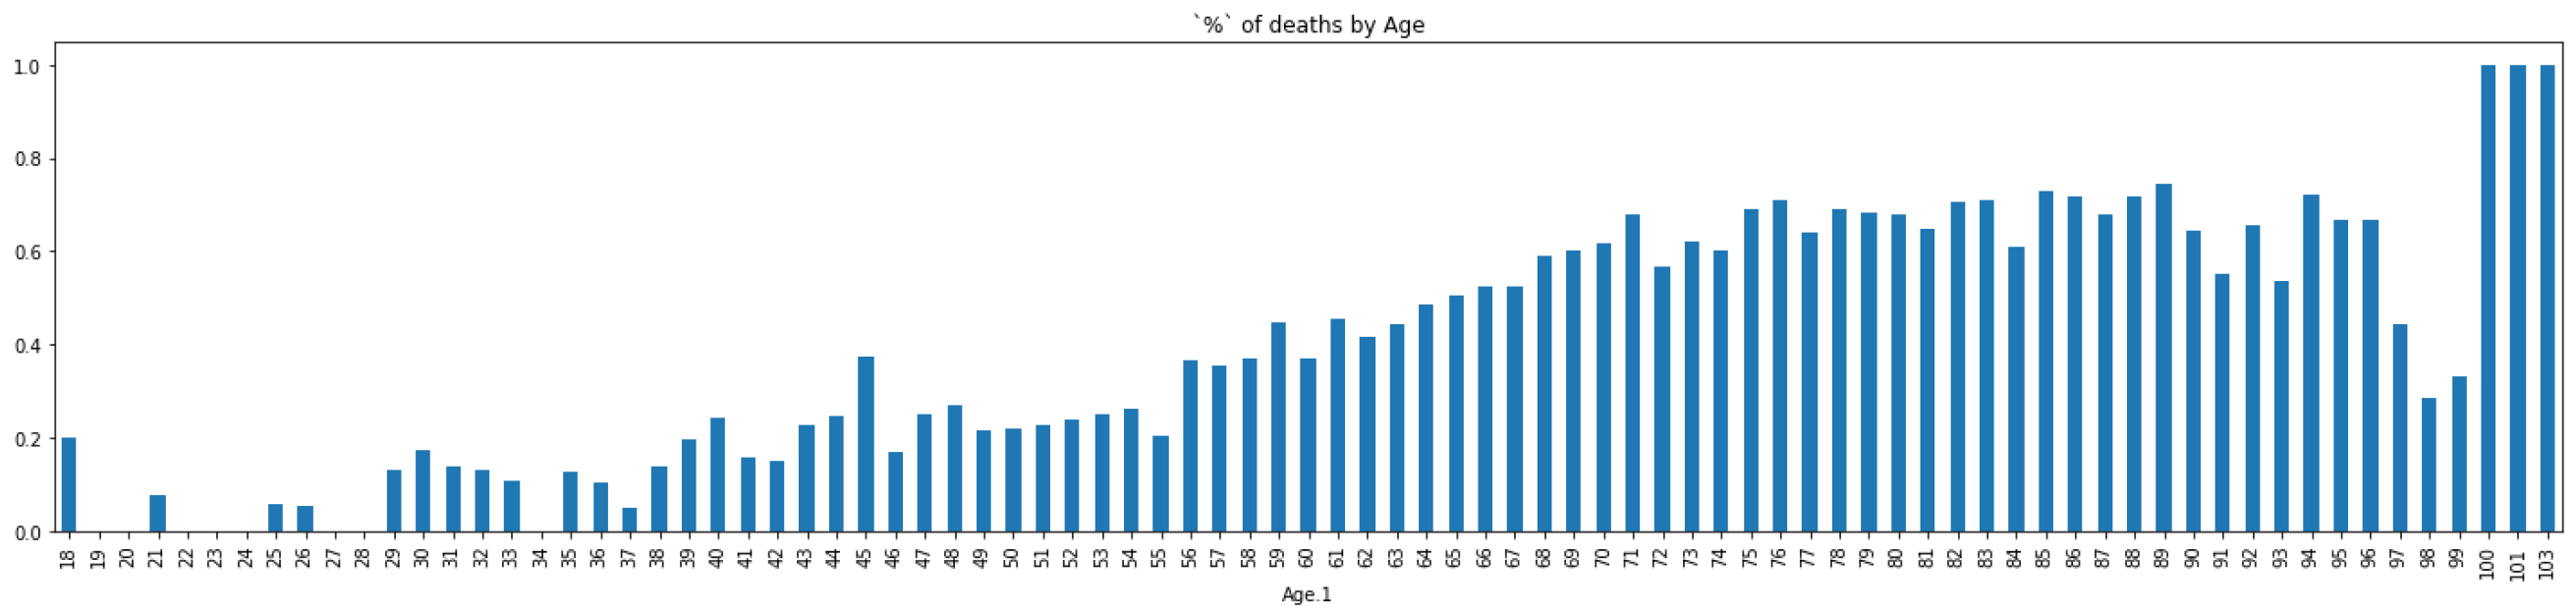
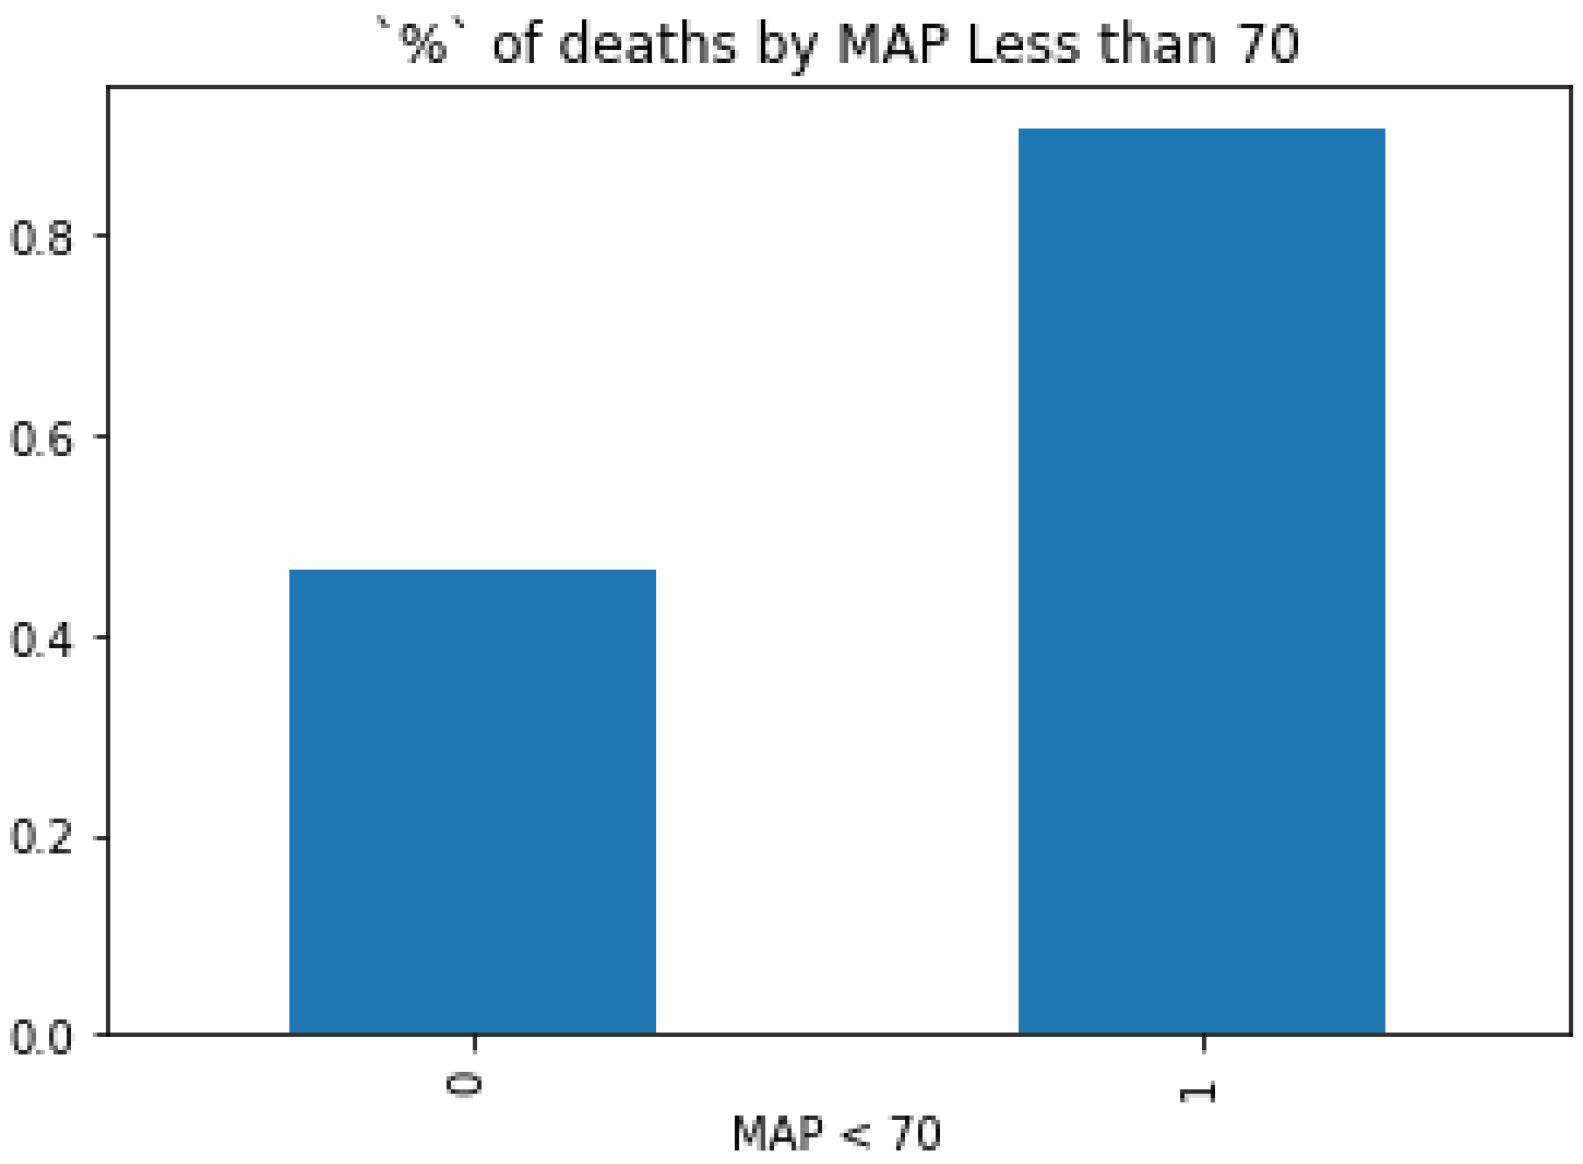
5.2. Key Information from Preprocessing
5.3. Experimental Result of Models
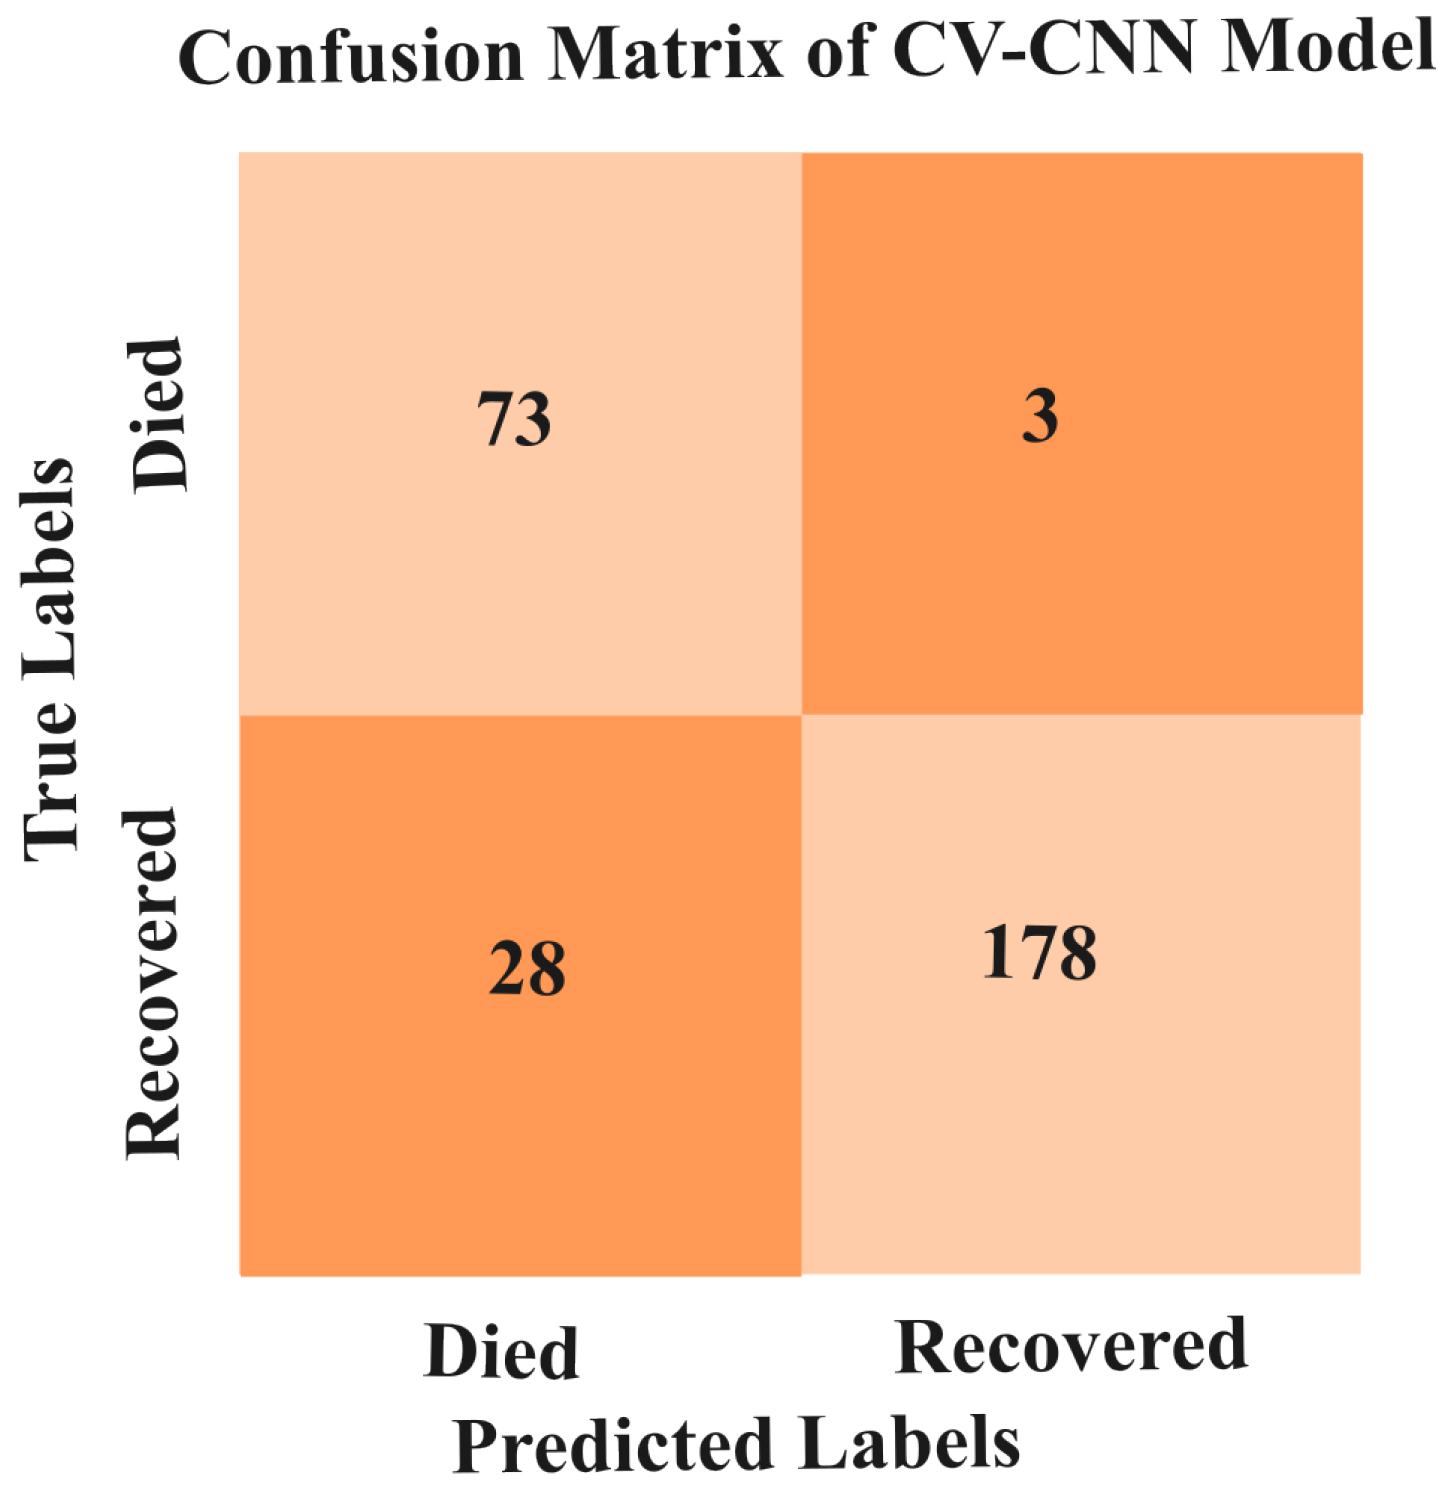
5.3.1. Results of CV-CNN Model
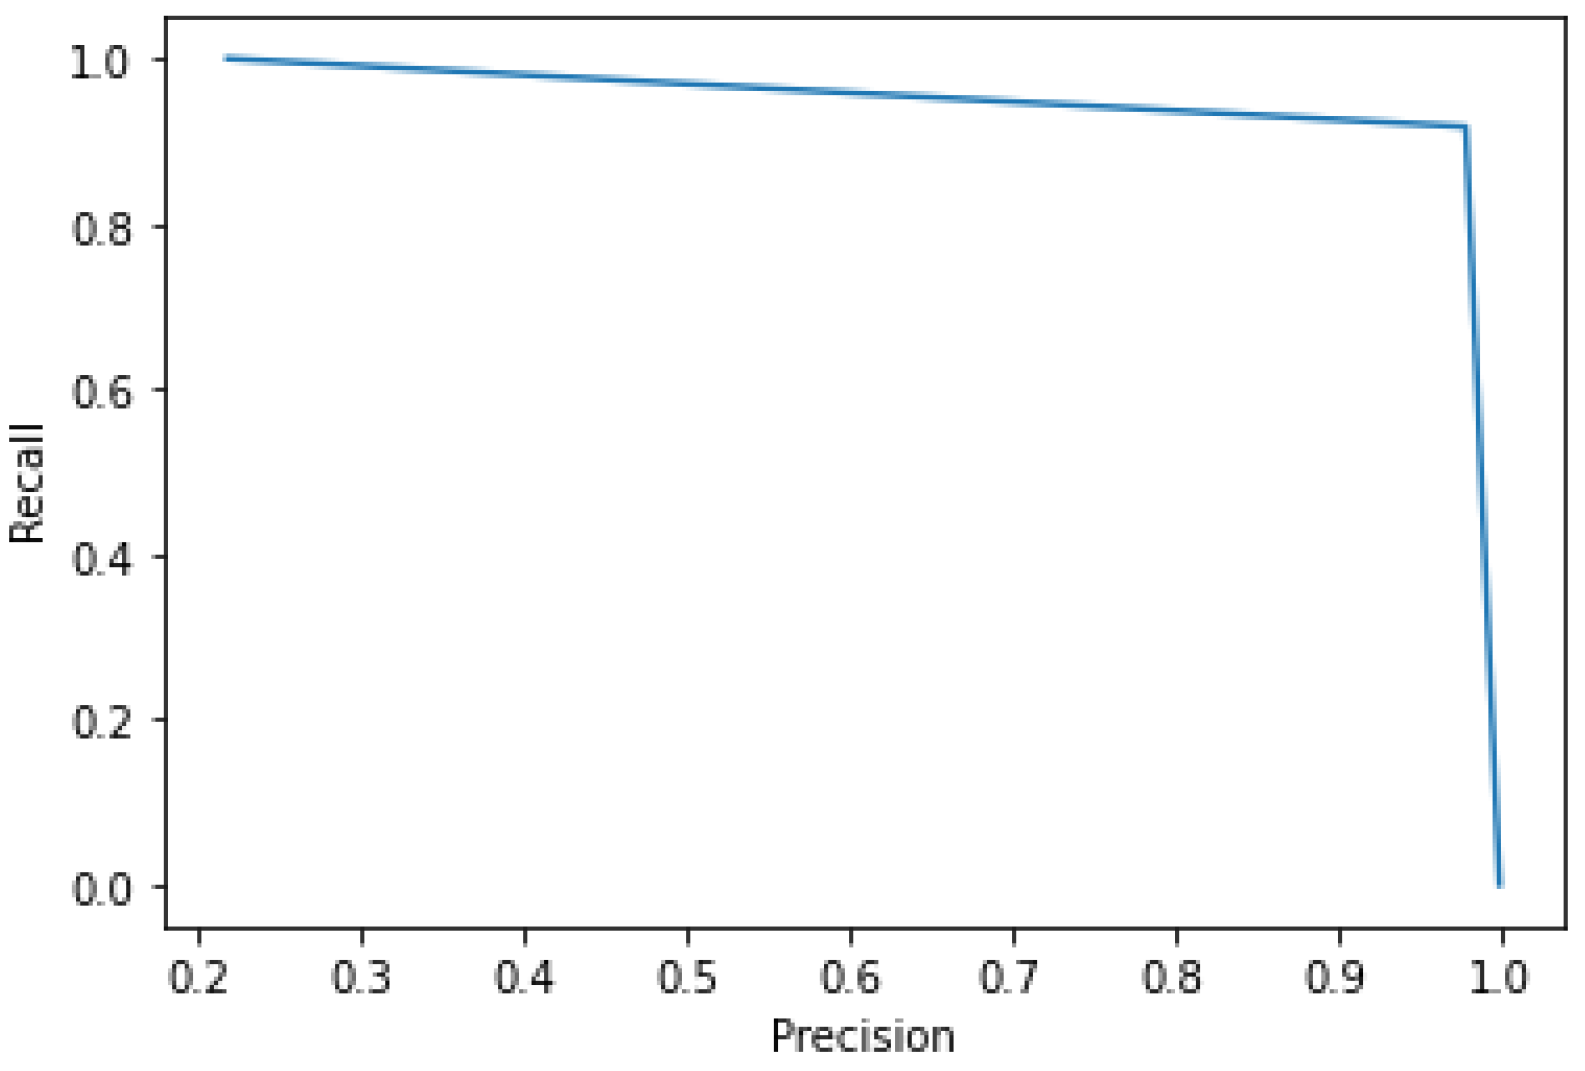
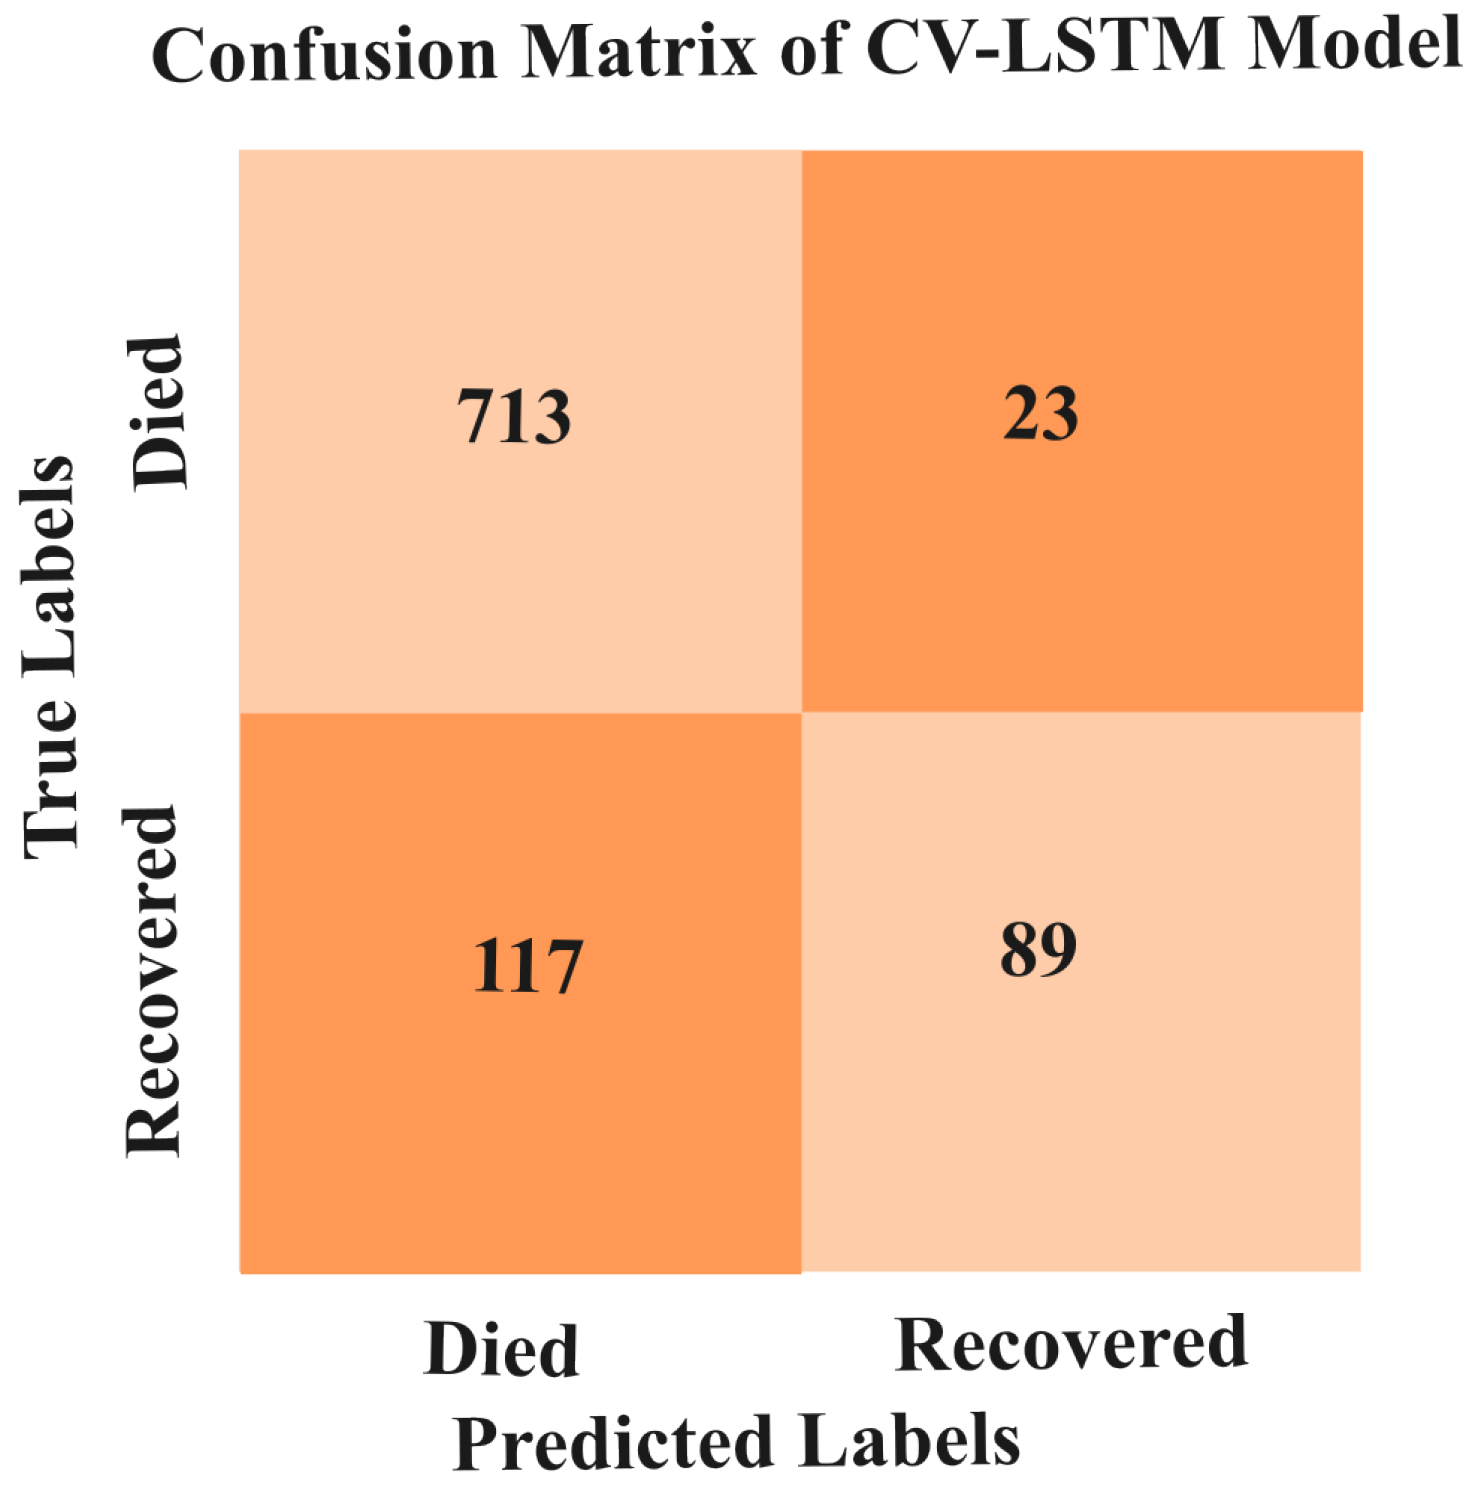
5.3.2. Results of CV-LSTM Model
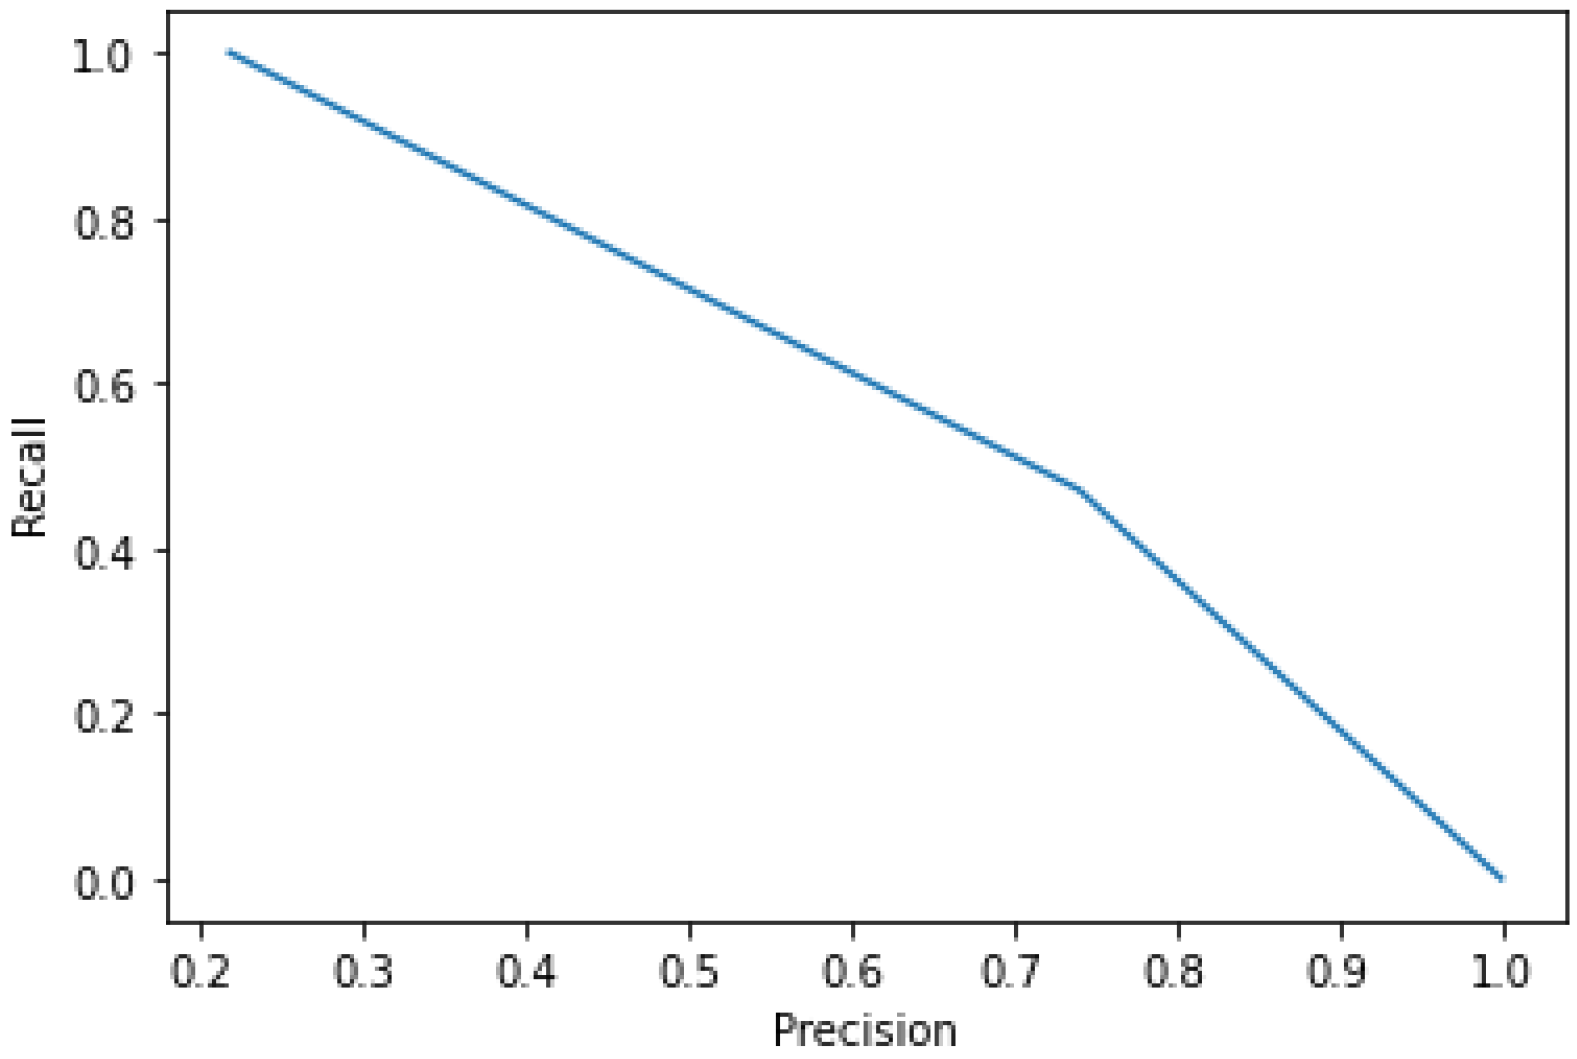
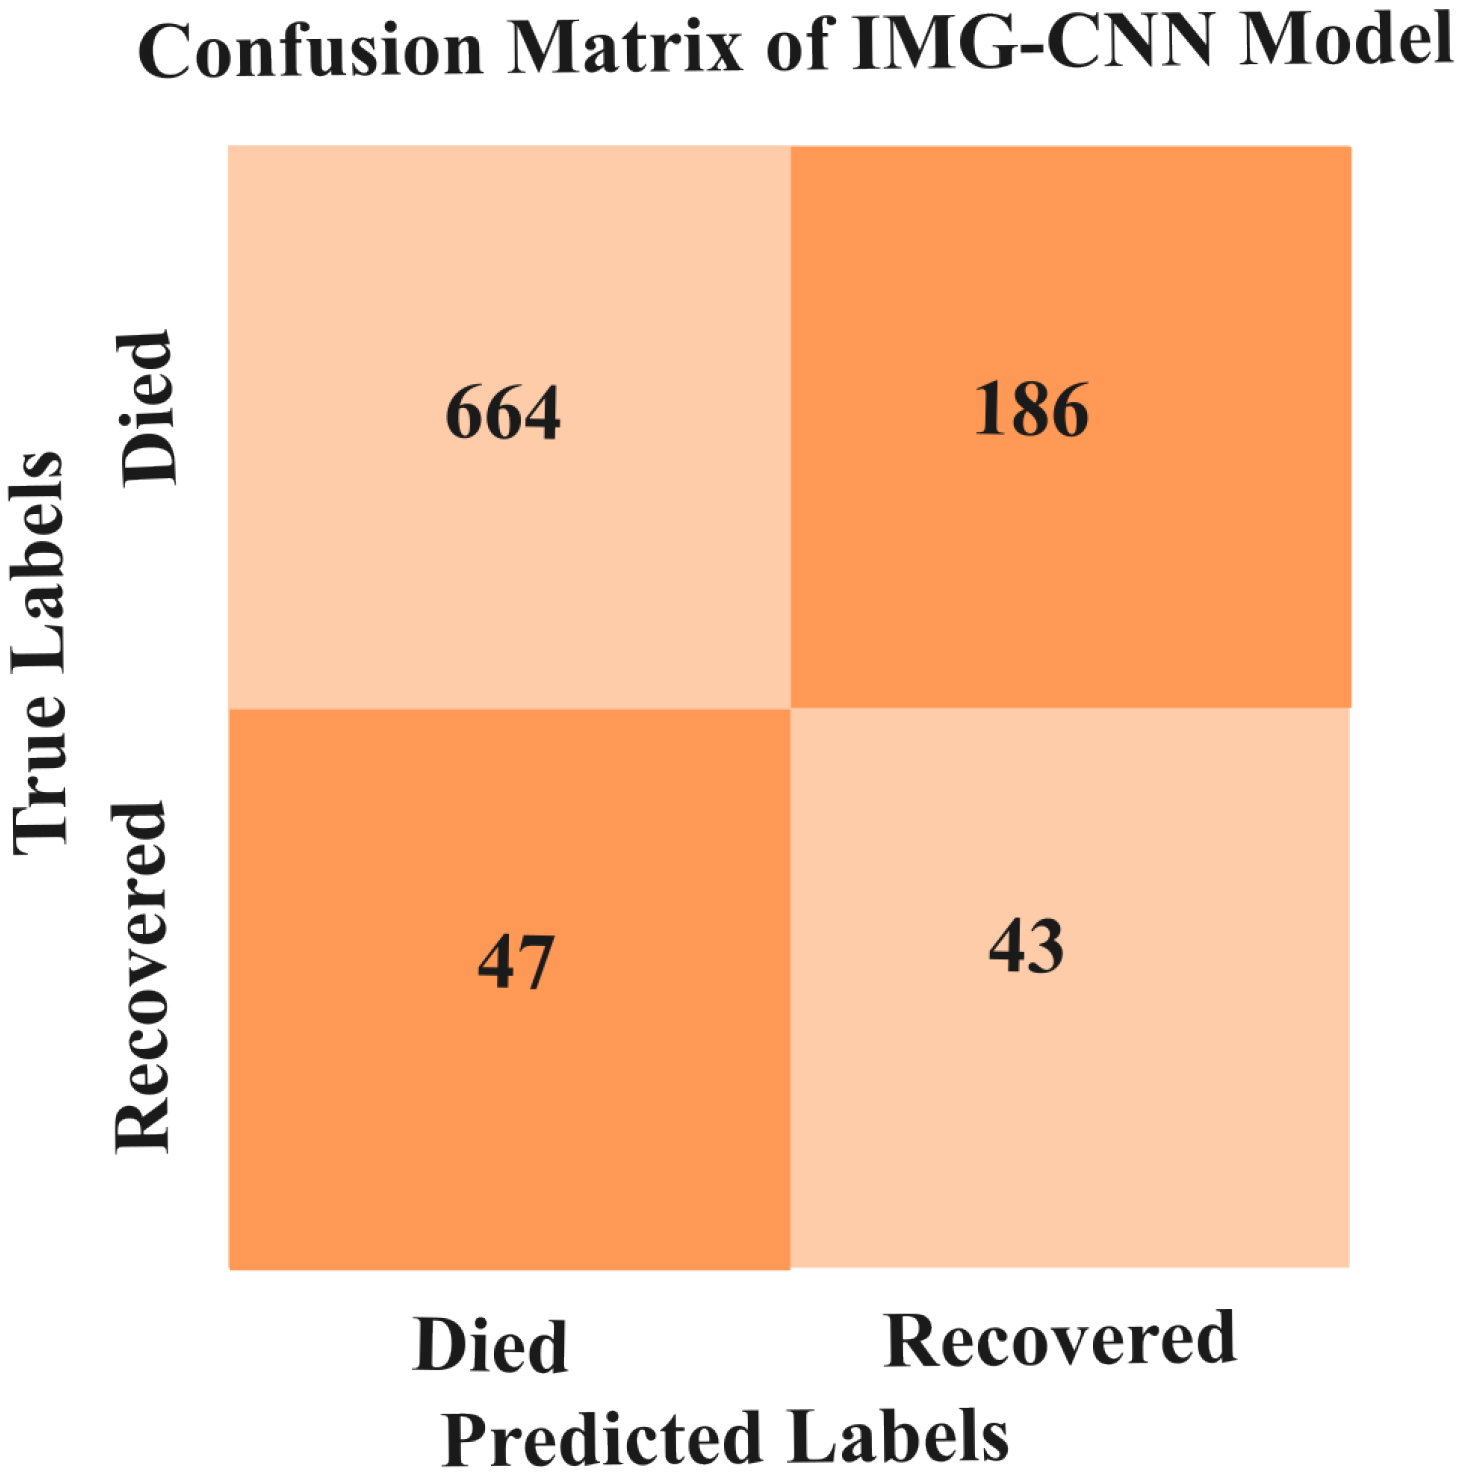
5.3.3. Results of IMG-CNN Model
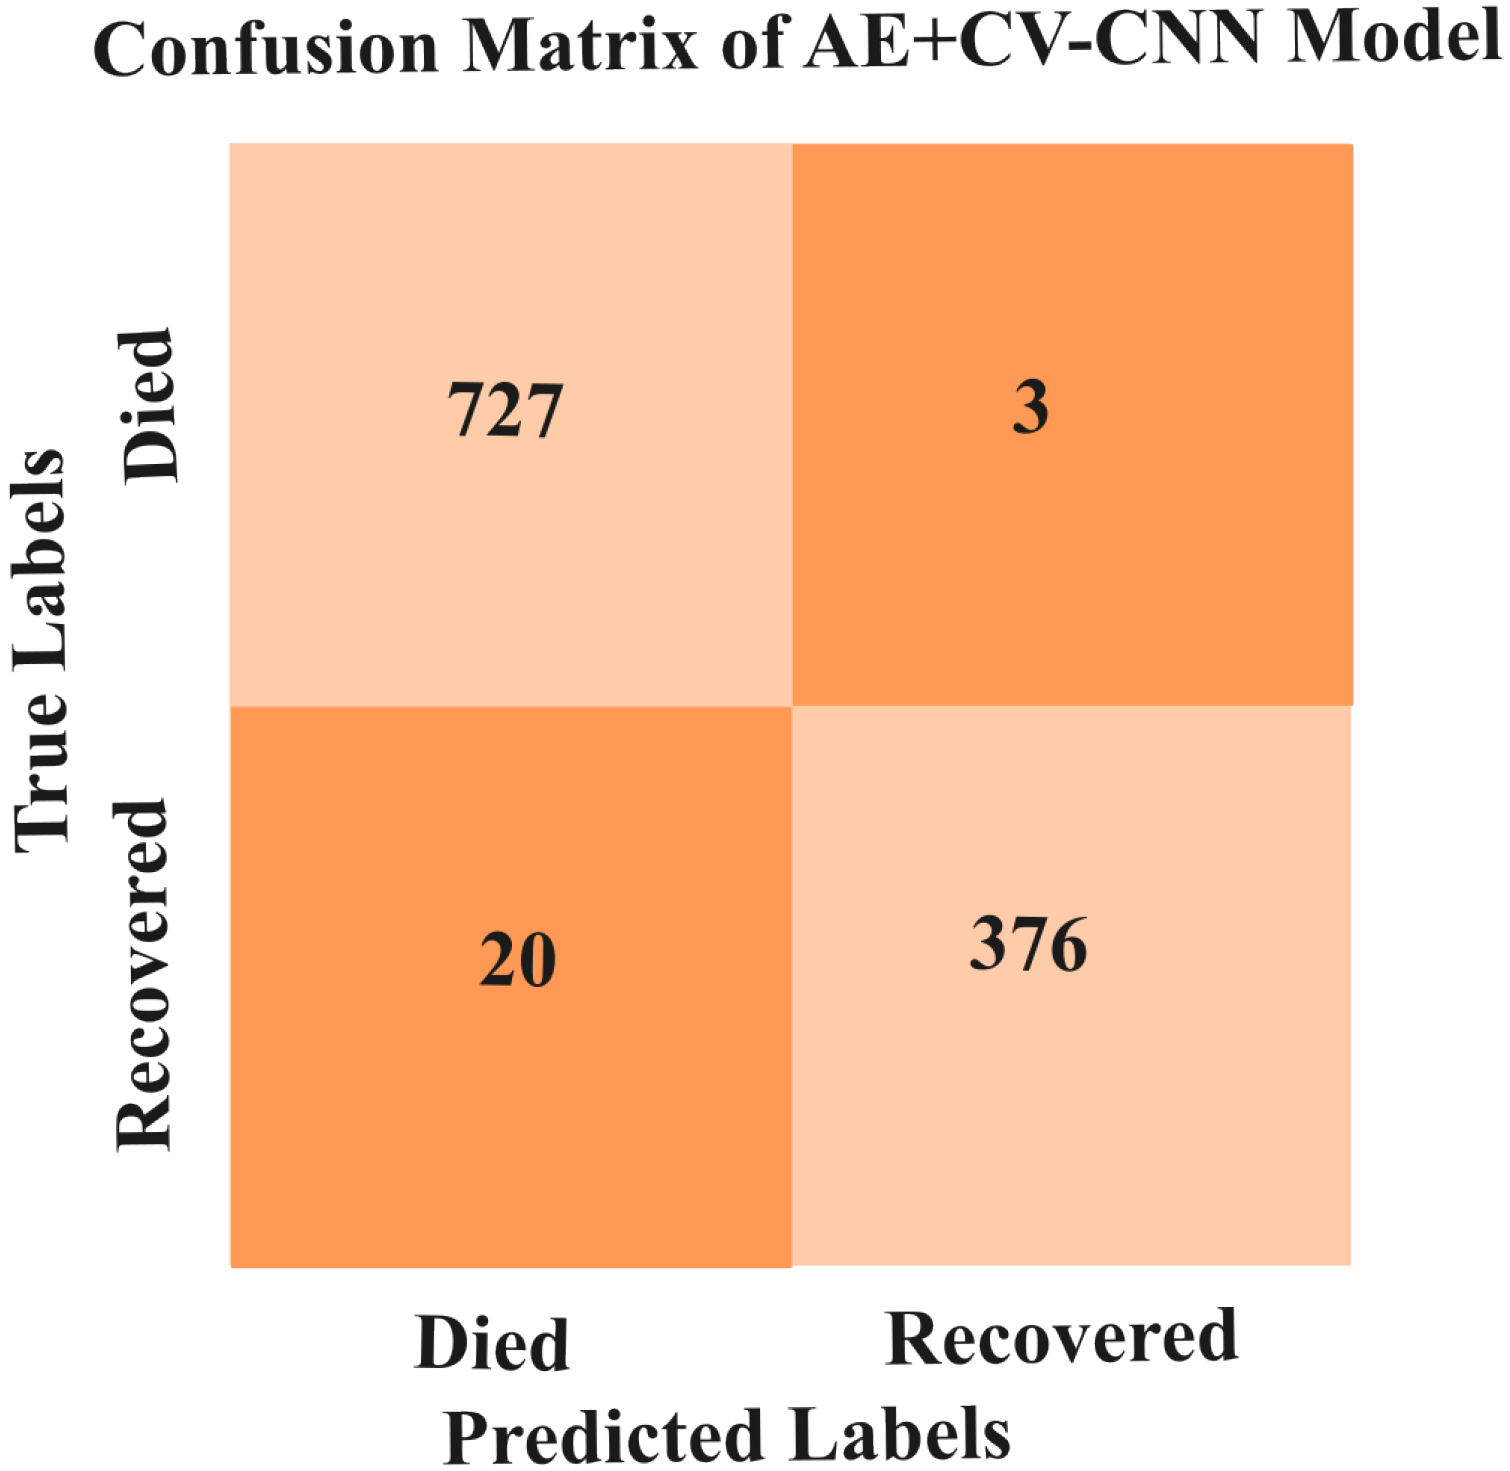
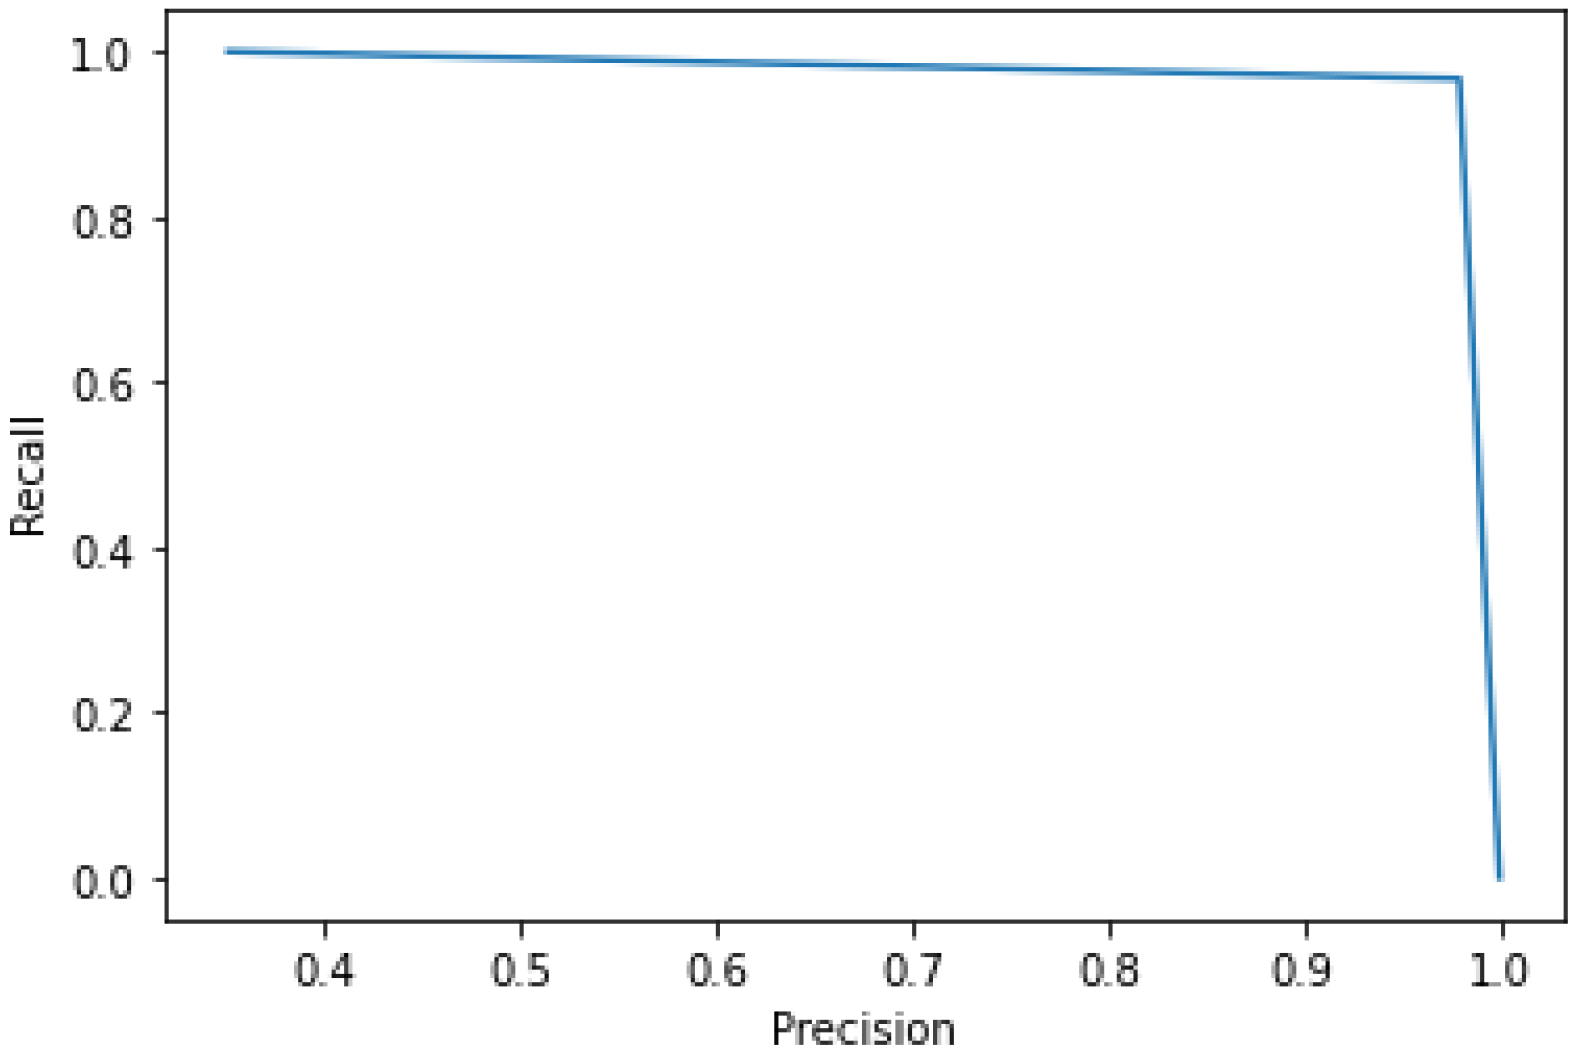
5.3.4. Result of AE+CV-CNN Model
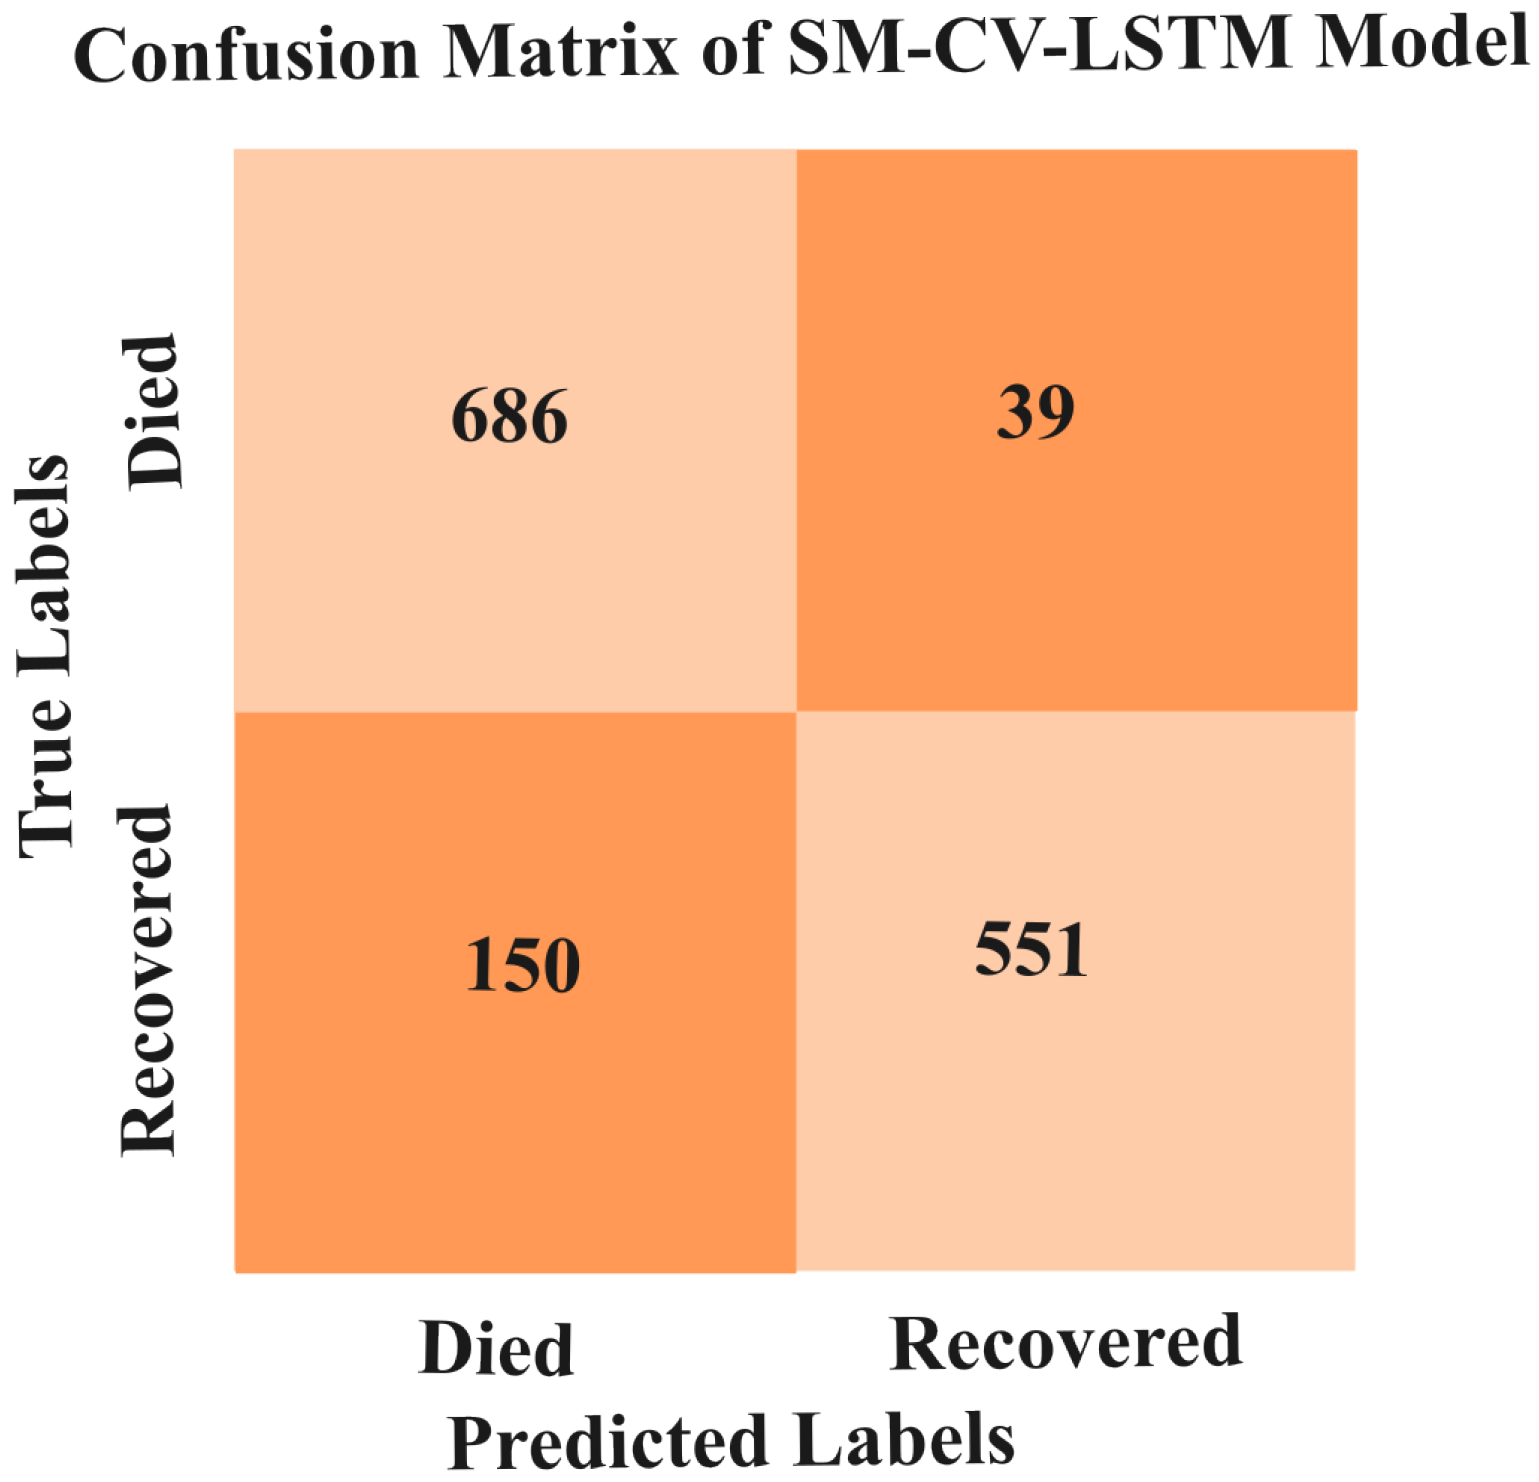
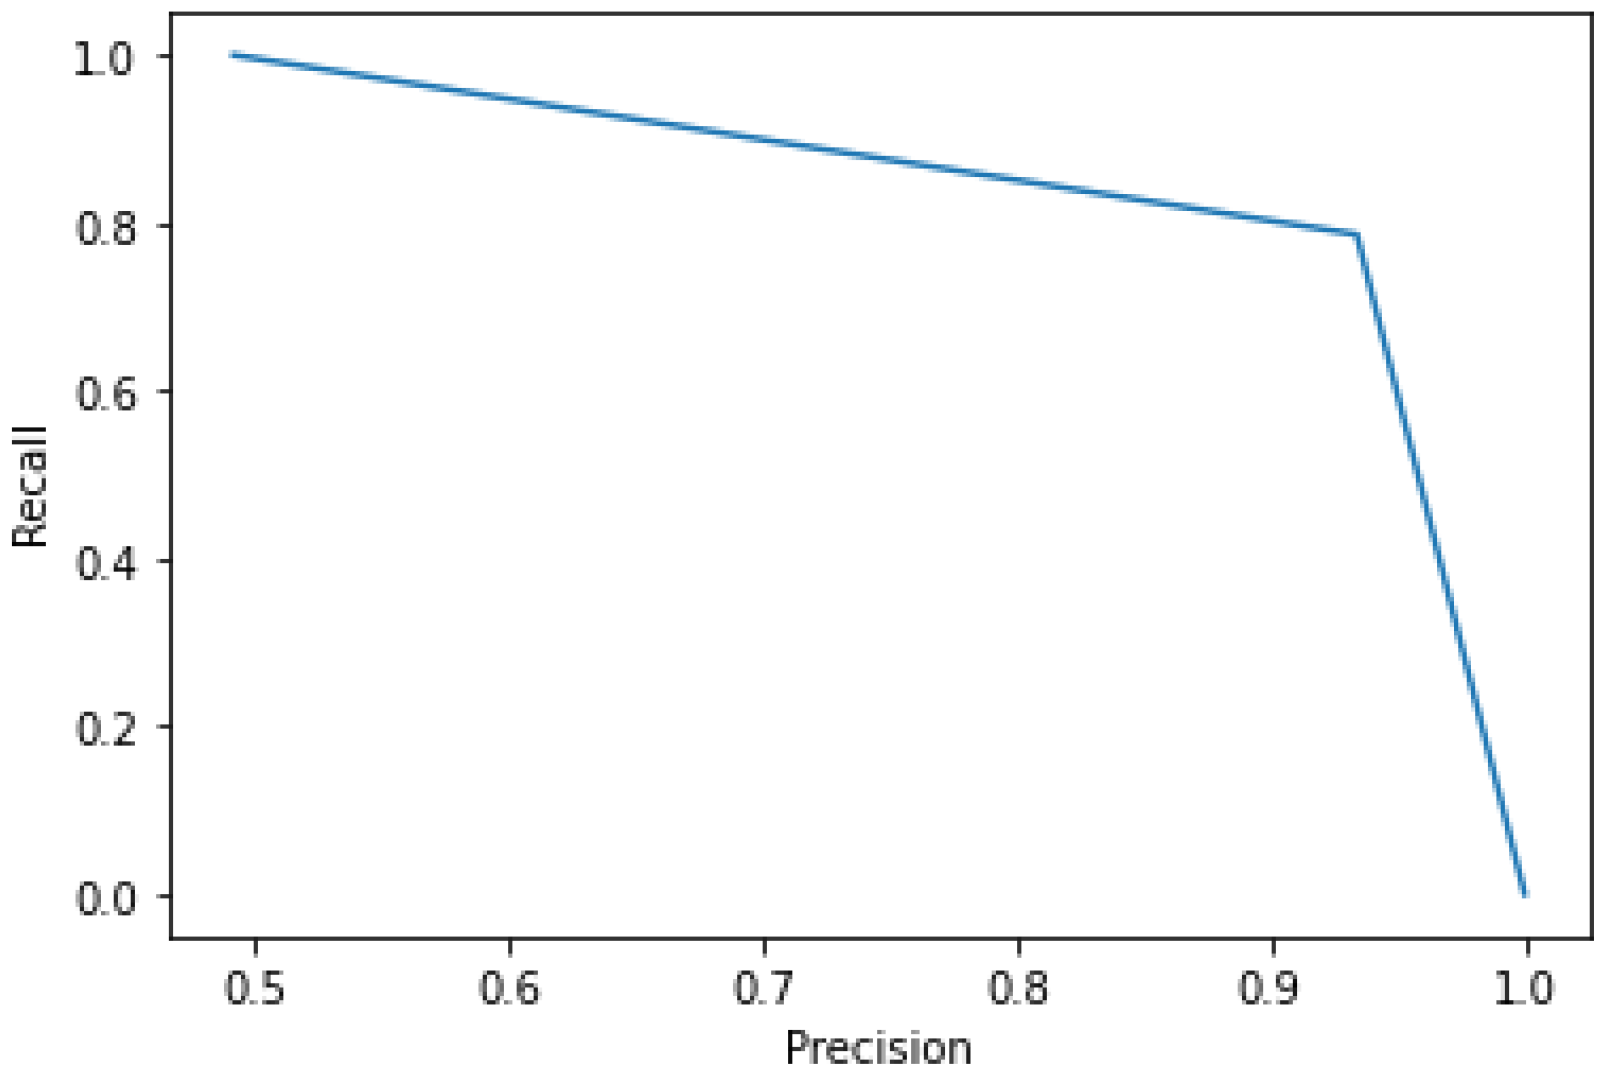
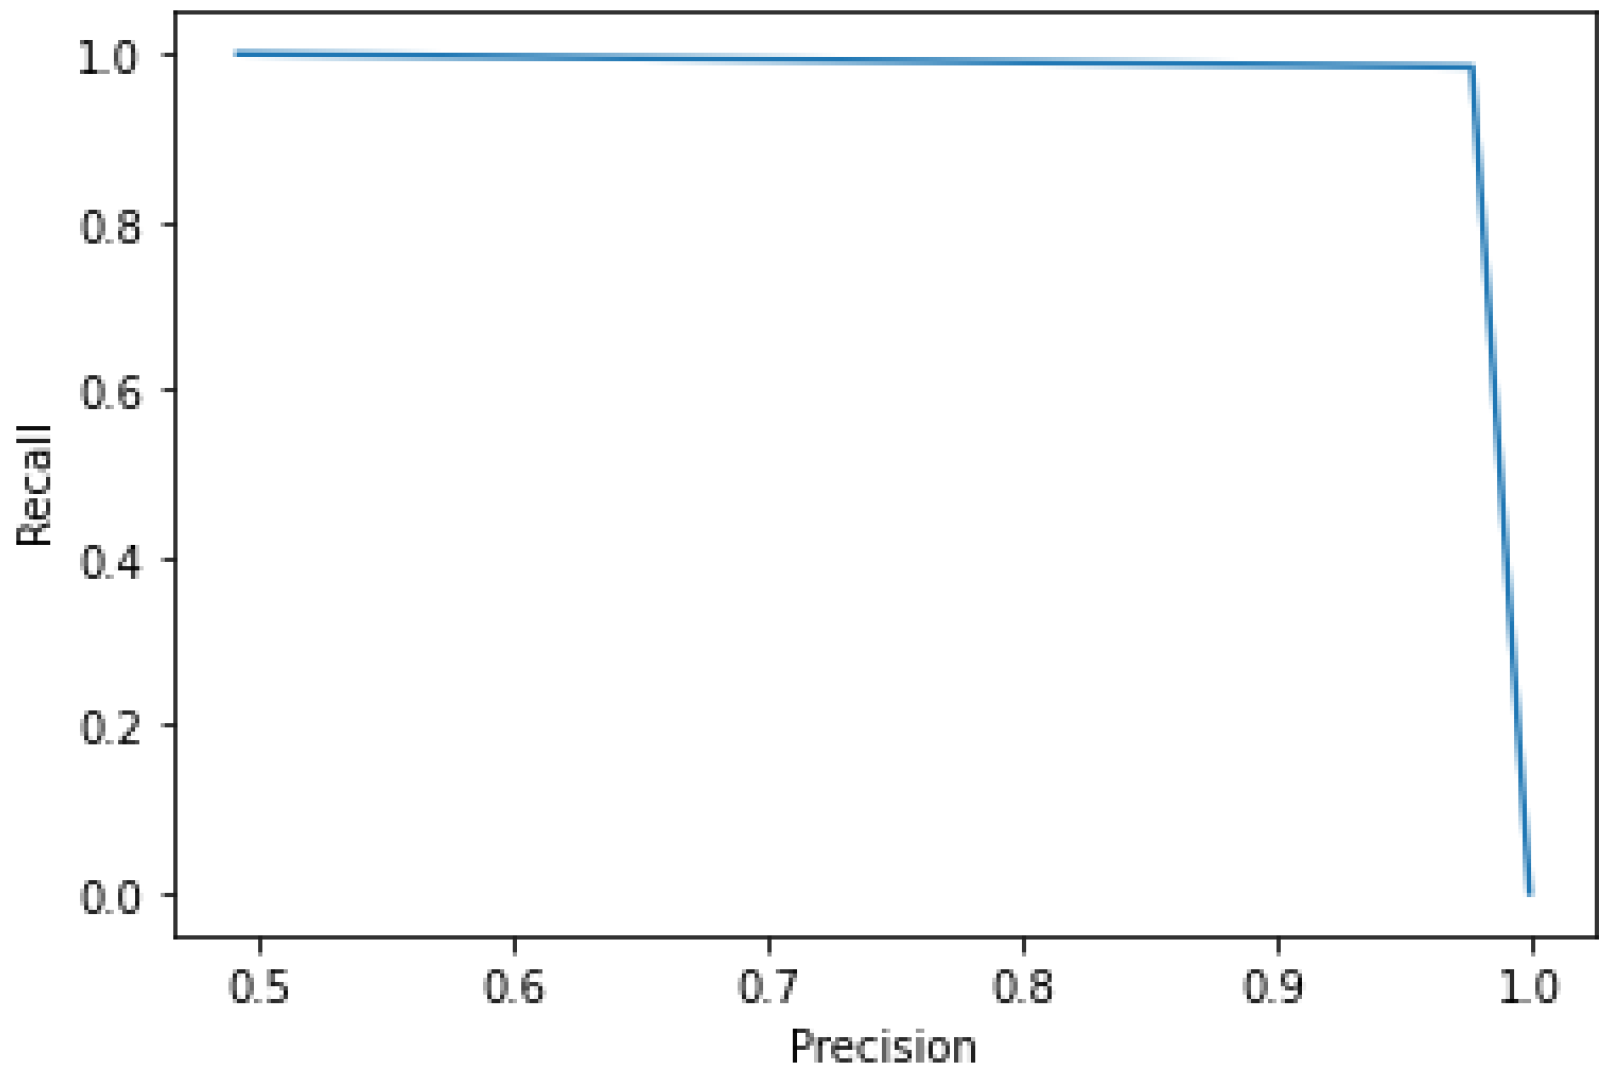
5.3.5. Results of SMOTE-CV-LSTM and SMOTE-CV-CNN Models
5.4. Inference
6. Conclusions
- Available small-scale datasets restrain the detailed study by researchers.
- No dataset is available to provide the critical level of patients.
- Even though the proposed model earned high accuracy on the small dataset, it is not clear how this will perform on a large dataset.
Author Contributions
Funding
Institutional Review Board Statement
Informed Consent Statement
Data Availability Statement
Conflicts of Interest
References
- Asgharnezhad, H.; Shamsi, A.; Alizadehsani, R.; Khosravi, A.; Nahavandi, S.; Sani, Z.A.; Srinivasan, D.; Islam, S.M.S. Objective evaluation of deep uncertainty predictions for COVID-19 detection. Sci. Rep. 2022, 12, 815. [Google Scholar] [CrossRef]
- Pourhomayoun, M.; Shakibi, M. Predicting mortality risk in patients with COVID-19 using machine learning to help medical decision-making. Smart Health 2021, 20, 100178. [Google Scholar] [CrossRef] [PubMed]
- Ibrahim, D.M.; Elshennawy, N.M.; Sarhan, A.M. Deep-chest: Multi-classification deep learning model for diagnosing COVID-19, pneumonia, and lung cancer chest diseases. Comput. Biol. Med. 2021, 132, 104348. [Google Scholar] [CrossRef] [PubMed]
- Wu, J. Introduction to convolutional neural networks. Natl. Key Lab Nov. Softw. Technol. 2017, 5, 495. [Google Scholar]
- Tekerek, A. A novel architecture for web-based attack detection using convolutional neural network. Comput. Secur. 2021, 100, 102096. [Google Scholar] [CrossRef]
- Xu, B.; Gutierrez, B.; Mekaru, S.; Sewalk, K.; Goodwin, L.; Loskill, A.; Cohn, E.L.; Hswen, Y.; Hill, S.C.; Cobo, M.M.; et al. Epidemiological data from the COVID-19 outbreak, real-time case information. Sci. Data 2020, 7, 106. [Google Scholar] [CrossRef]
- Banoei, M.M.; Dinparastisaleh, R.; Zadeh, A.V.; Mirsaeidi, M. Machine-learning-based COVID-19 mortality prediction model and identification of patients at low and high risk of dying. Crit. Care 2021, 25, 1–14. [Google Scholar] [CrossRef]
- Bikku, T. Multi-layered deep learning perceptron approach for health risk prediction. J. Big Data 2020, 7, 1–14. [Google Scholar] [CrossRef]
- Yan, L.; Zhang, H.-T.; Goncalves, J.; Xiao, Y.; Wang, M.; Guo, Y.; Sun, C.; Tang, X.; Jing, L.; Zhang, M.; et al. An interpretable mortality prediction model for COVID-19 patients. Nat. Mach. Intell. 2020, 2, 283–288. [Google Scholar] [CrossRef]
- Khozeimeh, F.; Sharifrazi, D.; Izadi, N.H.; Joloudari, J.H.; Shoeibi, A.; Alizadehsani, R.; Gorriz, J.M.; Hussain, S.; Sani, Z.A.; Moosaei, H.; et al. Combining a convolutional neural network with auto-encoders to predict the survival chance of COVID-19 patients. Sci. Rep. 2021, 11, 15343. [Google Scholar] [CrossRef]
- Khan, I.U.; Aslam, N.; Aljabri, M.; Aljameel, S.S.; Kamaleldin, M.M.A.; Alshamrani, F.M.; Chrouf, S.M.B. Computational intelligence-based model for mortality rate prediction in COVID-19 patients. Int. J. Environ. Res. Public Health 2021, 18, 6429. [Google Scholar] [CrossRef] [PubMed]
- Tezza, F.; Lorenzoni, G.; Azzolina, D.; Barbar, S.; Leone, L.A.C.; Gregori, D. Predicting in-hospital mortality of patients with COVID-19 using machine learning techniques. J. Pers. Med. 2021, 11, 343. [Google Scholar] [CrossRef] [PubMed]
- Wang, K.; Zuo, P.; Liu, Y.; Zhang, M.; Zhao, X.; Xie, S.; Zhang, H.; Chen, X.; Liu, C. Clinical and laboratory predictors of in-hospital mortality in patients with coronavirus disease-2019: A cohort study in wuhan, china. Clin. Infect. Dis. 2020, 71, 2079–2088. [Google Scholar] [CrossRef] [PubMed]
- Booth, A.L.; Abels, E.; McCaffrey, P. Development of a prognostic model for mortality in covid 19 infection using machine learning. Mod. Pathol. 2021, 34, 522–531. [Google Scholar] [CrossRef]
- Sun, L.; Song, F.; Shi, N.; Liu, F.; Li, S.; Li, P.; Zhang, W.; Jiang, X.; Zhang, Y.; Sun, L.; et al. Combination of four clinical indicators predicts the severe/critical symptom of patients infected COVID-19. J. Clin. Virol. 2020, 128, 104431. [Google Scholar] [CrossRef] [PubMed]
- Rechtman, E.; Curtin, P.; Navarro, E.; Nirenberg, S.; Horton, M.K. Vital signs assessed in initial clinical encounters predict COVID-19 mortality in an NYC hospital system. Sci. Rep. 2020, 10, 21545. [Google Scholar] [CrossRef]
- Hu, C.; Liu, Z.; Jiang, Y.; Shi, O.; Zhang, X.; Xu, K.; Suo, C.; Wang, Q.; Song, Y.; Yu, K.; et al. Early prediction of mortality risk among patients with severe COVID-19, using machine learning. Int. J. Epidemiol. 2020, 49, 1918–1929. [Google Scholar] [CrossRef]
- Zhou, Y.; Yang, Z.; Guo, Y.; Geng, S.; Gao, S.; Ye, S.; Hu, Y.; Wang, Y. A new predictor of disease severity in patients with COVID-19 in Wuhan, China. medRxiv 2020. [Google Scholar] [CrossRef]
- Li, Y.; Horowitz, M.A.; Liu, J.; Chew, A.; Lan, H.; Liu, Q.; Sha, D.; Yang, C. Individual-level fatality prediction of COVID-19 patients using AI methods. Front. Public Health 2020, 8, 587937. [Google Scholar] [CrossRef]
- Zhu, Z.; Cai, T.; Fan, L.; Lou, K.; Hua, X.; Huang, Z.; Gao, G. Clinical value of immune inflammatory parameters to assess the severity of coronavirus disease 2019. Int. J. Infect. Dis. 2020, 95, 332–339. [Google Scholar] [CrossRef]
- Monjur, O.; Preo, R.B.; Shams, A.B.; Raihan, M.; Sarker, M.; Fairoz, F. COVID-19 Prognosis and Mortality Risk Predictions from Symptoms: A Cloud-Based Smartphone Application. bioMed 2021, 1, 114–125. [Google Scholar] [CrossRef]
- Elshennawy, N.M.; Ibrahim, D.M.; Sarhan, A.M.; Arafa, M. Deep-Risk: Deep Learning-Based Mortality Risk Predictive Models for COVID-19. Diagnostics 2022, 12, 1847. [Google Scholar] [CrossRef] [PubMed]
- Davenport, T.; Kalakota, R. The potential for artificial intelligence in healthcare. Future Healthc. J. 2019, 6, 94. [Google Scholar] [CrossRef] [PubMed]
- Altschul, D.J.; Unda, S.R.; Benton, J.; de la Garza Ramos, R.; Cezayirli, P.; Mehler, M.; Eskandar, E.N. A novel severity score to predictinpatient mortality in COVID-19 patients. Sci. Rep. 2020, 10, 16726. [Google Scholar] [CrossRef] [PubMed]
- Kaggle, Dataset. Available online: https://www.kaggle.com/datasets/harshwalia/mortality-risk-clinincal-data-of-covid19-patients (accessed on 13 February 2023).
- Joloudari, J.H.; Marefat, A.; Nematollahi, M.A.; Oyelere, S.S.; Hussain, S. Effective Class-Imbalance Learning Based on SMOTE and Convolutional Neural Networks. Appl. Sci. 2023, 13, 4006. [Google Scholar] [CrossRef]
- Singh, M.; Bansal, S.; Ahuja, S.; Dubey, R.K.; Panigrahi, B.K.; Dey, N. Transfer learning—Based ensemble support vector machine model for automated COVID-19 detection using lung computerized tomography scan data. Med. Biol. Eng. Comput. 2021, 59, 825–839. [Google Scholar] [CrossRef]
- Yoo, S.H.; Geng, H.; Chiu, T.L.; Yu, S.K.; Cho, D.C.; Heo, J.; Choi, M.S.; Choi, I.H.; Cung Van, C.; Nhung, N.V.; et al. Deep learning-based decision-tree classifier for COVID-19 diagnosis from chest X-ray imaging. Front. Med. 2020, 7, 427. [Google Scholar] [CrossRef]
- Shi, W.; Peng, X.; Liu, T.; Cheng, Z.; Lu, H.; Yang, S.; Zhang, J.; Wang, M.; Gao, Y.; Shi, Y.; et al. A deep learning-based quantitative computed tomography model for predicting the severity of COVID-19: A retrospective study of 196 patients. Ann. Transl. Med. 2021, 9, 216. [Google Scholar] [CrossRef]
- Abbas, A.; Abdelsamea, M.M.; Gaber, M.M. Classification of COVID-19 in chest X-ray images using DeTraC deep convolutional neural network. Appl. Intell. 2021, 51, 854–864. [Google Scholar] [CrossRef]
- Che Azemin, M.Z.; Hassan, R.; Mohd Tamrin, M.I.; Md Ali, M.A. COVID-19 deep learning prediction model using publicly available radiologist-adjudicated chest X-ray images as training data: Preliminary findings. Int. J. Biomed. Imaging 2020, 2020, 8828855. [Google Scholar] [CrossRef]
- Soda, P.; D’Amico, N.C.; Tessadori, J.; Valbusa, G.; Guarrasi, V.; Bortolotto, C.; Akbar, M.U.; Sicilia, R.; Cordelli, E.; Fazzini, D.; et al. AI for COVID: Predicting the clinical outcomes in patients with COVID-19 applying AI to chest-X-rays. An Italian multicentre study. Med. Image Anal. 2021, 74, 102216. [Google Scholar] [CrossRef] [PubMed]
- Varshni, D.; Thakral, K.; Agarwal, L.; Nijhawan, R.; Mittal, A. Pneumonia detection using CNN based feature extraction. In Proceedings of the 2019 IEEE International Conference on Electrical, Computer and Communication Technologies (ICECCT), Coimbatore, India, 20–22 February 2019; IEEE: Coimbatore, India, 2019; pp. 1–7. [Google Scholar]
- Rahmat, T.; Ismail, A.; Aliman, S. Chest X-ray image classification using faster R-CNN. Malays. J. Comput. 2019, 4, 225–236. [Google Scholar]
- Rahman, T.; Chowdhury, M.E.; Khandakar, A.; Islam, K.R.; Islam, K.F.; Mahbub, Z.B.; Kadir, M.A.; Kashem, S. Transfer learning with deep convolutional neural network (CNN) for pneumonia detection using chest X-ray. Appl. Sci. 2020, 10, 3233. [Google Scholar] [CrossRef]


| Study | Method | ML/DL | Performance |
|---|---|---|---|
| [8] | SVM, NN and RF | ML | 89.98% Accuracy |
| [9] | XGBoost | ML | Accuracy > 90% |
| [10] | CNN | DL | 96.05% (Avg Accuracy) |
| [12] | RPART, SVM, CBM and RF | ML | RF Model Performance (84% ROC) |
| [13] | XGBoost | ML | 83% AUC Clinical Model 88% AUC Laboratory Model |
| [14] | SVM | ML | 91% specificity 91% sensitivity |
| [15] | SVM | ML | 97.57% AUC |
| [16] | XGBoost | ML | 86% AUC |
| [17] | Partial least squares regression, elastic net model, RF, Bagged FDA and LR | ML | 88.1% AUC 79.4 % Specificity 83.9% Sensitivity |
| [18] | LR | ML | 73.7% Specificity 88.6% Sensitivity |
| [19] | AE, LR, RF, SVM, one-class SVM, isolation forest and local outlier factor | ML | 97% Accuracy and 73% AUC |
| [20] | LR | ML | 90% AUC |
| [21] | RF and ANN | ML | 90. 83% Accuracy |
| [22] | Deep-Risk | DL | 94.14% Accuracy |
| Classification Report | ||||
|---|---|---|---|---|
| Precision (%) | Recall (%) | F1-Score (%) | Support | |
| Recovered | 96.12 | 100.00 | 98.23 | 736 |
| Died | 98.86 | 86.45 | 92.87 | 206 |
| Accuracy | 97.20 | 942 | ||
| Macro avg | 97.76 | 93.36 | 95.32 | 942 |
| Weighted avg | 97.83 | 97.27 | 97.83 | 942 |
| Fold | Accuracy (%) | Loss | Validation Accuracy (%) |
|---|---|---|---|
| 1 | 81.79 | 0.40 | 82.16 |
| 2 | 83.49 | 0.37 | 81.52 |
| 3 | 84.34 | 0.35 | 85.77 |
| 4 | 86.22 | 0.32 | 85.13 |
| 5 | 88.09 | 0.27 | 87.26 |
| 6 | 90.40 | 0.23 | 86.62 |
| 7 | 92.24 | 0.19 | 92.24 |
| 8 | 94.20 | 0.15 | 90.44 |
| 9 | 95.99 | 0.10 | 89.38 |
| 10 | 97.24 | 0.07 | 88.74 |
| Classification Report | ||||
|---|---|---|---|---|
| Precision (%) | Recall (%) | F1-Score (%) | Support (%) | |
| Recovered | 86.00 | 97.00 | 91.21 | 736 |
| Died | 79.34 | 43.97 | 56.65 | 206 |
| Accuracy | 85.00 | 942 | ||
| Macro avg | 83.74 | 70.36 | 74.48 | 942 |
| Weighted avg | 84.71 | 85.62 | 83.82 | 942 |
| Fold | Accuracy (%) | Loss | Validation Accuracy (%) |
|---|---|---|---|
| 1 | 77.07 | 0.46 | 79.61 |
| 2 | 78.37 | 0.45 | 73.88 |
| 3 | 78.89 | 0.43 | 77.70 |
| 4 | 79.64 | 0.43 | 79.83 |
| 5 | 81.95 | 0.41 | 84.07 |
| 6 | 82.66 | 0.40 | 83.86 |
| 7 | 83.09 | 0.40 | 86.19 |
| 8 | 82.92 | 0.39 | 84.92 |
| 9 | 84.24 | 0.37 | 77.28 |
| 10 | 84.64 | 0.36 | 77.91 |
| IMG-CNN Model | TP | FP | TN | FN | Loss | Accuracy (%) | Precision (%) | Recall (%) | AUC (%) |
| 2540 | 244 | 629 | 199 | 0.26 | 87.74 | 91.24 | 92.73 | 93.95 | |
| val_TP | val_FP | val_TN | val_FN | val_Loss | val_Accuracy | val_Precision | val_Recall | val_AUC | |
| 664 | 186 | 43 | 47 | 1.05 | 75.21 | 78.12 | 93.39 | 64.16 |
| Classification Report | ||||
|---|---|---|---|---|
| Precision (%) | Recall (%) | F1-Score (%) | Support (%) | |
| Recovered | 97.00 | 100 | 98.23 | 730 |
| Died | 99.00 | 95.95 | 97.30 | 396 |
| Accuracy | 98.00 | 1126 | ||
| Macro avg | 98.04 | 97.82 | 98.01 | 1126 |
| Weighted avg | 98.07 | 98.97 | 98.99 | 1126 |
| Fold | Accuracy (%) | Loss | Validation Accuracy (%) |
|---|---|---|---|
| 1 | 85.04 | 0.33 | 80.81 |
| 2 | 86.24 | 0.31 | 83.12 |
| 3 | 87.57 | 0.29 | 84.54 |
| 4 | 88.65 | 0.26 | 88.27 |
| 5 | 90.19 | 0.22 | 84.54 |
| 6 | 92.15 | 0.19 | 87.38 |
| 7 | 94.10 | 0.14 | 89.52 |
| 8 | 96.03 | 0.10 | 85.79 |
| 9 | 96.33 | 0.09 | 95.20 |
| 10 | 96.63 | 0.08 | 100 |
| Classification Report | ||||
|---|---|---|---|---|
| Precision (%) | Recall (%) | F1-Score (%) | Support (%) | |
| Recovered | 82.00 | 95.21 | 88.08 | 725 |
| Died | 93.09 | 79.06 | 85.98 | 701 |
| Accuracy | 87.09 | 1426 | ||
| Macro avg | 88.23 | 87.91 | 87.05 | 1426 |
| Weighted avg | 88.91 | 87.32 | 87.28 | 1426 |
| Fold | Accuracy (%) | Loss | Validation Accuracy (%) |
|---|---|---|---|
| 1 | 74.10 | 0.51 | 65.49 |
| 2 | 78.09 | 0.46 | 76.29 |
| 3 | 79.68 | 0.44 | 76.85 |
| 4 | 80.66 | 0.42 | 78.54 |
| 5 | 81.29 | 0.41 | 82.46 |
| 6 | 85.46 | 0.39 | 75.17 |
| 7 | 83.12 | 0.38 | 78.51 |
| 8 | 82.63 | 0.39 | 84.41 |
| 9 | 82.74 | 0.39 | 93.11 |
| 10 | 83.35 | 0.38 | 89.32 |
| Classification Report | ||||
|---|---|---|---|---|
| Precision (%) | Recall (%) | F1-Score (%) | Support (%) | |
| Recovered | 98.00 | 98.08 | 98.15 | 725 |
| Died | 98.86 | 98.25 | 98.81 | 701 |
| Accuracy | 98.00 | 1426 | ||
| Macro avg | 98.34 | 98.08 | 98.08 | 1426 |
| Weighted avg | 98.00 | 98.07 | 98.91 | 1426 |
| Fold | Accuracy (%) | Loss | Validation Accuracy (%) |
|---|---|---|---|
| 1 | 81.96 | 0.38 | 79.38 |
| 2 | 85.30 | 0.33 | 80.08 |
| 3 | 87.51 | 0.28 | 77.27 |
| 4 | 89.30 | 0.24 | 86.67 |
| 5 | 92.05 | 0.19 | 89.34 |
| 6 | 94.09 | 0.14 | 82.88 |
| 7 | 95.95 | 0.10 | 89.32 |
| 8 | 96.65 | 0.08 | 98.03 |
| 9 | 97.83 | 0.06 | 98.03 |
| 10 | 98.49 | 0.04 | 99.29 |
| Models | Precision (%) | Recall (%) | F1-Score (%) | Accuracy (%) |
|---|---|---|---|---|
| CV-CNN | 97.32 | 93.76 | 95.34 | 96.76 |
| CV-LSTM+CNN | 82.56 | 70.43 | 73.33 | 85.18 |
| IMG-CNN | 78.32 | 93.43 | 85.67 | 75.22 |
| AE+CV-CNN | 98.54 | 97.39 | 97.20 | 97.90 |
| SMOTE-CV-LSTM | 88.22 | 87.47 | 87.91 | 86.74 |
| SMOTE-CV-CNN | 98.22 | 98.33 | 98.43 | 98.10 |
| Study | Models | Accuracy (%) | AUC (%) |
|---|---|---|---|
| Pourhomayoun and Shakibi [2] | NN | 89.98 | 93.76 |
| KNN | 89.83 | 90.97 | |
| SVM | 89.02 | 88.18 | |
| RF | 87.93 | 94.34 | |
| LR | 87.91 | 93.98 | |
| DT | 86.87 | 93.97 | |
| Singh et al. [27] | SVM | 95.70 | 95.80 |
| Yoo et al. [28] | DT | 98.00 | 98.00 |
| Shi et al. [29] | LR | 82.70 | 89.00 |
| Proposed | SMOTE-CV-CNN | 98.10 | 98.11 |
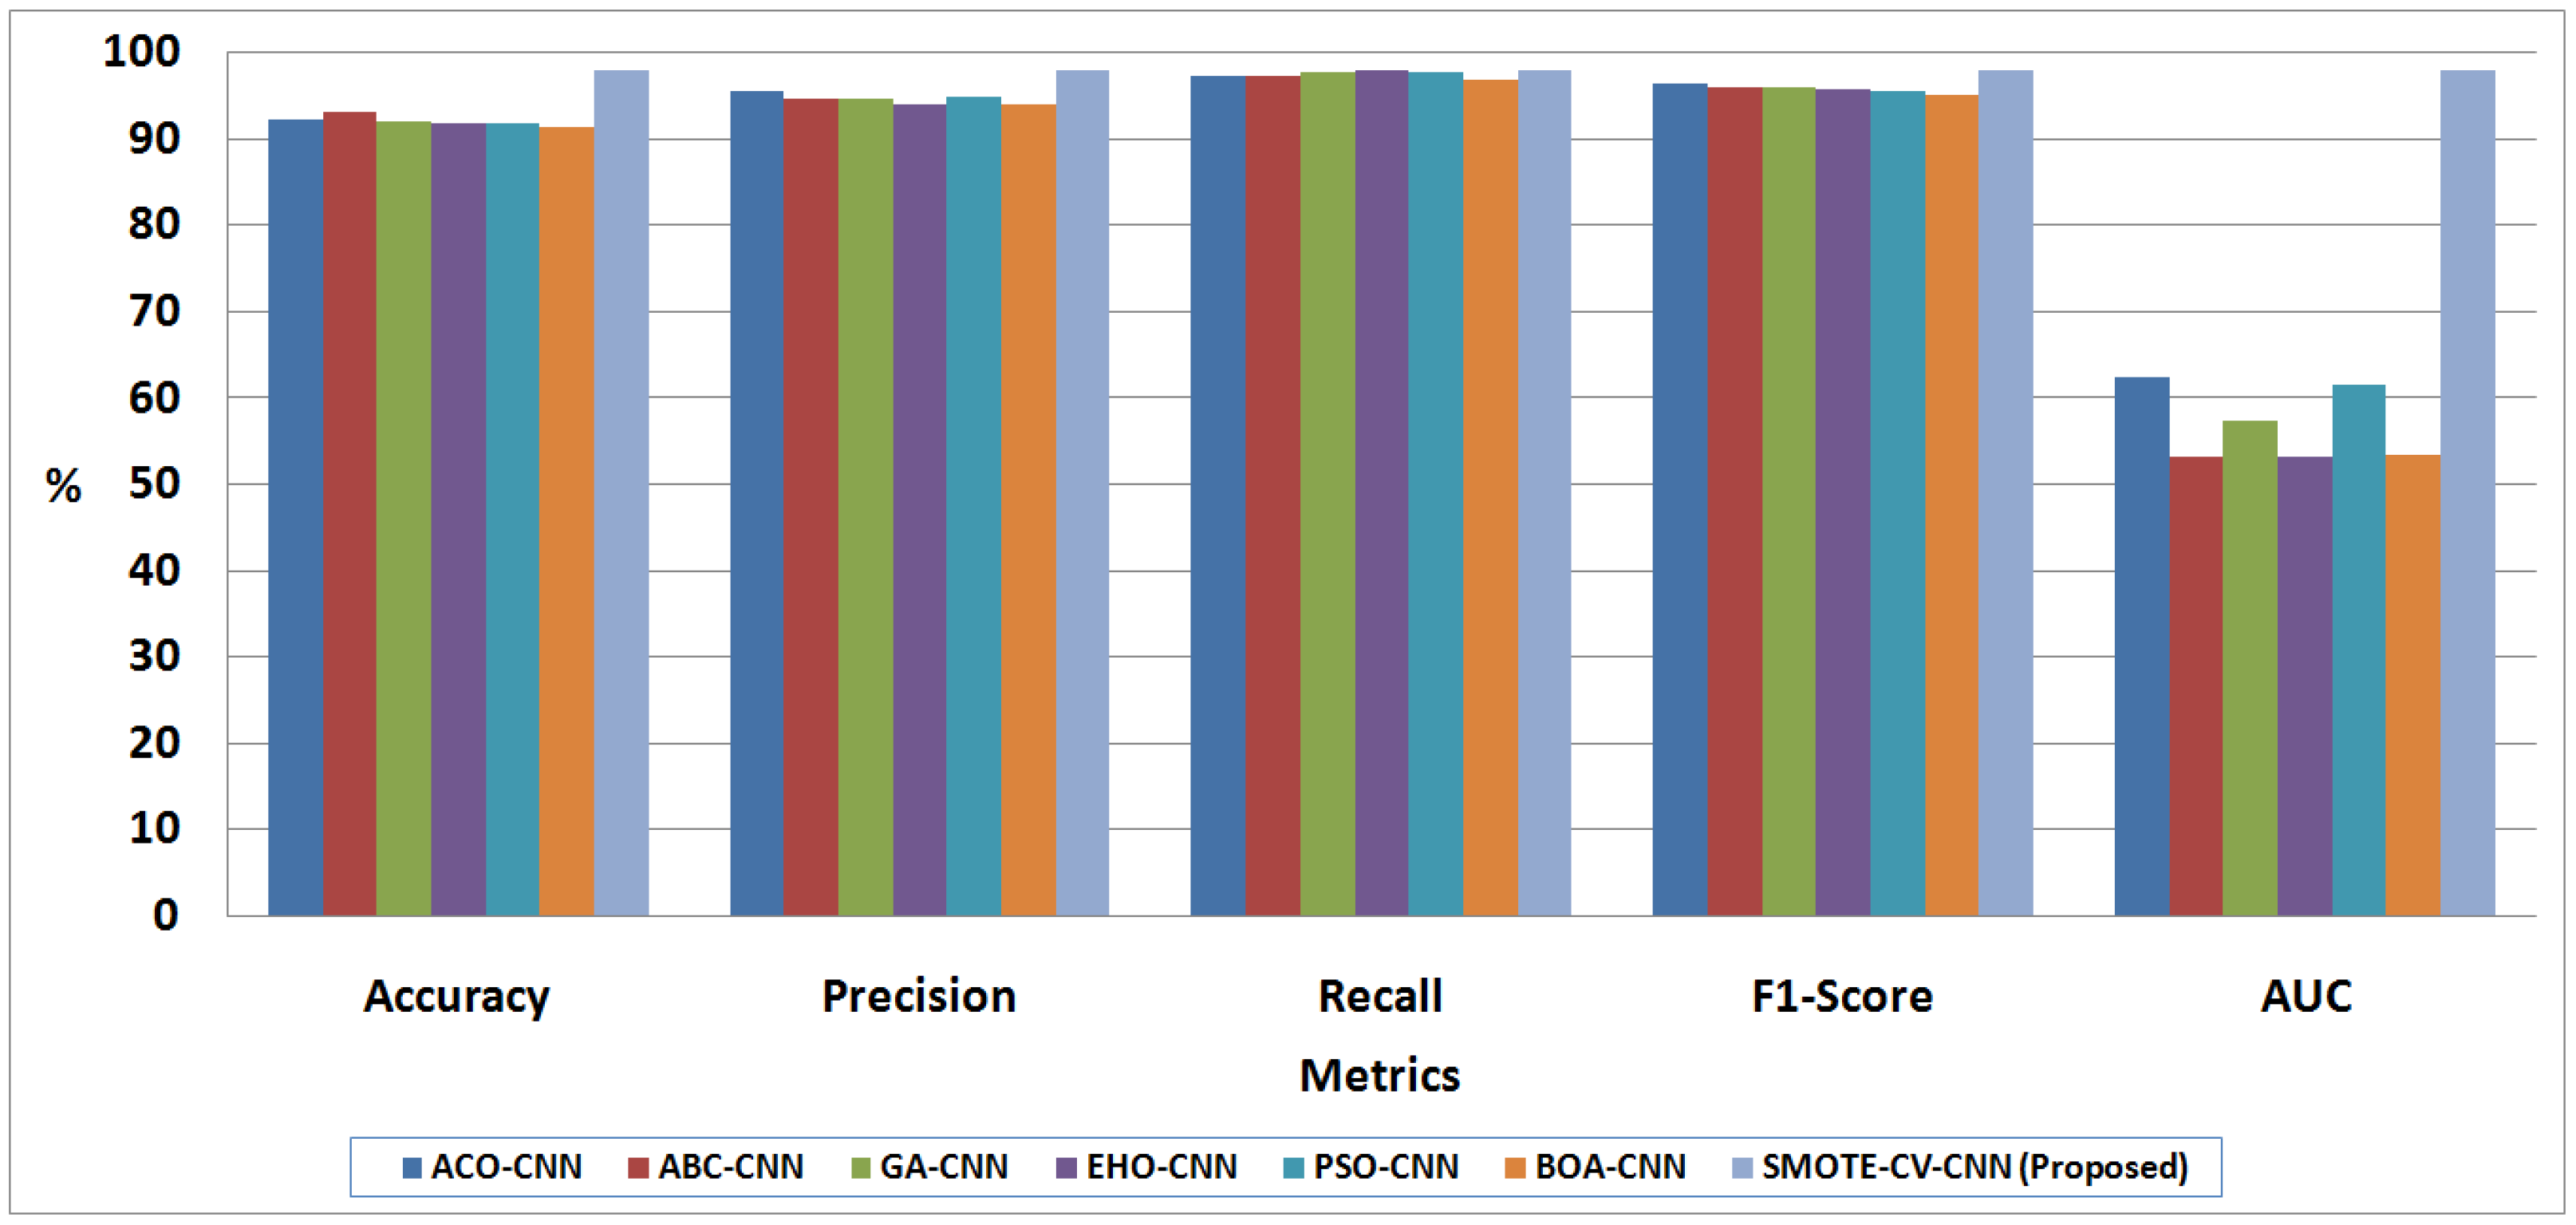
| Study | Models | Accuracy (%) | Precision (%) | Recall (%) | F1-Score (%) | AUC (%) |
|---|---|---|---|---|---|---|
| Khozeimeh et al. [10] | ACO-CNN | 92.32 | 95.64 | 97.33 | 96.24 | 62.51 |
| ABC-CNN | 93.10 | 94.57 | 97.43 | 96.01 | 53.33 | |
| GA-CNN | 92.18 | 94.78 | 97.83 | 96.01 | 57.25 | |
| EHO-CNN | 91.87 | 94.11 | 98.02 | 95.97 | 53.22 | |
| PSO-CNN | 91.85 | 95.03 | 97.85 | 95.51 | 61.59 | |
| BOA-CNN | 91.37 | 94.10 | 97.01 | 95.15 | 53.52 | |
| Proposed | SMOTE-CV-CNN | 98.10 | 98.03 | 98.02 | 98.00 | 98.12 |
| Paper | Method | Accuracy (%) |
|---|---|---|
| Abbas et al. [30] | CNN | 93.00 |
| Che Azemin et al. [31] | CNN | 71.90 |
| Soda et al. [32] | Deep multimodal CNN | 76.80 |
| Varshni et al. [33] | CNN Models along with DenseNet-169 and SVM | 80.02 |
| Rahmat et al. [34] | Fully connected RCNN | 62.00 |
| Rahman et al. [35] | Different Pre-trained CNN | 62.00 |
| Proposed | SMOTE-CV-CNN | 98.10 |
Disclaimer/Publisher’s Note: The statements, opinions and data contained in all publications are solely those of the individual author(s) and contributor(s) and not of MDPI and/or the editor(s). MDPI and/or the editor(s) disclaim responsibility for any injury to people or property resulting from any ideas, methods, instructions or products referred to in the content. |
© 2023 by the authors. Licensee MDPI, Basel, Switzerland. This article is an open access article distributed under the terms and conditions of the Creative Commons Attribution (CC BY) license (https://creativecommons.org/licenses/by/4.0/).
Share and Cite
Soundrapandiyan, R.; Manickam, A.; Akhloufi, M.; Murthy, Y.V.S.; Sundaram, R.D.M.; Thirugnanasambandam, S. An Efficient COVID-19 Mortality Risk Prediction Model Using Deep Synthetic Minority Oversampling Technique and Convolution Neural Networks. BioMedInformatics 2023, 3, 339-368. https://doi.org/10.3390/biomedinformatics3020023
Soundrapandiyan R, Manickam A, Akhloufi M, Murthy YVS, Sundaram RDM, Thirugnanasambandam S. An Efficient COVID-19 Mortality Risk Prediction Model Using Deep Synthetic Minority Oversampling Technique and Convolution Neural Networks. BioMedInformatics. 2023; 3(2):339-368. https://doi.org/10.3390/biomedinformatics3020023
Chicago/Turabian StyleSoundrapandiyan, Rajkumar, Adhiyaman Manickam, Moulay Akhloufi, Yarlagadda Vishnu Srinivasa Murthy, Renuka Devi Meenakshi Sundaram, and Sivasubramanian Thirugnanasambandam. 2023. "An Efficient COVID-19 Mortality Risk Prediction Model Using Deep Synthetic Minority Oversampling Technique and Convolution Neural Networks" BioMedInformatics 3, no. 2: 339-368. https://doi.org/10.3390/biomedinformatics3020023