Article

Evaluation of Transmembrane Protein Structural Models Using HPMScore

by
Stéphane Téletchéa
1,†,
Jérémy Esque
2,†,
Aurélie Urbain
3,
Catherine Etchebest
4 and
Alexandre G. de Brevern
4,5,*
1
Nantes Université, CNRS, U2SB, UMR 6286, F-44000 Nantes, France
2
Toulouse Biotechnology Institute, Université de Toulouse, CNRS, INRAE, INSA, 31077 Toulouse, France
3
Institut Jean-Pierre Bourgin, INRAE, AgroParisTech, Université Paris-Saclay, F-78000 Versailles, France
4
Université Paris Cité and Université de la Réunion and Université des Antilles, INSERM, BIGR, DSIMB, F-75014 Paris, France
5
Université Paris Cité and Université de la Réunion and Université des Antilles, INSERM, BIGR, DSIMB, F-97715 Saint Denis, France
*
Author to whom correspondence should be addressed.
These authors contributed equally to this work.
BioMedInformatics 2023, 3(2), 306-326; https://doi.org/10.3390/biomedinformatics3020021
Submission received: 3 March 2023 / Revised: 25 March 2023 / Accepted: 3 April 2023 / Published: 6 April 2023
(This article belongs to the Special Issue Feature Papers in Medical Statistics and Data Science Section)

Abstract

:
Transmembrane proteins (TMPs) are a class of essential proteins for biological and therapeutic purposes. Despite an increasing number of structures, the gap with the number of available sequences remains impressive. The choice of a dedicated function to select the most probable/relevant model among hundreds is a specific problem of TMPs. Indeed, the majority of approaches are mostly focused on globular proteins. We developed an alternative methodology to evaluate the quality of TMP structural models. HPMScore took into account sequence and local structural information using the unsupervised learning approach called hybrid protein model. The methodology was extensively evaluated on very different TMP all-α proteins. Structural models with different qualities were generated, from good to bad quality. HPMScore performed better than DOPE in recognizing good comparative models over more degenerated models, with a Top 1 of 46.9% against DOPE 40.1%, both giving the same result in 13.0%. When the alignments used are higher than 35%, HPM is the best for 52%, against 36% for DOPE (12% for both). These encouraging results need further improvement particularly when the sequence identity falls below 35%. An area of enhancement would be to train on a larger training set. A dedicated web server has been implemented and provided to the scientific community. It can be used with structural models generated from comparative modeling to deep learning approaches.

Graphical Abstract

1. Introduction

Protein structure knowledge allows the atomistic understanding of biological mechanisms. Nonetheless, most of the available protein structures in the Protein DataBank (PDB) [1] are globular. Indeed, despite their great functional importance, e.g., 20% of all human proteins [2], transmembrane proteins (TMPs) represent less than 0.7% of the PDB (at 8 December 2020). They are implicated in a large series of pathologies [3] and are targeted by more than 60% of current drug [4]. Thus, methods to propose efficient structural models of TMPs are of high importance [5,6].
Although the number of templates was limited, comparative modeling methods have been applied to TMPs de novo, and now, deep learning protein structure predictions are used with the most recent developments [7,8]. Whatever the approach, the major challenge is to detect the structural model with the closest conformation to the native structure, which is accomplished by the so-called model quality assessment programs (MQAPs). By definition, free energy potentials would theoretically allow this selection. Physics-based potentials taken from molecular mechanics [9,10] might be considered. It was actually proposed by Feig’s group [11], which calculated the energy of models as a sum of the force field conformational energy of the membrane protein plus the interaction energy of the protein with an implicit model of membrane environment. A web server (not available at the present time) was developed to calculate what is designated as memscore. As stated by the authors, the strategy was rather good for decoy close to the native state but further improvements are required for models further from the native state. Thus, even by accounting the membrane environment, force-field-based scoring functions are not the most efficient ones in practice because most of them are not calibrated on free energies.
The statistical potentials derived from experimentally determined protein structures remain the most efficient ones. MQAPs can be divided into different approaches; the most important ones take into account the local 3D environment of the protein structures. Briefly speaking, the scoring is based on the counting of the observed contacts and compared to a reference. However, although based on the same spirit and the same datasets, the formalism of the scoring function itself may be very different (see [12]). In this field, the most widely used was discrete optimized protein energy, or DOPE [13], which was implemented in the Modeller software [14,15]. It is mainly based on the distance between atoms in the analyzed models compared to the ones observed in the dataset of reference. Prosa [16] and its latest incarnation Prosa-web [17] are based on a classical potential of mean force; the output provided by Prosa-web was interesting as it compared the quality of the structural models in regard to a large dataset of X-ray and NMR structures. Verify3D proposed a slightly different view by considering the compatibility of the model (3D) with its sequence (1D) by looking at the environment (secondary structure, hydrophobicity, etc.) as seen in known structures [18,19]. Since this first generation, different improvements have been introduced; they consisted of adding different parameters, such as the residue distance, solvent accessibility and secondary structure content [20,21,22,23]. The weighting of these parameters was optimized with artificial neural networks, support vector machines or machine learning approaches [24,25,26,27]. Consequently, they were in general more dependent on the training procedure and on the training set than classical approaches.
TMPs structural models have often been assessed using this approach. However, these MQAPs were often optimized on water-soluble proteins that bathe in a homogenous environment. In the case of TMPs, the situation is more complex because they are in contact with two very distinct environments; a water environment for the soluble part of the protein and the lipid environment for the membrane embedded region, and even a third one corresponding to the membrane interface. This also corresponds to a striking difference in the amino acid distribution of TMPs [28]. Thus, to make sure these specificities were taken into account, the IQ method was proposed. It is based on the analysis of four types of inter-residue interactions within the transmembrane domains [29]. The ProQM approach used support vector machines trained on contacts, solvent-accessible surface, secondary structure, topology of TM region, Z-coordinate, and evolutionary information [30,31]. It was sensitive to the side-chain positioning.
MEMEMBED is a dedicated statistical potential that considers the membrane depth of residues [32]. More recently, MAIDEN proposed an interesting and innovative development, computing the interatomic distance between all 20 standard residue types, focusing on intramembrane residues [33,34]. QMEANBrane is a more simple approach also using the delineation of a theoretical membrane region to focus on the transmembrane region [35]. It was only tested on a GPCR, while MAIDEN was tested on the most diverse set of protein folds.
In the RosettaMembrane/RosettaMP approach [36,37,38], a specific function for TMP has been established in a Rosetta way, namely the force field is a linear combination of a Lennard–Jones potential to model the VDW interactions, a backbone torsional term, a knowledge-based pair interaction term for the electrostatic interactions, reference energies to normalize the overall amino acid composition, an implicit atomic solvation term, and an orientation-dependent hydrogen bonding term [39]. This development is highly dependent on the specific generation of the models by Rosetta. All these scoring functions can only compare a set of equivalent structural models, but not different sequences. AlphaFold2 has its own quality schema evaluation, called pLDDT, for “predicted local distance difference test”, which is a per-residue confidence metric [40]. pLDDT is not a score for comparing models but rather a local confidence measure of regions of the structural models [40]; it appears worse for qualifying regions in membrane protein compared to those in globular proteins [8,41,42,43,44].
In a previous study [45], we learnt and analyzed the sequence–structure relationship of TMPs with an unsupervised learning approach, called the hybrid protein model (HPM) [46,47]. HPM was also shown to be efficient in analyzing globular proteins, e.g., building of overlapping local structural prototypes [48,49,50] or the prediction [51,52,53] of flexibility. HPM was used to analyze protein fragments present in a non-redundant databank of all-α transmembrane proteins. The method has many advantages, which are: (i) A simultaneous learning of sequence (polarity, volume, and hydrophobicity) and structures (φ and ψ dihedral angles) properties, e.g., distribution of amino acids associated with different local conformations; (ii) Unsupervised learning due to the given descriptors (sequence and structure), i.e., without any a priori; and (iii) The learning of the overlapping of protein fragments, taking into account the sequentiality (or continuity) essential in proteins, i.e., without any constraints. After a fine-tuning of learning parameters, the sequence–structure relationship was analyzed in light of a structural alphabet, called protein blocks [54,55], underlining two helical regions with very different hydrophobic patterns, identifying groups with properties specific to extremities of helices, or to loops, or to helices. Moreover, some groups showed preferential localizations for the periphery of the membrane or inside the membrane. This can be used for annotation as channel/non-channel, but also for the assessment of the quality of structures and structural models.
In this study, we have generated a large set of structural models ranging from very good to poor models for a various number of folds. The models were evaluated using classical root mean square deviation (rmsd) and GDT_TS. The latter is the most classical reference metric for comparing diverse structural models [56]. Its interest is to limit the influence of poorly modeled substructures for the protein considered. We also used the famous DOPE scores [13], as using them is one of the most classical approaches to selecting protein structural models though comparative/homology modeling.
In some aspects, the HPM approach can be related to the Verify3D methodology, which encompasses sequence, structure, and environment properties to evaluate the compatibility of a given sequence with a given 3D structure. The Verify3D approach was never dedicated to TMPs. HPM does not need, as is true of other approaches, to localize helical regions and take into account the connecting loops. We then compared the discrimination of the quality of the models using HPMScore values compared to DOPE scores, and we propose a dedicated webserver HPMScore (https://www.dsimb.inserm.fr/dsimb_tools/hpmscore/index.php, accessed on 1 March 2023).

2. Materials and Methods

2.1. Protein Structure Dataset

The membrane protein dataset was derived from the HOMEP dataset [57]. This set of proteins is composed of 76 membrane proteins, separated in 23 categories, depending on their biological function (https://zenodo.org/record/2646540#.Y7b99C3pNTY, accessed on 1 March 2023). This dataset was completed by 13 GPCR structures. The entire dataset is composed of 89 proteins. The protein structures composed of all-α transmembrane domain were taken from the PDB [1]. For analysis purposes, the number of TM domains and their boundaries over the whole protein sequence were predicted using the PPM web server or directly imported from the orientation of protein in a membrane (OPM) database [58,59]. We defined three main categories of protein structures according to the transmembrane content: large (more than 40% of amino acids associated with the transmembrane domain), medium (40%< and >15%), and few (>15%). Please notice that HOMEP was later expanded in EncoMPASS [60].

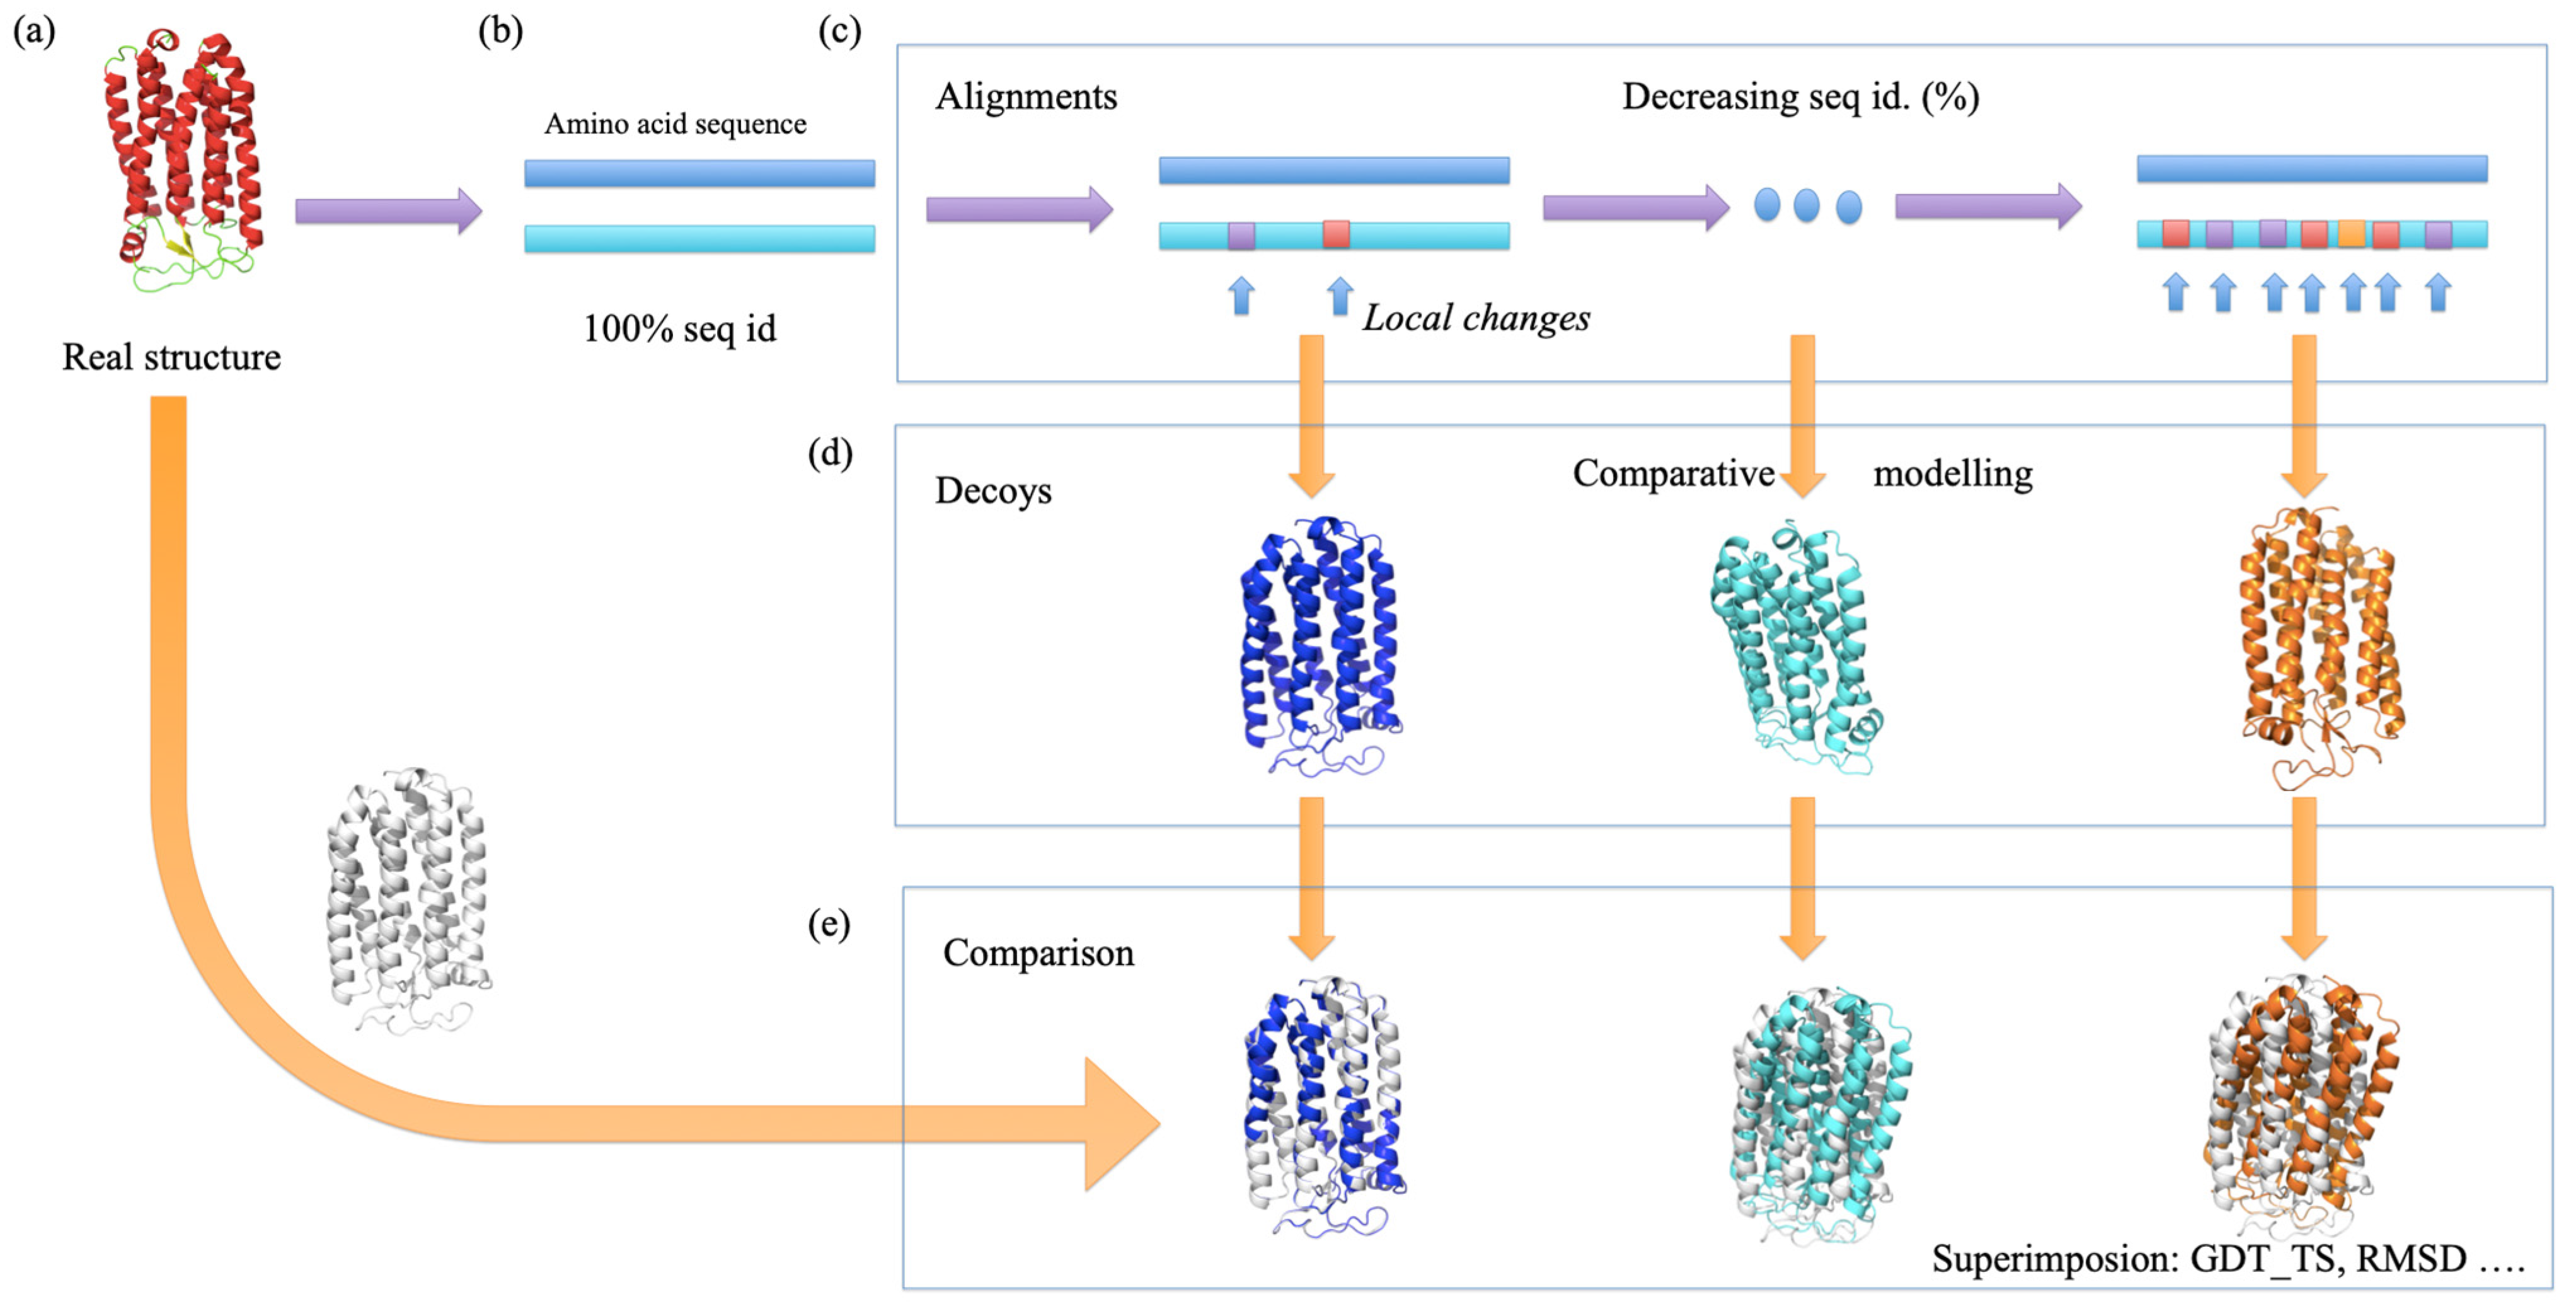
2.2. Generation of Alternative Structural Models

We have generated a large set of structural models ranging from good quality to bad, i.e., to mimic what often happens in daily research. For a given protein, the original sequence from the PDB was extracted and duplicated to create an ideal alignment where the template and the target sequence are initially identical. The alignment was further processed to reproduce point mutations or gap insertions using two strategies. First, we created a similar sequence by randomly picking an amino acid position and exchanging it with another position. This procedure kept the amino acid composition, but varied the sequence identity with the template sequence. The procedure was repeated until a target percentage of identity was obtained or a maximum number of iterations was reached. This iteration number was set arbitrarily at twice the length of the amino acid sequence to save time. The second strategy consisted of perturbing the alignment by random gap modifications, up to 5 random gaps of length between 1 and 8, either on the parent sequence or on its children. Once the alignment was produced, its overall percentage of identity was calculated using BioPerl [61]. The structural models for each alignment were created using Modeller v9.18 [14,15] (the entire process of generation and evaluation of structural models is presented in Figure A1).

2.3. Assessment Scores

DOPE scores [13] are directly provided by Modeller [14,15]. HPM scores [45] are determined as follows: (i) The protein structures are cut into fragments of length L (L = 13, as obtained in [45] and recommended from previous studies [46,47,54], see next paragraph); (ii) Each fragment is translated in terms of polarity, volume, and hydrophobicity for their sequence and in the cosine and sine functions of their dihedral angles for their structure; (iii) The fragment and its local environment are then compared to each position of the optimal HPM matrix (determined in [45]); (iv) The maximal score provides the best matching between this position and the HPM matrix that reflects our current knowledge of TMP sequence–structure relationship. The HPMScore value is the sum of all these maximum scores. For further analyses, local DOPE and local HPMScore values were also investigated per domain, i.e., transmembrane region or not, using the segments defined as membranous in OPM [58,59].
From a practical point of view, HPM depends on its total length and the length of the fragments presented. These two parameters were tested in [45] to end with a total length of 100 and fragments of L = 13 positions. With several simulations, these two choices made it possible to have a sufficient occurrence number at each position, and also two distinct types of helices. Then, with these parameters, 100 independent simulations were carried out with a high learning rate similar to the self-organizing maps (SOM) type [62,63]; this high value limits the importance of initializing. The most central HPM (with a minimum distance from all the others) was then taken up as a new initial HPM for a new training. Here, the learning coefficient was quite limited to fix the optimal HPM. These two stages have a strong analogy with the two main phases of learning the SOMS, i.e., diffusion then specialization.

2.4. Data Analyses

The 3D structure representation is generated using the PyMOL software (http://www.pymol.org, accessed on 1 March 2023) [64]. The protein superimposition was carried out using the iPBA software [65] based on the protein block description [54]. RMSD was computed using profit [66], through the iPBA software. In the following step, the computation of the GDT_TS and PBscore alignment was performed [65]. TMalign was also used for comparison [67]. The GDT_TS value is a reference metric for comparing diverse structural models [56]. It weights close to large local RMSD variations to limit the influence of poorly modeled substructures for the protein considered. An ideal GDT_TS value is 100 for a “perfect” match between the model and the experimental structure; the worst value is 0. For each experiment, the best model is defined by the highest GDT_TS in regard to the true 3D structure. It is named “G-model” in the following. Most of the analyses were carried out using the Python language and R software [68]. We have made available a companion website that contains a large number of analyses (https://clipperton.ufip.univ-nantes.fr/hpmeval/, accessed on 1 March 2023). The analyses can be viewed at the level of the whole dataset, but also by a single protein and by protein type. Various data analyses have been performed. The most classic is the calculation of the Top 1, Top 5, and Top 10. The metric is simple and corresponds to the number of times that for the same simulation, the HPM or DOPE method allow you to select the best model. For Top 1, it is a direct comparison, while for Top 5 and Top 10, it is the best as selected by DOPE and/or HPM within their best 5 and 10 scores. The only specificity of these results is that sometimes DOPE and HPM can select the same result (hence, the category HPM and DOPE).

2.5. Scripting and Web Server of HPMScore

The original code of HPMScore was developed with the use of a local PDB reader coded in C language that generated a flat file with all the information (sequence in terms of polarity, volume, and hydrophobicity, and structure in terms of φ and ψ dihedral angles). The latter is used by the HPM program (also coded in C language) that performs the evaluation. A dedicated web server that encompasses all these properties is made available to the scientific community. It provides a simple interface with a nice visualization (https://www.dsimb.inserm.fr/dsimb_tools/hpmscore/index.php, accessed on 1 March 2023).

3. Results

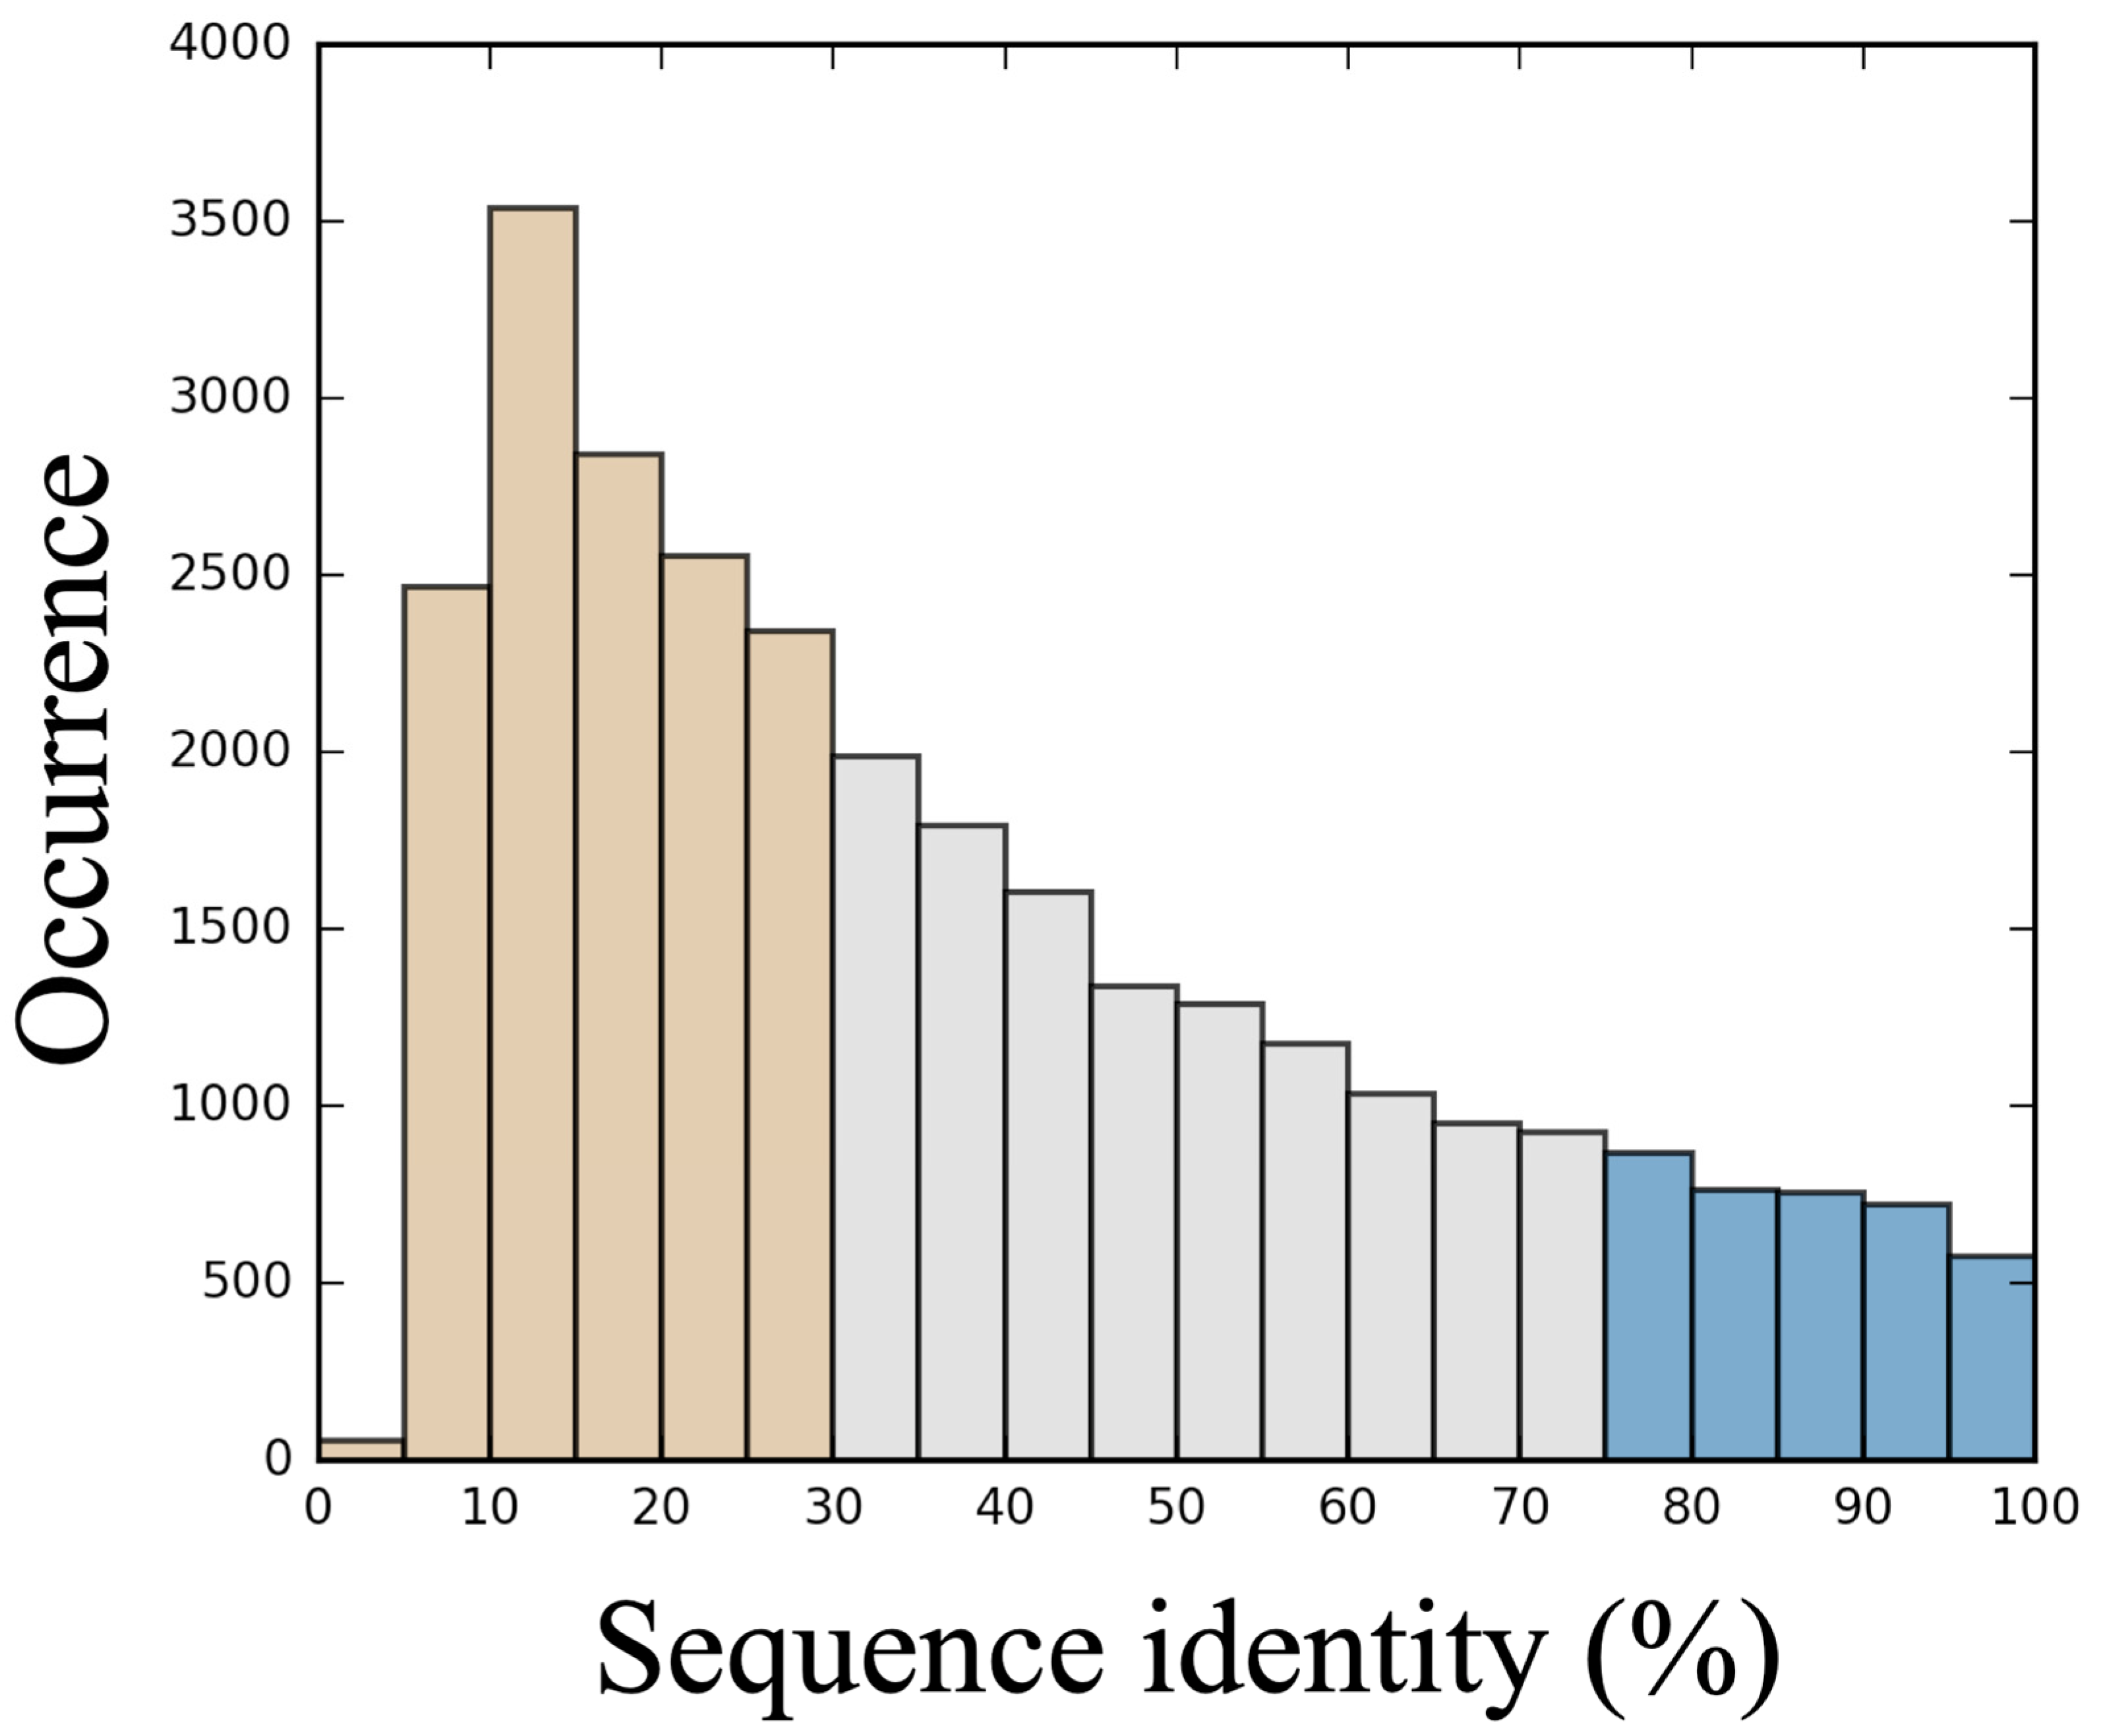
3.1. Generation of a Set of Structural Models for Sequences with Various Sequence Identities with Templates

The assessment of protein model quality is essential to guide computational biologists to select the best structure for further evaluation and analysis. The main idea was to simulate a large sampling of structural models derived from TMP resolved structures, ranging from sequences close to the sequence of a known structure to sequences far from any structural template sequences leading to very poor models, as it may occur. To mimic the drift of protein sequences through evolution, the initial protein sequence of each protein model was subjected to permutations or mutations to reach a given percentage of identity.
For example, a 100amino-acid-length protein sequence will attain 99% of sequence identity if one mutation is virtually performed, or 98% with a permutation since two positions are exchanged between different amino acids. This degenerated sequence and the original protein structure is then used as inputs for Modeller [14] for producing 3D models of the “drifted” protein. We will detail below how the models are assessed using our original method, HPMScore [45] and DOPE [13].
From the dataset of 89 proteins, a total of 29,571 alignments were generated, which correspond to an average value of 332 degenerated alignments per protein. This value depends on the protein length. The distribution of scrambled sequences ranked by sequence identity is shown in Figure 1. The average sequence identity is 38.9% (for a median of 32.55%) and reaches a peak for the 10–15% interval with more than 3500 alignments available. As the generation of sequences with very low identity percentages (<10%) can be time-consuming, we limited the number of sequence generation, which resulted in a drop in this category. This distribution, which looks roughly as an extreme value distribution, shows that it is easier to generate sequences with low sequence identity than with high sequence identity. It also underlines the interest of categorizing 3 main classes of alignments: good for a sequence identities higher than 75% (3682 sequences), bad for sequence identities less than 35% (15,786 sequences), and medium for the sequences between them (10,102 sequences). For each alignment, 25 models were built using Modeller [49].
Thus, a particularly large number of structural models of very different quality have been proposed, allowing a broad view of all the different types of protein folding of TMPs. This approach allows the evaluation of HPMScore and its comparison with DOPE.

3.2. HPM Selects Better Models Than DOPE

To determine which model is the closest to the experimental structure, GDT_TS values [56] were computed for all models proposed from the degenerated sequences. In ideal situations, we should observe a correlation between the scoring functions and the GDT_TS values. Consequently, we addressed two questions: (i) What is the capacity of each scoring function to rank the model with the highest GDT_TS score first? and (ii) What is the quality of the best model (Rank 1) defined by each scoring function? For the first question, we found that both DOPE and HPM can identify the absolute G-model (the one with the highest GDT_TS) with a very limited prediction rate of 7.4% for HPM and 3.7% for DOPE. Although the capacity of each scoring function to identify the absolute G-model is limited, HPM appears slightly more efficient than DOPE.
This result still stands when addressing the second question, i.e., the quality of the model ranked best by each method. Indeed, the first model ranked by HPM has a lower GDT_TS score in 46.9% of cases compared to 40.1% for DOPE, and both select the same in 13.0% of the cases (see Table 1(A)). If the first 5 HPM or DOPE best scores are considered, HPM still outperforms DOPE (48.4% vs. 44.0%), and this situation stands true even if the first 10 models are considered (48.4% vs. 45.5%). This average lower sensitivity of DOPE may be attributed to a more important weight of loop regions in the scoring function. In contrast, when only transmembrane segments are taken into account (see Table 1(B)), DOPE slightly outperforms HPM (47.2% vs. 45.6%) only if the best model is considered. Indeed, when more models are considered (Top 5 or 10 models selected by each method), the differences between the two scoring functions are small but systematically in favor of HPM (46.8% vs. 46.4%, and 47.0% vs. 46.3%, respectively).
In a second step, we examined the influence of the sequence identity on the capacity of identifying the best model and the quality of the ranked models for each method (see Table 2). For models produced with medium sequence identity (35–75% of sequence identity), or with high sequence identity, i.e., good sequence alignment (75–100%), the quality of the best ranked model by HPM largely outperforms the quality of the best ranked model by DOPE, with about 52% for models in both medium and good categories detected by HPMScore, 36% detected using DOPE, and 12% where both models find the same model. For sequences below 35% of sequence identity, considered as poor alignments, DOPE (43.8%) performs slightly better than HPM (42.6%), and both methods find the best model in 13.6% of alignments.
In summary, for target sequences with a sequence identity compatible with comparative modeling (>35%), HPM is on average more effective than DOPE. When the sequence identity decreases, the differences between the two scoring schemas are much lower, and slightly in favor of the DOPE scoring function. Please note that for poor alignment quality, it is difficult to be sure that the aliasing is properly preserved. It is certain that a significant number of cases are not correct TMPs.
Figure 2 illustrates an example of the putative metal-chelate type ABC transporter (PDB ID 2NQ2) and the relationship between the generated alignments, the HPMScore value of the corresponding structural models, and the structural approximation (evaluated here by the GDT_TS). The protein is a homodimer, each monomer being composed of a large transmembrane domain containing eight TM helices and an intracellular domain composed of α-helices mainly and a few β-sheets (Figure 2a). Only Chain A has been evaluated, since Chain B is similar. Figure 2b shows the dependence of the HPM score with the percentage of identity of the target sequences with the template sequences. Since the HPM score is equivalent to a distance, the lower the HPMScore value, the better it is. Figure 2b clearly illustrates the nice correlation between the HPMScore and the sequence identity. Figure 2c shows that the quality of the models (evaluated with the GDT_TS score) is obtained after a strong randomization of the sequence alignment. This figure points out that even with a low sequence identity, the GDT_TS score can be very high, which means that it is possible to keep a native fold. It is clear, however, that the better the alignment, the lower the standard deviation of the category (good, medium, and bad). Figure 2d highlights the correlation between scores from HPMScore and GDT_TS scores. It is clear that for the lowest HPMScore values (associated with good quality alignments), the structural approximation is the best. Moreover, the HPMScore is able to distinguish the best ones from the worst.
Hence, the example in Figure 2 shows the complexity of proposing structural models of different quality, but also how essential it is. TMPs are more often difficult cases than simple ones. The analysis of Top 1 to Top 10 shows that the HPMScore allows on average a better selection of models. The analysis of the alignments compatible with the comparative modeling (average and good quality) shows that the HPMScore gives a better selection in 52% of the cases, 12% are common with DOPE, and DOPE performed better in 36% of the cases. The difference is clear.

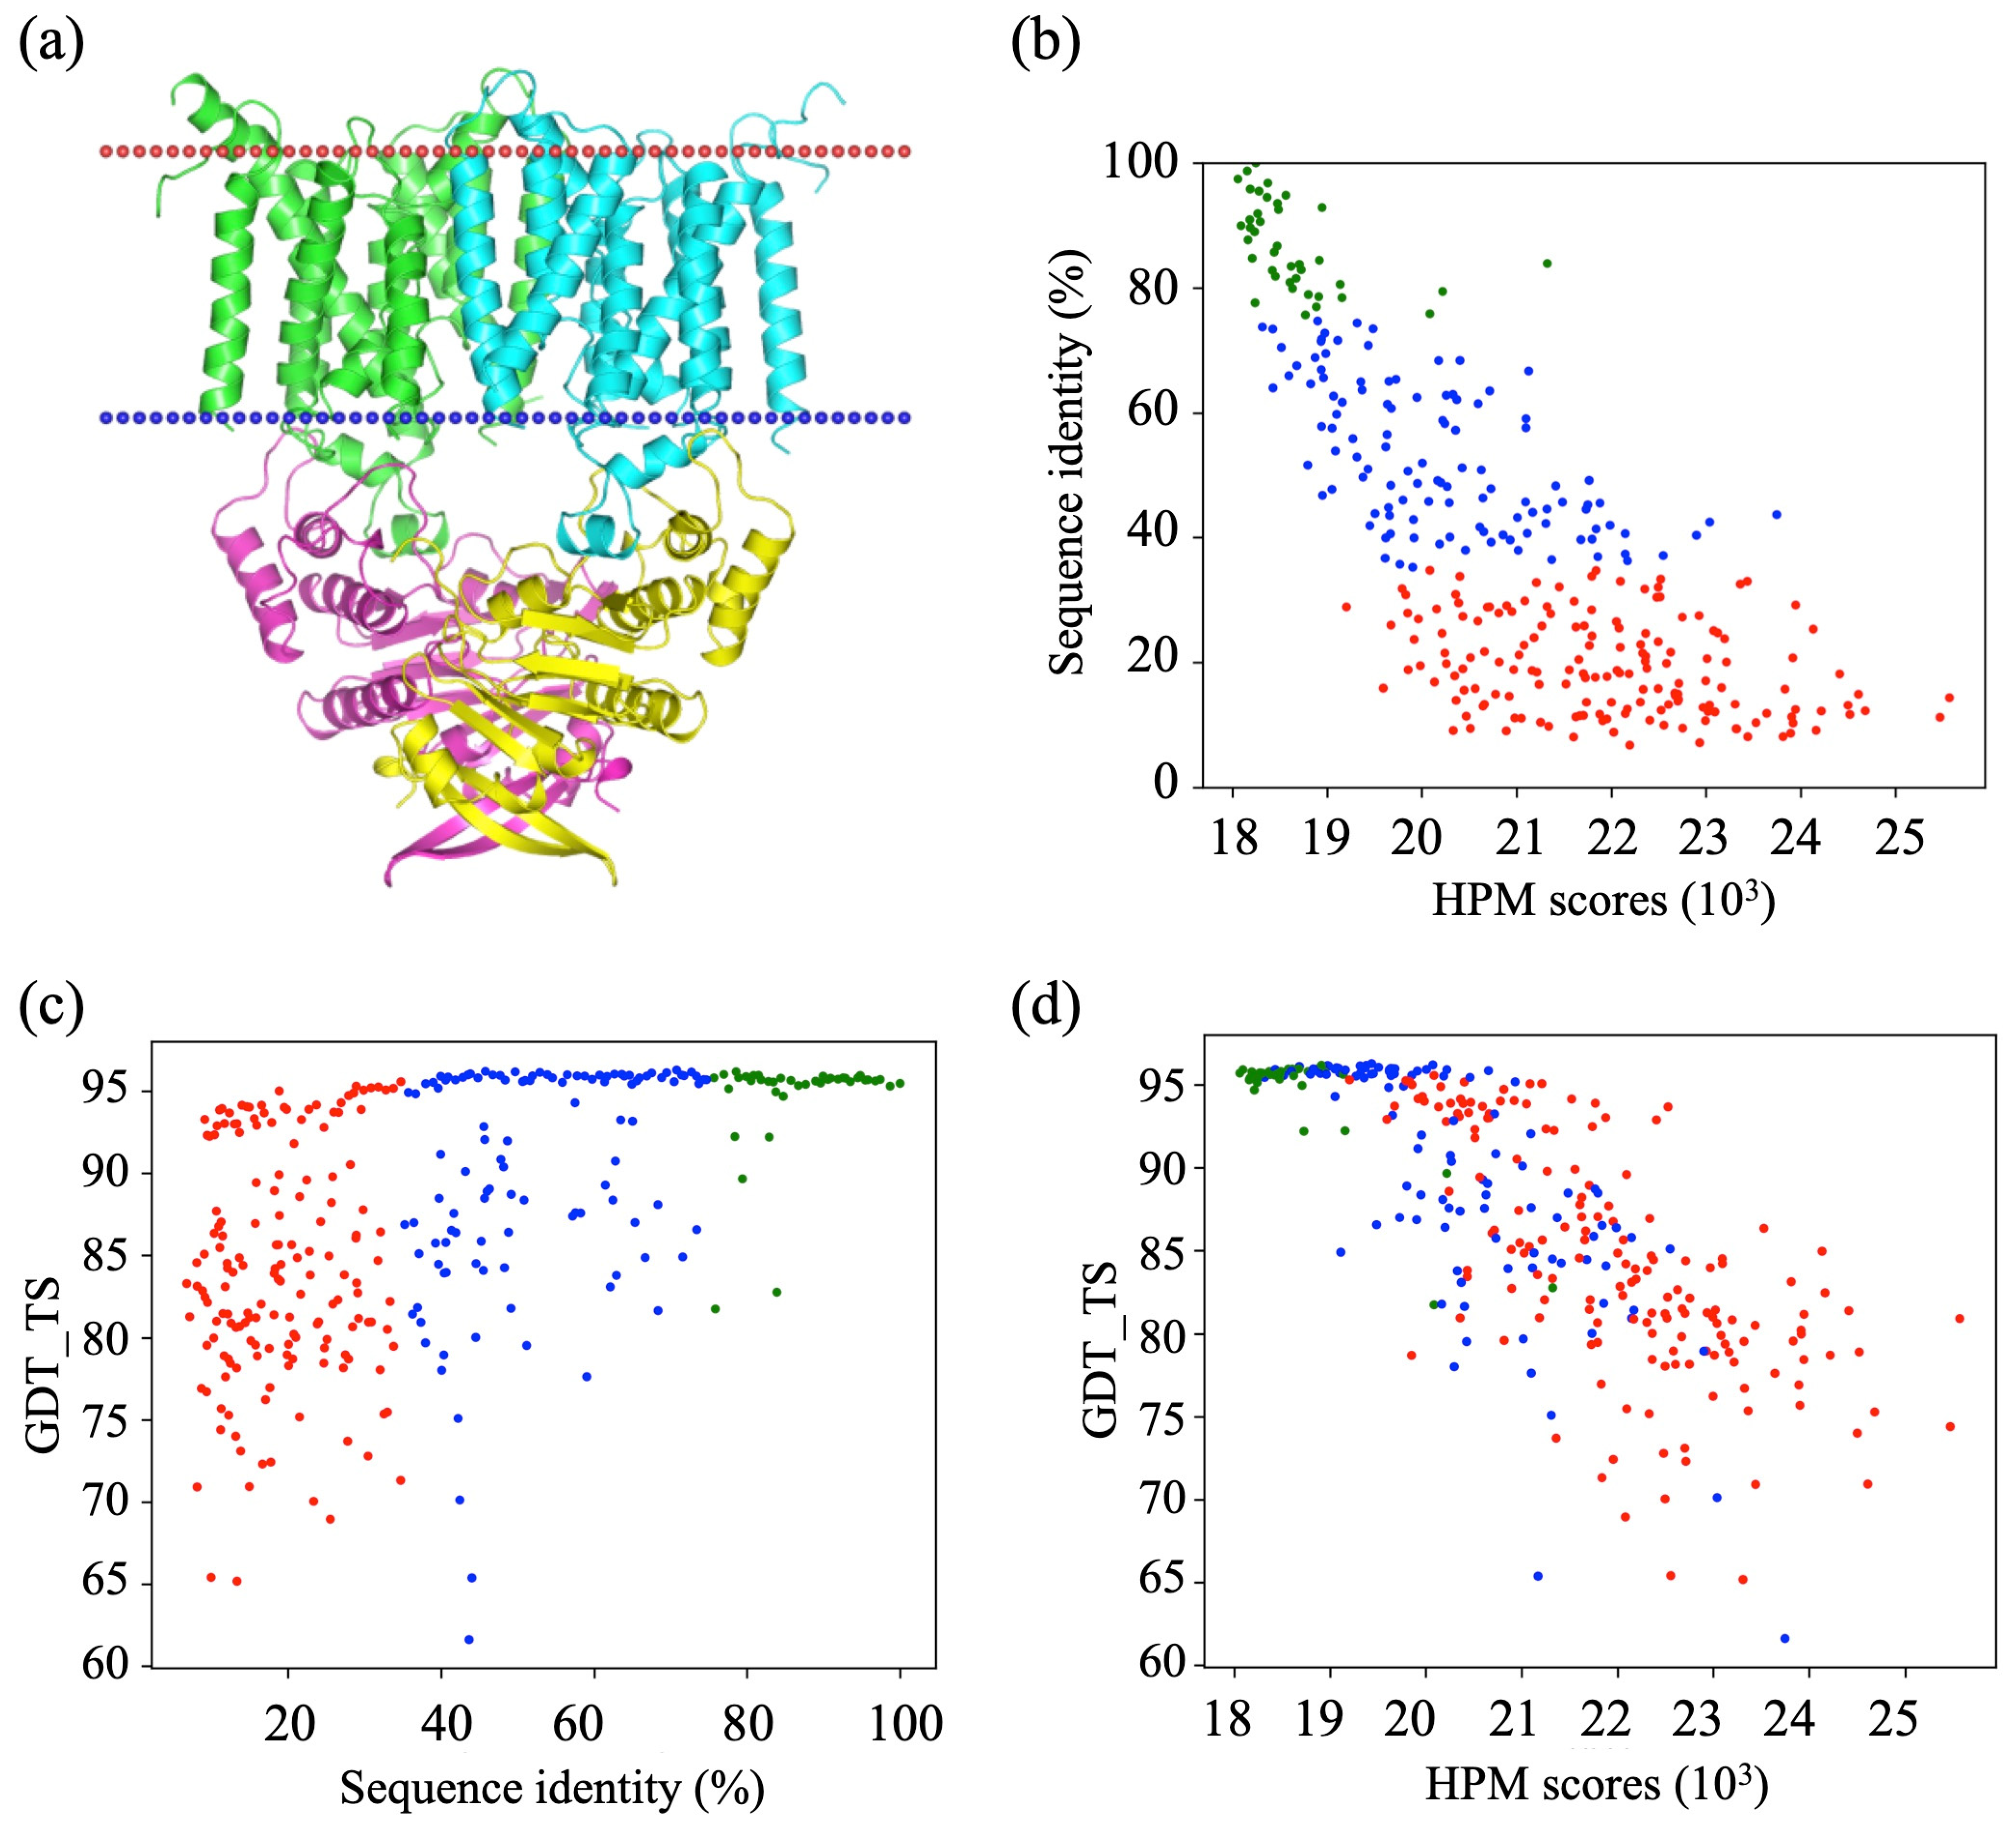
3.3. Assessment of Protein Model Quality

After evaluating how HPM correlates with a robust global measure, such as the GDT_TS, we go further in the evaluation of the quality of the models ranked by HPM and DOPE, respectively. An example of the models obtained for medium sequence identity to the reference protein (38%) is presented in Figure 3. The best model according to HPM is more compact and possesses slightly more secondary structures than the model with the best DOPE score. A closer inspection reveals a more consistent architecture of the seven transmembrane segments, a better orientation of the third intracytoplasmic loop characteristic of GPCR proteins, and the conservation of the extracellular loop involved as a lid for the ligand binding pocket. Overall, both models are of poor quality and would not be considered as sufficient for further use as support models, but the HPM-selected models are better candidates for further modeling studies.
All analyses for all proteins have been made available on the companion site (https://clipperton.ufip.univ-nantes.fr/hpmeval/, accessed on 1 March 2023). The analyses can be viewed at the level of the whole dataset, but also by single protein and by protein type.

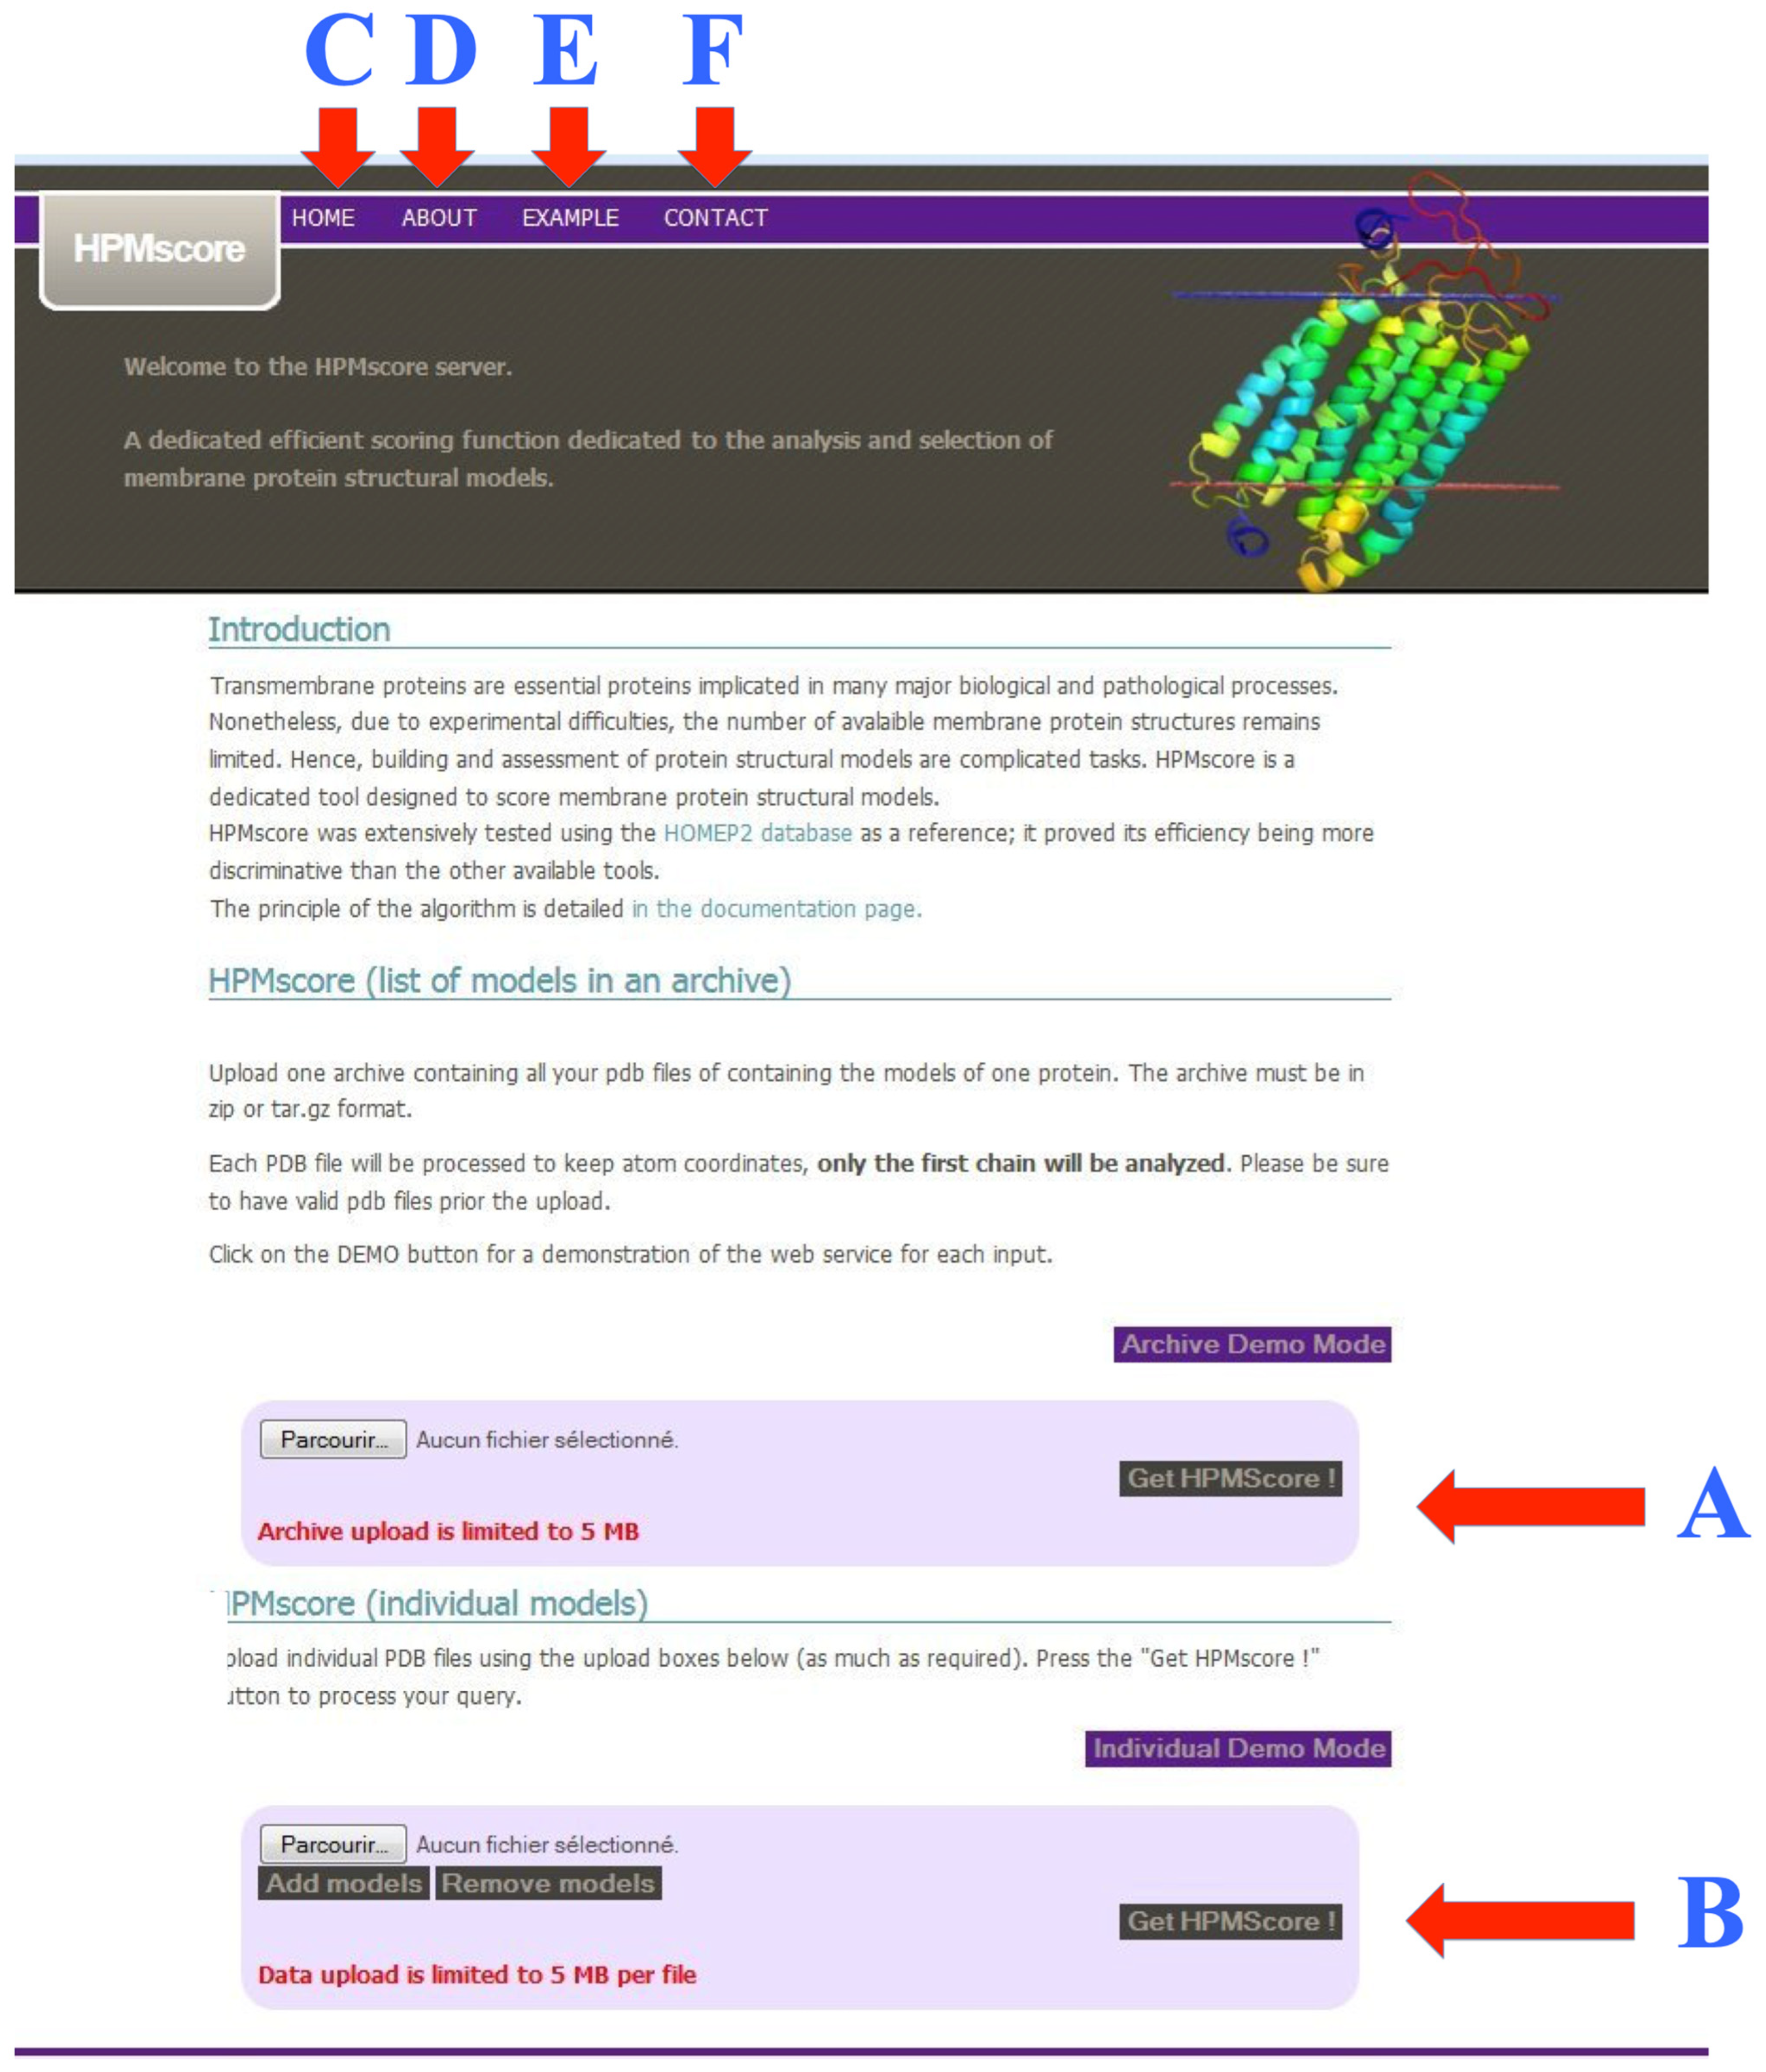
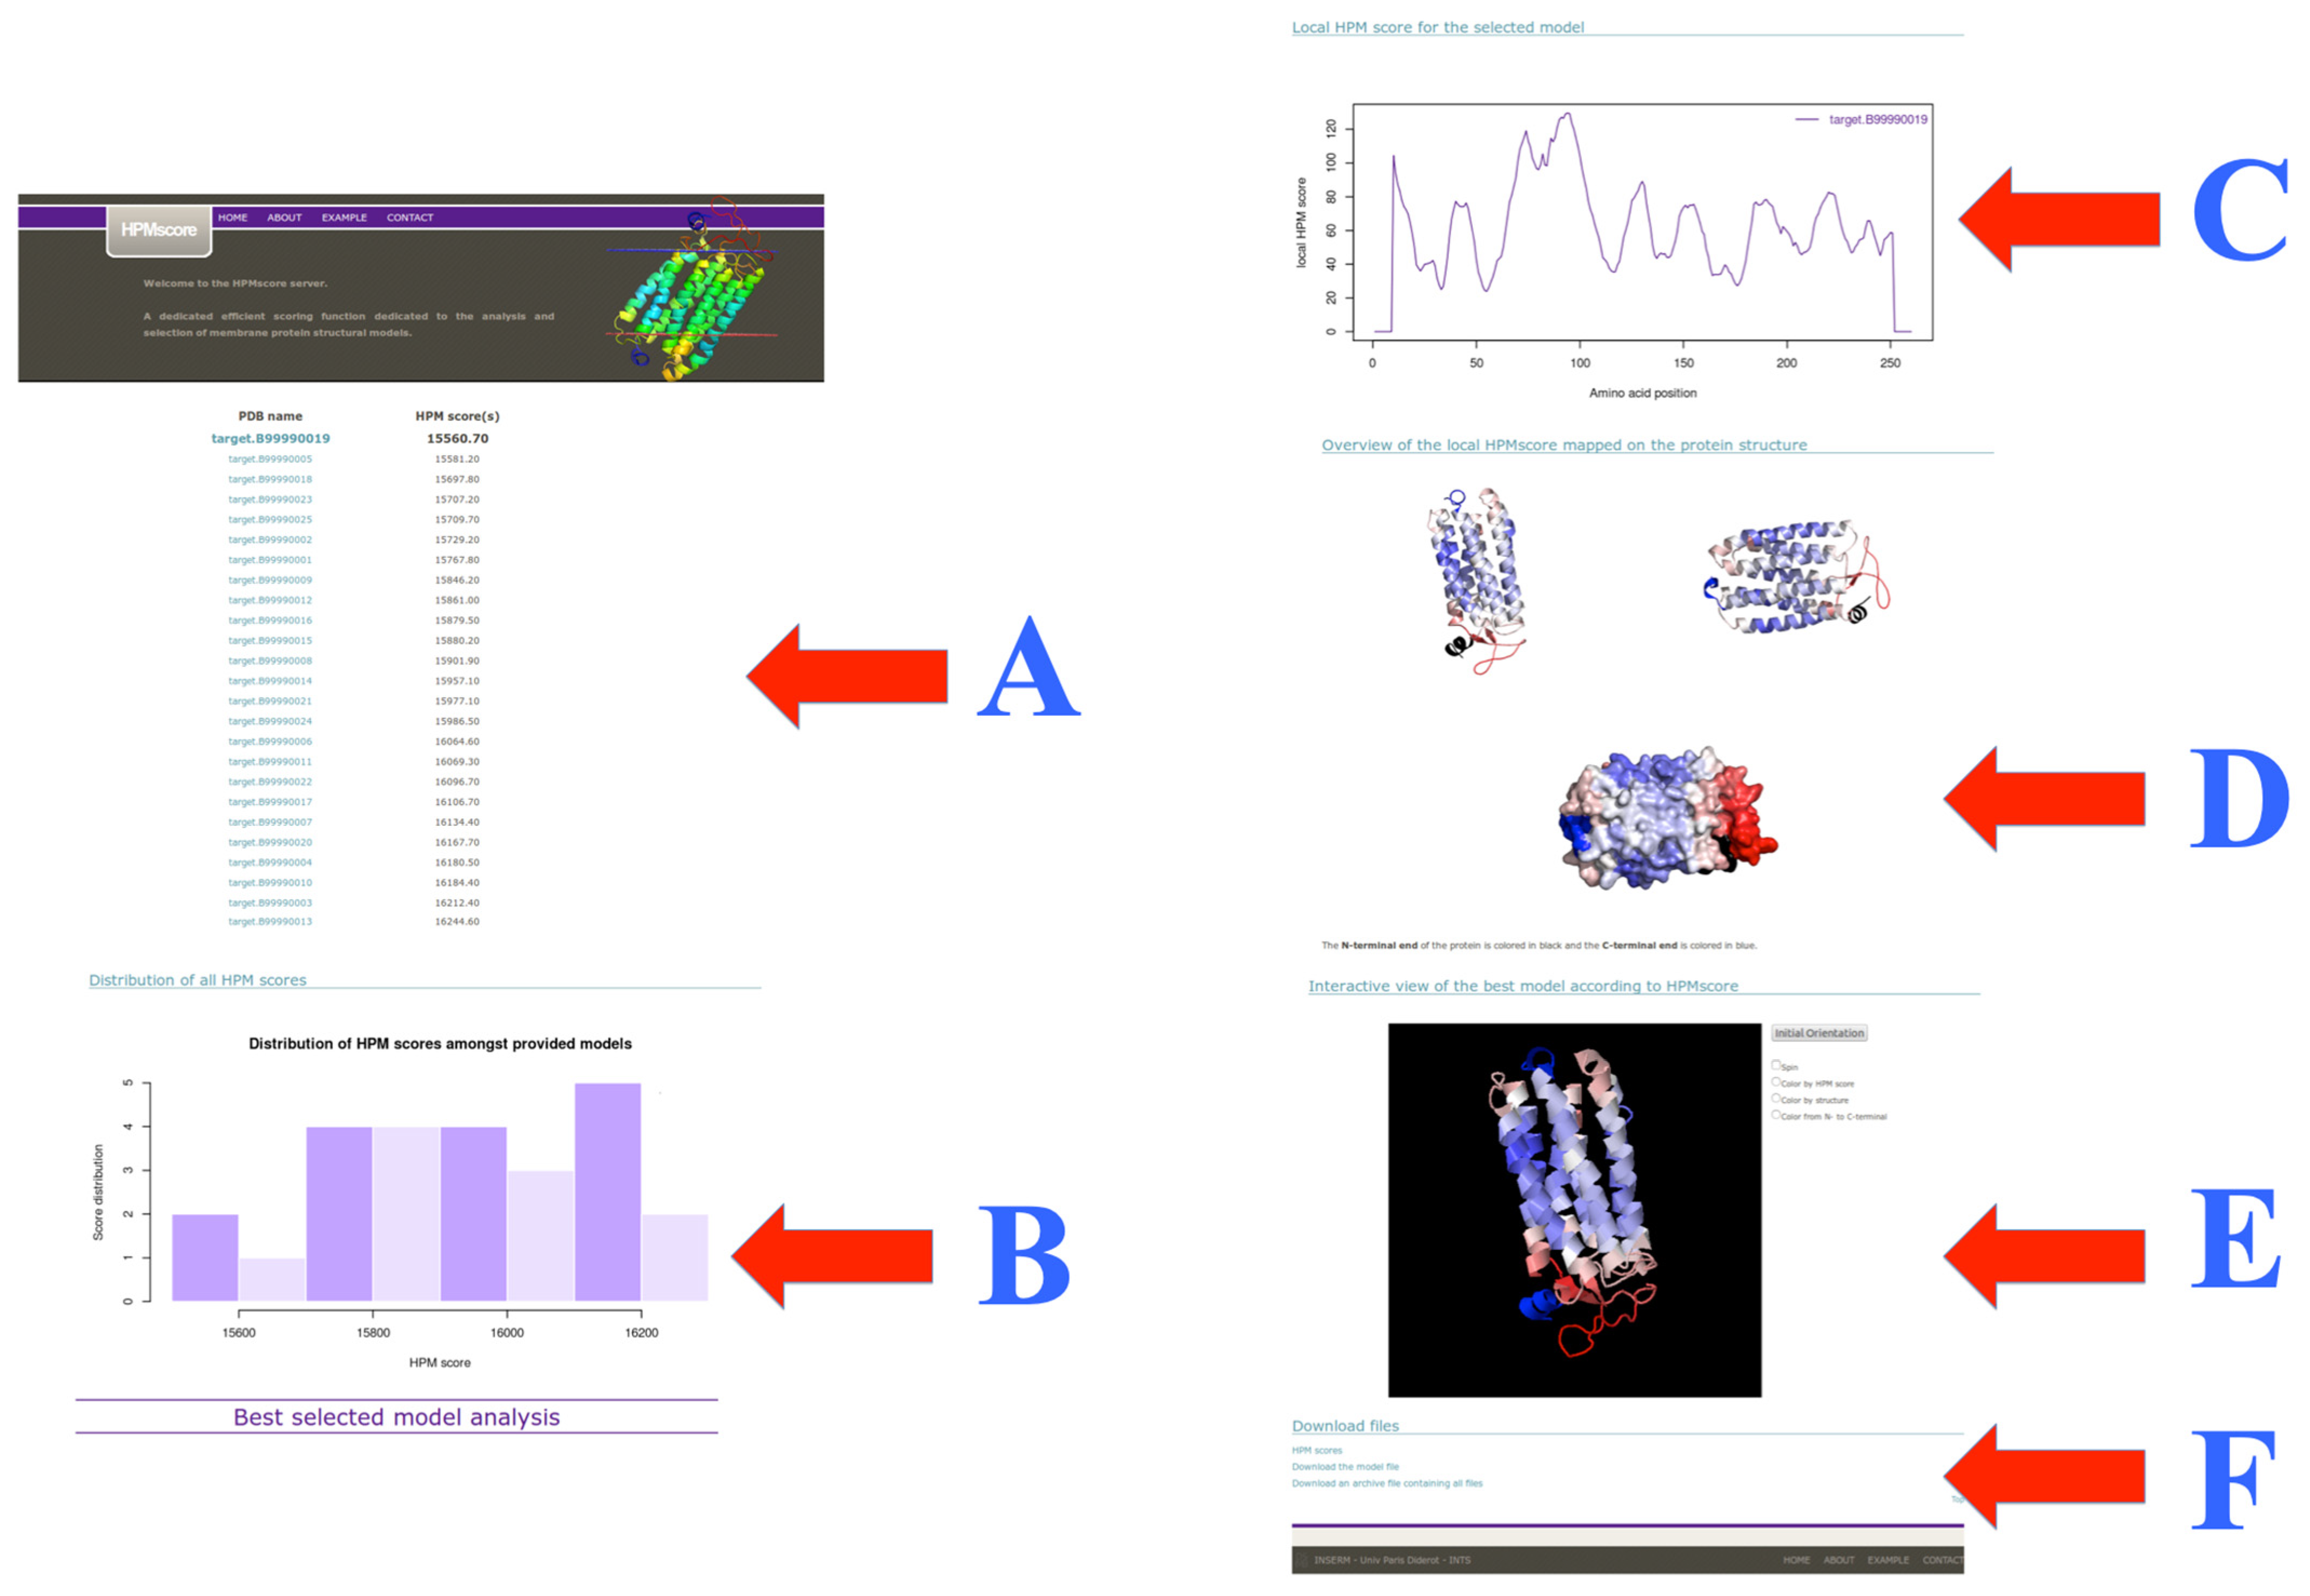
3.4. Web Server Usage and Example

The web server can be accessed at the following url: https://www.dsimb.inserm.fr/dsimb_tools/hpmscore/index.php, accessed on 1 March 2023). The main page gives a small introduction and a direct access to the section for uploading the structural models (see Figure 4). Two options are possible that consist of: (i) Analyzing models one by one (see Figure 4B); or (ii) A set of models uploaded from an archive (see Figure 4A). Please note that structural models must be provided in a classical PDB format, as generated by Modeller [14], Robetta [69], RoseTTAfold [70], AlphaFold2 [40], I-Tasser and other classical approaches.
At the top, links to access other pages are found on all pages. The first page is the Home page (see Figure 4C), followed by a page of explanation of the HPM methodology (see Figure 4D), a concrete example of usage and analysis (see Figure 4E), and finally, the last page contains the contacts of the people involved in this research (see Figure 4F).
When the files have been loaded, the program launches an intermediate note page stating ‘Please wait while HPMScore is computed’. Each job is associated with a temporary directory, which will be kept for two months.
The results page (see Figure 5) is divided into six main parts. The example proposed here can be found on the website, and corresponds to a putative Halorhodopsin with no known structure and less than 40% sequence identity to related ones, i.e., a classical case of structural modeling.
The first section lists the structural models by HPM score in descending order (the best being the first, see Figure 5A). Then, a histogram shows the distribution of the HPM scores of the different models (see Figure 5B). This information allows the user to carry out analyses, for example, to compare the best and the worst model, or other ranking questions. HPM, like DOPE score or Verify3D and PROSA, computes a local score, it uses an overlapping sequence window of 13 residues. The third section provides this information for the first model with a plot (see Figure 5C). It could allow comparing alternative proposed conformations. The fourth part shows the 3D model in two orientations (and an extra one with the surface) thanks to the software PyMOL. The structural model is colored according to the quality considered by the HPM score (see Figure 5D). The user can directly interact with the structural model (see Figure 5E). An essential point is the availability of an archive summarizing all this information (see Figure 5F), which can be downloaded locally. It contains all the information detailed here, but also provided for every model not shown on the website. Structural models are provided with an HPM score. It is possible to observe them with visualization software, such as the PyMOL software. All of this information makes it easy to choose the model that seems the most relevant, knowing the difficulty of this type of question for transmembrane proteins.
Thus, the HPMScore webserver allows the specialist and the neophyte (it has been particularly used in several training sessions) to evaluate models in a simple way. It then allows visualizing the areas considered as the most successful. The specialist can also use it to go further in comparative modeling by combining multiple models according to their local HPMScore values.

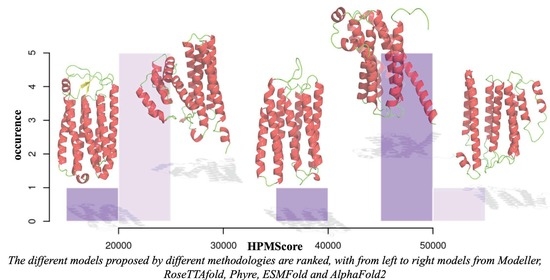
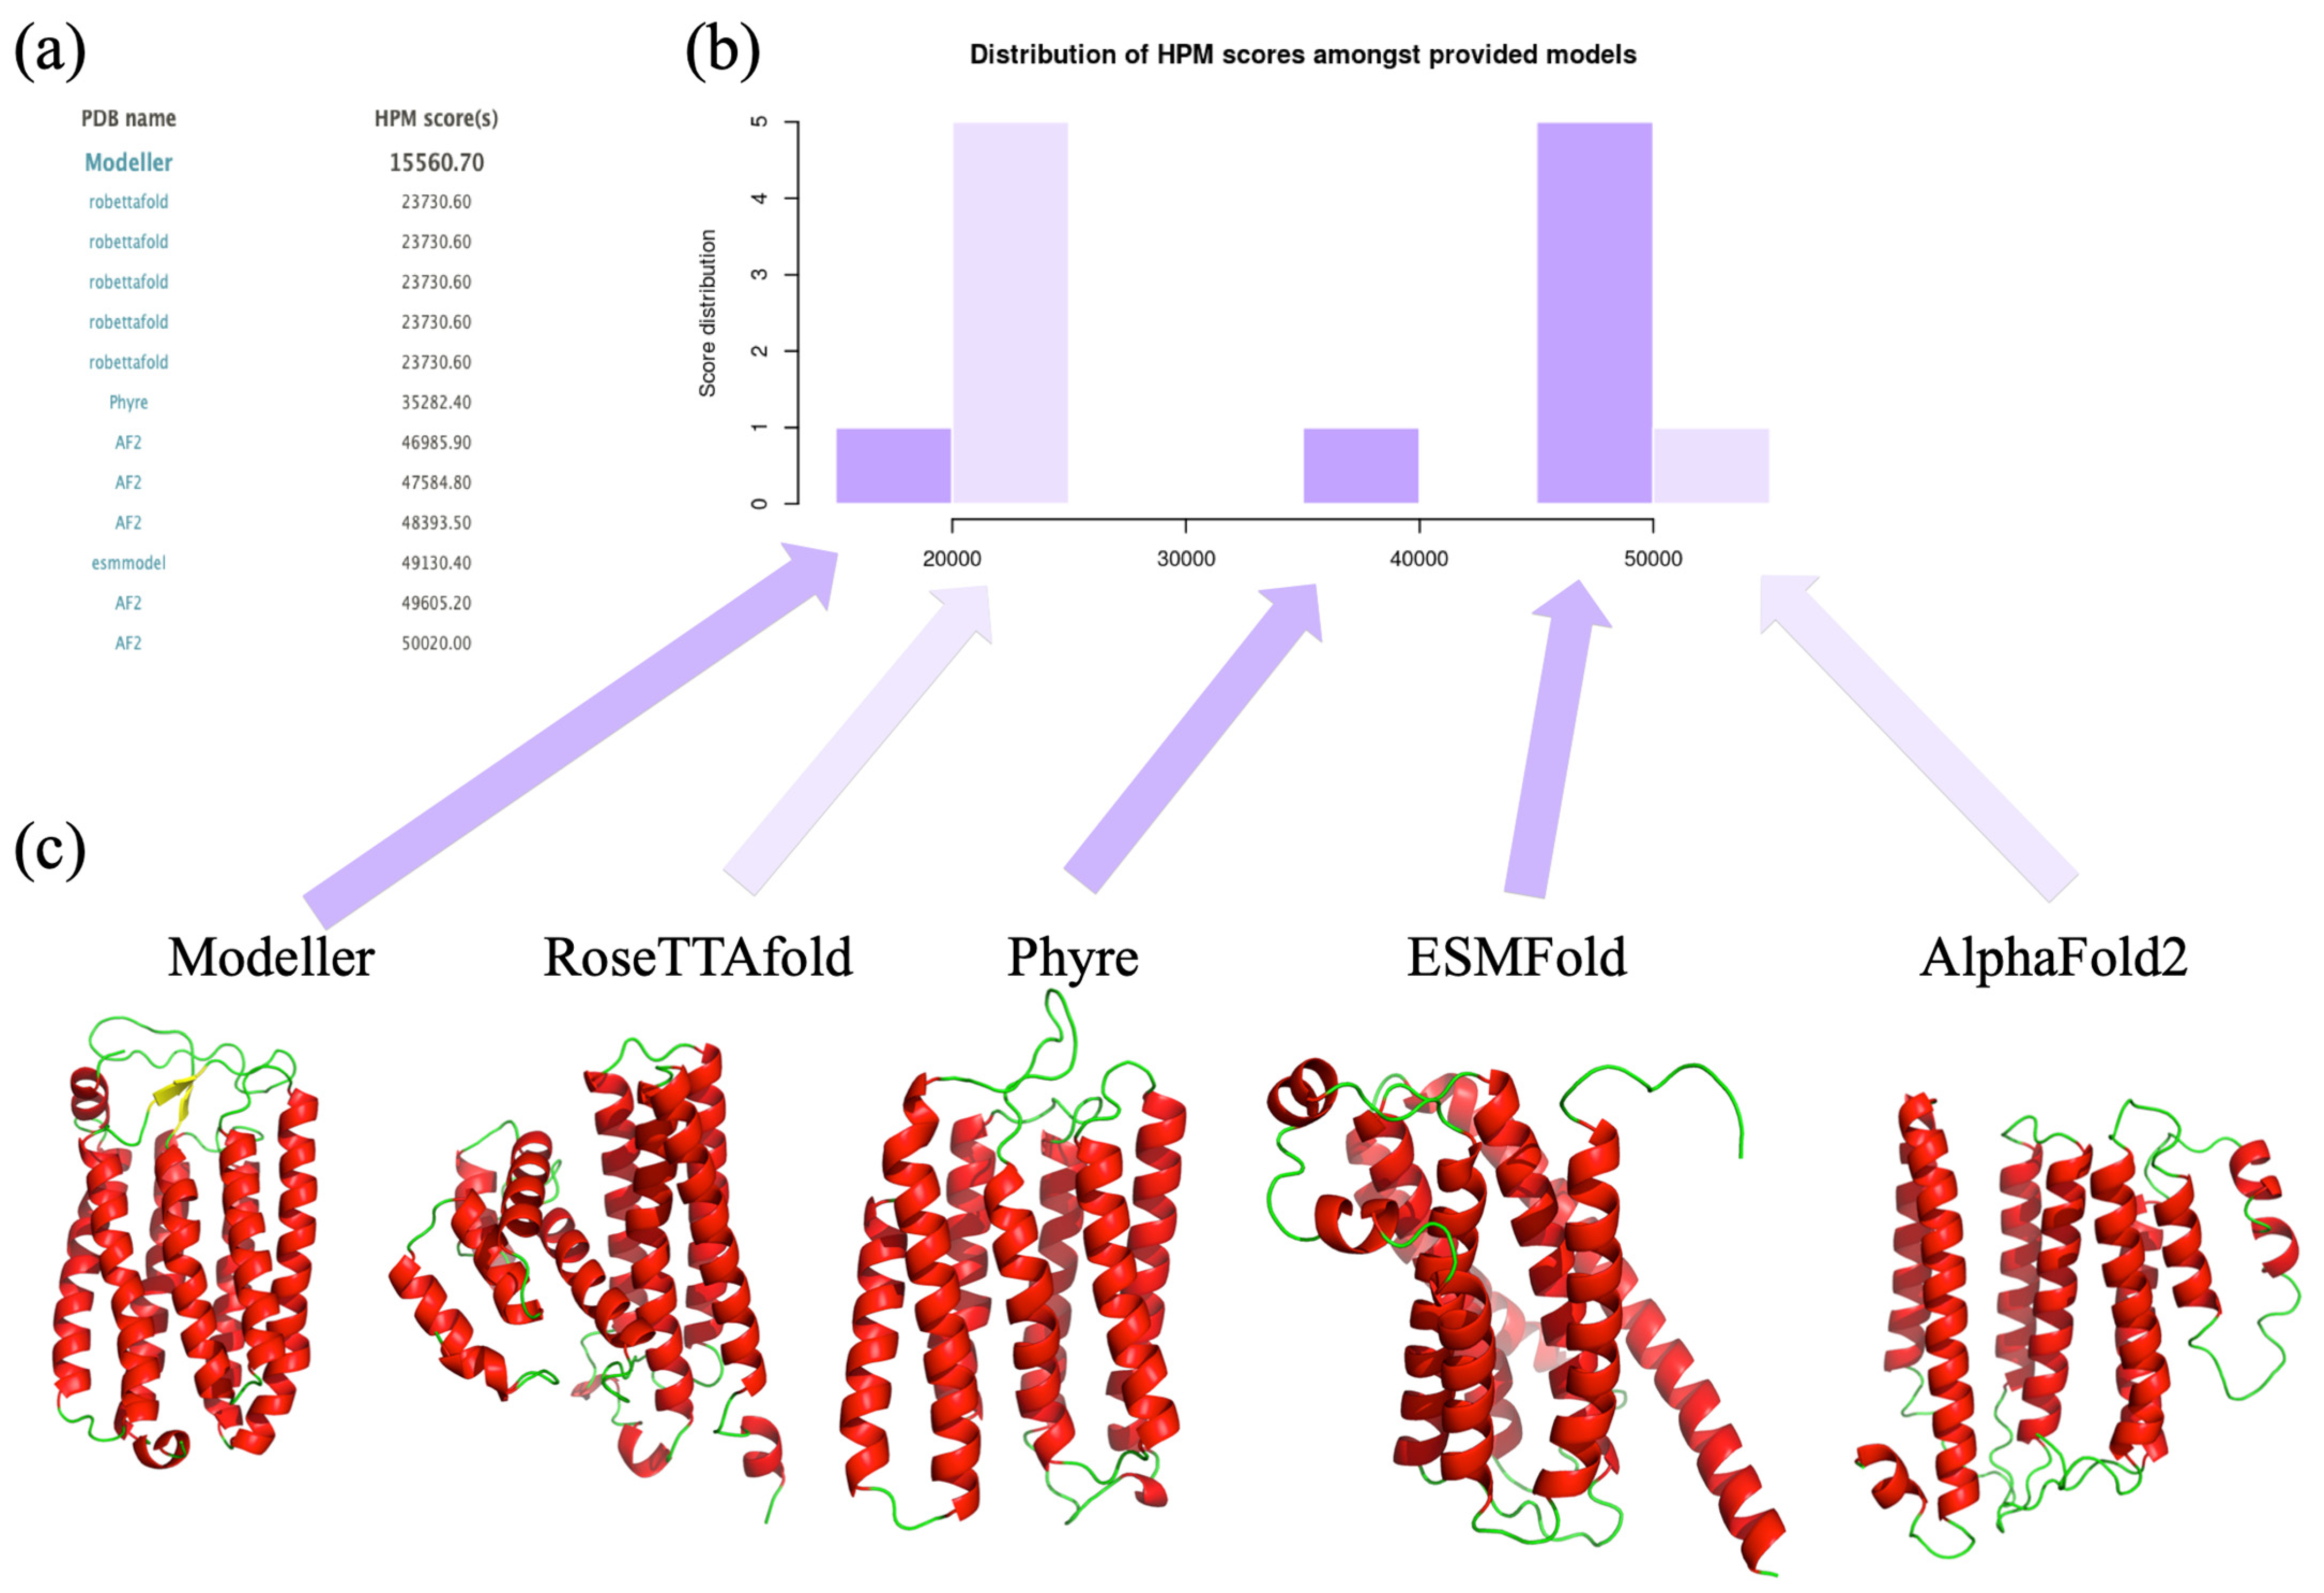
3.5. Use with Structural Models Coming from Different Approaches

We have assessed the interest of our approach based on comparative modeling, while new approaches of interest exist (see Figure 6). We have so built a 3D structural model of the putative Halorhodopsin used in Figure 5 with the threading approach Phyre [71] and deep learning approaches RoseTTAfold [70], ESMFold [72], and AlphaFold2 [40]. Other approaches were tested but they cannot provide complete models.
We have only added the best Modeller results. This works well and shows the diversity and difficulty of proposing TMP structural models. HPMScore values are distant, so the lower the better. Hence, AlphaFold2 [40] is very far away (and close to ESMFold) with the highest HPMScore values. Phyre is the intermediate when our supervised Modeller is the one associated with the lowest (best) HPMScore value. Interestingly, RoseTTAfold is not too far away but has a wrong local topology. This last example clearly underlines the interest of HPMScore, which is a specific development for protein of high pharmaceutical interest. Structure models were evaluated on a large scale with a very large set of model quality showing its stability. The HPM scoring function, performing on average better than DOPE, is the reference scoring function in the Modeller suite [14] (that can be used to rank models made from other approaches).
This example highlights the importance of having an external and simple tool to test results from different tools, even in this period of Deep Learning with AlphaFold2 and related methods.

4. Discussion

The modeling of TMPs has existed for a long time, even when the number of structures was very limited [7,73]. To analyze the properties of TMPs, the first step has long been the prediction of the transmembrane segments. PHDtm was the first method linking artificial neural networks (ANNs) and evolutionary data [74,75]. PsiPred [76,77] is a widely used platform for secondary structure prediction, which uses position-specific scoring matrices (PSSMs) with ANN [78]. Although this approach is hardly specific to TMPs, it has shown good results. Initially, the addition of hydrophobicity scales to the prediction of secondary structures gave better results [79,80]. An impressive number of methods were proposed, such as MEMSAT [81,82], HTP [83], DAS [83], SOSUI [84], HMMTOP [85,86], TMHMM 1.0 [87], PRED-TMR [88], OCTOPUS [89], TOPCONS [90,91], MINNOU [92], SVMtm [93], TUPS [94], Localizome [95], MemBrain [96], AllesTM [97], TMPSS [98], and TMbed [99]. The most recent approaches also take into account other features, such as the regions of the protein that actually face the membrane, the cytosolic or extracellular sides, and the motifs responsible for the interactions [97,100,101,102].
These approaches do not provide 3D structural models but they provide interesting behaviors. The first and most common proposition of TMP structural models is homology modeling with Modeller [14] and SwissModel [103]. Based on sequence alignment with a structural template, it remains essential in the TMP area. Some methods have been developed specifically for TMP. For instance, MEMOIR (membrane protein modeling pipeline) [104], and MEDELLER [105], which proposed only high-quality regions and did not complete others. Threading was used in TMFoldWeb [106], a web implementation of TMFoldRec [107]. Rosetta had interestingly incorporated a specific membrane-specific version of the original Rosetta energy function, which considers the membrane environment as an additional variable next to amino acid identity, inter-residue distances, and density [108]. It was included in RosettaMP [98]. In fact, all structural modeling methods, e.g., Phyre [71], Modeller [14], SwissModel [103], RoseTTAfold [70], ESMFold [72], and AlphaFold2 [40] can be used for TMPs (see Section 3.5).
However, a quasi-systematic bias is the use of score functions related to globular proteins and not to transmembrane proteins, such as DOPE. Independent tools, such as Verify3D [18] or Prosa II [16,17], are based on data that mainly emphasize globular proteins largely over-represented in PDB globular proteins compared to TMPs.
It is worth noting some studies of interest. Postic and collaborators have, thus, set up an empirical energy function for the structural assessment of protein transmembrane domains [33]. This statistical potential quantifies the interatomic distance between residues located in the lipid bilayer. Following a leave-one-out cross-validation procedure, they show that their method outperforms statistical potentials in discriminating correct from incorrect membrane protein models. The approach must be locally installed. Studer and coworkers proposed an equivalent method named QMEANBrane [35] derived from the original QMEAN scoring function [20,109]. It is integrated in the SwissModel environment but cannot be used with external models [103]. More recently, AlphaFold2 had proposed its pLDDT scores [40] associated with the quality of the proposed structural models. However, it cannot be used with results from other approaches. It seems so interesting to see if the HPMScore could be interesting for the scientific community.
Our work can easily raise three questions: (i) Which proteins can be used? (ii) Which structural models can be generated? and (iii) How can the results be assessed?.
Transmembrane proteins are difficult to obtain experimentally. In 2000, only one structure was in the protein data bank. Thanks to new methodologies, their number had greatly increased. Now, 1561 unique PTM structures can be found, for all-α and all-β TMPs, as stated by mpstruct [110,111] (https://blanco.biomol.uci.edu/mpstruc/#news, accessed on 17 January 2023). However, the number of different folds had not really increased, and redundancies exist. We have kept the HOMEP dataset as we know it very well and represent correctly the different known TMP folds.
From this dataset, we need to generate a series of structural models. Different approaches have been proposed to generate decoys that deviated from the real structure. As no dataset was available, we generated our own. To do this, we decided to make point mutations, insertions, and deletions to move further and further away from the real structure. Of course, this does not represent a directed (or rather degenerated) evolution [112], but it does allow for an important sampling of conformational space. The conservation of the membrane part plays on a weaker amino acid alphabet [113] than the one we used. Figure 2c shows how complex this is. Even with a 25% alignment, it is possible to have GDT_TS ranging from 10 to 90.
Finally, we have analyzed the results with RMSD [114], PBscore [65], and GDT_TS [56]. They all provide the same trends. Top 1, Top 5 and Top 10 underline the interest of the HPMScore to select the best models. As discussed before, we are in the idea of comparative modeling, i.e., for sequence alignment higher than 35%; the HPMScore gives a better selection in 52% of the cases, 12% are common with DOPE, and DOPE is associated with it in 36% of the cases. Figure 7 shows a visualization of the quality of the prediction by a slice of 5% of sequence identity. A regression is performed for the HPM results of DOPE and cases where both give the same result. The direction of the lines highlights the superiority of HPM. This evaluation unequivocally demonstrates the value of the approach. A Welsh test on the question of whether HPM is better than a DOPE score alone (data in Figure 7) gave a significant positive answer (0.01). A rather complex point to apprehend is the variability of the results simply by protein. The generation of unsupervised alternative alignments gives very different results depending on the topology of the protein, its amino acid composition or the impacts of insertions–deletions.
Lastly, we should remember that the HPMScore is built on the HPM matrix, fully described in [45]. The HPM strategy is based on a learning process combining sequence and structural properties, which depends on a few parameters.
In the present work, we kept the optimal HPM matrix finely tuned after an extensive grid search of the parameters and trained on 52 PDB files. Despite its small size, this dataset contains most of the representative folds of α-helical TM protein. Given the good results with the present version of the HPM matrix, we may reasonably expect improvement with new training on a larger dataset that includes 3D structures solved since. This will be the subject of a forthcoming study. For convenience, we have made available an additional website (https://clipperton.ufip.univ-nantes.fr/hpmeval/, accessed on 1 March 2023) with a large number of analyses, which highlights this complexity.
The HPMScore web server allows a simple and efficient use; we used it regularly (and also for courses). The example presented with results from very different predictive tools clearly demonstrates the usability of the methodology.

5. Conclusions

When one wants to produce a model and evaluate its quality, it is important to understand how the scoring procedure will indicate the overall quality of the model. Most of the proposed structural models have been created using comparative modeling [7], while AlphaFold2 can provide an interesting alternative [41,115,116]. In our study, we first simulated the evolutionary drift in protein sequence between homologous proteins by creating degenerated sequences using amino acids mutations or permutations. For each resulting sequence, we modeled the putative target protein from the template protein where the 3D structure was available. We then assessed the performance of our new method against the reference DOPE function, reportedly very effective for membrane proteins. Our new scoring function is based on the hybrid protein model approach, trained on a set of representative membrane proteins. It is widely accepted that membrane proteins are difficult to model since the amino acids forming the transmembrane segments are densely packed due to the hydrophobic environment and the lipid compaction surrounding the protein, whilst the extra- and intra-cellular amino acids are exposed to a more hydrophilic medium.
This study is interesting as the HPMScore is a non-classical approach, and was tested with the greatest number of different TMPs and the largest number of generated models. Moreover, Top 1 was used, but also Top 5 and Top 10; sequence identity rate influence was evaluated and even the analysis of the transmembrane region was assessed. It is, therefore, a systematic large-scale study.
A server is up for model validation. It can take as input a single model or a large number of models coming from various prediction methods. Interestingly, it can be used to select models and to analyze them at residue level (and so potentially combine different structural models).

Author Contributions

Conceptualization, A.G.d.B.; methodology, S.T., J.E., A.U. and A.G.d.B.; HPM coding, A.U.; formal analysis, S.T., J.E., A.U. and A.G.d.B.; resources, S.T., J.E., A.U. and A.G.d.B.; data curation, A.U. and A.G.d.B.; webserver developments, S.T. and J.E.; writing—original draft preparation, A.U. and A.G.d.B.; writing—review and editing, S.T., J.E., A.U., C.E. and A.G.d.B.; visualization, C.E., S.T., J.E. and A.G.d.B.; supervision, A.G.d.B.; project administration, C.E. and A.G.d.B.; funding acquisition, A.G.d.B. All authors have read and agreed to the published version of the manuscript.

Funding

This work was supported by grants from the Ministry of Research (France), Université Paris Cité (formerly University Paris Diderot, Sorbonne, Paris Cité, France and formerly Université de Paris), Université de la Réunion, National Institute for Blood Transfusion (INTS, France), National Institute for Health and Medical Research (INSERM, France), IdEx ANR-18-IDEX-0001 and labex GR-Ex. The labex GR-Ex, reference ANR-11-LABX-0051 is funded by the program “Investissements d’avenir” of the French National Research Agency, reference ANR-11-IDEX-0005-02. A.G.d.B. acknowledges the French National Research Agency with grant ANR-19-CE17-0021 (BASIN). Calculations were also performed on an SGI cluster granted by Conseil Régional Ile de France and INTS (SESAME Grant).

Institutional Review Board Statement

Not applicable.

Informed Consent Statement

Not applicable.

Data Availability Statement

Not applicable.

Acknowledgments

We would like to thank the anonymous reviewers who helped to improve the manuscript, Jean-Christophe Gelly for the fruitful discussions, and Sylvain Léonard for the technical support.

Conflicts of Interest

The authors declare no conflict of interest. The funders had no role in the design of the study; in the collection, analyses, or interpretation of data; in the writing of the manuscript, or in the decision to publish the results.

Appendix A

Figure A1. Study principle. (a) From a real structure taken from the protein data bank, (b) its sequence is extracted, an original alignment at 100% is performed, (c) then different changes are made to create alignments with decreasing sequence identity, (d) each alignment is used to generate structural models, (e) these models are superimpose with the true structural allowing to compute GDT_TS and RMSD.
Biomedinformatics 03 00021 g0a1

References

  1. Berman, H.M.; Westbrook, J.; Feng, Z.; Gilliland, G.; Bhat, T.N.; Weissig, H.; Shindyalov, I.N.; Bourne, P.E. The protein data bank. Nucleic Acids Res. 2000, 28, 235–242. [Google Scholar] [CrossRef] [PubMed] [Green Version]
  2. Dobson, L.; Reményi, I.; Tusnády, G.E. The human transmembrane proteome. Biol. Direct 2015, 10, 31. [Google Scholar] [CrossRef] [PubMed] [Green Version]
  3. Zaucha, J.; Heinzinger, M.; Kulandaisamy, A.; Kataka, E.; Salvádor, Ó.L.; Popov, P.; Rost, B.; Gromiha, M.M.; Zhorov, B.S.; Frishman, D. Mutations in transmembrane proteins: Diseases, evolutionary insights, prediction and comparison with globular proteins. Brief. Bioinform. 2020, 22, bbaa132. [Google Scholar] [CrossRef] [PubMed]
  4. Gong, J.; Chen, Y.; Pu, F.; Sun, P.; He, F.; Zhang, L.; Li, Y.; Ma, Z.; Wang, H. Understanding membrane protein drug targets in computational perspective. Curr. Drug Targets 2019, 20, 551–564. [Google Scholar] [CrossRef] [PubMed]
  5. Varga, J.; Dobson, L.; Reményi, I.; Tusnády, G.E. Tstmp: Target selection for structural genomics of human transmembrane proteins. Nucleic Acids Res. 2017, 45, D325–D330. [Google Scholar] [CrossRef] [Green Version]
  6. Latek, D.; Trzaskowski, B.; Niewieczerza, S.; Miszta, P.; Mynarczyk, K.; Dębiński, A.; Puławski, W.; Yuan, S.; Sztyler, A.; Orze, U.; et al. Modeling of membrane proteins. In Computational Methods to Study the Structure and Dynamics of Biomolecules and Biomolecular Processes; Liwo, A., Ed.; Springer: Berlin/Heidelberg, Germany, 2018; pp. 371–451. [Google Scholar]
  7. Almeida, J.G.; Preto, A.J.; Koukos, P.I.; Bonvin, A.; Moreira, I.S. Membrane proteins structures: A review on computational modeling tools. Biochim. Biophys. Acta. Biomembr. 2017, 1859, 2021–2039. [Google Scholar] [CrossRef] [PubMed]
  8. Dobson, L.; Szekeres, L.I.; Gerdán, C.; Langó, T.; Zeke, A.; Tusnády, G.E. Tmalphafold database: Membrane localization and evaluation of alphafold2 predicted alpha-helical transmembrane protein structures. Nucleic Acids Res. 2022, 51, D517–D522. [Google Scholar] [CrossRef]
  9. Lazaridis, T.; Karplus, M. Discrimination of the native from misfolded protein models with an energy function including implicit solvation. J. Mol. Biol. 1999, 288, 477–487. [Google Scholar] [CrossRef] [Green Version]
  10. Felts, A.K.; Gallicchio, E.; Wallqvist, A.; Levy, R.M. Distinguishing native conformations of proteins from decoys with an effective free energy estimator based on the opls all-atom force field and the surface generalized born solvent model. Proteins 2002, 48, 404–422. [Google Scholar] [CrossRef] [PubMed]
  11. Dutagaci, B.; Wittayanarakul, K.; Mori, T.; Feig, M.A.-O. Discrimination of native-like states of membrane proteins with implicit membrane-based scoring functions. J. Chem. Comput. 2017, 13, 3049–3059. [Google Scholar] [CrossRef]
  12. Postic, G.; Janel, N.; Tufféry, P.; Moroy, G. An information gain-based approach for evaluating protein structure models. Comput. Struct. Biotechnol. J. 2020, 18, 2228–2236. [Google Scholar] [CrossRef]
  13. Shen, M.Y.; Sali, A. Statistical potential for assessment and prediction of protein structures. Protein Sci. 2006, 15, 2507–2524. [Google Scholar] [CrossRef] [Green Version]
  14. Sali, A.; Blundell, T.L. Comparative protein modelling by satisfaction of spatial restraints. J. Mol. Biol. 1993, 234, 779–815. [Google Scholar] [CrossRef] [PubMed]
  15. Webb, B.; Sali, A. Protein structure modeling with modeller. Methods Mol. Biol. 2021, 2199, 239–255. [Google Scholar] [PubMed]
  16. Sippl, M.J. Recognition of errors in three-dimensional structures of proteins. Proteins 1993, 17, 355–362. [Google Scholar] [CrossRef] [PubMed]
  17. Wiederstein, M.; Sippl, M.J. Prosa-web: Interactive web service for the recognition of errors in three-dimensional structures of proteins. Nucleic Acids Res. 2007, 35, W407–W410. [Google Scholar] [CrossRef] [Green Version]
  18. Eisenberg, D.; Lüthy, R.; Bowie, J.U. Verify3d: Assessment of protein models with three-dimensional profiles. Methods Enzymol. 1997, 277, 396–404. [Google Scholar] [CrossRef]
  19. Lüthy, R.; Bowie, J.U.; Eisenberg, D. Assessment of protein models with three-dimensional profiles. Nature 1992, 356, 83–85. [Google Scholar] [CrossRef]
  20. Benkert, P.; Biasini, M.; Schwede, T. Toward the estimation of the absolute quality of individual protein structure models. Bioinformatics 2011, 27, 343–350. [Google Scholar] [CrossRef] [Green Version]
  21. Kortemme, T.; Morozov, A.V.; Baker, D. An orientation-dependent hydrogen bonding potential improves prediction of specificity and structure for proteins and protein-protein complexes. J. Mol. Biol. 2003, 326, 1239–1259. [Google Scholar] [CrossRef] [Green Version]
  22. Shin, W.H.; Kang, X.; Zhang, J.; Kihara, D. Prediction of local quality of protein structure models considering spatial neighbors in graphical models. Sci. Rep. 2017, 7, 40629. [Google Scholar] [CrossRef] [PubMed] [Green Version]
  23. Tosatto, S.C. The victor/frst function for model quality estimation. J. Comput. Biol. A J. Comput. Mol. Cell Biol. 2005, 12, 1316–1327. [Google Scholar] [CrossRef]
  24. Conover, M.; Staples, M.; Si, D.; Sun, M.; Cao, R. Angularqa: Protein model quality assessment with lstm networks. Comput. Math. Biophys 2019, 7, 1–9. [Google Scholar] [CrossRef]
  25. Uziela, K.; Shu, N.; Wallner, B.; Elofsson, A. Proq3: Improved model quality assessments using rosetta energy terms. Sci. Rep. 2016, 6, 33509. [Google Scholar] [CrossRef] [PubMed] [Green Version]
  26. Cao, R.; Bhattacharya, D.; Hou, J.; Cheng, J. Deepqa: Improving the estimation of single protein model quality with deep belief networks. BMC Bioinform. 2016, 17, 495. [Google Scholar] [CrossRef] [Green Version]
  27. Studer, G.; Rempfer, C.; Waterhouse, A.M.; Gumienny, R.; Haas, J.; Schwede, T. Qmeandisco-distance constraints applied on model quality estimation. Bioinformatics 2020, 36, 1765–1771. [Google Scholar] [CrossRef] [PubMed]
  28. Gao, C.; Stern, H.A. Scoring function accuracy for membrane protein structure prediction. Proteins 2007, 68, 67–75. [Google Scholar] [CrossRef]
  29. Heim, A.J.; Li, Z. Developing a high-quality scoring function for membrane protein structures based on specific inter-residue interactions. J. Comput.-Aided Mol. Des. 2012, 26, 301–309. [Google Scholar] [CrossRef] [Green Version]
  30. Ray, A.; Lindahl, E.; Wallner, B. Model quality assessment for membrane proteins. Bioinformatics 2010, 26, 3067–3074. [Google Scholar] [CrossRef] [Green Version]
  31. Wallner, B. Proqm-resample: Improved model quality assessment for membrane proteins by limited conformational sampling. Bioinformatics 2014, 30, 2221–2223. [Google Scholar] [CrossRef] [Green Version]
  32. Nugent, T.; Jones, D.T. Membrane protein orientation and refinement using a knowledge-based statistical potential. BMC Bioinform. 2013, 14, 276. [Google Scholar] [CrossRef] [Green Version]
  33. Postic, G.; Ghouzam, Y.; Gelly, J.C. An empirical energy function for structural assessment of protein transmembrane domains. Biochimie 2015, 115, 155–161. [Google Scholar] [CrossRef] [PubMed]
  34. Postic, G.; Ghouzam, Y.; Guiraud, V.; Gelly, J.C. Membrane positioning for high- and low-resolution protein structures through a binary classification approach. Protein Eng. Des. Sel. PEDS 2016, 29, 87–91. [Google Scholar] [CrossRef] [PubMed] [Green Version]
  35. Studer, G.; Biasini, M.; Schwede, T. Assessing the local structural quality of transmembrane protein models using statistical potentials (qmeanbrane). Bioinformatics 2014, 30, i505–i511. [Google Scholar] [CrossRef] [Green Version]
  36. Barth, P.; Schonbrun, J.; Baker, D. Toward high-resolution prediction and design of transmembrane helical protein structures. Proc. Natl. Acad. Sci. USA 2007, 104, 15682–15687. [Google Scholar] [CrossRef] [PubMed] [Green Version]
  37. Alford, R.F.; Koehler Leman, J.; Weitzner, B.D.; Duran, A.M.; Tilley, D.C.; Elazar, A.; Gray, J.J. An integrated framework advancing membrane protein modeling and design. PLoS Comput. Biol. 2015, 11, e1004398. [Google Scholar] [CrossRef] [Green Version]
  38. Duran, A.M.; Meiler, J. Computational design of membrane proteins using rosettamembrane. Protein Sci. 2018, 27, 341–355. [Google Scholar] [CrossRef] [Green Version]
  39. Yarov-Yarovoy, V.; Schonbrun, J.; Baker, D. Multipass membrane protein structure prediction using rosetta. Proteins 2006, 62, 1010–1025. [Google Scholar] [CrossRef] [Green Version]
  40. Jumper, J.; Evans, R.; Pritzel, A.; Green, T.; Figurnov, M.; Ronneberger, O.; Tunyasuvunakool, K.; Bates, R.; Žídek, A.; Potapenko, A.; et al. Highly accurate protein structure prediction with alphafold. Nature 2021, 596, 583–589. [Google Scholar] [CrossRef]
  41. Hegedűs, T.; Geisler, M.; Lukács, G.L.; Farkas, B. Ins and outs of alphafold2 transmembrane protein structure predictions. Cell. Mol. Life Sci. CMLS 2022, 79, 73. [Google Scholar] [CrossRef]
  42. Tunyasuvunakool, K.A.-O.; Adler, J.A.-O.; Wu, Z.; Green, T.A.-O.; Zielinski, M.; Žídek, A.; Bridgland, A.; Cowie, A.; Meyer, C.; Laydon, A.; et al. Highly accurate protein structure prediction for the human proteome. Nature 2021, 596, 590–596. [Google Scholar] [CrossRef] [PubMed]
  43. De Brevern, A.G. An agnostic analysis of the human alphafold2 proteome using local protein conformations. Biochimie 2023, 207, 11–19. [Google Scholar] [CrossRef] [PubMed]
  44. Akdel, M.; Pires, D.E.V.; Pardo, E.P.; Jänes, J.; Zalevsky, A.O.; Mészáros, B.; Bryant, P.; Good, L.L.; Laskowski, R.A.; Pozzati, G.; et al. A structural biology community assessment of alphafold2 applications. Nat. Struct. Mol. Biol. 2022, 29, 1056–1067. [Google Scholar] [CrossRef] [PubMed]
  45. Esque, J.; Urbain, A.; Etchebest, C.; de Brevern, A.G. Sequence-structure relationship study in all-alpha transmembrane proteins using an unsupervised learning approach. Amino Acids 2015, 47, 2303–2322. [Google Scholar] [CrossRef]
  46. De Brevern, A.G.; Hazout, S. Hybrid protein model (hpm): A method to compact protein 3d-structure information and physicochemical properties. IEEE-Comp. Soc. (SPIRE 2000) 2000, S1, 49–54. [Google Scholar]
  47. De Brevern, A.G.; Hazout, S. ‘Hybrid protein model’ for optimally defining 3d protein structure fragments. Bioinformatics 2003, 19, 345–353. [Google Scholar] [CrossRef] [Green Version]
  48. Benros, C.; de Brevern, A.G.; Etchebest, C.; Hazout, S. Assessing a novel approach for predicting local 3d protein structures from sequence. Proteins: Struct. Funct. Bioinform. 2005, 62, 865–880. [Google Scholar] [CrossRef] [Green Version]
  49. Benros, C.; de Brevern, A.G.; Hazout, S. Analyzing the sequence–structure relationship of a library of local structural prototypes. J. Theor. Biol. 2009, 256, 215–226. [Google Scholar] [CrossRef] [Green Version]
  50. Bornot, A.; Etchebest, C.; de Brevern, A.G. A new prediction strategy for long local protein structures using an original description. Proteins 2009, 76, 570–587. [Google Scholar] [CrossRef] [Green Version]
  51. Bornot, A.; Etchebest, C.; de Brevern, A.G. Predicting protein flexibility through the prediction of local structures. Proteins 2011, 79, 839–852. [Google Scholar] [CrossRef] [Green Version]
  52. Narwani, T.J.; Etchebest, C.; Craveur, P.; Léonard, S.; Rebehmed, J.; Srinivasan, N.; Bornot, A.; Gelly, J.C.; de Brevern, A.G. In silico prediction of protein flexibility with local structure approach. Biochimie 2019, 165, 150–155. [Google Scholar] [CrossRef] [Green Version]
  53. De Brevern, A.G.; Bornot, A.; Craveur, P.; Etchebest, C.; Gelly, J.C. Predyflexy: Flexibility and local structure prediction from sequence. Nucleic Acids Res. 2012, 40, W317–W322. [Google Scholar] [CrossRef] [Green Version]
  54. De Brevern, A.G.; Etchebest, C.; Hazout, S. Bayesian probabilistic approach for predicting backbone structures in terms of protein blocks. Proteins 2000, 41, 271–287. [Google Scholar] [CrossRef]
  55. Joseph, A.P.; Agarwal, G.; Mahajan, S.; Gelly, J.C.; Swapna, L.S.; Offmann, B.; Cadet, F.; Bornot, A.; Tyagi, M.; Valadie, H.; et al. A short survey on protein blocks. Biophys. Rev. 2011, 2, 137–147. [Google Scholar] [CrossRef] [PubMed]
  56. Zemla, A.; Venclovas, C.; Fidelis, K.; Rost, B. A modified definition of sov, a segment-based measure for protein secondary structure prediction assessment. Proteins 1999, 34, 220–223. [Google Scholar] [CrossRef]
  57. Stamm, M.; Forrest, L.R. Structure alignment of membrane proteins: Accuracy of available tools and a consensus strategy. Proteins 2015, 83, 1720–1732. [Google Scholar] [CrossRef] [Green Version]
  58. Lomize, M.A.; Lomize, A.L.; Pogozheva, I.D.; Mosberg, H.I. Opm: Orientations of proteins in membranes database. Bioinformatics 2006, 22, 623–625. [Google Scholar] [CrossRef] [Green Version]
  59. Lomize, M.A.; Pogozheva, I.D.; Joo, H.; Mosberg, H.I.; Lomize, A.L. Opm database and ppm web server: Resources for positioning of proteins in membranes. Nucleic Acids Res. 2012, 40, D370–D376. [Google Scholar] [CrossRef] [PubMed]
  60. Sarti, E.; Aleksandrova, A.A.; Ganta, S.K.; Yavatkar, A.S.; Forrest, L.R. Encompass: An online database for analyzing structure and symmetry in membrane proteins. Nucleic Acids Res. 2019, 8, D315–D325. [Google Scholar] [CrossRef] [Green Version]
  61. BioPerl. 2020. Available online: https://github.com/bioperl/bioperl-live (accessed on 1 March 2023).
  62. Kohonen, T. Self-organized formation of topologically correct feature maps. Biol. Cybern 1982, 43, 59–69. [Google Scholar] [CrossRef]
  63. Kohonen, T. Self-Organizing Maps, 3rd ed.; Springer: Berlin/Heidelberg, Germany, 2001; p. 501. [Google Scholar]
  64. Delano, W.L. The Pymol Molecular Graphics System. 2002. Available online: http://www.pymol.org (accessed on 1 March 2023).
  65. Joseph, A.P.; Srinivasan, N.; de Brevern, A.G. Improvement of protein structure comparison using a structural alphabet. Biochimie 2011, 93, 1434–1445. [Google Scholar] [CrossRef] [PubMed] [Green Version]
  66. Martin, A.; Porter, C. ProFit Software. Available online: http://www.bioinf.org.uk/software/profit/ (accessed on 1 March 2023).
  67. Zhang, Y.; Skolnick, J. Tm-align: A protein structure alignment algorithm based on the tm-score. Nucleic Acids Res. 2005, 33, 2302–2309. [Google Scholar] [CrossRef] [PubMed]
  68. R Core Team. R: A Language and Environment for Statistical Computing; R Foundation for Statistical Computing: Vienna, Austria, 2020. [Google Scholar]
  69. Kim, D.E.; Chivian, D.; Baker, D. Protein structure prediction and analysis using the robetta server. Nucleic Acids Res. 2004, 32, W526–W531. [Google Scholar] [CrossRef] [PubMed] [Green Version]
  70. Baek, M.; DiMaio, F.; Anishchenko, I.; Dauparas, J.; Ovchinnikov, S.; Lee, G.R.; Wang, J.; Cong, Q.; Kinch, L.N.; Schaeffer, R.D.; et al. Accurate prediction of protein structures and interactions using a three-track neural network. Science 2021, 373, 871–876. [Google Scholar] [CrossRef]
  71. Kelley, L.A.; Sternberg, M.J. Protein structure prediction on the web: A case study using the phyre server. Nat. Protoc. 2009, 4, 363–371. [Google Scholar] [CrossRef] [Green Version]
  72. Lin, Z.; Akin, H.; Rao, R.; Hie, B.; Zhu, Z.; Lu, W.; Smetanin, N.; Verkuil, R.; Kabeli, O.; Shmueli, Y.; et al. Evolutionary-scale prediction of atomic level protein structure with a language model. bioRxiv 2022. [Google Scholar] [CrossRef]
  73. Koehler Leman, J.; Ulmschneider, M.B.; Gray, J.J. Computational modeling of membrane proteins. Proteins 2015, 83, 1–24. [Google Scholar] [CrossRef] [Green Version]
  74. Rost, B.; Casadio, R.; Fariselli, P.; Sander, C. Transmembrane helices predicted at 95% accuracy. Protein Sci. 1995, 4, 521–533. [Google Scholar] [CrossRef] [Green Version]
  75. Bernhofer, M.; Dallago, C.; Karl, T.; Satagopam, V.; Heinzinger, M.; Littmann, M.; Olenyi, T.; Qiu, J.; Schütze, K.; Yachdav, G.; et al. Predictprotein-predicting protein structure and function for 29 years. Nucleic Acids Res. 2021, 49, W535–W540. [Google Scholar] [CrossRef]
  76. Buchan, D.W.A.; Jones, D.T. The psipred protein analysis workbench: 20 years on. Nucleic Acids Res. 2019, 47, W402–W407. [Google Scholar] [CrossRef] [Green Version]
  77. McGuffin, L.J.; Bryson, K.; Jones, D.T. The psipred protein structure prediction server. Bioinformatics 2000, 16, 404–405. [Google Scholar] [CrossRef] [Green Version]
  78. Jones, D.T. Protein secondary structure prediction based on position-specific scoring matrices. J. Mol. Biol. 1999, 292, 195–202. [Google Scholar] [CrossRef] [Green Version]
  79. Cid, H.; Bunster, M.; Arriagada, E.; Campos, M. Prediction of secondary structure of proteins by means of hydrophobicity profiles. FEBS Lett. 1982, 150, 247–254. [Google Scholar] [CrossRef] [Green Version]
  80. Hessa, T.; Kim, H.; Bihlmaier, K.; Lundin, C.; Boekel, J.; Andersson, H.; Nilsson, I.; White, S.H.; von Heijne, G. Recognition of transmembrane helices by the endoplasmic reticulum translocon. Nature 2005, 433, 377–381. [Google Scholar] [CrossRef]
  81. Jones, D.T.; Taylor, W.R.; Thornton, J.M. A model recognition approach to the prediction of all-helical membrane protein structure and topology. Biochemistry 1994, 33, 3038–3049. [Google Scholar] [CrossRef]
  82. Jones, D.T. Improving the accuracy of transmembrane protein topology prediction using evolutionary information. Bioinformatics 2007, 23, 538–544. [Google Scholar] [CrossRef] [Green Version]
  83. Fariselli, P.; Casadio, R. Htp: A neural network-based method for predicting the topology of helical transmembrane domains in proteins. Comput. Appl. Biosci. CABIOS 1996, 12, 41–48. [Google Scholar] [CrossRef] [Green Version]
  84. Hirokawa, T.; Boon-Chieng, S.; Mitaku, S. Sosui: Classification and secondary structure prediction system for membrane proteins. Bioinformatics 1998, 14, 378–379. [Google Scholar] [CrossRef] [Green Version]
  85. Tusnády, G.E.; Simon, I. Principles governing amino acid composition of integral membrane proteins: Application to topology prediction. J. Mol. Biol. 1998, 283, 489–506. [Google Scholar] [CrossRef] [Green Version]
  86. Dosztányi, Z.; Magyar, C.; Tusnády, G.E.; Cserzo, M.; Fiser, A.; Simon, I. Servers for sequence-structure relationship analysis and prediction. Nucleic Acids Res. 2003, 31, 3359–3363. [Google Scholar] [CrossRef] [Green Version]
  87. Sonnhammer, E.L.; von Heijne, G.; Krogh, A. A hidden markov model for predicting transmembrane helices in protein sequences. Proc. Int. Conf. Intell. Syst. Mol. Biol. 1998, 6, 175–182. [Google Scholar]
  88. Pasquier, C.; Promponas, V.J.; Palaios, G.A.; Hamodrakas, J.S.; Hamodrakas, S.J. A novel method for predicting transmembrane segments in proteins based on a statistical analysis of the swissprot database: The pred-tmr algorithm. Protein Eng. 1999, 12, 381–385. [Google Scholar] [CrossRef]
  89. Viklund, H.; Elofsson, A. Octopus: Improving topology prediction by two-track ann-based preference scores and an extended topological grammar. Bioinformatics 2008, 24, 1662–1668. [Google Scholar] [CrossRef] [Green Version]
  90. Bernsel, A.; Viklund, H.; Hennerdal, A.; Elofsson, A. Topcons: Consensus prediction of membrane protein topology. Nucleic Acids Res. 2009, 37, W465–W468. [Google Scholar] [CrossRef] [Green Version]
  91. Tsirigos, K.D.; Peters, C.; Shu, N.; Käll, L.; Elofsson, A. The topcons web server for consensus prediction of membrane protein topology and signal peptides. Nucleic Acids Res. 2015, 43, W401–W407. [Google Scholar] [CrossRef]
  92. Cao, B.; Porollo, A.; Adamczak, R.; Jarrell, M.; Meller, J. Enhanced recognition of protein transmembrane domains with prediction-based structural profiles. Bioinformatics 2006, 22, 303–309. [Google Scholar] [CrossRef] [Green Version]
  93. Yuan, Z.; Mattick, J.S.; Teasdale, R.D. Svmtm: Support vector machines to predict transmembrane segments. J. Comput. Chem. 2004, 25, 632–636. [Google Scholar] [CrossRef] [Green Version]
  94. Zhou, H.; Zhang, C.; Liu, S.; Zhou, Y. Web-based toolkits for topology prediction of transmembrane helical proteins, fold recognition, structure and binding scoring, folding-kinetics analysis and comparative analysis of domain combinations. Nucleic Acids Res. 2005, 33, W193–W197. [Google Scholar] [CrossRef] [Green Version]
  95. Lee, S.; Lee, B.; Jang, I.; Kim, S.; Bhak, J. Localizome: A server for identifying transmembrane topologies and tm helices of eukaryotic proteins utilizing domain information. Nucleic Acids Res. 2006, 34, W99–W103. [Google Scholar] [CrossRef]
  96. Yin, X.; Yang, J.; Xiao, F.; Yang, Y.; Shen, H.B. Membrain: An easy-to-use online webserver for transmembrane protein structure prediction. Nano-Micro Lett. 2018, 10, 2. [Google Scholar] [CrossRef] [Green Version]
  97. Hönigschmid, P.; Breimann, S.; Weigl, M.; Frishman, D. Allestm: Predicting multiple structural features of transmembrane proteins. BMC Bioinform. 2020, 21, 242. [Google Scholar] [CrossRef] [PubMed]
  98. Koehler Leman, J.; Mueller, B.K.; Gray, J.J. Expanding the toolkit for membrane protein modeling in rosetta. Bioinformatics 2017, 33, 754–756. [Google Scholar] [CrossRef] [PubMed] [Green Version]
  99. Bernhofer, M.; Rost, B. Tmbed: Transmembrane proteins predicted through language model embeddings. BMC Bioinform. 2022, 23, 326. [Google Scholar] [CrossRef]
  100. Von Heijne, G. Membrane-protein topology. Nat. Rev. Mol. Cell Biol. 2006, 7, 909–918. [Google Scholar] [CrossRef] [PubMed]
  101. Li, B.; Mendenhall, J.; Capra, J.A.; Meiler, J. A multitask deep-learning method for predicting membrane associations and secondary structures of proteins. J. Proteome Res. 2021, 20, 4089–4100. [Google Scholar] [CrossRef]
  102. Qu, J.; Yin, S.S.; Wang, H. Prediction of metal ion binding sites of transmembrane proteins. Comput. Math. Methods Med. 2021, 2021, 2327832. [Google Scholar] [CrossRef] [PubMed]
  103. Waterhouse, A.; Bertoni, M.; Bienert, S.; Studer, G.; Tauriello, G.; Gumienny, R.; Heer, F.T.; de Beer, T.A.P.; Rempfer, C.; Bordoli, L.; et al. Swiss-model: Homology modelling of protein structures and complexes. Nucleic Acids Res. 2018, 46, W296–W303. [Google Scholar] [CrossRef] [Green Version]
  104. Ebejer, J.-P.; Hill, J.R.; Kelm, S.; Shi, J.; Deane, C.M. Memoir: Template-based structure prediction for membrane proteins. Nucleic Acids Res. 2013, 41, W379–W383. [Google Scholar] [CrossRef] [Green Version]
  105. Kelm, S.; Shi, J.; Deane, C.M. Medeller: Homology-based coordinate generation for membrane proteins. Bioinformatics 2010, 26, 2833–2840. [Google Scholar] [CrossRef] [Green Version]
  106. Kozma, D.; Tusnády, G.E. Tmfoldweb: A web server for predicting transmembrane protein fold class. Biol. Direct. 2017, 10, 54. [Google Scholar] [CrossRef] [Green Version]
  107. Kozma, D.; Tusnády, G.E. Tmfoldrec: A statistical potential-based transmembrane protein fold recognition tool. BMC Bioinform. 2015, 16, 201. [Google Scholar] [CrossRef] [Green Version]
  108. .Yarov-Yarovoy, V.; Baker, D.; Catterall, W.A. Voltage sensor conformations in the open and closed states in ROSETTA structural models of K(+) channels. Proc. Natl. Acad. Sci. USA 2006, 103, 7292–7297. [Google Scholar] [CrossRef] [Green Version]
  109. Benkert, P.; Künzli, M.; Schwede, T. Qmean server for protein model quality estimation. Nucleic Acids Res. 2009, 37, W510–W514. [Google Scholar] [CrossRef] [Green Version]
  110. Snider, C.; Jayasinghe, S.; Fau-Hristova, K.; Hristova, K.; Fau-White, S.H.; White, S.H. Mpex: A tool for exploring membrane proteins. Protein Sci. 2009, 18, 2624–2628. [Google Scholar] [CrossRef] [PubMed] [Green Version]
  111. Jayasinghe, S.; Hristova, K.; Fau-White, S.H.; White, S.H. Mptopo: A database of membrane protein topology. Protein Sci. 2001, 10, 455–458. [Google Scholar] [CrossRef] [PubMed] [Green Version]
  112. Mokrab, Y.; Stevens, T.J.; Mizuguchi, K. A structural dissection of amino acid substitutions in helical transmembrane proteins. Proteins 2010, 78, 2895–2907. [Google Scholar] [CrossRef] [PubMed]
  113. Olivella, M.; Gonzalez, A.; Pardo, L.; Deupi, X. Relation between sequence and structure in membrane proteins. Bioinformatics 2013, 29, 1589–1592. [Google Scholar] [CrossRef] [Green Version]
  114. Kabsch, W. A discussion of the solution for the best rotation to relate two sets of vectors. Acta Crystallogr. Sect. A 1978, 34, 827–828. [Google Scholar] [CrossRef] [Green Version]
  115. Del Alamo, D.; Govaerts, C.; McHaourab, H.S. Alphafold2 predicts the inward-facing conformation of the multidrug transporter lmrp. Proteins 2021, 89, 1226–1228. [Google Scholar] [CrossRef]
  116. Xiao, Q.; Xu, M.; Wang, W.; Wu, T.; Zhang, W.; Qin, W.; Sun, B. Utilization of alphafold2 to predict mfs protein conformations after selective mutation. Int. J. Mol. Sci. 2022, 23, 7235. [Google Scholar] [CrossRef]
Figure 1. Distribution of sequence alignments. This histogram provides the distribution of sequence alignments percentage identity (%) between the true sequence and the simulated ones. A simulated sequence is classified as a good sequence if the sequence shares 75% or more sequence identity with the reference (in blue), as medium for a sequence identity above 30% and below 75% (grey), and as bad in other cases (<30%, in tan).
Biomedinformatics 03 00021 g001
Figure 2. Example of putative metal-chelate type ABC transporter (PDB ID 2NQ2). (a) Three-dimensional visualization, (b) sequence identity of the alignments (%) vs. HPM scores (103), (c) GDT_TS vs. sequence identity of the alignments (%), and (d) GDT vs. HPM scores (103). (bd) good alignment (green), intermediate alignment (blue) and bad alignment (red).
Biomedinformatics 03 00021 g002
Figure 3. Comparison of models identified using HPM or DOPE. Cartoon representation of the models selected by HPM ((a), in cyan) or DOPE ((b), in pink) for a degenerated sequence of 38.8% sequence identity with the human M2 muscarinic acetylcholine receptor (PDB ID 3UON). The HPM-selected model is more compact than the DOPE-selected model.
Biomedinformatics 03 00021 g003
Figure 4. HPMScore homepage. Two options are provided to upload the structural models: (A) all files being in an unique archive or (B) added one by one. Links to the different pages are shown on the top of the page (C) this page, (D) a description of the methodology, (E) a dedicated example and (F) the contact page.
Biomedinformatics 03 00021 g004
Figure 5. HPMScore results. The page results have been split in two columns. (A) The list of the different models ranging from best (smallest HPM score) to worst is provided; (B) A histogram of these HPM scores is provided; (C) A local plot of HPM score is shown for the best model (it can be found in the archive files for the other models); (D) Two orientations of the best structural models colored with the local HPM score are provided with an extra one within the protein surface; (E) An interactive visualization; and (F) Links to the different files and archive. The example shown here is provided on the website and corresponds to a Halorhodopsin far away from other related sequences and structures.
Biomedinformatics 03 00021 g005
Figure 6. Comparison of different structural models coming from different methodologies for a Halorhodopsin. (a) The list of the different methodologies is provided, (b) the corresponding HPM score histogram with (c) the visualization of different structural models from Modeller, RoseTTAfold, Phyre, ESMFold, and AlphaFold2. Please notice that PDB files of RoseTTAfold have been saved in proper PDB format with PyMOL.
Biomedinformatics 03 00021 g006
Figure 7. Evaluation summary. Per bins of 5% of sequence identity has shown the best results with HPMScore (red), DOPE (black) or both (blue). On the upper part, the number of evaluated models is given.
Biomedinformatics 03 00021 g007
Table 1. Relative performance of HPM vs. DOPE. The percentages of best models, i.e., best GDT_TS found by HPM, DOPE or both within TOP 1, TOP 5 and TOP 10 results, are provided. (A) For the complete structure. (B) Only on transmembrane segments.
(A)
Scoring Method/Models Considered for RankingTOP 1TOP 5TOP 10
DOPE40.1%44.0%45.5%
HPM46.9%48.4%48.4%
HPM and DOPE13.0%7.6%6.1%
(B)
Scoring Method/Models Considered for RankingTOP 1TOP 5TOP 10
DOPE47.4%46.4%46.3%
HPM45.6%46.8%47.0%
HPM and DOPE7.0%6.8%6.7%
Table 2. Relative performance of HPM vs. DOPE. The percentages of best models, i.e., the best GDT_TS, found by HPM, DOPE or both when the sequence percentage id of the reference model is taken into account, are provided.
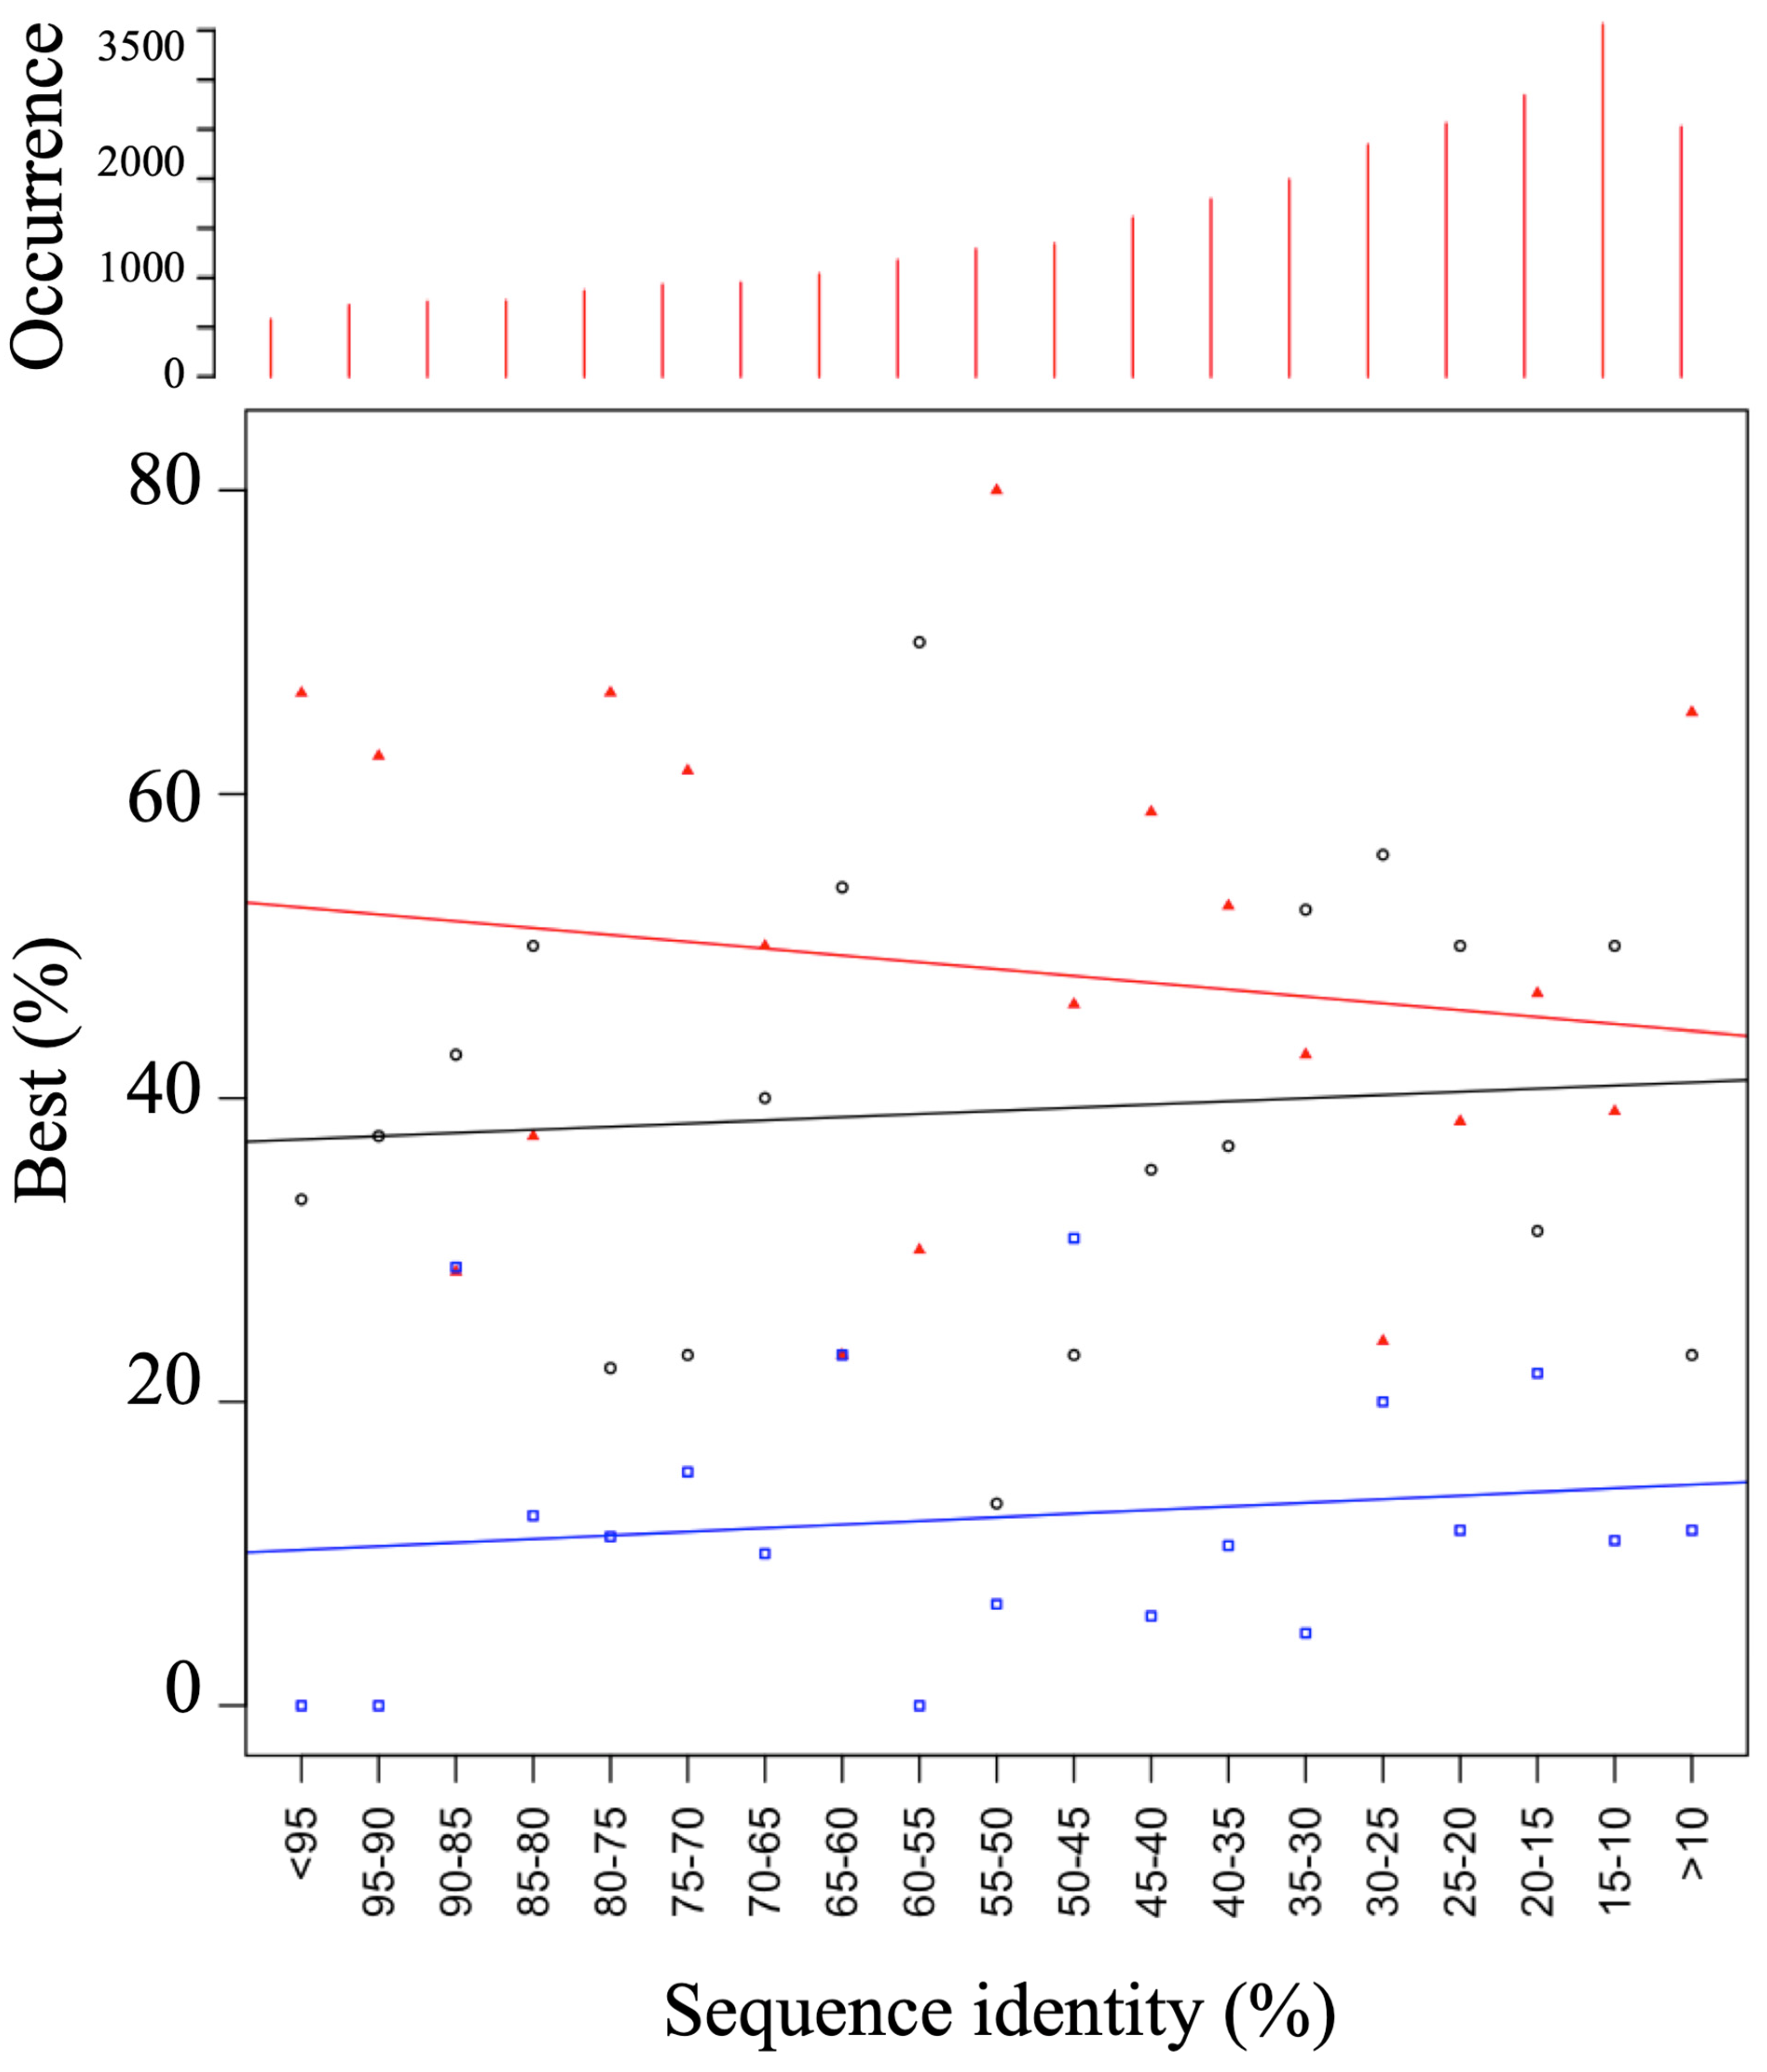
Scoring Method/%
Sequence Identity Range
Poor Alignments
(0–35%)
Average Alignments
(35–75%)
Good Alignments
(75–100%)
Sequence count15,78610,1023682
DOPE43.8%35.5%36.8%
HPM42.6%51.8%52.6%
HPM and DOPE13.6%12.7%10.6%
Disclaimer/Publisher’s Note: The statements, opinions and data contained in all publications are solely those of the individual author(s) and contributor(s) and not of MDPI and/or the editor(s). MDPI and/or the editor(s) disclaim responsibility for any injury to people or property resulting from any ideas, methods, instructions or products referred to in the content.

