

Chest X-ray Abnormality Detection by Using Artificial Intelligence: A Single-Site Retrospective Study of Deep Learning Model Performance
 , , ,
, , ,
Abstract
:1. Introduction
2. Background
2.1. Literature Review Methodology
2.2. Related Works
3. Software
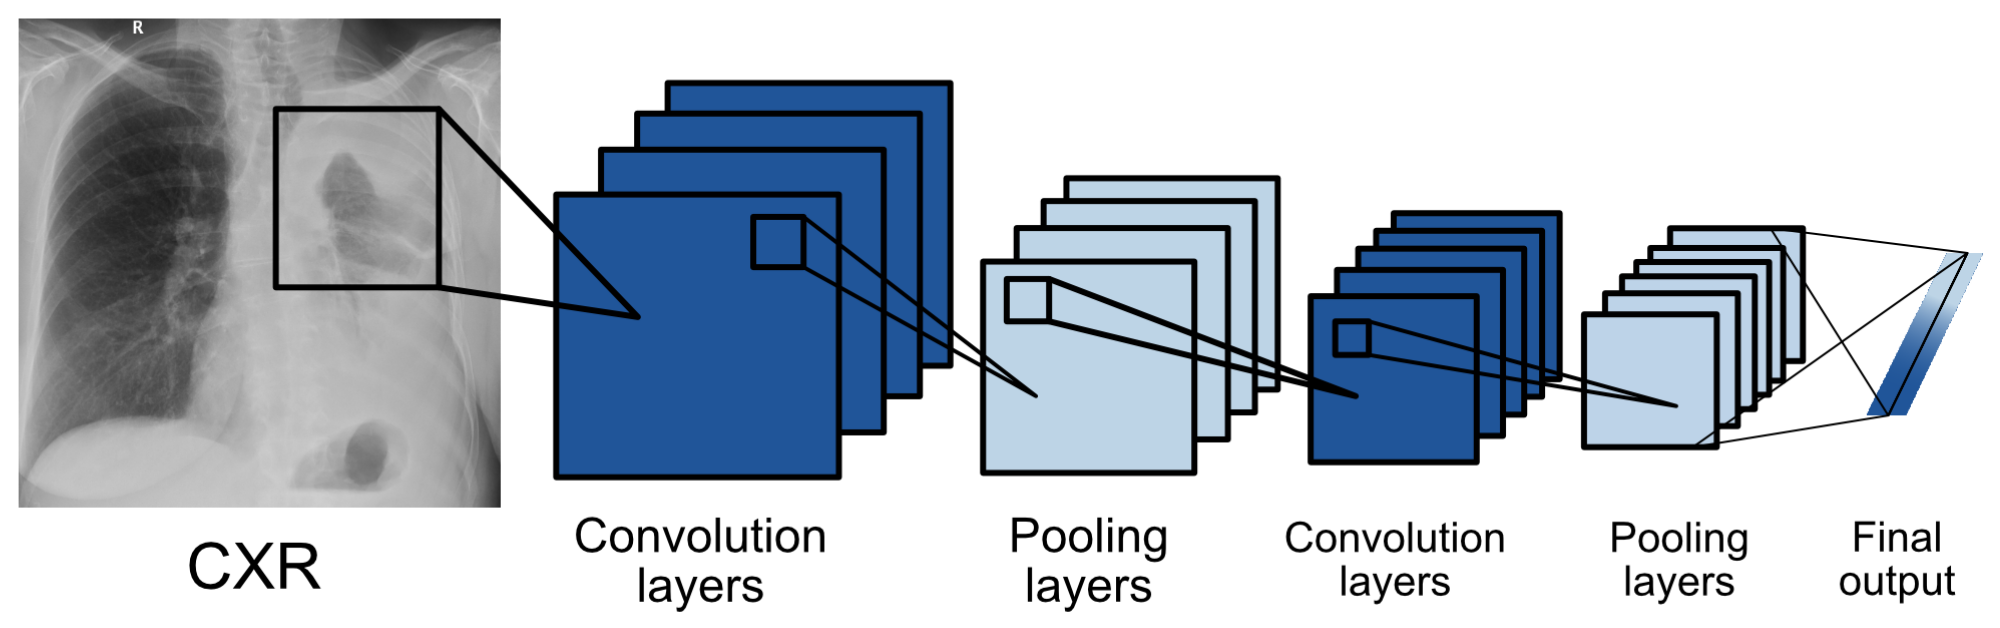
3.1. Model Architecture
3.2. Datasets
3.3. Internal Test
4. Methodology
4.1. Data Source
4.2. Ground Truth
4.3. Objectives
4.4. Statistical Analysis
5. Results
6. Discussion
7. Limitations
8. Conclusions
Author Contributions
Funding
Institutional Review Board Statement
Informed Consent Statement
Data Availability Statement
Conflicts of Interest
Abbreviations
| AI | Artificial Intelligence |
| CADe/CADx | Computer-Aided Detection/Diagnosis |
| CI | Confidence Interval |
| CNN | Convolutional Neural Network |
| CXR | Chest X-ray |
| DL | Deep Learning |
| DLAD | Deep Learning–based Automatic Detection Algorithm |
| MD | Medical Device |
| Se | Sensitivity |
| Sp | Specificity |
| FP | False Positive |
| FN | False Negative |
| LR | Likelihood Ratios |
| PLR | Positive Likelihood Ratio |
| NLR | Negative Likelihood Ratio |
| PV | Predictive Values |
| PPV | Positive Predictive Value |
| NPV | Negative Predictive Value |
| BA | Balanced Accuracy |
Appendix A


| Study | Target Population | Number of Patients, Scans | Used Software | Ground Truth | Statistical Results |
|---|---|---|---|---|---|
| [17] | suspected TB | 317 patients | qXR (Qure.ai) | microbiological confirmation, 1 radiologist | qXR Se 0.71, Sp 0.80, radiologist Se 0.56 and Sp 0.80, AUC for confirmed TB 0.81, detection of pleural effusion and “cavity” type. For TB in qXR AUC 0.94 and 0.84, others 0.75–0.94, radiologist Se 0.56, Sp 0.80, low AUC 0.75 for hilar lymphadenopathy and 0.76 consolidation, largest for cardiomegaly 0.94 |
| [15] | suspected TB | 1032 patients | 12 different solutions including qXR and Lunit | 2 doctors focused on TB | Expert Se 0.955, Sp 0.422. With setting this Se, qXR and Lunit had Sp 0.487 and 0.387, DeepTek SP 0.463, Delft imaging 0.453, JF Healthcare 0.41, Oxipit 0.408, InferVision 0.265, Artelus 0.231, Dr CADx 0.121, SemanticMD 0.101, EPCON 0.093, COTO 0.063. AUROC for qXR and Delft Imaging 0.82, PR AUC 0.41 and 0.39, DeepTek Genki AUROC 0.78, Lunit 0.82, JF Healthcare similar. |
| [48] | drug-resistant TB | 311 patients, 346 images | qXR (Qure.ai) | with initial identification by a radiologist, with possible comparison in CT | Correlation of radiologist and qXR in hilar lymphadenopathy, pleural effusion cavity, and atelectasis, but not in nodules. Se/Sp hilar lymphadenopathy 0.621/0.741, cavity 0.75/0.821, atelectasis 0.194/0.727, pleural effusion 0.6/0.949, nodule 0.597/0.742. |
| [18] | undergoing medical screening during military service (asymptomatic) | 19,686 patients, 20,135 images | Lunit INSIGHT CXR | microbiological confirmation, identification by a radiologist | AUC Lunit for pulmonary TB 0.999, for other abnormalities 0.967, Se for high Se for nodule 1.0, for high Sp 1.0, radiologist 0.8, and other abnormalities Se 0.921, 0.679, 0.821, Sp nodules 0.959, 0.997 and 0.997, others 0.960, 0.997, 0.998. |
| [20] | suspected lung cancer | 1512 images | red dot (behold.ai) | biopsy | Of the urgent ones given by the red dot radiologist, he evaluated 15% as non-urgent and 85% as urgent, the non-urgent red dot ones were determined as non-urgent, he just evaluated more of them as urgent |
| [23] | suspected lung cancer | 400 images | red dot (behold.ai) | 3 radiologists | Average radiologist Se 0.78, Sp 0.96, behold.ai Se 0.80, Sp 0.93, overall improvement of 3.67–13.33% confidence percentage, radiologist agreement improved to 94%, and missed tumors reduced by 60%. |
| [21] | high risk (smokers) with lung screening | 5485 patients | Lunit INSIGHT CXR | certified radiologist, GT if cancer for confirmed within one year | Lunit AUC 0.93 for chest radiographs, 0.99 for digital and 0.86 for CT, Se 0.862 and Sp 0.85, cancer detection Se 0.76, radiological 0.80. |
| [22] | various databases | 378 patients, 434 images | Lunit INSIGHT CXR | 2 radiology residents and 2 chest radiologists | Se 0.883, Sp 0.8618, Lunit AUC abnormalities 0.872, nodules Se 0.891. |
| [49] | various databases | 3790 patients, 3887 images | red dot (behold.ai) | 2 radiologists, 3rd arbitrator | Normal with an accuracy of 0.977, 84.6% of them were identified by radiologists as borderline. 13.5% missed abnormality by radiologists. |
| [45] | multiple radiological abnormalities (14), from the database of Wang et al. 2017 | 724 patients, 874 images | qXR (Qure.ai) | 4 radiologists + 2 as GT | AUC qXR 0.837–0.929, radiologist 0.693 and 0.923 |
| [44] | multiple radiographic abnormalities (3) | 244 images | Lunit INSIGHT CXR | clinicians (3 groups-GP, radio, non-radio) | AUC 0.993, Se 97.26, Sp 92.86, reliability 0.9549, AUC for nodules, consolidation, pneumothorax 0.988, 1 and 0.999. AUC of radiologists, non-radiologists and clinicians without Lunit 0.931, 0.915 and 0.769. With the help of Lunit AUC increased to 0.959, 0.944 and 0.894. |
| [46] | multiple radiographic abnormalities (9) | 100,000 images from 89,354 patients + 2000 images | qXR (Qure.ai) | comparison with the agreement of 3 radiologists on the 2000 and reports of different on 100,000 scans | AUC for smaller dataset 0.92, different for individual abnormalities, similar for large, individual abnormalities AUC 0.98–0.89 |
| [50] | various databases + TB | 1444 patients | ResNet-based DLAD | training set 2 radiologists, GT PCR, culture | in the second session, with the use of DLAD, all values increased, but significantly for non-radiologists: AUROC doctor only non-radiologists 0.746, with p-value 0.023, AUROC 0.664 with p-value 0.0088, Se 0.723, Sp 0.67, TDR 0.582. Certified radiologists AUROC 0.946, p = 0.0082, AUROC 0.9, p = 0.0003, Se 0.906, Sp 0.948, TDR 0.797, chest radiologists AUROC 0.971 p = 0.0218, AUROC 0.925, p = 0.0001, Se 0.952, Sp 0.930, TD 0.870. With DLAD non-radiologists 0.850, AUROC 0.781 with p-value 0.0236, |Se 0.848, SP 0.800, TDR 0.724, certified radiologists AUROC 0.961, p = 0.0606, AUROC 0.924, p = 0.0353, Se 0.930, Sp 0.954, TDR 0.849. Chest radiologists AUROC 0.977 p = 0.1623, AUROC 0.942, p = 0.0036, Se 0.964, Sp 0.936, TD 0.897. |
| [19] | various hospital datasets for nodule detection | 600 images for internal and 693 for external validation | ResNet-based DLAD | 5 radiologists | Internal validation: AUROC 0.96, External validation: AUROCs 0.92, 0.99, 0.94, and 0.96, and JAFROC FOMs were 0.870, 0.924, 0.831, and 0.880 for Seoul National University Hospital, Boramae Hospital, National Cancer Center, and University of California San Francisco Medical Center. Nodule-detection false-positive rate of DLAD 0.02–0.34 in external datasets, for radiograph classification performance were Se 0.79, 0.911, 0.712 and 0.88, Sp 0.95, 0.98, 1.0 and 0.93, and for nodules Se 0.699, 0.82, 0.696 and 0.75. |
| [51] | population from Oulu Hospital, Finland, detection of multiple findings | 9579 images | ChestLink | 2 certified radiologists + original radiologists report | As a result, 9 false negative cases evaluated by ChestLink. Oxipit Se 0.998%, Sp 0.364. |
| [43] | 5 pathologies | 370 images | Arterys Chest AI | 4 radiologists | Overall Se/Sp 0.988/0.4384. Se/Sp for fractures 0.667/0.9499, nodules 0.64/0.8417, opacities 0.9615/0.4804, pleural effusion 0.9213/0.8716, pneumothorax 1.0/0.7576. |
| [52] | retrospective diagnosis of COVID | 279 images | Lunit INSIGHT CXR | CT or 3 radiologists. | Lunit AUROC/Se/Sp 0.921, 0.956, 0.887. Radiologist AUROC/Se/Sp0.941, 0.912, 0.969. |
| [47] | identification of normal/abnormal | 430 images | DLAD | experienced radiologist + reference of an existing report | Se 0.9719, Sp 0.6828, 46 FP, 8 FN (3 clinically insignificant, 5 clinically significant). |
| [14] | 72 findings | 1998 images | VGG16, ResNet-50 | triple consensus dataset | AI AUC 0.772 on test, 0.807 on train, Se 0.716, PPV 0.730, Sp 0.980. Radiologist Se 0.720, PPV 0.682, Sp 0.973. |
| [29] | multiple abnormalities | 15,887 images | DLAD | 2 radiologists with 3 years of experience, in case of disagreement another radiologist with 10 years of experience | DLAD normal radiograph Se 0.71, Sp 0.95, for critical radiograph Se 0.65, Sp 0.94. |
References
- Moncada, D.C.; Rueda, Z.V.; Macías, A.; Suárez, T.; Ortega, H.; Vélez, L.A. Reading and interpretation of chest X-ray in adults with community-acquired pneumonia. Braz. J. Infect. Dis. 2011, 15, 540–546. [Google Scholar] [CrossRef] [PubMed] [Green Version]
- Pezzotti, W. Chest X-ray interpretation: Not just black and white. Nursing2020 2014, 44, 40–47. [Google Scholar] [CrossRef] [PubMed]
- Jacobi, A.; Chung, M.; Bernheim, A.; Eber, C. Portable chest X-ray in coronavirus disease-19 (COVID-19): A pictorial review. Clin. Imaging 2020, 64, 35–42. [Google Scholar] [CrossRef] [PubMed]
- Baltruschat, I.; Steinmeister, L.; Nickisch, H.; Saalbach, A.; Grass, M.; Adam, G.; Knopp, T.; Ittrich, H. Smart chest X-ray worklist prioritization using artificial intelligence: A clinical workflow simulation. Eur. Radiol. 2021, 31, 3837–3845. [Google Scholar] [CrossRef] [PubMed]
- Mills, A.F.; Argon, N.T.; Ziya, S. Resource-based patient prioritization in mass-casualty incidents. Manuf. Serv. Oper. Manag. 2013, 15, 361–377. [Google Scholar] [CrossRef] [Green Version]
- Sung, I.; Lee, T. Optimal allocation of emergency medical resources in a mass casualty incident: Patient prioritization by column generation. Eur. J. Oper. Res. 2016, 252, 623–634. [Google Scholar] [CrossRef]
- Déry, J.; Ruiz, A.; Routhier, F.; Bélanger, V.; Côté, A.; Ait-Kadi, D.; Gagnon, M.P.; Deslauriers, S.; Lopes Pecora, A.T.; Redondo, E.; et al. A systematic review of patient prioritization tools in non-emergency healthcare services. Syst. Rev. 2020, 9, 1–14. [Google Scholar] [CrossRef]
- Schull, M.J.; Guttmann, A.; Leaver, C.A.; Vermeulen, M.; Hatcher, C.M.; Rowe, B.H.; Zwarenstein, M.; Anderson, G.M. Prioritizing performance measurement for emergency department care: Consensus on evidencebased quality of care indicators. Can. J. Emerg. Med. 2011, 13, 300–309. [Google Scholar] [CrossRef] [Green Version]
- Ashour, O.M.; Okudan Kremer, G.E. Dynamic patient grouping and prioritization: A new approach to emergency department flow improvement. Health Care Manag. Sci. 2016, 19, 192–205. [Google Scholar] [CrossRef]
- Ding, Y.; Park, E.; Nagarajan, M.; Grafstein, E. Patient prioritization in emergency department triage systems: An empirical study of the Canadian triage and acuity scale (CTAS). Manuf. Serv. Oper. Manag. 2019, 21, 723–741. [Google Scholar] [CrossRef] [Green Version]
- Ústav zdravotnických informací a statistiky České republiky (ÚZIS). Medical Equipment of Health Establishments of Czech Republic in Year 2020. 2021. Available online: https://www.uzis.cz/res/f/008364/ai-2021-02-t1-pristrojove-vybaveni-zz-2020.pdf (accessed on 22 November 2022).
- Oakden-Rayner, L. Exploring large-scale public medical image datasets. Acad. Radiol. 2020, 27, 106–112. [Google Scholar] [CrossRef] [Green Version]
- Hryniewska, W.; Bombiński, P.; Szatkowski, P.; Tomaszewska, P.; Przelaskowski, A.; Biecek, P. Checklist for responsible deep learning modeling of medical images based on COVID-19 detection studies. Pattern Recognit. 2021, 118, 108035. [Google Scholar] [CrossRef] [PubMed]
- Wu, J.T.; Wong, K.C.; Gur, Y.; Ansari, N.; Karargyris, A.; Sharma, A.; Morris, M.; Saboury, B.; Ahmad, H.; Boyko, O.; et al. Comparison of chest radiograph interpretations by artificial intelligence algorithm vs radiology residents. JAMA Netw. Open 2020, 3, e2022779. [Google Scholar] [CrossRef] [PubMed]
- Codlin, A.J.; Dao, T.P.; Vo, L.N.Q.; Forse, R.J.; Van Truong, V.; Dang, H.M.; Nguyen, L.H.; Nguyen, H.B.; Nguyen, N.V.; Sidney-Annerstedt, K.; et al. Independent evaluation of 12 artificial intelligence solutions for the detection of tuberculosis. Sci. Rep. 2021, 11, 23895. [Google Scholar] [CrossRef] [PubMed]
- van Leeuwen, K.G.; de Rooij, M.; Schalekamp, S.; van Ginneken, B.; Rutten, M.J. How does artificial intelligence in radiology improve efficiency and health outcomes? Pediatr. Radiol. 2021, 52, 2087–2093. [Google Scholar] [CrossRef] [PubMed]
- Nash, M.; Kadavigere, R.; Andrade, J.; Sukumar, C.A.; Chawla, K.; Shenoy, V.P.; Pande, T.; Huddart, S.; Pai, M.; Saravu, K. Deep learning, computer-aided radiography reading for tuberculosis: A diagnostic accuracy study from a tertiary hospital in India. Sci. Rep. 2020, 10, 210. [Google Scholar] [CrossRef] [Green Version]
- Lee, J.H.; Park, S.; Hwang, E.J.; Goo, J.M.; Lee, W.Y.; Lee, S.; Kim, H.; Andrews, J.R.; Park, C.M. Deep learning–based automated detection algorithm for active pulmonary tuberculosis on chest radiographs: Diagnostic performance in systematic screening of asymptomatic individuals. Eur. Radiol. 2021, 31, 1069–1080. [Google Scholar] [CrossRef]
- Nam, J.G.; Park, S.; Hwang, E.J.; Lee, J.H.; Jin, K.N.; Lim, K.Y.; Vu, T.H.; Sohn, J.H.; Hwang, S.; Goo, J.M.; et al. Development and validation of deep learning–based automatic detection algorithm for malignant pulmonary nodules on chest radiographs. Radiology 2019, 290, 218–228. [Google Scholar] [CrossRef] [Green Version]
- Hussein, M.; Brozik, J.; Hopewell, H.; Patel, H.; Rasalingham, S.; Dillard, L.; Morgan, T.N.; Tappouni, R.; Malik, Q.; Lucas, E.; et al. Artificial intelligence: A potential prioritisation tool for chest radiographs with suspected thoracic malignancy. Lung Cancer 2020, 139, S25. [Google Scholar] [CrossRef]
- Yoo, H.; Kim, K.H.; Singh, R.; Digumarthy, S.R.; Kalra, M.K. Validation of a deep learning algorithm for the detection of malignant pulmonary nodules in chest radiographs. JAMA Netw. Open 2020, 3, e2017135. [Google Scholar] [CrossRef]
- Koo, Y.H.; Shin, K.E.; Park, J.S.; Lee, J.W.; Byun, S.; Lee, H. Extravalidation and reproducibility results of a commercial deep learning-based automatic detection algorithm for pulmonary nodules on chest radiographs at tertiary hospital. J. Med Imaging Radiat. Oncol. 2021, 65, 15–22. [Google Scholar] [CrossRef]
- Tam, M.; Dyer, T.; Dissez, G.; Morgan, T.N.; Hughes, M.; Illes, J.; Rasalingham, R.; Rasalingham, S. Augmenting lung cancer diagnosis on chest radiographs: Positioning artificial intelligence to improve radiologist performance. Clin. Radiol. 2021, 76, 607–614. [Google Scholar] [CrossRef]
- Liu, X.; Faes, L.; Kale, A.U.; Wagner, S.K.; Fu, D.J.; Bruynseels, A.; Mahendiran, T.; Moraes, G.; Shamdas, M.; Kern, C.; et al. A comparison of deep learning performance against health-care professionals in detecting diseases from medical imaging: A systematic review and meta-analysis. Lancet Digit. Health 2019, 1, e271–e297. [Google Scholar] [CrossRef]
- Qin, Z.Z.; Sander, M.S.; Rai, B.; Titahong, C.N.; Sudrungrot, S.; Laah, S.N.; Adhikari, L.M.; Carter, E.J.; Puri, L.; Codlin, A.J.; et al. Using artificial intelligence to read chest radiographs for tuberculosis detection: A multi-site evaluation of the diagnostic accuracy of three deep learning systems. Sci. Rep. 2019, 9, 15000. [Google Scholar] [CrossRef] [Green Version]
- Castiglioni, I.; Ippolito, D.; Interlenghi, M.; Monti, C.B.; Salvatore, C.; Schiaffino, S.; Polidori, A.; Gandola, D.; Messa, C.; Sardanelli, F. Artificial intelligence applied on chest X-ray can aid in the diagnosis of COVID-19 infection: A first experience from Lombardy, Italy. Eur. Radiol. Exp. 2021, 5, 7. [Google Scholar] [CrossRef]
- Sun, J.; Peng, L.; Li, T.; Adila, D.; Zaiman, Z.; Melton, G.B.; Ingraham, N.; Murray, E.; Boley, D.; Switzer, S.; et al. A prospective observational study to investigate performance of a chest X-ray artificial intelligence diagnostic support tool across 12 US hospitals. arXiv 2021, arXiv:2106.02118v2. [Google Scholar]
- Lee, S.; Shin, H.J.; Kim, S.; Kim, E.K. Successful Implementation of an Artificial Intelligence-Based Computer-Aided Detection System for Chest Radiography in Daily Clinical Practice. Korean J. Radiol. 2022, 23, 847–852. [Google Scholar] [CrossRef]
- Annarumma, M.; Withey, S.J.; Bakewell, R.J.; Pesce, E.; Goh, V.; Montana, G. Automated triaging of adult chest radiographs with deep artificial neural networks. Radiology 2019, 291, 196. [Google Scholar] [CrossRef]
- Albawi, S.; Mohammed, T.A.; Al-Zawi, S. Understanding of a convolutional neural network. In Proceedings of the 2017 International Conference on Engineering and Technology (ICET), Antalya, Turkey, 21–23 August 2017; pp. 1–6. [Google Scholar] [CrossRef]
- Krizhevsky, A.; Sutskever, I.; Hinton, G.E. ImageNet Classification with Deep Convolutional Neural Networks. In Advances in Neural Information Processing Systems; Pereira, F., Burges, C.J.C., Bottou, L., Weinberger, K.Q., Eds.; Curran Associates, Inc.: Red Hook, NY, USA, 2012; Volume 25. [Google Scholar]
- Refaeilzadeh, P.; Tang, L.; Liu, H. Cross-validation. Encycl. Database Syst. 2009, 5, 532–538. [Google Scholar]
- Ramezan, C.A.; Warner, T.A.; Maxwell, A.E. Evaluation of sampling and cross-validation tuning strategies for regional-scale machine learning classification. Remote Sens. 2019, 11, 185. [Google Scholar] [CrossRef] [Green Version]
- Wortsman, M.; Ilharco, G.; Gadre, S.Y.; Roelofs, R.; Gontijo-Lopes, R.; Morcos, A.S.; Namkoong, H.; Farhadi, A.; Carmon, Y.; Kornblith, S.; et al. Model soups: Averaging weights of multiple fine-tuned models improves accuracy without increasing inference time. In Proceedings of the International Conference on Machine Learning, Baltimore, MA, USA, 17–23 July 2022; pp. 23965–23998. [Google Scholar]
- Suzuki, K.; Matsuzawa, T. Model Soups for Various Training and Validation Data. AI 2022, 3, 796–808. [Google Scholar] [CrossRef]
- Balabanova, Y.; Coker, R.; Fedorin, I.; Zakharova, S.; Plavinskij, S.; Krukov, N.; Atun, R.; Drobniewski, F. Variability in interpretation of chest radiographs among Russian clinicians and implications for screening programmes: Observational study. BMJ 2005, 331, 379–382. [Google Scholar] [CrossRef] [Green Version]
- Whaley, J.S.; Pressman, B.D.; Wilson, J.R.; Bravo, L.; Sehnert, W.J.; Foos, D.H. Investigation of the variability in the assessment of digital chest X-ray image quality. J. Digit. Imaging 2013, 26, 217–226. [Google Scholar] [CrossRef] [Green Version]
- Ravnik, D.; Jerman, T.; Pernuš, F.; Likar, B.; Špiclin, Ž. Dataset variability leverages white-matter lesion segmentation performance with convolutional neural network. In Proceedings of the Medical Imaging 2018: Image Processing, Houston, TX, USA, 10–15 February 2018; Volume 10574, pp. 388–396. [Google Scholar]
- Alvarez-Estevez, D.; Fernández-Varela, I. Addressing database variability in learning from medical data: An ensemble-based approach using convolutional neural networks and a case of study applied to automatic sleep scoring. Comput. Biol. Med. 2020, 119, 103697. [Google Scholar] [CrossRef] [Green Version]
- Abboud, S.; Weiss, F.; Siegel, E.; Jeudy, J. TB or Not TB: Interreader and intrareader variability in screening diagnosis on an iPad versus a traditional display. J. Am. Coll. Radiol. 2013, 10, 42–44. [Google Scholar] [CrossRef]
- Ekpo, E.; Egbe, N.; Akpan, B. Radiographers’ performance in chest X-ray interpretation: The Nigerian experience. Br. J. Radiol. 2015, 88, 20150023. [Google Scholar] [CrossRef] [Green Version]
- Roldán-Nofuentes, J.A. Compbdt: An R program to compare two binary diagnostic tests subject to a paired design. BMC Med. Res. Methodol. 2020, 20, 143. [Google Scholar] [CrossRef]
- Arterys. Retrospective Study X-ray Chest AI Whitepaper. 2020. Available online: https://www.arterys.com/retrospective-study-x-ray-chest-ai-wp (accessed on 10 January 2023).
- Choi, S.Y.; Park, S.; Kim, M.; Park, J.; Choi, Y.R.; Jin, K.N. Evaluation of a deep learning-based computer-aided detection algorithm on chest radiographs: Case–control study. Medicine 2021, 100, e25663. [Google Scholar] [CrossRef]
- Singh, R.; Kalra, M.K.; Nitiwarangkul, C.; Patti, J.A.; Homayounieh, F.; Padole, A.; Rao, P.; Putha, P.; Muse, V.V.; Sharma, A.; et al. Deep learning in chest radiography: Detection of findings and presence of change. PLoS ONE 2018, 13, e0204155. [Google Scholar] [CrossRef] [Green Version]
- Putha, P.; Tadepalli, M.; Reddy, B.; Raj, T.; Chiramal, J.A.; Govil, S.; Sinha, N.; KS, M.; Reddivari, S.; Jagirdar, A.; et al. Can artificial intelligence reliably report chest x-rays?: Radiologist validation of an algorithm trained on 2.3 million x-rays. arXiv 2018, arXiv:1807.07455. [Google Scholar]
- Caring-Research. Automated classification of chest X-rays as normal/abnormal using a high sensitivity deep learning algorithm. In Proceedings of the European Congress of Radiology 2019, Vienna, Austria, 27 February–3 March 2019. [Google Scholar]
- Engle, E.; Gabrielian, A.; Long, A.; Hurt, D.E.; Rosenthal, A. Performance of Qure. ai automatic classifiers against a large annotated database of patients with diverse forms of tuberculosis. PLoS ONE 2020, 15, e0224445. [Google Scholar] [CrossRef] [PubMed] [Green Version]
- Dyer, T.; Dillard, L.; Harrison, M.; Morgan, T.N.; Tappouni, R.; Malik, Q.; Rasalingham, S. Diagnosis of normal chest radiographs using an autonomous deep-learning algorithm. Clin. Radiol. 2021, 76, 473.e9–473.e15. [Google Scholar] [CrossRef]
- Hwang, E.J.; Park, S.; Jin, K.N.; Im Kim, J.; Choi, S.Y.; Lee, J.H.; Goo, J.M.; Aum, J.; Yim, J.J.; Cohen, J.G.; et al. Development and validation of a deep learning–based automated detection algorithm for major thoracic diseases on chest radiographs. JAMA Netw. Open 2019, 2, e191095. [Google Scholar] [CrossRef] [Green Version]
- Keski-Filppula, T.; Nikki, M.; Haapea, M.; Ramanauskas, N.; Tervonen, O. Using artificial intelligence to detect chest X-rays with no significant findings in a primary health care setting in Oulu, Finland. arXiv 2022, arXiv:2205.08123. [Google Scholar]
- Jang, S.B.; Lee, S.H.; Lee, D.E.; Park, S.Y.; Kim, J.K.; Cho, J.W.; Cho, J.; Kim, K.B.; Park, B.; Park, J.; et al. Deep-learning algorithms for the interpretation of chest radiographs to aid in the triage of COVID-19 patients: A multicenter retrospective study. PLoS ONE 2020, 15, e0242759. [Google Scholar] [CrossRef]


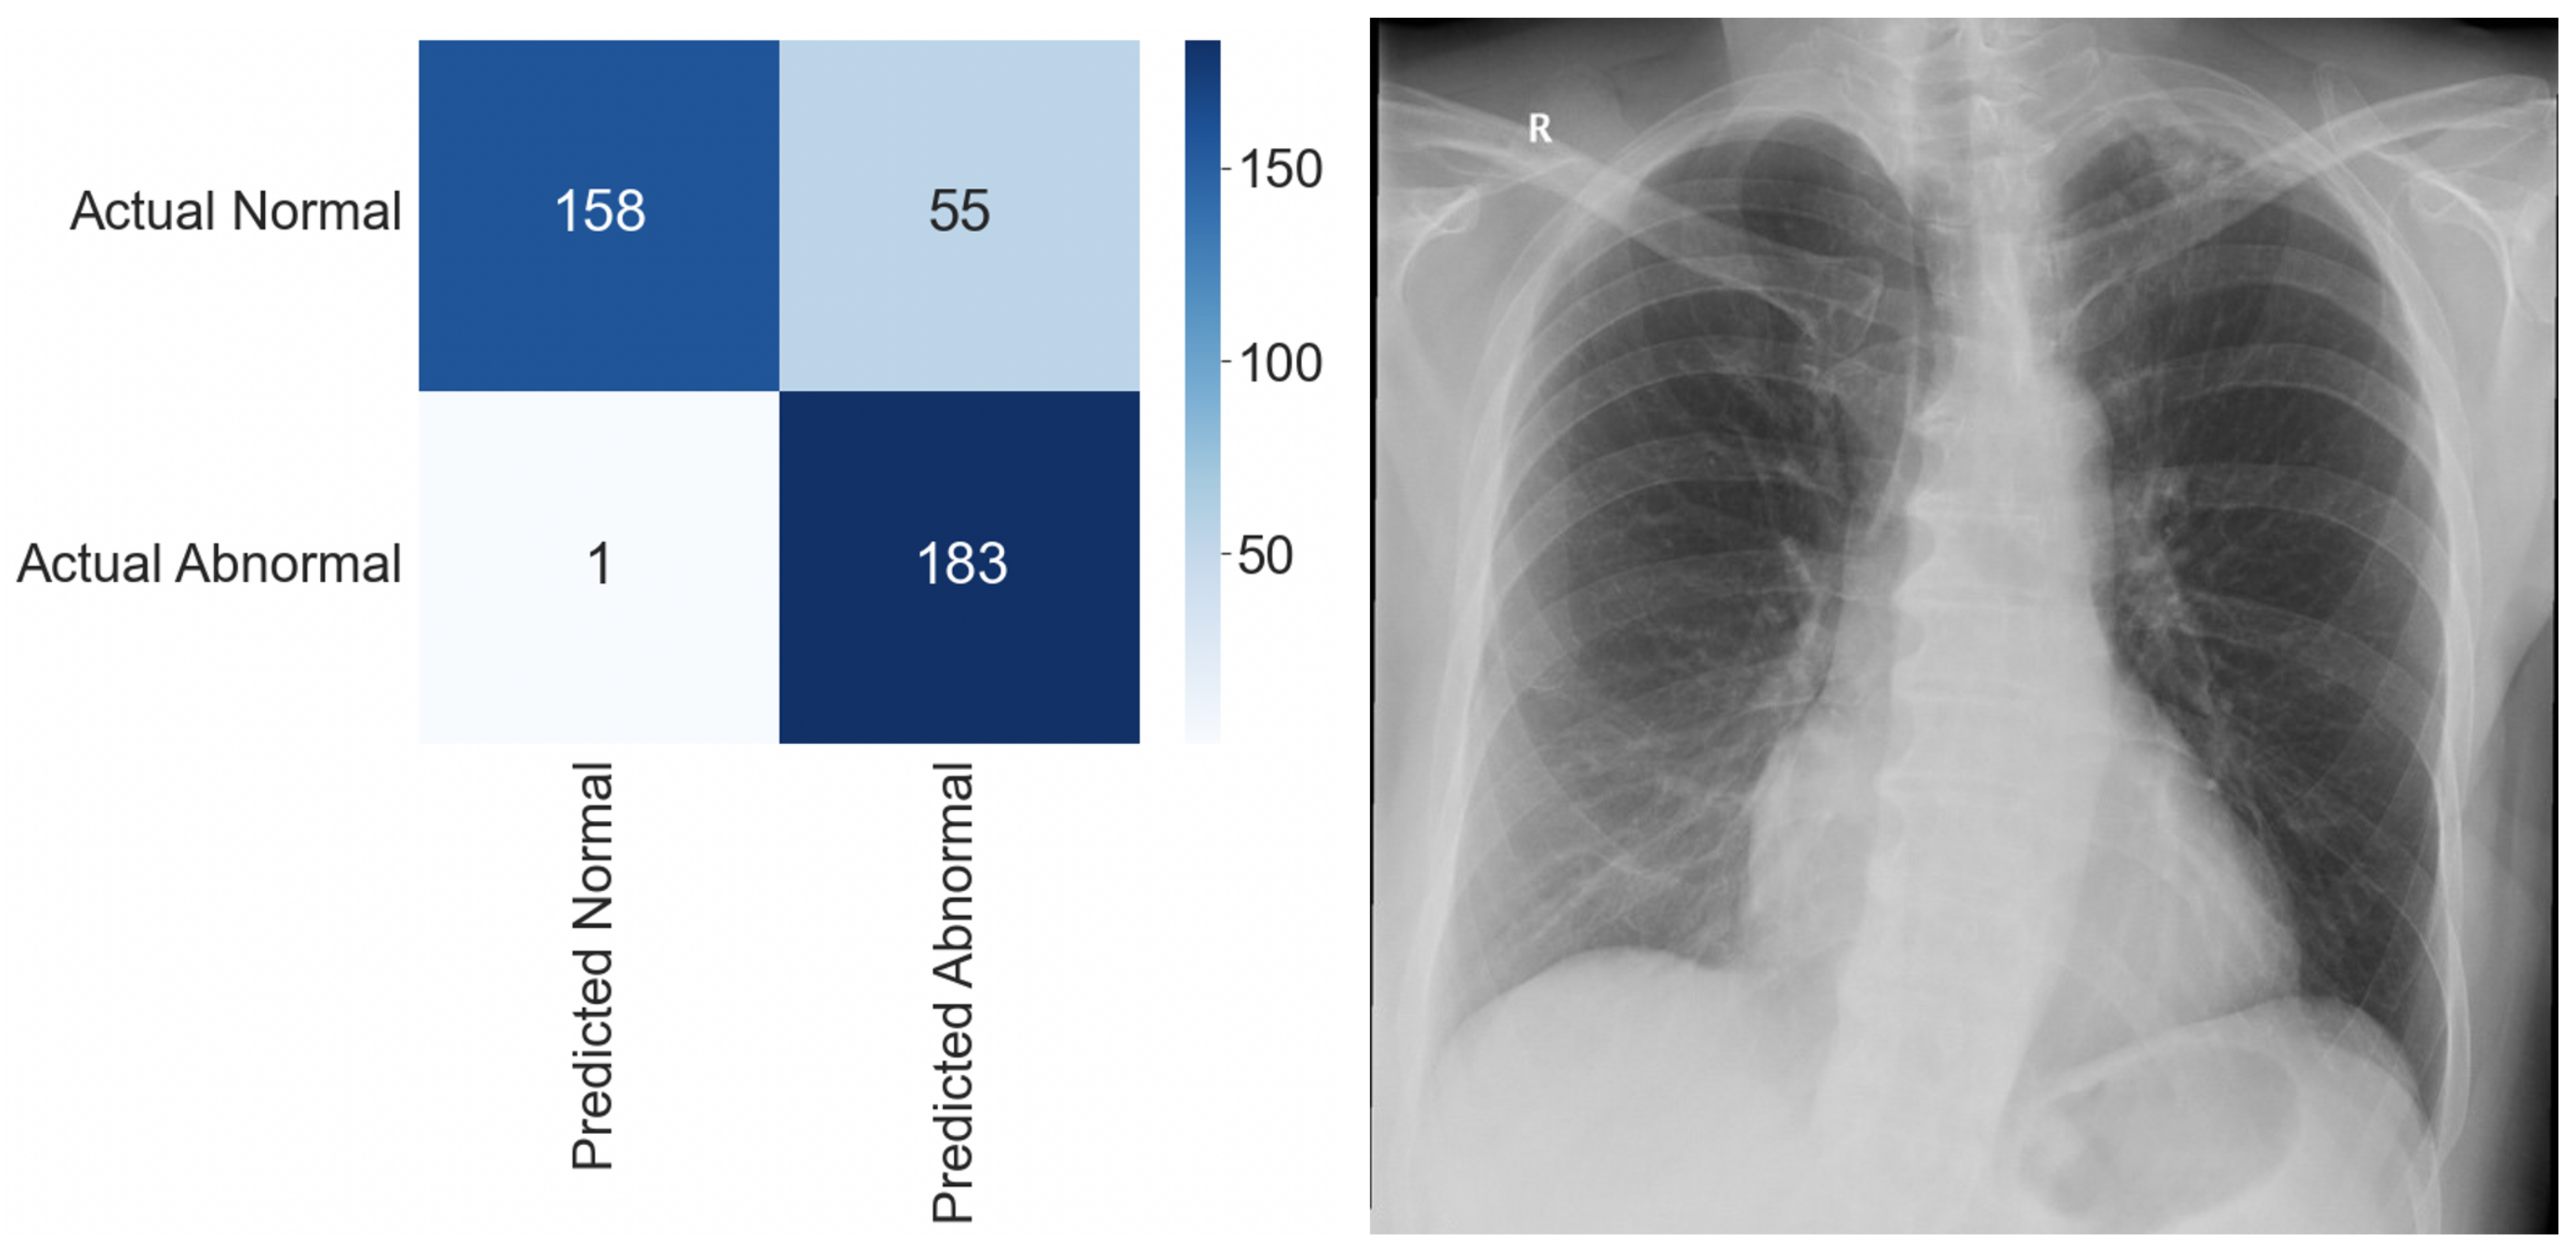
| n | 397 CXRs (Abnormal: 184, Normal: 213) |
| Sensitivity | 0.995 |
| Specificity | 0.742 |
| False Positive Rate | 0.258 |
| False Negative Rate | 0.005 |
| False Discovery Rate | 0.231 |
| Balanced Accuracy | 0.869 |
| F1 Score | 0.867 |
| Demographic Data | n (%) |
|---|---|
| Patient sex | |
| Female | 72 (56.7%) |
| Male | 55 (43.3%) |
| Patient age (yrs.) | |
| 18–30 | 6 (4.7%) |
| 31–50 | 15 (11.8%) |
| 51–70 | 50 (39.4%) |
| 70+ | 56 (44.1%) |
| Abnormality distribution (GT) | |
| Normal | 87 (68.5%) |
| Abnormal | 40 (31.5%) |
| Prevalence of individual pathologies (GT) | |
| Cardiomegaly | 24 (18.9%) |
| Consolidation | 18 (14.2%) |
| Pleural effusion | 12 (9.4%) |
| Pulmonary lesion | 9 (7.1%) |
| Pulmonary edema | 4 (3.1%) |
| Atelectasis | 3 (2.4%) |
| Fracture | 2 (1.6%) |
| Hilar enlargement | 2 (1.6%) |
| GT: Abnormal | GT: Normal | Total | |
|---|---|---|---|
| AI: Abnormal | 37 (29.1%) | 31 (24.4%) | 68 (53.5%) |
| AI: Normal | 3 (2.4%) | 56 (44.1%) | 59 (46.5%) |
| Total | 40 (31.5%) | 87 (68.5%) | 127 (100%) |
| Radiologists, Mean (95% CI) | DLAD, Mean | p-Value | |
|---|---|---|---|
| Se | 0.661 (0.572–0.743) | 0.925 | <0.0001 |
| Sp | 0.803 (0.723–0.868) | 0.644 | 0.0001 |
| PLR | 3.583 (3.439–3.727) | 2.596 | <0.0001 |
| NLR | 0.417 (0.404–0.43) | 0.117 | <0.0001 |
| PPV | 0.614 (0.524–0.699) | 0.544 | 0.1297 |
| NPV | 0.843 (0.767–0.901) | 0.949 | <0.0001 |
| Balanced Accuracy | 0.732 (0.646–0.807) | 0.784 | 0.1606 |
| F1 Score | 0.638 (0.548–0.721) | 0.685 | 0.2525 |
| Radiologist | DLAD | GT: Abnormal | GT: Normal | Total |
|---|---|---|---|---|
| #5f0: Abnormal | AI: Abnormal | 11 | 0 | 11 |
| AI: Normal | 0 | 0 | 0 | |
| #5f0: Normal | AI: Abnormal | 26 | 31 | 57 |
| AI: Normal | 3 | 56 | 59 | |
| #442: Abnormal | AI: Abnormal | 34 | 23 | 57 |
| AI: Normal | 2 | 26 | 28 | |
| #442: Normal | AI: Abnormal | 3 | 8 | 11 |
| AI: Normal | 1 | 30 | 31 | |
| #c8a: Abnormal | AI: Abnormal | 33 | 11 | 44 |
| AI: Normal | 2 | 7 | 9 | |
| #c8a: Normal | AI: Abnormal | 4 | 20 | 24 |
| AI: Normal | 1 | 49 | 50 | |
| #630: Abnormal | AI: Abnormal | 22 | 1 | 23 |
| AI: Normal | 2 | 1 | 3 | |
| #630: Normal | AI: Abnormal | 15 | 30 | 45 |
| AI: Normal | 1 | 55 | 56 | |
| #24a: Abnormal | AI: Abnormal | 25 | 7 | 32 |
| AI: Normal | 2 | 8 | 10 | |
| #24a: Normal | AI: Abnormal | 12 | 24 | 36 |
| AI: Normal | 1 | 48 | 49 | |
| Total | 40 | 87 | 127 |
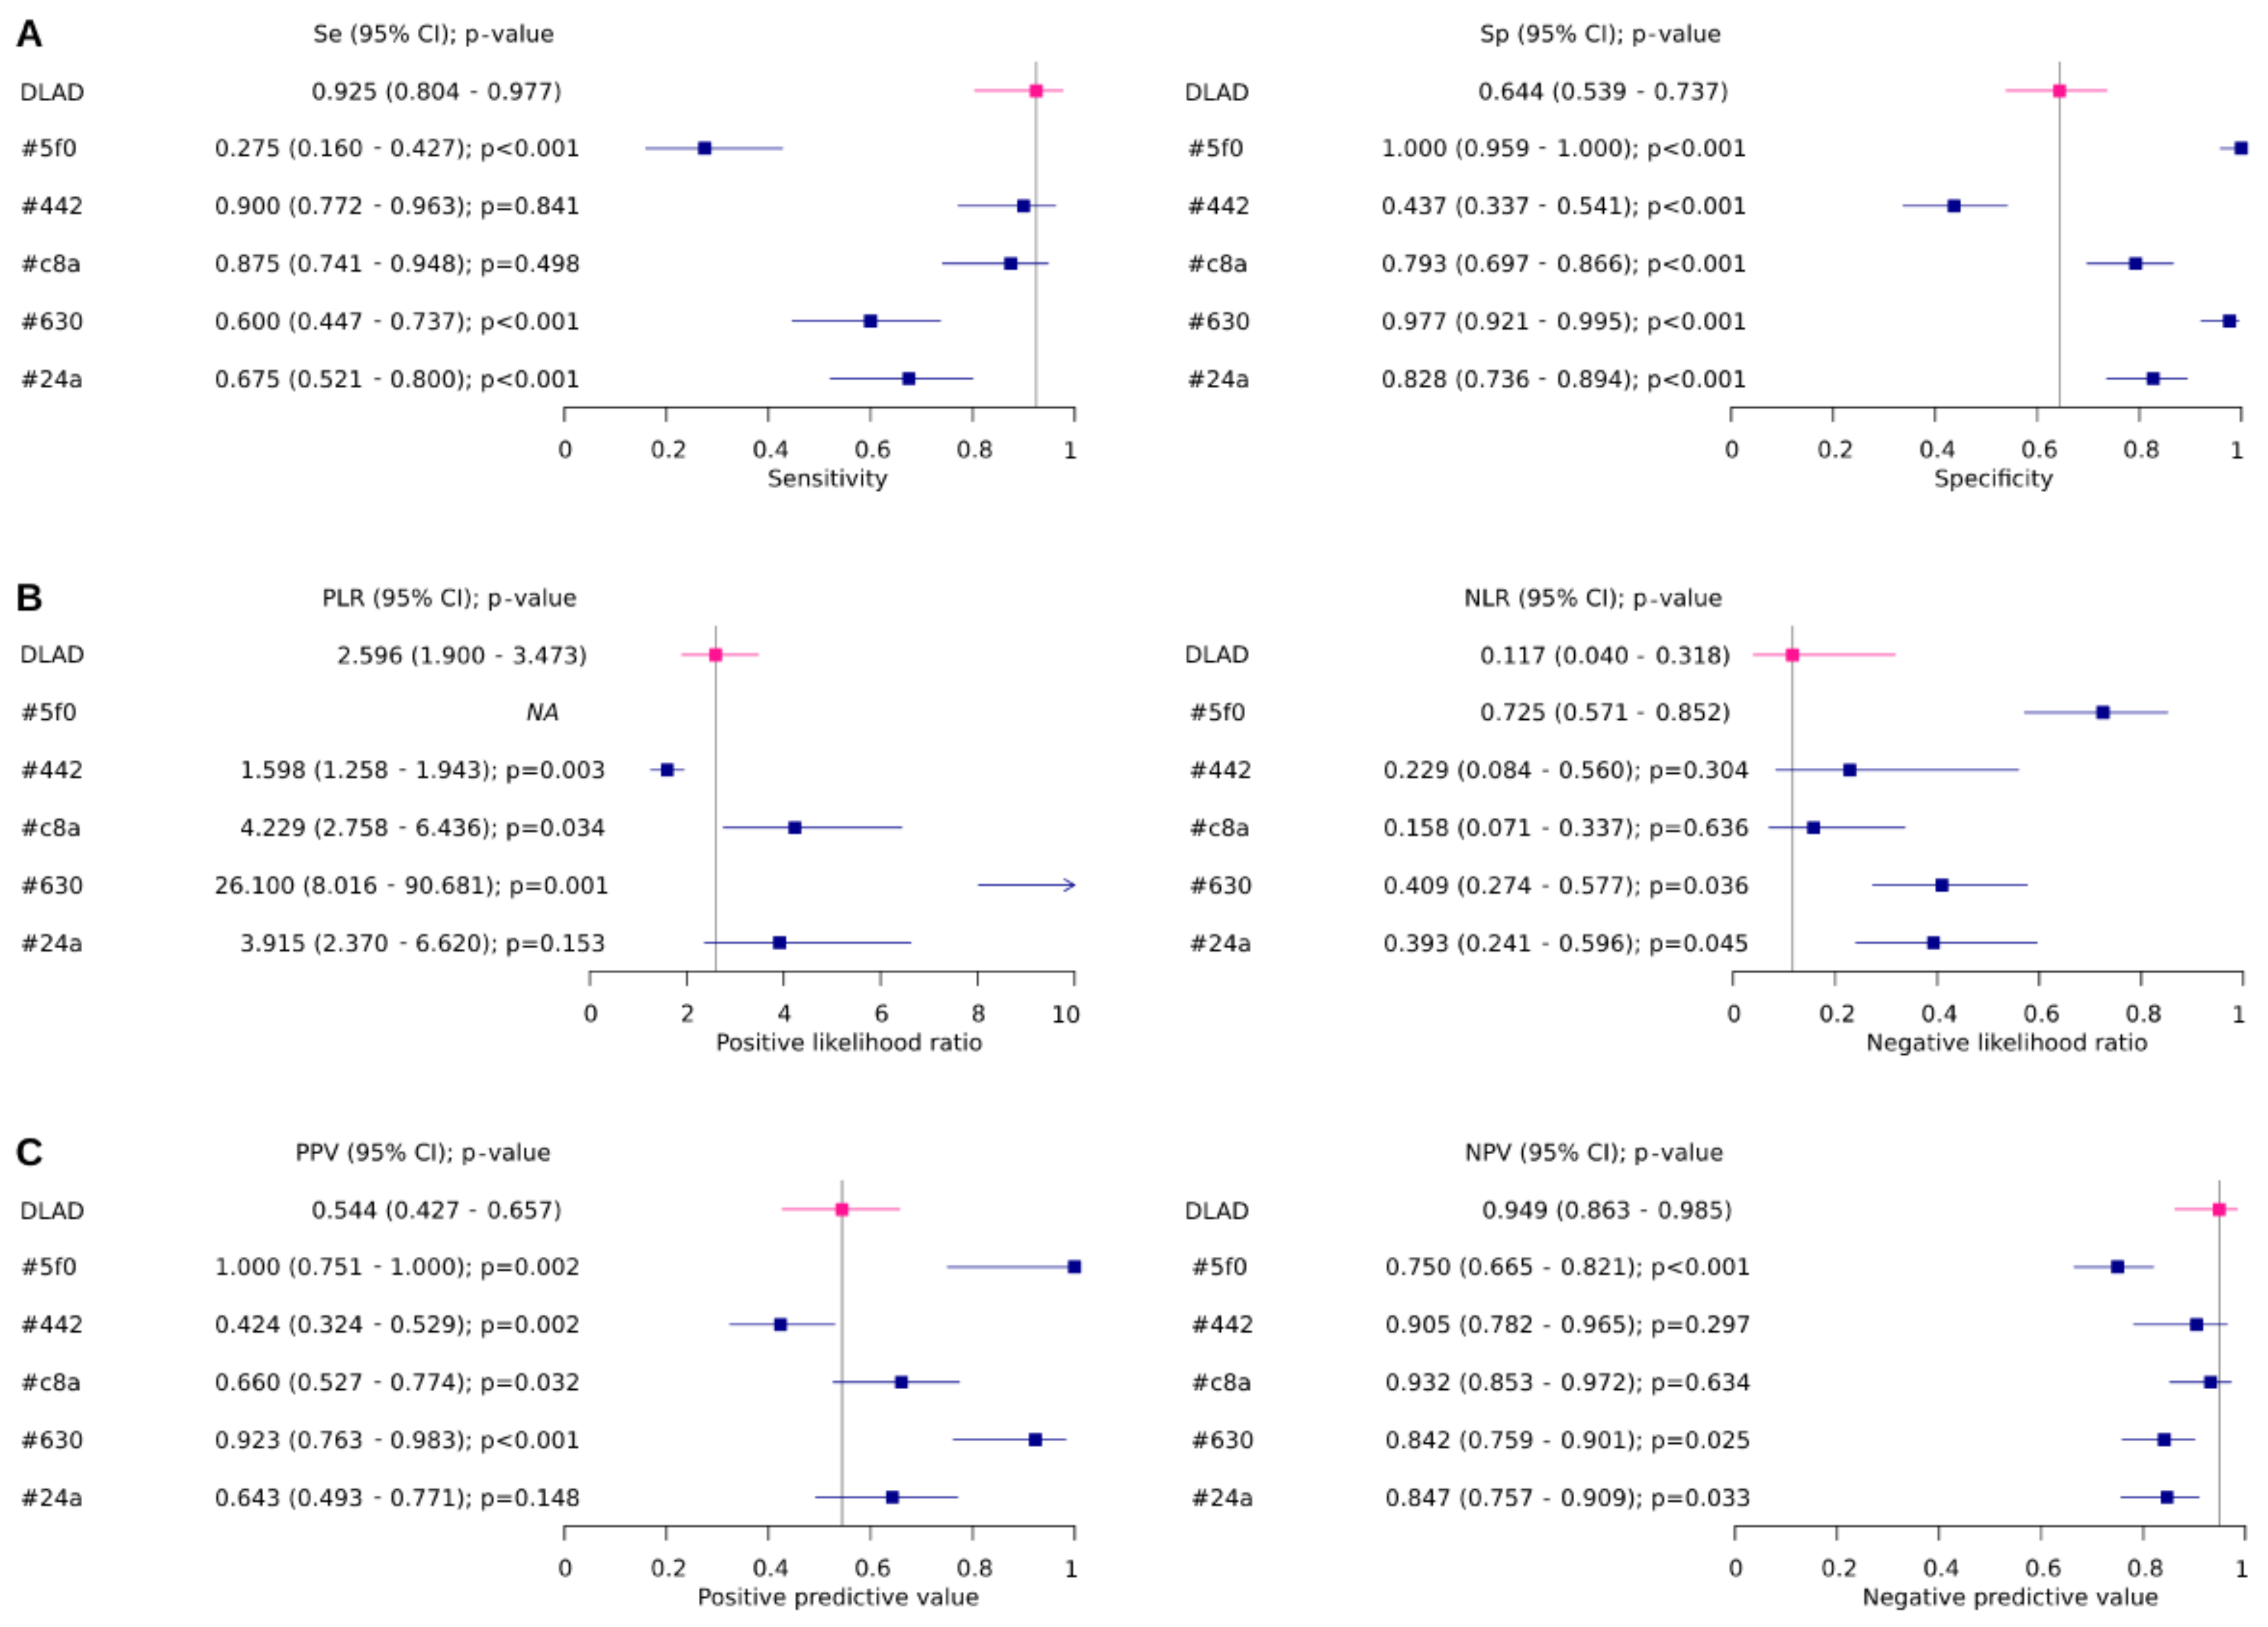
| ID | Se (95% CI) | Sp (95% CI) | Global p-Value | Se p-Value | Sp p-Value |
|---|---|---|---|---|---|
| DLAD | 0.925 (0.804–0.977) | 0.644 (0.539–0.737) | |||
| #5f0 | 0.275 (0.16–0.427) | 1 (0.959–1.000) | <0.0001 | <0.0001 | <0.0001 |
| #442 | 0.9 (0.772–0.963) | 0.437 (0.337–0.541) | 0.0043 | 0.8407 | <0.0001 |
| #c8a | 0.875 (0.741–0.948) | 0.793 (0.697–0.866) | 0.0244 | 0.4978 | <0.0001 |
| #630 | 0.6 (0.447–0.737) | 0.977 (0.921–0.995) | <0.0001 | <0.0001 | <0.0001 |
| #24a | 0.675 (0.521–0.8) | 0.828 (0.736–0.894) | 0.0002 | <0.0001 | <0.0001 |
| ID | PLR (95% CI) | NLR (95% CI) | Globalp-value | PLRp-value | NLRp-value |
| DLAD | 2.596 (1.9–3.473) | 0.117 (0.04–0.318) | |||
| #5f0 | NA | 0.725 (0.571–0.852) | NA | NA | NA |
| #442 | 1.598 (1.258–1.943) | 0.229 (0.084–0.56) | 0.0092 | 0.0027 | 0.3045 |
| #c8a | 4.229 (2.758–6.436) | 0.158 (0.071–0.337) | 0.0394 | 0.034 | 0.6359 |
| #630 | 26.1 (8.016–90.681) | 0.409 (0.274–0.577) | 0.0002 | 0.0014 | 0.0364 |
| #24a | 3.915 (2.37–6.62) | 0.393 (0.241–0.596) | 0.0069 | 0.1534 | 0.0449 |
| ID | PPV (95% CI) | NPV (95% CI) | Globalp-value | PPVp-value | NPVp-value |
| DLAD | 0.544 (0.427–0.657) | 0.949 (0.863–0.985) | |||
| #5f0 | 1 (0.751–1.000) | 0.75 (0.665–0.821) | <0.0001 | 0.0015 | 0.0001 |
| #442 | 0.424 (0.324–0.529) | 0.905 (0.782–0.965) | 0.0086 | 0.0024 | 0.2973 |
| #c8a | 0.66 (0.527–0.774) | 0.932 (0.853–0.972) | 0.029 | 0.0316 | 0.6344 |
| #630 | 0.923 (0.763–0.983) | 0.842 (0.759–0.901) | <0.0001 | <0.0001 | 0.0246 |
| #24a | 0.643 (0.493–0.771) | 0.847 (0.757–0.909) | 0.0004 | 0.1476 | 0.0327 |
| ID | BA (95% CI) | F1 (95% CI) | BAp-value | F1p-value | |
| DLAD | 0.784 (0.713–0.856) | 0.685 (0.604–0.766) | |||
| #5f0 | 0.638 (0.554–0.721) | 0.431 (0.345–0.518) | 0.0098 | <0.0001 | |
| #442 | 0.668 (0.587–0.75) | 0.576 (0.49–0.662) | 0.0382 | 0.0714 | |
| #c8a | 0.834 (0.769–0.899) | 0.753 (0.678–0.828) | 0.3134 | 0.2314 | |
| #630 | 0.789 (0.717–0.86) | 0.727 (0.65–0.805) | 0.9354 | 0.4615 | |
| #24a | 0.751 (0.676–0.826) | 0.659 (0.576–0.741) | 0.5328 | 0.6511 |
Disclaimer/Publisher’s Note: The statements, opinions and data contained in all publications are solely those of the individual author(s) and contributor(s) and not of MDPI and/or the editor(s). MDPI and/or the editor(s) disclaim responsibility for any injury to people or property resulting from any ideas, methods, instructions or products referred to in the content. |
© 2023 by the authors. Licensee MDPI, Basel, Switzerland. This article is an open access article distributed under the terms and conditions of the Creative Commons Attribution (CC BY) license (https://creativecommons.org/licenses/by/4.0/).
Share and Cite
Kvak, D.; Chromcová, A.; Biroš, M.; Hrubý, R.; Kvaková, K.; Pajdaković, M.; Ovesná, P. Chest X-ray Abnormality Detection by Using Artificial Intelligence: A Single-Site Retrospective Study of Deep Learning Model Performance. BioMedInformatics 2023, 3, 82-101. https://doi.org/10.3390/biomedinformatics3010006
Kvak D, Chromcová A, Biroš M, Hrubý R, Kvaková K, Pajdaković M, Ovesná P. Chest X-ray Abnormality Detection by Using Artificial Intelligence: A Single-Site Retrospective Study of Deep Learning Model Performance. BioMedInformatics. 2023; 3(1):82-101. https://doi.org/10.3390/biomedinformatics3010006
Chicago/Turabian StyleKvak, Daniel, Anna Chromcová, Marek Biroš, Robert Hrubý, Karolína Kvaková, Marija Pajdaković, and Petra Ovesná. 2023. "Chest X-ray Abnormality Detection by Using Artificial Intelligence: A Single-Site Retrospective Study of Deep Learning Model Performance" BioMedInformatics 3, no. 1: 82-101. https://doi.org/10.3390/biomedinformatics3010006